comm 324 --- w. suo slide 1. comm 324 --- w. suo slide 2 diversification random selection the...
TRANSCRIPT

Comm 324 --- W. SuoSlide 1Slide 1
Index ModelsIndex Models

Comm 324 --- W. SuoSlide 2Slide 2
Diversification
Random selection The effect of
diversification Markowitz diversification
What information are needed?
How to simplify the approach?

Comm 324 --- W. SuoSlide 3Slide 3
Linear Regression
Review Properties R-square Example
spreadsheet
Comm 324 --- W. SuoSlide 4Slide 4
Advantages: Reduces the number of inputs for diversification Easier for security analysts to specialize
Drawback: the simple dichotomy rules out important risk
sources (such as industry events)
The Single Index Model
Comm 324 --- W. SuoSlide 5Slide 5
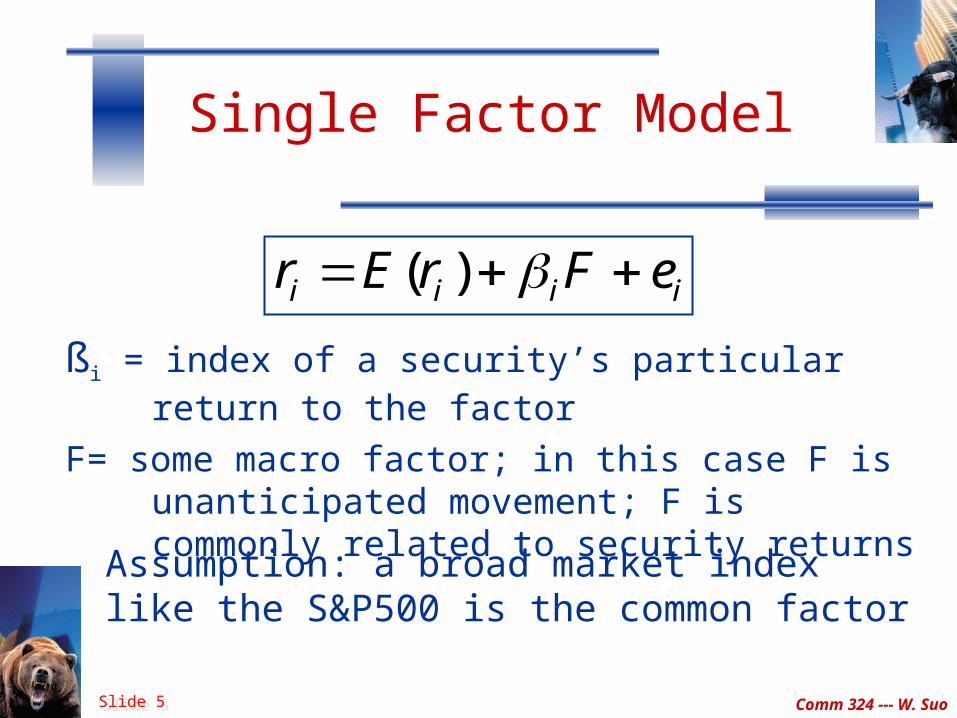
ßi = index of a security’s particular return to the factor
F= some macro factor; in this case F is unanticipated movement; F is commonly related to security returns
Single Factor Model
( )i i i ir E r F e
Assumption: a broad market index like the S&P500 is the common factor

Comm 324 --- W. SuoSlide 6Slide 6
Single Index Model
ifMiifi e)rr()rr(
ai = stock’s expected return if market’s excess return is zero
bi(rM-ri) = the component of return due to market movements
ei = the component of return due to unexpected firm-specific events

Comm 324 --- W. SuoSlide 7Slide 7
Let: Ri = (ri - rf)
Rm = (rm - rf)
Risk premiumformat
Ri = αi + ßiRm + ei
Risk Premium Format

Comm 324 --- W. SuoSlide 8Slide 8
Market or systematic risk: risk related to the macro economic factor or market index
Unsystematic or firm specific risk: risk not related to the macro factor or market index
Total risk = Systematic + Unsystematic
Components of Risk

Comm 324 --- W. SuoSlide 9Slide 9
i2 = total variance
i2 m
2 = systematic variance
2(ei) = unsystematic variance
Measuring Components of Risk
2 2 2 2( )ii i M e

Comm 324 --- W. SuoSlide 10Slide 10
Total Risk = Systematic +Unsystematic
Examining Percentage of Variance
2
2M
2i2 squareR
2i
22 )e(
1
)e(22M
2

Comm 324 --- W. SuoSlide 11Slide 11
Security Characteristic Line
Excess Returns (i)SCL
..
..
.... ..
..
.. ..
.. .. ..
.. ..
..
.. ..
......
..
..
..
....
......
....
..
....
....
..
.. ..
..
.. ..
..
.. ...... ..
.. .... ..Excess returnson market index
Ri = i + ßiRm + ei

Comm 324 --- W. SuoSlide 12Slide 12
Index Model
Spreadsheet example

Comm 324 --- W. SuoSlide 13Slide 13
Index Model and Diversification
i i i M iR R e
No. of Securities
St. Deviation
Market Risk
Unique Risk
2(eP)=2(e) / n
P2M
2

Comm 324 --- W. SuoSlide 14Slide 14
Industry Prediction of Beta
BMO Nesbitt Burns and Merrill Lynch examples BMO NB uses returns not risk premiums a has a different interpretation: a + rf (1-b) Merill Lynch’s ‘adjusted b’
Forecasting beta as a function of past beta Forecasting beta as a function of firm size, growth,
leverage etc.

Comm 324 --- W. SuoSlide 15Slide 15
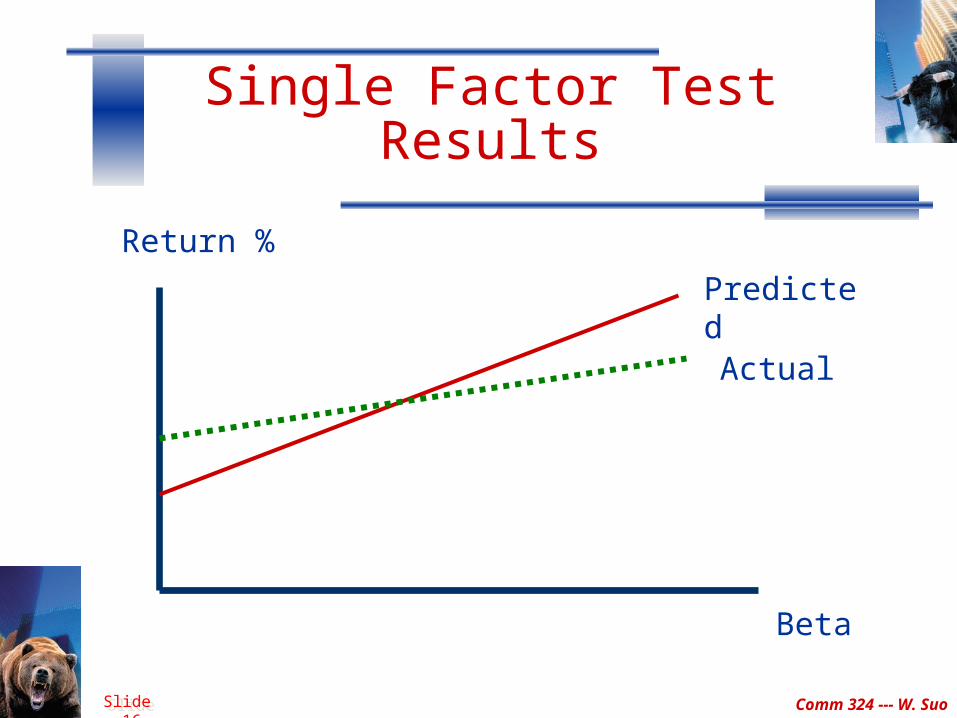
Tests of the Single Factor Model
Tests of the expected return beta relationship First Pass Regression
Estimate beta, average risk premiums and unsystematic risk
Second Pass: Using estimates from the first pass to determine if model is supported by the data
Most tests do not generally support the single factor model
Comm 324 --- W. SuoSlide 16Slide 16
Single Factor Test Results
Return %
Beta
Predicted
Actual

Comm 324 --- W. SuoSlide 17Slide 17
Roll’s Criticism on the Tests
The only testable hypothesis: the mean-variance efficiency of the market portfolio
All other implications are not independently testable
CAPM is not testable unless we use the true market portfolio
The benchmark error

Comm 324 --- W. SuoSlide 18Slide 18
Measurement Error in Beta
Statistical property: If beta is measured with error in the first stage, Second stage results will be biased in the direction
the tests have supported Test results could result from measurement error

Comm 324 --- W. SuoSlide 19Slide 19
Conclusions on the Tests’ Results
Tests proved that CAPM seems qualitatively correct Rates of return are linear and increase with beta Returns are not affected by nonsystematic risk
But they do not entirely validate its quantitative predictions The expected return-beta relationship is not fully consistent with
empirical observation.

Comm 324 --- W. SuoSlide 20Slide 20
Multifactor Models
Use factors in addition to market return Examples include industrial production, expected inflation
etc. Estimate a beta for each factor using multiple regression
Chen, Roll and Ross Returns a function of several macroeconomic and bond
market variables instead of market returns Fama and French
Returns a function of size and book-to-market value as well as market returns

Comm 324 --- W. SuoSlide 21Slide 21
Researchers’ Responses to Fama and French
Utilize better econometric techniques Improve estimates of beta Reconsider the theoretical sources and implications
of the Fama and French-type results Return to the single-index model, accounting for
non-traded assets and cyclical behavior of betas

Comm 324 --- W. SuoSlide 22Slide 22
Jaganathan and Wang Study (1996)
Included factors for cyclical behavior of betas and human capital
When these factors were included the results showed returns were a function of beta
Size is not an important factor when cyclical behavior and human capital are included