comm 324 --- w. suo slide 1. comm 324 --- w. suo slide 2 random walk - stock price change...
TRANSCRIPT

COMM 324 --- W. Suo Slide 1Slide 1
Market EfficiencyMarket Efficiency&&AnomaliesAnomalies

COMM 324 --- W. Suo Slide 2Slide 2
Random Walk - stock price change unpredictably Actually stock prices follow a positive trend
Expected price is positive over time Positive trend and random around the trend
Random Walk and Stock Prices
Security Prices
Time

COMM 324 --- W. Suo Slide 3Slide 3
Why do stock prices change?
Why are price changes random? Prices react to information Flow of information is random
Random Price Changes
COMM 324 --- W. Suo Slide 4Slide 4
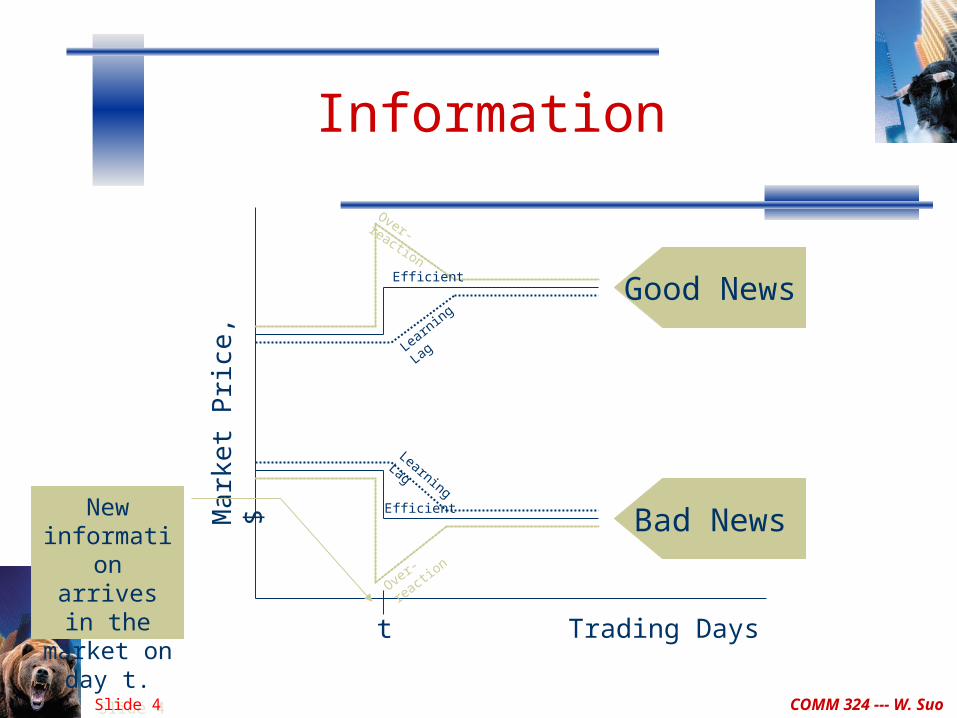
Information
Trading Days
Mar
ket P
rice
, $
t
Over-reaction
Efficient
Learning Lag
Over-rea
ction
Efficient
Learning LagNew
information arrives in the
market on day t.
Bad News
Good News

COMM 324 --- W. Suo Slide 5Slide 5
Basic question: Do security prices reflect information ?
Why look at market efficiency Implications for business and corporate finance Implications for investment
Forms of efficient market hypothesis Weak Semi-strong Strong
Efficient Market Hypothesis (EMH)

COMM 324 --- W. Suo Slide 6Slide 6
Types of Stock Analysis Fundamental Analysis
Using economic and accounting information to predict stock prices Semi strong form efficiency & fundamental analysis
Technical Analysis Using prices and volume information to predict future prices Weak form efficiency & technical analysis
Active Management Security analysis Timing
Passive Management Buy and Hold Index Funds
Even if the market is efficient a role exists for portfolio management Diversification Appropriate risk level Tax considerations
Implications of Efficiency for Active or Passive Management

COMM 324 --- W. Suo Slide 7Slide 7
Event studies Assessing performance of professional managers Testing some trading rule
Empirical Tests of Market Efficiency

COMM 324 --- W. Suo Slide 8Slide 8
Evidence SupportingWeakly Efficient Hypothesis
Is it possible that security prices do not reflect all historical information? Which is easy to obtain and cheap
Technicians focus on past security prices Look for meaningful trends in historical security prices Attempt to extract predictions from whatever patterns
they find
COMM 324 --- W. Suo Slide 9Slide 9
Filter Rules
An X% filter is a mechanical trading rule If a security’s price rises by at least X%, buy and hold until the price
peaks and falls by at least X% When price decreases from a peak level by X%, liquidate long
position and sell short Hold short position until price reaches a low point and then begins
to rise If (when) the price rises above X%, cover the short position and go
long
COMM 324 --- W. Suo Slide 10Slide 10
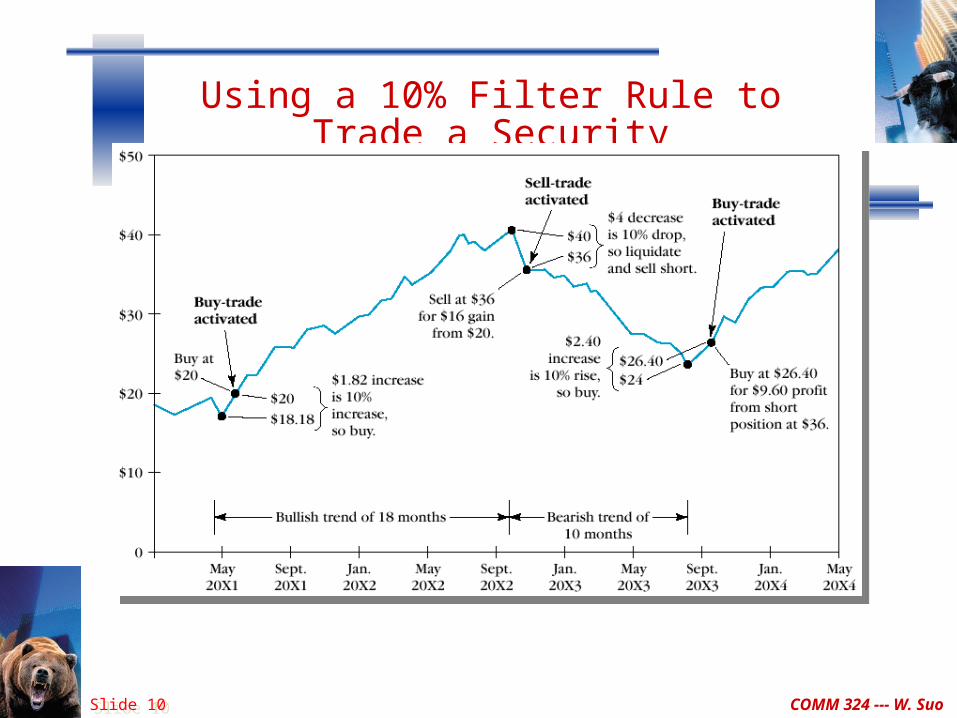
Using a 10% Filter Rule to Trade a Security

COMM 324 --- W. Suo Slide 11Slide 11
Filter Rules
Different filter rules can be testing by changing the X value If stock prices fluctuate randomly, filter rules should not
outperform randomly chosen stocks Filters ranging from .05% to 50% have been tested In general, filter rules generate large commissions
(especially those with small X values) After deducting for commissions, filter rules do not outperform
naïve buy-and-hold strategy Some filters result in large net losses after deducting commissions

COMM 324 --- W. Suo Slide 12Slide 12
Serial Correlation Tests
Serial correlation (autocorrelation) tests should be able to determine if security prices move in trends or reversals
Measures the correlation coefficient in a series of numbers with lagged values in the same series
Lags of any length can be used
Stock prices exhibit a long-run upward trend of about 6.6% a year in the U.S.
Thus, some positive serial correlation is found But, technical analysts focus on short-term trends
COMM 324 --- W. Suo Slide 13Slide 13
Serial Correlation Tests
Do daily or weekly price change trends exist and, if so, can they be used to earning a trading profit after commission?
Many studies have failed to detect statistically significant serial correlations on a daily, weekly or monthly basis
Scientific evidence supporting weak form efficiency Some conflicting evidence exists
DeBondt & Thaler (1985) find evidence of long-term stock price overreaction and negative serial correlation for individual stocks
Lo & MacKinlay (1988) found positive serial correlation for a diversified portfolio of stocks
Conrad & Kaul (1993) suggest that the above results are due to statistical measurement errors
COMM 324 --- W. Suo Slide 14Slide 14
Runs Tests
A “runs” test can be performed to determine if irregular trends occur in price changes
A run occurs when the changes between consecutive numbers switch direction
A series of random numbers is expected to generate a certain amount of positive, negative or zero runs
By comparing the actual number of runs to the expected number, we can determine if a non-random number of runs occurred
Results suggest that actual number of runs do not differ statistically from the number of expected runs

COMM 324 --- W. Suo Slide 15Slide 15
Anomalies in Weakly Efficient Hypothesis
Day-of-the-Week Effects the stock market tends to fall on Mondays and rise the rest of the week
Holiday effect Returns on the day before holiday weekends are 9 – 13 times higher than the average
daily return About 1/3 of the average stock’s annual return was earned in pre-holiday trading days
Friday to Monday Negative (positive) returns on a Friday are usually followed by large
negative (positive) returns on Monday The large commissions paid (relative to the small positive daily returns) will
more than offset the potential benefit of this knowledge January Effect
average stock’s return in January is more than 5 times the mean monthly return A large part of the typical stock’s annual return is generated during January
This is a larger anomaly than the day-of-the-week effects Can yield net trading profits after deducting transaction costs
Buy stocks before Christmas and sell at the end of January

COMM 324 --- W. Suo Slide 16Slide 16
1. Examine prices and returns over time
Tests of Semi-Strong Efficiency: Event Studies
0 +t-t
Announcement Date

COMM 324 --- W. Suo Slide 17Slide 17
2. Returns are adjusted to determine if they are abnormalMarket Model approach
a. Rt = a + bRmt + et
(Expected Return)b. Excess Return = (Actual - Expected)
et = Actual - (at + btRmt)
How Tests Are Structured (cont’d)

COMM 324 --- W. Suo Slide 18Slide 18
Stock Splits and Stock Dividends
Neither of these events change the total value of the firm or investor’s wealth
If security markets are efficient, the firm’s market capitalization should not be impacted by a stock split or stock dividend
In the long-run, stock splits and stock dividends do not seem to impact
The liquidity of the split stocks The market value of the firm Investors’ returns
If an investor can correctly predict which companies are going to split, it may be possible to earn excess returns
Studies involving stock splits and stock dividends appear to support the semi-strong efficient market hypothesis
COMM 324 --- W. Suo Slide 19Slide 19
Anomaly: Size Effect
Research shows that small company stocks earned higher rates of return than large company stocks, on average
Size based on market capitalization Found that small cap stocks were also riskier, but even after
adjusting for risk the size effect remained Even after adjusting for the impact of infrequent price
changes the size effect remained
COMM 324 --- W. Suo Slide 20Slide 20
Growth-Value Anomaly
Semi-strong form of EMH suggests that money managers who use a particular management style should not consistently outperform managers using another management style Value managers Growth manager Value stock investors have historically outperformed
growth stock investors on a risk-adjusted basis over extended periods of time
Constitutes an anomaly to the semi-strong form of efficient market hypothesis

COMM 324 --- W. Suo Slide 21Slide 21
Equity Premium Puzzle
Rewards for bearing risk appear too excessive Possible causes:
Unanticipated capital gains Survivorship bias
Survivorship bias also creates the appearance of abnormal returns in market efficiency studies
COMM 324 --- W. Suo Slide 22Slide 22
The Paradox
Grossman and Stiglitz In a world where it cost money to analyze securities,
analysts will be able to identify mispriced securities
Investors will do just as well using passive investment strategy where they simply but the securities in a particular index and hold unto those investments