combining carbon market and financial...
TRANSCRIPT

COMBINING CARBON MARKET AND FINANCIAL INSTRUMENTS FOR CITY‐WIDE APPROACH TO MITIGATION
Chandra Shekhar Sinha, Lead Finance Specialist/Carbon Finance CoordinatorSustainable Development DepartmentLatin America and the Caribbean Region

STA
TUPerformance of offset market mixed; regulatory uncertainty continues
USOFTH
E
• Current status of CDM– Low CER issuance due to EB bottleneck– Registered projects set to reduce by 1,862 million by 2012 C
ARBO
NO
– Issuance: 138Mt in 2008, 123 in 2009, 132 in 2010 (Total ~ 500 Mt)– PointCarbon estimates close to 1,000 million CERs to be issued by 2012
• Recent UNFCCC Secretariat clarifications on CDM post 2012
OFFSET
MA
• Recent UNFCCC Secretariat clarifications on CDM post‐2012 – Although the emission targets of Annex I Parties are negotiated on a commitment
period by commitment period basis, the CDM itself is a long‐term mechanism that continues from one period to the next, and is not tied to specific commitment periods This continuity applies to all aspects of the CDM
ARKETS
periods. This continuity applies to all aspects of the CDM.
• Inflow of new projects continues but investors and compliance buyers perceive CERs as more risky due to post‐2012
• Increasing interest in new instruments such as Program of Activities, NAMAs, Sectoral Crediting, etc.

OFFSE
Post‐2012 CERs have risks; push towards offsets from countries with commitmentsETELIG
IBIL
UNFCCC / CDM Eligibility EU ETS Eligibility
International negotiations
CDM is expected to continue regardless of binding post‐2012
Restrictions on eligibility more likely under a 20% reduction targets for EU ITY
POST‐2
negotiations regardless of binding post 2012 commitment but CER value dependent on compliance needs
under a 20% reduction targets for EU countries in comparison to a 30% target
Project type Current project types expected to ti I d t i l ( h
Renewable project are safest. Large h d j t l f I d t i l
2012
continue. Industrial gases (such as HFC23) may be excluded and be covered by other mechanisms (e.g. Montreal Protocol)
hydro projects are less safe. Industrial gases (HFC23, N2O) are the least safe
Vintage Reductions before 2013 are safest. Value of later reductions is uncertain.
Reductions pre‐2013 are safest. Projects Registered before 2013 are less safe and projects Registered after 2012 are least safe.
Host Country Advanced developing countries (e.g. Mexico, South Korea, BaSIC) are likely to be phased out of CDM
LDCs and other developing countries taking commitments (NAMAs, Sectoral targets, etc.) are safest
POST‐
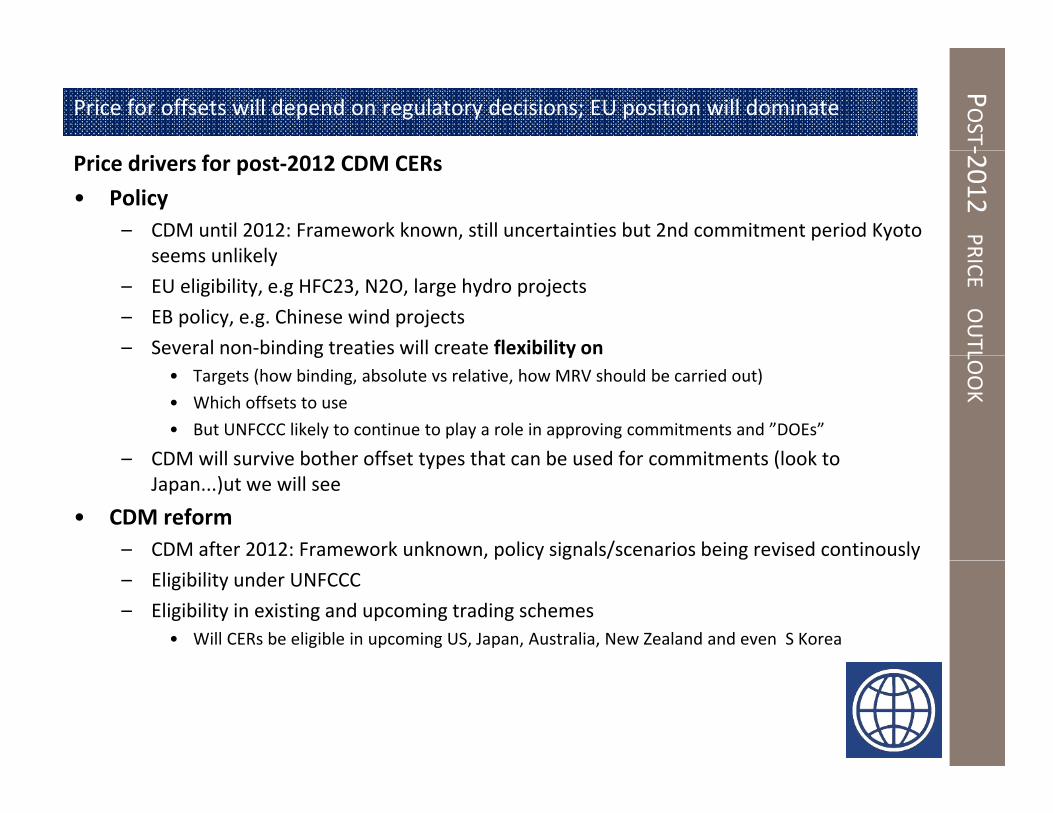
Price for offsets will depend on regulatory decisions; EU position will dominate‐2012 PR
Price drivers for post‐2012 CDM CERs
• Policy– CDM until 2012: Framework known, still uncertainties but 2nd commitment period Kyoto
seems unlikely
RICEOUTL
seems unlikely
– EU eligibility, e.g HFC23, N2O, large hydro projects
– EB policy, e.g. Chinese wind projects
– Several non‐binding treaties will create flexibility on LOOK
g y• Targets (how binding, absolute vs relative, how MRV should be carried out)
• Which offsets to use
• But UNFCCC likely to continue to play a role in approving commitments and ”DOEs”
CDM will survive bother offset types that can be used for commitments (look to– CDM will survive bother offset types that can be used for commitments (look to Japan...)ut we will see
• CDM reform– CDM after 2012: Framework unknown, policy signals/scenarios being revised continously
– Eligibility under UNFCCC
– Eligibility in existing and upcoming trading schemes • Will CERs be eligible in upcoming US, Japan, Australia, New Zealand and even S Korea
CARBO
N
DEM
AND
AND
PRICE
OUTLO
O
KFO
R
2013‐2020 ‐
ASSU
MING
AN
INTERN
AT
ONAL
AGREEM
E
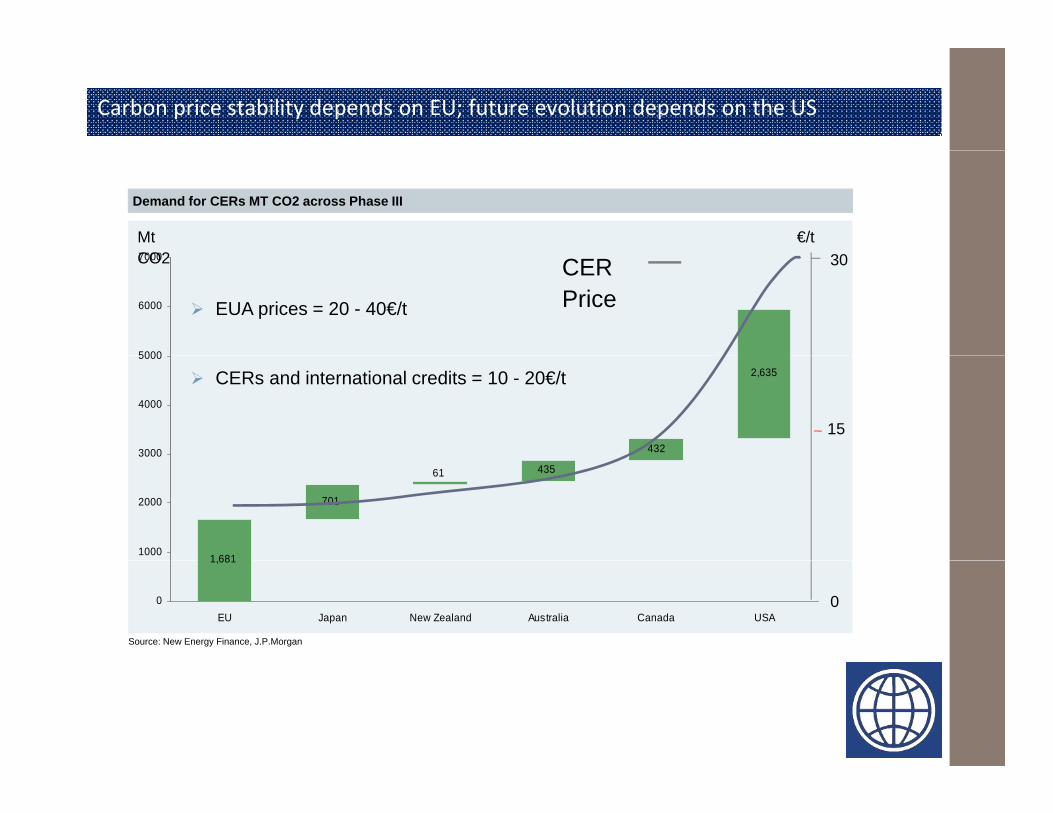
NT‐Carbon price stability depends on EU; future evolution depends on the US
7000
NDOGTIE
Demand for CERs MT CO2 across Phase III
Mt CO2
€/t
5000
6000
7000CO2 30
EUA prices = 20 - 40€/t
CER Price
432
2,635
3000
4000
5000
CERs and international credits = 10 - 20€/t
15
1 681
701
43561
1000
2000
1,681
0EU Japan New Zealand Australia Canada USA
0
Source: New Energy Finance, J.P.Morgan

NEWEmergence of new offset categories for the carbon market…
OFFSET
M
• CDM CERs, including PoAs will be replaced by new offset products• NAMAs (Nationally Appropriate Mitigation Actions)
– Countries get credit for policies and measures rather than specific projectsUncertain: what actions are “creditable” and create NAMA credits ECH
ANISM
– Uncertain: what actions are creditable and create NAMA credits• Sectoral credits for advanced developing countries
– Set targets or benchmarks by sector (e.g. steel, cement, electricity)– Step toward national targets for China, India, Brazil, Mexico, etc.
h b l b h k b d d d
S
– Uncertain: how are baselines or benchmarks or binding targets determined• How will NAMAs and Sectoral Credits be operationalized?• What is the role for the private sector?
– Verifiers– Finance– Project developers
• What is lead‐in time? – NAMA pilots by end 2011? Role of the PMRp ots by e d 0 ? o e o t e– If crediting, then start in 2013…?– If eligible for compliance, from 2014…?
• Early mover advantage (but with increased risk)

NEED
… move to a cap‐and‐trade system in advanced developing countriesFO
RA
• Design of a Cap‐and‐Trade system• Accurate emission inventory is the starting point
• Preparation of national emission inventory• Design of legal frameworks to collect, store and verify data
h h f ll / CAP‐A
ND‐
• Assigning coherent targets to sectors and within sectors to specific installations/operations• Development of guidelines for monitoring, reporting, verification, enforcement and
compliance• Development of registry of transactions• Making the business community aware ‐T
RADE
S
Making the business community aware• Legally embed trading rules
• Offset credits – create additional flexibility S
YSTEM
– maintain overall efficiency– create additional revenue streams for non‐ETS sectors
• Requirements for integration of project credits integrity of projects– integrity of projects
– low data uncertainties– appropriate baselines (safeguarding additionality)

THE
G
World energy‐related CO2 emission savings by technology in the 450 Scenario relative to the Current Policies Scenario
GLO
BALM
45
40
45
Gt
Share of cumulative abatement between 2010-2035
42.6 GtCurrent Policies Scenario
MITIG
ATIO
N
30
35
Efficiency 53%Renewables 21%Biofuels 3%Nuclear 9%
20.9 Gt
CHALLEN
G
In the 450 Scenario, compared with the Current Policies Scenario, efficiency measures provide 53% of the necessary
25
30CCS 15%
21 7 Gt450 Scenario
GE
abatement, but renewables, CCS & nuclear are also crucial20
2008 2015 2020 2025 2030 2035
21.7 Gt
Source: IEA 2010
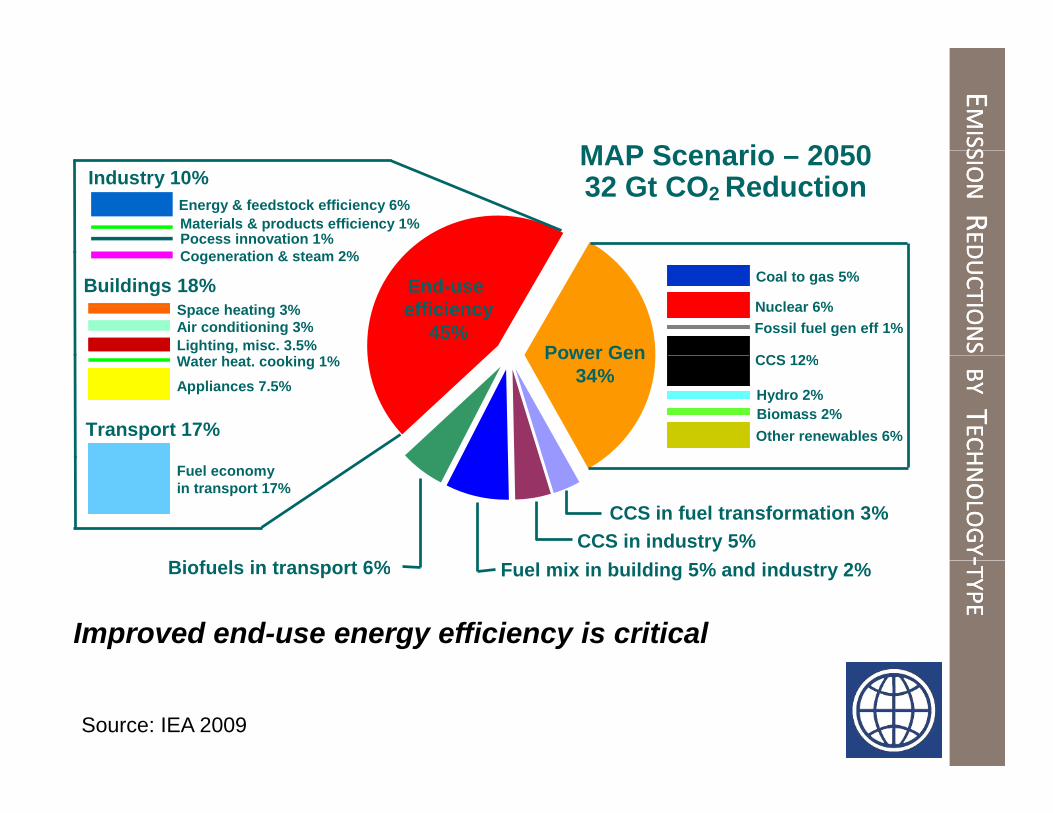
MAP Scenario 2050
EEMISS
MISSMAP Scenario – 2050
32 Gt CO2 ReductionMaterials & products efficiency 1% Energy & feedstock efficiency 6%
C ti & t 2%Pocess innovation 1%
Industry 10%
SION
SIONRREDED
Fossil fuel gen eff 1%Nuclear 6%
Coal to gas 5%
CCS 12%Power Gen
End-use efficiency
45%
Cogeneration & steam 2%
Space heating 3%
Lighting, misc. 3.5%Air conditioning 3%
Buildings 18%
DUCTIO
NS
DUCTIO
NS
Other renewables 6%Biomass 2%Hydro 2%
CCS 12%Power Gen34%Appliances 7.5%
Water heat. cooking 1%
Transport 17%
BYBYTTECHECH
Bi f l i 6%
CCS in fuel transformation 3%CCS in industry 5%
Fuel economy in transport 17%
HNOLO
GY
HNOLO
GY‐‐
Improved end-use energy efficiency is critical
Fuel mix in building 5% and industry 2%Biofuels in transport 6%
‐‐TYPETYPE
Source: IEA 2009
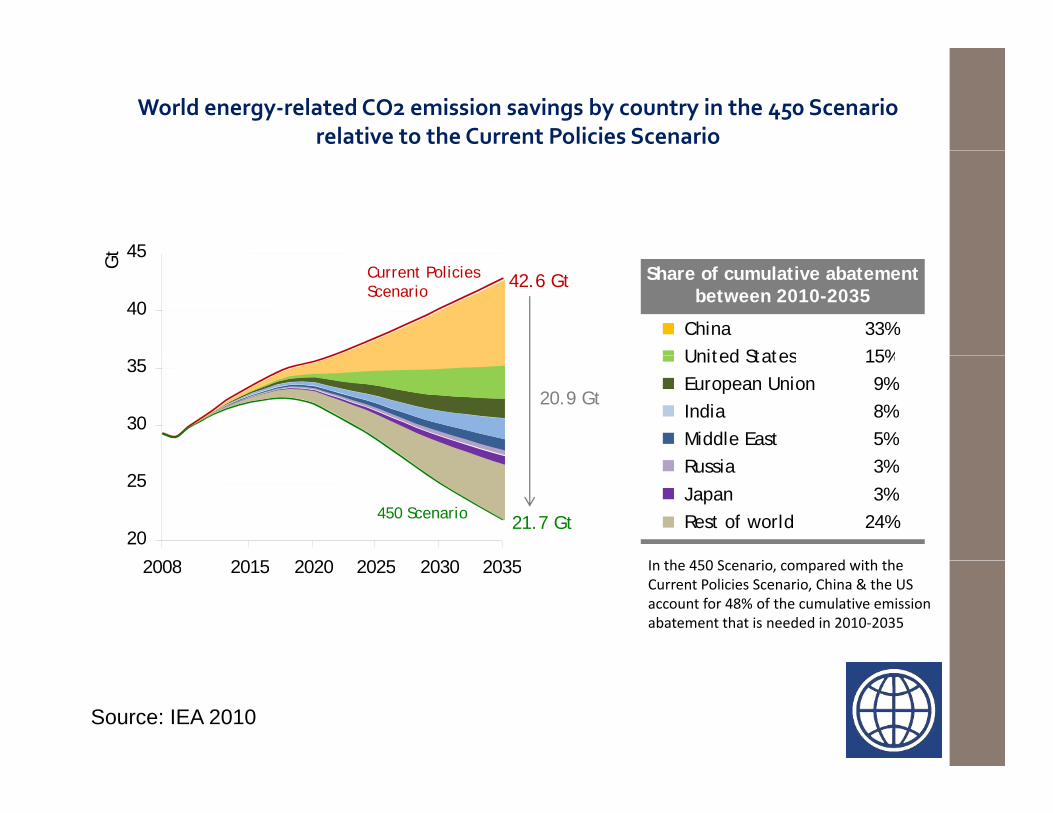
World energy‐related CO2 emission savings by country in the 450 Scenariorelative to the Current Policies Scenario
45t
40
45
Gt
China 33%United States 15%
Share of cumulative abatement between 2010-2035
42.6 GtCurrent Policies Scenario
30
35 United States 15%European Union 9%India 8%Middle East 5%
20.9 Gt
I h 450 S i d i h h
20
25
2008 2015 2020 2025 2030 2035
Russia 3%
Rest of world 24%Japan 3%
21.7 Gt450 Scenario
In the 450 Scenario, compared with the Current Policies Scenario, China & the US account for 48% of the cumulative emission abatement that is needed in 2010‐2035
2008 2015 2020 2025 2030 2035
Source: IEA 2010
GREEN
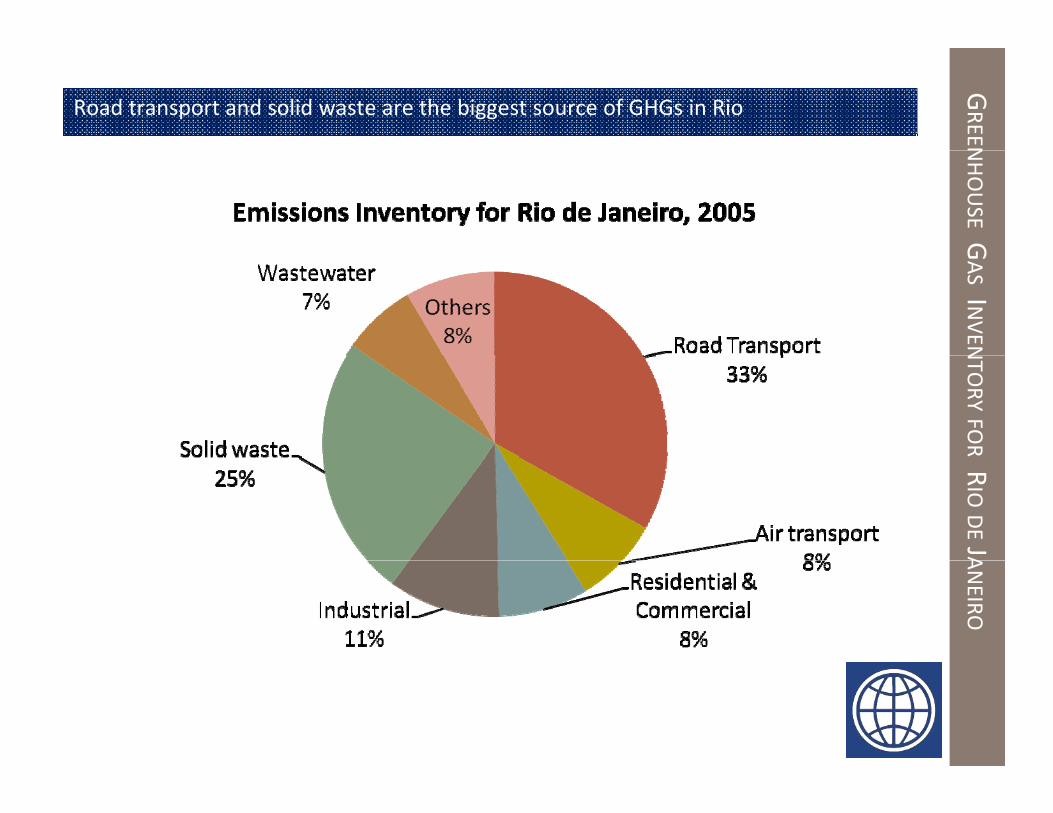
Road transport and solid waste are the biggest source of GHGs in RioNHOUSE
GGASINVENN
TORY
FORRIO
DEJAANEIRO

MIT
IGA
TIO
NMEA
SUR
ESAND
SUIT
ABIL
ITY
OF
INST
RUME
NTS
Transport system mitigation is important for Rio
CDM‐type activities are difficult for this sector; NAMA‐type offsets better fit?
TRANSPORT Voluntary offsets (e.g. VCS,
Project‐based Offsets (e.g.
Program‐based offsets
NAMAs/ Sector‐wide
Cap‐and‐Trade
yp ; yp
Gold Standard CDM) credits
Increasing level of “commitment”
Bike path
Non‐motorized transport
Modal shift (e.g. Public transport)
Fuel switch
Zoning/ smart planning
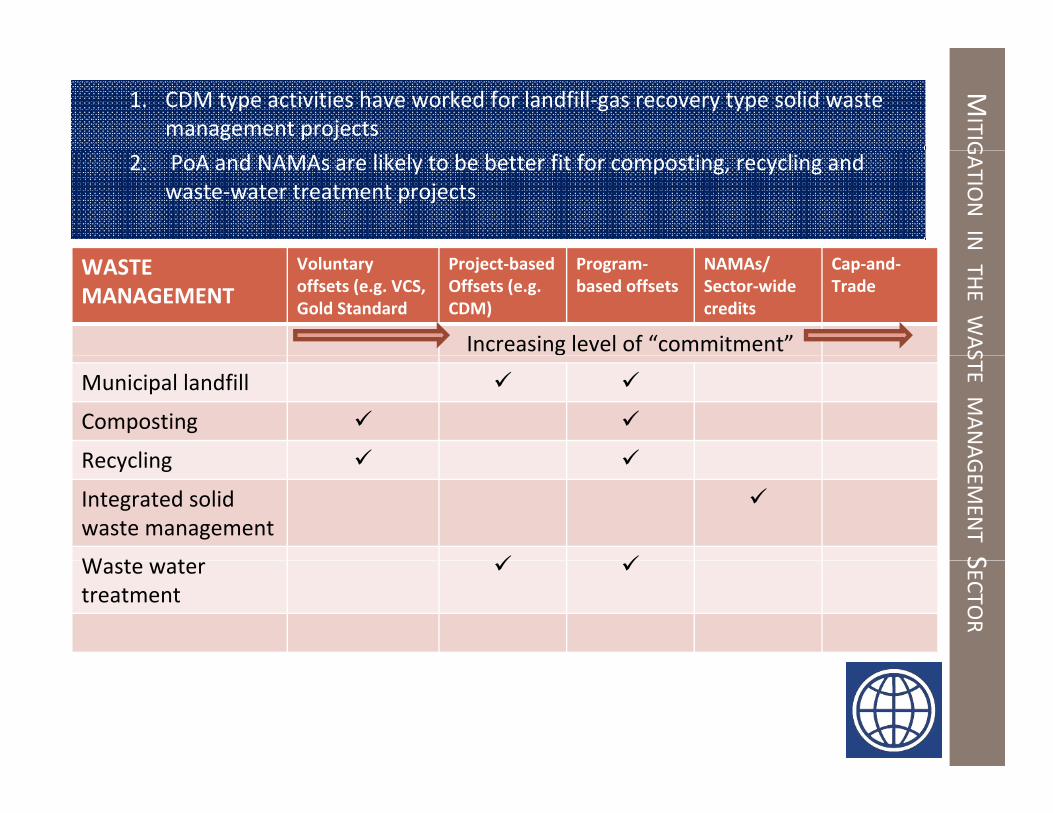
1. CDM type activities have worked for landfill‐gas recovery type solid waste management projects
MITIG
2. PoA and NAMAs are likely to be better fit for composting, recycling and waste‐water treatment projects
GATIO
NIN
WASTE MANAGEMENT
Voluntary offsets (e.g. VCS, Gold Standard
Project‐based Offsets (e.g. CDM)
Program‐based offsets
NAMAs/ Sector‐wide credits
Cap‐and‐Trade
Increasing level of “commitment”
THE
WAS
Municipal landfill
Composting
Recycling
STEMANA
Recycling
Integrated solidwaste management
W t t
AGEM
ENTS
Waste water treatment
SECTO
R

ENERG1. PoA type activities seem to be attractive for lighting and appliance efficiency
programs; Project‐based CDM type activities have failed to take off. GY
EFFICIE
2. NAMAs and Cap‐and‐Trade are likely to be effective for industrial consumers and building energy efficiency
ENERGY EFFICIENCY
Voluntary offsets (e.g. VCS, Gold Standard
Project‐based Offsets (e.g. CDM)
Program‐based offsets
NAMAs/ Sector‐wide credits
Cap‐and‐Trade
Increasing level of “commitment”
ENCY
MEA
Sg
Lighting efficiency
Appliance efficiency
I d t i l
SURES
FOR
Industrial energy efficiency
Building energy efficiency
RMITIG
AT
efficiency ION

Carbon Linked Financial Products
Design objective is to utilize limited public sector financial resource flows (e.g. from “Fast‐Start” resources committed at Copenhagen in 2009 or the Green Climate Fund established atCopenhagen in 2009 or the Green Climate Fund established at Cancun) to leverage much larger private sector investments for low carbon infrastructure investments
Selection of possible products:• Guarantees
– Product 1: WB Carbon Market Development Guarantee (“Carbon p (Guarantee”)
– Product 2: Off‐Balance Sheet Carbon Guarantee
• BondsBonds– Product 3: Country Issued Carbon‐linked Bond with WB Guarantee
• Product 4: Carbon Price Support fund
15

WB
Product 1: Carbon Market Development Guarantee– How it works
LAC“Off Shore” CARBO
N
Buyer of Carbon Credits[S i P i t P bli titi ]
LACOff‐Shore
CERs GUARA
NT
[Sovereigns, Private or Public entities]
$ ‘Shortfall’ Agreement [for failure to deliver]
$ m
Day 2
TEE
LAC Country Carbon Promoter
$ m (ERPA)
Day 1
Indemnity Agreement
WB Guarantee of Shortfall Agreement $
energy savings $
16
Pool of Low‐carbon Projects

OFFB
Product 2: Off Balance Sheet Carbon Guarantee – How it works
LAC“Off Shore”
BALANCE
SBuyer of Carbon Credits[S i P i t P bli titi ]
LACOff‐Shore
CERs HEET
CAR
[Sovereigns, Private or Public entities]
$ ‘Shortfall’ Agreement [for failure to deliver]
$ m
Day 2
BONGUA
LAC Country Carbon Promoter
$ m (ERPA)
Day 1
ARA
NTEE
Guarantee of Shortfall Agreement $
MDB
Indemnity Agreement
energy savings $
MDB
Trust Guarantor
$
17
Pool of Low‐carbon Projects“Climate Fund/
Annex I”
$

VARIA
Product 4: Country Issued Bond with WB Guarantee – How it works
LAC“Off Shore”
ATIO
N3: CCompliance Buyer
[S i P i t P bli titi ]
LACOff‐Shore
CERsCERs C
OUNTRY
IS
[Sovereigns, Private or Public entities]
$ Principal repayment
$ m
SSUED
BON
Bond Issuer LAC Country
$ m (Principal)
NDWITH
W
Indemnity Agreement
WB Guarantee of Principal $ Net Bond
proceeds WB G
UARA
$ energy savings
ANTEE
18
Pool of CDM Projects

CERs
Product 4: Emission Reduction Price Support Facility
TRE Auction Facility
CERs$price
CERs $price
Price Support FacilityGreen Fund$
$upside share
If $price < $minGreen Fund pays the
Carbon Reduction projects
CERs $min
p ydifference If $price >$min
Seller receives share of upside
Carbon Reduction projects
Key Challenge: Determining $min• Minimum price should be based on generating minimum IRRMinimum price should be based on generating minimum IRR
will depend on emission factor and project technology

SUMM
New carbon instruments for the carbon market are emerging and are important for mitigation financing in large cities of important developing countries M
ARY
AND
• Market based instruments have established their usefulness for mitigation action– However, carbon market regulations are in a state of flux– Early mover advantage in the market comes with risk D
CONCLU
y g
• Newer carbon instruments such as PoAs, NAMAs, Sectoral Credits are just beginning to be defined– Move seems to be to move towards cap‐and‐trade systems U
SIONS
p y
• For large cities, range of carbon assets will be attractive– Starting point for the appropriate carbon instrument is a good inventory of
greenhouse gas emissions g g
• Financing instruments linked to the carbon asset will be important to generate financing for the investments that will reduce the greenhouse has emissions
• In a period of regulatory uncertainty, the Bank will have important role to pilot new carbon instruments and carbon‐linked financial products