combined positive and negative feedback allows
TRANSCRIPT
Article
Combined Positive and Ne
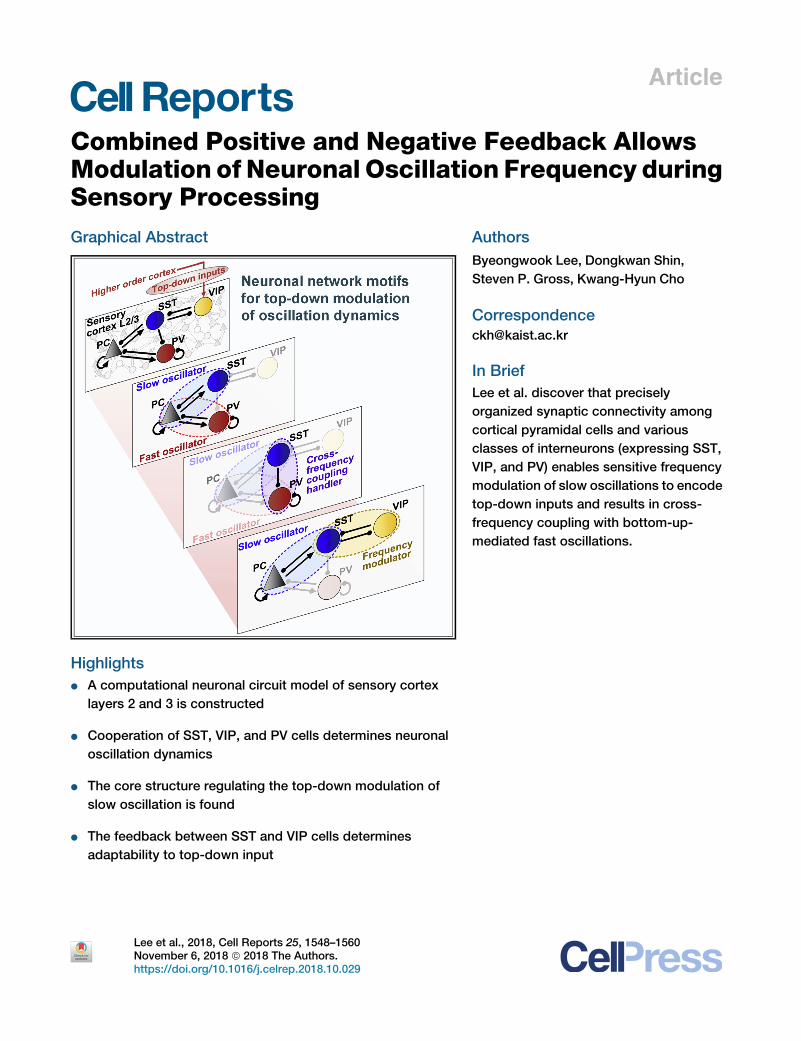
gative Feedback AllowsModulation of Neuronal Oscillation Frequency duringSensory ProcessingGraphical Abstract
Highlights
d A computational neuronal circuit model of sensory cortex
layers 2 and 3 is constructed
d Cooperation of SST, VIP, and PV cells determines neuronal
oscillation dynamics
d The core structure regulating the top-down modulation of
slow oscillation is found
d The feedback between SST and VIP cells determines
adaptability to top-down input
Lee et al., 2018, Cell Reports 25, 1548–1560November 6, 2018 ª 2018 The Authors.https://doi.org/10.1016/j.celrep.2018.10.029
Authors
Byeongwook Lee, Dongkwan Shin,
Steven P. Gross, Kwang-Hyun Cho
In Brief
Lee et al. discover that precisely
organized synaptic connectivity among
cortical pyramidal cells and various
classes of interneurons (expressing SST,
VIP, and PV) enables sensitive frequency
modulation of slow oscillations to encode
top-down inputs and results in cross-
frequency coupling with bottom-up-
mediated fast oscillations.

Cell Reports
Article
Combined Positive and Negative Feedback AllowsModulation of Neuronal Oscillation Frequencyduring Sensory ProcessingByeongwook Lee,1 Dongkwan Shin,1 Steven P. Gross,2 and Kwang-Hyun Cho1,3,*1Laboratory for Systems Biology and Bio-inspired Engineering, Department of Bio and Brain Engineering, Korea Advanced Institute ofScience and Technology (KAIST), Daejeon 34141, Republic of Korea2Department of Developmental and Cell Biology, UC Irvine, Irvine, CA 92697, USA3Lead Contact
*Correspondence: [email protected]://doi.org/10.1016/j.celrep.2018.10.029
SUMMARY
A key step in sensory information processing in-volves modulation and integration of neuronal oscil-lations in disparate frequency bands, a poorly under-stood process. Here, we investigate how top-downinput causes frequency changes in slow oscillationsduring sensory processing and, in turn, how theslow oscillations are combined with fast oscillations(which encode sensory input). Using experimentalconnectivity patterns and strengths of interneurons,we develop a system-level model of a neuronal cir-cuit controlling these oscillatory behaviors, allowingus to understand the mechanisms responsible forthe observed oscillatory behaviors. Our analysis dis-covers a circuit capable of producing the observedoscillatory behaviors and finds that a detailedbalance in the strength of synaptic connections isthe critical determinant to produce such oscillatorybehaviors. We not only uncover how disparatefrequency bands are modulated and combined butalso give insights into the causes of abnormalneuronal activities present in brain disorders.
INTRODUCTION
Cognitive processes—including attention, memory formation,
and sensory processing—are tightly correlated with neuronal os-
cillations involving multiple timescales. Depending on top-down
influences, oscillations in the low-frequency range (3–20 Hz) un-
dergo context-dependent frequency modulations, which deliver
specific commands of the higher-order cortex, suggesting that
sensitive frequency modulation plays a crucial role in cognitive
processes by rendering neuronal communication effective, pre-
cise, and selective (Bastos et al., 2015; Engel et al., 2001; Fries,
2015; Kilavik et al., 2012; Michalareas et al., 2016). Indeed, these
frequency changes likely coordinate specific cortical functions,
such as stimulus selection (Schroeder and Lakatos, 2009), multi-
sensory integration (van Atteveldt et al., 2014), and motor plan-
ning (Rickert et al., 2005) through combining with fast neuronal
oscillations (>20 Hz; phenomenon referred to as ‘‘cross-fre-
1548 Cell Reports 25, 1548–1560, November 6, 2018 ª 2018 The AuThis is an open access article under the CC BY-NC-ND license (http://
quency coupling’’ [CFC]), which typically encode sensory stimuli
(Canolty and Knight, 2010; Hyafil et al., 2015; Schroeder and
Lakatos, 2009). CFC has recently received attention due to its
participation in cognitive processing (Hyafil et al., 2015). Not sur-
prisingly, altered oscillatory behaviors (e.g., abnormal frequency
modulation of slow oscillations and abnormal CFC) are reported
to cause cognitive deficits in various brain disorders (Basar-
Eroglu et al., 2008; Hong et al., 2004; Javitt, 2009; Koh et al.,
2011; Marco et al., 2011). However, in spite of such experimental
interest and demonstrated importance, how slow oscillations are
modulated, and how their combination with fast oscillations is
controlled, remains unclear.
Although exactly how these oscillatory behaviors are formed
and controlled remains unclear, we do know spatially where
these processes occur: in the superficial layers (layers 2 and 3)
of the sensory cortex (Chen et al., 2017). Layers 2 and 3 of the
sensory cortex play a central role in sensory processing as
they receive and integrate local feedforward inputs (i.e., bot-
tom-up sensory inputs) and top-down inputs from other cortical
areas (Harris and Mrsic-Flogel, 2013; Karnani et al., 2016; Lee
et al., 2013; Zhang et al., 2014). In particular, the cortico-cortical
top-down inputs to layers 2 and 3 are thought to be crucial
for context-dependent sensory processing (Bastos et al., 2015;
Harris and Mrsic-Flogel, 2013; Lee et al., 2013; Zhang et al.,
2014).
Sensory processing is likely to be reflected in the spiking
activity of neurons, and synchronized oscillatory firing activity
of pyramidal cells (PCs) at various frequencies has been typically
detected in layers 2 and 3 of the sensory cortex (Chen et al.,
2017; Womelsdorf et al., 2014). Although multiple features
contribute to determining the firing activity of PCs, the contribu-
tion of the three largest inhibitory interneurons (INs), which repre-
sent 90% of INs in layers 2 and 3 of the sensory cortex, has
gained much attention (Pfeffer et al., 2013). Somatostatin-
expressing INs (SST INs) and parvalbumin-expressing INs (PV
INs) have been shown to contact PCs andmediate synchronized
oscillatory activity of PCs in distinct frequency ranges (with SST
INs mediating oscillations in the 5- to 30-Hz range and PV INs
mediating oscillations in the >20-Hz range; Chen et al., 2017).
Moreover, vasoactive intestinal-peptide-expressing INs (VIP
INs) are the main recipients of top-down input from higher-order
cortex and mediate disinhibition of PCs through inhibiting SST
INs (Lee et al., 2013; Pi et al., 2013; Zhang et al., 2014).
thors.creativecommons.org/licenses/by-nc-nd/4.0/).
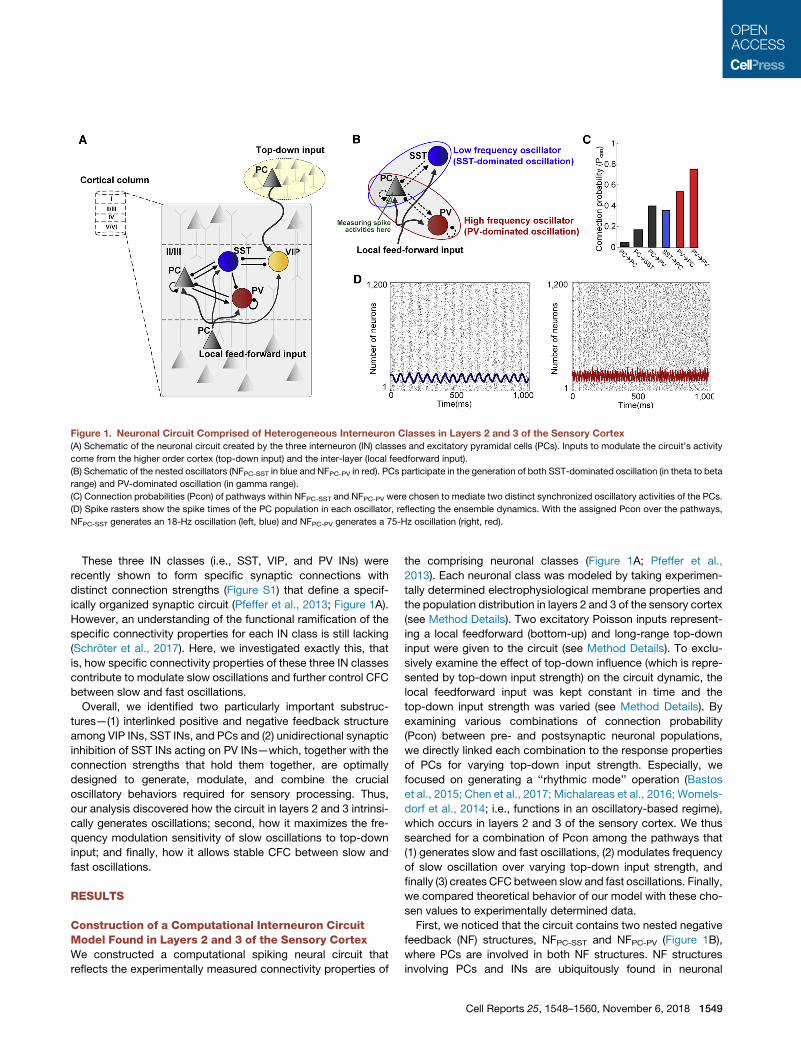
Figure 1. Neuronal Circuit Comprised of Heterogeneous Interneuron Classes in Layers 2 and 3 of the Sensory Cortex(A) Schematic of the neuronal circuit created by the three interneuron (IN) classes and excitatory pyramidal cells (PCs). Inputs to modulate the circuit’s activity
come from the higher order cortex (top-down input) and the inter-layer (local feedforward input).
(B) Schematic of the nested oscillators (NFPC-SST in blue and NFPC-PV in red). PCs participate in the generation of both SST-dominated oscillation (in theta to beta
range) and PV-dominated oscillation (in gamma range).
(C) Connection probabilities (Pcon) of pathways within NFPC-SST and NFPC-PV were chosen to mediate two distinct synchronized oscillatory activities of the PCs.
(D) Spike rasters show the spike times of the PC population in each oscillator, reflecting the ensemble dynamics. With the assigned Pcon over the pathways,
NFPC-SST generates an 18-Hz oscillation (left, blue) and NFPC-PV generates a 75-Hz oscillation (right, red).
These three IN classes (i.e., SST, VIP, and PV INs) were
recently shown to form specific synaptic connections with
distinct connection strengths (Figure S1) that define a specif-
ically organized synaptic circuit (Pfeffer et al., 2013; Figure 1A).
However, an understanding of the functional ramification of the
specific connectivity properties for each IN class is still lacking
(Schroter et al., 2017). Here, we investigated exactly this, that
is, how specific connectivity properties of these three IN classes
contribute to modulate slow oscillations and further control CFC
between slow and fast oscillations.
Overall, we identified two particularly important substruc-
tures—(1) interlinked positive and negative feedback structure
among VIP INs, SST INs, and PCs and (2) unidirectional synaptic
inhibition of SST INs acting on PV INs—which, together with the
connection strengths that hold them together, are optimally
designed to generate, modulate, and combine the crucial
oscillatory behaviors required for sensory processing. Thus,
our analysis discovered how the circuit in layers 2 and 3 intrinsi-
cally generates oscillations; second, how it maximizes the fre-
quency modulation sensitivity of slow oscillations to top-down
input; and finally, how it allows stable CFC between slow and
fast oscillations.
RESULTS
Construction of a Computational Interneuron CircuitModel Found in Layers 2 and 3 of the Sensory CortexWe constructed a computational spiking neural circuit that
reflects the experimentally measured connectivity properties of
the comprising neuronal classes (Figure 1A; Pfeffer et al.,
2013). Each neuronal class was modeled by taking experimen-
tally determined electrophysiological membrane properties and
the population distribution in layers 2 and 3 of the sensory cortex
(see Method Details). Two excitatory Poisson inputs represent-
ing a local feedforward (bottom-up) and long-range top-down
input were given to the circuit (see Method Details). To exclu-
sively examine the effect of top-down influence (which is repre-
sented by top-down input strength) on the circuit dynamic, the
local feedforward input was kept constant in time and the
top-down input strength was varied (see Method Details). By
examining various combinations of connection probability
(Pcon) between pre- and postsynaptic neuronal populations,
we directly linked each combination to the response properties
of PCs for varying top-down input strength. Especially, we
focused on generating a ‘‘rhythmic mode’’ operation (Bastos
et al., 2015; Chen et al., 2017; Michalareas et al., 2016; Womels-
dorf et al., 2014; i.e., functions in an oscillatory-based regime),
which occurs in layers 2 and 3 of the sensory cortex. We thus
searched for a combination of Pcon among the pathways that
(1) generates slow and fast oscillations, (2) modulates frequency
of slow oscillation over varying top-down input strength, and
finally (3) creates CFC between slow and fast oscillations. Finally,
we compared theoretical behavior of our model with these cho-
sen values to experimentally determined data.
First, we noticed that the circuit contains two nested negative
feedback (NF) structures, NFPC-SST and NFPC-PV (Figure 1B),
where PCs are involved in both NF structures. NF structures
involving PCs and INs are ubiquitously found in neuronal
Cell Reports 25, 1548–1560, November 6, 2018 1549

Figure 2. Frequency Modulation Mediated by an Interlinked Positive and Negative Feedback Structure among Pyramidal Cells, SST
Interneurons, and VIP Interneurons
(A) Schematic with a sub-circuit of the circuit in Figure 1A, indicating an interlinked positive and negative feedback (IPNF) structure. After determining the
PconPC/SST and PconSST/PC for NFPC-SST to act as an oscillator (Figure 1C), we now include positive feedback (PF) by including the interactions with the VIP INs,
(legend continued on next page)
1550 Cell Reports 25, 1548–1560, November 6, 2018

networks. Because they have been proposed to generate oscil-
latory activity (Prill et al., 2005; Wilson and Cowan, 1972), we hy-
pothesized that here these structures might participate in gener-
ating the observed collective slow (3–20 Hz) and fast (>20 Hz)
oscillations in layers 2 and 3 of the sensory cortex (Chen et al.,
2017). Moreover, additional work found that the peak frequency
of the NF structure is primarily determined by the specific bal-
ance of connectivity strengths for pathways within the structure
(Borgers and Kopell, 2003; Brunel and Wang, 2003; Shin and
Cho, 2013). As noted above, modulating Pcon allows control of
synaptic connectivity strengths, thus, in principle, allowing us
to tune the oscillation frequencies for the two NF structures,
NFPC-SST and NFPC-PV. We denote the connectivity strengths
for these substructures as PconNF.We chose a particular PconNFfor each pathway (Figure 1C) that generates highly synchronized
oscillatory activities of the PCs (see Figure S2 and Method
Details for details). With such PconNF, in response to local feed-
forward input, the NFPC-SST generated an 18-Hz oscillation (Fig-
ure 1D, left) and the NFPC-PV generated a 75-Hz oscillation (Fig-
ure 1D, right), within the frequency ranges of typical beta and
gamma oscillations, respectively, and consistent with experi-
mentally determined frequencies (Chen et al., 2017). As such,
we kept PconNF fixed for all further analyses.
The Synaptic Structure Constructed by DistinctConnectivity Patterns of VIP Interneurons, SSTInterneurons, and PCs Meets the StructuralPrerequisite for High Adaptability to Top-Down InputBecause PV INs are considered to contribute more on encoding
bottom-up sensory input rather than top-down input, we initially
excluded the PV INs from the circuit to investigate the circuit’s
top-down processing. Thus, we focused on the part of the circuit
that includes VIP INs, SST INs, and PCs. Intriguingly, we
observed that these three neuronal classes are connected by
positive-plus-negative feedback structures (Figure 2A, left).
Although a single negative feedback structure can produce
sustained oscillations, and single negative and positive feedback
structures are found in some biological networks (Eshaghi et al.,
2010; Gouze, 1998; Kim et al., 2007, 2010; Kim and Cho, 2006;
Murray et al., 2010; Park et al., 2006; Shin et al., 2006; Sreenath
PFSST-VIP. We examined under what conditions the population activity of the PCs e
(i.e., asynchronous mode) by varying PconVIP/SST, PconSST/VIP, and top-down i
defined as an upper limit of parameter combinations (PconVIP/SST, PconSST/V
Rhythmic mode boundaries between top-down input strength and PconVIP/SST
indicates whether the particular parameter combination is designated as rhythmic
(either rhythmic mode or asynchronous mode) and averaging over all PconSST/V
(right). The color code represents the relative abundance of the number of times e
the range of PconVIP/SST that the rhythmic mode maintains over the wide top-d
(B) An example illustration of calculating the frequency modulation tendency (FM
PconVIP/SST and PconSST/VIP was examined (right up). Within the PconSST/VIP
(right bottom). The pink line indicates the optimal PconVIP/SST that maximizes th
(C) Modulation of the oscillation frequency over increasing PconSST/VIP and top
oscillation frequency modulates in a stepwise manner over the top-down input in
top-down input strengths is plotted (right).
(D) The FMT of the IPNF structure increased linearly with increasing PconSST/VI
(E) Firing rates of PCs increase as the strength of top-down input increases.
(F) IPNF structure provides a constant oscillation amplitude and the oscillation fr
box-and-whisker plots.
et al., 2008; Tsai et al., 2008), many biological oscillators employ
coupled feedback structures, as observed in eukaryotic cell cy-
cle (Pomerening et al., 2005), circadian clocks (Lee et al., 2000),
and the p53-Mdm2 oscillator (Harris and Levine, 2005). Gener-
ally speaking, the presence of positive feedback combined
with negative feedback increases adaptability to various stimuli
and creates greater frequency tunability over a wider stimulus
range than a simple negative feedback structure, while maintain-
ing a constant oscillation amplitude (Tian et al., 2009; Tsai et al.,
2008). Layers 2 and 3 of the sensory cortex also requires this
functional characteristic (i.e., a high degree of adaptability to
stimuli), as they are the major targets of top-down input from
higher-order cortex and have a central role in sensory process-
ing. Thus, high-frequency tunability by top-down input would
be preferable for the sensory cortex, to increase communication
diversity and allow selective communication with other brain
regions for top-down-influenced (i.e., context-dependent)
sensory processing. Notably, the interlinked positive and nega-
tive feedback (IPNF) structure among VIP INs, SST INs, and
PCs satisfy the structural prerequisite for high adaptability to
top-down input.
The Interlinked Positive and Negative FeedbackStructure of VIP-SST-PC Enables FrequencyModulationwith a Constant AmplitudeWe were intrigued by the presence of the IPNF structure in
layers 2 and 3 of the sensory cortex because this structure has
never been reported in neuronal networks. Integrating positive
feedback, PFSST-VIP, with the negative feedback structure,
NFPC-SST, that we found likely to generate the beta oscillation
might then allow frequency tuning of this oscillation in response
to top-down stimuli. Because diverse responses can arise from
the same structure depending on its context, here we wanted
to assess the adaptability of the IPNF structure to varying top-
down stimuli: is it able to respond to a broad range of such stimuli
and, if so, which aspects of the network contribute to this ability.
We hypothesized that, to have high adaptability, the IPNF struc-
ture should first maintain (but modulate) the intrinsic oscillatory
behavior of NFPC-SST over wide top-down input strengths. To
investigate, we first explored the importance of the feedback
xhibits oscillatory behavior (i.e., rhythmicmode) versus asynchronous behavior
nput strength (left). We obtained the rhythmic mode boundary surface, which is
IP, and top-down input strength) that generated the rhythmic mode (middle).
at different PconSST/VIP are compared (middle up). The color of each voxel
mode (red) or asynchronousmode (blue). By summing the status of each voxel
IP values, the average rhythmic mode boundary over PconSST/VIP was obtained
ach voxel had rhythmic mode status over PconSST/VIP. Shaded box indicates
own stimuli (right).
T) of the IPNF structure (left). The FMT of the IPNF structure with particular
range of 0.6�0.9, the FMT exhibited a bell-shaped change over PconVIP/SST
e FMT of the IPNF structure.
-down input strengths, with a fixed PconVIP/SST of 0.12, is plotted (left). The
crement. Example evolution of the spike-time histogram of PCs under different
P. The pink line indicates the optimal PconSST/VIP that maximizes the FMT.
equency varies along with top-down input strengths. Data are represented as
Cell Reports 25, 1548–1560, November 6, 2018 1551

strength of the positive feedback (PF), PFSST-VIP module,
by changing connectivity strengths of the PFSST-VIP (i.e.,
PconVIP/SST and PconSST/VIP) and strengths of top-down input
and then assessing the impact of such changes by using numer-
ical simulations to determine whether the population of PCs ex-
hibits rhythmic mode under each condition (Figure 2A, left). If the
PCs do exhibit such a rhythmic mode, we further examined the
frequency values (see Method Details). One goal of exploring
the effect of changes in these parameter values was to under-
stand a surprising experimental observation: there is a distinct
disparity of the measured connectivity strengths in PFSST-VIP(weak VIP/SST connectivity strength and strong SST/VIP
strength; Pfeffer et al., 2013).
By examining the whole parameter space, we were able to
determine the range of PF parameters over which theNF-derived
rhythmic mode persists; its boundary was defined as an upper
limit of the PconVIP/SST and PconSST/VIP combinations that
maintained the rhythmic mode in response to top-down
stimuli (Figure 2A, middle). Intriguingly, we found that the
rhythmic mode of NFPC-SST is maintained over a relatively wide
top-down input strength only for a low PconVIP/SST (i.e., for
PconVIP/SST < 0.3; Figure 2A, right).
As we identified that the VIP/SST pathway with the specific
range of PconVIP/SST contributes on maintaining rhythmic
mode for wide top-down input, we now investigated the contri-
bution of the SST/VIP pathway in deciding the adaptability of
the IPNF structure. As mentioned above, in general, it is likely
that, for context-dependent sensory processing, a functional
control circuit should display sensitive frequency modulation
of PCs to varying top-down stimuli (i.e., high adaptability). To
quantitatively explore this, and in particular the contribution of
the strength of the SST/VIP pathway to the frequency modu-
lation, we analyzed the actual frequency values that were ob-
tained at the boundary surface (Figure 2A, right). We developed
a metric we call the ‘‘frequency modulation tendency,’’ or FMT,
to measure the adaptability of the IPNF structure. The FMT
of the IPNF structure was calculated by counting the number
of different frequency values that appear over different top-
down input strengths at particular PconSST/VIP (Figures 2B,
left, and S3; see Method Details). Thus, a high FMT can be in-
terpreted as a high ‘‘top-down stimuli-to-unique frequency’’
mapping ability. We investigated how the FMT varies as
the PconSST/VIP changes and searched for optimal
PconSST/VIP that resulted in maximum FMT. While modulating
PconSST/VIP, we confined the analysis space to PconVIP/SST <
0.3 to maintain the rhythmic mode (see above). We found that
the FMT of the IPNF structure is determined by the balance
between PconVIP/SST and PconSST/VIP (Figure 2B, right top).
Our results (Figures 2B–2D) imply that the relatively weak con-
nectivity strength of the VIP/SST pathway and the relatively
strong connectivity strength of the SST/VIP pathway, in terms
of connection probability, are the conditions for maximizing
the frequency modulation capability of the IPNF structure. We
plotted some of the example evolution of the spike-time
histogram of PCs at PconVIP/SST = 0.12 and PconVIP/SST =
0.8 (Figure 2C). Oscillation frequency modulated from the
peak frequency of NFPC-SST to lower frequency in a stepwise
manner under increasing top-down input strength (Figure 2C).
1552 Cell Reports 25, 1548–1560, November 6, 2018
Ultimately, we picked PconVIP/SST = 0.12 and PconSST/VIP =
0.8 as the optimal Pcon to accomplish high FMT of the IPNF
structure (plotted with a pink line in Figures 2B, right bottom,
and 2D).
Under the tuned Pcons over the pathways for the maximum
frequency tunability, other characteristics of the neuronal
population activities exposed by the IPNF structure were
examined. As top-down input to VIP INs was increased, the
mean firing rates of PCs increased as previously reported
(Lee et al., 2013; Figure 2E). Furthermore, the IPNF structure
enabled the adjustment of the oscillation frequency while main-
taining the amplitude of the oscillation approximately constant,
which is an intriguing characteristic caused by the VIP INs re-
cruiting top-down inputs (Figure 2F). Such a characteristic
plays a crucial role in allowing slow oscillations to form reliable
and well-controlled CFC with fast oscillations; this is discussed
in more detail later.
The Lack of Self-Inhibition in SST and VIP InterneuronsEnables Flexible Frequency ModulationOne notable difference between the SST INs, VIP INs, and PV INs
is their self-inhibition preference: there are strong self-inhibitory
connections among PV INs, but the opposite is true for the
SST INs and VIP INs (Lee et al., 2013; Pfeffer et al., 2013). In
the context of the previously studied negative feedback loop
involving PV INs and PCs (NFPC-PV), which is ubiquitously found
in all brain regions and known to typically encode sensory input,
several studies reported on the phenomenological attributes of
strong self-inhibition on PV INs (Bartos et al., 2007; Buzsaki
andWang, 2012; Deleuze et al., 2014): inclusion of self-inhibition
connections among PV INs in NFPC-PV provides more precise
control over the activity of the PV INs, resulting in generation of
highly synchronized gamma oscillations. Because such oscilla-
tions become more vulnerable to noise as the frequency in-
creases, high firing synchrony of PV INs would be desirable for
gamma oscillations to ensure their reliability of information trans-
mission within and between brain regions. However, no study
has yet suggested functional consequences—and advantages,
if any—due to SST INs and VIP INs avoiding self-inhibition
connections.
To determine the ramifications of the weak self-inhibition
preferences of SST INs and VIP INs, we used our FMT metric
(see above): we increased PconSST/SST and PconVIP/VIP,
respectively (Figures 3A and 3C) and determined how that
changed the IPNF structure’s response to various top-down
input strengths (see Method Details). Overall, we found that
increasing self-inhibition resulted in significant impairment of
FMT (Figures 3B, 3D, and S4). As an example, as we increased
PconSST/SST, the FMT of the IPNF structure declined dramati-
cally (Figure 3B). In sum, the IPNF circuit’s activity is differentially
sensitivity to inclusion of self-inhibition connections to the SST
INs and VIP INs (i.e., there are different minimum strengths of
self-inhibition required to observe significant effects); however,
their effects are qualitatively similar: they both result in a reduced
FMT of the IPNF structure. These results thus provide an expla-
nation for the experimentally observed lack of self-inhibitory
connections: self-inhibition is lacking to maximize the FMT of
the IPNF structure. Therefore, in the model, we set the optimal

Figure 3. Effect of Increasing Self-Inhibition Strength in SST and VIP Interneurons onDetermining the FrequencyModulation Tendency of the
IPNF Structure
(A) Schematic of the IPNF structure, highlighting possible self-inhibition of SST interneurons (INs). The strength of the self-inhibition was determined by the value
of PconSST/SST.
(B) As PconSST/SST increases, the population activity of the PCs increasingly remains at the inherent characteristic peak frequency generated by the NFPC-SST,
which leads to a decrease in the FMT of the IPNF structure. Optimal PconSST/SST value that provides the maximum FMT is plotted with pink line.
(C) Schematic of the IPNF structure, highlighting possible self-inhibition of VIP INs. The strength of the self-inhibition was controlled by varying PconVIP/VIP.
(D) As the PconVIP/VIP increases, a larger PconVIP/SST is required (turquoise) to maximize FMT of the IPNF structure. However, increasing PconVIP/SST
eventually reduces the FMT of the IPNF structure (black), whichwas shown in our previous result (Figure 2B, right bottom). Optimal PconVIP/VIP value that provides
the maximum FMT is plotted with pink line. Data are represented as box-and-whisker plots.
Pcon of the SST/SST and VIP/VIP pathway to zero, as they
provide the maximum frequency modulation capability to the
IPNF structure.
Incorporation of Bottom-Up Influences by PV INsSo far, we identified the IPNF structure as the core structure for
top-down-mediated frequency modulation of the slow oscilla-
tions observed in layers 2 and 3. However, another factor may
affect the FMT of the IPNF structure: the PV INs actually form a
negative feedback loop with PCs and thus deliver bottom-up
influences to the PCs (Figure 4A, left). So, unlike the above
simplified model where the activity of PCs was solely influenced
by SST INs, here (and in actuality) the PCs receive influences
from PV INs as well, and thus the FMT of the IPNF structure is
likely affected by inclusion of the PV INs.
Mechanistically, previous experiments found that gamma
oscillations of the PV INs are controlled by the top-down-
mediated slow oscillations (Bastos et al., 2015; Fries, 2015),
suggesting that the FMT of the IPNF should remain high with
inclusion of PV INs. To unravel the specific conditions under
which PV INs meaningfully contribute to the overall circuit func-
tion for sensory processing, we thus analyzed an extended
model, which included PV INs in the IPNF structure (Figure 4A,
left). Specifically, we first examined how inclusion of the PV INs
affects the FMT of the IPNF structure. Increases in the top-
down input to the VIP INs reduce the activity of the SST INs,
which in turn release the PV INs from inhibition by the SST
INs. This decrement in SST INs activity allows the PV INs to
start influencing the activity of PCs and indeed become the
dominant population that governs the PCs’ activity. We named
Cell Reports 25, 1548–1560, November 6, 2018 1553

Figure 4. Variation in the Frequency Modulation Tendency of the IPNF Structure by Inclusion of SST/PV Pathway
(A) Schematic of the whole circuit (left). Increases in the top-down input to the VIP INs reduces the activity of the SST INs, which in turn releases the PV INs from
inhibition by the SST INs. This decrease in the activity of the SST INs eventually causes the PV INs to become the dominant population that governs the PCs’
activity and mediates state transition (right).
(B) Variation in the FMT of the IPNF structure when it is in the SST-dominated state, as a function of the strength of the SST/PV linkage, controlled by increasing
PconSST/PV. The transition to the PV-dominated state with high-frequency oscillations occurs as a function both of PconSST/PV and of the strength of top-down
input (left). The FMT of the IPNF structure only increases with PconSST/PV up to a critical PconSST/PV value of 0.5 (right). The pink line indicates the optimal
PconSST/PV that maximizes the FMT. Data are represented as box-and-whisker plots.
this phenomenon a ‘‘state transition’’ from ‘‘SST-dominated
state’’ to ‘‘PV-dominated state’’ (Figure 4A, right). This gradual
shift of PCs’ activity dominancy eventually affects the FMT of
the IPNF structure. Because the SST/PV pathway most
directly controls the activity of PV INs, we examined changes
in the FMT of the IPNF structure due to modulation
of PconSST/PV. Intriguingly, we found that excess value of
PconSST/PV is not functional. That is, although increasing
PconSST/PV to 0.5 increases the overall frequency tunability,
when PconSST/PV exceeds this value, it no longer affects the
frequency tunability of the IPNF structure (Figure 4B, left),
because increased inhibition from the VIP INs to the SST INs
caused the activities of the SST INs to decrease to a level
that NFPC-SST could no longer sustain the SST-dominated oscil-
lations. We thus chose PconSST/PV = 0.5 as the optimal Pcon
to carry out the frequency modulation process (plotted with a
pink line in Figure 4B, right). In summary, we built a model
1554 Cell Reports 25, 1548–1560, November 6, 2018
that determines the adaptability of the circuit with taking both
top-down and bottom-up influences into account.
Top-Down-Mediated Slow Oscillations Control Bottom-Up-Mediated Fast Oscillations via Precisely TunedSynaptic ConnectivityNow that we have created a model whose architecture is
derived from experiments, with connectivity strengths, in terms
of connection probability, optimized to have high adaptability
to top-down inputs (Figure 5A), we wanted to use the extended
model to better understand experimentally observed CFC, i.e.,
the ability of slow oscillations to affect fast ones. We examined
spike rasters that reflect population-level activity of the four
neuronal populations under five specific top-down input
strengths. The PCs, SST INs, and VIP INs exhibited a global
oscillatory behavior where the strength of top-down input deter-
mines the unique oscillation frequency of the PCs’ firing activity

Figure 5. The Activity Profiles of Four Neuronal Classes
(A) Diagram of the circuit, with the optimal connectivity strength (in terms of Pcon) of each pathway, obtained by the simulation analysis, to maximize the FMT of
the IPNF structure (i.e., high adoptability to top-down input).
(B) Spike rasters, reflecting ensemble activity of the four neuronal populations, as a function of different top-down input strengths. During the SST-dominated
state, PCs, SST INs, and VIP INs show synchronized population activity, where their oscillation frequencies decrease along with the increase of top-down input.
When top-down input increases to the level where SST INs can no longer control PV INs, PV INs become a dominant IN population that controls the firing pattern
of PCs.
(C) The strength of phase-amplitude coupling (PAC) is quantified for the PCs’ oscillatory activities that arise at a top-down input strength of 40 spikes/s,
70 spikes/s, and 100 spikes/s.
(D) Quantification of the change of the PAC strength along with the strength of the SST/PV pathway.
Cell Reports 25, 1548–1560, November 6, 2018 1555

Figure 6. Connectivity Strengths based on
Theoretical Model Simulations and Experi-
mental Recordings
(A) The optimal Pcon values for each pathway in the
circuit, obtained by the simulation analysis, under
the hypothesis that, for optimal performance, the
circuit should provide maximum frequency modu-
lation tendency.
(B) Estimated mean unitary postsynaptic charge
(uPSQ) (the time integral of unitary postsynaptic
current) of the synaptic connections among the four
different neuronal classes.
(C) Theoretical INC values obtained by multiplying
Pcon of (A) and mean uPSQ of (B).
(D) Experimentally measured INC values in the visual
cortex layers 2 and 3 (values adapted from Figure 7A
in Pfeffer et al. 2013). It can be seen that the INC
values over the pathways are similar between
theoretically obtained values and experimental
values. This result is thus consistent with the hy-
pothesis that, in vivo, synaptic connectivity
strengths in the pathways within the circuit have
evolved to the optimal values that not only provide
high adaptability to the top-down input but also
provide stable CFC between sensory information
(i.e., top-down command and bottom-up sensory
stimuli).
(Figure 5B). Most importantly, the firing pattern of PV INs—and
its subsequent influence on the PCs—was controlled by the ac-
tivity of SST INs mediated by top-down input through the SST/
PV pathway. As a result, the CFC appeared as the top-down
input strength to VIP INs was increased (40 spikes/s to 70
spikes/s and 100 spikes/s). We explored this CFC in more detail
by quantifying the strength of phase-amplitude coupling (PAC)
(see Method Details), which experimentally is the most widely
observed type of CFC between slow and fast oscillations (Hyafil
et al., 2015). We quantified the PAC strength of PCs’ oscillatory
activities in Figure 5B (via top-down input strength of 40 spikes/
s, 70 spikes/s, and 100 spikes/s). As the top-down input strength
increased, we observed a phase shift of strong PAC from b=g to
a=g to q=g (Figure 5C). Finally, because our analysis highlighted
the critical role of SST activity in controlling PV activity, we
explored this more by altering the PconSST/PV and investigating
its effect on PAC (Figure 5D). Indeed, the SST-PV coupling
strength played a critical role in facilitating the PAC: the weak
PconSST/PV produced weak PCA (Figure 5D, top) whereas the
PconSST/PV of 0.5, which we chose as the optimal value to
maintain high FMT of the IPNF, also ensured strong PAC (Fig-
ure 5D, bottom). In summary, although a number of synaptic
architectures were previously suggested for generation of PAC
(Hyafil et al., 2015), none considered the role of SST/PV
pathway, which we find plays a dominant role.
Regulation of oscillation amplitude during frequency modula-
tion is another important feature for brain function. In particular,
co-modulation of amplitude and frequency has been widely
1556 Cell Reports 25, 1548–1560, November 6, 2018
observed during frequency modulation in
fast oscillations (i.e., gamma range; Jadi
and Sejnowski, 2014). However, interest-
ingly, our analysis suggests that the IPNF structure keeps the
slow oscillation amplitude approximately constant during fre-
quency modulation, which is an intriguing characteristic caused
by the VIP INs recruiting top-down input (Figure 2F). To explore
the functional importance of this unique feature, especially in
respect to PAC efficiency, we considered a simplified oscillator
model (Figure S5; see Method Details). Interestingly, there was
superior PAC efficiency when the slow oscillation amplitude
was kept constant during frequency modulation (Figure S6).
Benefits of this property are discussed below (see Discussion).
Taken all together, our analysis provides a circuit-level explana-
tion of the previous experimental observations in terms of
a cooperative mechanism arising from interactions between
diverse IN classes.
Link to Previous ExperimentsBy studying the circuit’s dynamic response to top-down input,
we discovered that a specific balance of synaptic connectivity
strengths (in terms of Pcons; Figure 6A) could yield the rhythmic
mode operation for encoding a wide range of top-down input by
modulating the frequency of the SST-dominated oscillation in
theta to beta range. Because these Pcons were derived by simu-
lation analysis of the model circuit, under the appealing but un-
tested hypothesis that the system was optimized for frequency
modulation sensitivity of slow oscillations to top-down input,
we wanted to test whether this was actually consistent with
experimentally measured synaptic connectivity strengths.
Pfeffer et al. (2013) determined the synaptic connectivity
strengths between SST INs, VIP INs, and PV INs in the visual cor-
tex layers 2 and 3. They used a measurement called the individ-
ual neuronal contribution (INC), which is the product of the Pcon
between the pre- and postsynaptic neuronal classes and the
average unitary postsynaptic charge (uPSQ) (the time integral
of the unitary postsynaptic current) generated by a single pre-
synaptic spike. We estimated the average uPSQ between the
pre- and postsynaptic neuronal classes by using previous elec-
trophysiological recordings (Avermann et al., 2012; Figure 6B;
see Method Details). By multiplying the Pcon (Figure 6A) and
estimated uPSQ (Figure 6B), we represented the synaptic con-
nectivity strength of each pathway obtained by the simulation
analysis in terms of the INC value (Figure 6C). We found that
the estimated INC values of our model are consistent with the
experimental INC values of Pfeffer et al. (2013; Figure 6D), sug-
gesting that our hypothesis that the connectivity properties of
the circuit might have organized to perform high-frequency
tunability to encode top-down inputs (i.e., high adaptability) is
reasonable. In particular, a distinct disparity of the connectivity
strengths over the SST/VIP and VIP/SST pathways support
the maximum FMT of the IPNF structure for the SST-dominated
slow oscillation. Moreover, we found that the experimentally
determined INCSST/PV is consistent with our model value, sug-
gesting that top-down and bottom-up influences are properly
integrated to perform sensory processing. Moreover, the unique
synaptic connectivity strength of INCSST/PV suggests that the
brain circuit has evolved to consider the wiring economy for its
computational needs and make pertinent (i.e., neither too weak
nor unnecessarily strong) synaptic connections. Importantly,
taken together, our results suggest that the importance of synap-
tic connections cannot be determined solely by their strengths,
because a certain synaptic connectivity strength has meaning
primarily not in isolation but rather as it affects the network’s
function.
DISCUSSION
The superficial layers (layers 2 and 3) of the sensory cortex play a
central role in sensory processing by receiving and integrating
bottom-up and top-down inputs from other layers (within the
sensory cortex) and other cortical areas (Harris andMrsic-Flogel,
2013; Jones andWise, 1977; Lee et al., 2013; Zhang et al., 2014).
In particular, top-down inputs from the higher-order cortex are
considered crucial for context-dependent sensory processing
(Bastos et al., 2015; Diamond et al., 2008; Harris and Mrsic-Flo-
gel, 2013; Lee et al., 2013; Zhang et al., 2014). Interestingly,
synchronized oscillatory firing activities of PCs at various fre-
quencies within the theta to beta range are typically detected
in layers 2 and 3 (Bastos et al., 2015; Chen et al., 2017; Michalar-
eas et al., 2016; Womelsdorf et al., 2014), suggesting that
distinct oscillation frequencies encode the context-dependent
sensory processing. Furthermore, modulations of bottom-
up-mediated gamma oscillation by these top-down-mediated
slow oscillations are also detected in this area (Bastos et al.,
2015; Fries, 2015), suggesting an integration capability of the
area. Considering the crucial role of layers 2 and 3 in sensory
processing, a circuit-level systematic understanding of these
phenomena is of paramount importance. Nonetheless, although
the neuronal classes composing this area—and their intercon-
nection properties—have been reported, because they form a
complex feedback structure, it had previously not been possible
to use this experimental information to understand the ensem-
ble’s function.
Throughout this paper, we attempted to explain the physiolog-
ical regime (i.e., the origin of the observed frequencies and how
those frequencies are modulated and combined) in layers 2
and 3 of the sensory cortex. By analyzing the patterns of synaptic
connectivity in relation to the response properties of PCs,
we found that connectivity patterns with specific connectivity
strengths are designed to support a maximum frequency
tunability according to the top-down input strength, enabling
top-down demands to be encoded in distinct frequency compo-
nents. The IPNF structure we identify, formed by VIP INs, SST
INs, and PCs, is a key frequency modulator for the top-down
input, where VIP INs preferentially recruit top-down inputs.
From this analysis, various intriguing experimentally observed
connectivity properties could now be rationalized. For instance,
we find that the weak connectivity strength of the VIP/SST
pathway is required to sustain synchronized oscillatory activity
for PCs (Figure 2A, right). Moreover, the strong connectivity
strength of the SST/VIP pathway is required to broaden the fre-
quencymodulation range to encode top-down inputs (Figure 2D).
Our model helps understand the reason for the curious absence
of self-inhibition in SST INs and VIP INs: it contributes to achieve-
ment of sensitive frequency modulation (Figures 3B and 3D).
Moreover, the intermediate connectivity strength of the SST/
PV pathway is an optimal value that both maximizes the fre-
quency modulation capability of the IPNF structure among
VIP-SST-PCs (Figure 4B) and also ensures stable cross-fre-
quency coupling between top-down-mediated slow oscillations
and bottom-up-mediated fast oscillations (Figure 5D). As seen in
our extensive simulation results, alteration of even a single
pathway can strongly influence the outcome of the circuit (i.e.,
frequency tunability and integration of slow and fast oscillations),
indicating that interactions among neuronal classes should be
very specifically tuned for a particular function.
Notably, our study thus adds perspective on how frequency
modulation of the slow oscillation occurs. Previously, the fre-
quencymodulation of the slow oscillation wasmainly considered
as a consequence of electrical coupling among the SST INs
(Fanselow et al., 2008; Urban-Ciecko and Barth, 2016), which
is an intrinsic property, that is, independent of the external stim-
ulus. However, such mechanism was suggested before the syn-
aptic interaction properties of SST INs with neighboring neuronal
classes were revealed. Considering the recent experimental
findings that SST INs are connected with VIP INs, which are
the main recipients of the top-down input, experiments might
thus lead one to suppose that the role of synaptic interactions
of SST INs with neighboring neuronal classes must now be re-
considered as one attempts to understand top-down influences
on the SST-dominated oscillations. Thus, we developed such an
integrated approach and identified a synaptic mechanism of the
frequency modulation process.
The best-known mechanism of long-range input recruitment
to local regional circuits is via PCs, but recent experimental
results show long-range projection to various IN classes
Cell Reports 25, 1548–1560, November 6, 2018 1557

(Womelsdorf and Everling, 2015). Determining the precise func-
tional consequences brought about by different IN classes
recruiting long-range cortico-cortical inputs has been a major
challenge in neuroscience research (Womelsdorf and Everling,
2015). In the case of layers 2 and 3 of the sensory cortex, in
contrast to the other two IN classes, VIP INs are the main recip-
ients of top-down input. As an exclusive functional consequence
of the VIP INs recruiting long-range inputs, we revealed that the
oscillation frequency of the SST-dominated theta to beta range
could be adjusted without compromising the oscillation ampli-
tude, which is an extraordinary characteristic. In contrast, as
mentioned above, PV INs recruit preferential input from the thal-
amus to pyramidal-interneuron gamma structure (PING) and
thereby modulate oscillation frequency within the gamma range
(Jadi and Sejnowski, 2014). During this frequency modulation
process, substantial changes in the oscillation amplitude occur
as well (Jadi and Sejnowski, 2014). Because co-modulation of
amplitude and frequency occurs in the gamma range, why is
frequency modulation with a constant amplitude required in
the low (i.e., theta to beta) frequency range? We believe it serves
to avoid cross-talk. That is, different low-frequency band oscilla-
tions are caused by distinct top-down demands and ultimately
often control the gamma range oscillation through CFC to carry
out diverse cognitive functions (Canolty and Knight, 2010;
Schroeder and Lakatos, 2009). For reliable and effective CFC,
the low-frequency band oscillations should keep constant ampli-
tudes over a range of frequencies such that diverse top-down
information is robustly processed against various disturbances
(Figures S5 and S6). Taken together, the IPNF structure and its
long-range input recruitment from the higher order cortex to
the VIP INs enables the low-frequency band oscillations in theta
to beta range to reliably control the gamma oscillations and to
further process various cognitive functions by allowing flexible
frequency modulation over a constant amplitude.
By providing a quantitative model of this critical brain pro-
cesses, our model creates a platform to better understand dis-
ease processes. In particular, our rhythmic mode boundary
surface analysis (Figure 2A, middle) provides a rough disease-
relevant map of parameter values: any choice of parameters,
from electrophysiological properties of individual neurons to
the connection probabilities between different neuronal classes,
that move the system across the boundary and destroy the
rhythmic mode should result in disease. In principle, using
measured cellular-level changes occurring in specific disease
processes, one can then use the model to determine how the
system’s function is altered, and thus, one can start to link spe-
cific functional changes to physiologically observed symptoms,
leading to a clearer view of the disease and also potentially sug-
gesting new therapeutic approaches (Assmus et al., 2006).
Although it provides an important framework for further
studies, we note that our model is incomplete: frequency modu-
lation within gamma range in layers 2 and 3 of the sensory cortex
by PV INs was not considered. Although such frequency modu-
lation of gamma range oscillation is also important, as it reflects
bottom-up sensory stimulus, it is beyond the scope of this study,
which instead was investigating top-down-mediated frequency
modulation of slow oscillations. However, a previous modeling
study suggested that the frequency of the gamma range oscilla-
1558 Cell Reports 25, 1548–1560, November 6, 2018
tion can be regulated by the relative strength of two distinct
excitatory pathways to the PV INs (i.e., monosynaptic and disy-
naptic pathways; Jadi and Sejnowski, 2014). Based on recent
experimental results showing that PV INs preferentially receive
additional strong excitatory inputs from the thalamus (Cruik-
shank et al., 2007; Yang et al., 2013), we assume that these
strong inputs may mediate the frequency modulation within the
gamma range.
Another limitation is that our study is based on numerical
investigation. Although the model is well defined and robust,
the approach is inherently insufficient to provide a detailed
mechanistic-level explanation for the models’ dynamic proper-
ties. For such insight, future analytic investigation is required,
where analytical solutions directly connect the mechanisms
and parameters to dynamic properties.
Various feedback structures are ubiquitously observed in
different types of biological networks, including gene regulatory
networks, molecular networks, and neuronal networks, and
are the building blocks that perform distinct functions. A few
intriguing cases in which different biological networks share
similar feedback structures have been identified, and these feed-
back structures perform similar functions (Alon, 2006; Milo et al.,
2002). This functional similarity raises the possibility that evolu-
tion may have converged on similar circuits in different biological
networks to perform important signal processing functions (Alon,
2006;Milo et al., 2002). The functional role of the IPNF structure in
the brain network has not been reported, making our work the
exemplar of a neuronal structure able to modulate oscillation
frequency according to top-down demands while maintaining
constant amplitude. Although we focused on layers 2 and 3 of
the sensory cortex, recent studies suggest that other cortical re-
gions share strikingly commonalities in constituent cell types and
their intrinsic properties (Harris and Mrsic-Flogel, 2013; Schroter
et al., 2017). Therefore, the IPNF structure may turn out to be a
general frequency modulator structure in multiple brain areas.
STAR+METHODS
Detailed methods are provided in the online version of this paper
and include the following:
d KEY RESOURCES TABLE
d CONTACT FOR REAGENT AND RESOURCE SHARING
d METHOD DETAILS
B Network model
B Synaptic interaction modeling
B External inputs
B Conditions for generating oscillations in NFPC-SST and
NFPC-PVB Characterization of oscillations
B Frequency modulation tendency
B Quantification of phase-amplitude coupling
B Quantification of noise vulnerability of phase-ampli-
tude coupling with respect to amplitude-frequency re-
lationships of slow oscillations
B Data analysis
d QUANTIFICATION AND STATISTICAL ANALYSIS
d DATA AND SOFTWARE AVAILABILITY

SUPPLEMENTAL INFORMATION
Supplemental Information includes six figures and two tables and can be
found with this article online at https://doi.org/10.1016/j.celrep.2018.10.029.
ACKNOWLEDGMENTS
This work was supported by the National Research Foundation of Korea (NRF)
grants funded by the Korea Government, the Ministry of Science and ICT
(2017R1A2A1A17069642 and 2015M3A9A7067220), and also supported by
the Samsung Research Funding Center of Samsung Electronics (SRFC-
IT1401-05).
AUTHOR CONTRIBUTIONS
K.-H.C. designed the project and supervised the research; B.L., D.S., and
K.-H.C. performed the modeling and analysis; and B.L., D.S., S.P.G.,
and K.-H.C. wrote the manuscript.
DECLARATION OF INTERESTS
The authors declare no competing interests.
Received: January 5, 2018
Revised: May 21, 2018
Accepted: October 3, 2018
Published: November 6, 2018
REFERENCES
Alon, U. (2006). An Introduction to Systems Biology: Design Principles of Bio-
logical Circuits (CRC).
Assmus, H.E., Herwig, R., Cho, K.-H., and Wolkenhauer, O. (2006). Dynamics
of biological systems: role of systems biology in medical research. Expert Rev.
Mol. Diagn. 6, 891–902.
Avermann, M., Tomm, C., Mateo, C., Gerstner, W., and Petersen, C.C. (2012).
Microcircuits of excitatory and inhibitory neurons in layer 2/3 of mouse barrel
cortex. J. Neurophysiol. 107, 3116–3134.
Bartos, M., Vida, I., and Jonas, P. (2007). Synaptic mechanisms of synchro-
nized gamma oscillations in inhibitory interneuron networks. Nat. Rev. Neuro-
sci. 8, 45–56.
Basar-Eroglu, C., Schmiedt-Fehr, C., Marbach, S., Brand, A., and Mathes, B.
(2008). Altered oscillatory alpha and theta networks in schizophrenia. Brain
Res. 1235, 143–152.
Bastos, A.M., Vezoli, J., Bosman, C.A., Schoffelen, J.-M., Oostenveld, R.,
Dowdall, J.R., De Weerd, P., Kennedy, H., and Fries, P. (2015). Visual areas
exert feedforward and feedback influences through distinct frequency chan-
nels. Neuron 85, 390–401.
Borgers, C., and Kopell, N. (2003). Synchronization in networks of excitatory
and inhibitory neurons with sparse, random connectivity. Neural Comput.
15, 509–538.
Brette, R., and Gerstner, W. (2005). Adaptive exponential integrate-and-fire
model as an effective description of neuronal activity. J. Neurophysiol. 94,
3637–3642.
Brunel, N., and Wang, X.-J. (2003). What determines the frequency of fast
network oscillations with irregular neural discharges? I. Synaptic dynamics
and excitation-inhibition balance. J. Neurophysiol. 90, 415–430.
Bruns, A., and Eckhorn, R. (2004). Task-related coupling from high- to low-
frequency signals among visual cortical areas in human subdural recordings.
Int. J. Psychophysiol. 51, 97–116.
Buzsaki, G., and Wang, X.-J. (2012). Mechanisms of gamma oscillations.
Annu. Rev. Neurosci. 35, 203–225.
Canolty, R.T., and Knight, R.T. (2010). The functional role of cross-frequency
coupling. Trends Cogn. Sci. 14, 506–515.
Chen, G., Zhang, Y., Li, X., Zhao, X., Ye, Q., Lin, Y., Tao, H.W., Rasch,M.J., and
Zhang, X. (2017). Distinct inhibitory circuits orchestrate cortical beta and
gamma band oscillations. Neuron 96, 1403–1418.e6.
Cruikshank, S.J., Lewis, T.J., and Connors, B.W. (2007). Synaptic basis for
intense thalamocortical activation of feedforward inhibitory cells in neocortex.
Nat. Neurosci. 10, 462–468.
Deleuze, C., Pazienti, A., and Bacci, A. (2014). Autaptic self-inhibition of
cortical GABAergic neurons: synaptic narcissism or useful introspection?
Curr. Opin. Neurobiol. 26, 64–71.
Diamond, M.E., von Heimendahl, M., Knutsen, P.M., Kleinfeld, D., and Ahissar,
E. (2008). ‘Where’ and ‘what’ in the whisker sensorimotor system. Nat. Rev.
Neurosci. 9, 601–612.
El-Boustani, S., and Sur, M. (2014). Response-dependent dynamics of cell-
specific inhibition in cortical networks in vivo. Nat. Commun. 5, 5689.
Engel, A.K., Fries, P., and Singer, W. (2001). Dynamic predictions: oscillations
and synchrony in top-down processing. Nat. Rev. Neurosci. 2, 704–716.
Eshaghi, M., Lee, J.H., Zhu, L., Poon, S.Y., Li, J., Cho, K.-H., Chu, Z., Karuturi,
R.K.M., and Liu, J. (2010). Genomic binding profiling of the fission yeast stress-
activatedMAPK Sty1 and the bZIP transcriptional activator Atf1 in response to
H2O2. PLoS ONE 5, e11620.
Fanselow, E.E., Richardson, K.A., and Connors, B.W. (2008). Selective, state-
dependent activation of somatostatin-expressing inhibitory interneurons in
mouse neocortex. J. Neurophysiol. 100, 2640–2652.
Fries, P. (2015). Rhythms for cognition: communication through coherence.
Neuron 88, 220–235.
Gentet, L.J., Avermann, M., Matyas, F., Staiger, J.F., and Petersen, C.C.
(2010). Membrane potential dynamics of GABAergic neurons in the barrel cor-
tex of behaving mice. Neuron 65, 422–435.
Gouze, J.-L. (1998). Positive and negative circuits in dynamical systems.
J. Biol. Syst. 6, 11–15.
Harris, S.L., and Levine, A.J. (2005). The p53 pathway: positive and negative
feedback loops. Oncogene 24, 2899–2908.
Harris, K.D., and Mrsic-Flogel, T.D. (2013). Cortical connectivity and sensory
coding. Nature 503, 51–58.
Hoffmann, J.H., Meyer, H.-S., Schmitt, A.C., Straehle, J., Weitbrecht, T., Sak-
mann, B., and Helmstaedter, M. (2015). Synaptic conductance estimates of
the connection between local inhibitor interneurons and pyramidal neurons
in layer 2/3 of a cortical column. Cereb. Cortex 25, 4415–4429.
Hong, L.E., Summerfelt, A., McMahon, R.P., Thaker, G.K., and Buchanan,
R.W. (2004). Gamma/beta oscillation and sensory gating deficit in schizo-
phrenia. Neuroreport 15, 155–159.
Hyafil, A., Giraud, A.-L., Fontolan, L., and Gutkin, B. (2015). Neural cross-fre-
quency coupling: connecting architectures, mechanisms, and functions.
Trends Neurosci. 38, 725–740.
Jadi, M.P., and Sejnowski, T.J. (2014). Cortical oscillations arise from contex-
tual interactions that regulate sparse coding. Proc. Natl. Acad. Sci. USA 111,
6780–6785.
Javitt, D.C. (2009). Sensory processing in schizophrenia: neither simple nor
intact. Schizophr. Bull. 35, 1059–1064.
Jones, E.G., and Wise, S.P. (1977). Size, laminar and columnar distribution of
efferent cells in the sensory-motor cortex of monkeys. J. Comp. Neurol. 175,
391–438.
Karnani, M.M., Jackson, J., Ayzenshtat, I., Tucciarone, J., Manoocheri, K.,
Snider, W.G., and Yuste, R. (2016). Cooperative subnetworks of molecularly
similar interneurons in mouse neocortex. Neuron 90, 86–100.
Kilavik, B.E., Ponce-Alvarez, A., Trachel, R., Confais, J., Takerkart, S., and
Riehle, A. (2012). Context-related frequency modulations of macaque motor
cortical LFP beta oscillations. Cereb. Cortex 22, 2148–2159.
Kim, J.-R., and Cho, K.-H. (2006). The multi-step phosphorelay mechanism of
unorthodox two-component systems in E. coli realizes ultrasensitivity to stim-
uli while maintaining robustness to noises. Comput. Biol. Chem. 30, 438–444.
Cell Reports 25, 1548–1560, November 6, 2018 1559

Kim, D., Kwon, Y.K., and Cho, K.H. (2007). Coupled positive and negative
feedback circuits form an essential building block of cellular signaling path-
ways. BioEssays 29, 85–90.
Kim, J.-R., Shin, D., Jung, S.H., Heslop-Harrison, P., and Cho, K.-H. (2010).
A design principle underlying the synchronization of oscillations in cellular
systems. J. Cell Sci. 123, 537–543.
Ko, H., Cossell, L., Baragli, C., Antolik, J., Clopath, C., Hofer, S.B., and Mrsic-
Flogel, T.D. (2013). The emergence of functional microcircuits in visual cortex.
Nature 496, 96–100.
Koh, Y., Shin, K.S., Kim, J.S., Choi, J.-S., Kang, D.-H., Jang, J.H., Cho, K.-H.,
O’Donnell, B.F., Chung, C.K., and Kwon, J.S. (2011). An MEG study of alpha
modulation in patients with schizophrenia and in subjects at high risk of devel-
oping psychosis. Schizophr. Res. 126, 36–42.
Lee, K., Loros, J.J., and Dunlap, J.C. (2000). Interconnected feedback loops in
the Neurospora circadian system. Science 289, 107–110.
Lee, S., Kruglikov, I., Huang, Z.J., Fishell, G., and Rudy, B. (2013). A disinhibi-
tory circuit mediates motor integration in the somatosensory cortex. Nat. Neu-
rosci. 16, 1662–1670.
Lefort, S., Tomm, C., Floyd Sarria, J.C., and Petersen, C.C. (2009). The
excitatory neuronal network of the C2 barrel column inmouse primary somato-
sensory cortex. Neuron 61, 301–316.
Marco, E.J., Hinkley, L.B., Hill, S.S., and Nagarajan, S.S. (2011). Sensory
processing in autism: a review of neurophysiologic findings. Pediatr. Res.
69, 48R–54R.
Michalareas, G., Vezoli, J., van Pelt, S., Schoffelen, J.-M., Kennedy, H., and
Fries, P. (2016). Alpha-beta and gamma rhythms subserve feedback and feed-
forward influences among human visual cortical areas. Neuron 89, 384–397.
Milo, R., Shen-Orr, S., Itzkovitz, S., Kashtan, N., Chklovskii, D., and Alon, U.
(2002). Network motifs: simple building blocks of complex networks. Science
298, 824–827.
Murray, P.J., Kang, J.-W., Mirams, G.R., Shin, S.-Y., Byrne, H.M., Maini, P.K.,
and Cho, K.-H. (2010). Modelling spatially regulated b-catenin dynamics and
invasion in intestinal crypts. Biophys. J. 99, 716–725.
Neske, G.T., Patrick, S.L., and Connors, B.W. (2015). Contributions of diverse
excitatory and inhibitory neurons to recurrent network activity in cerebral
cortex. J. Neurosci. 35, 1089–1105.
Park, S.G., Lee, T., Kang, H.Y., Park, K., Cho, K.-H., and Jung, G. (2006).
The influence of the signal dynamics of activated form of IKK on NF-kappaB
and anti-apoptotic gene expressions: a systems biology approach. FEBS
Lett. 580, 822–830.
Pfeffer, C.K., Xue, M., He, M., Huang, Z.J., and Scanziani, M. (2013). Inhibition
of inhibition in visual cortex: the logic of connections between molecularly
distinct interneurons. Nat. Neurosci. 16, 1068–1076.
Pi, H.-J., Hangya, B., Kvitsiani, D., Sanders, J.I., Huang, Z.J., and Kepecs, A.
(2013). Cortical interneurons that specialize in disinhibitory control. Nature
503, 521–524.
Pomerening, J.R., Kim, S.Y., and Ferrell, J.E., Jr. (2005). Systems-level dissec-
tion of the cell-cycle oscillator: bypassing positive feedback produces
damped oscillations. Cell 122, 565–578.
1560 Cell Reports 25, 1548–1560, November 6, 2018
Prill, R.J., Iglesias, P.A., and Levchenko, A. (2005). Dynamic properties of
network motifs contribute to biological network organization. PLoS Biol. 3,
e343.
Rickert, J., Oliveira, S.C., Vaadia, E., Aertsen, A., Rotter, S., and Mehring, C.
(2005). Encoding of movement direction in different frequency ranges of motor
cortical local field potentials. J. Neurosci. 25, 8815–8824.
Schroeder, C.E., and Lakatos, P. (2009). Low-frequency neuronal oscillations
as instruments of sensory selection. Trends Neurosci. 32, 9–18.
Schroter, M., Paulsen, O., and Bullmore, E.T. (2017). Micro-connectomics:
probing the organization of neuronal networks at the cellular scale. Nat. Rev.
Neurosci. 18, 131–146.
Shin, D., and Cho, K.-H. (2013). Recurrent connections form a phase-locking
neuronal tuner for frequency-dependent selective communication. Sci. Rep. 3,
2519.
Shin, S.-Y., Choo, S.-M., Kim, D., Baek, S.J., Wolkenhauer, O., and Cho, K.-H.
(2006). Switching feedback mechanisms realize the dual role of MCIP in the
regulation of calcineurin activity. FEBS Lett. 580, 5965–5973.
Sreenath, S.N., Cho, K.-H., and Wellstead, P. (2008). Modelling the dynamics
of signalling pathways. Essays Biochem. 45, 1–28.
Tian, X.-J., Zhang, X.-P., Liu, F., andWang, W. (2009). Interlinking positive and
negative feedback loops creates a tunable motif in gene regulatory networks.
Phys. Rev. E Stat. Nonlin. Soft Matter Phys. 80, 011926.
Tsai, T.Y.-C., Choi, Y.S., Ma, W., Pomerening, J.R., Tang, C., and Ferrell, J.E.,
Jr. (2008). Robust, tunable biological oscillations from interlinked positive and
negative feedback loops. Science 321, 126–129.
Urban-Ciecko, J., and Barth, A.L. (2016). Somatostatin-expressing neurons in
cortical networks. Nat. Rev. Neurosci. 17, 401–409.
van Atteveldt, N., Murray, M.M., Thut, G., and Schroeder, C.E. (2014). Multi-
sensory integration: flexible use of general operations. Neuron 81, 1240–1253.
Voytek, B., Canolty, R.T., Shestyuk, A., Crone, N.E., Parvizi, J., and Knight,
R.T. (2010). Shifts in gamma phase-amplitude coupling frequency from
theta to alpha over posterior cortex during visual tasks. Front. Hum. Neurosci.
4, 191.
Wilson, H.R., and Cowan, J.D. (1972). Excitatory and inhibitory interactions in
localized populations of model neurons. Biophys. J. 12, 1–24.
Womelsdorf, T., and Everling, S. (2015). Long-range attention networks:
circuit motifs underlying endogenously controlled stimulus selection. Trends
Neurosci. 38, 682–700.
Womelsdorf, T., Valiante, T.A., Sahin, N.T., Miller, K.J., and Tiesinga, P. (2014).
Dynamic circuit motifs underlying rhythmic gain control, gating and integra-
tion. Nat. Neurosci. 17, 1031–1039.
Yang, W., Carrasquillo, Y., Hooks, B.M., Nerbonne, J.M., and Burkhalter, A.
(2013). Distinct balance of excitation and inhibition in an interareal feedforward
and feedback circuit of mouse visual cortex. J. Neurosci. 33, 17373–17384.
Zhang, S., Xu, M., Kamigaki, T., Hoang Do, J.P., Chang, W.-C., Jenvay, S.,
Miyamichi, K., Luo, L., and Dan, Y. (2014). Selective attention. Long-range
and local circuits for top-down modulation of visual cortex processing.
Science 345, 660–665.

STAR+METHODS
KEY RESOURCES TABLE
REAGENT or RESOURCE SOURCE IDENTIFIER
Deposited Data
MATLAB code and data used in this study This paper http://sbie.kaist.ac.kr/software
Software and Algorithms
MATLAB R2014a MathWorks https://www.mathworks.com/; RRID: SCR_001622
CONTACT FOR REAGENT AND RESOURCE SHARING
Further information and requests for resources should be directed to and will be fulfilled by the Lead Contact, Kwang-Hyun Cho
METHOD DETAILS
Network modelThe network model was constructed with four neuronal classes (PCs, PV INs, SST INs, and VIP INs). A total of 1600 neurons were
used to describe the network, divided into 1200 PCs, 160 PV INs, 120 SST INs, and 120 VIP INs. The number of neurons in each class
were chosen by following experimentally determined values (Gentet et al., 2010; Lefort et al., 2009). All neurons were described by
the conductance-based adaptive exponential integrate and fire model (AdEx) (Brette and Gerstner, 2005). The membrane potential
Vm;i of neuron i was described with the following equation
CdVm;i
dT= � glðVm;i � ElÞ+glDTe
�Vm;i�VT
DT
��wad � gPC
�Vm;i � Esyn;e
�� gPV
�Vm;i � Esyn;i
�� gSST
�Vm;i � Esyn;i
�� gVIP
�Vm;i � Esyn;i
�; i˛½1� 1600�
where Vm;i ; i˛½1� 1200�, Vm;i ; i˛½1� 1360�, Vm;i ; i˛½1361� 1480�, Vm;i ; i˛½1481� 1600� correspond to membrane potential of PCs,
PV INs, SST INs and VIP INs population, respectively. The adaptation current wad was described by
twad
dwad
dT= aðVm;i � ElÞ �wad
where twadis the time constant of the adaptation of a neuron and a is the adaptation parameter. When the membrane potential
Vm reaches the spike threshold VT , a spike is emitted, and Vm is reset to the resting membrane potential Vrest, whereas wad is
incremented by an amount b. Experimentally determined values for electrophysiological properties were used to represent the
class-specific neurons (see Table S1) (El-Boustani and Sur, 2014; Ko et al., 2013; Neske et al., 2015). Respect to the adaptation cur-
rent, a and b for PC, SST, VIP class were set as 2 nS, 2 nS,�1 nS and 4 pA, 4 pA, 19 pA, respectively. twadwas set to 120 ms for PC,
SST, and VIP. For PV class, the adaptation current was set to zero as the PV class shows weak adaptation (Pfeffer et al., 2013).
Synaptic interaction modelingExperimentally recorded average unitary postsynaptic potential (uPSP) amplitudes and kinetics (Avermann et al., 2012; Neske et al.,
2015) were used to estimate the synaptic properties between the pre- and postsynaptic neuronal populations. The synaptic conduc-
tance profile gsynðtÞ was modeled as a sum of two exponentials, one for rising and the other for the decaying phase with the time
constant trise and tdecay. Minimization of the mean square error between the estimated uPSP and the experimentally determined
uPSP served as a cost function to optimize the synaptic parameters (gsyn; max, trise,tdecay ) (Hoffmann et al., 2015). The estimated
synaptic parameters are summarized in Table S2. The conductance changes by arrival of the jth spike from the presynaptic input
stream S was described by
gsynðtÞ=Xn
j =1
�gsyn;max 3N3
�exp
�� t � tjtdecay
�� exp
�� t � tj
trise
���; S= ½t1; t2;.; tn�
The normalization factor N ensures that gsyn is equals to gsyn;max at t = tpeak where tpeak and N were described by
tpeak = tj +tdecaytrise
tdecay � triseln
�tdecaytrise
�;
Cell Reports 25, 1548–1560.e1–e3, November 6, 2018 e1

N=1
exp�� ðtpeak � tjÞ
�tdecay
�� expð � ðtpeak � tjÞ�triseÞ
The unitary postsynaptic current (uPSC) and resultant unitary postsynaptic charge (uPSQ, the time integral of the uPSC) evoke by
single presynaptic spike were described by
IsynðtÞ=gsynðtÞ�Vm;i � Esyn
�;
Qsyn =Xt
IsynðtÞ
which are summarized in Table S2. The connectivity specificity of each neuronal class as a postsynaptic population was
described by setting the synaptic conductance gsyn of unwired neuronal classes to zero as follows: gVIP = 0 for i˛½1� 1200�,gVIP = 0 for i˛½1201� 1360�, gSST =gPV = 0 for i˛½1361� 1480�, and gPC = gVIP = gPV = 0 for i˛½1481� 1600�; thus, the unwired
neuronal classes do not influence the Vm changes of that neuronal class. Exceptionally, synaptic conductance profile of gSST for
i˛½1361� 1480� and gVIP for i˛½1481� 1600� was calculated to examine contribution of self-inhibition connection on the SST INs
and VIP INs, respectively.
External inputsTo mimic the local feed-forward input from the inter-layer, 150 presynaptic Poisson neurons with firing rates of 40 spikes/s were pro-
jected onto PCs, PV INs, SST INs and VIP INs with PconLOCAL-PC = 0.2, PconLOCAL-PV = 0.01, PconLOCAL-SST = 0.01, PconLOCAL-VIP = 0.01 for
all simulations. Connection probabilities were chosen to create oscillatory behaviors on NFPC-SST, and NFPC-PV, respectively. An
additional 150 Poisson neurons with varying firing rate from 0 spikes/s to 150spikes/s with 2 spikes/s increment were projected
exclusively to the VIP INs with a PconTOP_DOWN-VIP = 0.3 to mimic the top-down input from a higher-order cortex.
Conditions for generating oscillations in NFPC-SST and NFPC-PV
Connection probability (Pcon) of the excitatory and inhibitory connections within the two nested negative feedback structures
(NFPC-SST and NFPC-PV) were chosen to generate synchronized oscillatory activity of PCs. We divided the PCs population into
two equal sub-populations, assuming that one population is involved in generating slow oscillation, and another population is
involved in generating fast oscillation. These two sub-populations of PCs were connected through an excitatory connection of
PconPC/PC = 0.02 to influence each other. Following criteria were used to select the Pcon for each pathway in NFPC-SST and
NFPC-PV: i) a Pcon combination that generates oscillatory activity of PCs (characterization of oscillatory activity is described in
Characterization of oscillations below), ii) a Pcon combination that provides high synchrony in the population activity of PCs
(measured by calculating synchrnoization index (Shin and Cho, 2013)). Using numerical simulations, we chose the specific Pcon
combination of PconSST/PC = 0.36, PconPC/SST = 0.18 and PconPV/PC = 0.53, PconPC/PV = 0.4, PconPV/PV = 0.75 that generates
highly synchronized and experimentally observed slow (18 Hz) and fast (75 Hz) oscillations, respectively (Chen et al., 2017) (see
Figure S2).
Characterization of oscillationsThe population activity of PCs was characterized as either rhythmic-mode (i.e., oscillatory mode) or asynchronous-mode (i.e.,
non-oscillatory mode) according to the following rhythmicity criteria: The spike-time histogram (its definition is described in the
Data analysis section below) of PCs was low-pass filtered with a cutoff frequency of 100 Hz using fifth-order Butterworth filters in
theMATLAB signal-processing-toolbox. The amplitude of each frequency component of the histogramwas detected by Fast Fourier
Transform (FFT) using the fft command in MATLAB 2014a. A dominant (or characteristic) frequency component was considered
present if the power spectrum includes a peak amplitude that is at least 30% larger than the amplitudes of any other frequency
components. Depending on the existence of the dominant frequency component, we characterized PCs’ response as either rhyth-
mic-mode (if the dominant frequency component exists) or asynchronous-mode (if the dominant frequency does not exist). The
dominant frequency component of the histogram in rhythmic-mode was estimated again using the findpeaks command in MATLAB
2014a, where the findpeaks command detects and counts the number of local peaks in the smoothed histogram to estimate the
frequency.
Frequency modulation tendencyFrequency modulation tendency (FMT) is the index that measures the adaptability of the IPNF structure for top-down input, which is
calculated by counting the number of different frequency components that appear in the predetermined top-down input strength
range. For Figures 2B–2D and 3, the FMT of the IPNF structure was measured over top-down input strengths from 0 spikes/s to
120 spikes/s with 2 spikes/s increment (total 61 different stimulation strengths). For Figure 4C, the range of top-down stimuli was
increased from 0 spikes/s to 150 spikes/s with 2 spikes/s increments (total of 76 different strengths) to determine the FMT of the
IPNF structure before the state transition from the SST-dominated state to the PV-dominated state occurs. The occurrence of the
e2 Cell Reports 25, 1548–1560.e1–e3, November 6, 2018
state transition was determined by checking the oscillation frequency of PCs changing from low frequency (under 20 Hz; controlled
by SST INs) to high frequency (over 50 Hz; controlled by PV INs).
Quantification of phase-amplitude couplingThe strength of phase-amplitude coupling (PAC) was quantified by using the Envelope-to-Signal Correlation (ESC) measure (Bruns
and Eckhorn, 2004). The ESC quantifies the strength of PAC by calculating the correlation between the amplitude envelope of the
band-pass filtered high frequency signal and the band-pass filtered low frequency signal.
Quantification of noise vulnerability of phase-amplitude coupling with respect to amplitude-frequency relationshipsof slow oscillationsThe artificial phase-amplitude coupling (PAC) signals were generated by following procedures (Figure S5A): First, we extracted the
instantaneous phase and computed the envelope signal of slow oscillation. Second, we multiplied the envelope of slow oscillation
with the fast oscillation so that the amplitude of fast oscillation is modulated by the phase of slow oscillation. Lastly, we combined the
slow oscillation and the amplitude-modulated fast oscillation to generate a PAC signal.
Three cases of amplitude-frequency relationships were tested to see the potential benefit of maintaining the amplitude constant
during frequency modulation of slow oscillation (Figures S5 and S6). The frequencies examined were 4Hz, 6Hz, 8Hz, 10Hz, 12Hz,
and 14Hz, which are in the theta-alpha frequencies that are reported to create PAC signals with gamma frequency oscillations (Hyafil
et al., 2015; Voytek et al., 2010). The amplitudes of slow oscillations were modulated in a range from 0.2 to 5 times the default ampli-
tude strength. The following describes the three amplitude-frequency relationships (Figure S5B):
1. Case 1 (Amplitude maintains while frequency increases): Even if the frequency is modulated, the amplitude is fixed at the
default amplitude strength.
2. Case 2 (Amplitude increases when frequency increases): As the frequency increases, the amplitude also increases. As a result,
a 4 Hz oscillation will have an amplitude that is 0.2 times larger (i.e., 5 times less) than the default amplitude strength, and a
14 Hz oscillation will have an amplitude five times larger than the default amplitude strength.
3. Case 3 (Amplitude decreases when frequency increases): As the frequency increases, the amplitude decreases. Thus, a 4 Hz
signal will have an amplitude five times larger than the amplitude of the default amplitude strength, and a 14 Hz signal will have
an amplitude of 0.2 times larger (i.e., 5 times less) than the default amplitude strength.
Changes in coupling strengths of PAC signals for each of the three cases were examined by adding noise to the slow oscillations
(of different frequencies) before extracting their phase components and creating PAC signals with 60 Hz fast oscillation. The noise
level is given from 0 to 0.7 times the default amplitude strength (Figure S5D; it is conceivable to assume that the noise level is pro-
portional to the distance between distinct areas that generate low and fast oscillations).
Data analysisNetwork simulations, data analysis, and visualizations were done with MATLAB 2014a (The MathWorks). For each simulation con-
dition, neuronal population activity of 1.5 s was simulated over 50 trials to assure the reliability/reproducibility of the output response
of the model. Considering the settling time, an initial 500 ms of simulation data were removed. Data analysis was performed on the
remaining 1 s of simulation data by computing spike-time histogram of PCs. The spike-time histogram is an estimate for the time-
varying firing rate of neuronal population. It was obtained by dividing the firing activity of PCs into discrete time bin of 2ms and count-
ing the number of spikes that fell in each time bin. Themean firing ratewas calculated by counting the number of spikes evoked during
1 s and averaged over the trials. The mean oscillation amplitude was measured by averaging the amplitudes of the spike-time his-
togram (which is corresponding to spikes/ms) within the 5% of the maximum amplitude.
QUANTIFICATION AND STATISTICAL ANALYSIS
In all analyses, box-and-whisker plots are presented. All the analyses were performed using MATALB 2014a. Details of data analysis
are documented in METHOD DETAILS.
DATA AND SOFTWARE AVAILABILITY
Codes and data used in this study can be found at http://sbie.kaist.ac.kr/software.
Cell Reports 25, 1548–1560.e1–e3, November 6, 2018 e3
Cell Reports, Volume 25
Supplemental Information
Combined Positive and Negative Feedback Allows
Modulation of Neuronal Oscillation Frequency
during Sensory Processing
Byeongwook Lee, Dongkwan Shin, Steven P. Gross, and Kwang-Hyun Cho

Figure S1. Connectivity properties of heterogeneous interneuron classes in the layer 2/3 of the sensory
cortex. Related to Figure 1.
(A) Schematic of the connectivity patterns of the three interneuron (IN) classes (PV, SST, and VIP expressing
interneurons) in the layer 2/3 of the sensory cortex. PV INs preferentially inhibit one another; SST INs inhibit
all other classes of INs but avoids inhibiting themselves, and VIP INs preferentially inhibit SST INs. (B) Net
synaptic contribution (calculated by the measure named individual neuronal contribution) of the presynaptic IN
classes to postsynaptic neuronal classes adapted from Figure 7A in Pfeffer et al., 2013. INC is calculated by
multiplying connection probability (Pcon) between pre- and postsynaptic neuronal populations and unitary
postsynaptic charge (uPSQ) generated by single presynaptic spike. INC of each pathway is normalized by
INCPVàPC.

Figure S2. Conditions for generating oscillations in NFPC-SST and NFPC-PV. Related to Figure 1.
(A) Schematic of the NFPC-SST. (B-C) Peak frequency and synchronization index of the PCs’ population firing
activity were measured for every Pcon combinations in the NFPC-SST. We chose specific Pcon combination of
PconSSTàPC=0.36 and PconPCàSST=0.18 that generates 18 Hz oscillation with high synchrony (indicated with
white circles). (D) Schematic of the NFPC-PV. (E-F) Peak frequency and synchronization index of the PCs’
population firing activity were measured for every Pcon combinations in the NFPC-PV. We chose specific Pcon
combination of PconPVàPC=0.53, PconPCàPV=0.4 and PconPVàPV=0.75 that generates 75 Hz oscillation with high
synchrony (indicated with white circles). (G) Changes in synchronization index related to the self-inhibitory
connections within PV INs.

Figure S3. An example illustration of calculating frequency modulation tendency (FMT) of the IPNF
structure. Related to Figure 2.
Frequency modulation tendencies (FMTs) of the IPNF structure with particular connectivity strengths (i.e.,
connection probability; Pcon) were calculated by counting the number of different frequency components that
appear in the predetermined top-down input strength range. In this figure, we illustrated the overall steps for
searching the particular connection probabilities between SST INs and VIP INs (i.e., PconSSTàVIP, PconVIPàSST)
that provide maximum FMT.

Figure S4. Variation in the frequency modulation tendency (FMT) of the IPNF structure under increasing
self-inhibition on SST and VIP interneurons. Related to Figure 3.
(A) Self-inhibition connectivity of the SST interneurons is modulated by varying PconSSTàSST. When the
VIPàSST pathway is disconnected (PconVIPàSST=0), the model generated resonant frequency (FR) of NFPC-SST,
which is increased (FR,PconSSTàSST:0=18 Hz, FR,PconSSTàSST:0.07=22 Hz, FR,PconSSTàSST:0.3=30 Hz) with raising
PconSSTàSST. The IPNF structure with increasing PconSSTàSST tends to give up the rhythmic-mode after
oscillating at the characteristic peak frequency (i.e., resonant frequency) of the NFPC-SST, rather than modulating
its oscillation frequency. As a result, the frequency modulation tendency (FMT) drops dramatically as the
PconSSTàSST increases. (B) When increasing PconVIPàVIP, the IPNF structure showed a reduced FMT again, but
at a different rate compared to when increasing PconSSTàSST. As the PconVIPàVIP increases, a larger PconVIPàSST
is required (Figure 3D, turquoise) to increase the FMT. However, increasing PconVIPàSST causes a reduced FMT
(Figure 3D, black), which was shown in our previous result (Figure 2B, right bottom). As a result, increasing
self-inhibition on VIP interneurons causes a decrement in the FMT.
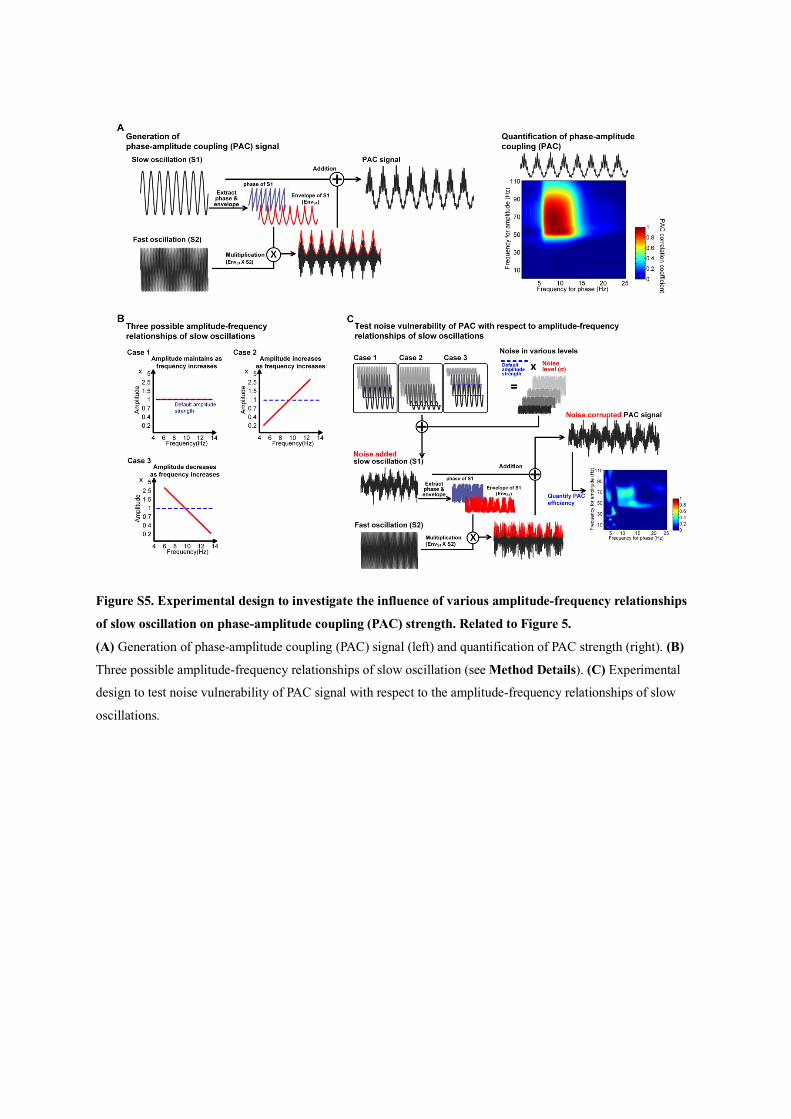
Figure S5. Experimental design to investigate the influence of various amplitude-frequency relationships
of slow oscillation on phase-amplitude coupling (PAC) strength. Related to Figure 5.
(A) Generation of phase-amplitude coupling (PAC) signal (left) and quantification of PAC strength (right). (B)
Three possible amplitude-frequency relationships of slow oscillation (see Method Details). (C) Experimental
design to test noise vulnerability of PAC signal with respect to the amplitude-frequency relationships of slow
oscillations.

Figure S6. Quantification of noise vulnerability of phase-amplitude coupling (PAC) with respect to the
amplitude-frequency relationship of slow oscillation. Related to Figure 5.
(A) Slow oscillations at six different frequencies (i.e., 4Hz, 6Hz, 8Hz, 10Hz, 12Hz, and 14Hz) were used to
generate phase-amplitude coupling (PAC) signals. In Case 1, none of the generated PAC signals showed a
dramatic decrease in coupling strength against noise, showing its robustness against noise. On the other hand,
noticeable decreases in coupling strengths of the PAC signals created by 4 & 6 Hz and 12 & 14 Hz were
observed in Case 2 (middle) and Case 3 (right), respectively. Frequency modulation of slow oscillations and the
corresponding changes in PAC with gamma oscillations can be viewed as a series of processes for cognitions. It
is therefore ideal to provide reliable and robust coupling PAC strengths for all slow oscillations (4H to 14 Hz).
This result shows that case 1, which maintains constant amplitude over varying frequency, provides the highest
reliability. Due to this aspect, maintaining the amplitude constant over varying frequency might be preferable
for slow oscillations.

Table S1. Distribution of electrophysiological properties of neuronal classes in L2/3 of the sensory cortex.
Related to Figure 1 & 2 & 3 & 4 & 5 & 6.
Symbol Function Parameter
PC PV SST VIP
𝜏" Membrane time constant (ms) 10.5±5.1 3.1±1.3 11.8±4.6 10.9±3.8
𝑉% Spike threshold (mV) -41.5±6.0 -41.6±3.4 -41.8±6.3 -43.7±5.3
𝑉&'(') Resting potential (mV) -67.4±4.3 -66.4±3.0 -59.9±4.0 -65.7±1.9
𝑔+ Leak conductance (nS) 20.3±6.0 77.1±25.6 21.4±8.7 26.6±10.9
𝐸+ Leak reversal potential (mV) -70
𝐸(-.,' Excitatory reversal potential (mV) 0
𝐸(-.,0 Inhibitory reversal potential (mV) -85
𝐶" Membrane capacitance (pF) 200
∆% Slope factor (mV) 2

Table S2. Estimated distribution of synaptic interactions between neuronal classes in L2/3 of the sensory
cortex. Related to Figure 1 & 2 & 3 & 4 & 5 & 6.
Symbol Function Parameters
PresynapticàPostsynaptic
uPSP
Unitary postsynaptic
potential amplitude (mV)
0.37±0.1 (PCàPC)
-0.52±0.1 (PVàPC)
-0.39±0.1 (SSTàPC)
-0.39±0.2 (VIPàSST)
0.82±0.1 (PCàPV)
-0.76±0.2 (PVàPV)
-0.37±0.1 (SSTàPV)
-0.49±0.2 (VIPàVIP)
0.39±0.11 (PCàSST)
-0.49±0.2 (SSTàSST)
0.39±0.11 (PCàVIP)
-0.39±0.1 (SSTàVIP)
𝜏343,&0(' Rise time of uPSP kinetics (ms)
3.5±0.6 (PCàPC)
3.4±0.5 (PVàPC)
5.4±0.5 (SSTàPC)
4.9±1.2 (VIPàSST)
1.6±0.2 (PCàPV)
1.8±0.2 (PVàPV)
3.1±0.6 (SSTàPV)
4.9±1.2 (VIPàVIP)
2.6±0.5 (PCàSST)
4.9±1.2 (SSTàSST)
2.6±0.5 (PCàVIP)
4.9±1.2 (SSTàVIP)
𝜏343,5'67- Decay time of uPSP kinetics (ms)
28.6±4.7 (PCàPC)
40.0±4.4 (PVàPC)
52.5±7.3 (SSTàPC)
32.4±12 (VIPàSST)
11.7±1.6 (PCàPV)
16.4±4.1 (PVàPV)
16.8.1±4.1 (SSTàPV)
32.4±12 (VIPàVIP)
16.7±2.2 (PCàSST)
32.4±12 (SSTàSST)
16.7±2.2 (PCàVIP)
32.4±12 (SSTàVIP)
𝑔(-.,"78 Synaptic conductance (nS)
0.39±0.04 (PCàPC)
2.8±0.2 (PVàPC)
1.4±0.42 (SSTàPC)
1.8±0.48 (VIPàSST)
2.1±0.09 (PCàPV)
7.8±0.5 (PVàPV)
2.7±0.21 (SSTàPV)
2.3±0.48 (VIPàVIP)
0.64±0.06 (PCàSST)
1.3±0.48
(SSTàSST)
0.59±0.06 (PCàVIP)
1.5±0.48 (SSTàVIP)
𝜏&0(' Rise time of
synaptic conductance (ms)
0.23±0.16 (PCàPC)
0.21±0.15 (PVàPC)
0.36±0.12 (SSTàPC)
0.21±0.22 (VIPàSST)
0.16±0.17 (PCàPV)
0.18±0.09 (PVàPV)
0.20±0.14 (SSTàPV)
0.36±0.12 (VIPàVIP)
0.25±0.17 (PCàSST)
0.32±0.22 (SSTàSST)
0.24±0.11 (PCàVIP)
0.26±0.16 (SSTàVIP)
𝜏5'67- Decay time of
synaptic conductance (ms)
6.7±1.8 (PCàPC)
6.4±1.8 (PVàPC)
13.1±2.1 (SSTàPC)
13.1±1.1 (VIPàSST)
3.3±1.6 (PCàPV)
4.6±1.7 (PVàPV)
5.2±1.8 (SSTàPV)
11.3±1.8 (VIPàVIP)

5.4±1.2 (PCàSST)
12.3±1.5
(SSTàSST)
5.6±1.1 (PCàVIP)
10.2±0.96 (SSTàVIP)
uPSC Unitary
postsynaptic current (pA)
-14.2±2.5 (PCàPC)
19.0±2.7 (PVàPC)
93.9±1.6 (SSTàPC)
8.45±1.8 (VIPàSST)
-69.2±6.1 (PCàPV)
54.8±6.6 (PVàPV)
17.2±2.9 (SSTàPV)
13.7±4.1 (VIPàVIP)
-20.4±3.5 (PCàSST)
14.2±3.8 (SSTàSST)
-21.2±3.4 (PCàVIP)
11.0±2.1 (SSTàVIP)
uPSQ Absolute unitary
postsynaptic charge (nC)
1.46±0.2 (PCàPC)
2.10±0.2 (PVàPC)
1.91±0.3 (SSTàPC)
0.63±0.1 (VIPàSST)
1.38±0.1 (PCàPV)
1.42±0.5 (PVàPV)
0.69±0.1 (SSTàPV)
1.5±0.4 (VIPàVIP)
1.03±0.1 (PCàSST)
1.10±0.3 (SSTàSST)
0.99±0.1 (PCàVIP)
1.22±0.3 (SSTàVIP)