combined management report of the lanxess group and...
TRANSCRIPT

67
Combined Management Report of the LANXESS Group and LANXESS AG
Combined Management Report 68 Fundamentals
68 Group structure68 Business 70 Strategy72 Value management and control system74 Procurement and production 76 Sales organization and customers77 Research and development 79 Corporate responsibility
80 Economic report80 Legal environment80 Business conditions82 Key events influencing the company’s business82 Comparison of forecast and actual business 83 Business performance of the LANXESS Group 86 Business trends by region87 Segment information90 Statement of financial position and financial condition98 Management’s summary of business development
and the fiscal year99 Earnings, asset and financial position of LANXESS AG101 Employees
102 Compensation report110 Report pursuant to Section 289, Paragraph 4 and
Section 315, Paragraph 4 of the German Commercial Code112 Report pursuant to Section 289a of the German Commercial Code112 Events after the end of the reporting period 112 Report on risks, opportunities and future perspectives
112 Economic outlook114 Future perspectives115 Opportunity and risk report

68 LANXESS Annual Report 2014
Group structure
Legal structure
LANXESS AG is the parent company of the LANXESS Group and
functions largely as a management holding company. LANXESS
Deutschland GmbH and LANXESS International Holding GmbH are
wholly owned subsidiaries of LANXESS AG and in turn control the
other subsidiaries and affiliates both in Germany and elsewhere.
The following are the principal companies wholly owned by LANXESS AG
directly or indirectly:
Principal Direct or Indirect Subsidiaries of LANXESS AG
Company Name and Domicile Function Segments
LANXESS Deutschland GmbH, Cologne, Germany
Production and sales
All
LANXESS Butyl Pte. Ltd., Singapore
Production and sales
Performance Polymers, Performance Chemicals
LANXESS Corporation, Pittsburgh, U.S.A.
Production and sales
All
LANXESS Elastomères S.A.S., Lillebonne, France
Production and sales
Performance Polymers
LANXESS Elastomers B.V., Sittard-Geleen, Netherlands
Production and sales
Performance Polymers
LANXESS Elastômeros do Brasil S.A., Rio de Janeiro, Brazil
Production and sales
Performance Polymers
LANXESS Holding Hispania, S.L., Barcelona, Spain
Holding company
All
LANXESS Inc., Sarnia, Canada
Production and sales
Performance Polymers
LANXESS India Private Ltd., Thane, India
Production and sales
All
LANXESS International Holding GmbH, Cologne, Germany
Holding company
All
LANXESS International SA, Granges-Paccot, Switzerland
Sales All
LANXESS N.V., Antwerp, Belgium
Production and sales
Performance Polymers, Performance Chemicals
LANXESS Rubber N.V., Zwijndrecht, Belgium
Production Performance Polymers
Rhein Chemie Rheinau GmbH, Mannheim, Germany
Production and sales
Performance Chemicals
Saltigo GmbH, Leverkusen, Germany
Production and sales
Advanced Intermediates
Changes to the Group portfolio
In March 2014, we divested our wholly owned subsidiary Perlon-
Monofil GmbH, Dormagen, Germany. This company is among the
world’s leading producers of polyamide and polyester monofila-
ments, which are used above all in paper manufacturing, shipping
and agriculture.
Management and control organization
LANXESS AG has a two-tier management structure consisting of
the Board of Management, which manages the company, and the
Supervisory Board, which oversees the Board of Management with the
assistance of an Audit Committee formed from among its members
to advise on financial matters. The Board of Management shapes
Group strategy and manages resource allocation, infrastructure and
organization. As the Group management company, LANXESS AG is
responsible for financing and for communication with the company’s
key stakeholders.
For additional information, please also see the Corporate Governance
Report.
Business
Business organization
As part of the realignment of the LANXESS Group by means of the
“Let’s LANXESS again” program, we consolidated our business units
effective January 1, 2015. LANXESS is still structured in three seg-
ments but these now comprise a total of 10 business units, each of
which conducts its own operations and has global profit responsibility.
The Butyl Rubber and Performance Butadiene Rubbers business units
were merged to form the Tire & Specialty Rubbers business unit. This
decision was based on overlapping customer structures, regional
commonalities in the established markets and changed conditions
in the emerging economies. Furthermore, LANXESS consolidated
the High Performance Elastomers and Keltan Elastomers business
units in the High Performance Elastomers business unit. Here, too,
there were substantial overlaps in customer structures. The specialty
chemicals product line of the Rubber Chemicals business unit, the
Functional Chemicals business unit and the Rhein Chemie business
unit now make up the new Rhein Chemie Additives business unit.
By consolidating our additives business operations, we are seeking
access to new markets and customers. Effective January 1, 2015,
the antioxidants and accelerators product lines of the Rubber Chemi-
cals business unit were integrated into the portfolio of the Advanced
Industrial Intermediates business unit. These restructuring measures
have no impact on our reporting for fiscal 2014.
Group functions and service companies assigned to them support
our business units by providing financial, legal, technical and other
centralized services. Complementing this global alignment of the
business units and group functions, the country organizations ensure
the necessary proximity to markets and provide the organizational
infrastructure required.
69Combined Management Report – Fundamentals
Group structure | Business
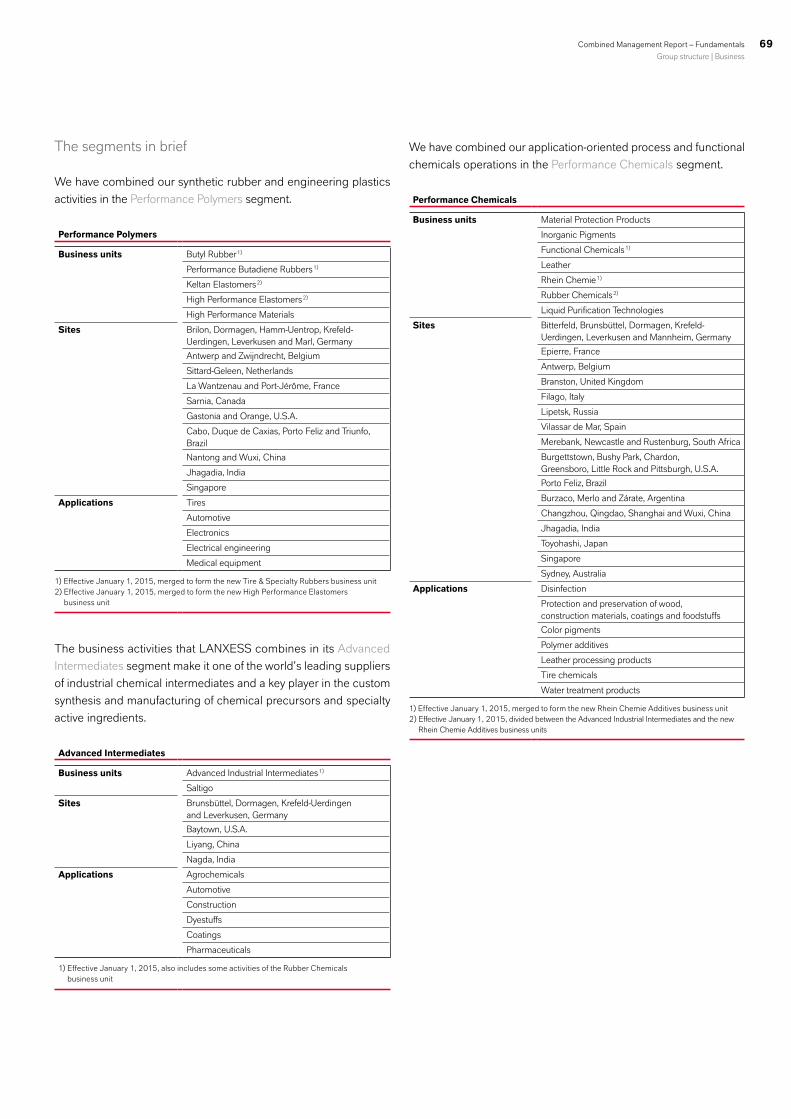
The segments in brief
We have combined our synthetic rubber and engineering plastics
activities in the Performance Polymers segment.
Performance Polymers
Business units Butyl Rubber 1)
Performance Butadiene Rubbers 1)
Keltan Elastomers 2)
High Performance Elastomers 2)
High Performance Materials
Sites Brilon, Dormagen, Hamm-Uentrop, Krefeld- Uerdingen, Leverkusen and Marl, Germany
Antwerp and Zwijndrecht, Belgium
Sittard-Geleen, Netherlands
La Wantzenau and Port-Jérôme, France
Sarnia, Canada
Gastonia and Orange, U.S.A.
Cabo, Duque de Caxias, Porto Feliz and Triunfo, Brazil
Nantong and Wuxi, China
Jhagadia, India
Singapore
Applications Tires
Automotive
Electronics
Electrical engineering
Medical equipment
1) Effective January 1, 2015, merged to form the new Tire & Specialty Rubbers business unit2) Effective January 1, 2015, merged to form the new High Performance Elastomers
business unit
The business activities that LANXESS combines in its Advanced
Intermediates segment make it one of the world’s leading suppliers
of industrial chemical intermediates and a key player in the custom
synthesis and manufacturing of chemical precursors and specialty
active ingredients.
Advanced Intermediates
Business units Advanced Industrial Intermediates 1)
Saltigo
Sites Brunsbüttel, Dormagen, Krefeld-Uerdingen and Leverkusen, Germany
Baytown, U.S.A.
Liyang, China
Nagda, India
Applications Agrochemicals
Automotive
Construction
Dyestuffs
Coatings
Pharmaceuticals
1) Effective January 1, 2015, also includes some activities of the Rubber Chemicals business unit
We have combined our application-oriented process and functional
chemicals operations in the Performance Chemicals segment.
Performance Chemicals
Business units Material Protection Products
Inorganic Pigments
Functional Chemicals 1)
Leather
Rhein Chemie 1)
Rubber Chemicals 2)
Liquid Purification Technologies
Sites Bitterfeld, Brunsbüttel, Dormagen, Krefeld- Uerdingen, Leverkusen and Mannheim, Germany
Epierre, France
Antwerp, Belgium
Branston, United Kingdom
Filago, Italy
Lipetsk, Russia
Vilassar de Mar, Spain
Merebank, Newcastle and Rustenburg, South Africa
Burgettstown, Bushy Park, Chardon,Greensboro, Little Rock and Pittsburgh, U.S.A.
Porto Feliz, Brazil
Burzaco, Merlo and Zárate, Argentina
Changzhou, Qingdao, Shanghai and Wuxi, China
Jhagadia, India
Toyohashi, Japan
Singapore
Sydney, Australia
Applications Disinfection
Protection and preservation of wood, construction materials, coatings and foodstuffs
Color pigments
Polymer additives
Leather processing products
Tire chemicals
Water treatment products
1) Effective January 1, 2015, merged to form the new Rhein Chemie Additives business unit 2) Effective January 1, 2015, divided between the Advanced Industrial Intermediates and the new
Rhein Chemie Additives business units

70 LANXESS Annual Report 2014
Strategy
The LANXESS Group is a globally operating chemicals enterprise that
is characterized particularly by flexible asset structures, a diversified
customer base, a worldwide presence with regional flexibility and
an entrepreneurial management structure. The company’s portfolio
ranges from polymers to industrial, specialty and fine chemicals. Its
development is aligned with four central megatrends:
• The growing demand for mobility, particularly in China, India and
other large emerging economies, and the simultaneous need to
make mobility more environmentally friendly.
• Agriculture, which will have to satisfy the sharp increase in global
food requirements due to a rapidly growing world population.
• Urbanization, resulting worldwide in the migration of people from
rural areas to cities. All these people will need living space, offices
and a robust infrastructure. According to current forecasts, nearly
70% of the world population will be city-dwellers in 2050.
• The rising demand for water due to population growth and climate
change will likely result in water becoming a valuable commodity
in the not-too-distant future.
With the customized products and services offered by their business
units, our segments make a valuable social and economic contribu-
tion to mastering the challenges presented by these megatrends.
Structural challenges on the supply side
Whereas we consider long-term demand development to be largely
intact, supported by the aforementioned megatrends, we are facing
three significant structural changes on the supply side:
• The European chemical industry – and thus also LANXESS – is
increasingly experiencing cost disadvantages in the global com-
petitive arena because of higher raw material and energy prices.
• Import pressure on the European markets is being increased by
suppliers from the emerging economies that are state-owned
or at least supported by state subsidies and by U.S. companies
that benefit from much lower energy costs.
• As the result of expanding local production capacities – also for
high-quality products – export opportunities to the world’s growth
regions are successively declining.
LANXESS has a Presence Throughout the World
Australia
Asia
Africa
South America
North and Central America
Europe
71Combined Management Report – Fundamentals
Business | Strategy
Although raw material and energy prices declined during the second
half of 2014, the structural developments are impacting our synthetic
rubber business especially. Overcapacities of some 20% already
exist for the common rubber grades. Additional capacity start-ups,
especially for EPDM and butyl rubbers, could further reinforce this
imbalance.
To be successful in this changed environment in the long term,
we must tangibly improve the efficiency of our business and ad-
ministrative processes and make LANXESS’s business units more
competitive again.
Extensive realignment program initiated
Against the background of these structural challenges, we initiated
the three-phase “Let’s LANXESS again” program in the third quarter.
We have been working since then on its consistent implementation.
In the first phase of the program, we reduced the number of our
business units from 14 to 10 with effect from January 1, 2015 (see
“Business organization” in this combined management report). We are
also streamlining the administration of our business units and service
functions through cross-functional workforce reductions worldwide and
the consolidation of group functions. Through a more efficient organi-
zational structure, we are fostering market and customer proximity and
also seeking to sustainably improve our cost position. From the end
of 2016, we aim to achieve annual savings of around €150 million.
The first phase of the realignment will result in a reduction of about
1,000 positions worldwide.
As part of the second phase, we have started two excellence initia-
tives focusing on our operational competitiveness. In a manufacturing
excellence initiative through to the end of 2016, we will be examining
all production processes and facilities with respect to market require-
ments, potential synergies and the need for temporary or permanent
plant shutdowns. A parallel initiative is focusing on commercial and
supply chain excellence.
We have already initiated the first steps of the program’s third phase
as well, which is closely allied with the second phase. Here, the focus
is on examining portfolio options, as well as improving access to raw
materials and customer markets – also through strategic partnerships.
With the financial headroom gained by “Let’s LANXESS again,” we
aim to redirect our strategic focus beyond 2016 toward growth –
especially in less cyclical businesses.
Capital expenditure strategy
We are striving to increase our international competitiveness through
capital expenditures focused on continuous efficiency improvements
in our production facilities and attractive growth opportunities in profit-
able markets. The following principles guide our capital expenditure
activities:
• Having focused in recent years on the construction of world-scale
plants in Singapore and China, we intend in the future to target
investment more specifically – with the exercise of strict cost
discipline – on improving the efficiency of existing plants and on
new plants for the Advanced Intermediates and Performance
Chemicals segments.
• We invest in sustainably growing markets that are the strategic
focus for our operating segments.
• Capital expenditures must satisfy clear financial criteria that, at
a minimum, preserve the average return on capital employed
(ROCE) achieved by the LANXESS Group during a normal
business cycle.
• Capital expenditures are mostly financed out of the cash flow from
operating activities or, if that is insufficient, from other available
liquidity or credit lines.
Financing strategy
Our financing policy is conservative and sustainable. Its cornerstones
are accessing international financial markets and securing long-term
financial flexibility.
In respect of capital requirements and capital coverage, we work to
optimally reconcile competing requirements for profitability, liquidity,
security and autonomy. The debt level is aligned to the ratio systems
used by the leading rating agencies for investment-grade companies.
Growth of our company is enabled by its business operations and
specific financing measures. Our goal is to generate positive earnings
contributions along with a positive cash flow.

72 LANXESS Annual Report 2014
Value management and control system
Value Management and Control System
2010 2011 2012 2013 2014
EBITDA pre exceptionals € million 918 1,146 1,223 735 808
EBITDA margin pre exceptionals % 12.9 13.1 13.4 8.9 10.1
Capital employed € million 3,750 4,784 5,442 4,969 5,093
ROCE % 17.0 17.2 15.6 5.8 7.9
Days of inventory outstanding (DIO) Days 69.3 73.7 82.8 70.7 79.1
Days of sales outstanding (DSO) Days 46.3 49.9 47.4 47.8 48.0
Net financial liabilities € million 913 1,515 1,483 1,731 1,336
Net financial debt ratio 1.0x 1.3x 1.2x 2.4x 1.7x
Investment ratio % 7.4 8.0 8.1 8.1 8.6
To achieve our strategic goals, we need specific indicators that we
can use to measure the outcome of our activities. The most impor-
tant indicator of our financial performance – and thus the company’s
key controlling parameter – is EBITDA (earnings before interest, in-
come taxes, depreciation and amortization) pre exceptionals. We view
other financial performance ratios such as return on capital employed
(ROCE), days of inventory outstanding (DIO) and net financial debt
ratio as company-specific lead indicators that we monitor but which
are not relevant to steering our business.
The calculation of specific indicators is founded on a reliable, readily
understandable financial and controlling information system. We are
constantly working to further improve the information provided by
the Accounting and Corporate Controlling group functions through
consistent reporting of budget, forecast and actual data.
Our success is largely reflected by our earning power so our control
system is focused on steering this parameter.
Earning power
The key indicator for steering the earning power of the LANXESS
Group and the individual segments is EBITDA pre exceptionals. It is
calculated from EBIT by adding back depreciation of property, plant
and equipment, amortization of intangible assets and any exceptional
items. The latter are effects of an unusual nature or magnitude. They
may include write-downs, restructuring expenses, expenses for the
design and implementation of IT projects and expenses for portfolio
adjustments. Grants and subsidies from third parties for the acquisi-
tion and construction of property, plant and equipment are accounted
for as deferred income using the gross method. In this respect, no
adjustments other than for gross depreciation and amortization are
made when calculating EBITDA pre exceptionals.
Every operational decision or achievement is judged in the short and
long term by its sustainable impact on EBITDA pre exceptionals. As
part of the annual budget and planning process, targets are set for
this benchmark of our company’s success, which are then taken into
account in determining employees’ variable income components.
We use EBITDA pre exceptionals as our key controlling parameter
because it facilitates assessment of the company’s development over
several reporting periods.
Simple revenue data such as net sales are not among the Group’s
controlling parameters because they do not permit any direct conclu-
sions about our profitability. Volatile raw material prices are a hallmark of
our industry and their fluctuation throughout the year impacts our sell-
ing prices. This influences sales but, other than short-term effects, has
largely no impact on the margins that are significant to our profitability.
We therefore set no sales targets, either for the short or medium term.
Company-specific lead indicators
Lead indicators support the timely identification of material changes in
the company’s earnings, asset and financial position and the initiation
of appropriate measures.
Our annual budget and planning process delivers key values for the
Group’s earning power and our ability to finance operations from our
own funds as the starting point for steering the company. This informa-
tion is used, for example, to make financing and capital expenditure
decisions. To ensure a timely response to changes in market conditions
73Combined Management Report – Fundamentals
Value management and control system
and the competitive environment, operational forecasts are prepared
twice each year as the basis for updating the full-year budget and the
associated key values we use to control the Group. In addition, regular
forecasts of the key values for our earning power are prepared.
Certain parameters used in budgets and forecasts are defined cen-
trally and applied uniformly because they have a major influence on
the key values. Strategic raw materials, like butadiene, have a crucial
role in forecasting. The ongoing development of procurement prices
is significant to the timely adjustment of selling prices. Even regional
differences in the availability of raw materials over a specific period of
time may become significant. Given the regional diversification of our
production sites and customer markets, exchange rate development
also affects the profitability resulting from sales and cost trends, with
corresponding repercussions for pricing and hedging strategies. In
addition, we draw on continuously updated growth forecasts for our
customer industries and the regions where we do business in order
to prepare and review sales and capital expenditure decisions.
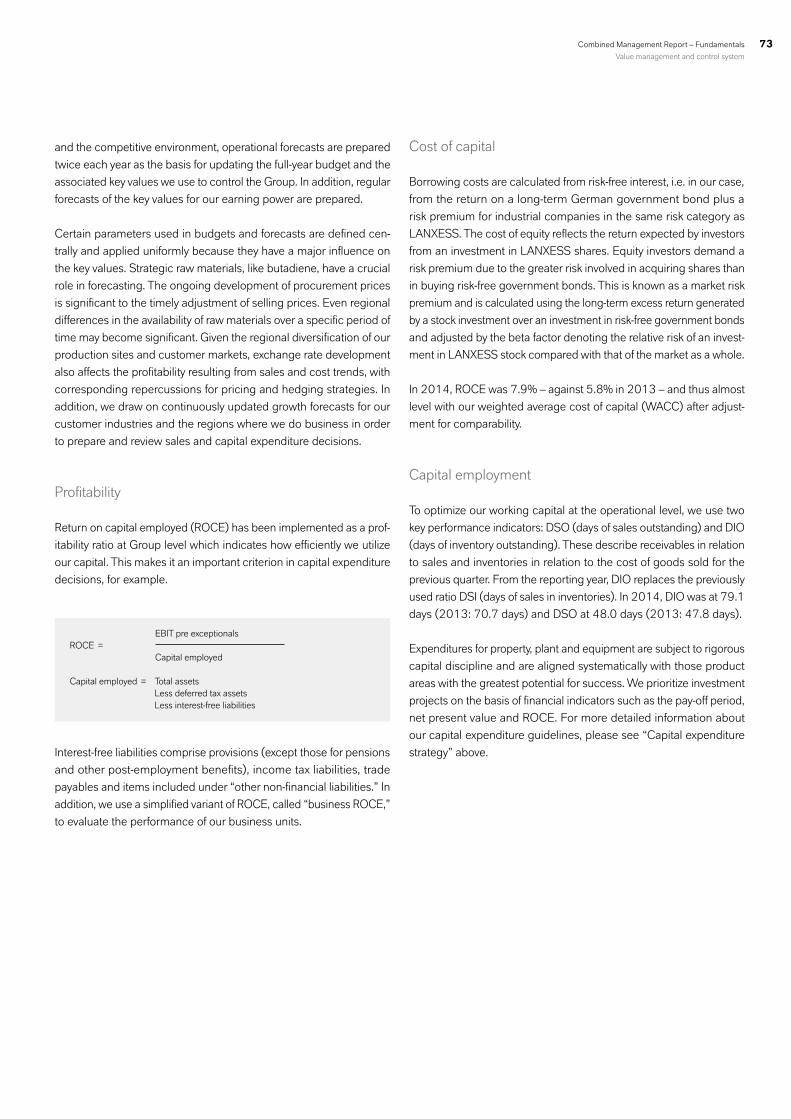
Profitability
Return on capital employed (ROCE) has been implemented as a prof-
itability ratio at Group level which indicates how efficiently we utilize
our capital. This makes it an important criterion in capital expenditure
decisions, for example.
EBIT pre exceptionals ROCE = Capital employed
Capital employed = Total assets Less deferred tax assets Less interest-free liabilities
Interest-free liabilities comprise provisions (except those for pensions
and other post-employment benefits), income tax liabilities, trade
payables and items included under “other non-financial liabilities.” In
addition, we use a simplified variant of ROCE, called “business ROCE,”
to evaluate the performance of our business units.
Cost of capital
Borrowing costs are calculated from risk-free interest, i.e. in our case,
from the return on a long-term German government bond plus a
risk premium for industrial companies in the same risk category as
LANXESS. The cost of equity reflects the return expected by investors
from an investment in LANXESS shares. Equity investors demand a
risk premium due to the greater risk involved in acquiring shares than
in buying risk-free government bonds. This is known as a market risk
premium and is calculated using the long-term excess return generated
by a stock investment over an investment in risk-free government bonds
and adjusted by the beta factor denoting the relative risk of an invest-
ment in LANXESS stock compared with that of the market as a whole.
In 2014, ROCE was 7.9% – against 5.8% in 2013 – and thus almost
level with our weighted average cost of capital (WACC) after adjust-
ment for comparability.
Capital employment
To optimize our working capital at the operational level, we use two
key performance indicators: DSO (days of sales outstanding) and DIO
(days of inventory outstanding). These describe receivables in relation
to sales and inventories in relation to the cost of goods sold for the
previous quarter. From the reporting year, DIO replaces the previously
used ratio DSI (days of sales in inventories). In 2014, DIO was at 79.1
days (2013: 70.7 days) and DSO at 48.0 days (2013: 47.8 days).
Expenditures for property, plant and equipment are subject to rigorous
capital discipline and are aligned systematically with those product
areas with the greatest potential for success. We prioritize investment
projects on the basis of financial indicators such as the pay-off period,
net present value and ROCE. For more detailed information about
our capital expenditure guidelines, please see “Capital expenditure
strategy” above.

74 LANXESS Annual Report 2014
Debt
The net financial debt ratio, which we use solely at Group level, is
defined as net financial liabilities divided by EBITDA pre exception-
als. Net financial liabilities are the total of current and non-current
financial liabilities, less cash, cash equivalents and near-cash assets.
The financial liabilities reflected in the statement of financial position
are adjusted here for liabilities for accrued interest. Due to lower net
financial liabilities at December 31, 2014, the net financial debt ratio
decreased to 1.7, against 2.4 at the previous year’s reporting date.
Our net financial liabilities declined by €395 million to €1,336 million.
Moreover, at Group level, provisions for pensions and other post-
employment benefits are considered components of debt. They rose
by €347 million compared with the end of 2013, to €1,290 million.
Net Financial Liabilities
€ million 2010 2011 2012 2013 2014
Non-current financial liabilities 1,302 1,465 2,167 1,649 1,698
Current financial liabilities 176 633 167 668 182
Less
Liabilities for accrued interest (41) (55) (54) (53) (26)
Cash and cash equivalents (160) (178) (386) (427) (418)
Near-cash assets (364) (350) (411) (106) (100)
913 1,515 1,483 1,731 1,336
Procurement and production
Procurement
LANXESS uses its centrally managed global procurement organization
– Global Procurement & Logistics – to ensure a reliable supply of raw
and other materials and services. Global Categories closely coordinate
with our business units to pool their requirements in the raw materials,
technical goods, packaging materials, energy, services and logistics
segments. Our worldwide procurement network helps them leverage
purchasing synergies, so that we can move efficiently in the market and
exploit price advantages. We avoid delivery bottlenecks or reliance on
individual suppliers using strategies like multiple sourcing. As a result,
we experienced no delivery shortfalls or bottlenecks in the reporting
period that had a material effect on our business development.
Procuring chemical raw materials is a significant priority at LANXESS.
Our aim is to secure our supplies on the basis of long-term contracts.
The availability of raw materials has always been a crucial factor in
facility location decisions. For our butyl rubber plant in Singapore, for
example, we source a large proportion of the most important feed-
stocks via nearby pipelines. We have taken the same approach to
sourcing the raw materials for our plant to manufacture neodymium-
based performance butadiene rubber (Nd-PBR), also in Singapore.
We procure key raw materials like butadiene and utilities in the form of
steam and biomass from the immediate vicinity at several of our other
production sites, too. In this way, we not only minimize the costs and
environmental impact of our transportation activities, but reduce the
risk of delivery shortfalls caused by transportation issues in particular.
Our biggest suppliers of chemical raw materials in 2014 included
BASF, Bayer, BP, Braskem, Evonik, ExxonMobil, INEOS, LyondellBasell,
Nova Chemicals, PT Petrokimia Butadiene Indonesia, Sabic, Shell
Chemicals and Total.
Among the most important strategic raw materials by far for our pro-
duction operations in 2014 were ammonia, benzene, butadiene,
caustic soda, cyclohexane, ethylene, isobutylene, propylene, styrene
and toluene. In all, strategic raw materials accounted for a purchasing
volume of about €3.0 billion in fiscal 2014 (2013: about €3.2 billion),
or around 75% of the LANXESS Group’s total expenditure for raw
materials and goods in 2014, which amounted to approximately
€4.0 billion (2013: about €4.2 billion). Around 78% (2013: 83%)
of our total expenditure for raw materials and goods went to suppliers
from countries in the upper third of the Country Sustainability Rank-
ing. Of the remaining 22%, nearly two thirds were accounted for by
supplies from Brazil, China and India. Our total procurement volume
in 2014 was around €6.2 billion (2013: about €6.2 billion).
Across the LANXESS Group, a global procurement directive defines
how our employees should behave toward suppliers and their employ-
ees. An internal training academy supports the training and ongoing
professional development of our employees and ensures the high
quality of our procurement processes. The training content includes our
seven-step strategic procurement process, negotiating techniques and
intercultural awareness, as well as time, supplier and risk management.
We systematically apply best-practice processes. These include
e-procurement tools, such as e-catalogs, auctions and electronic mar-
ketplaces, many of which are integrated into our internal IT systems.
In 2014, about 66% of all items ordered (2013: around 64%) were
handled in e-procurement systems.

75Combined Management Report – Fundamentals
Value management and control system | Procurement and production
Our HSEQ management process begins when raw materials and
services are procured. In the reporting year, our procurement transac-
tions involved more than 16,500 suppliers. Based on the principles
of the U.N. Global Compact, the International Labour Organization
(ILO), Responsible Care® and other corporate responsibility codes, we
expect our suppliers to comply with all applicable national and other
laws and regulations on safeguarding the environment, ensuring health
and safety in the workplace and using appropriate labor and hiring
practices. These criteria, which are defined in our Supplier Code of
Conduct, have a key role in our selection and evaluation of suppliers.
As a founder of the Together for Sustainability (TfS) initiative, we aim
to enhance supply chain transparency and thus further minimize pro-
curement risks. The goal of this initiative, membership of which rose to
12 international chemical companies in the reporting year, is to develop
and implement a global audit process to assess and continuously
improve sustainability activities along the chemical industry supply
chain, focusing on human rights, child labor, working standards, oc-
cupational safety, environmental protection and business integrity. As
the assessment and audit results are shared within the initiative, we
had access to a substantially larger number of sustainability assess-
ments (more than 2,600) and audit reports (286) at the end of 2014.
Countries such as Brazil, China and India remained the focus of the
93 audits conducted during the reporting period. These identified a
continuing need for action in respect of labor and human rights and
occupational safety. The first joint TfS Supplier Day held in Shanghai,
China, in October 2014 attracted around 350 participants. It was
used to explain to the attending suppliers the growing importance
of a sustainable supply chain to LANXESS and the other members
of the initiative.
Production
LANXESS is one of the world’s major producers of chemical and
polymer products. Our production facilities make anywhere from very
small batches of custom-synthesized products to basic, specialty and
fine chemicals and polymers in quantities of several ten thousand tons.
Each of our production facilities is organizationally assigned to an
individual business unit. The most important production sites are at
Leverkusen, Dormagen and Krefeld-Uerdingen, Germany; Antwerp,
Belgium; Sittard-Geleen, Netherlands; Orange, United States; Sarnia,
Canada; Triunfo and Duque de Caxias, Brazil; Jhagadia, India; Singa-
pore; and Wuxi, China. LANXESS also has other production sites in
Argentina, Australia, Belgium, Brazil, China, France, Germany, India,
Italy, Japan, Russia, South Africa, Spain, the United Kingdom and
the United States. For a detailed breakdown of our production sites
by segment, please see “The segments in brief” in this combined
management report.
The following significant changes occurred in our global production
network in 2014:
• The High Performance Elastomers business unit has a new
production line for Baypren solid polychloroprene rubber at our
Dormagen, Germany, site.
• The High Performance Materials business unit opened a
state-of-the-art compounding facility for engineering plastics with
an annual capacity of around 20,000 tons in Porto Feliz, Brazil.
• At our site in Antwerp, Belgium, the High Performance Materials
business unit commissioned a new world-scale plant for polyam-
ide plastics with an annual capacity of some 90,000 tons.
• LANXESS subsidiary Bond-Laminates GmbH, which is assigned
to the High Performance Materials business unit, completed
capacity expansion measures for the Tepex high-performance
composite at its headquarters in Brilon, Germany.
• At the site in Leverkusen, Germany, the Liquid Purification
Technologies business unit commissioned a state-of-the-art,
food-compatible filling and packaging facility and an additional
production line for weakly acidic cation exchange resins.
Including the measures described above, our cash outflows for capital
expenditures came to €614 million in 2014. Details are given under
“Capital expenditures” in the “Statement of financial position and
financial condition” section of this combined management report.
A strike at our butyl rubber facility in Zwijndrecht, Belgium, in March
and April 2014 resulted in a production stoppage of nine weeks in
total. During this time, we supplied our customers from our butyl
rubber plants in Sarnia, Canada, and Singapore.

76 LANXESS Annual Report 2014
Sales organization and customers
Sales organization
We sell our products all over the world, to several thousand customers
in more than 150 countries across all continents. LANXESS’s long-
standing customer base includes leaders in each of its user industries.
We have well-established customer relationships in all sales regions. To
meet our customers’ needs, we have set up very flexible marketing and
sales structures. We manage our sales throughout the world through
49 companies owned by LANXESS itself. In countries where we do
not yet have our own company, we work with local sales partners.
To keep as close as possible to customers and ensure they receive
individual support, each of our business units manages its own sales
organization. Another competitive advantage is derived from having
52 of our own production sites in 17 countries. Wherever possible,
customers are supplied from production sites in the same region,
yielding advantages in terms of time and costs.
In 2014, we expanded our e-business activities in purchasing, sales
and logistics. Altogether, more than 1,000,000 orders and the
respective automated follow-up notices were handled as e-business.
This capability is provided by the “LANXESS one” Internet portal and
the system-to-system connections via ELEMICA. We will continue to
expand this process, which provides benefits for all involved, by adding
further partners and technical services. The net sales invoice values
accounted for by e-business came to approximately €1.8 billion, an
increase of about 3% on the previous year.
Selling costs in the reporting year came to 9.3% of LANXESS Group
sales, up 0.2 percentage points on the prior-year level of 9.1%.
The table below shows selling costs by segment over the last five years.
Selling Costs
2010 2011 2012 2013 2014
Selling costs (€ million) 646 732 763 755 742
% of sales 9.1 8.3 8.4 9.1 9.3
Breakdown by segment
Performance Polymers 216 262 284 286 277
Advanced Intermediates 122 127 125 126 123
Performance Chemicals 300 320 335 328 330
Reconciliation 8 23 19 15 12
Customers
Because of our broad offering, we have business relationships with a
large number of customers all over the world. These customers need
an individualized, well-focused approach, which we are able to provide
because our sales organizations are managed through the business
units. Individual sales and marketing strategies are reviewed on the
basis of regular customer satisfaction surveys.
LANXESS serves the following industries in particular: tires, automotive,
plastics, chemicals, agrochemicals, construction, electronics, leather
and footwear, pharmaceuticals, food, water treatment and furniture.
Shares of Sales by Industry Sector
% 2014
Tires ~ 25
Automotive ~ 20
Chemicals ~ 15
Agrochemicals ~ 10
Construction, electrical/electronics, leather/footwear ~ 15
Others (cumulative share) ~ 15
In fiscal 2014, our top ten customers accounted for about 22% of
total sales (2013: 24%). None of our customers accounted for more
than 10% of Group sales. 50 (2013: 57) customers accounted for
annual sales in excess of €20 million.
The number of customers in each segment varies widely. The
Performance Polymers segment had some 3,600 customers in 2014
(2013: 3,500), while Advanced Intermediates and Performance
Chemicals had about 3,100 (2013: 3,000) and around 11,300
(2013: 11,600), respectively. This information is based on the number
of customer accounts in each segment. Each segment includes all
customer groups and sales categories. However, one customer may
do business with more than one segment.
The comparatively low sales per customer in the Performance Chemi-
cals segment, as well as its broad customer base, reflect the way in
which its business often involves custom-tailored solutions in specialty
chemicals. By contrast, the substantially lower number of customers
in the Performance Polymers segment, which nonetheless generates
relatively high sales, is typical of the synthetic rubber products busi-
ness. On account of the extensive customer base, no segment can
be considered dependent on just a few customers.
77Combined Management Report – Fundamentals
Sales organization and customers | Research and development
Research and development
Research and development makes an important contribution toward
increasing our competitiveness and expanding our product portfolio
through the development of innovative products and processes as well
as the ongoing optimization of existing production processes. In 2014,
we redefined our focus in the course of realigning our decentral and
central research and development activities. We are now concentrating
on projects with a short- to medium-term time horizon for the products
and processes in our core businesses.
Organizational focus
Our research programs are directly and consistently aligned with the
needs of our customers in the end markets relevant to our businesses.
For example, the business units in the Performance Polymers segment
are strengthening the focus of their activities on optimizing their prod-
ucts and product quality, as well as on developing new products.
Business units with most of their products in very mature markets,
such as the Advanced Industrial Intermediates business unit in the
Advanced Intermediates segment, concentrate on continuous process
optimization to improve their production facilities and processes.
Our central research unit – the Production, Technology, Safety &
Environment Group Function – complements the business units’
research work with cross-business unit projects to ensure that potential
synergies are exploited to the full and innovations can be applied in
various LANXESS units.
Research concentrates on both process and product innovation, which
are handled by separate units.
In the area of process innovation, the emphasis is on planning new
processes and integrating new technologies into existing production
processes with the aim of achieving cost and technology leadership.
One focus is on reviewing current production processes using math-
ematical and experimental methods in order to pinpoint optimization
potential. In this way, for example, we have identified and in some
cases achieved considerable savings on raw materials and energy.
We have also succeeded in further reducing our operating costs by
implementing process control concepts that include online analytics
in a number of plants. These concepts enable us to run our plants
even closer to the optimum operating point.
Product innovation is focused on generating new products and new
applications for existing products as well as on product modifications.
The development of new products is more broadly based than in the
business units, the main topics are generally applicable to multiple
business units. Here, too, our research goals are derived from the
needs of our customers in the markets that are relevant to LANXESS.
Our main research and development units are at the sites in Leverku-
sen, Krefeld-Uerdingen and Dormagen, Germany; London, Canada;
and Qingdao and Wuxi, China. Testing covers, for example, high-
performance rubbers and engineering plastics for lightweight auto-
motive engineering applications. In Hong Kong, we operate a center
for engineering plastics to strengthen our relations with automakers
in the Asia-Pacific growth region.
Main research and development projects
In the reporting year, the Performance Polymers segment launched
an innovative crosslinking technology for EPDM rubber using resol
synthetic resin with zeolite as the new coactivator. This not only results
in high vulcanization rates but also in particularly efficient crosslinking.
Alongside the established vulcanization processes using sulfur and
peroxide, the main crosslinking technologies for EPDM, resol vulcani-
zation represents a promising alternative for processing this synthetic
rubber. We have also developed a new heat-stabilized polyamide 6 for
use in direct long fiber thermoplastic (DLFT) flow molding. This is the
first customized polyamide 6 for this process and, unlike conventional
long fiber compression molding compounds based on polyamide 6,
it has outstanding flow properties and can be processed fume-free at
extrusion temperatures of around 300 degrees Celsius. It therefore
extends the spectrum of use for the process, which was previously
dominated by polypropylene, to include applications that must display
the typical advantages of polyamide 6.
The Advanced Intermediates segment has introduced Baynox Extra, a
highly concentrated liquid stabilizer for biodiesel. This easily metered
additive prolongs the stability of biodiesel produced from renewable
raw materials, even if it contains polyunsaturated fatty acids. The com-
bination of our proven antioxidants Baynox and Baynox Plus has an
active ingredient content of 50% and prevents premature aging. As
the stabilizer does not crystallize out, it can be used without any prob-
lems even at temperatures of minus ten degrees Celsius, therefore
eliminating the need to heat the pre-tank.

78 LANXESS Annual Report 2014
The Performance Chemicals segment also brought a number of innova-
tions to market in the reporting year. LANXESS has developed a new
class of retanning materials designated Levotan X-Biomer, for which
it has filed patent applications. These products make up a complete
portfolio for all key steps in the retanning process and offer an alterna-
tive to synthetic retanning materials. All the products are based on
biodegradable polymers derived from renewable raw materials and are
given their functionality for retanning applications in a biotechnologi-
cal process. They can be used to produce chrome-tanned leathers
(wet blues) which meet even the stringent technical requirements for
automotive applications and children’s shoes, for example. Moreover,
the use of Levotan X-Biomer reduces the environmental impact of the
tanning process in many ways. In June 2014, LANXESS also launched
its new Lewabrane RO S range of products, initially comprising three
grades of spiral-wound membrane elements for reverse osmosis, which
were specially developed for seawater desalination. These products
already successfully completed important field tests prior to the launch.
Our central research unit has also developed a new technology which
makes it possible to directly bond elastomers like EPDM to polyamide
components in a single step during vulcanization. No adhesion pro-
moter or primer is needed, thus reducing the number of steps involved
in the overall process.
The research-intensive product and process development activities
coordinated by the Production, Technology, Safety & Environment
Group Function are conducted mainly via alliances with universities
and research institutes. Generating knowledge in this way is sub-
stantially more efficient and cost-effective than if we were to maintain
our own resources for this purpose. In 2014, we had a total of 154
(2013: 194) major research and development alliances, 41 (2013:
73) of which were with universities, 79 (2013: 72) with suppliers or
customers, and 34 (2013: 52) with research institutes.
Cost trend and employees
Our total research and development expenses in 2014 decreased
by 14.0% on the prior year to €160 million, or 2.0% of sales (2013:
€186 million, or 2.2% of sales). The Butyl Rubber, High Performance
Materials, Saltigo, High Performance Elastomers and Keltan Elastomers
business units accounted for the largest share of these expenditures in
2014 at 53% (2013: 59%). Saltigo, Butyl Rubber, Liquid Purification
Technologies, Material Protection Products and High Performance
Elastomers were the business units most active in research in terms
of their ratios of research and development expenses to sales.
The decrease in research and development expenses already reflects
the first savings achieved by our “Advance” and “Let’s LANXESS
again” programs.
The table below shows research and development expenditures in
the past five years.
Research and Development Expenses
2010 2011 2012 2013 2014
Research and development expenses (€ million) 116 144 192 186 160
% of sales 1.6 1.6 2.1 2.2 2.0
At the end of 2014, we employed 708 people – against 931 in
2013 – in our research and development laboratories worldwide.
In our central research unit, the number of employees declined to
309 from 383 on December 31, 2013. Headcount in the decentral
units decreased from 548 in 2013 to 399.
Number of Employees in Research and Development
2010 2011 2012 2013 2014
Year end 519 731 843 931 708
% of Group employees 3.5 4.5 4.9 5.4 4.3
Fields of activity and patent strategy
Within the context of our global realignment, we are focusing our
research and development activities on market-driven core projects. In
2014, we conducted around 210 projects (2013: 260), around 120
of which (2013: 150) aimed to design new products and applications
or improve existing ones. Some 90 projects (2013: around 110)
concerned process technology issues with a view to reducing costs,
improving efficiency or increasing capacity. We plan to have roughly
20% of the research and development projects we started in 2014
in the market or technical implementation stages by the end of 2015
(2013: about 20%).
The results of our activities are protected by patents, where this is
possible and expedient. In the course of 2014, we submitted 94
priority applications worldwide. As of December 31, 2014, the full
patent portfolio included approximately 1,010 patent families covering
around 7,360 property rights.

79Combined Management Report – Fundamentals
Research and development | Corporate responsibility
Corporate responsibility
As an international specialty chemicals group, we bear a major re-
sponsibility toward people and the environment. Our entrepreneur-
ial activities reflect this sense of responsibility, which is also a key
component of our strategy. Safety, environmental protection, social
responsibility, quality and commercial efficiency are all key corporate
goals at LANXESS. Our products and activities enable us to make a
significant contribution worldwide to supporting our customers and
improving people’s quality of life. Our responsibility spans the entire
supply and value creation chain – from the global procurement of
raw materials and product development, through production, stor-
age and transport, to use and disposal. Moreover, all our corporate
responsibility (CR) activities must be linked to our core business or
to our available expertise.
We consider compliance with laws and ethical principles to be the
basis for sustainable corporate governance. The “Code for Legal Com-
pliance and Corporate Responsibility at LANXESS,” which is applicable
throughout the Group, specifies minimum standards and gives our
employees advice and guidance on complying with these standards.
We have been supporting the Responsible Care® initiative since 2006
and, by signing the revised Responsible Care® Global Charter in 2014,
we reaffirmed our commitment to the visions and ethical principles of
the initiative in the year under review. We are also committed to the
established principles of the world’s largest corporate social respon-
sibility initiative, the U.N Global Compact.
Integrated management system
At LANXESS, a central management system provides the neces-
sary global structures to ensure responsible commercial practices.
Worldwide, we apply internal directives and operating procedures
together with the ISO 9001 and ISO 14001 international standards
for quality and environmental management. External, independent
experts regularly audit the progress of system integration at new sites
and the performance of our management system worldwide. Con-
firmation of our compliance with ISO 9001 and ISO 14001 takes
the form of a global matrix certificate. We successfully completed a
follow-up audit in 2014.
As of December 31, 2014, our matrix certificate covered 46 com-
panies with 76 sites in 23 countries. In 2014, the new butyl rubber
production facility in Singapore was included in the certificate for the
first time as planned. Our sites in the United States have also received
confirmation of their certification to RC 14001 (RC = Responsible
Care®). In addition, we have implemented an ISO 50001-certified
energy management system in Germany, which was recertified in
2014.
On account of our realignment activities, we have revised our strategy
of global certification of the energy management system in favor of
a regional certification strategy. In future, certification decisions will
be taken locally on the basis of regulatory requirements. In line with
this new strategy, we are preparing for certification at sites in Belgium
and China in 2015.
Environment data
We use an electronic data capture system for the systematic global
recording of key performance indicators (KPIs) in the areas of safety
and environmental protection. Data for all indicators except the LTIFR
(lost time injury frequency rate) are gathered only at those production
sites in which the company has a holding of more than 50%. In the
year under review, PricewaterhouseCoopers AG Wirtschaftsprüfungs-
gesellschaft assessed our HSE indicators for 2014 and the necessary
data recording processes in the course of a business audit, again with
a view to achieving a “limited assurance” rating.
Social commitment
Our not-for-profit activities focus on providing support for science edu-
cation in schools. The LANXESS education initiative is the Group-wide
platform for these activities and has been used to establish relevant
projects at almost all LANXESS sites. Since its launch in 2008, we
have invested a total of more than €6 million worldwide in activities
which have reached tens of thousands of children, adolescents and
young adults.

80 LANXESS Annual Report 2014
Legal environment
There were no changes in the legal environment in 2014 that would
have had a material impact on the earnings, asset and financial position
of the LANXESS Group or LANXESS AG.
Business conditions
GDP and Chemical Production in 2014
Change vs. prior year in real terms (%)
The economic environment
Global economic growth weakened slightly during the course of 2014
yet showed an increase of 2.4%, which was just above the prior-year
level of 2.1%. Economic development in the Asia-Pacific region resulted
in growth of 3.9% on the prior year and was driven by the momentum in
the Chinese economic region, which nonetheless lost pace as the year
progressed. Gross domestic product in the NAFTA region increased by
2.3% in the reporting year, although development in the first quarter
was hampered by the long winter period. The economy of the EMEA
region grew by 1.6%. It was impacted by the need for structural reform
in the eurozone and the associated debate concerning the financing of
sovereign debt. Economic development was held back by the crisis in
Ukraine and the resulting economic sanctions against Russia as well
Chemical productionGross domestic product
NAFTA
Latin America
EMEA
Germany
Asia-Pacific
World
0.8(1.1)
2.32.4
1.62.4
1.5(0.9)
3.95.6
2.43.6
0 4 62(2)
as by the renewed escalation of the conflicts in the Middle East. The
German economy started 2014 in robust mood but lost momentum
as the year progressed in light of the aforementioned developments.
At year end, it had grown by 1.5%. In Latin America, the weak growth
of the region’s two major economies – Brazil and Argentina – saw
gross domestic product increase by only a slim 0.8%.
In 2014, the exchange rate between the euro and the U.S. dollar
developed counter to the prior-year trend. Monetary policy in both
currency areas remained largely unchanged compared with a year
earlier and was again characterized by very low interest rates. While
the U.S. Federal Reserve ended its bond-buying program toward the
end of the year, the European Central Bank agreed to buy potentially
unlimited numbers of certain government bonds. Against this back-
ground, the euro started 2014 at US$1.38, with the U.S. currency
mostly remaining at this level on average throughout the first half
of the year. A substantial devaluation of the euro began in July and
continued into October, interrupted by only slight upturns. Although
the exchange rate subsequently displayed more substantial upturns,
the downward slide of the euro continued unabated. At year end, the
euro cost US$1.21 – an increase of 11.6% in the value of the U.S.
dollar in 2014. The euro’s average rate for the year was unchanged
year on year at US$1.33. Due to the regional positioning of our busi-
ness, a stronger U.S. dollar generally has a positive effect on our earn-
ings. Centralized hedging activities limit any impact that cannot be
neutralized by ensuring that production and sales take place in the
same currency area.
Value of the U.S. Dollar against the Euro
2014 Average 2014
2013 Average 2013
Jan. Feb. March April May June July Aug. Sep. Oct. Nov. Dec.
1.20
1.10
1.30
1.40
1.50

81Combined Management Report – Economic report
Legal environment | Business conditions
On the raw material markets, prices declined over the course of the re-
porting year. We are particularly affected by the prices of petrochemical
raw materials as they have a material impact on our production costs.
The price of our most important strategic raw material, butadiene,
declined over the course of the year – especially from the beginning
of the second half. Reflecting the development of the oil price, the
prices of feedstocks such as benzene and toluene also decreased.
The chemical industry
The general economic trends had an impact on the chemical industry
as well, where production worldwide grew by 3.6 %. The Asia-Pacific
region posted the strongest growth at 5.6%, supported above all by
the development of the Chinese economic region. In the reporting
year, chemical production in the NAFTA region increased by 2.4%. In
the Latin America region, chemical industry production declined by
1.1% after expanding by a slim 0.3% in 2013. The chemical sector
in the EMEA region posted growth of 2.4% whereas the industry’s
business in Germany receded by 0.9%.
Evolution of major user industries
Global tire production increased by 3.2% in 2014, which was on a
par with the prior year. This growth was centered on the Asia-Pacific
region, which expanded by 4.5%. However, the region’s performance
was dampened by development in the Chinese economic region,
which was held back by the debate in the United States concerning
punitive tariffs on tire imports from China. Despite the Ukraine crisis
and the resurgent conflicts in the Middle East, the EMEA region posted
growth of 2.1%. In Germany, the tire industry expanded production
by 5.6%. Compared with other regions, growth in the NAFTA region
was more restrained, reaching just 1.9% despite a recovery in both
the original equipment and replacement tire businesses. In the Latin
America region, where the original equipment business in particular
displayed weakness, tire production saw a substantial decline of 4.5%.
The pace of growth in global automotive production slowed slightly to
2.0% in 2014, compared with 2.7% in 2013. In percentage terms, the
growth driver was the NAFTA region, which posted a robust increase
of 4.6%. Despite the crisis in Ukraine and the associated decline in
automotive production in Eastern Europe, production in the EMEA
region expanded by 3.7%. Stronger local demand and sustained high
exports supported automotive production in Germany and resulted in
growth of 2.2%. On account of weaker development in the Chinese
economic region and other Asian countries, automobile production
in the Asia-Pacific region increased by only 2.2% on the prior year.
Business development in the Latin America region in 2014 was dis-
appointing. On account of the economic crisis in Argentina and slow
development in Brazil, production contracted by 17.2%.
Global production of chemicals for the agricultural industry posted
only modest growth of 1.8% in the reporting year. Development was
positive especially in the Asia-Pacific region, where growth was 2.7%.
In the EMEA region, production increased by 2.2%. By contrast, a
decrease of 0.3% saw production in Germany stay just below the
prior-year level. On account of the long winter period at the beginning
of the year, an effect that was reinforced by high inventory levels at the
end of the previous year, business in the NAFTA region contracted
by 1.1%. Production volumes in the Latin America region decreased
by the same extent.
The construction industry worldwide posted growth of 3.3%. The
Asia-Pacific region saw expansion of 5.6% and thus continued on the
previous year’s growth course. This trend was buoyed by infrastructure
investments in the Chinese economic region. In Germany, momentum
remained positive at 2.8%, setting the country slightly apart from the
EMEA region where, despite the critical developments in Ukraine
and the Middle East, growth of 1.7% was recorded. The industry’s
expansion was slightly stronger in the NAFTA region, closing out the
reporting year with growth of 2.4%. By contrast, construction industry
production in the Latin America region barely improved, remaining
below the prior-year level for growth of 0.6%.
Evolution of Major User Industries in 2014
Change vs. prior year in real terms (%)
Chemi-cals
Tires Auto-motive
Agro-chemi-
cals
Con-struction
NAFTA 2.4 1.9 4.6 (1.1) 2.4
Latin America (1.1) (4.5) (17.2) (1.1) 0.6
EMEA 2.4 2.1 3.7 2.2 1.7
Germany (0.9) 5.6 2.2 (0.3) 2.8
Asia-Pacific 5.6 4.5 2.2 2.7 5.6
World 3.6 3.2 2.0 1.8 3.3

82 LANXESS Annual Report 2014
Key events influencing the company’s business
Fiscal 2014 was characterized by the persistently difficult competitive
situation in our synthetic rubber businesses. In principle, the decline
in procurement costs for key raw materials, especially butadiene,
resulted in corresponding adjustments to selling prices. Additional
price pressure was caused by an increase in production capacities as
new suppliers entered the market and established providers expanded
their existing capacities. Exchange rate developments had a positive
effect, as did reduced energy costs due also to the lower oil price.
In March and April 2014, a strike at our site in Zwijndrecht, Belgium,
resulted in a nine-week production stoppage with a negative impact
on the earnings of our Performance Polymers segment.
In the year under review, we initiated an extensive corporate realign-
ment program. Against this background, a decision was taken in the
second quarter to increase the capital stock of LANXESS AG and im-
mediately implemented. This yielded gross proceeds of €433 million,
some of which was used to finance our “Let’s LANXESS again” global
realignment program. This program comprises three phases: com-
petitiveness of the business and administrative structure, operational
competitiveness, and competitiveness of the business portfolio. Fur-
ther information about “Let’s LANXESS again” can be found in the
“Strategy” section of this combined management report.
Comparison of forecast and actual business
In the combined management report for fiscal 2013, we had pre-
dicted a slight year-on-year increase in EBITDA pre exceptionals in
2014. We narrowed this guidance in our interim reports for 2014.
The actual result of €808 million was 9.9% above the prior-year result
of €735 million and roughly in the middle of the guidance range given
in our interim reports for 2014.
In line with our forecast for the LANXESS Group, the Performance
Polymers and Advanced Intermediates segments slightly increased
EBITDA pre exceptionals on the prior year by 0.8% and 5.9% to
€392 million and €303 million, respectively. By contrast, our Perfor-
mance Chemicals segment posted earnings of €274 million, which
were substantially higher than the prior-year earnings of €231 million.
For LANXESS AG, we had assumed net income in 2014 slightly above
the level of the previous year. However, due mainly to the reduction in
income from investments in affiliated companies, net income of minus
€85 million was substantially below the prior-year value of €35 million.
Comparison of Forecast and Actual Business 2014
Forecast for 2014 in Annual Report 2013 Actual 2014
Business development: Group
EBITDA pre exceptionals Slight year-on-year increase (2013: €735 million) €808 million
Business development: segments
Performance Polymers Slight improvement in demand from the main customer industries – automotive and tires; most dynamic growth
in the Asian growth markets; continued strong competition for synthetic rubber products
Persistently difficult competitive situation for synthetic rubbers; 1.4% decrease in volumes
(EBITDA pre exceptionals: €392 million)
Advanced Intermediates Good customer demand for agrochemical products; more scheduled plant shutdowns in 2014
Good demand for agrochemicals; 2.1% increase in volumes (EBITDA pre exceptionals: €303 million)
Performance Chemicals Slight improvement in demand; more dynamic growth in the construction industry
2.8% increase in volumes (EBITDA pre exceptionals: €274 million)
Raw material prices Varying price trends for individual strategic raw materials; overall trend toward higher procurement costs with
continuing volatility
Lower raw material prices with continued volatility
Financial condition: Group
Cash outflows for capital expenditures At prior-year level (€624 million) €614 million

83Combined Management Report – Economic report
Key events influencing the company’s business | Comparison of forecast and actual business |
Business performance of the LANXESS Group
Business performance of the LANXESS Group
• Group-wide realignment initiated
• Price-driven sales decline of 3.5% at Group level largely due to
raw materials
• Persistently difficult competitive situation for synthetic rubbers;
good demand for agrochemicals
• EBITDA pre exceptionals up 9.9% to €808 million
• EBITDA margin pre exceptionals at 10.1%, after 8.9% in 2013
• Net income and earnings per share improved to €47 million and
€0.53, respectively, against a net loss of €159 million and minus
€1.91 in the prior year
• Debt reduced by almost €400 million compared with the prior
year
Key Financial Data
€ million 2013 2014 Change %
Sales 8,300 8,006 (3.5)
Gross profit 1,548 1,588 2.6
EBITDA pre exceptionals 735 808 9.9
EBITDA margin pre exceptionals 8.9% 10.1% –
EBITDA 624 644 3.2
Operating result (EBIT) pre exceptionals 288 402 39.6
Operating result (EBIT) (93) 218 > 100
EBIT margin (1.1)% 2.7% –
Financial result (146) (138) 5.5
Income before income taxes (239) 80 > 100
Net income (loss) (159) 47 > 100
Earnings per share (€) (1.91) 0.53 > 100
Sales and earnings
Group Sales
€ million
In 2014, LANXESS Group sales declined by 3.5% from €8,300 mil-
lion in the prior year to €8,006 million. The small increase in volumes
raised sales by 0.4%. The effect of lower selling prices, which caused
sales to decline by 3.5% percent, was compounded by mildly un-
favorable exchange rate developments and slightly negative portfolio
effects. After adjustment for currency and portfolio effects, operational
sales decreased by 3.1%.
Effects on Sales
€ million/%
2013 Currency PortfolioVolumePrice 2014
8,300
(3.5)%
+0.4% 8,006
(0.3)% (0.1)%
Sales in our Performance Polymers segment decreased by a significant
8.0% in 2014 and thus substantially impacted LANXESS’s business
performance. The development of selling prices was due especially
to lower procurement prices for raw materials and to the persistently
challenging competitive situation. Volumes were also down year on
year. Negative currency effects and an unfavorable portfolio effect re-
sulting from the sale of the shares of Perlon-Monofil GmbH, Dormagen,
Germany, had a minor impact.
The Advanced Intermediates segment posted a slim sales decrease
of 0.2%. Here, the positive development of volumes compensated for
a negative effect arising from the decline in selling prices. Exchange
rate developments had a slightly negative effect.
Sales in our Performance Chemicals segment advanced by 2.9%
due to higher volumes and a slight year-on-year increase in selling
prices. A net negative impact was caused by minor portfolio effects
from acquisitions made in the previous year, which were assigned to
the Material Protection Products and Functional Chemicals business
units, as well as from unfavorable exchange rate developments.
2014
2012
2011
2010
2013
0 2,000 4,000 6,000 8,000 10,000
7,120
8,775
9,094
8,300
8,006

84 LANXESS Annual Report 2014
Sales by Segment
€ million 2013 2014 Change %
Proportion of Group
sales %
Performance Polymers 4,486 4,128 (8.0) 51.6
Advanced Intermediates 1,647 1,643 (0.2) 20.5
Performance Chemicals 2,132 2,193 2.9 27.4
Reconciliation 35 42 20.0 0.5
8,300 8,006 (3.5) 100.0
LANXESS slightly raised sales in North America, but registered declines
in the other regions. Latin America and EMEA (excluding Germany)
were particularly affected, posting sales decreases of 11.1% and
4.5%, respectively. The Asia-Pacific and Germany regions proved
comparatively robust with declines of 3.1% and 1.2%, respectively.
Sales performance across the regions was largely dependent on the
development of the Performance Polymers segment.
Order book status
Most of our business is not subject to long-term agreements on fixed
volumes or prices. Instead, our business is characterized by long-stand-
ing relationships with customers and revolving master agreements.
Our activities are focused on demand-driven orders with relatively
short lead times which do not provide a basis for forward-looking
statements about our capacity utilization or volumes. The business
is managed primarily on the basis of regular Group-wide forecasts
of the Group operating target. For additional information, please see
“Company-specific lead indicators.”
Any disclosure of the Group’s order book status at a given report-
ing date therefore would not be indicative of the Group’s short- or
medium-term earning power. For this reason, no such disclosure is
made in this report.
Gross profit
The cost of sales showed a disproportionately large decline of 4.9%
compared with sales, to €6,418 million. Declining procurement prices
for raw materials and energies as well as higher capacity utilization
coupled with lower idle capacity costs had a positive impact and more
than offset the opposing effect on costs caused by higher sales vol-
umes. Moreover, the start-up of a new facility had a stronger impact
in the previous year. Exchange rate movements had a positive effect.
Capacity utilization, at around 79%, was one percentage point above
the prior-year level.
Gross profit was €1,588 million, up by €40 million or 2.6% against
the prior year. The gross profit margin rose from 18.7% to 19.8%.
Volume expansion and lower manufacturing costs contributed to the
positive development, This effect was opposed by the decline in sell-
ing prices, which slightly outweighed the positive impact of lower raw
material costs. Exchange rate developments had a positive effect on
the gross profit of the LANXESS Group.
EBITDA and operating result (EBIT)
Our operating result before depreciation and amortization (EBITDA)
pre exceptionals increased by €73 million, or 9.9%, to €808 million
in 2014, from €735 million the year before. This was due especially
to the decline in manufacturing costs and to the increase in volumes.
Favorable exchange rate effects were a further positive factor and more
than compensated for a slightly negative portfolio effect. Earnings were
held back by selling price adjustments, which exceeded the benefit from
the decline in raw material costs especially because of the challenging
competitive situation in the rubber market. Selling expenses declined
by €13 million to €742 million in 2014. Research and development
costs were down 14.0%, to €160 million. General administrative ex-
penses declined from €301 million to €278 million. The development
of functional costs already reflected cost savings from the “Advance”
and “Let’s LANXESS again” programs. The Group’s EBITDA margin
pre exceptionals improved from 8.9% to 10.1%.
EBITDA and EBITDA Margin Pre Exceptionals
€ million
2014
2012
2011
2010
2013
0 250 500 750 1,000 1,250 1,500
918 12.9%
1,146 13.1%
1,223 13.4%
735 8.9%
808 10.1%
EBITDA pre exceptionals in the Performance Polymers segment
advanced by €3 million from the prior-year level of €389 million, to
€392 million. This was mainly the result of considerably lower manu-
facturing costs due in part to lower energy and idle capacity costs, as
well as to lower research and development expenses. In addition, the
prior year was impacted by the start-up of a new facility. Lower selling
prices resulting from the persistently difficult competitive situation
for synthetic rubber and a decline in purchase prices for some raw
materials had the opposite effect. The net influence of currency and
portfolio effects was positive.

85Combined Management Report – Economic report
Business performance of the LANXESS Group
In the Advanced Intermediates segment, EBITDA pre exceptionals
advanced by €17 million to €303 million. Continued good demand
for agrochemicals led to positive volume effects. The decline in selling
prices was in line with the development of raw material costs. Shifts in
currency parities did not have a significant impact.
The Performance Chemicals segment generated EBITDA pre excep-
tionals of €274 million, up €43 million or 18.6% on the prior year. At
the segment level, the increase in sales volumes, favorable exchange
rate developments and a positive price effect led to improved earnings.
Higher manufacturing costs had an opposing effect.
EBITDA Pre Exceptionals by Segment
€ million 2013 2014 Change %
Performance Polymers 389 392 0.8
Advanced Intermediates 286 303 5.9
Performance Chemicals 231 274 18.6
Reconciliation (171) (161) 5.8
735 808 9.9
The reconciliation of EBITDA pre exceptionals to the operating result
(EBIT) was as follows:
Reconciliation of EBITDA Pre Exceptionals to Operating Result (EBIT)
€ million 2013 2014 Change %
EBITDA pre exceptionals 735 808 9.9
Depreciation and amortization (717) (426) 40.6
Exceptional items in EBITDA (111) (164) (47.7)
Operating result (EBIT) (93) 218 > 100
The operating result (EBIT) increased very substantially from mi-
nus €93 million to €218 million in fiscal 2014. Depreciation and
amortization, at €426 million, was €291 million or 40.6% below
the prior-year period, even after additions from capital expenditures.
Write-downs on intangible assets and property, plant and equipment
came to €32 million, after €279 million in 2013. The write-downs
recognized at year end 2013 reduced the depreciation and amortiza-
tion base for the reporting year.
The other operating result, which is the balance between other operat-
ing income and expenses, improved substantially by €209 million to
minus €190 million. Adjusted for exceptional items, the other operating
result came to minus €6 million, which was €12 million higher than in
2013. Net exceptional charges of €184 million were incurred in the
reporting year, €164 million of which impacted EBITDA and mainly
related to the “Let’s LANXESS again” and “Advance” programs as well
as to expenses associated with the design and implementation of IT
projects. The exceptional charges of €20 million that had no impact
on EBITDA were due above all to write-downs recognized on a pilot
plant of the Butyl Rubber business unit. In 2013, net exceptional
charges of €381 million were incurred, €270 million of which had no
impact on EBITDA and were due to impairment charges recognized
for the Keltan Elastomers, High Performance Elastomers and Rubber
Chemicals business units. The exceptional charges of €111 million
which impacted EBITDA in 2013 were mainly related to the “Advance”
program for improving competitiveness across all segments as well
as to expenses associated with the design and implementation of IT
projects.
Reconciliation of EBIT to Net Income (Loss)
€ million 2013 2014 Change %
Operating result (EBIT) (93) 218 > 100
Income from investments accounted for using the equity method 0 2 –
Net interest expense (106) (69) 34.9
Other financial income and expense (40) (71) (77.5)
Financial result (146) (138) 5.5
Income (loss) before income taxes (239) 80 > 100
Income taxes 71 (36) < (100)
Income (loss) after income taxes (168) 44 > 100
of which:
attributable to non-controlling interests (9) (3) 66.7
attributable to LANXESS AG stockholders [net income (loss)] (159) 47 > 100
Financial result
The financial result came in at minus €138 million in fiscal 2014,
compared with minus €146 million for the prior year. The prorated
income from the investment in Currenta GmbH & Co. OHG, Leverku-
sen, Germany, which is accounted for using the equity method, came
to €2 million, against €0 million the previous year. Interest expense
declined by €36 million year on year, mainly due to the repayment
of the €500 million Eurobond issued in 2009, which matured in the
reporting period. As in 2013, the capitalization of a portion of borrow-
ing costs, some of which related to the construction of the new plants
in Singapore and in China, had a positive effect on the financial result.
At €69 million, net interest expense was €37 million lower than in
the previous year. The decline in other financial income and expense
items resulted mainly from the substantially higher net exchange loss.
In addition, interest costs for interest-bearing provisions were slightly
higher than in 2013.

86 LANXESS Annual Report 2014
Income before income taxes
Due to the improved EBIT, income before income taxes increased by
€319 million to €80 million.
Income taxes
In fiscal 2014, the Group had tax expense of €36 million, compared
with tax income of €71 million the year before. The Group’s tax rate
was 45.0%, after 29.7% in the previous year.
Net income/Earnings per share/Earnings per share pre exceptionals
The LANXESS Group posted net earnings of €47 million, an increase
of €206 million year on year. A loss of €3 million was attributable to
non-controlling interests, compared with a loss of €9 million in the
previous year.
Earnings per share are calculated by dividing net income by the
weighted average number of LANXESS shares in circulation during
the reporting year. The number of shares in circulation rose by the
shares issued for the capital increase. This increase was accounted
for pro rata temporis. Earnings per share were €0.53, ahead of the
minus €1.91 recorded for the prior year.
Earnings per share pre exceptionals were €1.98, against €1.37 the
year before. This value was calculated from the earnings per share
adjusted for exceptional items and attributable tax effects. In the report-
ing year, exceptional items came to €184 million after €381 million
in 2013.
Business trends by region
Sales by Market
%
2013 2014
EMEA (excluding Germany)
Germany
North America
Latin America
Asia-Pacific
28.7
18.0
16.7
10.7
25.9
29.0
17.6
16.0
11.6
25.8
Sales by Market
2013 2014 Change
€ million % € million % %
EMEA (excluding Germany) 2,404 29.0 2,296 28.7 (4.5)
Germany 1,458 17.6 1,440 18.0 (1.2)
North America 1,332 16.0 1,338 16.7 0.5
Latin America 966 11.6 859 10.7 (11.1)
Asia-Pacific 2,140 25.8 2,073 25.9 (3.1)
8,300 100.0 8,006 100.0 (3.5)
EMEA (excluding Germany)
Sales in the EMEA region (excluding Germany) receded by
€108 million, or 4.5%, to €2,296 million in 2014. Adjusted for cur-
rency changes and for portfolio effects from the acquisition of the phos-
phorus chemicals business of Thermphos France S.A.R.L., Epierre,
France, and the sale of the shares of Perlon-Monofil GmbH, Dormagen,
Germany, sales receded by 4.2%. The Performance Polymers segment
posted a sales decline in the low-double-digit percentage range. In our
Advanced Intermediates and Performance Chemicals segments, sales
increased by medium- and low-single-digit percentages, respectively.
The overall negative trend in the region affected Belgium, Italy, France,
Spain and Turkey in particular. However, sales were bolstered by posi-
tive growth in demand in other countries such as the Netherlands, the
Czech Republic and South Africa.
With a 28.7% share of total sales, after 29.0% in the prior year, EMEA
(excluding Germany) remained the largest of the LANXESS Group’s
regions in terms of sales.
Germany
In Germany, our sales came to €1,440 million in 2014, down
€18 million, or 1.2%, on the previous year. There were no material
portfolio effects to consider. Our Performance Chemicals segment
posted sales growth in the low-single-digit percentage range, whereas
sales of the Performance Polymers segment remained level with the
prior year. In the Advanced Intermediates segment, sales declined by
a mid-single-digit percentage.
Germany’s share of Group sales rose slightly from 17.6% to 18.0%.

87Combined Management Report – Economic report
Business performance of the LANXESS Group | Business trends by region | Segment information
North America
Sales in this region came to €1,338 million, up €6 million, or 0.5%,
from the previous year. Adjusted for slight currency and portfolio effects,
sales were up by 0.9%. Business performance was characterized by the
positive development of the Advanced Intermediates and Performance
Chemicals segments, which posted sales increases in the low- to mid-
single-digit percentage range. These more than offset a low-single-digit
percentage decline in the Performance Polymers segment. The United
States had the primary role in the region’s development.
At 16.7%, North America’s share of Group sales was 0.7 percentage
points higher than in the prior year.
Latin America
Sales in Latin America receded by a substantial €107 million, or
11.1%, to €859 million. Adjusted for slight currency and portfolio
effects, sales were down by 10.5%. The crucial factor in business
performance here was the development of the Performance Polymers
segment, where sales declined by a low-double-digit percentage. Sales
also fell in the Advanced Intermediates and Performance Chemicals
segments, but by low-single-digit percentages. Business development
in the region was mainly attributable to the sales performance in Brazil.
LANXESS generated 10.7% of Group sales in Latin America, com-
pared with 11.6% in the prior-year period.
Asia-Pacific
Sales in the Asia-Pacific region declined by €67 million, or 3.1%, to
€2,073 million in 2014. Adjusted for negative currency effects and
slight portfolio effects, sales were down by 2.4%. This development
was primarily due to the business performance in our Performance
Polymers and Advanced Intermediates segments, where sales de-
clined by a high- and mid-single-digit percentage, respectively. The
Performance Chemicals segment recorded very positive development,
expanding sales by a high-single-digit percentage. The main contribu-
tors to operational development in the region were Hong Kong, China,
Taiwan and Thailand. Increasing sales were posted in India, Singapore
and Indonesia, although the trend in the latter was far more restrained.
Asia-Pacific’s share of Group sales was more or less unchanged at
25.9%, following 25.8% the previous year. Thus, it confirmed its posi-
tion as the second-strongest region behind EMEA (excluding Germany)
in terms of sales.
Segment information
• Performance Polymers: challenging competitive situation for
synthetic rubbers; lower selling prices impact sales and earnings
• Advanced Intermediates: earnings increase with sales at
prior-year level; agrochemicals business remains good
• Performance Chemicals: sales and earnings improved especially
by higher volumes at stable prices
Sales by Segment
%
Performance Polymers
Overview of Key Data
2013 2014 Change
€ million Margin %
€ million Margin %
%
Sales 4,486 4,128 (8.0)
EBITDA pre exceptionals 389 8.7 392 9.5 0.8
EBITDA 372 8.3 351 8.5 (5.6)
Operating result (EBIT) pre exceptionals 135 3.0 181 4.4 34.1
Operating result (EBIT) (117) (2.6) 120 2.9 > 100
Cash outflows for capital expenditures 385 428 11.2
Depreciation and amortization 489 231 (52.8)
Employees as of Dec. 31 5,379 5,176 (3.8)
Business in our Performance Polymers segment declined year on year
in 2014. Sales decreased by 8.0% to €4,128 million. This develop-
ment was primarily impacted by a negative price effect of 5.9% and
by a 1.4% decline in volumes. A slightly unfavorable currency effect
and a minor negative portfolio effect from the sale of the shares of
Perlon-Monofil GmbH, Dormagen, Germany, accounted for 0.7% of
this decrease.
2013 2014
Performance Polymers
Advanced Intermediates
Performance Chemicals
Reconciliation
51.6
20.5
27.4 0.5
54.1
19.8
25.7 0.4

88 LANXESS Annual Report 2014
All business units in this segment were impacted by declining market
prices. Negative effects resulted especially from lower raw material
costs and the persistently difficult market environment for our synthetic
rubber businesses. While the Keltan Elastomers, High Performance
Materials and High Performance Elastomers business units increased
volumes, the Butyl Rubber and Performance Butadiene Rubbers busi-
ness units posted negative volume development. All business units
were held back to a small extent by exchange rate developments. In
addition, the High Performance Materials business unit registered a
slightly negative portfolio effect. While the segment’s sales in Germany
and North America were slightly below the prior-year level, business
in the other regions declined substantially.
EBITDA and EBITDA Margin Pre Exceptionals
€ million
EBITDA pre exceptionals in the Performance Polymers segment ad-
vanced slightly from the prior-year level of €389 million to €392 million.
Here, the Performance Butadiene Rubbers, High Performance Elasto-
mers and High Performance Materials business units showed a positive
development. A positive impact on earnings resulted especially from
considerably lower manufacturing costs that were attributable in part
to lower energy and idle capacity costs. Moreover, in the previous year,
the start-up of a new facility proved to be a stronger burden. Decreased
expenses for research and development and general administration
also contributed positively to this development. Earnings were held
back by lower selling prices resulting from reduced procurement
prices for raw materials and by the persistently difficult competitive
situation for synthetic rubbers. Moreover, a strike at our butyl rubber
plant in Belgium resulted in a production stoppage of nine weeks and
reduced earnings in our Butyl Rubber business unit. At the segment
level, the development of volumes had an additional effect. Exchange
rate development was positive and more than compensated for slightly
negative portfolio effects. The segment’s EBITDA margin pre excep-
tionals improved from 8.7% to 9.5%.
2014
2012
2011
2010
2013
0 200 400 600 800 1,000
548 14.8%
768 15.2%
817 15.8%
389 8.7%
392 9.5%
Exceptional items amounted to €61 million, €41 million of which
impacted EBITDA. Most of the exceptional charges with no impact
on EBITDA were due to write-downs recognized on a pilot plant of
the Butyl Rubber business unit. The exceptional charges which im-
pacted EBITDA were largely related to measures associated with the
“Let’s LANXESS again” and “Advance” programs. Exceptional items
in 2013 amounted to €252 million, €17 million of which impacted
EBITDA. Most of the exceptional charges were impairment charges
recognized by the Keltan Elastomers and High Performance Elasto-
mers business units.
Advanced Intermediates
Overview of Key Data
2013 2014 Change
€ million Margin %
€ million Margin %
%
Sales 1,647 1,643 (0.2)
EBITDA pre exceptionals 286 17.4 303 18.4 5.9
EBITDA 287 17.4 293 17.8 2.1
Operating result (EBIT) pre exceptionals 209 12.7 214 13.0 2.4
Operating result (EBIT) 210 12.8 204 12.4 (2.9)
Cash outflows for capital expenditures 96 84 (12.5)
Depreciation and amortization 77 89 15.6
Employees as of Dec. 31 2,854 2,809 (1.6)
Our Advanced Intermediates segment recorded sales of €1,643 million
in 2014, more or less level with the prior year. While selling price ad-
justments necessitated by a decline in raw material prices resulted in
a negative effect of 2.1%, volumes were up by 2.1% against the prior
year. Exchange rate movements had no tangible effect.
Both of the segment‘s business units were able to grow volumes, in
part substantially. In particular, demand for agrochemicals showed
pleasing development. Selling price adjustments, especially in the
Advanced Industrial Intermediates business unit, had an offsetting
effect. In North America and EMEA (excluding Germany), the segment
delivered a positive business performance. In the other regions, sales
were below the prior-year level.
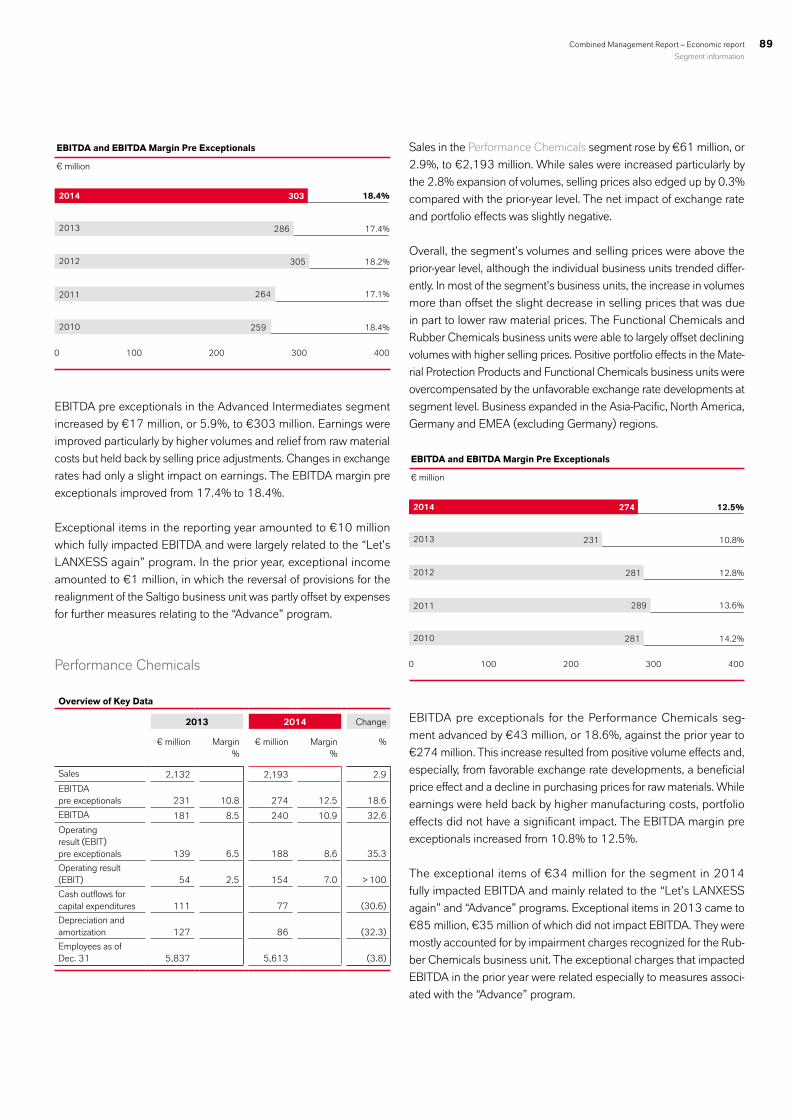
89Combined Management Report – Economic report
Segment information
EBITDA and EBITDA Margin Pre Exceptionals
€ million
EBITDA pre exceptionals in the Advanced Intermediates segment
increased by €17 million, or 5.9%, to €303 million. Earnings were
improved particularly by higher volumes and relief from raw material
costs but held back by selling price adjustments. Changes in exchange
rates had only a slight impact on earnings. The EBITDA margin pre
exceptionals improved from 17.4% to 18.4%.
Exceptional items in the reporting year amounted to €10 million
which fully impacted EBITDA and were largely related to the “Let’s
LANXESS again” program. In the prior year, exceptional income
amounted to €1 million, in which the reversal of provisions for the
realignment of the Saltigo business unit was partly offset by expenses
for further measures relating to the “Advance” program.
Performance Chemicals
Overview of Key Data
2013 2014 Change
€ million Margin %
€ million Margin %
%
Sales 2,132 2,193 2.9
EBITDA pre exceptionals 231 10.8 274 12.5 18.6
EBITDA 181 8.5 240 10.9 32.6
Operating result (EBIT) pre exceptionals 139 6.5 188 8.6 35.3
Operating result (EBIT) 54 2.5 154 7.0 > 100
Cash outflows for capital expenditures 111 77 (30.6)
Depreciation and amortization 127 86 (32.3)
Employees as of Dec. 31 5,837 5,613 (3.8)
2014
2012
2011
2010
2013
0 100 200 300 400
259 18.4%
264 17.1%
305 18.2%
286 17.4%
303 18.4%
Sales in the Performance Chemicals segment rose by €61 million, or
2.9%, to €2,193 million. While sales were increased particularly by
the 2.8% expansion of volumes, selling prices also edged up by 0.3%
compared with the prior-year level. The net impact of exchange rate
and portfolio effects was slightly negative.
Overall, the segment’s volumes and selling prices were above the
prior-year level, although the individual business units trended differ-
ently. In most of the segment’s business units, the increase in volumes
more than offset the slight decrease in selling prices that was due
in part to lower raw material prices. The Functional Chemicals and
Rubber Chemicals business units were able to largely offset declining
volumes with higher selling prices. Positive portfolio effects in the Mate-
rial Protection Products and Functional Chemicals business units were
overcompensated by the unfavorable exchange rate developments at
segment level. Business expanded in the Asia-Pacific, North America,
Germany and EMEA (excluding Germany) regions.
EBITDA and EBITDA Margin Pre Exceptionals
€ million
EBITDA pre exceptionals for the Performance Chemicals seg-
ment advanced by €43 million, or 18.6%, against the prior year to
€274 million. This increase resulted from positive volume effects and,
especially, from favorable exchange rate developments, a beneficial
price effect and a decline in purchasing prices for raw materials. While
earnings were held back by higher manufacturing costs, portfolio
effects did not have a significant impact. The EBITDA margin pre
exceptionals increased from 10.8% to 12.5%.
The exceptional items of €34 million for the segment in 2014
fully impacted EBITDA and mainly related to the “Let’s LANXESS
again” and “Advance” programs. Exceptional items in 2013 came to
€85 million, €35 million of which did not impact EBITDA. They were
mostly accounted for by impairment charges recognized for the Rub-
ber Chemicals business unit. The exceptional charges that impacted
EBITDA in the prior year were related especially to measures associ-
ated with the “Advance” program.
2014
2012
2011
2010
2013
0 100 200 300 400
281 14.2%
289 13.6%
281 12.8%
231 10.8%
274 12.5%

90 LANXESS Annual Report 2014
Reconciliation
Overview of Key Data
€ million 2013 2014 Change %
Sales 35 42 20.0
EBITDA pre exceptionals (171) (161) 5.8
EBITDA (216) (240) (11.1)
Operating result (EBIT) pre exceptionals (195) (181) 7.2
Operating result (EBIT) (240) (260) (8.3)
Cash outflows for capital expenditures 32 25 (21.9)
Depreciation and amortization 24 20 (16.7)
Employees as of Dec. 31 3,273 2,986 (8.8)
EBITDA pre exceptionals for the Reconciliation came to minus
€161 million, compared with minus €171 million in the prior year.
The development of functional costs already reflected cost savings
from the “Let’s LANXESS again” and “Advance” programs. The excep-
tional charges of €79 million, which fully impacted EBITDA, primarily
related to measures associated with the “Let’s LANXESS again” and
“Advance” programs, expenses for the design and implementation
of IT projects and expenses for portfolio adjustments, to the extent
that these expenses could not be allocated to specific segments or
business units. The exceptional charges of €45 million reported in
the Reconciliation in 2013, all of which impacted EBITDA, primarily
related to measures associated with the “Advance” program, expenses
for the design and implementation of IT projects and expenses for
portfolio adjustments, to the extent that these expenses could not be
allocated to specific segments or business units.
Statement of financial position and financial condition
Statement of financial position
• Increase in total assets, mainly due to capital expenditures
• Equity ratio improved by capital increase
• Higher pension provisions due to lower discount rates
• Net financial liabilities substantially below prior year at
€1,336 million
Structure of the Statement of Financial Position
Dec. 31, 2013 Dec. 31, 2014 Change
€ million % € million % %
Assets
Non-current assets 3,592 52.7 4,101 56.6 14.2
Current assets 3,219 47.3 3,149 43.4 (2.2)
Total assets 6,811 100.0 7,250 100.0 6.4
Equity and liabilities
Equity (including non-controlling interests) 1,900 27.9 2,161 29.8 13.7
Non-current liabilities 3,029 44.5 3,447 47.6 13.8
Current liabilities 1,882 27.6 1,642 22.6 (12.8)
Total equity and liabilities 6,811 100.0 7,250 100.0 6.4
Structure of the statement of financial position
Total assets of the LANXESS Group amounted to €7,250 million as
of December 31, 2014, an increase of €439 million, or 6.4%, on
the prior-year figure. This was primarily due to capital expenditures
for property, plant and equipment, an increase in deferred tax assets
and the expansion of inventories. The decline in trade receivables
had an opposing effect. The ratio of non-current assets to total assets
increased from 52.7% to 56.6%. On the equity and liabilities side,
equity increased particularly due to the capital increase in the second
quarter. This effect was counteracted by a net comprehensive loss,
primarily due to remeasurement of the net defined benefit liability
from post-employment benefit plans necessitated by lower interest
rates. At the end of 2014, the equity ratio was 29.8%, after 27.9%
in the previous year.
Structure of the Statement of Financial Position – Assets
€ million
2013 2014
Intangible assets and property,plant and equipment
Other non-current assets
Inventories and receivables
Cash and cash equivalents
Other current assets
3,653448
2,399518 232
3,226366
2,369533
317
6,811 7,250

91Combined Management Report – Economic report
Segment information | Statement of financial position and financial condition
Non-current assets rose by €509 million to €4,101 million, with
intangible assets and property, plant and equipment increasing by
€427 million to €3,653 million. Cash outflows for purchases of prop-
erty, plant and equipment and intangible assets in the reporting period
were €614 million, just below the prior-year level of €624 million.
Depreciation and amortization in 2014 totaled €426 million and was
thus below the prior-year level, mainly because of the lower deprecia-
tion and amortization base following comparatively high write-downs
of intangible assets and property, plant and equipment at year end
2013. The carrying amount of investments accounted for using the
equity method decreased by €12 million to €0 million. This change
resulted from the net-asset-driven adjustment to the carrying amount
of the interest in Currenta GmbH & Co. OHG, Leverkusen, Germany.
Deferred taxes increased by €126 million, to €380 million. The ratio
of non-current assets to total assets was 56.6%, up from 52.7% on
December 31, 2013.
Current assets decreased by €70 million, or 2.2%, compared with
December 31, 2013 to €3,149 million. The inventory growth of
€85 million, or 6.5%, to €1,384 million was attributable to slightly
higher volumes and the development of exchange rates, especially
for the U.S. dollar. The lower prices for certain key raw materials offset
inventory growth. Days of inventory outstanding (DIO) increased from
70.7 to 79.1. By contrast, trade receivables were €55 million, or 5.1%,
lower at €1,015 million, despite opposing currency effects. Days of
sales outstanding (DSO) were virtually unchanged at 48.0. Minimal
portfolio effects from the sale of the shares of Perlon-Monofil GmbH,
Dormagen, Germany, in the reporting year had no significant influ-
ence on net working capital. Cash and cash equivalents decreased by
€9 million to €418 million. Near-cash assets decreased by €6 million
to €100 million at year end following the sale of shares in money
market funds. The ratio of current assets to total assets was 43.4%,
against 47.3% as of December 31, 2013.
The LANXESS Group has significant internally generated intangible
assets that are not reflected in the statement of financial position in
light of accounting rules. These include the brand equity of LANXESS
and the value of other brands of the Group. A variety of measures
was deployed in the reporting period to continually enhance these
assets and help strengthen the positions our business units hold in
their respective markets.
Our established relationships with customers and suppliers also con-
stitute a significant intangible asset. These long-standing, trust-based
partnerships with customers and suppliers, underpinned by consistent
service quality, have made it possible for us to compete successfully
– also in a more challenging business environment. Our competence
in technology and innovation, also a valuable asset, is rooted in our
specific expertise in the areas of research and development and cus-
tom manufacturing. It enables us to generate significant added value
for our customers.
The know-how and experience of our employees are crucial factors for
our corporate success. In addition, we have sophisticated production
and business processes that create competitive advantages for us in
the relevant markets.
Structure of the Statement of Financial Position – Equity and Liabilities
€ million
Equity amounted to €2,161 million, up by €261 million or 13.7%
compared with December 31, 2013, primarily due to the capital
increase of 10% in the second quarter of 2014. Factors with the op-
posite effect were the dividend payout of €46 million to LANXESS AG
stockholders in May 2014 and the net comprehensive loss recorded,
which was primarily due to the remeasurement of the net defined ben-
efit liability from post-employment benefit plans necessitated by lower
interest rates. The ratio of equity to the Group’s total assets was 29.8%
as of December 31, 2014, after 27.9% as of December 31, 2013.
Non-current liabilities increased by €418 million to €3,447 million
as of December 31, 2014. Provisions for pensions and other post-
employment benefits rose by €347 million compared with the end of
2013, to €1,290 million. This increase mainly related to the change
in the interest rates used in measurement, with minimal effects caused
by the “Let’s LANXESS again” program. Other non-current financial
liabilities amounted to €1,698 million, up by €49 million against
December 31, 2013. This increase resulted primarily from the partial
refinancing of the €500 million Eurobond issued in 2009 that matured
in the reporting period. The ratio of non-current liabilities to total assets
was 47.6%, up from 44.5% as of December 31, 2013.
2013 2014
Equity
Non-current financial liabilities
Other non-current liabilities
Current financial liabilities
Other current liabilities
1,900
1,661
1,368
1,380502
2,161
1,718
1,729
1,082560
6,811 7,250

92 LANXESS Annual Report 2014
Current liabilities came to €1,642 million, down by €240 million, or
12.8% from December 31, 2013. This decline resulted mainly from
the repayment of the aforementioned Eurobond issued in 2009. At
€799 million, trade payables were €109 million above the prior-year
figure, due in large part to changes in payment terms and, to a smaller
extent, to shifts in exchange rates. In light of the devaluation of the
euro against certain contract currencies, current derivative liabilities
increased by €79 million to €101 million. Other current liabilities
increased by €40 million to €166 million on account of the effects
of the “Let’s LANXESS again” program. By contrast, in spite of small
additions also resulting from this program, other current provisions
decreased by €5 million to €350 million. The ratio of current liabilities
to total assets was 22.6% as of December 31, 2014, against 27.6%
at the end of 2013.
At €1,336 million, net financial liabilities were substantially below the
figure of €1,731 million at December 31, 2013.
The Group’s key ratios developed as follows:
Capital expenditures
In 2014, capital expenditures for property, plant and equipment and
intangible assets came to €692 million, compared with €676 million
the year before, and led to cash outflows of €614 million (2013:
€624 million). Depreciation and amortization totaled €426 mil-
lion in the same period (2013: €717 million). This figure included
€20 million in write-downs reported as exceptional items (2013:
€270 million). Adjusted for these write-downs, capital expenditures
exceeded depreciation and amortization by a substantial 70% (2013:
51%). The increase was primarily due to the reduction in the deprecia-
tion and amortization base following the recognition of write-downs
in 2013.
Cash Outflows for Capital Expenditures vs. Depreciation and Amortization
€ million
2014
2013
2012
2011
2010
0 400200 600 800
Depreciation and amortizationCash outflows for capital expenditures
696378
679325
501283
624717
696378
614426
679325
501283
Ratios
% 2010 2011 2012 2013 2014
Equity ratio Equity1)
Total assets 31.1 30.2 31.0 27.9 29.8
Non-current asset ratio Non-current assetsTotal assets 48.3 50.7 49.8 52.7 56.6
Asset coverage I Equity1)
Non-current assets 64.3 59.4 62.2 52.9 52.7
Asset coverage II Equity1) and non-current liabilitiesNon-current assets 153.9 137.3 157.2 137.2 136.7
Funding structure Current liabilitiesTotal liabilities 37.2 43.5 31.4 38.3 32.3
1) Including non-controlling interests

93Combined Management Report – Economic report
Statement of financial position and financial condition
Selected Capital Expenditure Projects 2014
Segment Site Description
Performance Polymers
Performance Butadiene Rubbers Singapore Construction of a production plant for neodymium-based performance butadiene rubber (Nd-PBR), start-up in the first half of 2015
Keltan Elastomers Changzhou, China Construction of a production plant for ethylene-propylene-diene (EPDM) rubber, start-up in 2015
High Performance Materials Porto Feliz, Brazil Construction of a new compounding plant for high-tech plastics, start-up in April 2014
High Performance Materials Antwerp, Belgium Start-up of a new polyamide plastics plant in Q3 2014
High Performance Materials Gastonia, U.S.A. Expansion of the high-tech plastics facility by the addition of a second production line, start-up in 2016
Performance Chemicals
Inorganic Pigments Ningbo, China Construction of a plant for iron oxide red pigments with the addition of a mixing and milling plant for inorganic pigments, completion in Q4 2015 and start-up in Q1 2016
Liquid Purification Technologies Leverkusen, Germany Construction of a plant for weakly acidic cation exchange resins, completion in September 2014
In the reporting year, capital expenditures focused on the following
areas:
• construction of new facilities, expansion and maintenance of existing
facilities;
• measures to increase plant availability;
• projects to improve plant safety, enhance quality and comply with
environmental protection requirements.
Almost two-thirds of the capital expenditures in 2014 went toward
expansion or efficiency improvement measures, while the rest went
to maintain existing facilities.
In regional terms, 23% of our capital expenditures in the reporting
period were made in Germany, 17% in the EMEA region (excluding
Germany), 7% in North America, 5% in Latin America and 48% in
Asia-Pacific. Capital expenditures in Germany mostly comprised our
investments to increase capacities and modernize facilities in all
segments, especially investments in expansions for the Advanced
Industrial Intermediates and Saltigo business units. The continued
large share of capital expenditures made in the Asia-Pacific region
in the reporting year is due primarily to the construction of a new
production plant for high-performance neodymium-based perfor-
mance butadiene rubber (Nd-PBR) for the Performance Butadiene
Rubbers business unit in Singapore and the construction of a new
production plant for EPDM rubber for the Keltan Elastomers business
unit in Changzhou, China.
Cash Outflows for Capital Expenditures by Segment
€ million
In the Performance Polymers segment, capital expenditures
amounted to €472 million (2013: €405 million), €428 million
(2013: €385 million) of which were cash outflows. Depreciation
and amortization amounted to €231 million (2013: €489 million).
The major capital expenditures in this segment were made in the
Performance Butadiene Rubbers and Keltan Elastomers business
units. Capital expenditures in the Advanced Intermediates segment
amounted to €94 million (2013: €113 million). Cash outflows came
to €84 million (2013: €96 million), below the depreciation and
amortization of €89 million (2013: €77 million). They were ac-
counted for by a number of smaller capital expenditure projects.
In the Performance Chemicals segment, capital expenditures
came to €100 million (2013: €117 million), €77 million (2013:
€111 million) of which were cash outflows. Depreciation and amor-
tization stood at €86 million (2013: €127 million). A key capital
expenditure is the construction of a state-of-the-art plant for iron
oxide red pigments in Ningbo, China, for the Inorganic Pigments
business unit.
The following table shows major capital expenditure projects in the
LANXESS Group.
428
2013
84 77 25
6142014
385 96 111 32
624
Performance PolymersAdvanced IntermediatesPerformance ChemicalsReconciliation

94 LANXESS Annual Report 2014
Expansion of the Group portfolio Please see “Changes to the Group
portfolio” in this combined management report for more information
on the changes in fiscal 2014.
Financial condition
• Operating cash flow above prior-year level
• Inflow from reduction in cash tied up in working capital
• Cash used for investing activities reflects extensive capital
expenditures for growth projects
• Liquidity position remains solid
The cash flow statement shows inflows and outflows of cash and cash
equivalents by type of business operation.
Cash Flow Statement
€ million 2013 2014 Change
Income before income taxes (239) 80 319
Depreciation and amortization 717 426 (291)
Other items 53 144 91
Net cash provided by operating activities before change in net working capital 531 650 119
Change in net working capital 110 147 37
Net cash provided by operating activities 641 797 156
Net cash used in investing activities (342) (587) (245)
Net cash used in financing activities (260) (222) 38
Change in cash and cash equivalents from business activities 39 (12) (51)
Cash and cash equivalents as of December 31 427 418 (9)
Cash provided by operating activities, before changes in net working
capital, increased by €119 million to €650 million in fiscal 2014.
This was mainly due to the €319 million increase in income before
income taxes to €80 million. Depreciation and amortization decreased
to €426 million from €717 million in the previous year, primarily due
to write-downs recognized on property plant and equipment and
intangible assets at the end of 2013.
The decrease in net working capital compared to December 31,
2013 resulted in a cash inflow of €147 million. The cash inflow from
the change in net working capital in 2013 was €110 million. The
development during the reporting period was mainly attributable
to the decline in trade receivables. This effect was intensified by the
increase in trade payables but offset by the expansion of inventories.
The net cash provided by operating activities was €797 million, against
€641 million in 2013.
LANXESS’s investing activities in fiscal 2014 resulted in a cash outflow
of €587 million, up from €342 million in the previous year. Disburse-
ments for intangible assets and property, plant and equipment came to
€614 million, which was below the prior-year level of €624 million. The
cash outflows for the acquisition of subsidiaries and other businesses,
net of acquired cash and cash equivalents, amounted to €15 million
in 2013. The acquisitions made in that year were PCTS Specialty
Chemicals Pte. Ltd., Singapore, and the phosphorus chemicals port-
folio of Thermphos France S.A.R.L., Epierre, France. Cash inflows
from financial assets came to €8 million and mainly comprised the
proceeds from the sale of shares in money market funds. The sale of
the shares of Perlon-Monofil GmbH, Dormagen, Germany, resulted in
a cash inflow of €3 million, net of divested cash and cash equivalents.
Free cash flow – the difference between the cash inflows from operat-
ing activities and the cash used in investing activities – decreased by
€89 million to €210 million.
Net cash used in financing activities came to €222 million, against
€260 million the year before. A major effect came from the cash in-
flow of €433 million resulting from the capital increase in the second
quarter of 2014. However, this was more than offset by cash outflows
of €478 million attributable to the net repayment of borrowings. Inter-
est payments and other financial disbursements of €131 million were
slightly higher than the previous year’s amount of €119 million. An
outflow of €46 million was accounted for by the dividend paid to the
stockholders of LANXESS AG for fiscal 2013 (2013: €83 million).
The net change in cash and cash equivalents from business activities
in fiscal 2014 was minus €12 million, against €39 million the previous
year. After taking into account currency-related and other changes in
cash and cash equivalents of €3 million, cash and cash equivalents
at the closing date amounted to €418 million, against €427 million
at the previous year’s closing date. Taken together with near-cash as-
sets (short-term investment of liquid assets in money market funds)
of €100 million, against €106 million the previous year, the Group
retained a sound liquidity position of €518 million as of December 31,
2014, compared to €533 million at the end of 2013.

95Combined Management Report – Economic report
Statement of financial position and financial condition
Principles and objectives of financial management LANXESS pursues
a conservative financial policy characterized by the forward-looking
management of financial risks. Our aim is to be able to provide suf-
ficient liquidity to our business operations at all times, regardless of
cyclical fluctuations in the real economy or financial markets. The
debt level is largely aligned with the ratio systems of the leading rat-
ing agencies for investment-grade companies and we will be seeking
its further reduction in the future. In addition to liquidity risk, financial
management also covers other financial risks, such as interest and
foreign exchange risks. Here too, we aim to mitigate the financial risks
that arise and increase planning reliability, partly by using derivative
financial instruments. Detailed information about the management
of these risks is contained in the “Opportunity and risk report” in this
combined management report and under Note [35], “Financial instru-
ments,” to the consolidated financial statements.
LANXESS Group ratings Access to the capital markets and good rela-
tions with German and international commercial banks are essential for
achieving our financial management objectives. Accordingly, ongoing
dialogue and communication with banks, investors and rating agencies
are of crucial importance. In fiscal 2014, the latter reduced LANXESS’s
creditworthiness from BBB and Baa2 to BBB– and Baa3, respectively.
However, they raised the outlook to stable. Justifying this downward
assessment, the rating agencies cited factors such as LANXESS’s
latterly weaker financial data resulting from the persistently difficult
business environment for rubber. They based their stable outlook on
the measures taken by LANXESS, including the capital increase made
in the reporting period and the implementation of the global realign-
ment program we initiated.
Financing analysis In fiscal 2014, LANXESS had a balanced financing
structure and a very sound liquidity position.
The main change to our financial portfolio during the reporting period
resulted from the redemption of the €500 million bond that matured
in April. For this purpose, we drew on a credit line we have with the
European Investment Bank. The proceeds of the capital increase
made in May 2014 served to finance the “Let’s LANXESS again”
program and strengthen our financial position. In the fourth quarter
of 2014, we repaid two bank loans ahead of schedule in order to
reduce gross indebtedness and lower interest burden. We funded
the growth program which ends in 2015 from business operations
and using existing liquidity and credit lines.
LANXESS launched a €2.5 billion debt issuance program in March
2009. On this basis and aligned with the prevailing market conditions,
bonds can be placed on the capital market very flexibly with respect to
timing and volume. As of December 31, 2014, just under €1.5 billion
of the €2.5 billion financing facility had been utilized to issue bonds
and private placements. Utilization was correspondingly reduced after
redemption of our €500 million bond in April 2014. Capital market
financing is a central component in LANXESS’s financing mix, which
is subject to regular review to ensure the adequate diversification of
our financing sources.
Current financial liabilities decreased from €668 million in 2013 to
€182 million at December 31, 2014, largely due to the redemption
of the €500 million bond.
Development of LANXESS Ratings and Rating Outlook Since 2010
2010 2011 2012 2013 2014
Standard & Poor’s BBB/stable Sep. 1, 2010
BBB/stableAug. 23, 2011
BBB/stableAug. 31, 2012
BBB/negativeJune 27, 2013
BBB –/stableMay 19, 2014
Moody’s Investors Service Baa2/stable May 19, 2010
Baa2/stableNov. 23, 2011
Baa2/stableSep. 26, 2012
Baa2/negativeAug. 14, 2013
Baa3/stableJune 20, 2014
Fitch Ratings BBB/stable Dec. 17, 2010
BBB/stableNov. 22, 2011
BBB/stableSep. 13, 2012
BBB/negativeAug. 15, 2013
BBB –/stableAug. 18, 2014
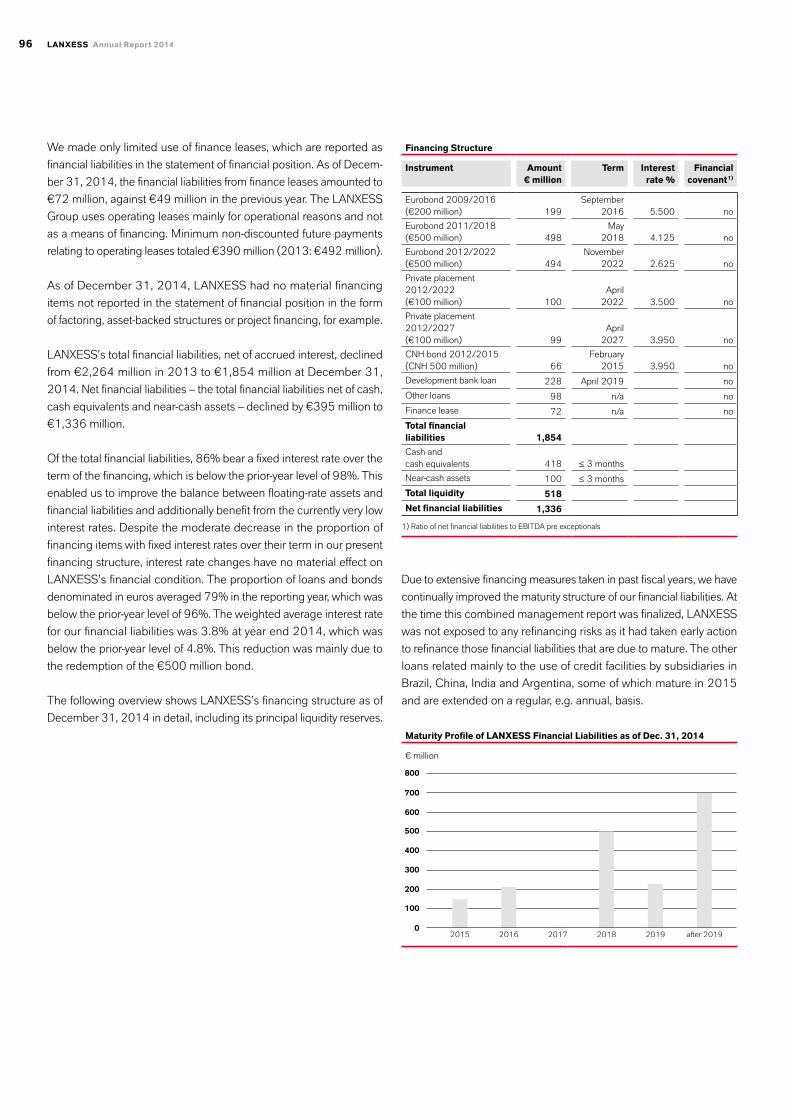
96 LANXESS Annual Report 2014
We made only limited use of finance leases, which are reported as
financial liabilities in the statement of financial position. As of Decem-
ber 31, 2014, the financial liabilities from finance leases amounted to
€72 million, against €49 million in the previous year. The LANXESS
Group uses operating leases mainly for operational reasons and not
as a means of financing. Minimum non-discounted future payments
relating to operating leases totaled €390 million (2013: €492 million).
As of December 31, 2014, LANXESS had no material financing
items not reported in the statement of financial position in the form
of factoring, asset-backed structures or project financing, for example.
LANXESS’s total financial liabilities, net of accrued interest, declined
from €2,264 million in 2013 to €1,854 million at December 31,
2014. Net financial liabilities – the total financial liabilities net of cash,
cash equivalents and near-cash assets – declined by €395 million to
€1,336 million.
Of the total financial liabilities, 86% bear a fixed interest rate over the
term of the financing, which is below the prior-year level of 98%. This
enabled us to improve the balance between floating-rate assets and
financial liabilities and additionally benefit from the currently very low
interest rates. Despite the moderate decrease in the proportion of
financing items with fixed interest rates over their term in our present
financing structure, interest rate changes have no material effect on
LANXESS’s financial condition. The proportion of loans and bonds
denominated in euros averaged 79% in the reporting year, which was
below the prior-year level of 96%. The weighted average interest rate
for our financial liabilities was 3.8% at year end 2014, which was
below the prior-year level of 4.8%. This reduction was mainly due to
the redemption of the €500 million bond.
The following overview shows LANXESS’s financing structure as of
December 31, 2014 in detail, including its principal liquidity reserves.
Financing Structure
Instrument Amount € million
Term Interest rate %
Financial covenant 1)
Eurobond 2009/2016 (€200 million) 199
September 2016 5.500 no
Eurobond 2011/2018 (€500 million) 498
May 2018 4.125 no
Eurobond 2012/2022 (€500 million) 494
November 2022 2.625 no
Private placement 2012/2022 (€100 million) 100
April 2022 3.500 no
Private placement 2012/2027 (€100 million) 99
April 2027 3.950 no
CNH bond 2012/2015 (CNH 500 million) 66
February 2015 3.950 no
Development bank loan 228 April 2019 no
Other loans 98 n/a no
Finance lease 72 n/a no
Total financial liabilities 1,854
Cash and cash equivalents 418 ≤ 3 months
Near-cash assets 100 ≤ 3 months
Total liquidity 518
Net financial liabilities 1,336
1) Ratio of net financial liabilities to EBITDA pre exceptionals
Due to extensive financing measures taken in past fiscal years, we have
continually improved the maturity structure of our financial liabilities. At
the time this combined management report was finalized, LANXESS
was not exposed to any refinancing risks as it had taken early action
to refinance those financial liabilities that are due to mature. The other
loans related mainly to the use of credit facilities by subsidiaries in
Brazil, China, India and Argentina, some of which mature in 2015
and are extended on a regular, e.g. annual, basis.
Maturity Profile of LANXESS Financial Liabilities as of Dec. 31, 2014
€ million
0
100
200
300
400
600
700
800
500
2015 2016 2017 2018 2019 after 2019

97Combined Management Report – Economic report
Statement of financial position and financial condition
Liquidity analysis In addition to cash and cash equivalents of
€418 million and investments in highly liquid AAA money market
funds of €100 million, LANXESS has additional sizeable liquidity
reserves in the form of undrawn credit facilities. The investments in
money market funds are undertaken only at European Group com-
panies that are not subject to restrictions on foreign exchange and
capital transfers. We can therefore freely dispose of the funds. Around
86% of our cash is held in Group companies in countries with no re-
strictions on foreign exchange and capital transfers. Only about 14%
of our cash is held in companies in regulated capital markets where
cash transfers are restricted.
Thanks to our good liquidity position, our solvency was assured at all
times in fiscal 2014. This is an aspect that was assessed positively
by the rating agencies in their credit ratings in 2014.
By far the most important of LANXESS’s credit lines is the syndicated
credit facility of €1.25 billion, which has not been significantly drawn
upon to date. In February 2015, we extended this facility by one year
until February 2020. This credit facility is designed as an operating
line of credit and to provide funds for capital investment. It corresponds
to market requirements in the European syndicated loan market for
investment-grade companies with a BBB rating. Another important
credit line is the €150 million facility we agreed with the European
Investment Bank in fiscal 2014. None of our major loan agreements
contains a financial covenant. LANXESS had unused credit lines total-
ing around €1.5 billion as of December 31, 2014, unchanged against
the end of the previous year.
The total of liquid assets and undrawn credit lines gives us a liquid-
ity scope of around €2.0 billion, as in the prior year. This liquidity
reserve secures our entrepreneurial flexibility and serves as back-up
financing for our global realignment program; it is an expression of
our conservative financial policy. Our solvency is safeguarded for the
short and long term.
Bond performance – evolution of credit spread in 2014 An important
indicator for corporate bonds, apart from the absolute change in price,
is the relative valuation of the risk specific to the issuer in comparison to
a reference interest rate. This credit risk premium is expressed in what
is known as the credit spread. Due to the higher default risk associated
with longer bond maturity, long-term bonds generally feature a wider
credit spread. This, and factors such as liquidity and trading volume,
also apply to the various LANXESS bonds. The following chart shows
the evolution of the credit spreads of our bonds and the average credit
spread of corporate bonds with a BBB rating and a five-year maturity
in comparison to the interest rate swap curve.
LANXESS Eurobond Spreads vs. BBB Corporates Index
Basis points
LANXESS Eurobond 2014 LANXESS Eurobond 2022
LANXESS Eurobond 2016 BBB Corporates, 5 years
LANXESS Eurobond 2018
The credit risk premiums on corporate bonds displayed little volatility in
2014 and declined steadily during the year. This reflected the overall
positive situation on Europe’s capital markets and, against the back-
ground of the further decline in interest rates, the high demand from
investors for corporate bonds with investment-grade ratings.
In the first half of 2014, the credit risk premiums on LANXESS bonds
moved in parallel with but were below those for bonds in the BBB-
rated reference group. Following the reduction of LANXESS’s rat-
ings to BBB– and Baa3 in the second half of the year, the credit risk
premium on the LANXESS bond which matures in 2018 moved on
the same level as those for bonds with roughly the same maturities
in the BBB-rated reference group. The development of our credit
spreads underscores the fact that we retain competitive access to
capital market financing.
01.01.2008 31.12.20080
100
200
300
400
500
-20
0
20
40
60
80
100
0
20
40
60
80
100
Jan. 1, 2014 Dec. 31, 2014(20)

98 LANXESS Annual Report 2014
Management’s summary of business development and the fiscal year
In 2014, the LANXESS Group’s business was largely characterized
by the persistently difficult competitive situation for synthetic rubbers.
While business development had been unfavorable in 2013, a slightly
more favorable trend was evident in the year under review.
At €8,006 million, LANXESS Group sales in 2014 declined by 3.5%
from €8,300 million in the prior year. Our Performance Polymers
segment posted a substantial decrease in sales, due especially to
lower procurement prices for raw materials and to the persistently
challenging competitive situation. In the Advanced Intermediates
segment, sales were more or less flat with the previous year thanks to
good demand for agrochemicals. The Performance Chemicals seg-
ment posted a positive business performance on account of higher
volumes and selling prices.
EBITDA pre exceptionals in 2014 increased by almost 10% to
€808 million from €735 million in the previous year. This was due
especially to lower manufacturing costs and higher volumes. Ad-
ditionally, cost savings were contributed by the “Advance” and “Let’s
LANXESS again” programs. Earnings were held back by lower selling
prices due to the challenging competitive situation for synthetic rub-
bers, resulting in part from overcapacities. Overall, net income and
earnings per share were substantially improved year on year.
We upheld our conservative accounting and financing policy. In
accordance with the consistency principle, we essentially applied the
same measurement methods and exercised the same discretion as in
the previous year. Our equity ratio improved from 27.9% to 29.8%,
which was attributable above all to the capital increase. Total assets
increased, mainly due to capital expenditures.
Our statement of financial position shows that our liquidity position
remains solid. Additional substantial liquidity reserves in the form of
undrawn credit lines are also available. Of the total financial liabilities,
86% bear a fixed interest rate over the term of the financing, which
is below the prior-year level of 98%. This enabled us to improve the
balance between floating-rate assets and financial liabilities and ad-
ditionally benefit from the currently very low interest rates. Our financial
liabilities are free of financial covenants.
Our net financial liabilities declined by €395 million to €1,336 million.
In fiscal 2014, the rating agencies reduced LANXESS’s creditworthi-
ness from BBB and Baa2 to BBB– and Baa3, respectively. However,
they raised the outlook to stable. This downward assessment was
justified by factors such as LANXESS’s latterly weaker financial data
resulting from the persistently difficult business environment for rub-
ber, among other factors.
In the prior year, we made appropriate corrections to our assets af-
fected by the risks associated with the challenging competitive situ-
ation resulting from growing capacities, lower selling prices and less
favorable prices for raw materials and energy. Although there has
been no fundamental change to this environment, we believe that
our company’s business situation remains positive on account of its
balanced financing position in the long term and the intactness of the
megatrends in the medium term.

99Combined Management Report – Economic report
Management’s summary of business development and the fiscal year | Earnings, asset and financial position of LANXESS AG
Key Business Data – Multi-Period Overview
€ million 2010 2011 2012 2013 2014
Earnings performance
Sales 7,120 8,775 9,094 8,300 8,006
EBITDA pre exceptionals 918 1,146 1,223 735 808
EBITDA margin pre exceptionals 12.9% 13.1% 13.4% 8.9% 10.1%
EBITDA 890 1,101 1,186 624 644
Operating result (EBIT) pre exceptionals 635 826 847 288 402
Operating result (EBIT) 607 776 808 (93) 218
EBIT margin 8.5% 8.8% 8.9% (1.1)% 2.7%
Net income (loss) 379 506 508 (159) 47
Earnings per share (€) 4.56 6.08 6.11 (1.91) 0.53
Financial position
Cash flow from operating activities 430 672 838 641 797
Depreciation and amortization 283 325 378 717 426
Cash outflows for capital expenditures 501 679 696 624 614
Net financial liabilities 913 1,515 1,483 1,731 1,336
Assets and liabilities
Total assets 5,666 6,878 7,519 6,811 7,250
Non-current assets 2,738 3,489 3,747 3,592 4,101
Current assets 2,928 3,389 3,772 3,219 3,149
Net working capital 1,372 1,766 1,849 1,679 1,600
Equity (including non-controlling interests) 1,761 2,074 2,330 1,900 2,161
Pension provisions 605 679 893 943 1,290
Indicators
ROCE 17.0% 17.2% 15.6% 5.8% 7.9%
Equity ratio 31.1% 30.2% 31.0% 27.9% 29.8%
Non-current asset ratio 48.3 50.7 49.8 52.7 56.6
Asset coverage I 64.3 59.4 62.2 52.9 52.7
Net working capital/sales 19.3% 20.1% 20.3% 20.2% 20.0%
Employees (as of December 31) 14,648 16,390 17,177 17,343 16,584
Earnings, asset and financial position of LANXESS AG
LANXESS AG serves primarily as the management holding company
for the LANXESS Group. The principal management functions for the
entire Group are performed by the Board of Management. The Board of
Management shapes Group strategy and manages resource allocation,
infrastructure and organization. The Group management company is
also responsible for financing and communication with LANXESS’s key
stakeholders. The economic performance of LANXESS AG depends
principally on the operating business entities in the LANXESS Group
and on the development of the chemical industry. The balance of
income and losses from investments in affiliated companies resulting
from profit or loss transfers and dividends from affiliated companies is of
key importance for the future ability of LANXESS AG to pay a dividend.
Therefore, especially the statements made in the “Opportunity and
risk report” in this combined management report apply in principle
to LANXESS AG as well.
The financial statements of LANXESS AG are prepared in accordance
with the German Commercial Code (HGB) and the German Stock
Corporation Act (AktG).

100 LANXESS Annual Report 2014
Sales and earnings of LANXESS AG
LANXESS AG Income Statement in Accordance with the German Commercial Code (HGB) – Abridged
€ million 2013 2014 Change %
Sales 4 5 25.0
Cost of sales (4) (5) (25.0)
Gross profit 0 0 –
General administration expenses (39) (43) (10.3)
Other operating income 2 34 >100
Other operating expenses (2) (14) < (100)
Operating result (39) (23) 41.0
Income from investments in affiliated companies 169 53 (68.6)
Net interest expense (85) (57) 32.9
Other financial income and expenses – net (14) (33) < (100)
Financial result 70 (37) < (100)
Income (loss) before income taxes 31 (60) < (100)
Income taxes 4 (25) < (100)
Net income (loss) 35 (85) < (100)
Carryforward to new account 13 3 (76.9)
Withdrawal from other retained earnings 0 135 –
Distributable profit 48 53 10.4
The earnings of LANXESS AG are determined largely by profit or loss
transfers from LANXESS Deutschland GmbH and LANXESS Interna-
tional Holding GmbH, which hold the shares of the other subsidiaries
and affiliates both in Germany and elsewhere.
Sales of LANXESS AG stood at €5 million, which was slightly higher
than the prior-year level of €4 million. They related to services provided
to LANXESS Deutschland GmbH. A balanced result remained after
deducting the cost of sales, which consisted mostly of personnel ex-
penses and appropriate shares of the general administration expenses.
General administration expenses increased against the previous year,
up €4 million, or 10.3%, to €43 million. They principally comprised
personnel and other business expenses not directly related to the
services provided to Group companies. The increase in other operating
income was primarily due to the reversal of provisions. The operating
result improved by €16 million to minus €23 million.
The financial result, which comprises the balance of income and losses
from investments in affiliated companies, the net interest position,
and other financial income and expense, decreased by €107 million
to minus €37 million. This change was primarily due to the profit
transfer of €67 million from LANXESS Deutschland GmbH, down
€102 million from the previous year, and to the assumption of a loss
of €13 million from LANXESS International Holding GmbH. By con-
trast, the €28 million decrease in net interest expense to €57 million
had a positive effect and was mainly attributable to the repayment of
borrowings from subsidiaries.
Income before income taxes came to minus €60 million, following €31 million in the previous year. Net expenses for income taxes
of €25 million comprised tax expenses of €1 million for 2014
and €24 million for the previous years. The net loss for 2014 was
€85 million after net income of €35 million in the previous year.
Taking into account the profit carryforward of €3 million and a with-
drawal from other retained earnings of €135 million, the distribut-
able profit as of December 31, 2014, increased to €53 million from
€48 million at the end of 2013.
Asset and capital structure of LANXESS AG
LANXESS AG Statement of Financial Position in Accordance with the German Commercial Code (HGB) – Abridged
Dec. 31, 2013 Dec. 31, 2014 Change
€ million % € million % %
ASSETS
Financial assets 757 23.5 758 26.3 0.1
Non-current assets 757 23.5 758 26.3 0.1
Receivables from affiliated companies 1,967 61.1 1,754 60.8 (10.8)
Other assets 25 0.7 20 0.7 (20.0)
Liquid assets and securities 467 14.5 348 12.1 (25.5)
Current assets 2,459 76.3 2,122 73.6 (13.7)
Prepaid expenses 5 0.2 4 0.1 (20.0)
Total assets 3,221 100.0 2,884 100.0 (10.5)
EqUITy AND LIABILITIES
Equity 1,171 36.4 1,473 51.1 25.8
Provisions 101 3.1 103 3.6 2.0
Liabilities to banks 59 1.8 1 0.0 (98.3)
Payables to affiliated companies 1,886 58.6 1,297 45.0 (31.2)
Other liabilities 4 0.1 10 0.3 >100
Liabilities 1,949 60.5 1,308 45.3 (32.9)
Total assets 3,221 100.0 2,884 100.0 (10.5)

101Combined Management Report – Economic report
Earnings, asset and financial position of LANXESS AG | Employees
In view of its function as a strategic holding company, the statement
of financial position of LANXESS AG is dominated by financial assets
and by receivables from, and payables to, subsidiaries.
LANXESS AG had total assets of €2,884 million as of December 31,
2014, which was €337 million, or 10.5%, below the prior-year fig-
ure. Non-current assets were €758 million and primarily included the
carrying amount of the investment in LANXESS Deutschland GmbH,
which stands at €739 million. The share of non-current assets in total
assets increased from 23.5% to 26.3%. Current assets declined by
€337 million, or 13.7%, to €2,122 million and accounted for 73.6%
of total assets, compared with 76.3% in 2013. Receivables from sub-
sidiaries accounted for 60.8% of total assets and related principally to
financial transactions and short-term loans. The share of bank balances
and securities in total assets decreased from 14.5% to 12.1%.
Equity increased by €302 million to €1,473 million, largely due to the
10% increase in the capital stock. This was partly offset by the dividend
payout for 2013 and the net loss for the reporting period. The equity
ratio was 51.1%, after 36.4% at the end of 2013.
Liabilities decreased by €641 million to €1,308 million, largely on
account of payables to subsidiaries, which were €589 million lower
than the previous year at €1,297 million. The provisions increased
by €2 million to €103 million and related mainly to commitments to
employees and statutory obligations.
Employees
As of December 31, 2014, the LANXESS Group had a total of
16,584 employees, against 17,343 at the closing date of the prior
year. Our global headcount reflected the measures taken to realign
the company. Some 1,000 positions in administration and service
units, marketing, and research and development worldwide were
identified for reduction by 2016 as part of the first phase of our
realignment (competitiveness of the business and administrative
structure).
In the EMEA region (excluding Germany), the number of employees
as of December 31, 2014 was 3,267, down from 3,444 in the
previous year. In Germany, the headcount declined from 8,117 to
7,747. The number of employees in the North America region fell to
1,371, from 1,526 as of December 31, 2013, while Latin America
saw its workforce shrink from 1,560 at the end of last year, to 1,467.
At the reporting date, we employed 2,732 people in the Asia-Pacific
region, which is 36 more than a year ago.
13,598, or 82%, of our employees were men and 2,986, or 18%,
were women. The number of employees who were non-German
nationals was 9,270. In addition, we had 957 employees worldwide
working on temporary employment contracts. LANXESS AG had
139 employees as of the reporting date, versus 144 the year before.
With a total of 496 trainees in 19 different career paths and seven
combined vocational training and study programs at the end of 2014,
LANXESS continues to train more young people than it needs to meet
its own requirements. In 2014, despite our realignment program, we
hired around 75% of those who completed their vocational training
with us in Germany.
Part-time employees accounted for 7.0% of the workforce at our
German core companies as of the reporting date. Individuals with
severe disabilities made up 5.4% of the workforce at our German
companies. In addition, we routinely award contracts to work centers
for the disabled.
The lost time injury frequency rate (LTIFR), known as MAQ (injuries
for every million hours worked) in Germany, is the key indicator used
to assess occupational safety within the LANXESS Group. In 2014,
the LTIFR was 2.3, compared with 3.2 in 2013.
Personnel expenses totaled €1,457 million in fiscal 2014 (2013:
€1,339 million). Wages and salaries, at €1,106 million (2013:
€1,006 million), accounted for the greater part of this figure. Social
security contributions were €202 million (2013: €194 million),
while pension plan expenses totaled €136 million (2013: €128 mil-
lion), and social assistance benefits came to €13 million (2013:
€11 million).

102 LANXESS Annual Report 2014
Employees by Region
%
19.7 EMEA (excluding Germany)
46.7 Germany
8.3 North America
8.8 Latin America
16.5 Asia-Pacific
Employees by Segment
%
31.2 Performance Polymers
16.9 Advanced Intermediates
33.9 Performance Chemicals
18.0 Other
Employees by Functional Area (Annual Average)
%
72.4 Production
11.8 Marketing
11.2 Administration
4.6 Research
HR strategy
Our entrepreneurial success is fundamentally based on our employees’
professionalism, implementation skills and sense of responsibility. Only
through their ongoing training and development – especially aimed
at strengthening their willingness to learn and change – can we safe-
guard our company’s ability to continuously adapt to complex market
challenges and sustainably improve LANXESS’s competitiveness.
The strategic development initiative in the HR function, which was
started in 2013, was integrated into the “Let’s LANXESS again”
program in 2014. Within the context of our realignment, leadership,
dialogue, organizational consulting and change management were
special areas of focus for the HR organization.
In addition to developing and implementing innovative concepts for
addressing the challenges resulting from demographic change, our
top long-term strategic human resources goal is to attract and cultivate
a range of talented employees for LANXESS. We aim to strengthen
our diversity, particularly in terms of age, national origin and gender.
As part of our Diversity & Inclusion initiative, we have set a goal for the
company: to voluntarily increase the proportion of women in middle
and upper management to around 20% by 2020. The figure currently
stands at around 15.3%.
Compensation report
Compensation of the Board of Management
The structure of the compensation system and the level of compensa-
tion for the members of the Board of Management are determined
by the Supervisory Board. The appropriateness of the compensation
is regularly reviewed. The criteria for determining the appropriate-
ness of the compensation for an individual Board of Management
member include, in particular, his duties, his personal performance,
the economic situation, and the success and sustainable growth of
the LANXESS Group. Consideration is also given to compensation
at comparable companies and the company’s overall compensation
structure, including as well the ratio between the compensation of
the Board of Management and that of LANXESS’s senior execu-
tives and the rest of the workforce, both overall and in terms of time.
The compensation structure is also designed to be competitive in
the international market for highly qualified executives and provide
the motivation to successfully work toward sustainable corporate
development.
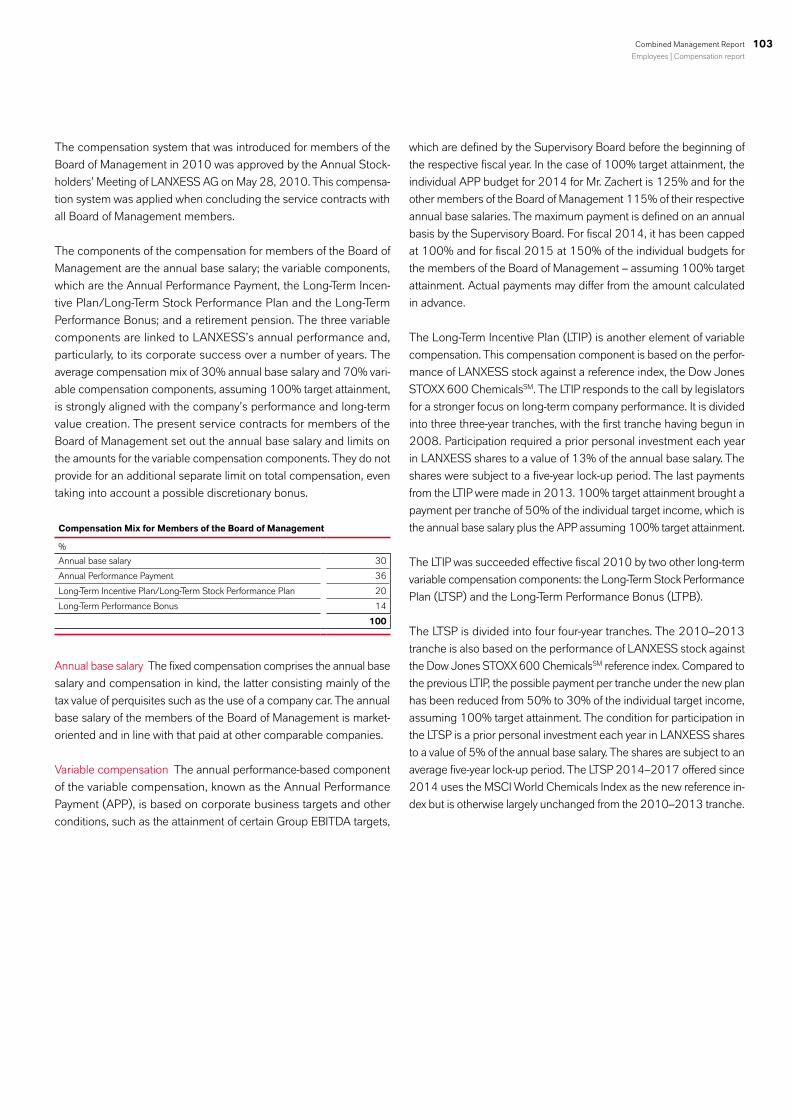
103Combined Management Report
Employees | Compensation report
The compensation system that was introduced for members of the
Board of Management in 2010 was approved by the Annual Stock-
holders’ Meeting of LANXESS AG on May 28, 2010. This compensa-
tion system was applied when concluding the service contracts with
all Board of Management members.
The components of the compensation for members of the Board of
Management are the annual base salary; the variable components,
which are the Annual Performance Payment, the Long-Term Incen-
tive Plan/Long-Term Stock Performance Plan and the Long-Term
Performance Bonus; and a retirement pension. The three variable
components are linked to LANXESS’s annual performance and,
particularly, to its corporate success over a number of years. The
average compensation mix of 30% annual base salary and 70% vari-
able compensation components, assuming 100% target attainment,
is strongly aligned with the company’s performance and long-term
value creation. The present service contracts for members of the
Board of Management set out the annual base salary and limits on
the amounts for the variable compensation components. They do not
provide for an additional separate limit on total compensation, even
taking into account a possible discretionary bonus.
Compensation Mix for Members of the Board of Management
%
Annual base salary 30
Annual Performance Payment 36
Long-Term Incentive Plan/Long-Term Stock Performance Plan 20
Long-Term Performance Bonus 14
100
Annual base salary The fixed compensation comprises the annual base
salary and compensation in kind, the latter consisting mainly of the
tax value of perquisites such as the use of a company car. The annual
base salary of the members of the Board of Management is market-
oriented and in line with that paid at other comparable companies.
Variable compensation The annual performance-based component
of the variable compensation, known as the Annual Performance
Payment (APP), is based on corporate business targets and other
conditions, such as the attainment of certain Group EBITDA targets,
which are defined by the Supervisory Board before the beginning of
the respective fiscal year. In the case of 100% target attainment, the
individual APP budget for 2014 for Mr. Zachert is 125% and for the
other members of the Board of Management 115% of their respective
annual base salaries. The maximum payment is defined on an annual
basis by the Supervisory Board. For fiscal 2014, it has been capped
at 100% and for fiscal 2015 at 150% of the individual budgets for
the members of the Board of Management – assuming 100% target
attainment. Actual payments may differ from the amount calculated
in advance.
The Long-Term Incentive Plan (LTIP) is another element of variable
compensation. This compensation component is based on the perfor-
mance of LANXESS stock against a reference index, the Dow Jones
STOXX 600 ChemicalsSM. The LTIP responds to the call by legislators
for a stronger focus on long-term company performance. It is divided
into three three-year tranches, with the first tranche having begun in
2008. Participation required a prior personal investment each year
in LANXESS shares to a value of 13% of the annual base salary. The
shares were subject to a five-year lock-up period. The last payments
from the LTIP were made in 2013. 100% target attainment brought a
payment per tranche of 50% of the individual target income, which is
the annual base salary plus the APP assuming 100% target attainment.
The LTIP was succeeded effective fiscal 2010 by two other long-term
variable compensation components: the Long-Term Stock Performance
Plan (LTSP) and the Long-Term Performance Bonus (LTPB).
The LTSP is divided into four four-year tranches. The 2010–2013
tranche is also based on the performance of LANXESS stock against
the Dow Jones STOXX 600 ChemicalsSM reference index. Compared to
the previous LTIP, the possible payment per tranche under the new plan
has been reduced from 50% to 30% of the individual target income,
assuming 100% target attainment. The condition for participation in
the LTSP is a prior personal investment each year in LANXESS shares
to a value of 5% of the annual base salary. The shares are subject to an
average five-year lock-up period. The LTSP 2014–2017 offered since
2014 uses the MSCI World Chemicals Index as the new reference in-
dex but is otherwise largely unchanged from the 2010–2013 tranche.

104 LANXESS Annual Report 2014
For more information, particularly regarding the valuation parameters
applied, please see Note [14] to the consolidated financial statements.
The personnel expenses for (2013: gain from) share-based com -
pensation in fiscal 2014 amounted to €100 thousand for Mr. Zachert,
€20 thousand (2013: €56 thousand) for Dr. Düttmann, €428 thousand
(2013: €223 thousand) for Dr. van Roessel, €564 thousand (2013:
€385 thousand) for Dr. Heitmann and €1,056 thousand (2013:
€223 thousand) for Dr. Breuers.
The LTPB, which is the third variable compensation component, is
likewise aligned with long-term corporate performance. It rewards
target attainment only after two successive fiscal years. The basis for
calculating the LTPB is the individual APP target attainment for the
fiscal years in question. The exact amount of the LTPB results from the
average individual APP target attainment for the two fiscal years. As-
suming an average APP target attainment of 100%, the LTPB amounts
to 45% of the annual base salary. Actual payments in 2015 and 2016
may differ from the amounts calculated in advance.
In 2014, Mr. Zachert received a one-time payment of €2,000 thousand
in partial recompense for the multi-year variable compensation origi-
nally agreed under his previous employment contract but not paid
out because of his move to LANXESS AG. His total compensation
Compensation of the Board of Management
€ ’000 Fixed compensation Variable compensation Payments from LTSP rights
year Annual base
salery
Compen-sation in
kind
Perfor-mance
bonus1)
Pay-ment for previous
years4)
LTPB (multi-
year)
Total cash compen-
sation
Number of rights
Fair values
Total
Serving members of the Board of Management as of December 31, 2014
Matthias Zachert (as of April 1, 2014)
2014 900 54 1,125 – 406 5) 2,485 810,000 689 3,174
2013 – – – – – – – – –
Dr. Bernhard Düttmann2014 650 60 673 – 263 7) 1,646 419,250 356 2,002
2013 613 57 346 2) – 218 6) 1,234 322,500 177 1,411
Dr. Rainier van Roessel2014 650 49 673 – 263 7) 1,635 419,250 356 1,991
2013 613 47 346 2) – 218 6) 1,224 322,500 177 1,401
Former members of the Board of Management as of December 31, 2014
Dr. Axel C. Heitmann (until February 21, 2014)
2014 157 (1) – – – 156 – – 156
2013 1,000 130 615 3) 34 323 6) 2,102 596,625 328 2,430
Dr. Werner Breuers (until August 5, 2014)
2014 387 34 238 – – 659 – – 659
2013 613 51 346 2) – 218 6) 1,228 322,500 177 1,405
Total2014 2,744 196 2,709 – 932 6,581 1,648,500 1,401 7,982
2013 2,839 285 1,653 34 977 5,788 1,564,125 859 6,647
1) Payment in 2014 and 2015, respectively2) The performance bonus was voluntarily reduced by 10% of the annual base salary.3) The performance bonus was voluntarily reduced by 6% of the annual base salary.4) Payment in 20135) Payment in 20146) Payment of 50% each in 2014 and 20157) Payment of 50% each in 2015 and 2016
therefore amounts to €5,174 thousand. The table shows the total
compensation of the other members of the Board of Management.
The aggregate compensation of the entire Board of Management
totaled €9,982 thousand (2013: €6,647 thousand), comprising
€4,940 thousand (2013: €3,124 thousand) in non-performance-
related components, €3,641 thousand (2103: €2,664 thousand)
in performance-related components and €1,401 thousand (2013:
€859 thousand) in components with a long-term incentive effect.
Retirement pensions On termination of their service contracts, the
members of the Board of Management receive benefits under the
company pension plan. These benefits are paid when the beneficiary
reaches age 60 or if the beneficiary is permanently unable to work.
They are paid to surviving dependents in the event of the beneficiary’s
death.
The pension plan for the members of the Board of Management is a
defined contribution plan stipulating a basic contribution to be made
by the company equal to 25% of the annual base salary and APP.
The maximum amount taken into account for calculating the APP
contribution is that due on 100% target attainment, irrespective of
the actual target attainment. Moreover, the members of the Board of
Management must themselves pay an amount from deferred compen-
sation amounting to 12.5% of the APP. The members of the Board of

105Combined Management Report
Compensation report
Management may increase their personal contribution to up to 25%
of the APP. From the date of entitlement, up to 30% of the accumu-
lated capital – including the interest thereon – may be converted to
a pension benefit. There are claims arising from provisions in place
before 2006 that are granted as vested rights to individual members
of the Board of Management. If the service contract ends before the
beneficiary reaches the age of 60, the company pays certain additional
benefits up to a defined ceiling.
LANXESS has established provisions for the future claims of Board of
Management members. The total service cost recognized under IFRS
accounting rules in the 2014 consolidated financial statements for this
purpose was €2,496 thousand (2013: €1,264 thousand). The pres-
ent value of the obligations for the members of the Board of Manage-
ment serving as of December 31, 2014 was €9,994 thousand (2013:
€21,740 thousand). Under IFRS accounting principles, the service
cost for pension entitlements earned in 2014 and the present value of
the obligations, including acquired rights, as of December 31, 2014
amounted, respectively, to €1,574 thousand and €1,993 thousand
for Mr. Zachert, €254 thousand and €2,095 thousand (2013:
€394 thousand and €1,584 thousand) for Dr. Düttmann, and
€148 thousand and €5,906 thousand (2013: €118 thousand
and €5,090 thousand) for Dr. van Roessel. The service cost for
Dr. Heitmann and Dr. Breuers for their service on the Board of Man-
agement in 2014 came to €366 thousand and €154 thousand,
respectively.
The net expense for pension entitlements recognized under HGB ac-
counting rules in the 2014 annual financial statements for this purpose
was €109 thousand (2013: €3,470 thousand). This amount includes
income in connection with pension entitlements for Dr. Heitmann and
Dr. Breuers of €1,851 thousand and €2 thousand, respectively. The
present value of the obligations for the members of the Board of Man-
agement serving as of December 31, 2014 was €7,787 thousand
(2013: €18,565 thousand). Under HGB accounting principles,
the present value of the obligations, including vested rights, for the
members of the Board of Management serving as of December 31,
2014 amounted, respectively, to €1,287 thousand for Mr. Zachert,
€1,644 thousand (2013: €1,348 thousand) for Dr. Düttmann, and
€4,856 thousand (2013: €4,477 thousand) for Dr. van Roessel.
As of December 31, 2014, obligations to former members of the Board
of Management totaled €27,921 thousand (2013: €11,578 thousand)
under IFRS accounting rules and €21,215 thousand (2013:
€9,734 thousand) under HGB accounting rules. In 2014, this total
contained obligations to Dr. Heitmann and Dr. Breuers for the first time.
Benefits associated with and following termination of service on the
Board of Management The members of the Board of Management
have indemnification rights should their service contracts be terminated
for defined reasons at the instigation of the company or in the event
of a material change of control over the company. The terms depend
on the respective circumstances and, regardless of the remaining
term of the service contract, include severance payments amounting
to up to two times the annual base salary or, in the event of a change
of control, three times the annual base salary, plus the APP and LTPB
assuming 100% target achievement and compensation pro rata tem-
poris of LTSP rights.
No additional benefits have been pledged to any member of the Board
of Management in the event of termination of their service.
Dr. Heitmann resigned from the Board of Management by mutual
agreement effective February 21, 2014, and left the company. Up
to this time, the contractually agreed benefits were granted and paid,
including the variable compensation for fiscal 2013 that had already
been earned. Dr. Heitmann waived further claims, i.e. to variable com-
pensation (APP and LTPB) pro rata, compensation for existing LTSP
rights or other severance payments.
Dr. Breuers will be leaving the company on expiration of his service
contract on May 31, 2015. He already resigned from the Board of
Management effective August 5, 2014. The contractually agreed
terms of his compensation shall remain applicable until he leaves
the company. At that time, existing LTSP rights shall be evaluated at
€1.00 per right and compensation paid pro rata, depending on the
length of the retention period that has already elapsed. This results in
an entitlement of €729 thousand. In addition, Dr. Breuers has been
granted a severance payment of €1,690 thousand comprising a tar-
get income, which is the annual base salary plus the APP and LTPB
assuming 100% target attainment.
In 2014, compensation of former members of the Board of Manage-
ment totaled €1,983 thousand (2013: €308 thousand).
Other benefits In 2014, no member of the Board of Management
received benefits or assurances of benefits from third parties in respect
of their duties as members of the Board of Management.
No loans were granted to members of the Board of Management in
fiscal 2014.
Individual compensation in line with the recommendations of the
German Corporate Governance Code
The following tables list the compensation, additional benefits and
allocations (payments) for 2013 and 2014, in line with the recom-
mendations of the German Corporate Governance Code. The variable
compensation components differ depending on the reference period.
The amounts of compensation shown also include the maximum and
minimum attainable compensation.

106 LANXESS Annual Report 2014
Compensation Granted (Serving Members of the Board of Management as of December 31, 2014)
€ ’000 Matthias ZachertChairman of the Board of Management
Appointed April 1, 2014
Dr. Bernhard DüttmannChief Financial Officer
Appointed April 1, 2011
Dr. Rainier van RoesselMember of the Board of Management
Appointed January 1, 2007
Target value2013
Target value2014
2014(min.)
2014(max.)
Target value2013
Target value2014
2014(min.)
2014(max.)
Target value2013
Target value2014
2014(min.)
2014(max.)
Annual base salary – 900 900 900 613 650 650 650 613 650 650 650
Compensation in kind – 54 54 54 57 60 60 60 47 49 49 49
Total – 954 954 954 670 710 710 710 660 699 699 699
Annual Performance Payment(APP) 2) – 1,125 1,125 1,125 748 748 0 748 748 748 0 748
Multi-year variable compensation – 1,365 406 2,431 538 649 0 1,059 538 649 0 1,059
LTPB (tranche 2012–2013) – – – – 68 – – – 68 – – –
LTPB (tranche 2013–2014) – 203 203 203 293 0 0 (146) 3) 293 0 0 (146) 3)
LTPB (tranche 2014–2015)2) – 473 203 608 0 293 0 366 0 293 0 366
LTSP 2010–2013 (tranche 2013) – – – – 177 – – – 177 – – –
LTSP 2014–2017 (tranche 2014) – 689 0 1,620 0 356 0 839 0 356 0 839
Total – 3,444 2,485 4,510 1,956 2,107 710 2,517 1,946 2,096 699 2,506
Service cost – 1,574 1,574 1,574 394 254 254 254 118 148 148 148
Total compensation 1) – 5,018 4,059 6,084 2,350 2,361 964 2,771 2,064 2,244 847 2,654
1) In 2014, Mr. Zachert also received a one-time payment of €2,000 thousand in partial recompense for the multi-year variable compensation originally agreed under his previous employment contract but not paid out because of his move to LANXESS AG.
2) Maximum target attainment for 2014 reduced from 200% to 100% 3) 2013 grant adjusted retrospectively to 100% for 2014
Allocations (Serving Members of the Board of Management as of December 31, 2014)
€ ’000 Matthias ZachertChairman of the Board of Management
Appointed April 1, 2014
Dr. Bernhard DüttmannChief Financial Officer
Appointed April 1, 2011
Dr. Rainier van RoesselMember of the Board of Management
Appointed January 1, 2007
2013 2014 2013 2014 2013 2014
Annual base salary – 900 613 650 613 650
Compensation in kind – 54 57 60 47 49
Total – 954 670 710 660 699
Annual Performance Payment(APP) 2) – 1,125 346 2) 673 346 2) 673
Multi-year variable compensation – 406 328 212 1,349 825
LTPB (tranche 2012–2013) – – 328 – 328 –
LTPB (tranche 2013–2014) – 203 – 212 – 212
LTPB (tranche 2014–2015) – 203 – – – –
LTIP 2008–2010 (tranche 2010) – – – – 1,021 –
LTSP 2010–2013 (tranche 2010) – – – – – 613
Total – 2,485 1,344 1,595 2,355 2,197
Service cost – 1,574 394 254 118 148
Total compensation 1) – 4,059 1,738 1,849 2,473 2,345
1) In 2014, Mr. Zachert also received a one-time payment of €2,000 thousand in partial recompense for the multi-year variable compensation originally agreed under his previous employment contract but not paid out because of his move to LANXESS AG.
2) The performance bonus (APP) was voluntarily reduced by 10% of the annual base salary.

107Combined Management Report
Compensation report
Compensation Granted (Former Members of the Board of Management as of December 31, 2014)
€ ’000 Dr. Axel C. HeitmannChairman of the Board of Management
Resigned February 21, 2014
Dr. Werner BreuersMember of the Board of Management
Resigned August 5, 2014
Target value2013
Target value2014
2014(min.)
2014(max.)
Target value2013
Target value2014
2014(min.)
2014(max.)
Annual base salary 1,000 157 157 157 613 387 387 387
Compensation in kind 130 (1) 3) (1) 3) (1) 3) 51 34 34 34
Total 1,130 156 156 156 664 421 421 421
Annual Performance Payment (APP) 1) 1,236 – – – 748 445 0 445
Multi-year variable compensation 880 – – – 538 87 0 (59)
LTPB (tranche 2012–2013) 68 – – – 68 – – –
LTPB (tranche 2013–2014) 484 – – – 293 0 0 (146) 2)
LTPB (tranche 2014–2015)1) 0 – – – 0 87 0 87
LTSP 2010–2013 (tranche 2013) 328 – – – 177 – – –
LTSP 2014–2017 (tranche 2014) 0 – – – 0 – – –
Total 3,246 156 156 156 1,950 953 421 807
Service cost 376 366 366 366 376 154 154 154
Total compensation 3,622 522 522 522 2,326 1,107 575 961
1) Maximum target attainment for 2014 reduced from 200% to 100% 2) 2013 grant adjusted retrospectively to 100% for 2014 3) Including correction for prior year
Allocations (Former Members of the Board of Management as of December 31, 2014)
€ ’000 Dr. Axel C. HeitmannChairman of the Board of Management
Resigned February 21, 2014
Dr. Werner BreuersMember of the Board of Management
Resigned August 5, 2014
2013 2014 2013 2014
Annual base salary 1,000 157 613 387
Compensation in kind 130 (1) 51 34
Total 1,130 156 664 421
Annual Performance Payment (APP) 1) 615 2) – 346 1) 238
Multi-year variable compensation 2,316 1,064 1,349 693
LTPB (tranche 2012–2013) 542 – 328 –
LTPB (tranche 2013–2014) – – – 80
LTPB (tranche 2014–2015) – – – –
LTIP 2008–2010 (tranche 2010) 1,774 – 1,021 –
LTSP 2010–2013 (tranche 2010) – 1,064 – 613
Total 4,061 1,220 2,359 1,352
Service cost 376 366 376 154
Total compensation 4,437 1,586 2,735 1,506
1) The performance bonus (APP) was voluntarily reduced by 10% of the annual base salary. 2) The performance bonus (APP) was voluntarily reduced by 6% of the annual base salary.

108 LANXESS Annual Report 2014
Compensation of the Supervisory Board
The compensation of the Supervisory Board is governed by Sec-
tion 12 of the company’s articles of association. The members of
the Supervisory Board of LANXESS AG receive fixed compensation
of €80 thousand per year. The Chairman of the Supervisory Board
receives three times, and the Vice Chairman one and a half times, this
amount. Serving as the chair or a member of Supervisory Board com-
mittees is compensated separately in accordance with the German
Corporate Governance Code. Supervisory Board members who belong
to a committee receive one half of the fixed compensation amount
in addition. The chair of the Audit Committee receives a further half.
Supervisory Board members who chair a committee other than the
Audit Committee receive a further quarter. However, no member may
receive in total more than three times the fixed compensation amount.
Supervisory Board members are reimbursed for their expenses in
addition and also receive an attendance allowance of €1.5 thousand
for each Supervisory Board meeting and each committee meeting
they attend, with the exception of meetings of the Committee formed
pursuant to Section 27, Paragraph 3 of the German Codetermination
Act and meetings of the Nominations Committee. With respect to their
membership on the supervisory boards of LANXESS Group companies,
the members of the Supervisory Board are remunerated only for their
service on the Supervisory Board of LANXESS Deutschland GmbH in
the amount of €5 thousand each.
The Supervisory Board members also receive a long-term incentive
based on the company’s performance during the standard term of an
individual’s membership on the Supervisory Board (five years). Unlike
the fixed compensation component, this variable compensation com-
ponent is not paid every year, but only once at the end of the standard
term of office. If a Supervisory Board member serves a shorter term,
the amount is prorated.
Payment of the variable compensation depends on how LANXESS’s
stock performs relative to the Dow Jones STOXX 600 ChemicalsSM
index during a member’s five-year term. The average price of LANXESS
stock and the average level of the index during the 90 trading days
prior to the Annual Stockholders’ Meeting at which the Supervisory
Board members were elected are each compared with the respective
average for the 90 trading days prior to the Annual Stockholders’ Meet-
ing at the conclusion of which the members’ terms end. The variable
compensation is only payable if the stock has outperformed the bench-
mark index. The exact amount of the variable compensation depends
on the extent to which the stock price outperformed the benchmark
index in the preceding five years. If LANXESS stock has outperformed
the Dow Jones STOXX 600 ChemicalsSM by up to ten percentage
points, the variable compensation amounts to €50 thousand for this
five-year period; if it has outperformed the index by between ten and
20 percentage points, €100 thousand is paid, and if the degree of out-
performance is greater than this, the compensation is €150 thousand.
No variable compensation was paid in fiscal 2014.
The expected compensation payable for the term of office that began
with the conclusion of the Annual Stockholders’ Meeting on May 28,
2010, and runs until the conclusion of the Annual Stockholders’ Meet-
ing that resolves to ratify the Supervisory Board members’ actions for
fiscal 2014 was valued at €0 thousand (2013: €1,800 thousand)
at December 31, 2014.
None of the members of the Supervisory Board received benefits for
services provided personally during the reporting period. No loans or
advances were granted to members of the Supervisory Board during
the reporting year.
The following table breaks down the compensation received by each
member of the Supervisory Board for their work on the Supervisory
Board in fiscal 2014.

109Combined Management Report
Compensation report
Compensation of the Supervisory Board1)
€ year Fixed compensation
LANXESS AG
Compensation as committee member
LANXESS AG
Attendance allowance
Fixed compensation
LANXESS Deutschland GmbH
Total
Dr. Rolf Stomberg, Chairman2014 240,000 0 22,500 5,000 267,500
2013 240,000 0 16,500 5,000 261,500
Ulrich Freese, Vice Chairman2014 120,000 40,000 21,000 5,000 186,000
2013 120,000 40,000 16,500 5,000 181,500
Axel Berndt 2014 80,000 40,000 18,000 5,000 143,000
2013 80,000 40,000 15,000 5,000 140,000
Dr. Rudolf Fauss(pro rata temporis until June 30, 2014)
2014 40,000 20,000 10,500 2,500 73,000
2013 80,000 40,000 15,000 5,000 140,000
Dr. Hans-Dieter Gerriets(pro rata temporis from July 1, 2014)
2014 40,000 20,000 7,500 2,500 70,000
2013 0 0 0 0 0
Dr. Friedrich Janssen2014 80,000 120,000 27,000 5,000 232,000
2013 80,000 96,548 18,000 5,000 199,548
Robert J. Koehler2014 80,000 40,000 21,000 5,000 146,000
2013 80,000 40,000 13,500 5,000 138,500
Rainer Laufs2014 80,000 40,000 18,000 5,000 143,000
2013 80,000 40,000 15,000 5,000 140,000
Thomas Meiers2014 80,000 40,000 18,000 5,000 143,000
2013 80,000 40,000 15,000 5,000 140,000
Dr. Ulrich Middelmann(deceased July 2, 2013)
2014 0 0 0 0 0
2013 40,110 20,055 7,500 2,507 70,172
Claudia Nemat(effective July 25, 2013)
2014 80,000 0 9,000 5,000 94,000
2013 35,068 0 3,000 2,192 40,260
Hans-Jürgen Schicker2014 80,000 40,000 22,500 5,000 147,500
2013 80,000 40,000 16,500 5,000 141,500
Gisela Seidel2014 80,000 40,000 22,500 5,000 147,500
2013 80,000 40,000 16,500 5,000 141,500
Theo H. Walthie 2014 80,000 40,000 18,000 5,000 143,000
2013 80,000 40,000 15,000 5,000 140,000
Total2014 1,160,000 480,000 235,500 60,000 1,935,500
2013 1,155,178 476,603 183,000 59,699 1,874,480
1) Figures exclude value-added tax

110 LANXESS Annual Report 2014
Report pursuant to Section 289, Paragraph 4 and Section 315, Paragraph 4 of the German Commercial Code
Pursuant to Section 289, Paragraph 4, Nos. 1 to 9 and Section 315,
Paragraph 4, Nos. 1 to 9 of the German Commercial Code, we hereby
make the following declarations:
1. The capital stock of LANXESS AG amounted to €91,522,936 as
of December 31, 2014, and is composed of 91,522,936 no-par
bearer shares. All shares carry the same rights and obligations.
One vote is granted per share, and profit is distributed per share.
The rights and obligations arising from the shares are governed
by the German Stock Corporation Act.
2. We are not aware of any restrictions affecting voting rights or the
transfer of shares. However, shares allocated under employee stock
plans are subject to a lock-up period before they may be sold.
3. We received no reports of direct and indirect equity investments in
the capital of LANXESS AG exceeding 10% of total voting rights.
4. No shares carry special rights granting control authority.
5. Employees hold a direct interest in the capital of LANXESS AG
through employee stock programs. There are no restrictions on
directly exercising the control rights arising from these shares.
6. Sections 84 and 85 of the German Stock Corporation Act and
Section 31 of the German Codetermination Act apply to the ap-
pointment and dismissal of Board of Management members. Under
the provisions of these sections, Board of Management members
are appointed by the Supervisory Board for a term not exceed-
ing five years. Such appointment may be renewed or the term
of office may be extended, provided that the term of each such
renewal or extension shall not exceed five years. Appointments
require a majority of at least two-thirds of the Supervisory Board
members’ votes. Section 6, Paragraph 1 of the articles of association
states that the Board of Management must consist of at least two
members. The number of members of the Board of Management
is determined by the Supervisory Board. The Supervisory Board
may appoint a chairman of the Board of Management and a vice
chairman of the Board of Management. Alternative members of
the Board of Management may be appointed. The Supervisory
Board may revoke the appointment of a member of the Board of
Management or the appointment of a member as Chairman of the
Board of Management for cause (Section 84, Paragraph 3 of the
German Stock Corporation Act).
Section 179 of the German Stock Corporation Act provides
that a resolution of the Stockholders’ Meeting is required for
any amendment to the articles of association. Pursuant to Sec-
tion 17, Paragraph 2 of the articles of association, resolutions of
the Stockholders’ Meeting require a simple majority of the votes
cast and, if a capital majority is required, a simple majority of the
capital stock, unless otherwise required by law or provided by the
articles of association. The articles of association contain no further
provisions in this regard. Section 10, Paragraph 9 of the articles of
association of LANXESS AG authorizes the Supervisory Board to
resolve on amendments relating solely to the form of the articles
of association.
7. The Board of Management of LANXESS AG has been authorized
to issue or repurchase shares as follows:
Own shares The Annual Stockholders’ Meeting of LANXESS AG on
May 18, 2011, authorized the Board of Management until May 17,
2016, to acquire shares in the company representing up to 10% of
the capital stock and to utilize them for any purpose permitted by law.
This authorization may also be utilized by subsidiaries of the company
or by third parties on behalf of the company or its subsidiaries. At the
discretion of the Board of Management, such shares may be acquired
either in the market or via a public tender offer. The Board of Manage-
ment is authorized to use them for any purpose permitted by law. In
particular, it can retire the shares, sell them other than via the stock
exchange or an offer to the stockholders, or transfer them against
consideration in kind for the purpose of acquiring companies, parts
of companies or equity interests in companies or in order to conclude
mergers. It is also authorized to use them to satisfy conversion rights
from convertible or warrant bonds and/or profit-participation rights or
income bonds (or a combination of these instruments) issued by the
company and to grant holders of convertible or warrant bonds and/
or profit-participation rights or income bonds (or a combination of
these instruments) issued by the company or its direct and indirect
affiliates that grant a conversion or option right or stipulate a conver-
sion or warrant obligation the number of shares for which such parties
would be entitled to subscribe upon exercise of their conversion or
option rights or fulfillment of the conversion or warrant obligation. The
stockholders shall not have subscription rights in such cases, except
where the shares are retired.
Conditional capital The Annual Stockholders’ Meeting of LANXESS AG
on May 18, 2011, authorized the Board of Management until May 17,
2016, with the approval of the Supervisory Board, to issue – in one or
more installments – warrant bonds and/or convertible bonds, profit-
participation rights and/or income bonds or a combination of these
instruments (collectively referred to as “bonds”) – as either registered
or bearer bonds – with a total nominal value of up to €2,000,000,000,
with or without limited maturity, and to grant option rights to, or im-
pose option obligations on, the holders or creditors of warrant bonds,
profit-participation rights with warrants or income bonds with warrants,
and/or to grant conversion rights to, or impose conversion obliga-
tions on, the holders or creditors of convertible bonds, convertible
profit-participation rights or convertible income bonds in respect of
bearer shares of the company representing a total pro rata increase
of up to €16,640,534 in the company’s capital stock on the terms

111Combined Management Report
Report pursuant to Section 289, Paragraph 4 and Section 315, Paragraph 4 of the German Commercial Code
to be defined for these bonds. Pursuant to Section 4, Paragraph 4 of
the articles of association, the capital stock of LANXESS AG is thus
conditionally increased by up to €16,640,534 (Conditional Capital).
The conditional capital increase shall only be implemented to the
extent that the holders or creditors of, or persons obligated to exer-
cise, option or conversion rights pertaining to bonds issued by the
company or a dependent company against cash contributions, or
issued against cash contributions and guaranteed by the company
or a dependent company, on or before May 17, 2016, on the basis
of the authorization granted to the Board of Management by the An-
nual Stockholders’ Meeting on May 18, 2011, exercise their option
or conversion rights or, where they are obligated to do so, fulfill such
obligation, or to the extent that the company elects to grant shares in
the company in place of all or part of the cash amount due for pay-
ment. The conditional capital increase shall not be implemented if
cash compensation is granted or if the company’s own shares, shares
issued out of authorized capital or shares in another listed company
are used to service the option or conversion rights.
When issuing bonds, the Board of Management is authorized, with
the approval of the Supervisory Board, to exclude subscription rights
in the following cases:
• for residual amounts resulting from the subscription ratio;
• insofar as is necessary to grant to holders of previously issued
option or conversion rights or obligations subscription rights
to the number of new shares to which they would be entitled
to subscribe as stockholders upon exercise of their option or
conversion rights or fulfillment of their option or conversion
obligations;
• in the case of issuance against cash contributions, if the issue
price is not significantly below the theoretical market value of the
bonds with option or conversion rights or conversion obligations,
as determined using accepted pricing models; if bonds are
issued by application of Section 186, Paragraph 3, Sentence 4
of the German Stock Corporation Act, in which case the issued
shares may not exceed a total of 10% of the capital stock either
at the time this authorization takes effect or at the time it is
utilized;
• if profit-participation rights or income bonds without option
or conversion rights or conversion obligations are vested with
bond-like characteristics.
Authorized Capital I and II Pursuant to Section 4, Paragraph 2 of
LANXESS AG’s articles of association, the Annual Stockholders’ Meet-
ing on May 23, 2013, authorized the Board of Management until
May 22, 2018, with the approval of the Supervisory Board, to increase
the capital stock on one or more occasions by issuing new no-par
shares against cash or contributions in kind up to a total amount of
€16,640,534 (Authorized Capital I). Stockholders are generally en-
titled to subscription rights when Authorized Capital is utilized. With
the approval of the Supervisory Board, subscription rights can be
excluded for residual amounts and in order to grant holders of war-
rants or convertible bonds issued by the company and its affiliates
subscription rights to the number of new shares for which such parties
would be entitled to subscribe upon exercise of their conversion or
option rights. Moreover, subscription rights can be excluded with the
approval of the Supervisory Board when the company’s capital stock is
increased against contributions in kind, particularly for the acquisition of
companies. Subscription rights can also be excluded with the approval
of the Supervisory Board in order to grant holders of convertible and/
or warrant bonds issued by the company or its affiliates new shares
upon exercise of their rights. Finally, subscription rights can also be
excluded with the approval of the Supervisory Board if the issue price
of the new shares is not significantly lower than the stock market price
at the time the issue price is fixed and the issued shares do not exceed
10% of the company’s capital stock. The upper limit of 10% of the
capital stock is reduced by the proportionate interest in the capital stock
which is attributable to those shares issued or sold during the term
of this authorization while excluding stockholders’ rights in direct or
analogous application of Section 186, Paragraph 3, Sentence 4 of the
German Stock Corporation Act. Further details are given in Section 4,
Paragraph 2 of the articles of association.
In addition, pursuant to Section 4, Paragraph 3 of LANXESS AG’s
articles of association, the Annual Stockholders’ Meeting on May 28,
2010, authorized the Board of Management until May 27, 2015, with
the approval of the Supervisory Board, to increase the company’s capital
stock on one or more occasions by issuing new no-par shares against
cash or contributions in kind up to a total amount of €8,320,268
(Authorized Capital II). In fiscal 2014, €8,320,266 of the original
Authorized Capital II of €16,640,534 was used to increase the share
capital. Stockholders are generally entitled to subscription rights when
Authorized Capital is utilized. With the approval of the Supervisory
Board, subscription rights can be excluded for residual amounts and
in order to grant holders of warrants or convertible bonds issued by
the company and its affiliates subscription rights to the number of new
shares for which such parties would be entitled to subscribe upon
exercise of their conversion or option rights. Moreover, subscription
rights can be excluded with the approval of the Supervisory Board
when the company’s capital stock is increased against contributions in
kind, particularly for the acquisition of companies. Subscription rights
can also be excluded with the approval of the Supervisory Board in
order to grant holders of convertible and/or warrant bonds issued by
the company or its affiliates new shares upon exercise of their rights.
Finally, subscription rights can also be excluded with the approval of
the Supervisory Board if the issue price of the new shares is not sig-
nificantly lower than the stock market price at the time the issue price
is fixed and the issued shares do not exceed 10% of the company’s
capital stock. The upper limit of 10% of the capital stock is reduced
by the proportionate interest in the capital stock which is attributable
to those shares issued or sold during the term of this authorization
while excluding stockholders’ rights in direct or analogous applica-
tion of Section 186, Paragraph 3, Sentence 4 of the German Stock
Corporation Act. Further details are given in Section 4, Paragraph 3
of the articles of association.

112 LANXESS Annual Report 2014
8. The service contracts between the company and the members
of the Board of Management of LANXESS AG contain provisions
regarding the potential departure of the members of the Board
of Management in the context of a change of control. These are
outlined in the compensation report in this combined manage-
ment report. Such agreements, albeit with different terms, also
exist between the company and members of the first level of upper
management. In addition, the terms for placing bonds under the
company’s existing debt issuance program may contain a change-
of-control clause which gives bondholders the right to redeem the
bond should certain events occur that affect its rating. This applies to
the €200 million Eurobond issued by LANXESS Finance B.V. in the
2009 fiscal year, the €500 million Eurobond issued by LANXESS
Finance B.V. in the 2011 fiscal year, and the €500 million Eurobond
issued by LANXESS Finance B.V. in November 2012. At the end
of fiscal 2014, it also applied to the CNH 500 million bond issued
by LANXESS Finance B.V. in February 2012 and redeemed in
February 2015. All of these bonds are guaranteed by LANXESS AG.
The terms for two private placements with a volume of €100 million
each made by LANXESS Finance B.V. under the debt issuance
program in the 2012 fiscal year likewise contain corresponding
change-of-control clauses. These placements are also guaranteed
by LANXESS AG. In fiscal 2011 and 2014, LANXESS Finance
B.V. and LANXESS AG signed agreements with an investment bank
for loans of €200 million and €150 million, respectively. The loan
agreement signed by LANXESS Finance B.V. was transferred to
LANXESS AG in January 2015. These agreements may be termi-
nated without notice or repayment of the outstanding loans may
be required if another company or person gains control of more
than 50% of LANXESS AG. The company also entered into an
agreement with a syndicate of banks concerning a credit facility that
is currently at €1,250 million. This agreement can also be termi-
nated without notice if another company or person takes control of
more than 50% of LANXESS AG. Furthermore, according to agree-
ments between the company and LANXESS Pension Trust e.V.,
the company is obligated to make considerable payments to
LANXESS Pension Trust e.V. in the event of a change of control.
9. The service contracts between the company and the members of
the Board of Management of LANXESS AG as well as between
the company and members of the first and second levels of upper
management of LANXESS AG contain compensation agreements
applicable in the event of a change of control, as such change is
more particularly described in the respective contracts.
Report pursuant to Section 289a of the German Commercial Code
The Board of Management and Supervisory Board have issued the
corporate governance declaration pursuant to Section 289a of the
German Commercial Code (HGB). This has been made available to
the stockholders and can be found on our website at www.lanxess.
com under Investor Relations/Corporate Governance.
Events after the end of the reporting period
No events of particular significance took place after December 31,
2014, that could be expected to have a material effect on the earnings,
asset and financial position of the LANXESS Group or LANXESS AG.
Report on risks, opportunities and future perspectives
The economic outlook below describes our expectations for economic
development. Following the report on future perspectives, we discuss
the opportunities and risks which may result in deviations from our
predictions. To give the informed reader a clearer view of the LANXESS
Group’s expected development, opportunities and risks, the opportu-
nities and risks will be described in a combined report starting in the
year under review. In addition, there have been changes to the form
and content of the reporting.
Economic outlook
General business conditions We expect global economic growth of
3.0% in 2015. This forecast is based on the assumption that there will
be no further escalation in the crises in Ukraine and the Middle East.
A sustained low oil price could result in slight additional stimulation
of the economy. In the NAFTA region, we are anticipating growth of
3.0%, which will likely be driven by private consumption. Especially
due to a slightly improved economic environment in Europe, we are
assuming expansion of 2.5% in the EMEA region. A lower oil price
and a stronger U.S. dollar are expected to have a positive effect, while
the crisis in Ukraine will likely continue to dampen development. We
are forecasting growth of 2.0% in Germany, facilitated by low unem-
ployment and an associated improvement in consumer sentiment. In
the Asia-Pacific region, we predict a gain of 4.5%. Growth in China
is expected to weaken somewhat because the country’s exports will
possibly no longer increase at the same pace as in the past.

113Combined Management Report
Report pursuant to Section 289, Paragraph 4 and Section 315, Paragraph 4 of the German Commercial Code | Report pursuant to Section 289a of the German Commercial Code |
Events after the end of the reporting period | Report on risks, opportunities and future perspectives
Expected Growth 2015
Change vs. prior year in real terms (%)1)
Gross domestic product
Chemical production
NAFTA 3.0 2.5
Latin America 2.5 3.0
EMEA 2.5 2.0
Germany 2.0 1.0
Asia-Pacific 4.5 6.0
World 3.0 4.0
1) Rounded to the nearest 0.5% Source: LANXESS estimates and IHS Global Insight
Future performance of the chemical industry We believe that the
chemical industry will continue to expand in 2015, with production
growing by 4.0%. The emerging economies are expected to again be
the focus of this growth. Driven by development in China, we expect
production expansion in the Asia-Pacific region to be 6.0% above
the prior year. In the NAFTA region, we forecast a gain of 2.5%. We
anticipate growth of 3.0% in Latin America and gains of 2.0% and
1.0% in the EMEA and Germany regions, respectively.
Future evolution of selling markets We expect the global tire industry
to increase production by 2.5% in 2015. In the Asia-Pacific region,
a gain of 4.5% is anticipated. China is likely to remain the driver for
growth, albeit at a slower pace. In our predictions for the industrial
nations, we expect rising imports to result in a production decline
of 1.5% in the EMEA region. The NAFTA region is predicted to see
positive development of 1.0%. Latin America may see growth of 3.5%
in the current year, while we expect Germany to post a gain of 1.0%.
We are assuming growth of 4.5% in automotive production in 2015.
With anticipated expansion of 5.0%, the Asia-Pacific region is likely
to remain the focus of development. We see the Chinese economic
region, the ASEAN countries and India as the growth drivers here.
In the NAFTA region, we predict expansion of 4.0%. The situation in
Latin America should stabilize and this region is expected to turn in
growth of 4.0% following the strong decline in 2014. In the EMEA
region, we are anticipating a gain of 2.5%, with production in Germany
expected to rise by 0.5%.
Growth of 5.0% is projected for the construction industry in 2015. In
our view, the Asia-Pacific region will remain one focus of this develop-
ment with a forecast increase of 5.5%. We are also anticipating an
improvement in the NAFTA region and assume growth of 8.0%. Latin
America is expected to post a gain of 4.0%. Due to a lack of momentum
in some eurozone countries and continued tensions in Eastern Europe,
we anticipate growth of 2.5% for the EMEA region. Germany should
continue its positive development for expansion of 4.0%.
The market for agrochemicals should remain robust and post growth of
3.0%. The NAFTA region is expected to see an increase of 2.0%. We
are also anticipating a recovery in Latin America with a gain of 3.0%.
In the EMEA region, growth of 3.0% is expected. Growth in Germany
is likely to weaken for an increase of 0.5%, whereas we anticipate
expansion of 3.5% in the Asia-Pacific region.
Expected Evolution of Major User Industries
Change vs. prior year in real terms (%)1)
Tires Auto-motive
Agro-chemi-
cals
Con-struc-tion
2015 2015 2015 2015
NAFTA 1.0 4.0 2.0 8.0
Latin America 3.5 4.0 3.0 4.0
EMEA (1.5) 2.5 3.0 2.5
Germany 1.0 0.5 0.5 4.0
Asia-Pacific 4.5 5.0 3.5 5.5
World 2.5 4.5 3.0 5.0
1) Rounded to the nearest 0.5% Source: LANXESS estimates and IHS Global Insight

114 LANXESS Annual Report 2014
Future perspectives
Expected earnings position of the LANXESS Group We anticipate
that our earnings in fiscal 2015 will be influenced by the persistently
challenging competitive environment, especially for our synthetic
rubber businesses. Additional effects will likely come from the ramp-
up costs for our new rubber plants and the associated idle capacity
costs. We do not expect any significant momentum for our business
development from the slight growth forecast for the global economy.
We assume the following development for the ten business units in
our three segments. The assumptions made for each segment are
based especially on the differing market and competitive situations
faced by the business units and the customer industries they serve.
For the Performance Polymers segment, we expect a slight improve-
ment in demand from the main customer industries – automotive
and tires – in 2015 compared with the previous year. We believe that
the tire classification and labeling regulations and initiatives in vari-
ous countries will slightly support demand for this segment’s rubber
products. However, in those business units which produce synthetic
rubbers – especially EPDM and butyl rubber – we are anticipating
continued price pressure due to additional capacities. In 2015, we
predict further positive development of our business with plastics for
lightweight construction applications in the automotive industry. The
U.S. dollar is the main currency for our rubber businesses and we
expect positive effects from its continued strength. For the current
year, this segment is expected to incur ramp-up costs totaling around
€25 million for the new Nd-PBR rubber plant in Singapore and the
EPDM rubber plant in Changzhou, China. Also for the current year,
we are anticipating idle costs of some €50 million for the additional
capacities of these two new plants.
In 2015, we expect continued good demand from key customer
industries for the Advanced Intermediates segment. According to
current market forecasts, growth for agrochemical products is likely
to be rather restrained. In the Saltigo business unit, we anticipate a
slight project-related decline in our fine chemicals and pharmaceutical
products businesses.
We expect a slight improvement to the demand situation for the
Performance Chemicals segment in 2015. Our business with inor-
ganic pigments for the construction industry should develop well, as
should our leather chemicals business although there we anticipate
a burden from the continued price pressure for chrome ore products.
The additives business, which has close links with the tire industry,
should see stable development overall. However, we anticipate chal-
lenges for our rubber additives in the Chinese market. We anticipate
ongoing strong demand for the products of our Liquid Purification
Technologies business unit.
In 2014, against the background of the continuing challenges facing
LANXESS, we initiated the three-phase “Let’s LANXESS again” pro-
gram for the realignment of our company with the aim of sustainably
strengthening our competitiveness. In connection with the first phase
of the program, aimed at increasing the efficiency of business and
administrative structures, we have planned total exceptional charges
with no impact on EBITDA of €150 million through 2016. Of these
exceptional charges, around €110 million were incurred in the report-
ing year and some €40 million are expected in 2015. As decisions are
taken, we will be giving further details of the second and third phases
of the program during 2015, although we already initiated the first
measures of these phases in 2014. The cost reductions expected
from the realignment initiated in the reporting year are expected to
have a positive effect on our operating result in 2015.
In the current year, higher costs are also to be expected as a result
of the increase in wages and salaries associated with the pending
negotiations on the collective bargaining agreement in Germany.
Against the background of the anticipated influences, which are
expected to have a largely offsetting effect on the individual segments,
we predict EBITDA pre exceptionals for the full year 2015 to be just
about on a comparable level to 2014. This takes account of the ex-
pected cost savings from the realignment initiated in the reporting year.
In 2015, we are predicting the continuing volatile development of raw
material costs, which were at a comparatively low level at the end of
the year under review. We anticipate an increase in procurement costs
against the second half of 2014, especially for the petrochemical raw
materials that are crucial to the synthetic rubber products of our Per-
formance Polymers segment. The starting point for this development
is the comparatively low cost level at year end 2014.
The U.S. dollar will remain the key currency for our businesses. We
expect this currency to remain volatile against the euro in 2015 and
anticipate that it will be slightly stronger than in 2014.
The effective tax rate for the LANXESS Group is significantly influenced
by the regional distribution of its earnings. For the medium term, af-
ter conclusion of its realignment, LANXESS is targeting a tax rate of
between 22% and 25%. Given the persistently challenging business
situation and our ongoing realignment program, we expect a tax rate
of more than 30% for the current fiscal year.

115Combined Management Report
Report on risks, opportunities and future perspectives
Expected financial position of the LANXESS Group
Liquidity situation LANXESS will continue to pursue a forward-looking
and conservative financial policy in the current year. With more than
€2.0 billion in cash and undrawn credit lines, unchanged at year
end 2014 compared with 2013 and as described under “Financial
condition,” we have a very good liquidity and financing position which
will enable us, for example, to safeguard our entrepreneurial flexibility
and implement our ongoing realignment program.
Capital expenditures In the future, our capital expenditures will be in-
creasingly focused on the maintenance of existing production facilities
as well as efficiency improvements and the expansion of existing plants.
Following the start-up of our two large Nd-PBR and EPDM rubber
plants in Asia in 2015, we have no further plans for major investments
in the construction of new production facilities in the coming years.
We will successively reduce our capital expenditures in the coming
years and expect cash outflows for capital expenditures of around
€450 million in 2015. A further reduction to between €400 million
and €450 million may possibly be envisaged for 2016. In this way,
we are seeking to achieve a balanced investment cycle to ensure our
financial headroom.
Financing measures LANXESS is in a good position due to the long-
term nature of its financing since it ensures the financing for planned
capital expenditures and the realignment program it has initiated by
future cash flows, available liquidity and existing lines of credit. The
same also applies to the expected dividend payment. Other than for the
redemption of a CNH 500 million bond in February 2015, there will be
no further significant need for refinancing in fiscal 2015. In addition,
LANXESS will continue its efforts to secure long-term funding as part
of a conservative financing policy by further diversifying its financing
sources and implementing forward-looking financing measures.
Expected earnings position of LANXESS AG In the current fiscal year,
we expect the earnings position of LANXESS AG to be substantially
better than in 2014. It is influenced by the administration expenses
the company incurs in performing its tasks as a management holding
company and by the financial result, especially the net interest position
and the balance of income and losses from investments in affiliated
companies. We expect the net interest position to be negative on
account of the financing structure. The balance of income and losses
from investments in affiliated companies and the corresponding ability
of LANXESS AG to pay a dividend will depend in large measure on
the profit transfers and dividends paid by the other companies of the
LANXESS Group. We will maintain our consistent dividend policy and
expect LANXESS AG to report a distributable profit that will enable
our stockholders to adequately participate in the LANXESS Group’s
earnings in the coming year.
Dividend policy LANXESS follows a consistent dividend policy. As
in the past, our future dividend proposals will take into account the
business performance of the relevant fiscal year, the Group’s financing
goals and development trends in the new fiscal year.
Summary of the Group’s projected performance LANXESS remains
well positioned with its product portfolio in the relevant customer in-
dustries and key global markets and with its strategic alignment with
the world’s most important trends.
In 2014, in light of the structural challenges on the supply side,
which are impacting our synthetic rubber businesses in particular, we
launched a comprehensive three-phase global realignment program,
which we will continue to systematically implement in the current year.
This program is aimed at sustainably increasing the competitiveness
of the business and administrative structure, operational competitive-
ness and the competitiveness of the business portfolio. We view our
realignment as a key element of our activities in the current fiscal
year. Although our measures have already yielded cost savings in
support of our business, our development in 2015 will continue to
be primarily shaped by the challenging environment for our synthetic
rubber businesses.
We do not expect any significant momentum for our business develop-
ment from the slight forecast growth in the global economy.
Following on from the comparatively low cost levels at year end 2014,
we believe that the costs of petrochemical raw materials, which are
crucial to our rubber businesses, will increase compared to the second
half of 2014.
We predict EBITDA pre exceptionals for the full year 2015 to be just
about on a comparable level to 2014.
Opportunity and risk report
Opportunity and risk management system Our success is significantly
dependent on identifying opportunities and risks in our business activi-
ties and actively managing them. The goal of the opportunity and risk
management system is to safeguard the company’s existence for the
long term and ensure its successful future development by identifying
opportunities and risks and, depending on their nature, appropriately
considering these in strategic and operational decisions. Opportunities
and risks are understood as potential future trends or events that might
result in either positive or negative departures from forecasts or goals.
Our management system is based both on internal organizational work-
flows that are managed by way of control and monitoring mechanisms
and on early warning systems that are used to closely observe changes
in external conditions and systematically implement the appropriate
measures. This approach applies equally to opportunities and risks.

116 LANXESS Annual Report 2014
Like all methods intended for dealing with business risk, this system
does not offer absolute protection. However, it does serve to prevent
business risks from having a material impact on the company with a
sufficient degree of certainty.
Structural basis The principles of our opportunity and risk management
system are set forth in a Group directive. The management system,
which uses the COSO model as the enterprise risk management frame-
work, comprises many different elements that are incorporated into
business processes through the company’s organizational structure,
its workflows, its planning, reporting and communication systems,
and a set of detailed management policies and technical standards.
The system is based on an integration concept. In other words, the
early identification of opportunities and risks is an integral part of the
management system and not the object of a separate organizational
structure. The management of opportunities and risks is therefore a pri-
mary duty of the heads of all business units, as well as of those people
in Group companies who hold process and project responsibility.
This is why our opportunity and risk management is based on clearly
defined business processes, the precise assignment of responsibilities
throughout the Group, and reporting systems that ensure the timely
provision of the information required for decision-making to the Board
of Management or other management levels.
Roles of key organizational units At LANXESS, the business units
each conduct their own operations, for which they have global profit
responsibility. Group functions and service companies support the busi-
ness units by providing financial, legal, technical and other centralized
services. Complementing this global alignment of the business units
and group functions, the country organizations ensure the required
proximity to markets and the necessary organizational infrastructure.
In line with this division of duties, we have assigned responsibility to
risk owners for the following:
• identification and assessment of opportunities and risks;
• implementation of control measures (measures taken to exploit
or enhance opportunities and to avoid or minimize risks);
• monitoring the development of opportunities and risks (e.g. on
the basis of performance indicators and, perhaps also, early
warning indicators);
• risk mitigation (measures to minimize damage upon occurrence
of a risk event);
• communication of the key opportunities and risks to the manage-
ment committees of the business units and group functions.
The Corporate Controlling Group Function is responsible for collecting
and aggregating key information across the Group at the following
intervals:
• twice per year during the intrayear forecasting process;
• once per year as part of the budget and planning process for
the subsequent year and the medium-term forecast horizon.
The Corporate Development Group Function systematically analyzes
and measures significant and strategic opportunities and risks with
the goal of ensuring that the Group is pursuing the correct long-term
strategy.
Transactions particularly for the transfer of financial but also operat-
ing risk (hedging transactions or insurance) are managed centrally
by the Treasury Group Function. This is explained in more detail in
“Opportunities and risks of future development.”
Due to the highly integrated nature of our general business processes,
we have specialized committees composed of representatives of the
business units and group functions who deal with issues concerning
the Group’s opportunities and risks. This enables us to react quickly
and flexibly to changing situations and their influence on the company.
In addition, a Risk Committee chaired by the Chief Financial Officer
analyzes the material risks and their development for their potential
impact on the company as a whole. The Risk Committee brings to-
gether representatives from selected group functions to analyze existing
measures to counter risks, initiate additional measures, define Group-
wide risk management standards and guidelines and, if necessary,
initiate further analyses of individual opportunities and risks that have
been identified.
The duty to report opportunities and risks to the Corporate Control-
ling Group Function is based on the anticipated impact on Group
net income or EBITDA pre exceptionals. All opportunities and risks
must be reported if their anticipated impact is more than €1 million
following the implementation of countermeasures. In addition, those
risks must be reported which have an anticipated impact that was
reduced by more than €10 million through the implementation of
countermeasures. These thresholds guarantee that the information
gathered about opportunities and risks is comprehensive and that the
collection of information is not just limited to material risks or risks that
could jeopardize the future of the company as a going concern. The
Corporate Controlling Group Function centrally determines the top
opportunities and risks only after the information has been gathered.

117Combined Management Report
Report on risks, opportunities and future perspectives
There is also provision for immediate internal reporting on specific
risk issues such as unexpected operational events with an impact of
more than €10 million after the implementation of countermeasures.
In 2014, there was no cause for immediate reporting of this kind.
The reported opportunities and risks are collected in a central database
and regularly analyzed for the Board of Management and Supervisory
Board. This ensures that when new opportunities and risks arise or
when existing ones change substantially, the necessary information
can be communicated in a timely manner all the way to the Board of
Management and therefore also be specifically integrated into the
general management of the company.
Opportunity and risk assessment Opportunity and risk management
is integrated into the planning and forecasting process and identifies
opportunities and risks as potential deviations from planned or forecast
EBITDA pre exceptionals or Group net income.
Depending on the type of opportunity or risk, different calculation
methods are applied in their assessment. Distribution-based oppor-
tunities and risks are described by scenario-based fluctuations in
planning parameters such as exchange rates, raw material prices,
energy prices and economic development assumptions. Changes
in these variables may result in either positive or negative deviations
from planned or forecast figures.
Event-based opportunities and risks (such as the failure of a supplier
or the occurrence of an insured event) that would only impact earn-
ings if they actually occur are evaluated on the basis of the expected
probability of their occurrence and the predicted effect on EBITDA
pre exceptionals or Group net income.
Significance of the Group-wide planning process Corporate planning
is a core element of our opportunity and risk management. Events with
a high probability of occurrence flow directly into the planning process.
The processes for corporate planning and intrayear forecasting as well
as the corresponding analyses and suggestions for action are steered
by the Corporate Controlling Group Function, which works closely in
this regard with the business units. Certain Board of Management
meetings are dedicated to discussing and adopting corporate plan-
ning outcomes, including the associated opportunities and risks. We
monitor, and if necessary adjust, the annual budget in any given fiscal
year by regularly updating our expectations for business development.
Compliance as an integral component Risk management also includes
preventing illegal conduct by our employees. To this end, we obtain
extensive legal advice concerning business transactions and obligate
employees by means of our compliance code to observe the law and
to act responsibly. The compliance code is part of a comprehensive
compliance management system that has been structured in accor-
dance with the principles of an internationally recognized framework
for enterprise risk management (COSO). A Compliance Committee
promotes and monitors adherence to our compliance guidelines. Its
work is supported by compliance officers who have been appointed
for each country in which we have a subsidiary. The Compliance Com-
mittee is chaired by a Group Compliance Officer, who reports directly
and regularly to the Board of Management.
(Group) accounting aspects of the internal control and risk manage-
ment system The aspects of the internal control and risk management
system relating to the (Group) accounting process include the prin-
ciples, procedures and measures required to ensure the effectiveness,
efficiency and propriety of the company’s accounting, and compliance
with applicable legal regulations. To this end, clear organizational, con-
trol and monitoring structures have been established. The distinctive
features of the chemical industry and the risk management tools used
regularly by LANXESS in this regard are taken into account. In addition
to the (Group) accounting process in its narrower sense, this also in-
cludes the aforementioned structured budget and forecasting process,
and extensive contract management. However, the effectiveness and
reliability of the internal control and risk management system can be
restricted by discretionary decisions, criminal acts, faulty controls or
other circumstances. Thus, even if the system components used are
applied Group-wide, the correct and timely recording of (Group) ac-
counting issues cannot be guaranteed with full assurance.
The Accounting Group Function, which reports to the Chief Financial
Officer, is responsible for the (Group) accounting process and therefore
for preparing the annual financial statements of LANXESS AG and
the consolidated financial statements of the LANXESS Group. It is
also responsible for ensuring the uniform preparation of the single-
entity financial statements of the subsidiaries that are included in
the consolidated financial statements. The Board of Management
prepares the annual financial statements and the consolidated finan-
cial statements, which are then forwarded to the Supervisory Board’s
Audit Committee without delay. Upon recommendation by the Audit
Committee, the annual financial statements and the consolidated
financial statements are adopted and approved by the Supervisory
Board at its financial statements meeting. The Supervisory Board, and
especially its Audit Committee, deal with major questions relating to
LANXESS’s accounting, opportunity and risk management, the audit
mandate and the areas of focus for the auditor’s audit of the annual
financial statements.

118 LANXESS Annual Report 2014
Consolidated interim financial statements are prepared each quar-
ter. The condensed consolidated half-year financial statements are
reviewed, while the annual financial statements and the consolidated
financial statements are subjected to a full audit by the auditor of the
company’s annual financial statements and consolidated financial
statements.
LANXESS AG’s accounting in compliance with the German Com-
mercial Code is based on a structured process with appropriate or-
ganizational structures and workflows, including the related working
instructions. In addition to the segregation of duties, the dual-control
principle and continual plausibility testing serve as fundamental moni-
toring tools during the financial statement preparation process. On the
IT side, the accounting process is supplemented by an integrated IT
system that is based largely on off-the-shelf software and is protected
by security measures against unauthorized access. The correctness
of the automatically generated postings and the master data required
for them is regularly reviewed. Manual postings are based on a sys-
tematic voucher system, documented to the necessary extent and
verified downstream.
The foundation for uniform and IFRS-compliant consolidated financial
reporting at LANXESS is the Group Financial Statements Guideline.
This governs the way the provisions of the International Financial Re-
porting Standards (IFRS) applicable to the Group are applied by the
subsidiaries as reporting entities. Moreover, the guideline also defines
the chart of accounts that is binding throughout the Group. On the IT
side, the guideline is supplemented by a uniform, Group-wide delivery
and consolidation system that is based largely on off-the-shelf software
and is protected by security measures against unauthorized access.
By controlling and monitoring LANXESS’s (Group) accounting pro-
cess, we ensure that generally accepted accounting practices in line
with the applicable laws and standards are applied and guarantee the
reliability of our financial reporting. The (Group) accounting-related
internal control system we use is based on generally accepted stan-
dards (COSO model). There were no material changes to this system
during the period under review. Corresponding standards also apply
to the single-entity financial statements of the subsidiaries.
Preparation of the consolidated financial statements is based on a
detailed process that includes specifying a financial statement cal-
endar containing deadlines for the delivery of certain data. A further
component is regular reviews of the correctness and completeness
of the scope of consolidation. The principle of the segregation of
duties as expressed in structured authorization and approval proce-
dures and the dual-control principle as well as continual plausibility
testing on data is applied end-to-end throughout the preparation and
consolidation process.
For the consolidated financial statements, all subsidiaries subject to
reporting requirements transmit their Group reporting data using the
above-mentioned consolidation system. Validation rules integrated
into the system ensure that the data reported by the subsidiaries are
consistent at the time of delivery. The ultimate responsibility for ensuring
the correctness of the reported data content lies with the accounting
departments of the subsidiaries. The Corporate Accounting Depart-
ment within the Accounting Group Function conducts more detailed
testing of the correctness of the data content. To this end, the depart-
ment evaluates standardized reports in which the companies explain
material facts relevant to financial reporting. After the process-based
controls have been applied, consolidation including currency transla-
tion is carried out in the same system, without additional interfaces,
utilizing both automated and manual procedures. The correctness of
the automated consolidation steps and of the master data necessary
for this purpose is reviewed regularly. Consolidation information that
must be entered manually is posted separately, documented to the
extent required and verified downstream. This is supplemented by
validation rules that are integrated into the system.
Regular coordination with other financial group functions, particu-
larly the Treasury, Tax & Trade Compliance and Corporate Controlling
group functions, assists the financial reporting process. A continual
exchange of information with the operating business units and other
group functions makes it possible for the Accounting Group Func-
tion to identify and deal with issues arising outside of accounting
processes. These include litigation risks, projections for impairment
testing and special contractual agreements with suppliers or custom-
ers. In addition, third-party service providers are consulted on special
issues, particularly relating to the valuation of pensions and other
post-employment benefits.
Monitoring of risk management system and internal control system
(ICS) LANXESS’s Internal Auditing Department within the Legal & Com-
pliance Group Function is tasked with overseeing whether the internal
control and monitoring system is functioning properly and whether
organizational safeguards are being observed. The planning of audits
(selection of audit subjects) and the audit methods applied are corre-
spondingly aligned with risks. To assess the effectiveness of the ICS, an
annual self-assessment is also carried out in major Group companies,
operating units and group functions. In addition, the early warning system
is evaluated by the external auditor as part of the audit of the consolidated
and annual financial statements. The Supervisory Board also exercises
control functions, including regular monitoring of the efficiency of the
management systems described above by the full Supervisory Board
and by its Audit Committee. The Audit Committee reviews reports about
the Compliance Committee’s activities and findings, the work of the
Internal Auditing Department, and the status of the risk management
and internal control system.

119Combined Management Report
Report on risks, opportunities and future perspectives
Opportunities and risks of future development Full identification of the
LANXESS Group’s opportunities and risks is performed on the basis
of a catalog of categories, which are summarized in the table below:
Categories
Procurement markets
Human resources
Plant operations and hazards
Corporate strategy
Sales markets
Finance
Legal, regulatory and political environment
Subsequent reporting is based on a planning horizon of one year.
Procurement markets On the procurement side, the principal oppor-
tunities and risks lie in the high volatility of raw material and energy
prices. An increase or decrease in the price of the materials we use
directly results in higher or lower production costs. If prices decrease,
write-downs may have to be recognized on inventories. In addition,
changes in raw material prices result in higher or lower selling prices
– either immediately or after a delay. We mitigate situations like this
by following a sensible inventory and procurement policy. Most of the
company’s raw material and energy needs are met by long-term sup-
ply contracts and contracts containing price escalation clauses. Many
agreements with customers also contain price escalation clauses. We
also have the option of hedging this risk via derivatives transactions
if liquid futures markets are available for hedging raw material and
energy price risks (see also “Financial markets”). Additionally, we are
constantly looking for ways to use our resources more efficiently so
that we can offset higher costs by raising productivity. The volatility
of raw material prices, especially for our key raw material butadiene,
impacts our Performance Polymers segment in particular.
To guard against possible supply bottlenecks due to factors such as
the failure of a supplier or of an upstream operation at a networked
site, we pursue an appropriate inventory strategy and line up alterna-
tive sources of supply.
Human resources The risk of industrial actions resulting from disputes
in connection with negotiations concerning future collective pay agree-
ments or associated with restructuring measures cannot be ruled out.
We also face increases in our personnel expenses because of future
wage increases. Such an increase in the cost of human resources can
be just as detrimental to earnings as increases in raw material prices,
as described above, but in the case of human resources we cannot
hedge the risk in futures markets or pass it on to our customers. We
counter this risk by fostering open communication with our employees
and their representatives in a culture of active labor relations. The
employee representatives in various countries have been consulted
especially with regard to our “Let’s LANXESS again” program. Continu-
ous use is made of existing dialogue platforms such as the European
Forum, which brings together the works councils in Europe. We also
actively seek dialogue with the representatives of our employees, the
trade unions and other interest groups in the other regions in which
we operate.
Our employees’ expert knowledge of internal processes and issues
relating to their areas of specialization is a critical factor in the efficiency
of our business operations. We take various approaches to mitigate
the risk of losing this expertise and to increase our employees’ loyalty
to the company, including attractive compensation models, challeng-
ing jobs and international career options. We continue to invest in the
next generation of employees by increasing the number of training
opportunities in Germany. We have also launched and expanded re-
gional internship, trainee and loyalty programs in, for example, North
America, Brazil, India and China as well as Germany. In some regions
and countries, including China, we continue to go into schools in
search of interesting talents we can develop. In Germany, our pre-
school education program aims to arouse the interest of the youngest
children in scientific phenomena.
The growing lack particularly of skilled employees in our global markets
is becoming tangible in individual cases. However, this effect has been
mitigated by the “Let’s LANXESS again” program launched in the third
quarter of 2014, which in the first instance substantially reduced our
specific need for skilled employees in the reporting period. However,
a forward-looking and sustainable HR policy will remain important,
which is evidenced by our regular HR development conferences. In
line with our needs, we are expanding our cooperations with research
institutes, universities, colleges and high schools in Germany, as well
as with public-sector entities both in Germany and other key target
markets. At many events and conferences around the world, we have
positioned our company as an attractive employer and continue to seek

120 LANXESS Annual Report 2014
early contact with highly talented young people. In Germany, where we
have the largest headcount, we have established a LANXESS program
to provide both financial and expert support for undergraduate and
postgraduate students. We also have a loyalty program for particularly
outstanding interns. Both these programs focus on the natural and
engineering sciences. Similar programs for young talents are being
established in other major regions, where they always take account
of local requirements. All these measures are an expression of our dif-
ferentiated employer branding approach, which we will use to sustain
our positive employer image and expand this as required even during
our company’s realignment phase.
In preparing the “Let’s LANXESS again” program, we identified mis-
sion-critical activities with a view to offering the relevant knowledge
holders a perspective within the LANXESS Group or to retaining their
knowledge for the company by means of succession planning and
know-how transfer.
There are a number of other HR risks which, because of their long-
term nature, will have virtually no impact on the planned EBITDA
pre exceptionals for fiscal 2015. These risks include in particular
demographic change, which we actively manage. In Germany, in
order to ensure continued access to a highly skilled workforce, we
have been implementing a comprehensive package of measures
known as “XCare” since 2009. Interdisciplinary working groups are
collaborating closely with employee representatives at LANXESS to
develop innovative concepts to preempt and actively address shifts
resulting from demographic change. We have also initiated comparable
programs in other regions.
Plant operations and hazards A lack of plant availability and disruptions
of plant and process safety can make it impossible for us to meet pro-
duction targets and adequately service existing demand, resulting in a
loss of marginal income. We use a comprehensive range of measures
to counter this scenario. These include proactive facility maintenance,
regular compliance checks, the preparation of risk assessments and
systematic training of employees to improve standards and safety. We
also counter the risk of unplanned production stoppages by manufac-
turing certain products at various sites worldwide.
Although LANXESS applies high technical and safety standards to the
construction, operation and maintenance of production facilities, inter-
ruptions in operations, including those due to external factors, such as
natural disasters or terrorism, cannot be ruled out. These can lead to
explosions, the release of materials hazardous to health, or accidents
in which people, property or the environment are harmed. In addition
to systematically monitoring compliance with quality standards in order
to avoid such stoppages and accidents, we are also insured against
the resulting damage to the extent usual in the industry.
LANXESS’s product portfolio includes substances that are classified
as hazardous to health. In order to prevent possible harm to health,
we systematically test the properties of our products and draw our
customers’ attention to the risks associated with their use. We also
carry product liability insurance that is customary in our industry.
In line with LANXESS’s forward-looking approach, product monitor-
ing enables us to identify and evaluate potential hazards associated
with our product portfolio and initiate suitable measures if relevance
is established.
Our information technology (IT) supports LANXESS’s business
activities worldwide, including the processes from receiving an order
to receiving payment and from placing an order to paying a vendor.
It is important that the people who use the systems receive correct
and meaningful information when they need it. We support this by
developing a uniform, integrated system architecture and investing
in the expansion of IT services worldwide.
The operation and use of IT systems entails risks. For example, net-
works or systems may fail, or data and information may be compro-
mised or destroyed because of operator and programming errors or
external factors. In particular, we are observing a growing number
of threats to our IT infrastructure resulting from outside attack. All of
these can cause serious business interruptions. To mitigate such risks,
we invest in suitable data protection systems designed to prevent the
loss of data and information. Various security and monitoring tools
and access restriction and authorization systems are used to ensure
the integrity, confidentiality and availability of data and information
and the trouble-free operation of systems. With a view to improving
the security of our IT infrastructure, we are evaluating existing security
measures for their suitability in defending against current attack sce-
narios. Where necessary, these measures will be upgraded. Additional
security systems are being established worldwide as defense against
new and specific threats.
Corporate strategy We actively pursue the strategic optimization of
the enterprise. Our efforts include ongoing efficiency enhancement,
strengthening of core businesses, active portfolio management and
proactive participation in industry consolidation through partnerships,
divestments and acquisitions. Further information can be found in the
“Strategy” section of this combined management report.
The success of the decisions associated with these efforts is naturally
subject to forecasting risk in respect of predicting future (market) de-
velopments and making assumptions about the feasibility of planned
measures. For example, the entry into or exit from a business segment
could be based on profitability or growth expectations that prove to
be unrealistic over time. We mitigate this risk by carefully and system-
atically analyzing the information that is relevant to decision-making.
During this process, the business units affected and the Board of
Management receive support from departments with the requisite
expertise and, if necessary, from external consultants.

121Combined Management Report
Report on risks, opportunities and future perspectives
The LANXESS product portfolio is systematically aligned with key
global trends that promise continuous growth in the coming years.
With our products, we offer innovative solutions for these trends and
generate measurable added value for our customers. We are suc-
cessfully positioned in those markets in which our product portfolio
will enable us to particularly benefit from these trends in the medium
and long term. The BRICS countries – especially Brazil, China and
India – will retain a central role in this regard.
When gathering information in the context of acquisitions, it is possible
that certain facts required to assess an acquisition candidate’s future
performance or to determine the purchase price are not available or
are not correctly interpreted. We address this risk by conducting well-
structured due diligence analyses and, where possible, by concluding
appropriate agreements with the sellers. Insufficient integration of
acquired companies or businesses can result in expected develop-
ments not materializing. For this reason, we have processes in place
with which full integration of acquired businesses is assured. If as-
sumptions concerning future developments – such as the realization
of synergies – do not materialize, this might result in a write-down
on assets. We monitor this risk by carrying out impairment testing at
least once a year.
Unlocking and exploiting operational opportunities is an important
aspect of LANXESS’s entrepreneurial activities. We are committed
to using existing products and new solutions to advance our growth
and sustainably strengthen our position in global markets. Investing
in new plants as well as expanding the capacities and increasing
the productivity of existing ones are key elements in these efforts.
The anticipated effects are taken into account in our planning or are
reported as opportunities. In principle, we expect investments to yield
benefits but they are also coupled with risks. Thus, for example, the
success of our investments in Asia has been substantially impacted
by the challenging competitive situation in the synthetic rubber busi-
nesses. The preparatory work for investments that exceed a specified
significance threshold is the responsibility of the relevant business
units. After review by an Investment Committee set up for this pur-
pose, the information is presented to the Board of Management for
a decision. By following this procedure, we ensure that investments
are in line with our corporate strategy and satisfy our profitability and
security requirements.
The fundamental risk remains that difficulties may arise in connection
with the start-up of our new plants for Nd-PBR rubber in Singapore and
for EPDM rubber in Changzhou, China, both of which are scheduled
for 2015. From the present viewpoint, however, we do not anticipate
any problems.
Sales and earnings effects expected from our investments and acquisi-
tions are already considered in our forecasts. These targeted invest-
ments may also generate further operational opportunities because
they enable us to unlock new potential and improve our positioning
in key markets.
Sales markets LANXESS is inherently exposed to general economic
developments and political change in the countries and regions in
which the LANXESS Group operates. Regional differences in economic
performance and the associated demand trends can affect the Group’s
pricing and sales potential in its various geographical markets, with
corresponding positive or negative effects on its earnings. Our global
presence, which we are continuing to expand in growth markets,
enables us to participate in favorable regional developments and,
at the same time, reduce our dependence on certain regions. This
approach is discussed in further detail in the “Strategy” section of this
combined management report.
The volatility and cyclicality that are typical of the global chemical and
polymer markets and their dependence on developments in customer
industries harbor uncertainties for LANXESS’s business. As well as
the influence of general economic development, the particular depen-
dence of the rubber business on customers in the tire and automo-
tive industries can result in sales volatility. Additional and unplanned
sales opportunities may arise through access to new markets or the
acquisition of new customers. In addition to being subject to these
demand-side market influences, our earning power can be impacted
by structural changes in markets, such as the disappearance of existing
competitors or the entry of new ones and the availability of additional
capacities, regional shifts, the migration of customers to countries with
lower costs, and product substitution or market consolidation trends
in some sectors. We counter such trends by systematically managing
costs and continuously adjusting our product portfolio, sharpening its
focus and aligning our offering with innovative customer segments
which will enable us to operate successfully in the long term.

122 LANXESS Annual Report 2014
In our Performance Polymers segment, the synthetic rubber business
continues to face increasing competition, partly from new manufac-
turers entering the market. In some business units, this may result in
further overcapacities and stronger competition on prices. LANXESS
is pursuing a product-specific strategy in these areas based on factors
such as product and process differentiation and global positioning.
In 2014, the company additionally initiated the three-phase “Let’s
LANXESS again” program for the global realignment of the LANXESS
Group. Further information about this program can be found in the
“Strategy” section.
Finance The Treasury Group Function has the task of centrally record-
ing and managing financial opportunities and risks. Chief among
these are:
Financial Opportunities and Risks
Price changes
Liquidity and refinancing
Counterparty risks
Capital investments
Insurance
Currencies Availability of cash
Customers Investments in pension assets
Shortfall in cover
Interest rates
Access to multi- and bilateral capital markets
Banks
Raw materials
Energies
• Price changes
Currencies Since the LANXESS Group undertakes transactions in
various currencies, it is exposed to fluctuations in the relative value
of these currencies. Fixed exchange rates were used in our planning
for fiscal 2015. The development of the U.S. dollar against the euro
is of particular relevance. An appreciation of the U.S. dollar compared
with the exchange rate used in planning would have a positive effect
on our planned EBITDA pre exceptionals. We have already entered
into hedging transactions for 2015 and 2016 to mitigate the effects
of currency fluctuations.
Currency risks from potential declines in the value of financial instru-
ments due to exchange rate fluctuations (transaction risks) arise mainly
when receivables and payables are denominated in a currency other
than the company’s local currency. These risks and the currency risks
arising on financial transactions, including the interest component,
are generally fully hedged through forward exchange contracts. In
the short term, therefore, the appreciation or depreciation of the euro
against other major currencies can have no material impact on future
cash flows.
The opportunities and risks relating to operating activities are system-
atically monitored and analyzed. To this end, both sales and costs are
planned in foreign currencies. In the long term, exchange rate fluctua-
tions could adversely affect future cash flows should the LANXESS
Group not be able to counter them, for example, by pricing its products
in the respective local currencies. This risk is minimized by partial
hedging with derivative financial instruments. Hedging is performed
in line with principles determined by the Board of Management and
is subject to continuous monitoring.
Interest rates Market interest rate movements can cause fluctuations in the fair value of a financial instrument. They affect both financial
assets and financial liabilities.
Since the majority of financial liabilities were entered into at fixed
interest rates, changes in interest rates in the coming years will have
only a limited impact on the LANXESS Group.
Raw materials/energies Where certain market-price risks for energies
and raw materials cannot be passed on to customers in their entirety,
they may be hedged on a case-by-case basis by forward commodity
contracts in order to reduce the volatility of cash flows. As in the previ-
ous year, LANXESS had no forward commodity contracts as at the
reporting date.
• Liquidity and refinancing
We ensure our access to the capital markets and our solvency through
a conservative financing policy and a target capital structure that is
largely based on the ratio systems used by leading rating agencies. Our
conservative financing policy takes into account the risk of a change
to our rating and the associated effects on financial risk management,
even though LANXESS has no direct influence on the assessments
by independent rating agencies.
Our main liquidity reserve is a €1.25 billion syndicated credit facility,
which remained largely undrawn on the reporting date. In February
2015, its original term was extended by one year to February 2020.
We have a further material credit line of €150 million with the Euro-
pean Investment Bank. In addition to credit facilities, the Group has
short-term liquidity reserves of €518 million in the form of cash and
cash equivalents and highly liquid investments in AAA-rated money
market funds. Accordingly, the LANXESS Group has a liquidity position
based on a broad range of financing instruments.

123Combined Management Report
Report on risks, opportunities and future perspectives
• Counterparty risks
Counterparty risks (credit risks) arise from trade relationships with
customers and dealings with banks and other financial partners, espe-
cially with regard to the investment business and financial instrument
transactions.
Customer risks are systematically identified, analyzed and managed
using both internal and external information sources. Customer port-
folios may be insured against credit risks, especially where the risk
profile is elevated.
The objective of receivables management at LANXESS is to collect
all outstanding payments punctually and in full, and thus to minimize
the risk of default. Continuous monitoring is computer-assisted based
on the payment terms agreed with the customers. These are generally
based on the customary payment terms for the business or country.
Reminders are sent out at regular intervals if payments are overdue.
Credit insurance has been concluded with a well-known European
credit insurer to cover material credit risks relating to receivables from
customers. After a deductible, these cover default risks, especially in
Europe, that could arise up to the end of the respective fiscal year
in the mid-double-digit millions of euros. The maximum credit risk
is further reduced by letters of credit in favor of LANXESS. In certain
cases, prepayment is agreed with the contracting partner.
In addition, LANXESS has a contractually agreed title to goods until the
contractual partner has paid the full purchase price. The vast majority
of receivables relate to customers with very high credit standing.
The creditworthiness of the counterparty is a key criterion in the
financial policy and credit risk management of the LANXESS Group,
especially in the selection of banks and financial partners for capital
investments and transactions involving financial instruments. LANXESS
therefore endeavors to undertake transactions with banks and other
financial counterparties that have at least an investment-grade rating.
The derivatives and financial assets outstanding as of the closing date
were almost all concluded with banks with an investment-grade rating.
Credit risk management also includes global management of the
counterparty risk relating to all existing relationships with banks and
financial partners. The LANXESS Group pays particular attention to
risk diversification to prevent any cluster risks that could jeopardize
its existence. Through master agreements, the market values of open
trading positions can be netted if a partner becomes insolvent, thereby
further reducing risks.
• Capital investments
Opportunities and risks associated with the investment of pension
assets are monitored by the Pension Committee, which is made up
of the Chief Financial Officer and representatives from the Treasury,
Accounting and Human Resources group functions.
Additional information on our financial risks can be found in Note [35],
“Financial instruments,” to the consolidated financial statements.
• Insurance
The LANXESS Group carries insurance cover against material risks
such as those arising from property damage, business interruption and
product liability. If a loss event occurs, LANXESS must therefore pay
only those damages in excess of the deductible. However, there is a
residual risk of events that are not covered by the insurance or which
result in damages in excess of the cover guaranteed by the insurer.
Legal, regulatory and political environment Companies in the
LANXESS Group are subject to legal risks and are parties to various
litigations. The outcome of individual proceedings cannot be predicted
with assurance due to the uncertainties always associated with legal
disputes. To the extent necessary in light of the known circumstances
in each case, we have set up risk provisions for the event that the
outcome of such proceedings is unfavorable to LANXESS. Taking
into account existing provisions and insurance, as well as agreements
reached with third parties in respect of liability risks arising from legal
disputes, it is currently estimated that none of these proceedings will
materially affect our planned EBITDA pre exceptionals.
As a preventive approach to avoiding legal risks, LANXESS has estab-
lished an extensive compliance management system incorporating a
range of organizational measures. Among the main risks LANXESS
has identified are those relating to antitrust legislation, plant safety
and environmental protection, foreign trade legislation and corruption.
In connection with risks relating to antitrust legislation, for example,
LANXESS has developed a program that combines classroom train-
ing and e-learning to ensure compliance with competition law. In this
way, our employees and managers are schooled in the particular
risks pertaining to their areas of business and made aware of their
significance. This training is performed and documented at regular
intervals. Our employees can also contact designated experts in the
Legal & Compliance Group Function if they have any specific questions.
Further information about compliance can be found in the Corporate
Governance Report and in the “Compliance as an integral component”
section of this opportunity and risk report.
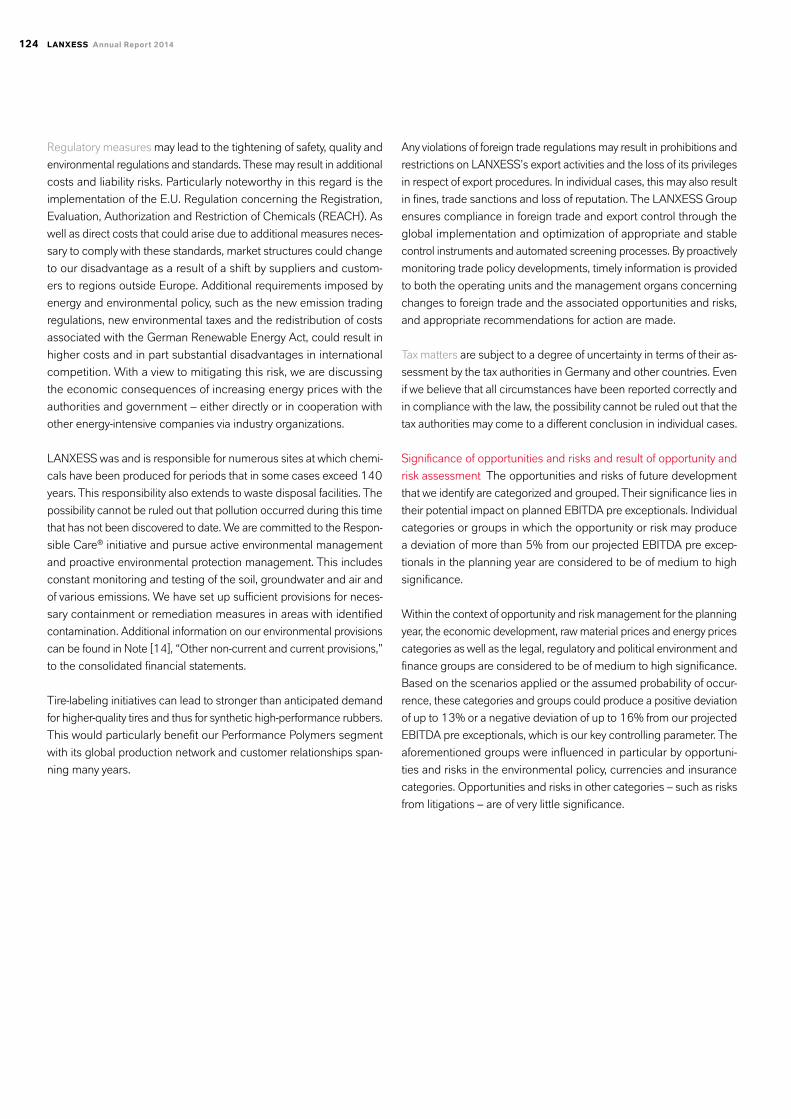
124 LANXESS Annual Report 2014
Regulatory measures may lead to the tightening of safety, quality and
environmental regulations and standards. These may result in additional
costs and liability risks. Particularly noteworthy in this regard is the
implementation of the E.U. Regulation concerning the Registration,
Evaluation, Authorization and Restriction of Chemicals (REACH). As
well as direct costs that could arise due to additional measures neces-
sary to comply with these standards, market structures could change
to our disadvantage as a result of a shift by suppliers and custom-
ers to regions outside Europe. Additional requirements imposed by
energy and environmental policy, such as the new emission trading
regulations, new environmental taxes and the redistribution of costs
associated with the German Renewable Energy Act, could result in
higher costs and in part substantial disadvantages in international
competition. With a view to mitigating this risk, we are discussing
the economic consequences of increasing energy prices with the
authorities and government – either directly or in cooperation with
other energy-intensive companies via industry organizations.
LANXESS was and is responsible for numerous sites at which chemi-
cals have been produced for periods that in some cases exceed 140
years. This responsibility also extends to waste disposal facilities. The
possibility cannot be ruled out that pollution occurred during this time
that has not been discovered to date. We are committed to the Respon-
sible Care® initiative and pursue active environmental management
and proactive environmental protection management. This includes
constant monitoring and testing of the soil, groundwater and air and
of various emissions. We have set up sufficient provisions for neces-
sary containment or remediation measures in areas with identified
contamination. Additional information on our environmental provisions
can be found in Note [14], “Other non-current and current provisions,”
to the consolidated financial statements.
Tire-labeling initiatives can lead to stronger than anticipated demand
for higher-quality tires and thus for synthetic high-performance rubbers.
This would particularly benefit our Performance Polymers segment
with its global production network and customer relationships span-
ning many years.
Any violations of foreign trade regulations may result in prohibitions and
restrictions on LANXESS’s export activities and the loss of its privileges
in respect of export procedures. In individual cases, this may also result
in fines, trade sanctions and loss of reputation. The LANXESS Group
ensures compliance in foreign trade and export control through the
global implementation and optimization of appropriate and stable
control instruments and automated screening processes. By proactively
monitoring trade policy developments, timely information is provided
to both the operating units and the management organs concerning
changes to foreign trade and the associated opportunities and risks,
and appropriate recommendations for action are made.
Tax matters are subject to a degree of uncertainty in terms of their as-
sessment by the tax authorities in Germany and other countries. Even
if we believe that all circumstances have been reported correctly and
in compliance with the law, the possibility cannot be ruled out that the
tax authorities may come to a different conclusion in individual cases.
Significance of opportunities and risks and result of opportunity and
risk assessment The opportunities and risks of future development
that we identify are categorized and grouped. Their significance lies in
their potential impact on planned EBITDA pre exceptionals. Individual
categories or groups in which the opportunity or risk may produce
a deviation of more than 5% from our projected EBITDA pre excep-
tionals in the planning year are considered to be of medium to high
significance.
Within the context of opportunity and risk management for the planning
year, the economic development, raw material prices and energy prices
categories as well as the legal, regulatory and political environment and
finance groups are considered to be of medium to high significance.
Based on the scenarios applied or the assumed probability of occur-
rence, these categories and groups could produce a positive deviation
of up to 13% or a negative deviation of up to 16% from our projected
EBITDA pre exceptionals, which is our key controlling parameter. The
aforementioned groups were influenced in particular by opportuni-
ties and risks in the environmental policy, currencies and insurance
categories. Opportunities and risks in other categories – such as risks
from litigations – are of very little significance.
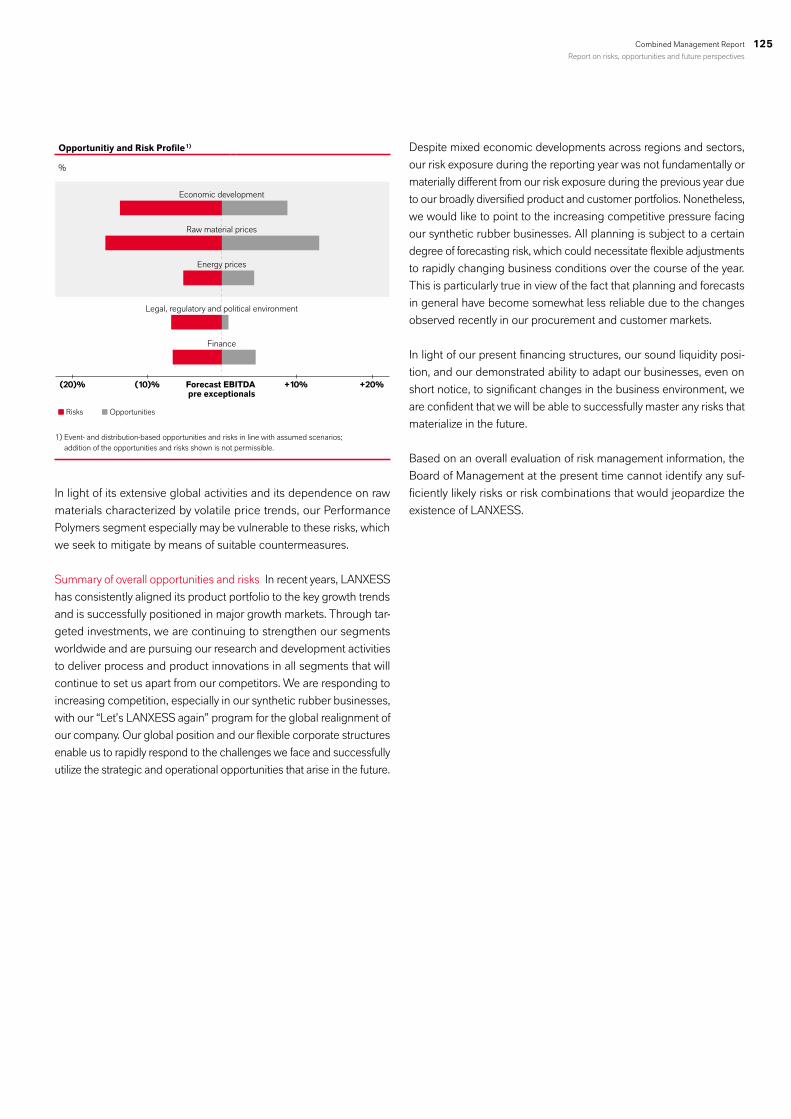
125Combined Management Report
Report on risks, opportunities and future perspectives
Opportunitiy and Risk Profile 1)
%
1) Event- and distribution-based opportunities and risks in line with assumed scenarios; addition of the opportunities and risks shown is not permissible.
In light of its extensive global activities and its dependence on raw
materials characterized by volatile price trends, our Performance
Polymers segment especially may be vulnerable to these risks, which
we seek to mitigate by means of suitable countermeasures.
Summary of overall opportunities and risks In recent years, LANXESS
has consistently aligned its product portfolio to the key growth trends
and is successfully positioned in major growth markets. Through tar-
geted investments, we are continuing to strengthen our segments
worldwide and are pursuing our research and development activities
to deliver process and product innovations in all segments that will
continue to set us apart from our competitors. We are responding to
increasing competition, especially in our synthetic rubber businesses,
with our “Let’s LANXESS again” program for the global realignment of
our company. Our global position and our flexible corporate structures
enable us to rapidly respond to the challenges we face and successfully
utilize the strategic and operational opportunities that arise in the future.
OpportunitiesRisks
(20)% (10)% +10% +20%
Economic development
Raw material prices
Energy prices
Legal, regulatory and political environment
Finance
Forecast EBITDA pre exceptionals
Despite mixed economic developments across regions and sectors,
our risk exposure during the reporting year was not fundamentally or
materially different from our risk exposure during the previous year due
to our broadly diversified product and customer portfolios. Nonetheless,
we would like to point to the increasing competitive pressure facing
our synthetic rubber businesses. All planning is subject to a certain
degree of forecasting risk, which could necessitate flexible adjustments
to rapidly changing business conditions over the course of the year.
This is particularly true in view of the fact that planning and forecasts
in general have become somewhat less reliable due to the changes
observed recently in our procurement and customer markets.
In light of our present financing structures, our sound liquidity posi-
tion, and our demonstrated ability to adapt our businesses, even on
short notice, to significant changes in the business environment, we
are confident that we will be able to successfully master any risks that
materialize in the future.
Based on an overall evaluation of risk management information, the
Board of Management at the present time cannot identify any suf-
ficiently likely risks or risk combinations that would jeopardize the
existence of LANXESS.