combined ariborne and ground geophysics flåm norway
TRANSCRIPT
Combined airborne and ground geophysics as a first phase towards a landslide warning system
Österreichische Ingenieur- und Architekten-Zeitschrift, 160. Jg., Heft 1–12/2015 215
scope of this paper. In terms of the used geophysical methods standard near-surface geophysics such as ground penetrating radar (GPR), electrical resistivity tomography (ERT) and seismic reflection and refraction are commonly used. Airborne electro-magnetic (AEM) measurements are a novel tool for these pro-jects.The area around the West-Norwegian village of Flåm, located approximately half way between Oslo and Bergen, on the end of the Aurlandsfjord, a side arm of the Sognefjord, is prone to various kinds of natural hazards, rockslides and consequent tsunamis, rock falls, flooding and landslides. In this study, we focus on a creeping landslide along the eastern slope of the Flåm valley stretching southwards from Flåm where both houses, railway and roads are exposed. Within a research pro-ject, funded by The Regional Research Fund, Vestlandet (RFF), we aim at establishing an early warning system (EWS) for the railway, theroad and for the public in the area. To assist the de-sign phase of this system, in particular to find locations for bore-holes with consequent monitoring instrumentation, we carried out an AEM survey with ERT follow up in 2014/15. The results of those measurements gave us a 3D model of the potential sliding plane and provided us with depth maps to plan the drilling cam-paign. A first drilling found artesian water at the depth predicted by the geophysical models and two boreholes are instrumented (piezometer and inclinometer) to assist the EWS.
2. The project
The inner Aurland Fjord with the adjacent Flåm Valley (in- western Norway) is among Norway’s most famous touristdes-tinations with up to 450,000 visitors and more than 150 cruise ships a year visiting the area. Flåm is further the northern end of the historic Flåm railway, one of the steepest tracks in the world. Latest estimates point towards 700 thousand passengers during summer. The main road betweenBergen and Oslo (E16) passes through Flåm, bypasses thefjord, and enters the 24.5 km Lærdalstunnelen in Aurlandsvangen.Evidence of large rock- slides in the geological pasthave been documented in the area
Abstract
Norway’s geology and post-glacial topography poses in part a substantial natural hazard for people and infrastructure. A costly, detailed study of potential sliding mechanisms is typi-cally necessary to manage these risks. Within the framework of a research project connected to municipal mapping funds, we assess the value of airborne electromagnetics (AEM) for efficient structural mapping. Based on airborne- and ground geophysics we produced a 3D model in a fraction of time and funds nee-ded for conventional investigations. A first drilling based on this model found artesian water, the most likely driving mechanism of the investigated creeping landslide. Preliminary monitoring data shows the correlation between precipitation and pore pressure.
Kurzfassung
Die Bevölkerung und Infrastruktur in Teilen Norwegens ist auf-grund der Geologie und post-glazialen Landschaft bedeutenden Naturgefahren ausgesetzt. Mögliche Rutschungsszenarien müssen üblicherweise kosten- und zeitintensiv Untersucht werden, um diese Gefahren handzuhaben. Innerhalb eines Forschungsprojektsgekoppelt an kommunale Kartierungsbud- gets konnten wir den Mehrwert von Helikoptergeophysik (AEM) zur Strukturkartierung untersuchen. Basierend auf Daten der Hubschrauber- und Bodengeophysik konnten wir ein 3D Model erstellen, zu einem Bruchteil der Kosten und Zeitdauer für her-kömmliche Grunduntersuchungen. Eine erste Bohrung traf gespanntes Wasser, höchstwahrscheinlich der treibende Faktor der untersuchten Kriechhangrutschung. Erste Ergebnisse der Niederschlags- und Porendrucküberwachung zeigen eine klare Korrelation.
1. Introduction
Geophysical methods have proven a valuable tool for early phase investigations of land- and rock-slides.Numerous groups, especially in Austria, Switzerland, Italy and Norway, have pub-lished case studies. A full list of references would exceed the
Combined airborne and ground geophysics as a first phase towards a landslide warning system – a Norwegian case studyKombinierte Helikopter- und Boden-Geophysik als erster Schritt in der Planung eines Warnsystems an einem Kriechhang in NorwegenVon H. Anschütz , A. A. P fa f fhuber, U. Domaas , Oslo (N) and B. St. Rosenvo ld , Aurland (N) Mit 6 Abbildungen
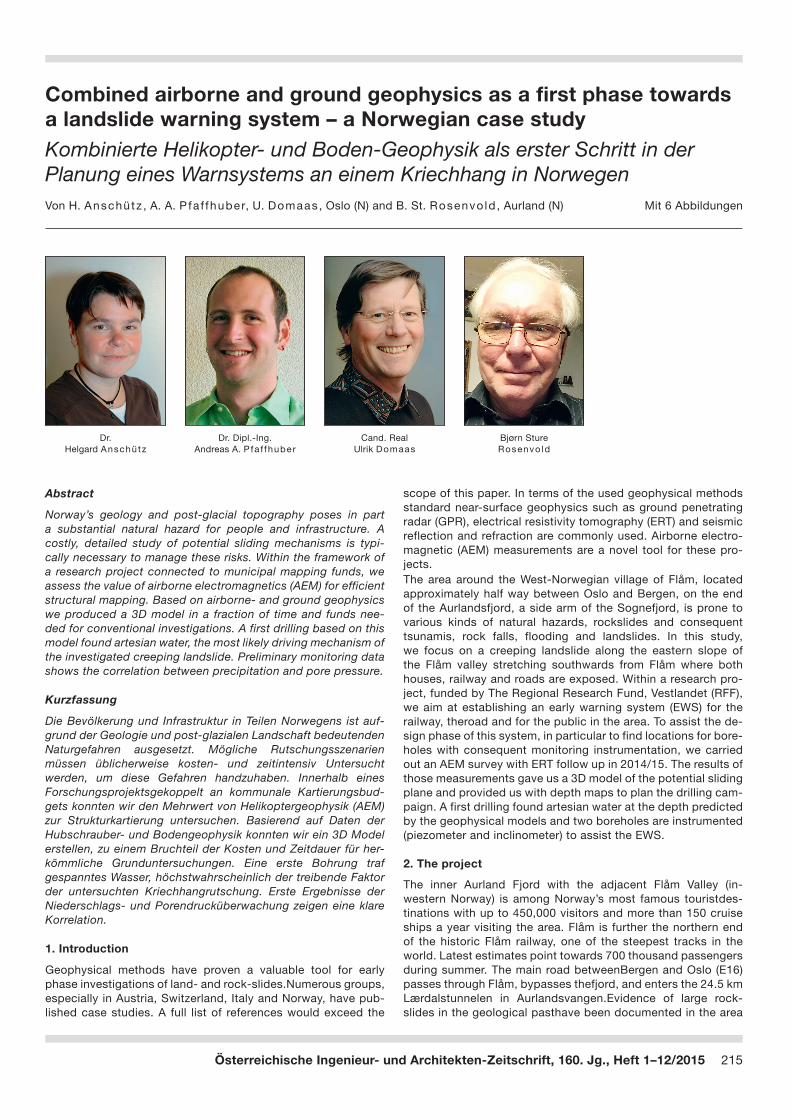
Dr. Helgard Anschütz
Dr. Dipl.-Ing. Andreas A. P fa f fhuber
Cand. RealUlrik Domaas
Bjørn Sture Rosenvo ld
Combined airborne and ground geophysics as a first phase towards a landslide warning system
216 Österreichische Ingenieur- und Architekten-Zeitschrift, 160. Jg., Heft 1–12/2015
with ground movementsevident to the present day. The area is subject to potentialrockslides composed of creeping rock and debris masses (Fig. 1). A first research project funded by the Norwegian research coun-cil took place between 2000 and 2002 by a Research Group consisting of experts from NGI, the Norwegian geological survey (NGU), the Institute for Energy Technology (IFE), the municipality of Aurland, E-CO Energy and Spilde Entrepreneur AS. Goal of the project was to map the potential natural hazard risk areas for rockslides, tsunamis and slow movements in the phyllitic areas along the Flåm Valley, and gain understanding
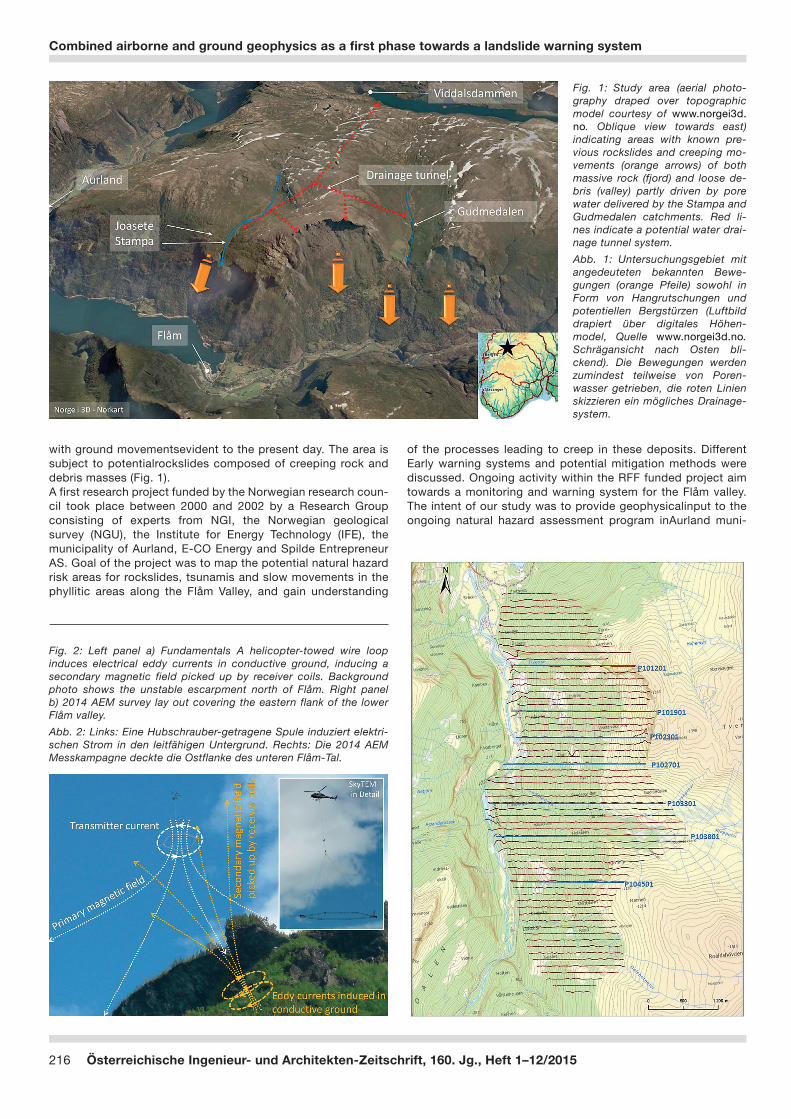
Fig. 1: Study area (aerial photo-graphy draped over topographic model courtesy of www.norgei3d.no. Oblique view towards east) indicating areas with known pre-vious rockslides and creeping mo-vements (orange arrows) of both massive rock (fjord) and loose de-bris (valley) partly driven by pore water delivered by the Stampa and Gudmedalen catchments. Red li-nes indicate a potential water drai-nage tunnel system.Abb. 1: Untersuchungsgebiet mit angedeuteten bekannten Bewe-gungen (orange Pfeile) sowohl in Form von Hangrutschungen und potentiellen Bergstürzen (Luftbild drapiert über digitales Höhen-model, Quelle www.norgei3d.no. Schrägansicht nach Osten bli-ckend). Die Bewegungen werden zumindest teilweise von Poren-wasser getrieben, die roten Linien skizzieren ein mögliches Drainage-system.
Fig. 2: Left panel a) Fundamentals A helicopter-towed wire loop induces electrical eddy currents in conductive ground, inducing a secondary magnetic field picked up by receiver coils. Background photo shows the unstable escarpment north of Flåm. Right panel b) 2014 AEM survey lay out covering the eastern flank of the lower Flåm valley.Abb. 2: Links: Eine Hubschrauber-getragene Spule induziert elektri-schen Strom in den leitfähigen Untergrund. Rechts: Die 2014 AEM Messkampagne deckte die Ostflanke des unteren Flåm-Tal.
of the processes leading to creep in these deposits. Different Early warning systems and potential mitigation methods were discussed. Ongoing activity within the RFF funded project aim towards a monitoring and warning system for the Flåm valley.The intent of our study was to provide geophysicalinput to the ongoing natural hazard assessment program inAurland muni-

Combined airborne and ground geophysics as a first phase towards a landslide warning system
Österreichische Ingenieur- und Architekten-Zeitschrift, 160. Jg., Heft 1–12/2015 217
cipality.Based on a successful AEM survey in 2009 covering a potential rockslide just north of Flåm, P fa f fhuber et.al. (2010), we carried out an additional AEM survey south of Flåm with the aim to map the base of the creeping debris masses along the eastern flank of the lower valley (Fig. 1).We completed the survey during 3 days in April 2014 using aSkyTEM 304system (Sørensen & Auken (2004)) acquiring roughly 140 km of data along 62 lines with 100 m spacing (Fig. 2). This particular AEM system has been developed for high resolution groundwater mapping in Denmark and provides us with the necessary depth penetration and resolution for such a survey. The rough topo-graphy (slopes with often 40–60 degrees inclination) is a chal-lenge that can be dealt with by virtue of adapted flight plans. We received raw data in the field and inverted them to a 3D resistivity model using so called spatially constrained inversion, SCI, V iezzo l i et.al. (2008). These SCI results are a good approximation of the actual subsurface structure but need to be interpreted with some care, as structures dipping stepper than 30 degrees tend to be imaged biased with this algorithm. Also the strong topography may have an effect on the processing.
For these reasons and further fundamental limitations in AEM resolution, we planned and performed 2 ERT surveys based on the initial AEM data models to “zoom” in on the structures of interest. Placement and interpretation of these ERT lines and the AEM results are discussed in the following section.
3. Results
Provided the challenging topographic survey conditions we mostly achieved good data quality. Nominal flight height was 30–50 m with higher clearance over power lines and other installations. The average flight speed resulted as 21 km/h with a bin spacing (horizontal distance between data points) of ca. 15 m. Measurements were only conducted on uphill flights because of the steep topography in the area. Areas with very low signal levels where manually excluded from the data and assigned as outcropping bedrock with resistivity above some thousand Ωm. As the final result is a 3D resistivity model, the data can be studied both as depth slice maps (Fig. 3) or profile sections (Fig. 4). The resistivity models clearly show a con- ductive layer that we interpret as the base of debris that we
Fig. 3: Resistivity depth slices for three representative depth inter-vals. Profile shown in Fig. 4 is in- dicated as a red line.Abb. 3: Widerstandstiefenschnitte in drei repräsentativen Tiefen. Das Profil in Fig. 4 ist als rote Linie ge-zeichnet.
Fig. 4: Section through the 3D re-sistivity model at profile 102701 (see Fig. 3). A thin, conductive layer is evident throughout the lower part of the slope with a discontinuity at the base of a minor escarpment (at distance 1100 m). The grey line indicate the individual penetration depth and thus the parts of the model (greyed out) with rather high uncertainty. See Fig. 3 for the resis-tivity colour scale.Abb. 4: Profil 102701 (Fig. 3) durch das 3D Widerstandsmodel. Eine dünne, leitfähige Schicht ist deut-lich erkennbar, es zeichnet sich bei ca. Profil 1100 m eine leichte Diskontinuität ab, nahe eines Kni-ckes in der Topographie. Die graue Linie beschreibt die Eindringtiefe, Widerstandswerte in größerer Tie-fe müssen als unsicher verstanden werden.

Combined airborne and ground geophysics as a first phase towards a landslide warning system
218 Österreichische Ingenieur- und Architekten-Zeitschrift, 160. Jg., Heft 1–12/2015
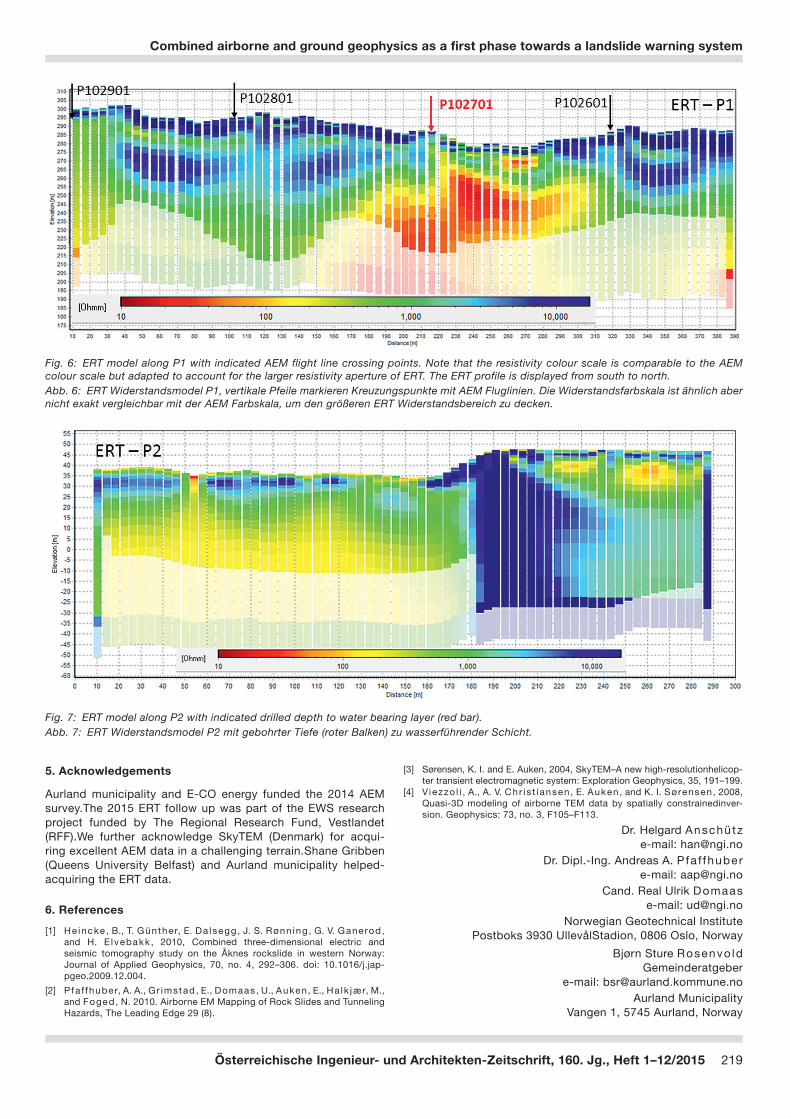
assume to be rich in fine-grain, water saturated material and thus low electrical resistivity (high conductivity). It is evident that this conductive layer is strongly undulating in elevation and depth below ground.Depth to the top of this layer is extracted from the resistivity model by searching from the top until a given threshold value is reached. This threshold resistivity is somewhat arbitrary and in this project based on various tests, we chose 80 Ωm as the most representative value. The extracted depths are thus connected with uncertainty. A map of these depth estimates (Fig. 5) can be used to pinpoint areas for potential ground follow up and ideally for drilling of monitoring wells, which aren‘t feasible if the tar- geted sliding plane is to deep.To further focus on the structure of the debris base and ulti-mately make a drilling decision, we carried out two ERT profiles in April 2015. One of the lines is situated in the valley, close to the railway line as that area could not be covered with AEM due to coupling with the rails (P1 in Fig. 5). The other line is placed approximately mid slope, at a location with shallow depth to the conductor (P2 in Fig. 5). The expected depth was confirmed by the ground measurements which in addition provide further detail of the topography of the debris base (Fig. 6). Note the agreement of depth to conductor in Fig. 5 and the resistivity contours in Fig. 6.Final drilling confirmation is unfortunately pending for the P1 location due to access reasons. On the lower location, how- ever, a first drilling has hit water under artesian pressure, based on the resistivity model form P2 (Fig. 6). This drilling was termi-nated at approximately 20 m depth, due to a ground water out-burst.The water pressure in the lower part of the phyllitic mas-ses indicate water flow in the ground with a low permeability top layer keeping the water from coming up to the surface before it reaches the river. High water pressure in the ground causes the creeping effect. Monitoring data since installation indicate a strong correlation between precipitation and pore pressure.
4. Discussion
The Flåm valley project gave us the opportunity to study the potential of semi-regional geophysical mapping in the early phase of a monitoring and warning project. Especially in our setting with a large unstable, creeping area that is difficult to assess and that appears to be driven by a partially fairly deep seated sliding mechanism it may have taken years and tens to hundreds of millions Norwegian kroner until one would have found a sliding plane within the reach of instrumented bore-holes. The AEM survey provided us with the planning basis in a matter of weeks at a fraction of these costs. With a limited ground geophysics program, we zoomed in on the potential drilling sites and have gained first confirmations of the geo- physical assumptions. The Flåm valley project is now going ahead towards further instrumentation and establishing a data-base that after sufficient learning time shall be used to manage this risk for both railway, road and local residents.
We need to bear in mind though, that not every slope may be investigated in this way. AEM is an incredibly efficient tool but also has its limitations. Flight operations can for example not be carried out over densely inhabited areas and EM noise and coupling with existing, technical infrastructure demand some hundred meters distance to these areas. Yet, the most important limitation is the resistivity aperture of AEM, in other words which materials that can be distinguished by AEM. The phyllitic geo- logy in Aurland leads to very conductive materials with less than 10 Ωm resistivity (a perfect AEM target). Other landslides and especially rockslides in more resistive environments (gneiss, granite, …) are potentially not resolvable with AEM, such as the Åknes slide where the water saturated sliding plane was found to have 10.000 Ωm and the stable rock even more He incke et.al. (2009). AEM would not be able to distinguish between those resistivities.Consequently, a detailed feasibility study is crucial before one engages in an AEM survey.
Fig. 5: Depth to conductive layer and potential sliding plane based on an 80-Ωm threshold in the he 3D resistivity model and ground follow up (red lines indicating ERT profiles P1 and P2) to define drilling locations.Abb. 5: Tiefenkarte der Leitfähi-gen Schicht und damit potentiellen Gleitschicht, basierend auf einem 80-Ωm Grenzwert im 3D Wider-standsmodel, Planungsgrundlage für Geländearbeit (ERT Profile P1 und P2), um Bohrlokationen fest-zulegen.
Combined airborne and ground geophysics as a first phase towards a landslide warning system
Österreichische Ingenieur- und Architekten-Zeitschrift, 160. Jg., Heft 1–12/2015 219
5. Acknowledgements
Aurland municipality and E-CO energy funded the 2014 AEM survey.The 2015 ERT follow up was part of the EWS research project funded by The Regional Research Fund, Vestlandet (RFF).We further acknowledge SkyTEM (Denmark) for acqui-ring excellent AEM data in a challenging terrain.Shane Gribben (Queens University Belfast) and Aurland municipality helped- acquiring the ERT data.
6. References[1] He incke , B., T. Günther, E. Da lsegg , J. S. Rønn ing , G. V. Ganerod ,
and H. E lvebakk , 2010, Combined three-dimensional electric and seismic tomography study on the Åknes rockslide in western Norway: Journal of Applied Geophysics, 70, no. 4, 292–306. doi: 10.1016/j.jap-pgeo.2009.12.004.
[2] P fa f fhuber, A. A., Gr imstad , E., Domaas , U., Auken , E., Ha lk jær, M., and Foged, N. 2010. Airborne EM Mapping of Rock Slides and Tunneling Hazards, The Leading Edge 29 (8).
[3] Sørensen, K. I. and E. Auken, 2004, SkyTEM–A new high-resolutionhelicop-ter transient electromagnetic system: Exploration Geophysics, 35, 191–199.
[4] V iezzo l i , A., A. V. Chr i s t i ansen , E. Auken , and K. I. Sørensen , 2008, Quasi-3D modeling of airborne TEM data by spatially constrainedinver-sion. Geophysics: 73, no. 3, F105–F113.
Dr. Helgard Anschütze-mail: [email protected]
Dr. Dipl.-Ing. Andreas A. P fa f fhubere-mail: [email protected]
Cand. Real Ulrik Domaase-mail: [email protected]
Norwegian Geotechnical Institute Postboks 3930 UllevålStadion, 0806 Oslo, Norway
Bjørn Sture Rosenvo ldGemeinderatgeber
e-mail: [email protected] Municipality
Vangen 1, 5745 Aurland, Norway
Fig. 6: ERT model along P1 with indicated AEM flight line crossing points. Note that the resistivity colour scale is comparable to the AEM colour scale but adapted to account for the larger resistivity aperture of ERT. The ERT profile is displayed from south to north.Abb. 6: ERT Widerstandsmodel P1, vertikale Pfeile markieren Kreuzungspunkte mit AEM Fluglinien. Die Widerstandsfarbskala ist ähnlich aber nicht exakt vergleichbar mit der AEM Farbskala, um den größeren ERT Widerstandsbereich zu decken.
Fig. 7: ERT model along P2 with indicated drilled depth to water bearing layer (red bar).Abb. 7: ERT Widerstandsmodel P2 mit gebohrter Tiefe (roter Balken) zu wasserführender Schicht.