color - visualization lab | uc...
TRANSCRIPT
1
Color
Maneesh Agrawala
CS 294-10: Visualization Fall 2013
Last Time: D3 and Wrangling

2
Guest Lectures M Oct 7: Introduction to D3 (Scott Murray)
Look at his online tutorials (part of reading) Bring your laptop on Monday Get a webserver running on your laptop
W Oct 9: Wrangling Data (Sean Kandel)
Class wiki http://vis.berkeley.edu/courses/cs294-10-fa13/wiki/
Announcements
3
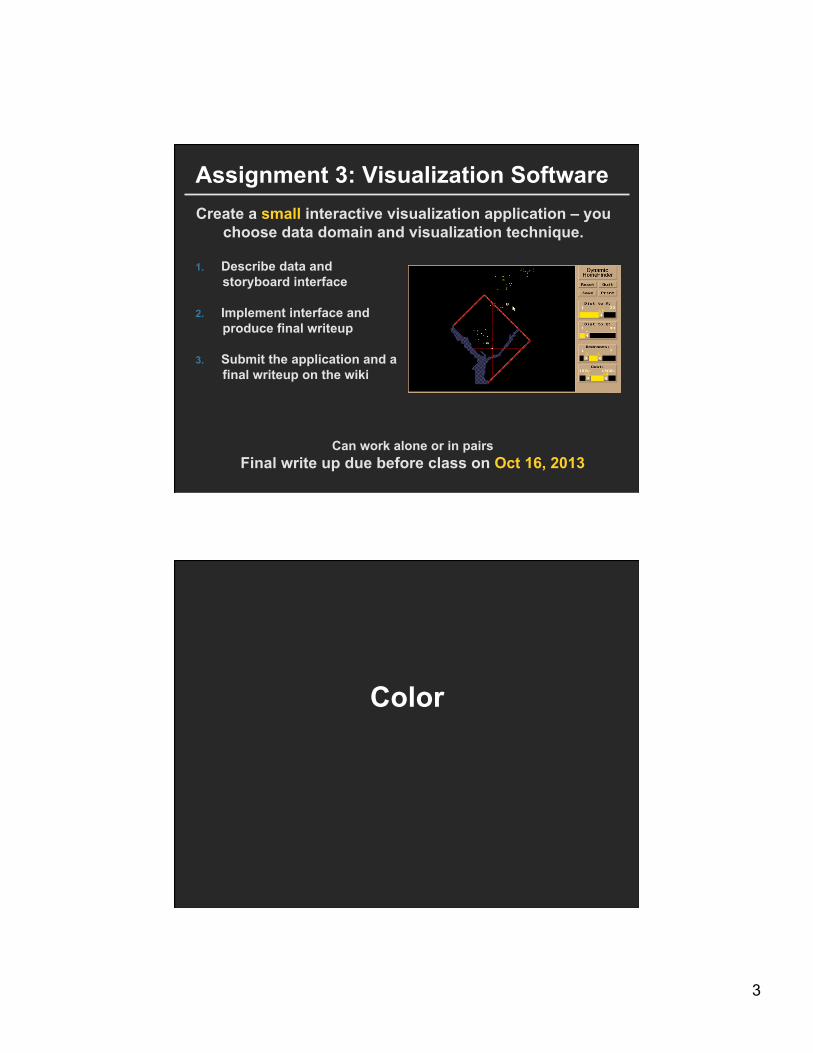
Assignment 3: Visualization Software
1. Describe data and
storyboard interface
2. Implement interface and produce final writeup
3. Submit the application and a final writeup on the wiki
Can work alone or in pairs Final write up due before class on Oct 16, 2013
Create a small interactive visualization application – you choose data domain and visualization technique.
Color

4
Color in Visualization
Identify, Group, Layer, Highlight
Colin Ware
Purpose of Color To label To measure To represent and imitate To enliven and decorate “Above all, do no harm.” - Edward Tufte
5
Topics Color Perception Color Naming
Using Color in Visualization
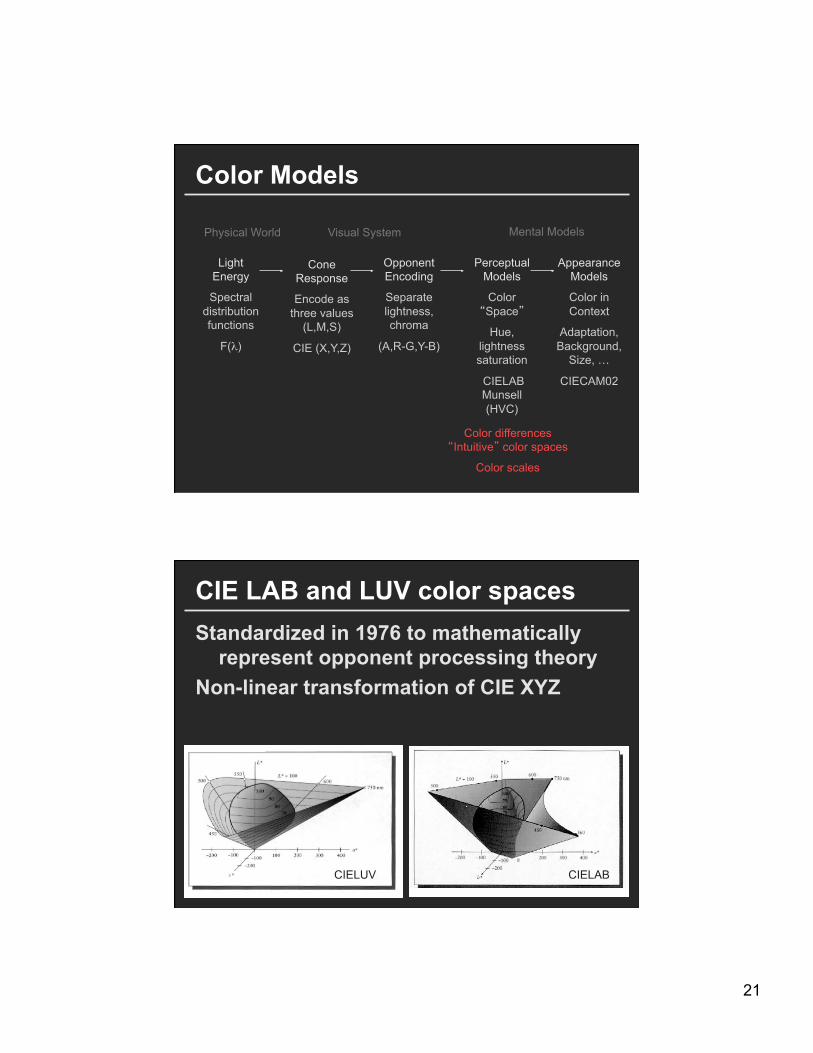
Color Perception Physical World, Visual System, Mental Models
6
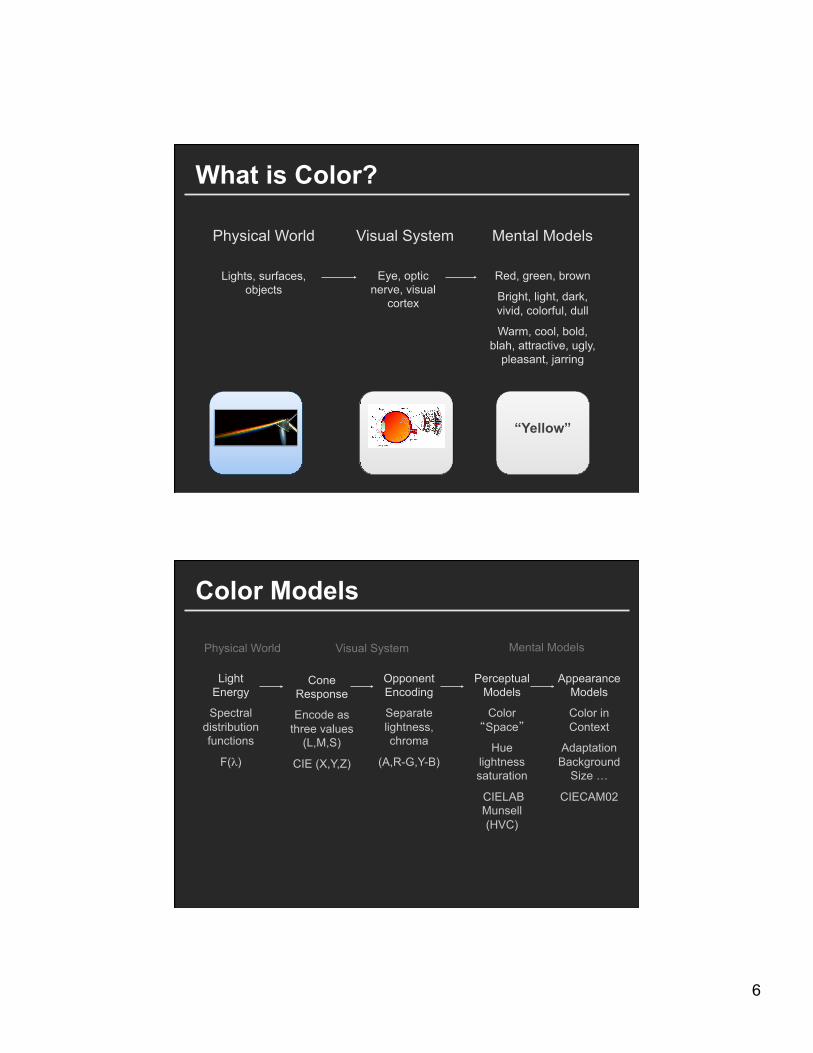
Physical World Visual System Mental Models
Lights, surfaces, objects
Eye, optic nerve, visual
cortex
Red, green, brown
Bright, light, dark, vivid, colorful, dull
Warm, cool, bold, blah, attractive, ugly,
pleasant, jarring
What is Color?
“Yellow”
Physical World Visual System Mental Models
Opponent Encoding
Separate lightness, chroma
(A,R-G,Y-B)
Light Energy
Spectral distribution functions
F(λ)
Cone Response
Encode as three values
(L,M,S)
CIE (X,Y,Z)
Appearance Models
Color in Context
Adaptation Background
Size …
CIECAM02
Perceptual Models
Color “Space”
Hue lightness saturation
CIELAB Munsell (HVC)
Color Models
7
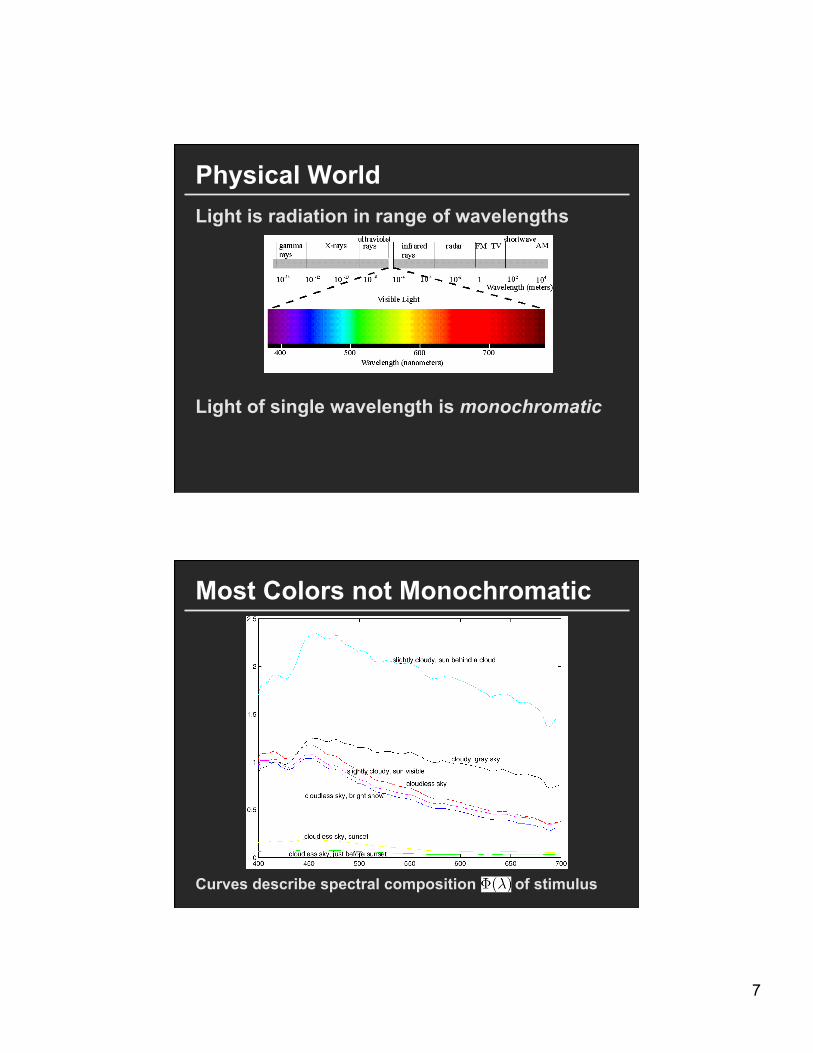
Physical World Light is radiation in range of wavelengths Light of single wavelength is monochromatic
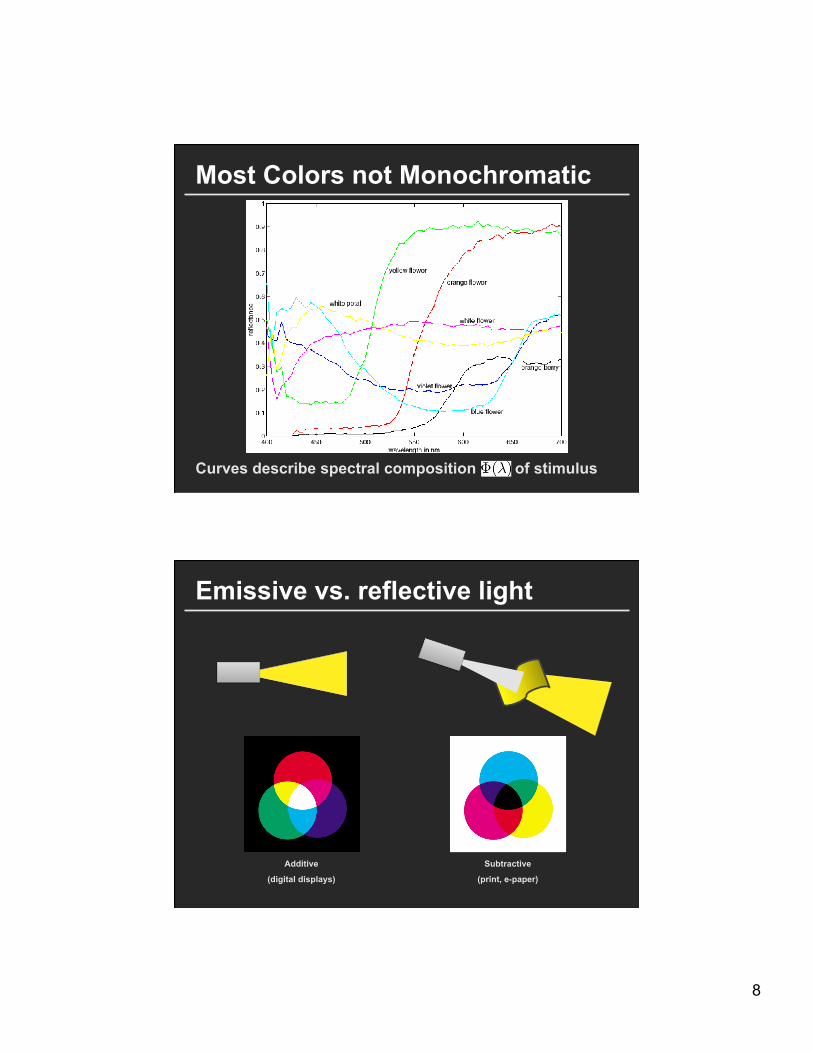
Most Colors not Monochromatic
Curves describe spectral composition of stimulus
8
Most Colors not Monochromatic
Curves describe spectral composition of stimulus
Emissive vs. reflective light
Additive
(digital displays)
Subtractive
(print, e-paper)
9
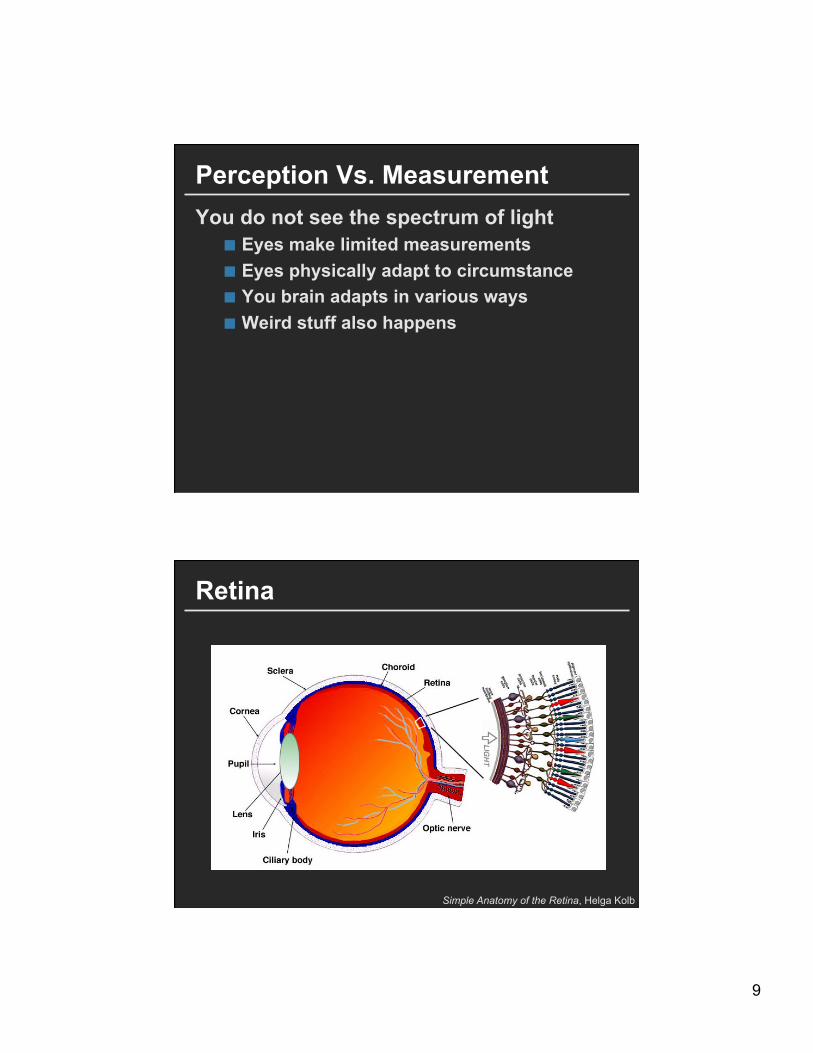
Perception Vs. Measurement You do not see the spectrum of light
Eyes make limited measurements Eyes physically adapt to circumstance You brain adapts in various ways Weird stuff also happens
Retina
Simple Anatomy of the Retina, Helga Kolb

10
Rods and Cones Rods
No color (sort of) Spread over the retina More sensitive
Cones 3 types sensitive to different frequencies Concentrated in fovea (center of the retina Less sensitive
As light enters our cones… LMS (Long, Middle, Short) Cones Sensitive to different wavelength
A Field Guide to Digital Color, Maureen Stone
11
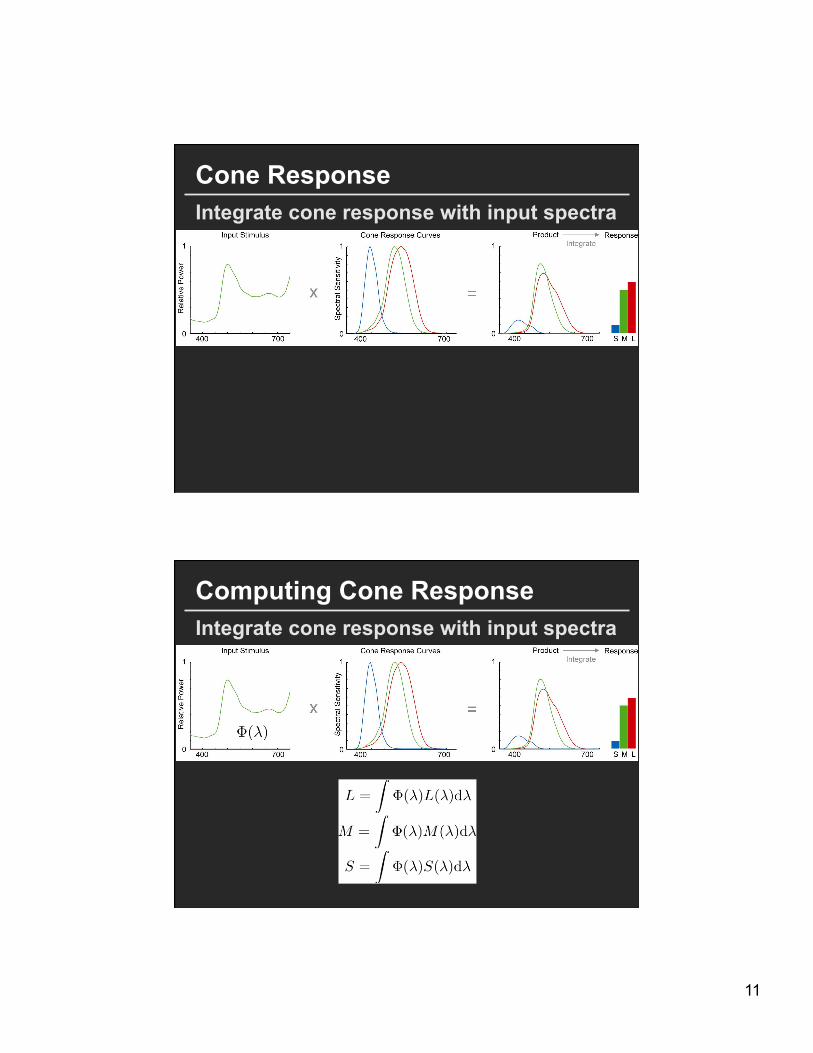
Cone Response Integrate cone response with input spectra
Integrate cone response with input spectra Computing Cone Response
12
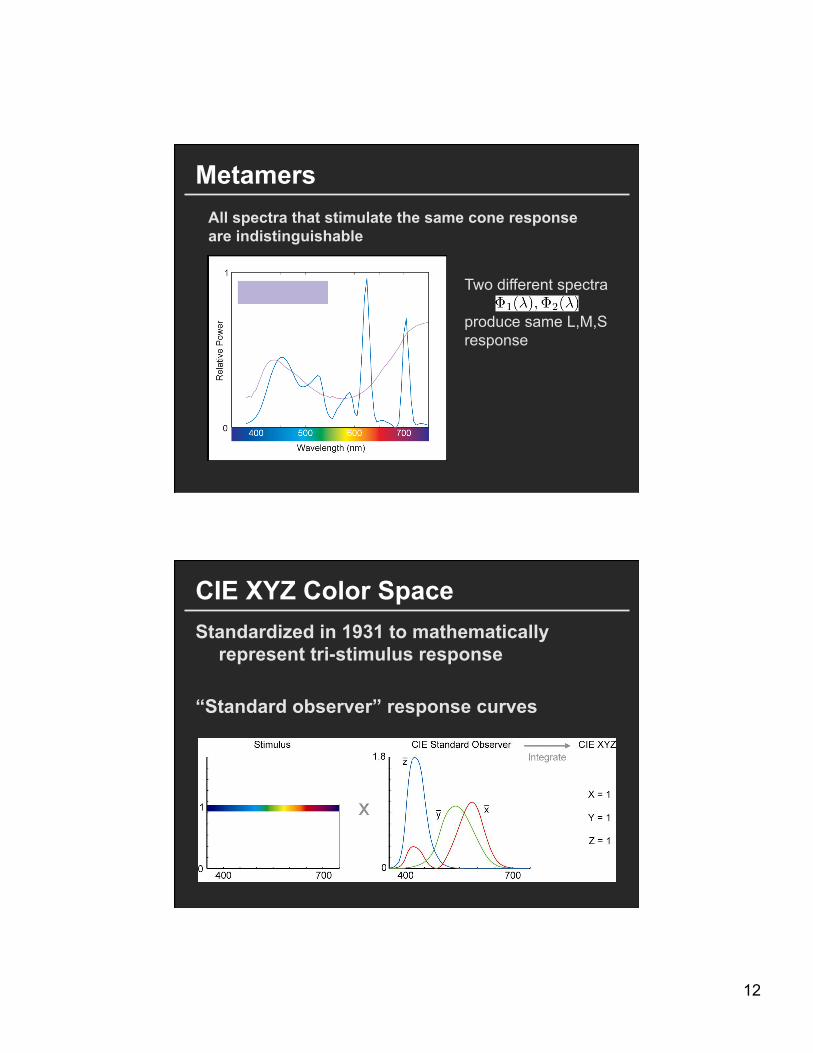
Metamers All spectra that stimulate the same cone response are indistinguishable
Two different spectra produce same L,M,S response
CIE XYZ Color Space Standardized in 1931 to mathematically
represent tri-stimulus response “Standard observer” response curves
13
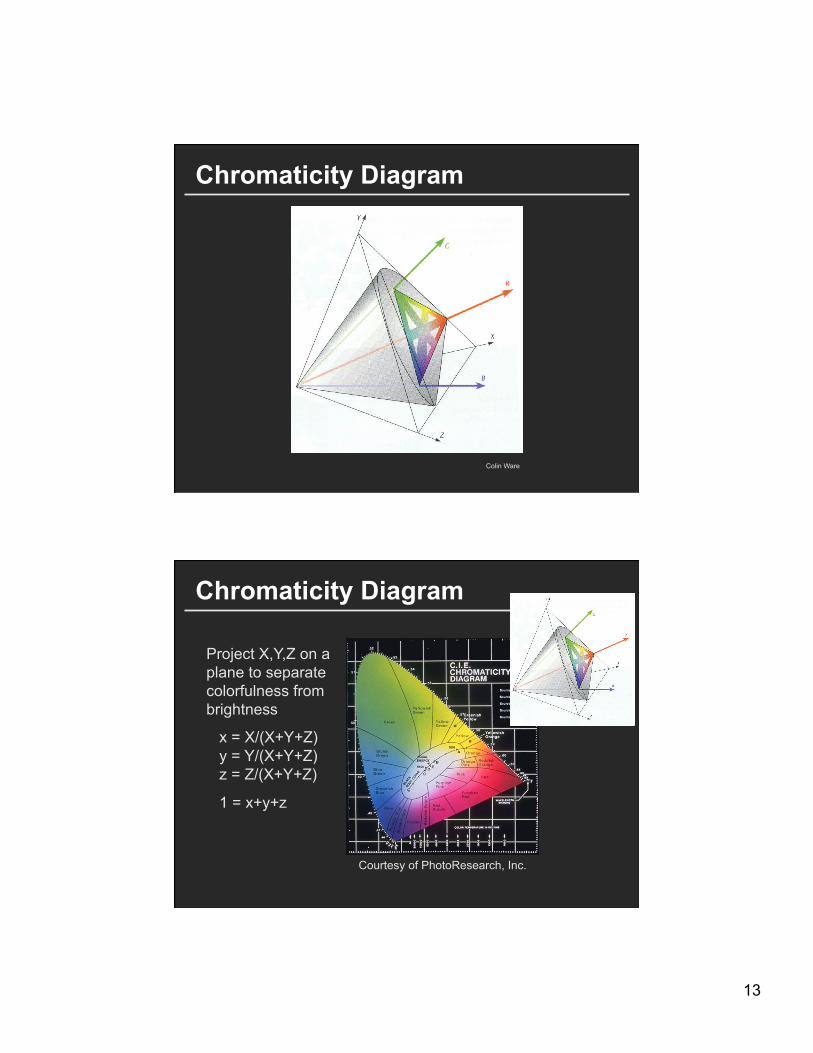
Chromaticity Diagram
Colin Ware
Project X,Y,Z on a plane to separate colorfulness from brightness
x = X/(X+Y+Z) y = Y/(X+Y+Z) z = Z/(X+Y+Z)
1 = x+y+z
Courtesy of PhotoResearch, Inc.
Chromaticity Diagram
14
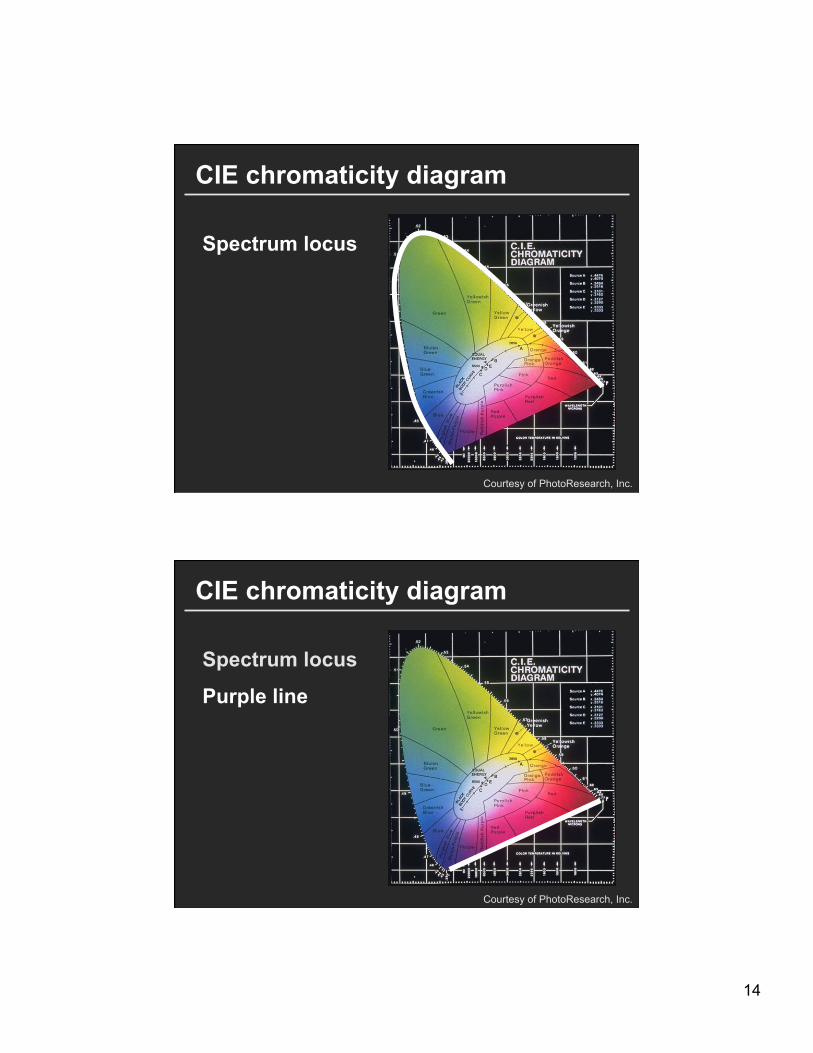
CIE chromaticity diagram
Spectrum locus
Courtesy of PhotoResearch, Inc.
CIE chromaticity diagram
Spectrum locus
Purple line
Courtesy of PhotoResearch, Inc.
15
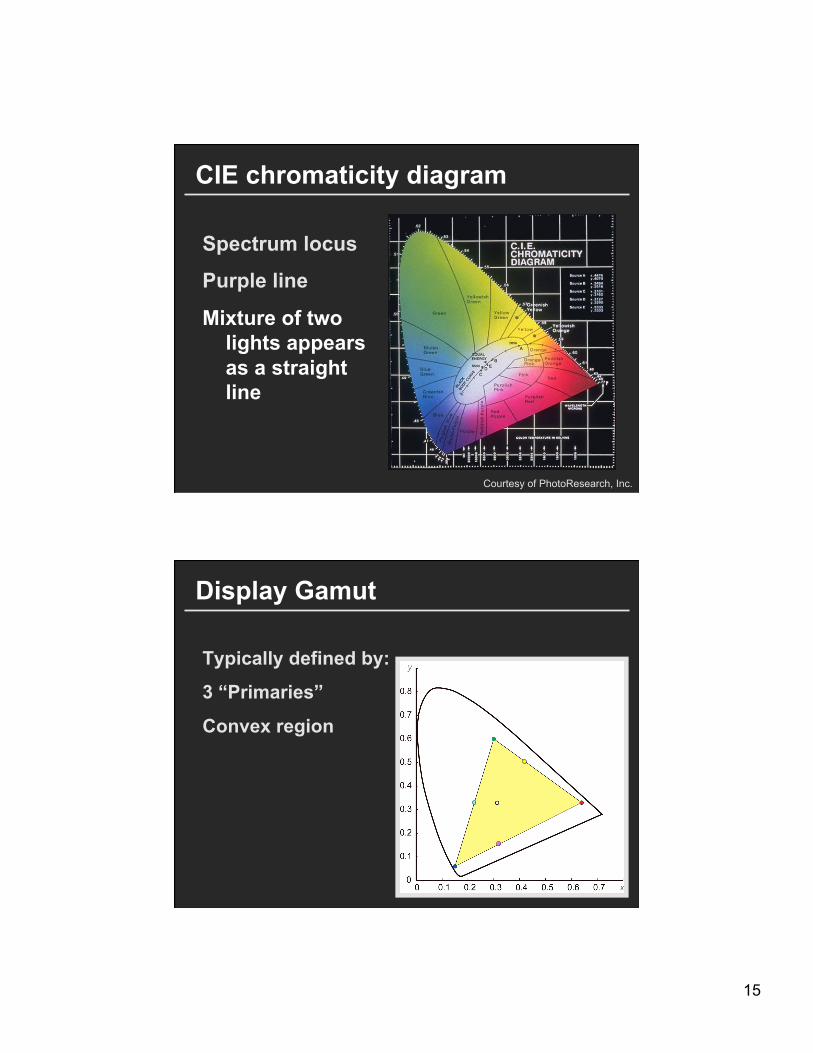
CIE chromaticity diagram
Spectrum locus
Purple line
Mixture of two lights appears as a straight line
Courtesy of PhotoResearch, Inc.
Display Gamut
Typically defined by:
3 “Primaries”
Convex region
16
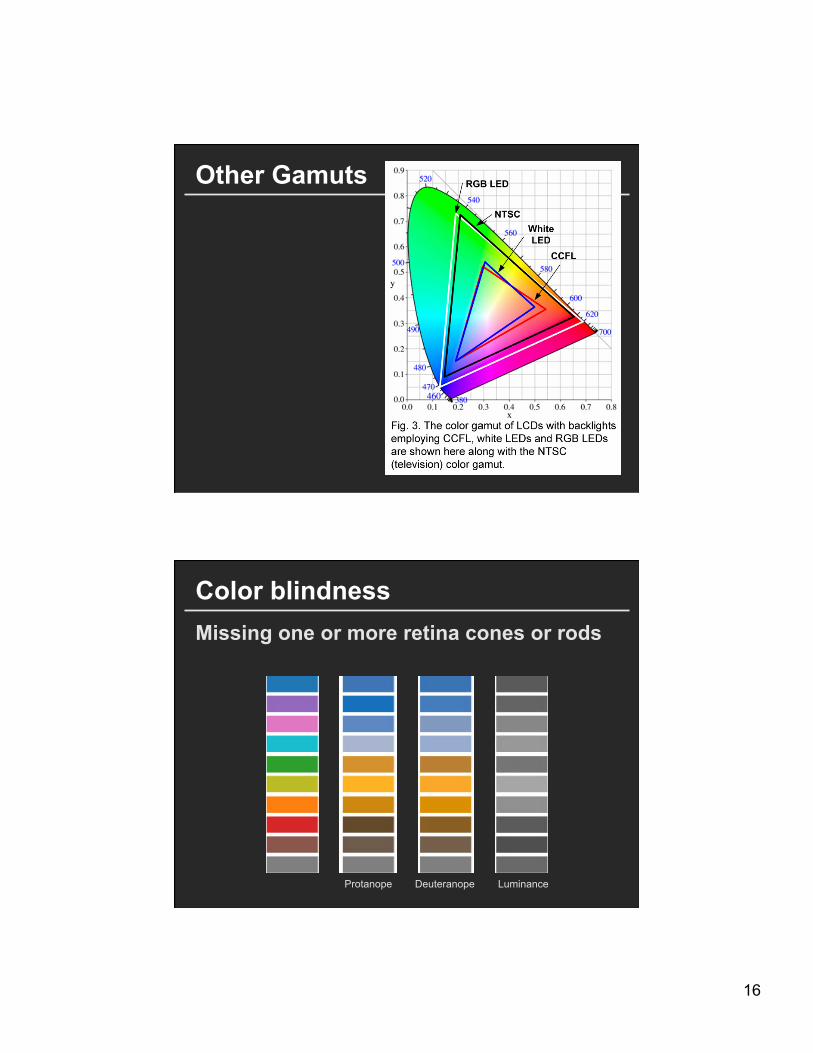
Other Gamuts
Color blindness Missing one or more retina cones or rods
Protanope Deuteranope Luminance
17
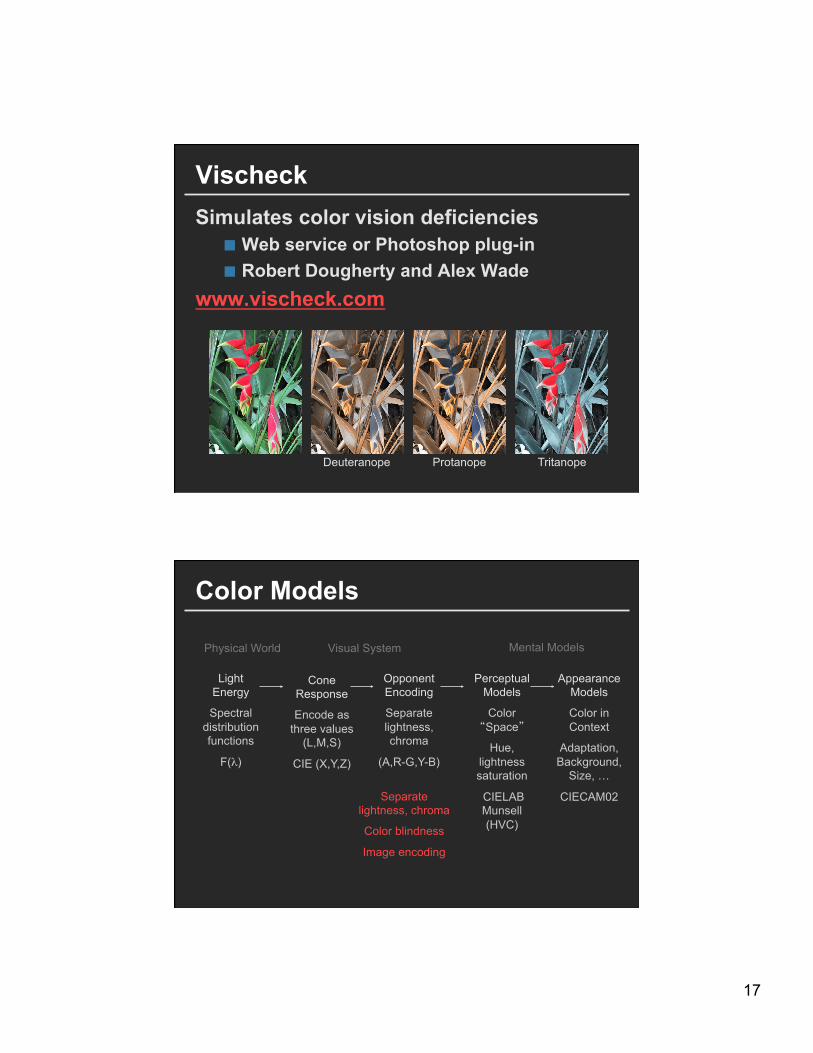
Vischeck Simulates color vision deficiencies
Web service or Photoshop plug-in Robert Dougherty and Alex Wade
www.vischeck.com
Deuteranope Protanope Tritanope
Physical World Visual System Mental Models
Opponent Encoding
Separate lightness, chroma
(A,R-G,Y-B)
Light Energy
Spectral distribution functions
F(λ)
Cone Response
Encode as three values
(L,M,S)
CIE (X,Y,Z)
Appearance Models
Color in Context
Adaptation, Background,
Size, …
CIECAM02
Perceptual Models
Color “Space”
Hue, lightness saturation
CIELAB Munsell (HVC)
Separate lightness, chroma
Color blindness
Image encoding
Color Models
18
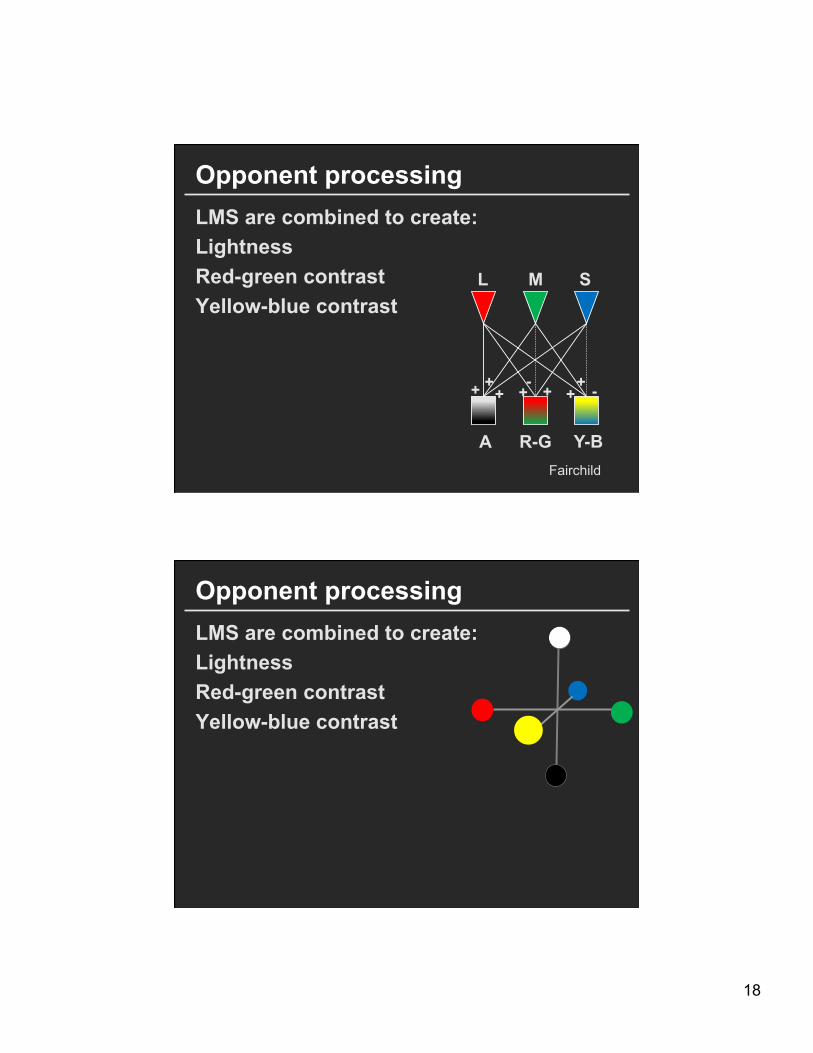
Opponent processing LMS are combined to create: Lightness Red-green contrast Yellow-blue contrast
A R-G Y-B
+ + + + + + + - -
Fairchild
L M S
Opponent processing LMS are combined to create: Lightness Red-green contrast Yellow-blue contrast
19
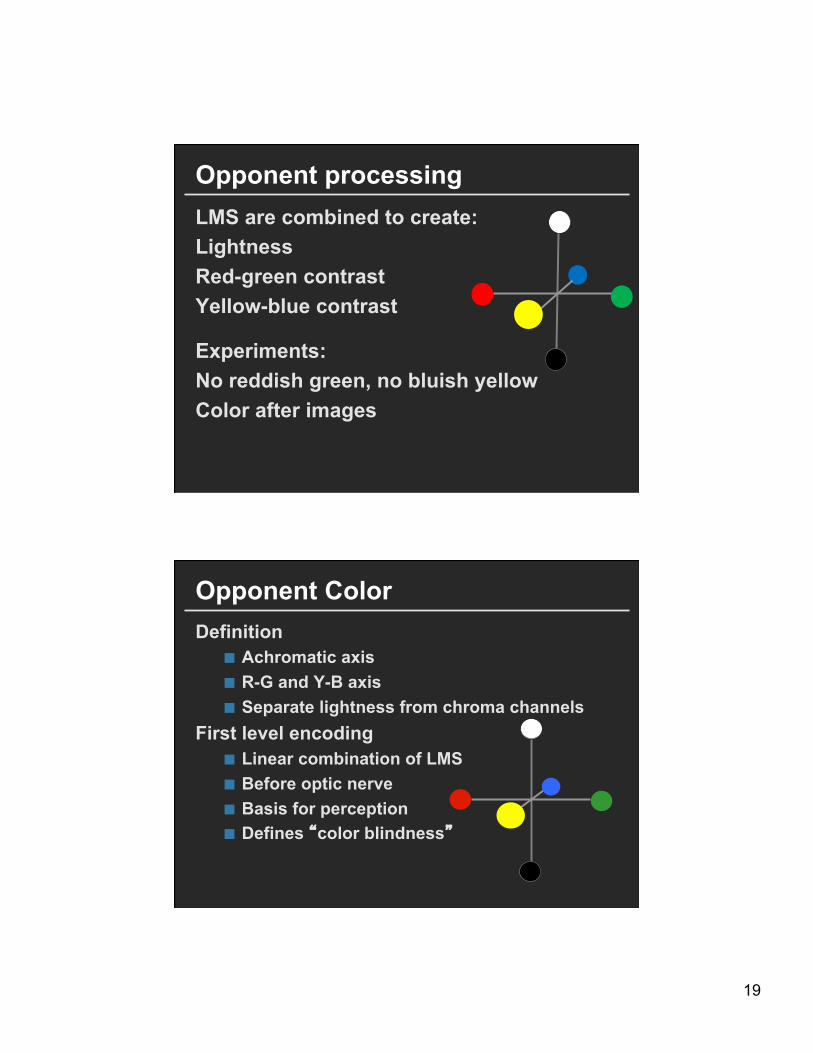
Opponent processing LMS are combined to create: Lightness Red-green contrast Yellow-blue contrast
Experiments: No reddish green, no bluish yellow Color after images
Opponent Color Definition
Achromatic axis R-G and Y-B axis Separate lightness from chroma channels
First level encoding Linear combination of LMS Before optic nerve Basis for perception Defines “color blindness”
20
21
Physical World Visual System Mental Models
Opponent Encoding
Separate lightness, chroma
(A,R-G,Y-B)
Light Energy
Spectral distribution functions
F(λ)
Cone Response
Encode as three values
(L,M,S)
CIE (X,Y,Z)
Appearance Models
Color in Context
Adaptation, Background,
Size, …
CIECAM02
Perceptual Models
Color “Space”
Hue, lightness saturation
CIELAB Munsell (HVC)
Color differences “Intuitive” color spaces
Color scales
Color Models
CIE LAB and LUV color spaces Standardized in 1976 to mathematically
represent opponent processing theory Non-linear transformation of CIE XYZ
CIELAB CIELUV
22
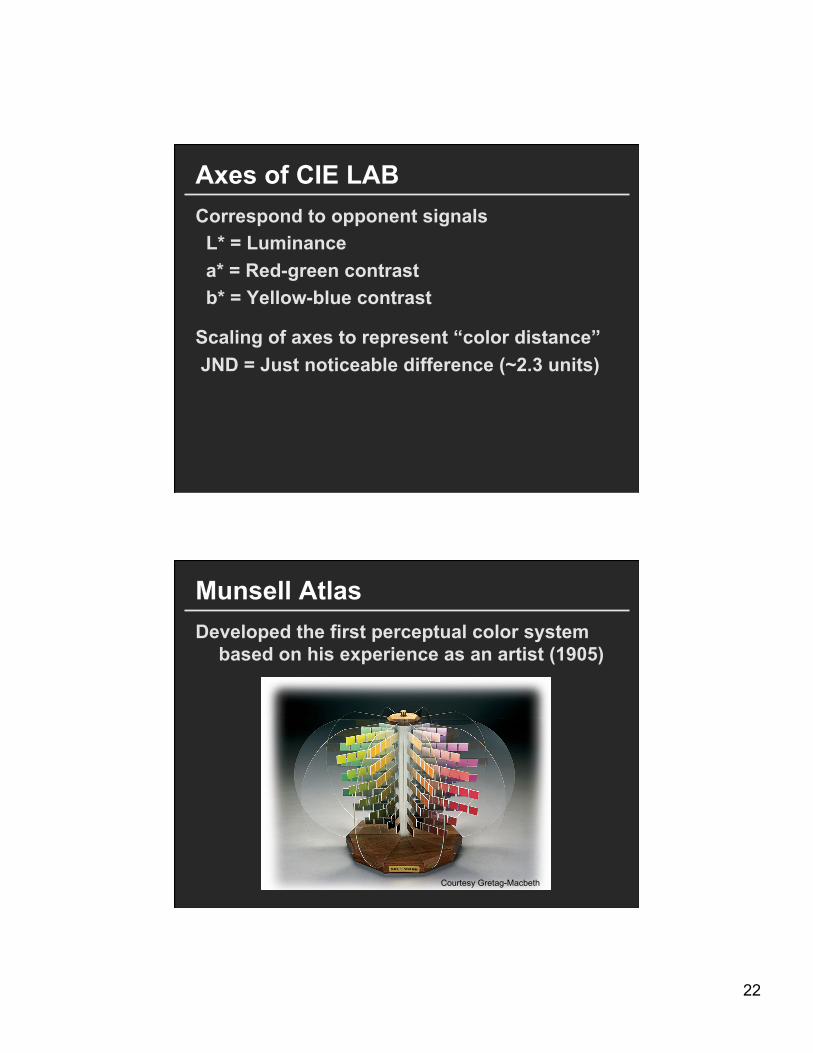
Axes of CIE LAB Correspond to opponent signals L* = Luminance a* = Red-green contrast b* = Yellow-blue contrast
Scaling of axes to represent “color distance” JND = Just noticeable difference (~2.3 units)
Courtesy Gretag-Macbeth
Munsell Atlas Developed the first perceptual color system
based on his experience as an artist (1905)

23
Hue, Value, Chroma
Hue, Value, Chroma
Hue

24
Hue, Value, Chroma
Value
Hue, Value, Chroma
Chroma
25
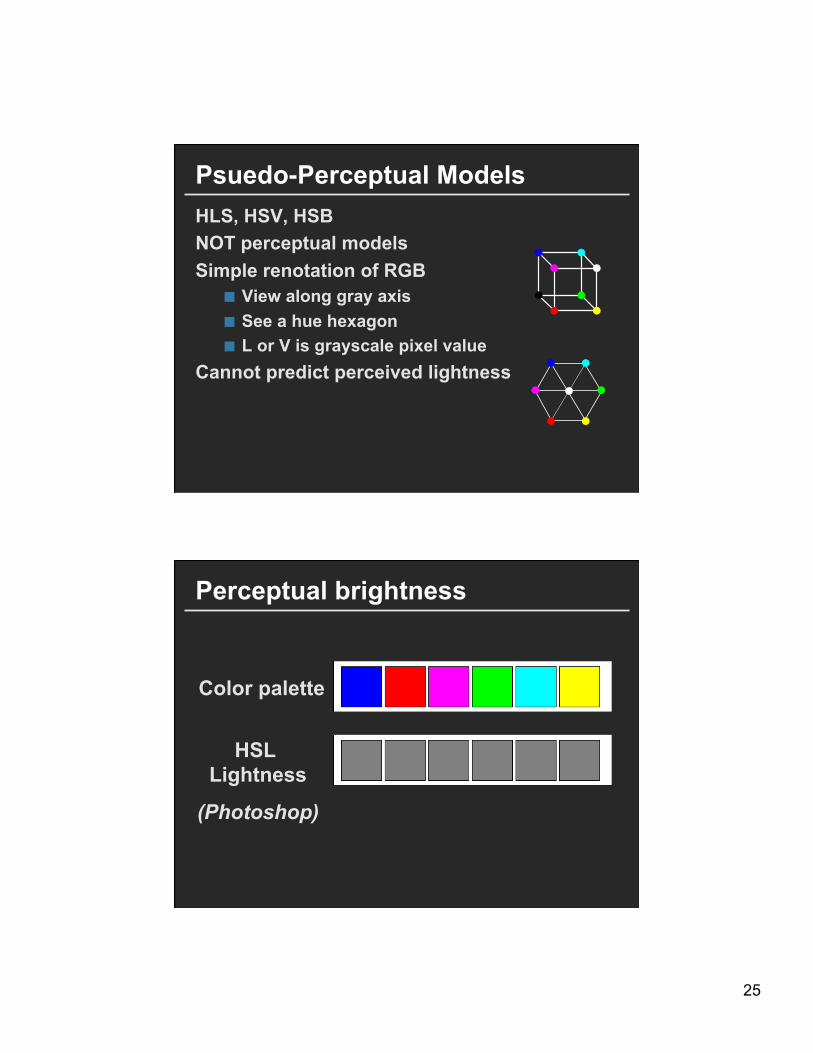
Psuedo-Perceptual Models HLS, HSV, HSB NOT perceptual models Simple renotation of RGB
View along gray axis See a hue hexagon L or V is grayscale pixel value
Cannot predict perceived lightness
Perceptual brightness
Color palette
HSL Lightness
(Photoshop)
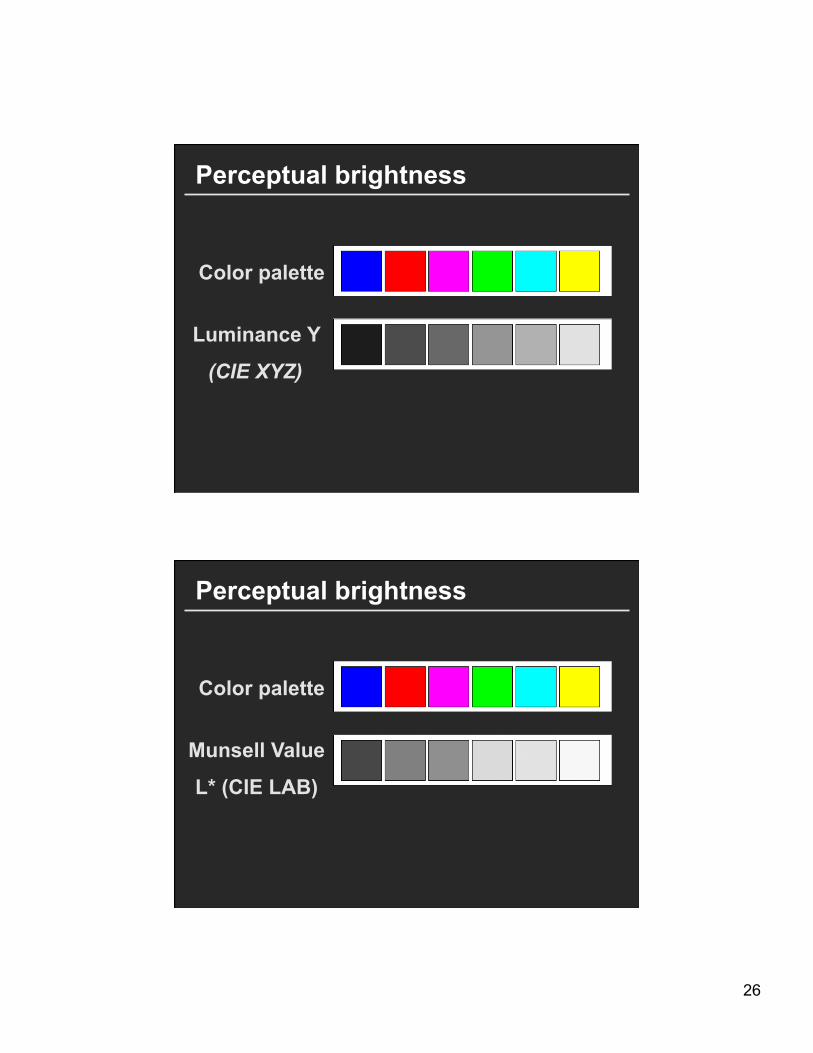
26
Perceptual brightness
Color palette
Luminance Y
(CIE XYZ)
Perceptual brightness
Color palette
Munsell Value
L* (CIE LAB)
27
Physical World Visual System Mental Models
Opponent Encoding
Separate lightness, chroma
(A,R-G,Y-B)
Light Energy
Spectral distribution functions
F(λ)
Cone Response
Encode as three values
(L,M,S)
CIE (X,Y,Z)
Appearance Models
Color in Context
Adaptation, Background,
Size, …
CIECAM02
Perceptual Models
Color “Space”
Hue, lightness saturation
CIELAB Munsell (HVC) Adaptation
Contrast effects Image appearance Complex matching
Color Models
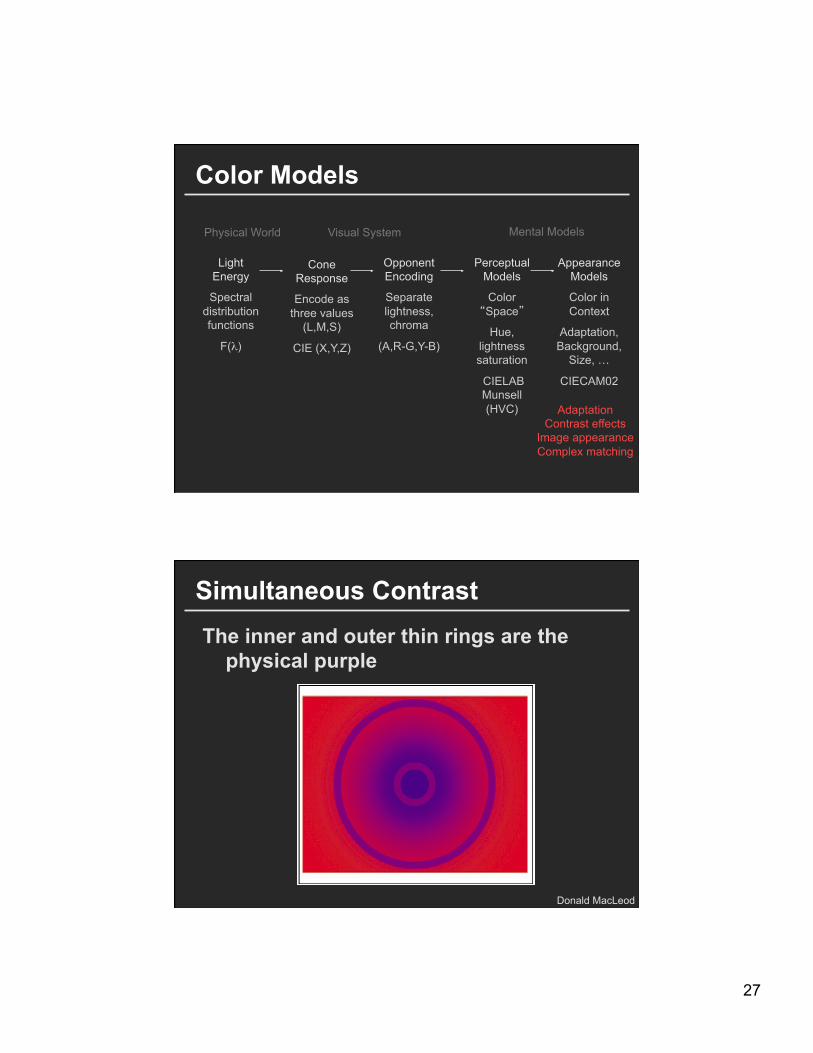
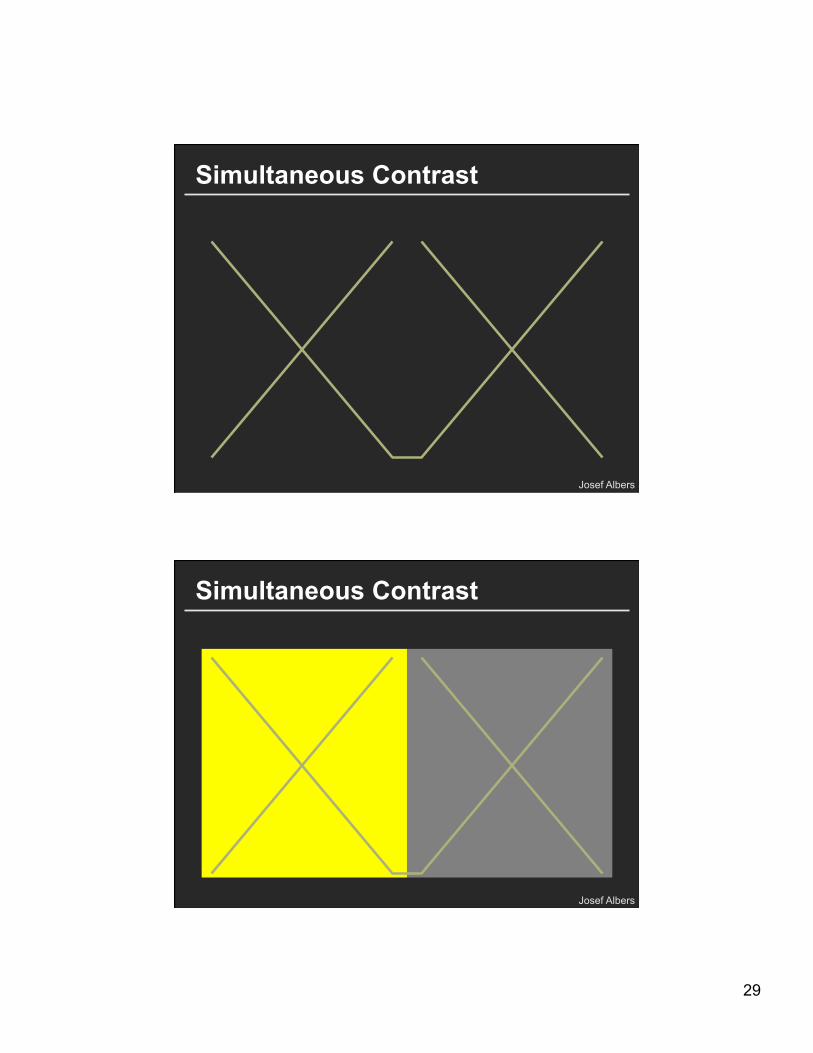
Simultaneous Contrast The inner and outer thin rings are the
physical purple
Donald MacLeod
28
29
Simultaneous Contrast
Josef Albers
Simultaneous Contrast
Josef Albers
30
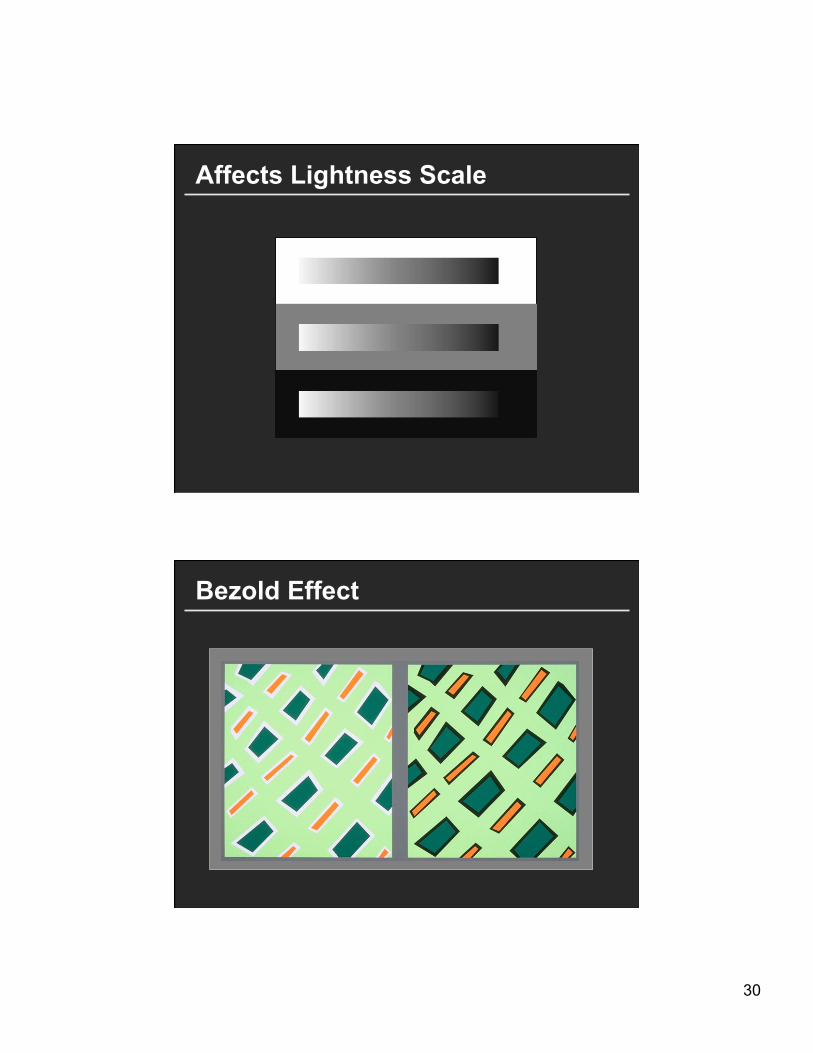
Affects Lightness Scale
Bezold Effect
31
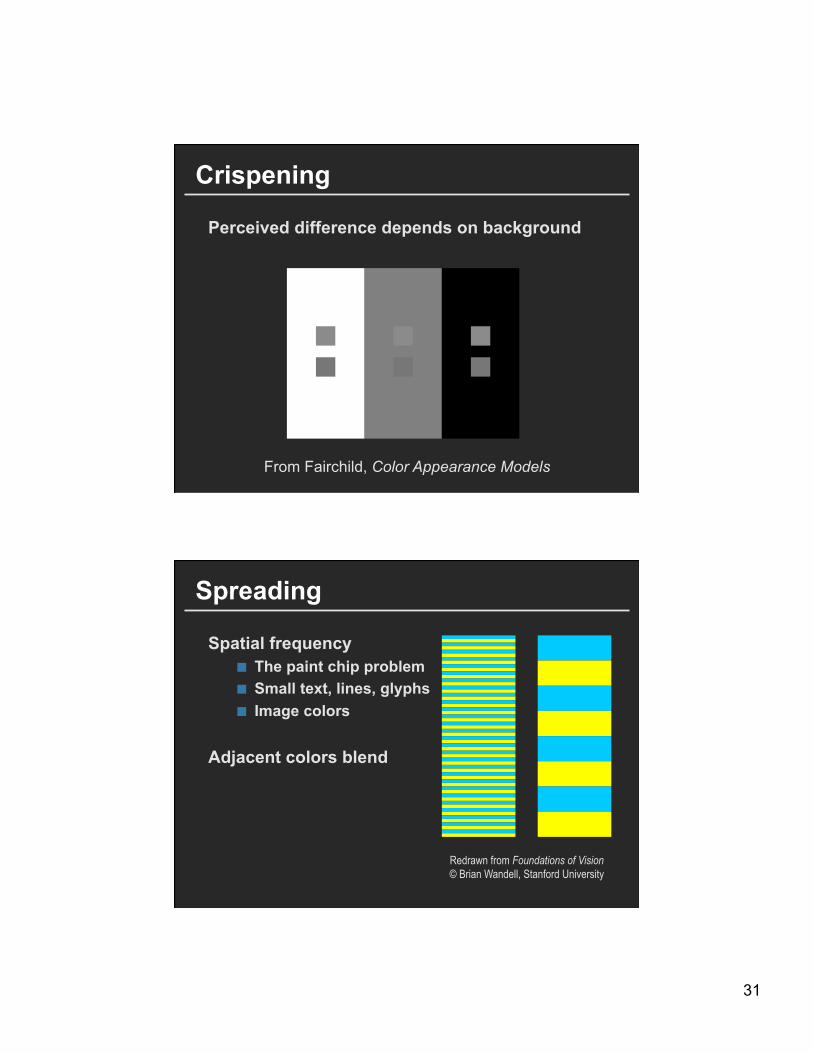
Crispening
Perceived difference depends on background
From Fairchild, Color Appearance Models
Spreading
Spatial frequency The paint chip problem Small text, lines, glyphs Image colors
Adjacent colors blend
Redrawn from Foundations of Vision © Brian Wandell, Stanford University
32
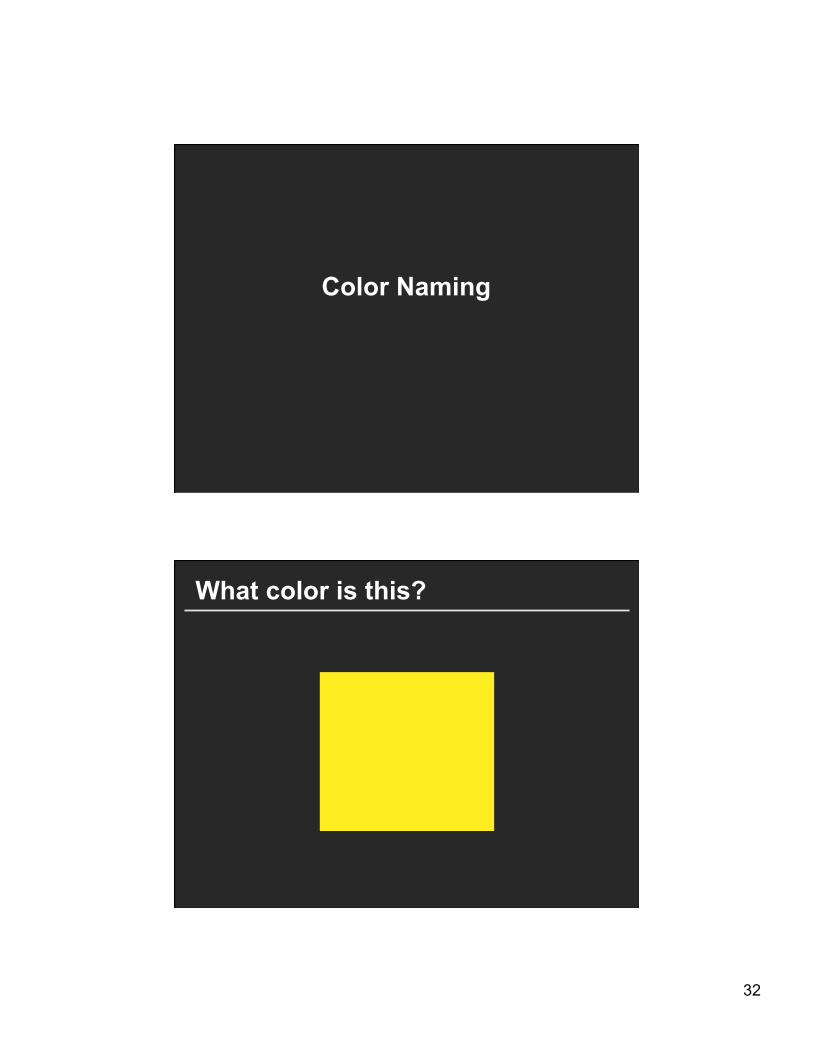
Color Naming
What color is this?
33
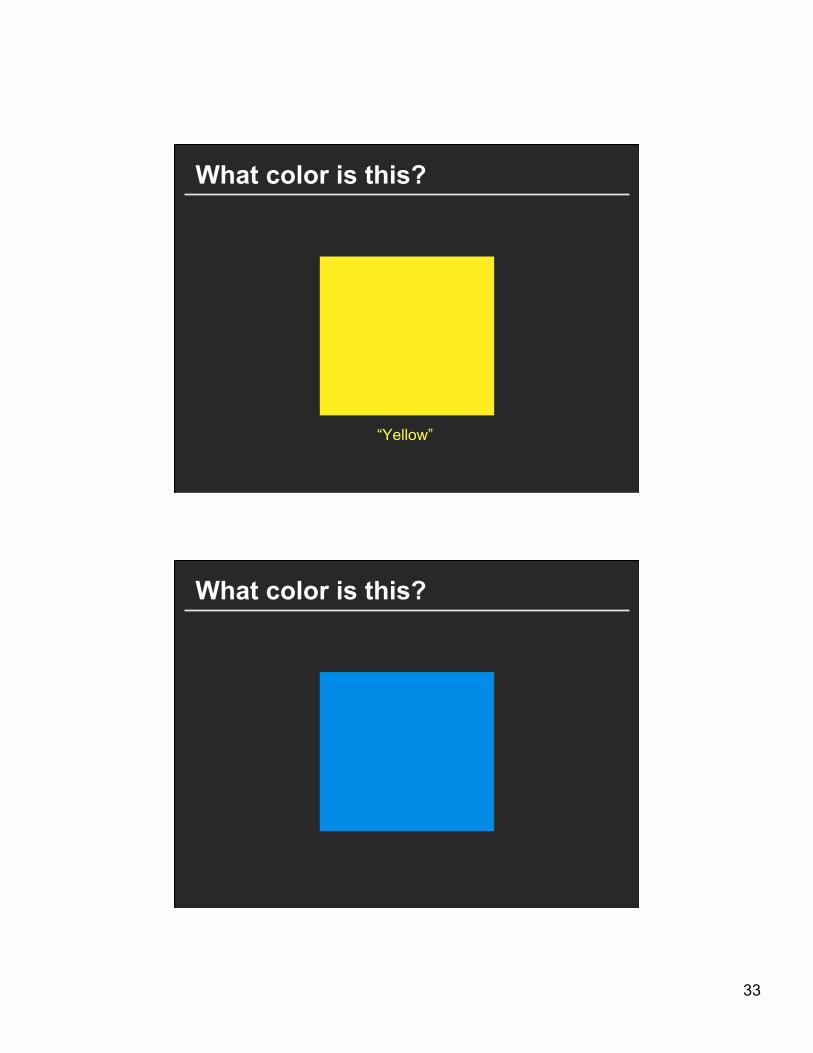
What color is this?
“Yellow”
What color is this?
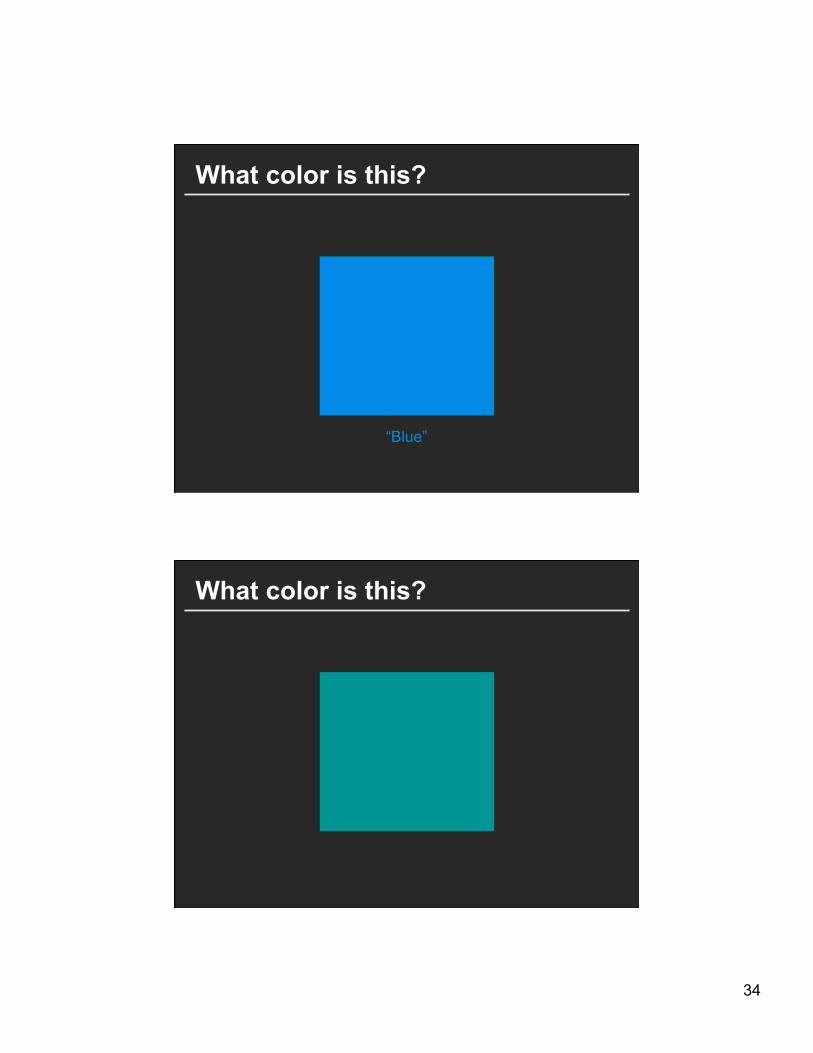
34
What color is this?
“Blue”
What color is this?
35
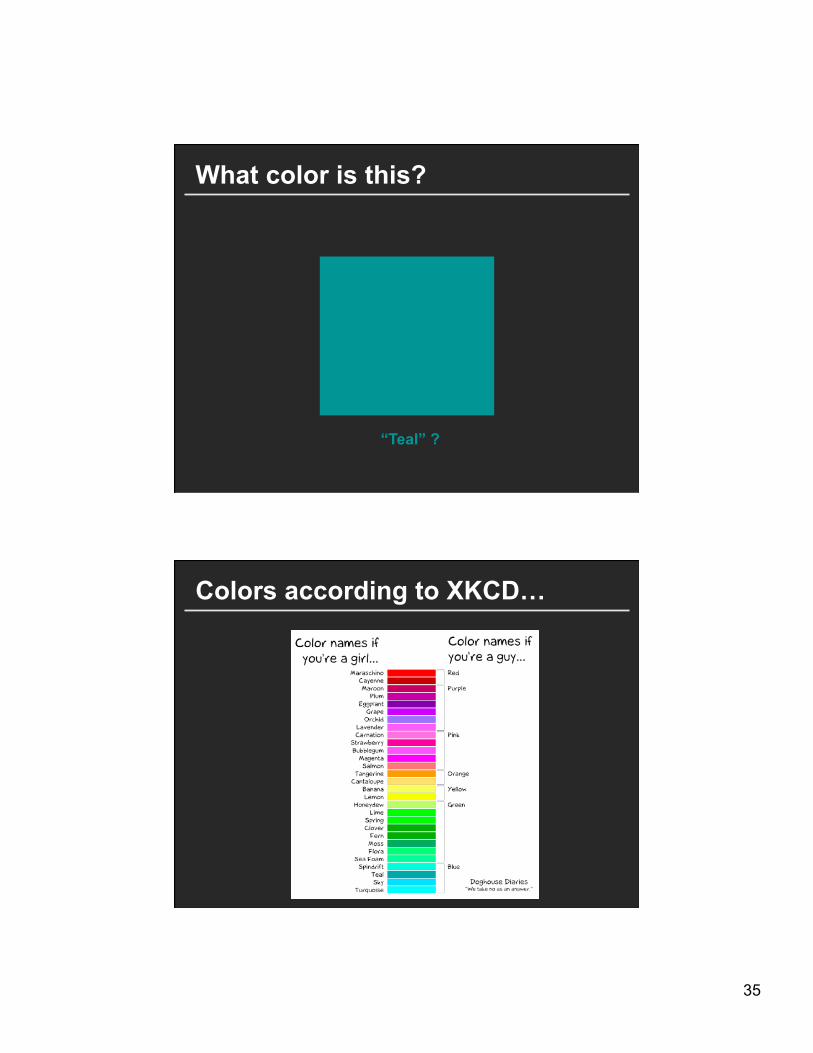
What color is this?
“Teal” ?
Colors according to XKCD…

36
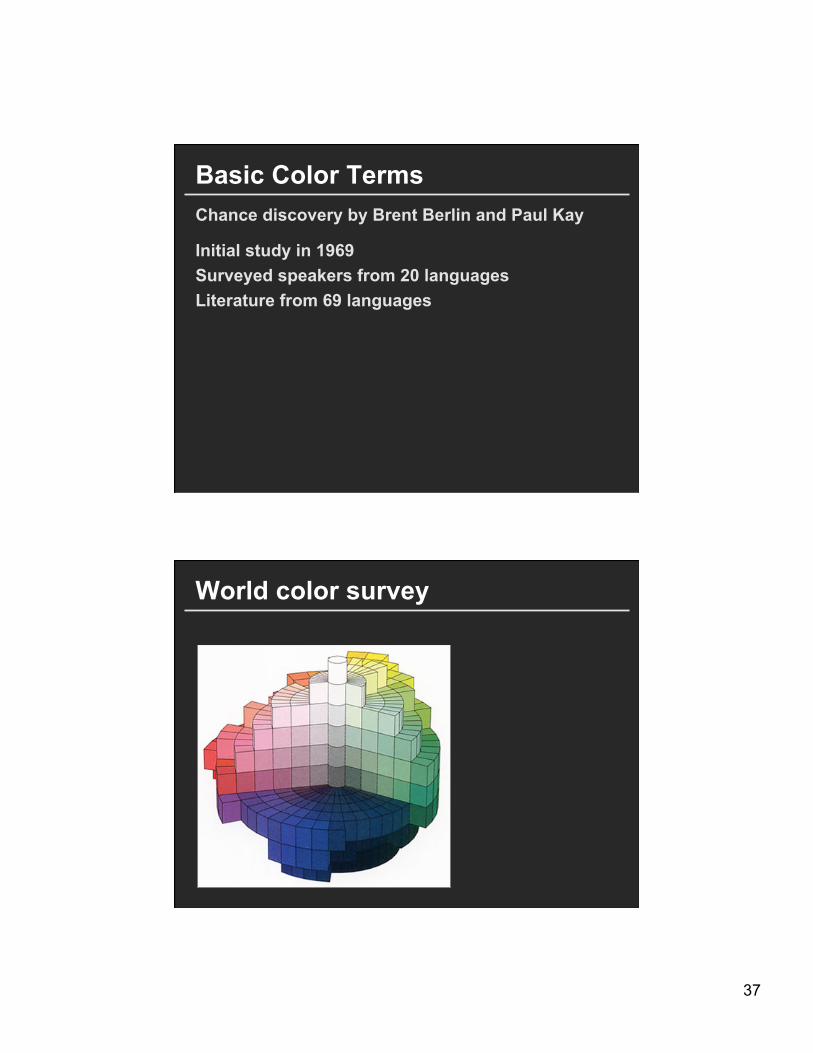
Basic color terms Chance discovery by Brent Berlin and Paul Kay
Basic color terms Chance discovery by Brent Berlin and Paul Kay
37
Basic Color Terms Chance discovery by Brent Berlin and Paul Kay
Initial study in 1969 Surveyed speakers from 20 languages Literature from 69 languages
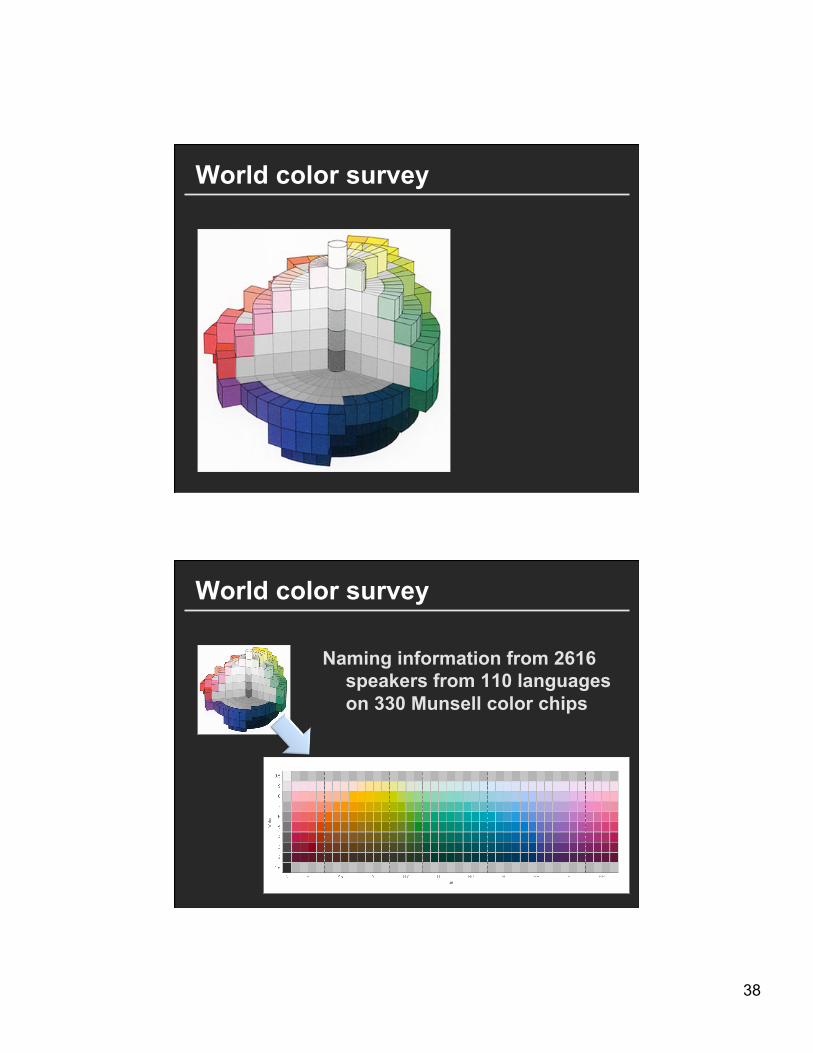
World color survey
38
World color survey
World color survey
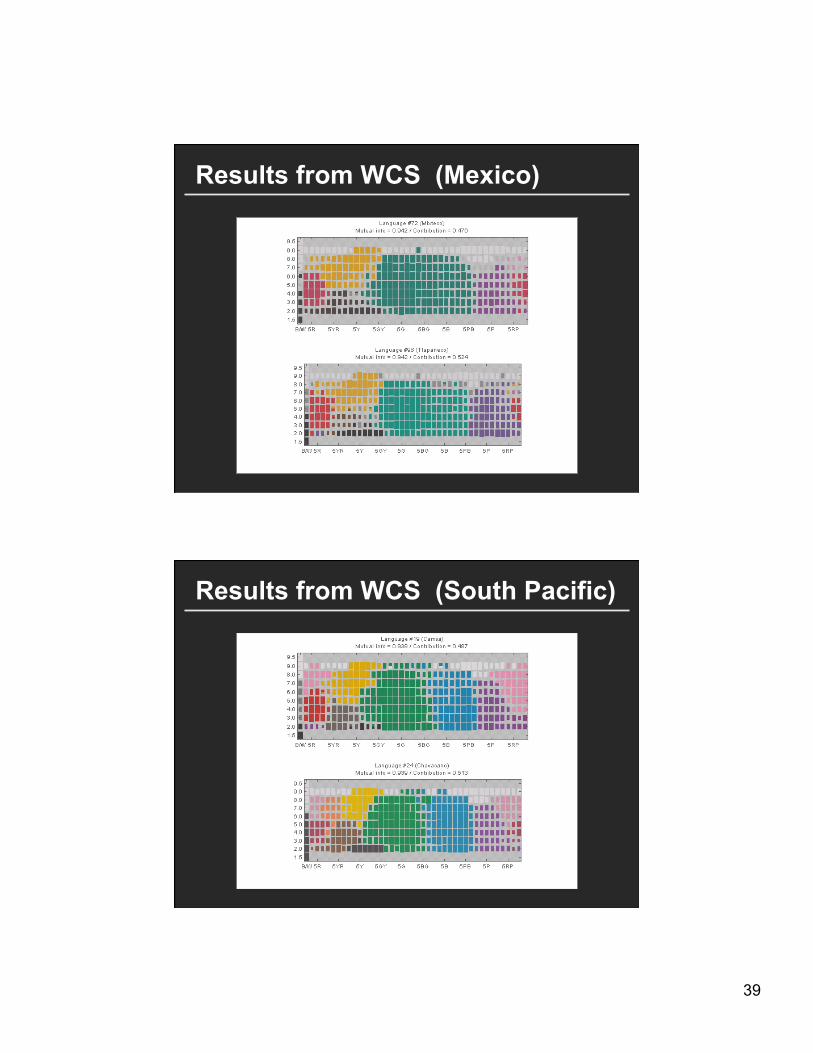
Naming information from 2616 speakers from 110 languages on 330 Munsell color chips
39
Results from WCS (Mexico)
Results from WCS (South Pacific)
40
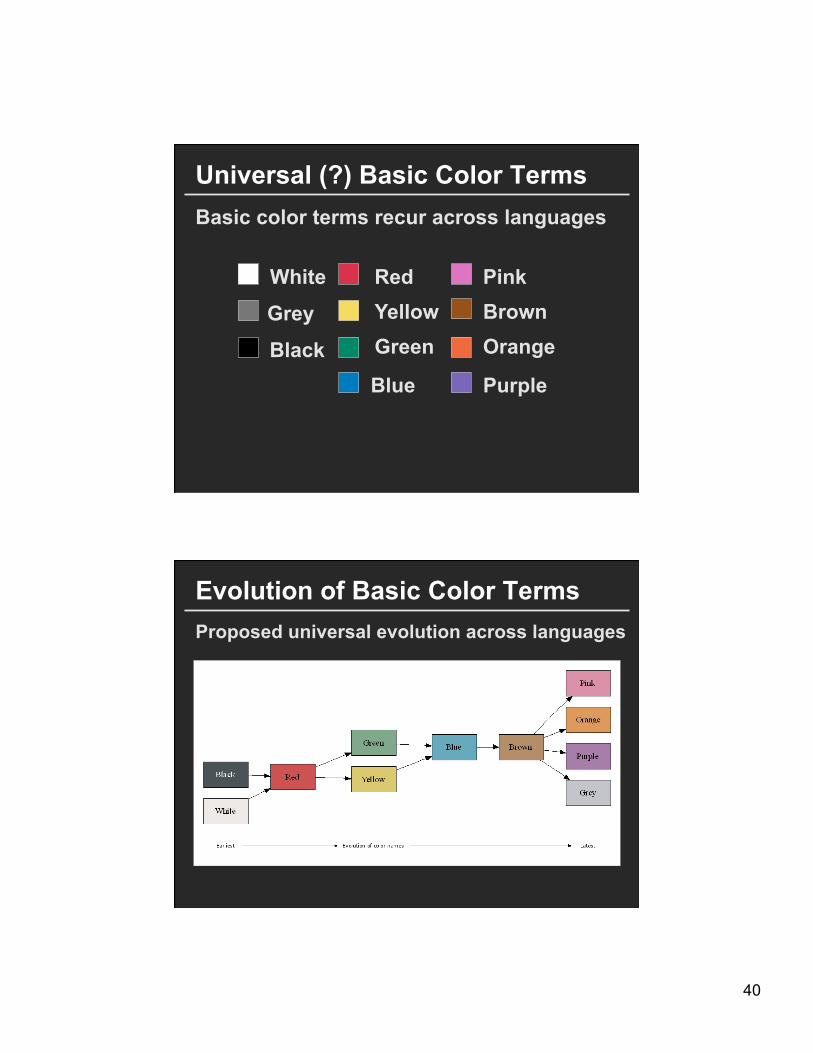
Universal (?) Basic Color Terms Basic color terms recur across languages
White
Grey
Black
Red Yellow Green
Blue
Pink
Orange Brown
Purple
Evolution of Basic Color Terms Proposed universal evolution across languages

41
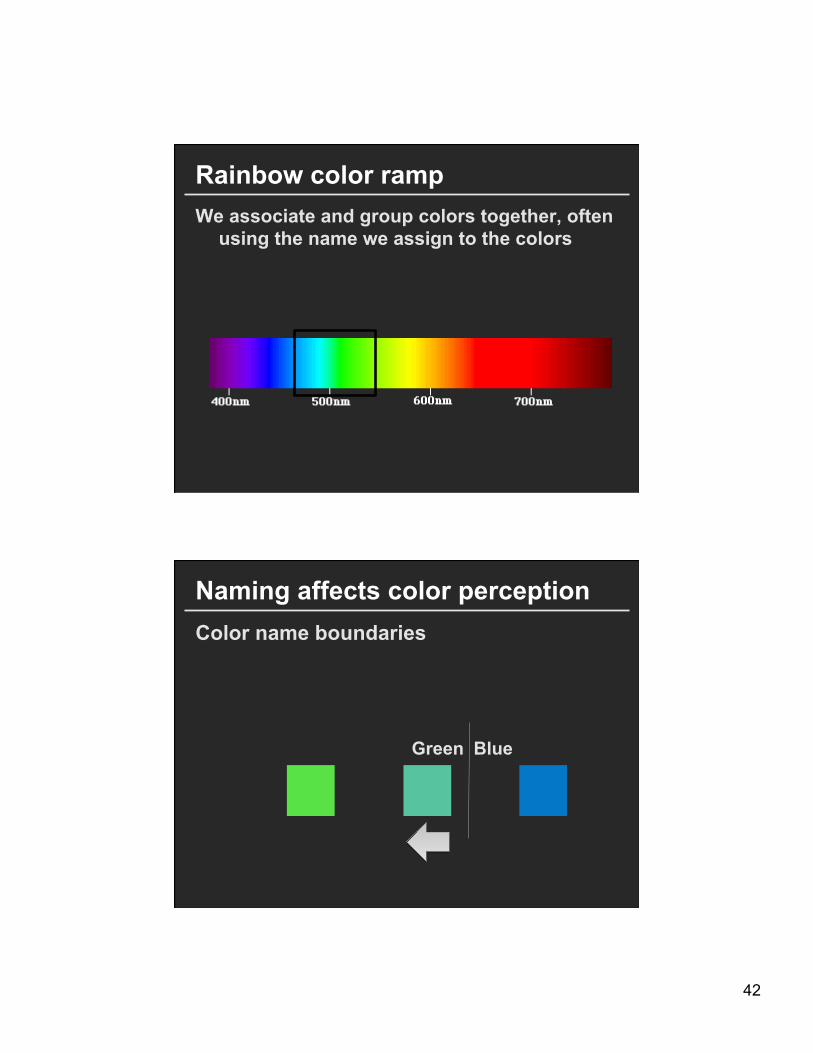
Rainbow color ramp We associate and group colors together, often
using the name we assign to the colors
Rainbow color ramp We associate and group colors together, often
using the name we assign to the colors
42
Rainbow color ramp We associate and group colors together, often
using the name we assign to the colors
Naming affects color perception Color name boundaries
Green Blue
43
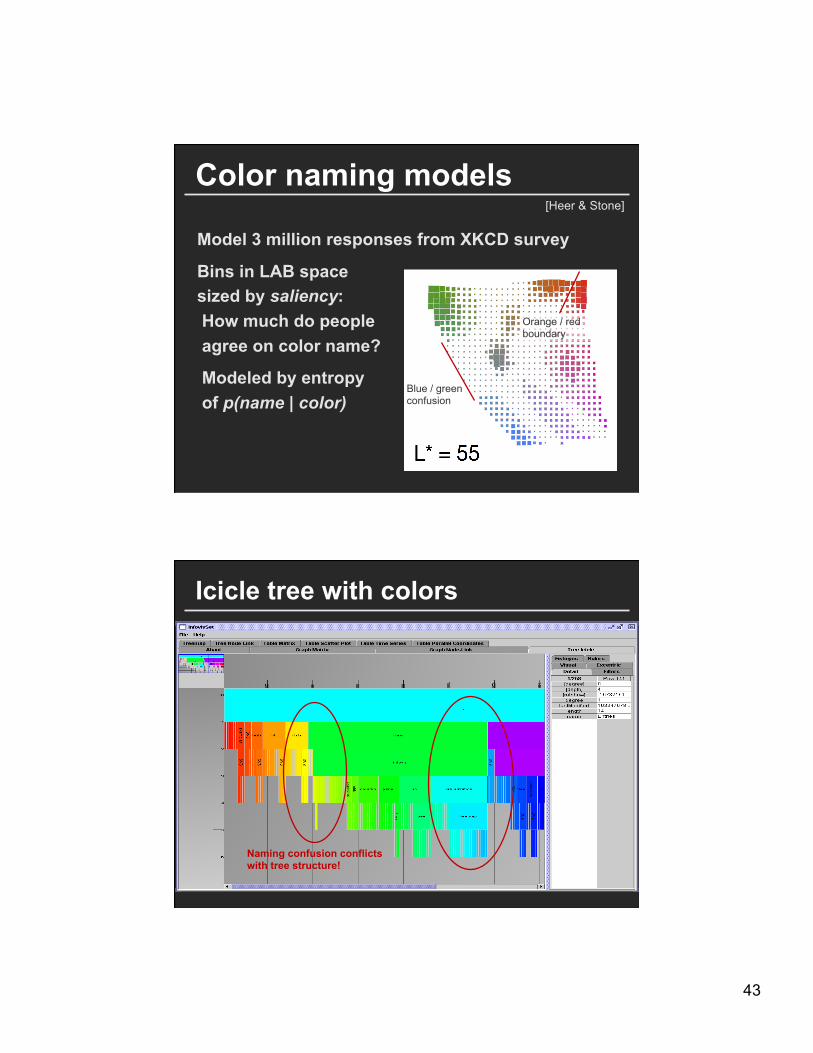
Color naming models
Model 3 million responses from XKCD survey
Bins in LAB space sized by saliency: How much do people agree on color name?
Modeled by entropy of p(name | color)
[Heer & Stone]
Blue / green confusion
Orange / red boundary
Icicle tree with colors
Naming confusion conflicts with tree structure!
44
Using Color in Visualization
To Label
45
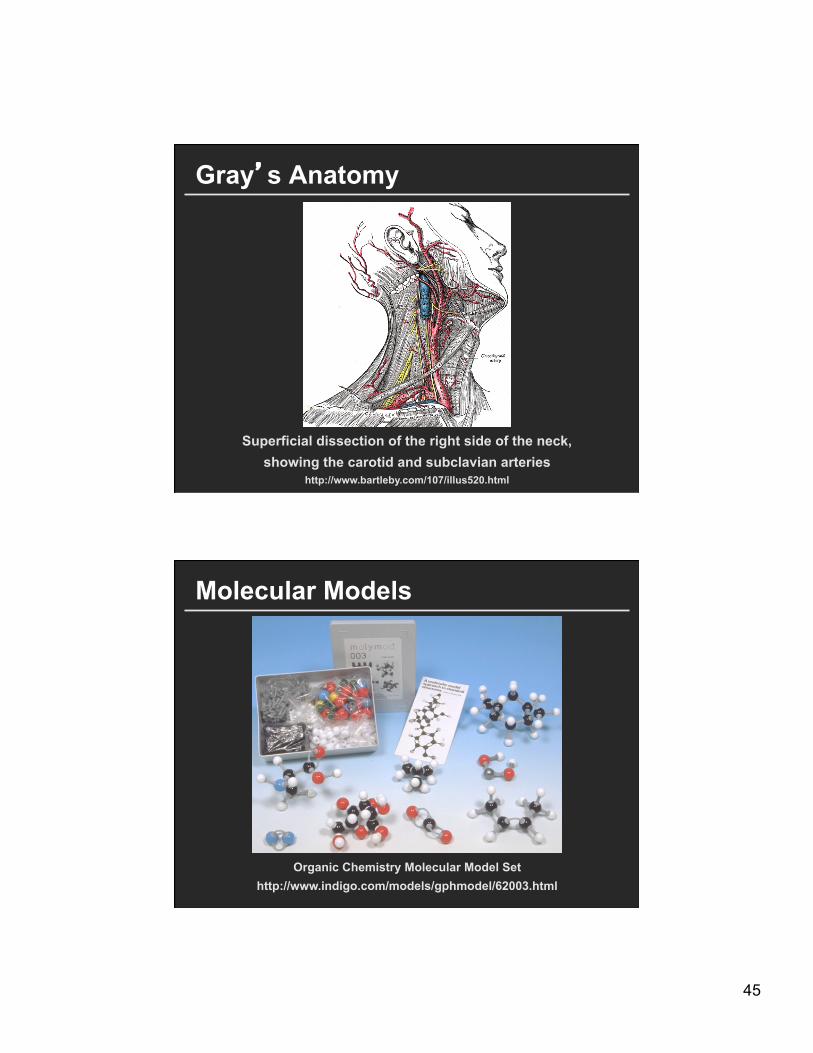
Gray’s Anatomy
Superficial dissection of the right side of the neck, showing the carotid and subclavian arteries
http://www.bartleby.com/107/illus520.html
Molecular Models
Organic Chemistry Molecular Model Set http://www.indigo.com/models/gphmodel/62003.html

46
Product Categories
Created by Tableau - Visual Analysis for DatabasesTM
Grouping, Highlighting
47
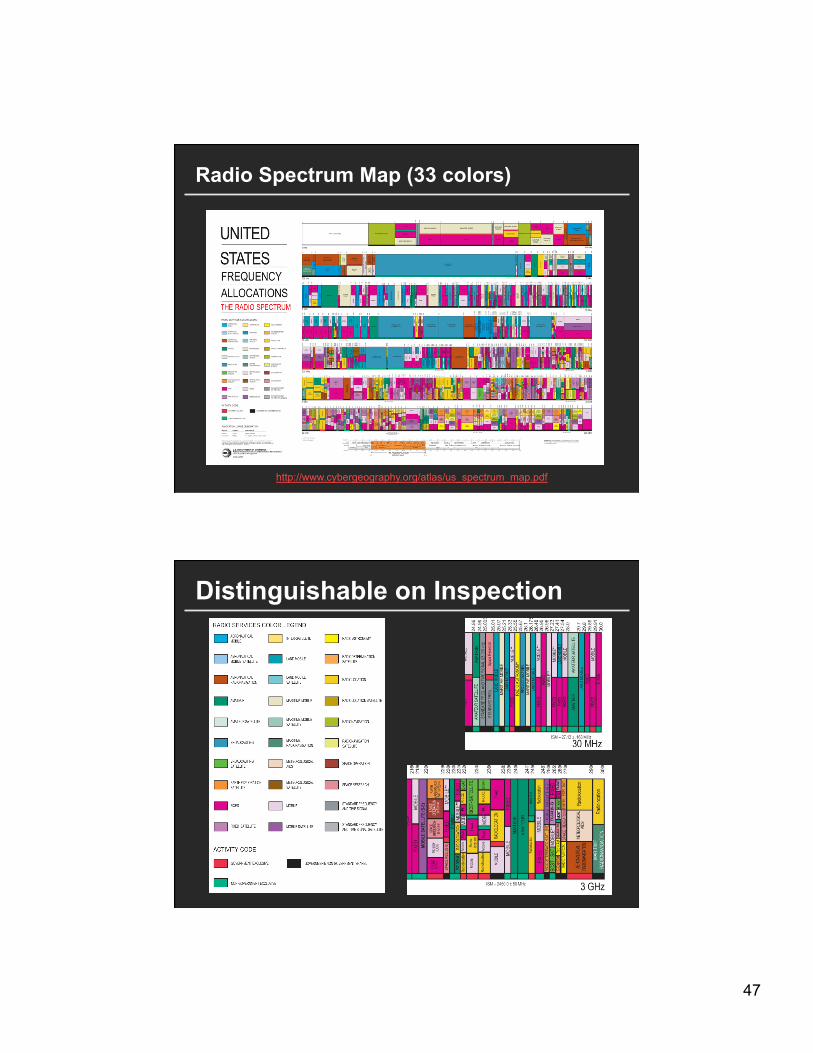
Radio Spectrum Map (33 colors)
http://www.cybergeography.org/atlas/us_spectrum_map.pdf
Distinguishable on Inspection
48
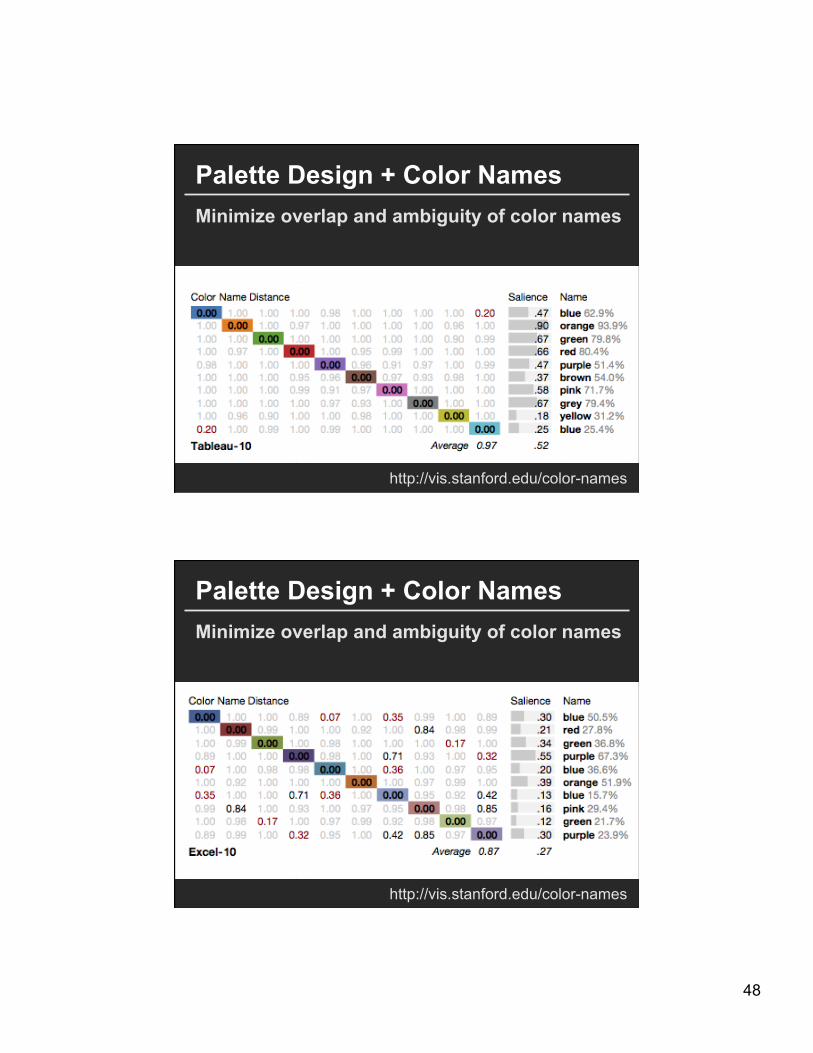
Palette Design + Color Names Minimize overlap and ambiguity of color names
http://vis.stanford.edu/color-names
Palette Design + Color Names Minimize overlap and ambiguity of color names
http://vis.stanford.edu/color-names
49
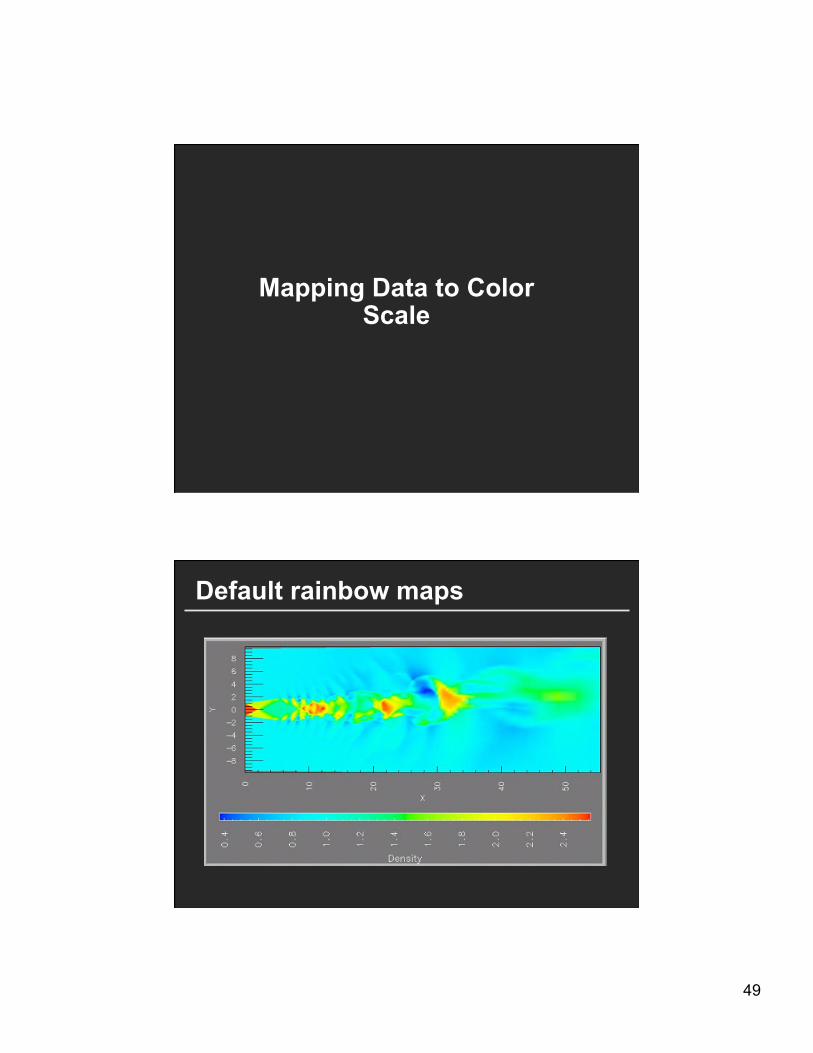
Mapping Data to Color Scale
Default rainbow maps
50
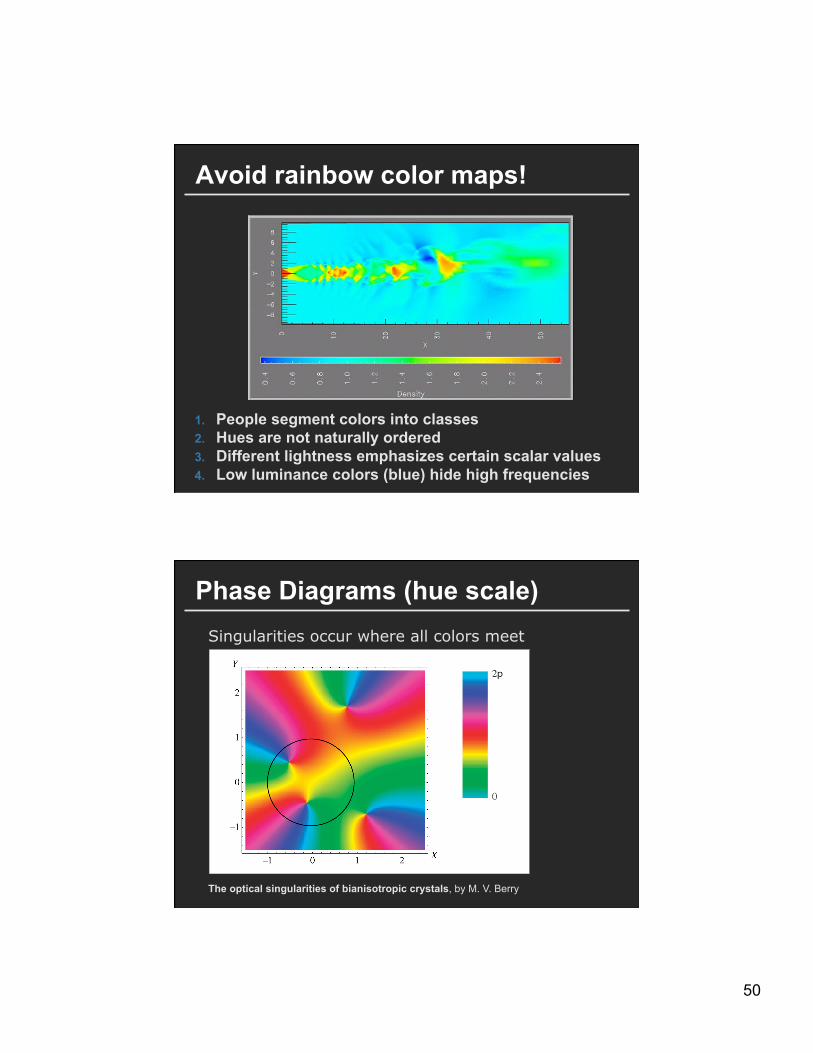
Avoid rainbow color maps!
1. People segment colors into classes 2. Hues are not naturally ordered 3. Different lightness emphasizes certain scalar values 4. Low luminance colors (blue) hide high frequencies
Phase Diagrams (hue scale)
The optical singularities of bianisotropic crystals, by M. V. Berry
Singularities occur where all colors meet
51
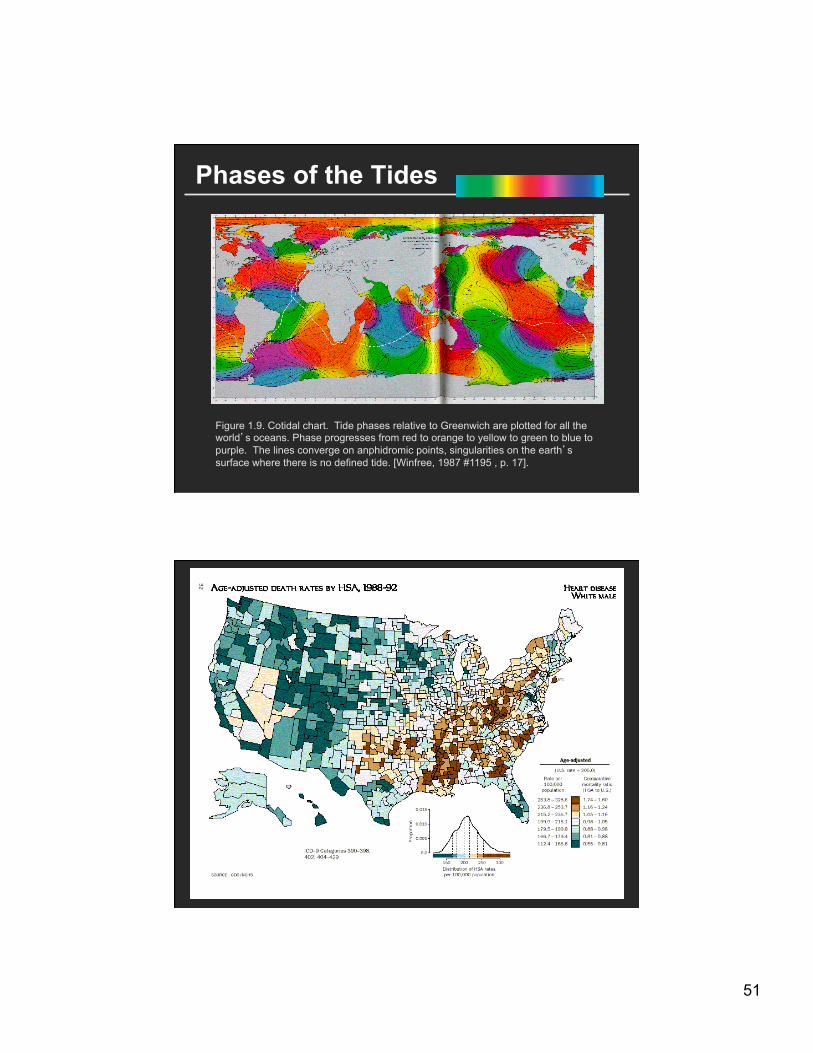
Phases of the Tides
Figure 1.9. Cotidal chart. Tide phases relative to Greenwich are plotted for all the world’s oceans. Phase progresses from red to orange to yellow to green to blue to purple. The lines converge on anphidromic points, singularities on the earth’s surface where there is no defined tide. [Winfree, 1987 #1195 , p. 17].
52
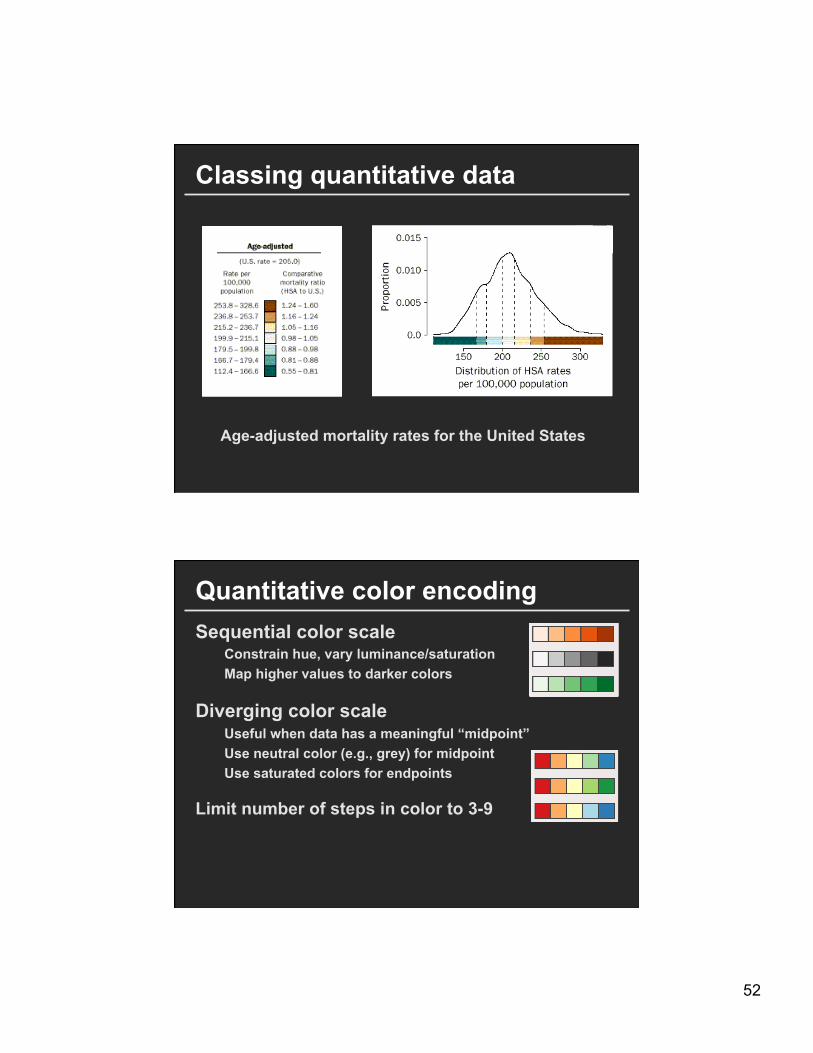
Classing quantitative data
Age-adjusted mortality rates for the United States
Quantitative color encoding Sequential color scale
Constrain hue, vary luminance/saturation Map higher values to darker colors
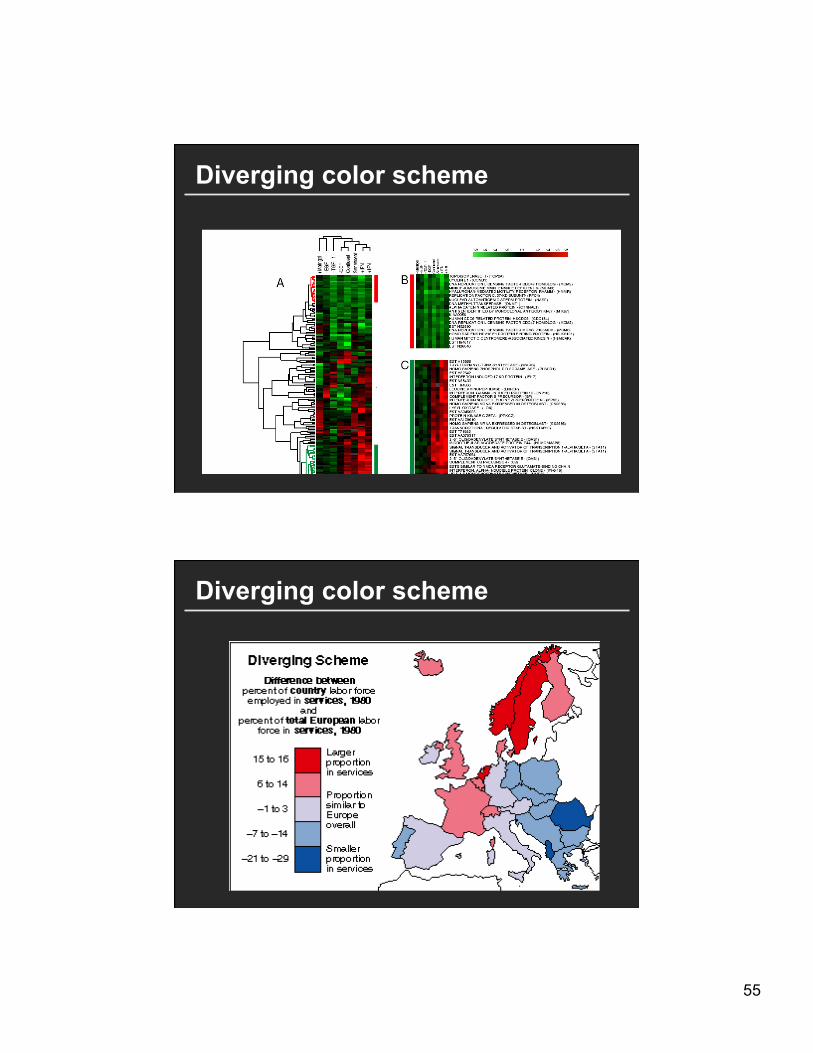
Diverging color scale Useful when data has a meaningful “midpoint” Use neutral color (e.g., grey) for midpoint Use saturated colors for endpoints
Limit number of steps in color to 3-9
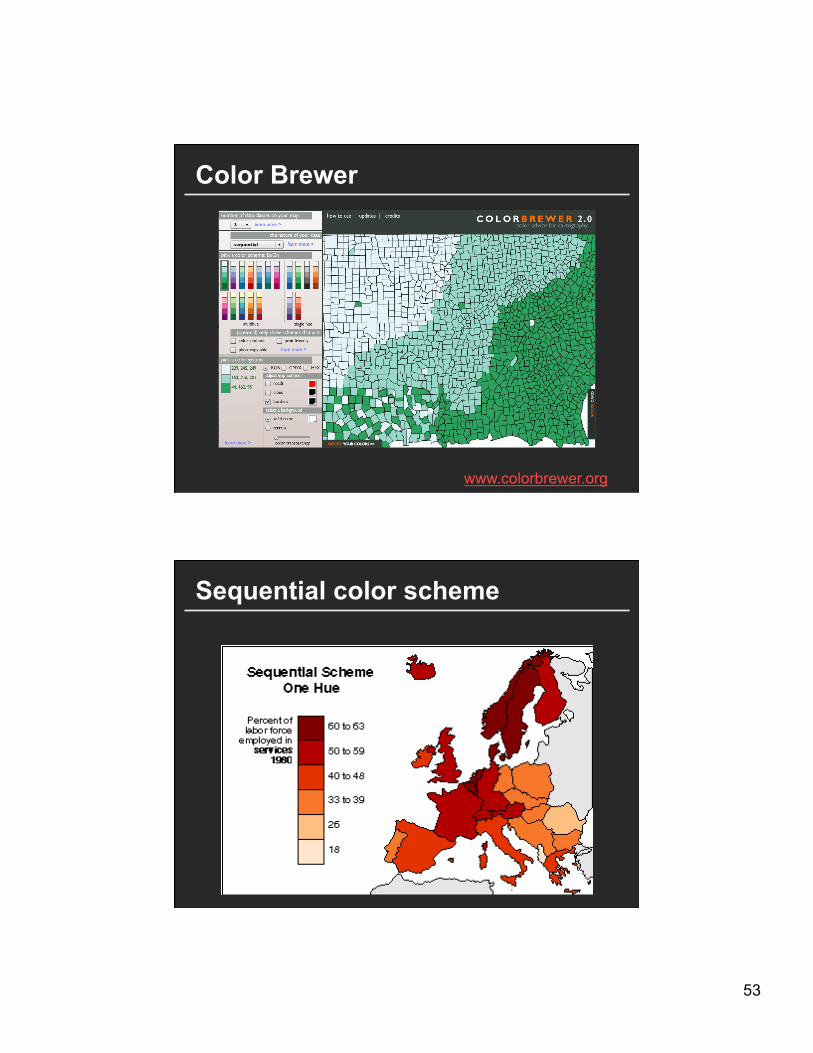
53
www.colorbrewer.org
Color Brewer
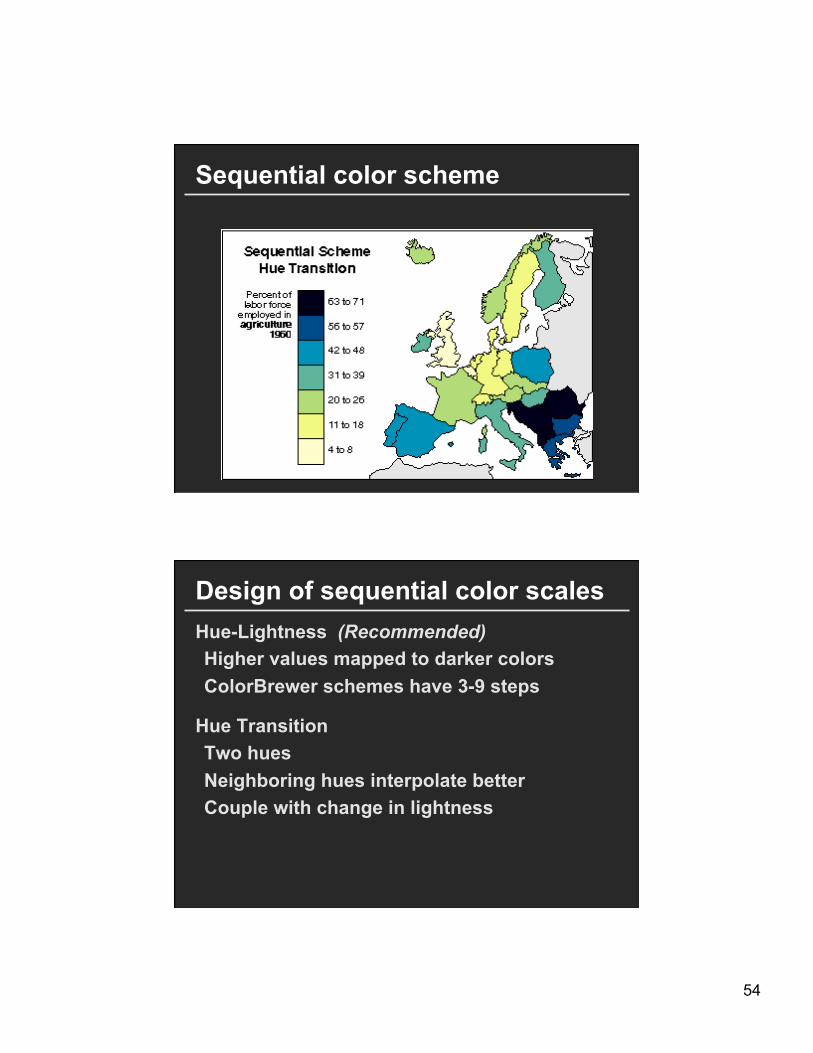
Sequential color scheme
54
Sequential color scheme
Design of sequential color scales Hue-Lightness (Recommended) Higher values mapped to darker colors ColorBrewer schemes have 3-9 steps
Hue Transition Two hues Neighboring hues interpolate better Couple with change in lightness
55
Diverging color scheme
Diverging color scheme

56
Diverging color scheme Hue Transition Carefully handle midpoint
Critical class – Low, Average, High – ‘Average’ should be gray
Critical breakpoint – Defining value e.g. 0 – Positive & negative should use different hues
Extremes saturated, middle desaturated
Hints for the colorist Use only a few colors (~6 ideal) Colors should be distinctive and named Strive for color harmony (natural colors?) Use cultural conventions; appreciate symbolism Beware of bad interactions (red/blue etc.) Get it right in black and white Respect the color blind