collision and grounding frequency analyses in the gulf … · research report vtt-r-06593-09 3 (32)...
TRANSCRIPT

RESEARCH REPORT VTT-R-06593-09
Collision and grounding frequencyanalyses in the Gulf of FinlandAuthors: Tapio Nyman, Markus Porthin, Sampo Karppinen
Confidentiality: Public

RESEARCH REPORT VTT-R-06593-09
2 (32)
Contents
1 Introduction.............................................................................................................3
2 Goal........................................................................................................................5
3 Limitations ..............................................................................................................5
4 Methods..................................................................................................................64.1 GRISK.............................................................................................................6
4.2 Modelling of the sea area................................................................................8
5 Results .................................................................................................................115.1 Traffic analysis ..............................................................................................11
5.2 Collision and grounding frequency analysis..................................................17
6 Validation of the results ........................................................................................226.1 Background...................................................................................................22
6.2 Accidents ......................................................................................................22
6.3 Qualitative validation.....................................................................................25
6.4 Quantitative validation...................................................................................26
7 Conclusions..........................................................................................................30
Appendices................................................................................................................31
References ................................................................................................................32

RESEARCH REPORT VTT-R-06593-09
3 (32)
1 Introduction
The Gulf of Finland is a sea area between Finland and Estonia bordering Russia in the east.The gulf has an area of 29,500 km2, length of 428 km and width of up to 120 km. The deepestparts of the gulf are at its mouth, where there is a deep with a depth of 80–100 metres. Thereare depths of over 100 metres at the southern coast, while the depth at the northern coastnever exceeds 60 metres. Much of the northern shoreline is fairly shallow and rocky, makingit difficult or even dangerous to navigate the coastal waters there without accurate charts. Thedeepest point, 121 m, is at the Estonian coast, just northeast of Tallinn. About 5% of the watermass in the Baltic Sea is located in the Gulf of Finland.
The main concern in the Gulf of Finland is the rapid increase in oil tanker traffic. In 2008 theannual amount of oil transport was about 145 million tons, almost sevenfold compared with1995, and is expected to reach 250 million tons by 2015 (Figure 1). Oil tanker traffic crossesthe Gulf of Finland mainly in the east-west direction, intersecting the routes of frequentpassenger traffic between Helsinki and Tallinn and increasing the risk of serious accidents.
OIL TRANSPORTATION IN THE GULF OF FINLAND THROUGH MAIN OIL PORTSOil transportation in years 1995-2005 and estimated development by year 2015
0
50
100
150
200
250
300
1995 2000 2005 by year2010
by year2015
Others Porvoo Tallinn Sillamäe Ust-Luga St. Petersburg Primorsk Vysotsk
Mill
ion
tonn
es
23rd Feb 2009
Figure 1 Oil transportation in the Gulf of Finland based on port statistics [Source: SYKEand VTT].
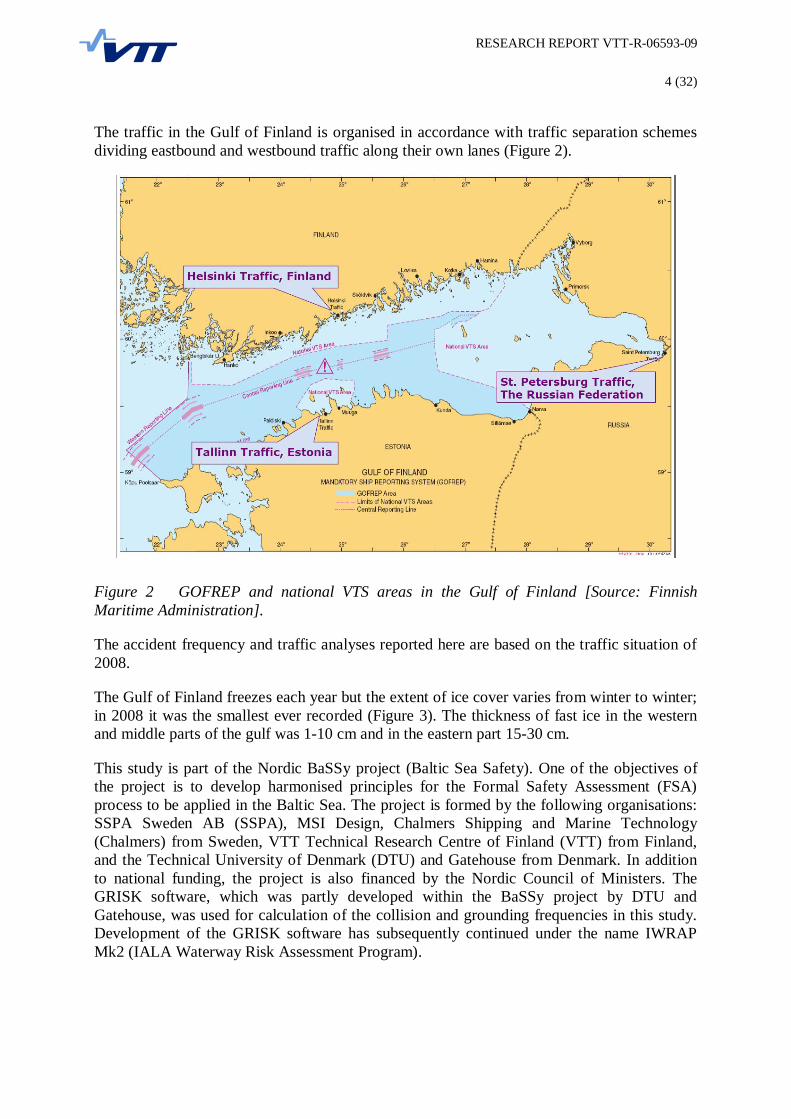
In order to reduce the risk of ship accidents, ship traffic in the Gulf of Finland is monitoredboth by the national VTS stations and the GOFREP system managed in Finland by HelsinkiTraffic, in the Russian Federation by St. Petersburg Traffic, and in Estonia by Tallinn Traffic.The monitoring areas are shown in Figure 2.
RESEARCH REPORT VTT-R-06593-09
4 (32)
The traffic in the Gulf of Finland is organised in accordance with traffic separation schemesdividing eastbound and westbound traffic along their own lanes (Figure 2).
Figure 2 GOFREP and national VTS areas in the Gulf of Finland [Source: FinnishMaritime Administration].
The accident frequency and traffic analyses reported here are based on the traffic situation of2008.
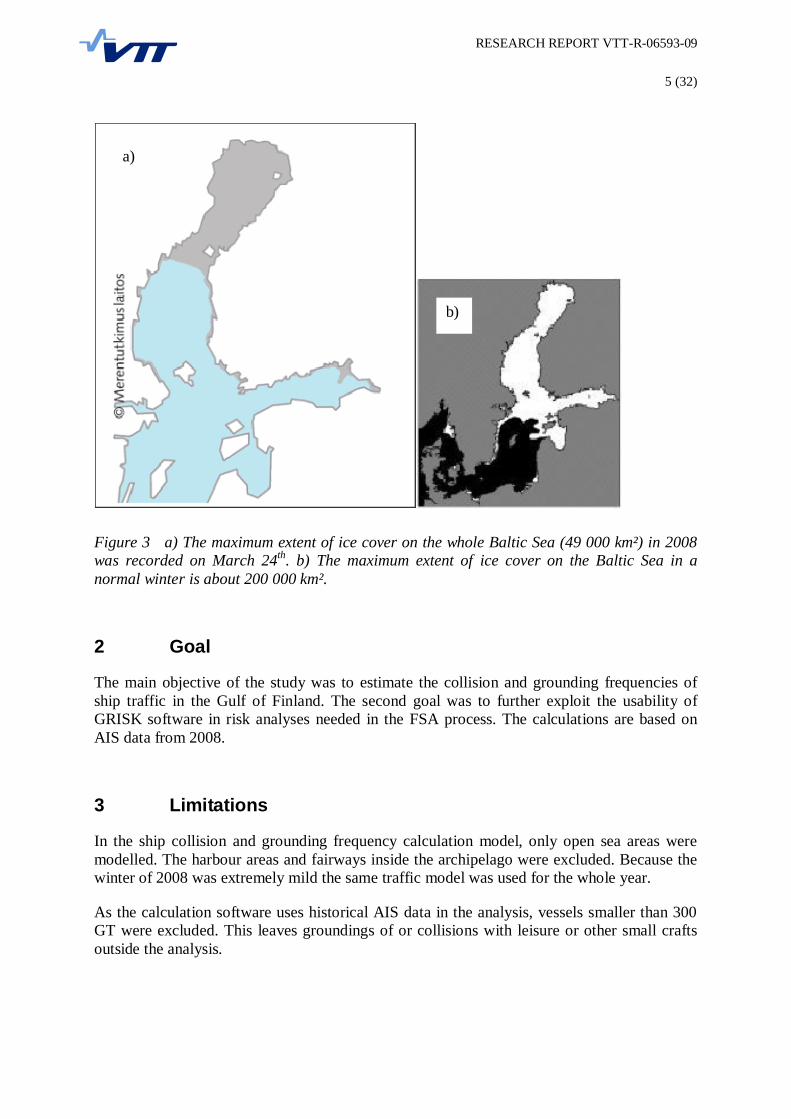
The Gulf of Finland freezes each year but the extent of ice cover varies from winter to winter;in 2008 it was the smallest ever recorded (Figure 3). The thickness of fast ice in the westernand middle parts of the gulf was 1-10 cm and in the eastern part 15-30 cm.
This study is part of the Nordic BaSSy project (Baltic Sea Safety). One of the objectives ofthe project is to develop harmonised principles for the Formal Safety Assessment (FSA)process to be applied in the Baltic Sea. The project is formed by the following organisations:SSPA Sweden AB (SSPA), MSI Design, Chalmers Shipping and Marine Technology(Chalmers) from Sweden, VTT Technical Research Centre of Finland (VTT) from Finland,and the Technical University of Denmark (DTU) and Gatehouse from Denmark. In additionto national funding, the project is also financed by the Nordic Council of Ministers. TheGRISK software, which was partly developed within the BaSSy project by DTU andGatehouse, was used for calculation of the collision and grounding frequencies in this study.Development of the GRISK software has subsequently continued under the name IWRAPMk2 (IALA Waterway Risk Assessment Program).
RESEARCH REPORT VTT-R-06593-09
5 (32)
Figure 3 a) The maximum extent of ice cover on the whole Baltic Sea (49 000 km²) in 2008was recorded on March 24th. b) The maximum extent of ice cover on the Baltic Sea in anormal winter is about 200 000 km².
2 Goal
The main objective of the study was to estimate the collision and grounding frequencies ofship traffic in the Gulf of Finland. The second goal was to further exploit the usability ofGRISK software in risk analyses needed in the FSA process. The calculations are based onAIS data from 2008.
3 Limitations
In the ship collision and grounding frequency calculation model, only open sea areas weremodelled. The harbour areas and fairways inside the archipelago were excluded. Because thewinter of 2008 was extremely mild the same traffic model was used for the whole year.
As the calculation software uses historical AIS data in the analysis, vessels smaller than 300GT were excluded. This leaves groundings of or collisions with leisure or other small craftsoutside the analysis.
a)
b)
RESEARCH REPORT VTT-R-06593-09
6 (32)
4 Methods
4.1 GRISK
Actual calculations to estimate collision and grounding frequencies were performed using theGRISK software version 2.1.1. which was partly developed by DTU and Gatehouse as part ofthe BaSSy project. The software succeeds the GRACAT software (Grounding and CollisionAnalysis Toolbox), which was validated in case studies by the developers. Development ofthe GRISK software has subsequently continued under the name IWRAP Mk2 (IALAWaterway Risk Assessment Program).
In the collision and grounding analysis, the latent accident frequency is first calculated fromthe traffic data. The latent frequency represents the amount of theoretically possible collisionsituations per unit time, assuming blind navigation. The expected frequency of an accidenttype is then obtained by multiplying the latent accident frequency by the expected value of thecausation factor related to the accident type.
The causation factor represents the capability of vessels to notice the presence of a dangerousencounter situation in time and to react by taking sufficient steps to avoid an accident. Thecausation factor depends on several functions related to traffic perception, communication andavoidance actions. It also depends on external factors such as the vessel types involved in theaccident, weather conditions, physical manoeuvre options, etc. The smaller the causationfactor, the better is the capability of the navigators to avoid potential accidents.
With respect to ship-to-ship collision situations, GRISK examines five collision scenariosseparately, namely:
1. Overtaking collision, in which two vessels moving in the same direction collide on astraight leg of a fairway as a result of one overtaking the other
2. Head-on collision, in which two vessels collide on a straight leg of a fairway as a result oftwo-way traffic on the fairway
3. Crossing collision, in which two vessels using different fairways collide at the fairwaycrossing
4. Merging collision, in which two vessels using different fairways collide at the merging ofthe fairways
5. Bend collision, in which two vessels moving in opposite directions on the same fairwaycollide on a turn of the fairway as a result of one of the vessels neglecting or missing theturn (error of omission) and thus coming into contact with the other vessel
GRISK enables the use of different causation factor values for each collision type. In thisstudy, the default causation factor values of GRISK version 2.1.1 were used and are given inTable 1. In addition, a reduction factor of 20 is applied to passenger ships and fast ferries inthe default settings, which means that the causation factor is divided by 20 for these shiptypes.

RESEARCH REPORT VTT-R-06593-09
7 (32)
Table 1 Default causation factor values of GRISK version 2.1.1.
Grounding frequencies were estimated in similar manner as the collisions: first, the latentgrounding frequencies were derived, i.e. number of ships on a grounding course, which werethen multiplied with the corresponding causation factor. Two types of powered groundingswere examined:
1. Ships following the ordinary direct route at normal speed. Accidents in this categoryare mainly due to human error, but may include ships subject to unexpected problemswith the propulsion/steering system that occur in the vicinity of the fixed marinestructure or ground.
2. Ships that failed to change course at a given turning point near the obstacle.
For grounding type 1, the causation factor represents the fraction of the grounding candidateswhich fail to avoid the obstacle, whereas for type 2 the causation factor represents the fractionfailing to change course at the given point. In type 2, the vessel can still avoid grounding afterfailing to make a turn if it is able to detect the error in time. The officer of the watch isassumed to check the position of the ship randomly following a Poisson process. The

RESEARCH REPORT VTT-R-06593-09
8 (32)
checking frequency is determined by a modelling parameter called the average time betweenchecks. The collision and grounding analysis methodology is further described in [1]. Thedrift grounding calculation module was not used in the analysis.
GRISK takes into account different characteristics of ships such as length, width, speed etc.by categorising ships according to ship type and length. The ship types used are crude oiltanker, oil products tanker, chemical tanker, gas tanker, container ship, general cargo ship,bulk carrier, Ro-Ro cargo ship, passenger ship, fast ferry, support ship, fishing ship, pleasureboat and other ship.
Water depth information was needed in the grounding risk analysis module in the GRISKsoftware. For this analysis, electronic nautical chart material including coastlines and waterdepth curves were received from the FMA. The chart material was converted from ESRIShapefile (.shp) format into XML for use in the GRISK software. The conversion process isdescribed in Appendix 1.
4.2 Modelling of the sea area
Calculation of the collision frequencies is based on careful specification of the operationalenvironment of the ship traffic considered. The ship routes relevant to the present study werebased on a density plot of the 2008 AIS data covering the examined sea area (Figure 4). Theroutes consist of legs that are defined as straight lines between given waypoints (Figure 5).
Figure 4 Ship traffic density plot and locations of the selected accidents in the Gulf ofFinland. The red markers denote the position of a collision; the green markers denotegrounding sites. Letter “A” in the marker denotes accidents that occurred after and letter“B” before implementation of the GOFREP system.

RESEARCH REPORT VTT-R-06593-09
9 (32)
Figure 5 Traffic model used in the study.
AIS traffic data for 2008 were also used for estimating the annual numbers of vessels ofdifferent types and lengths on the various routes. The AIS signals were allocated to the routenet by defining reference lines to each traffic leg. All ships that cross a reference line with lessthan a 20 angle to the leg are associated with that leg. A relatively small proportion of thetotal traffic does not fulfil the given conditions and is therefore discarded from the analysis.However, this is judged not to have any significant effect on the analysis. The ship types wereascertained from the Lloyd’s Database.
The lateral distribution of traffic on each route leg was specified based on AIS data.Histograms of the traffic crossing the reference line of each leg was processed from the AISdata as shown in the example in Figure 6. Theoretical distributions consisting of a mixture ofeither a normal distribution and a uniform distribution or two normal distributions were thenfitted to the histograms as shown in Figure 7.

RESEARCH REPORT VTT-R-06593-09
10 (32)
Figure 6 Example of a histogram showing the observed lateral distribution of traffic on aleg.
Figure 7 Example of a theoretical distribution (solid red line) fitted to the observed traffic(dashed blue line). Southbound traffic on the left and northbound on the right.

RESEARCH REPORT VTT-R-06593-09
11 (32)
5 Results
5.1 Traffic analysis
Traffic analyses in this study were performed using the GRISK software and are basedprimarily on historical AIS data recorded in 2008. In addition, HELCOM AIS statistics wereused in the analysis as a comparison.
The majority the ship traffic in the longitudinal direction on the Gulf of Finland follows therouteing system based on a sequence of Traffic Separation Schemes established on the Gulf ofFinland (green line in Figure 8). According to the traffic analysis the annual number ofvessels sailing along this route is almost 28000 vessels (including both directions) at thewestern end, decreasing eastwards to about 14500 vessels in the easternmost leg. The trafficconsists mainly of container and general cargo ships (about 50% of vessels), but Ro-Ro cargoships and oil product tankers are a significant part of the traffic on the western half of theroute. About 5% of the vessels are crude oil tankers, most of them over 225 m in length,sailing the entire longitudinal route on the Gulf of Finland. The amount of traffic divided intodifferent ship types on six legs along this route is shown in and . The location of the selectedlegs is shown in .
Figure 8 Main traffic routes in the Gulf of Finland used in the calculation model. Main routein the east–west direction along the Traffic Separation Schemes (green line) and the mainroute between Helsinki and Tallinn (red line).

RESEARCH REPORT VTT-R-06593-09
12 (32)
LEG 105Total 25866 ships
0
1000
2000
3000
40005000
6000
7000
1 2 3 4 5 6 7 8 9 10 11 12 13 14Ship type
Num
ber o
f shi
ps
LEG 103Total 27768 ships
010002000300040005000600070008000
1 2 3 4 5 6 7 8 9 10 11 12 13 14Ship type
Num
ber o
f shi
ps
LEG 94Total 24787 ships
010002000300040005000600070008000
1 2 3 4 5 6 7 8 9 10 11 12 13 14Ship type
Num
ber o
f shi
pd
LEG 91Total 16364 ships
0
1000
2000
3000
40005000
6000
7000
1 2 3 4 5 6 7 8 9 10 11 12 13 14Ship type
Num
ber o
f shi
ps
LEG 2Total 16670 ships
0
1000
2000
3000
4000
5000
6000
1 2 3 4 5 6 7 8 9 10 11 12 13 14Ship type
Num
ber o
f shi
ps
LEG 1Total 14568 ships
0
1000
2000
3000
4000
5000
6000
1 2 3 4 5 6 7 8 9 10 11 12 13 14Ship type
Num
ber o
f shi
ps
Figure 9 Main longitudinal traffic flow in the Gulf of Finland (green line in Figure 8).Number of vessels divided by ship type crossing Legs 105, 103, 94, 91, 2 and 1 in bothdirections. The column numbers are as follows: 1 = crude oil tanker, 2 = oil products tanker,3 = chemical tanker, 4 = gas tanker, 5 = container ship, 6 = general cargo ship, 7 = bulkcarrier, 8 = Ro-Ro cargo ship, 9 = passenger ship, 10 = fast ferry, 11 = support ship, 12 =fishing ship, 13 = pleasure boat and 14 = other ship.

RESEARCH REPORT VTT-R-06593-09
13 (32)
Table 2 Number of ships divided by ship type on different legs of the longitudinal main routein the Gulf of Finland.
Number of shipsShip typeShiptype Leg 105 Leg 103 Leg 94 Leg 91 Leg 2 Leg 1
Crude oil tanker 1 1471 1515 1328 737 1128 73
Oil products tanker 2 3586 3726 4168 1369 1323 999
Chemical tanker 3 164 186 217 51 24 24
Gas tanker 4 147 159 140 0 0 0
Container ship 5 6548 6854 5971 4803 5042 4883
General cargo ship 6 5258 5809 7419 5766 5314 5124
Bulk carrier 7 1192 1244 1212 902 949 674
Ro-Ro cargo ship 8 4744 5040 2796 1175 1286 1248
Passenger ship 9 1008 1101 452 756 840 828
Fast ferry 10 868 1036 7 6 11 8
Support ship 11 175 234 242 238 192 180
Fishing ship 12 63 65 40 39 33 34
Pleasure boat 13 39 41 42 48 47 47
Other ship 14 603 758 753 474 481 446
Sum 25866 27768 24787 16364 16670 14568
Ship traffic in the transverse direction across the Gulf of Finland runs mostly betweenHelsinki and Tallinn (red line in Figure 8). The annual number of vessels on this route isabout 13500 vessels (including both directions) in the north, decreasing to about 10000vessels in the south. Roughly half of the traffic consists of fast passenger ferry traffic betweenHelsinki and Tallinn, the other half being mostly container and passenger ships. On thenorthern part of the route, Ro-Ro cargo ships sailing between Helsinki and ports around theBaltic Sea and North Sea form a significant part of the traffic. The results of the trafficanalysis are shown in greater detail in Figure 10 and Table 3.
In addition to the traffic on the main routes mentioned above, there is significant traffic fromthe Finnish ports to Sweden following the Finnish coastline on the north side of the routeingsystem. Passenger-car ferry traffic between Helsinki and Stockholm is an important part of

RESEARCH REPORT VTT-R-06593-09
14 (32)
this traffic. Also joining this flow is the passenger-car ferry traffic between Tallinn andStockholm via Mariehamn. Totally this comes to 5000 vessels sailing annually through Leg40 in Figure 8. Half of the traffic is passenger vessels and one quarter is container ships(Figure 11).
Another significant longitudinal traffic flow outside the main traffic routes in the Gulf ofFinland is traffic following the Estonian north coast on the south side of the routeing systemand being directed towards ports around the Baltic Sea and elsewhere in Europe. This traffic(Leg 65 in Figure 8) consists of about 4300 vessels. Some 60% of these are general cargoships, 13% container ships and 13% Ro-Ro cargo ships (Figure 12).
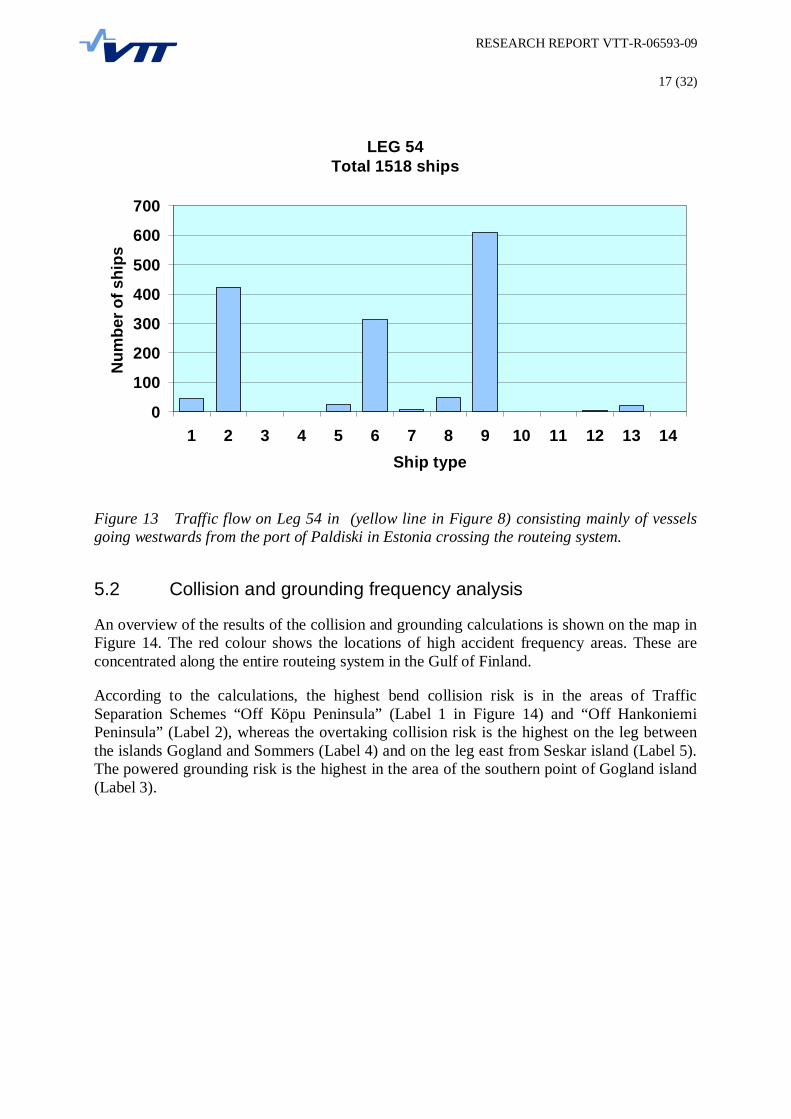
The third traffic flow outside the main traffic routes of the Gulf of Finland moves westwardsfrom the port of Paldiski in Estonia, crossing the routeing system and consisting of about1500 vessels (Leg 54 in Figure 8). Of this traffic, 40% is passenger ships sailing dailybetween Paldiski and Kapellskär, 28% is oil products tankers, and 20% is general cargo ships(Figure 13).
The annual numbers of vessels of different types and lengths on each leg in the traffic modelare presented in Appendix 2.
LEG 25Total 13520 ships
010002000300040005000600070008000
1 2 3 4 5 6 7 8 9 10 11 12 13 14Ship type
Num
ber o
f shi
ps
LEG 29Total 12720 ships
0
1000
2000
3000
4000
5000
6000
1 2 3 4 5 6 7 8 9 10 11 12 13 14Ship type
Num
ber o
f shi
ps
LEG 23Total 12034 ships
0
1000
2000
3000
40005000
6000
7000
1 2 3 4 5 6 7 8 9 10 11 12 13 14Ship type
Num
ber o
f shi
ps
LEG 184Total 9853 ships
0
1000
2000
3000
4000
5000
6000
1 2 3 4 5 6 7 8 9 10 11 12 13 14Ship type
Num
ber o
f shi
ps
Figure 10 Main traffic flow in the transverse direction on the Gulf of Finland (red line inFigure 8). Number of vessels divided by ship type crossing Legs 25, 29, 23 and 184 in bothdirections. The column numbers are as follows: 1 = crude oil tanker, 2 = oil products tanker,3 = chemical tanker, 4 = gas tanker, 5 = container ship, 6 = general cargo ship, 7 = bulkcarrier, 8 = Ro-Ro cargo ship, 9 = passenger ship, 10 = fast ferry, 11 = support ship, 12 =fishing ship, 13 = pleasure boat and 14 = other ship.

RESEARCH REPORT VTT-R-06593-09
15 (32)
Table 3 Number of ships divided by ship type on different legs of the transverse main routein the Gulf of Finland.
Number of ships
Ship type
Shiptypenumber Leg 25 Leg 29 Leg 23 Leg 184
Crude oil tanker 1 0 0 9 2
Oil products tanker 2 49 68 27 26
Chemical tanker 3 2 8 1 1
Gas tanker 4 2 0 0 0
Container ship 5 3040 2199 2560 1949
General cargo ship 6 155 292 159 19
Bulk carrier 7 0 0 2 0
Ro-Ro cargo ship 8 495 1822 6 1
Passenger ship 9 2896 2610 2690 2164
Fast ferry 10 6804 4857 6518 5605
Support ship 11 19 97 14 25
Fishing ship 12 0 0 0 0
Pleasure boat 13 1 4 1 1
Other ship 14 57 763 47 60
Sum 13520 12720 12034 9853

RESEARCH REPORT VTT-R-06593-09
16 (32)
LEG 40Total 5166 ships
0
500
1000
1500
2000
2500
3000
1 2 3 4 5 6 7 8 9 10 11 12 13 14Ship type
Num
ber o
f shi
ps
Figure 11 Traffic flow on Leg 40 in (blue line in Figure 8) consisting mainly of vesselsgoing from Finnish and Estonian ports to Stockholm and vice versa.
LEG 65Total 4312 ships
0
500
1000
1500
2000
2500
3000
1 2 3 4 5 6 7 8 9 10 11 12 13 14Ship type
Num
ber o
f shi
ps
Figure 12 Traffic flow on Leg 65 in (brown line Figure 8) consisting mainly of vessels goingfrom Estonia to ports around the Baltic Sea outside the Gulf of Finland and European portsand vice versa.
RESEARCH REPORT VTT-R-06593-09
17 (32)
LEG 54Total 1518 ships
0
100
200
300
400
500
600
700
1 2 3 4 5 6 7 8 9 10 11 12 13 14Ship type
Num
ber o
f shi
ps
Figure 13 Traffic flow on Leg 54 in (yellow line in Figure 8) consisting mainly of vesselsgoing westwards from the port of Paldiski in Estonia crossing the routeing system.
5.2 Collision and grounding frequency analysis
An overview of the results of the collision and grounding calculations is shown on the map inFigure 14. The red colour shows the locations of high accident frequency areas. These areconcentrated along the entire routeing system in the Gulf of Finland.
According to the calculations, the highest bend collision risk is in the areas of TrafficSeparation Schemes “Off Köpu Peninsula” (Label 1 in Figure 14) and “Off HankoniemiPeninsula” (Label 2), whereas the overtaking collision risk is the highest on the leg betweenthe islands Gogland and Sommers (Label 4) and on the leg east from Seskar island (Label 5).The powered grounding risk is the highest in the area of the southern point of Gogland island(Label 3).

RESEARCH REPORT VTT-R-06593-09
18 (32)
Figure 14 Results of collision and grounding frequency analysis. The legs, waypoints andshoreline areas with the highest accident frequencies are shown in red. Positions 1 and 2 arewaypoints with a high frequency of bending collisions, position 3 denotes a high frequency ofpowered groundings, and positions 4 and 5 denote legs with a high frequency of overtakingcollisions.
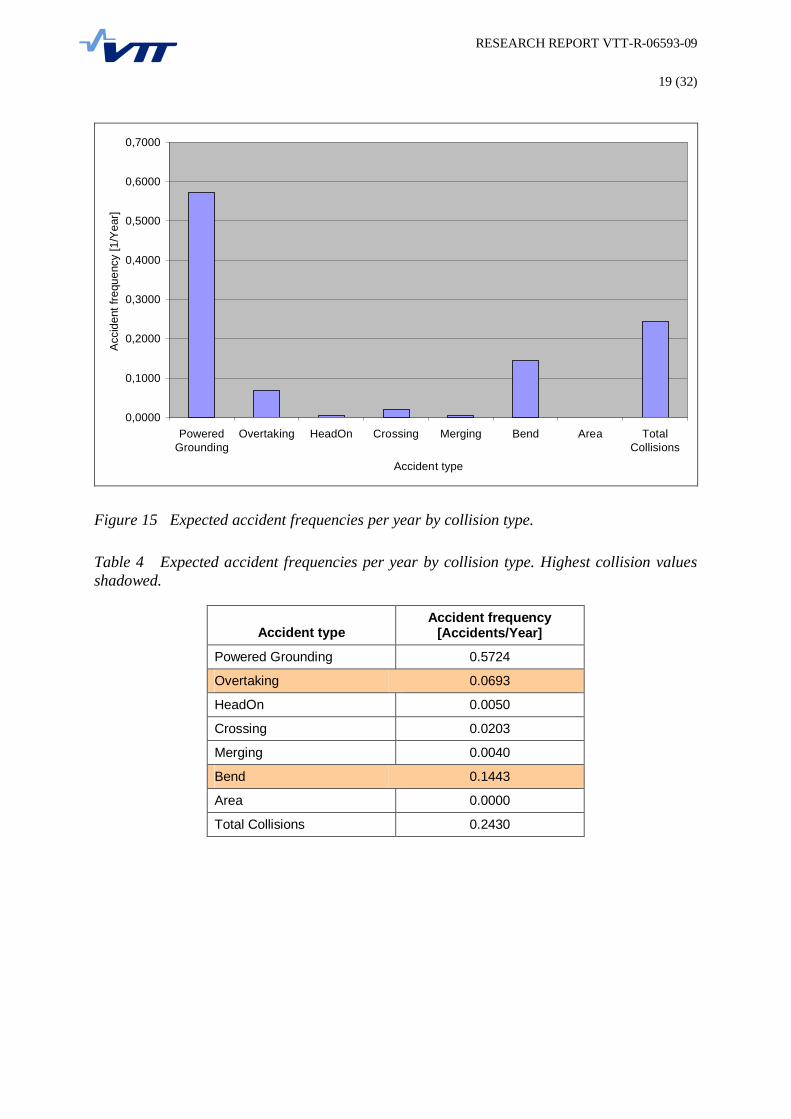
The estimates of expected accident frequencies are shown in Figure 15 - Figure 17 and inTable 4 - Table 6. The expected frequency for ship-to-ship collision is 0.243 incidents peryear and for powered grounding more than double at 0.572 incidents per year (Table 4).Among collision types the bend collision is the most probable, with 0.144 incidents per year.The next most probable type is the overtaking collision, with 0.069 incidents per year.
According to the calculations, the most probable ship type suffering collision is general cargoship, followed by container ship (Figure 16, Table 5), and the most probable ship sufferinggrounding is container ship, followed by general cargo ship (Figure 17, Table 6). This isunsurprising as these two ship types are the most common in the Gulf of Finland.
RESEARCH REPORT VTT-R-06593-09
19 (32)
0,0000
0,1000
0,2000
0,3000
0,4000
0,5000
0,6000
0,7000
PoweredGrounding
Overtaking HeadOn Crossing Merging Bend Area TotalCollisions
Accident type
Acc
iden
t fre
quen
cy [1
/Yea
r]
Figure 15 Expected accident frequencies per year by collision type.
Table 4 Expected accident frequencies per year by collision type. Highest collision valuesshadowed.
Accident typeAccident frequency
[Accidents/Year]
Powered Grounding 0.5724
Overtaking 0.0693
HeadOn 0.0050
Crossing 0.0203
Merging 0.0040
Bend 0.1443
Area 0.0000
Total Collisions 0.2430

RESEARCH REPORT VTT-R-06593-09
20 (32)
0
0,01
0,02
0,03
0,04
0,05
0,06
0,07
0,08
0,09
0,1
Crude o
il tan
ker
Oil prod
ucts
tanke
r
Chemica
l tank
er
Gas ta
nker
Contai
ner s
hip
Genera
l carg
o ship
Bulk ca
rrier
Ro-Ro c
argo s
hip
Passe
nger
ship
Fast fe
rry
Suppo
rt ship
Fishing
ship
Pleasu
re bo
at
Other s
hip
Ship type
Col
lisio
n fre
quen
cy [1
/Yea
r]
Figure 16 Expected collision frequencies per year by type of struck vessel.
Table 5 Expected collision frequencies per year by type of struck vessel. Highest valuesshadowed.
Ship typeCollision frequency
[Incidents/Year]
Crude oil tanker 0.0143
Oil products tanker 0.0296
Chemical tanker 0.0015
Gas tanker 0.0007
Container ship 0.0494
General cargo ship 0.0892
Bulk carrier 0.0129
Ro-Ro cargo ship 0.0261
Passenger ship 0.0036
Fast ferry 0.0014
Support ship 0.0046
Fishing ship 0.0008
Pleasure boat 0.0003
Other ship 0.0085
Sum 0.2430

RESEARCH REPORT VTT-R-06593-09
21 (32)
0
0,05
0,1
0,15
0,2
0,25
0,3
Crude o
il tan
ker
Oil prod
ucts
tanke
r
Chemica
l tank
er
Gas ta
nker
Contai
ner s
hip
Genera
l carg
o ship
Bulk ca
rrier
Ro-Ro c
argo s
hip
Passe
nger
ship
Fast fe
rry
Suppo
rt ship
Fishing
ship
Pleasu
re bo
at
Other s
hip
Ship type
Gro
undi
ng fr
eque
ncy
[1/y
ear]
Figure 17 Expected grounding frequencies per year by type of vessel.
Table 6 Expected grounding frequencies per year by type of vessel. Highest valuesshadowed.
Ship type Grounding frequency[Incidents/Year]
Crude oil tanker 0.0291
Oil products tanker 0.0445
Chemical tanker 0.0005
Gas tanker 0.0016
Container ship 0.2743
General cargo ship 0.0848
Bulk carrier 0.0345
Ro-Ro cargo ship 0.0482
Passenger ship 0.0029
Fast ferry 0.0053
Support ship 0.0236
Fishing ship 0.0005
Pleasure boat 0.0005
Other ship 0.0223
Sum 0.5724

RESEARCH REPORT VTT-R-06593-09
22 (32)
6 Validation of the results
6.1 Background
In the following, the validation of the estimated collision and grounding frequencies isperformed by comparing them with the frequency of registered accidents that have occurredin the Gulf of Finland. The accident statistics were obtained primarily from the Baltic Seaaccident statistics reports compiled by HELCOM [3] and the Finnish accident databaseDAMA, which consists of the marine casualty reports given to FMA. Also used in thevalidation were the statistical analyses of accidents [4], [5] and [6] and the reports of theFinnish Accident Investigation Board [7].
The criteria for selecting the relevant accidents were as follows:
Only accidents that occurred in the Gulf of Finland were taken into account.
Accidents that occurred during the period 1.7.2004 – 31.12.2008 were taken into accountprimarily. The accident statistics of 2009 were not yet available. The GOFREP systemwas introduced at the beginning of July 2004; thus conditions in the Gulf of Finland arenot comparable before and after that time. However, as a comparison also accidents thatoccurred before implementation of the GOFREP system during the period 1.1.1999 –30.6.2004 were checked.
Accidents that occurred due to ice conditions were rejected because the accident models inthe GRISK software were developed only for open water conditions.
Accidents that occurred in the port area were rejected.
The accident frequency estimation performed using the GRISK software is based onhistorical AIS data from 2008. Thus only accidents involving vessels of gross tonnage 300upwards were taken into account. (According to the IMO regulation this is the size limitfor vessels in international traffic that have to be equipped with the AIS system.)
As regards collisions only ship-to-ship collisions were taken into account.
As regards groundings only powered groundings were taken into account.
6.2 Accidents
During the four-and-a-half year period following implementation of the GOFREP system(1.7.2004 – 31.12.2008), altogether 57 accidents were registered in the Gulf of Finland – 19collisions and 38 groundings (Table 7). Following the above-mentioned criteria, altogethereight accidents, one collision and seven groundings were selected for use in verification of thecalculated accident frequencies. As a comparison, accidents before the GOFREP system werealso compiled. During the five-and-a-half year period from 1.1.1999 to 30.6.2004 there were66 accidents registered in the Gulf of Finland – 22 collisions and 44 groundings. One of thecollisions and 17 of the groundings were evaluated as relevant. However, due to insufficientdata reported on the accidents, selection of relevant accidents was difficult and categorisingthe accidents into different types was impossible. The locations of accidents in the Gulf of

RESEARCH REPORT VTT-R-06593-09
23 (32)
Finland can be seen in Figure 4 and other information in Table 8 for collisions and in Table 9for groundings. When translating the numbers of accidents into accident frequencies thefollowing values were obtained:
After GOFREP (4.5 year period):
Collision frequency 0.22 accidents/year
Grounding frequency 1.56 accidents/year
Before GOFREP (5.5 year period):
Collision frequency 0.18 accidents/year
Grounding frequency 3.09 accidents/year
In one collision that occurred after implementation of the GOFREP system a Panamanian4128 GT refrigerated vessel and a Russian 2500 GT bulk carrier collided near the borderbetween Finland and Russia northwest of the Sommers lighthouse. In another collision thatoccurred before the GOFREP system a Russian 53700 dwt timber carrier and a Panamanian16582 dwt bulker collided near the pilot boarding position at the eastern end of therecommended route to St. Petersburg. The locations are shown on the map in Figure 4. Thetype of the collision was not reported in the statistics.
As for groundings, the most common ship types involved after implementation of theGOFREP system were general cargo ships (three accidents) and container ships (twoaccidents). Those involved before GOFREP were general cargo ships (five accidents), tankers(four accidents) and bulk carriers (four accidents) (Table 10). In the table all tanker types arelisted under Tanker.
None of the accidents resulted in oil pollution.
Table 7 Registered accidents before (1.1.1999 – 30.6.2004) and after (1.7.2004 –31.122008) implementation of the GOFREP system.
1.7.2004- 31.12.2008 1.1.1999 – 30.6.2004
Collisions Groundings Collisions Groundings
Qualified 1 7 1 17
Due to iceconditions
1 10 1
Port area accident 16 15 8 14
Collision withobject
1 2
Drift grounding 2
Location outsidethe modelled area
16 1 10
Total number ofaccidents
19 38 22 44

RESEARCH REPORT VTT-R-06593-09
24 (32)
Table 8 Relevant collisions in the Gulf of Finland. “A” in the collision number indicates thatthe accident occurred after, and “B” before, implementation of the GOFREP system.
No Date Lat. Lon. Ship1 Ship1category
Ship1size
Ship2 Ship2category
Ship 2size
Cause Pilotonboard
Offence Damage
AC1 31.5.2007 60,2530 27,5080 BEAUTYSONG
Panama
Cargo,refrigerated vessel
4128 GT Nevskiy-34
Russia
Cargo,bulk
carrier
2500 GT Otherfactor,
reducedvisibility
ship 1: Yesship 2: n.i.
weatherrestriction
hole
BC1 5.11.2003 60,0333 29,4167 PIONERYAKUTIIRussia
Cargotimbercarrier
53700dwt
HANDYRUBY
Panama
Cargo,bulk
carrier
16582dwt
n.i. n.i. n.i. n.i.
Table 9 Relevant groundings in the Gulf of Finland. “A” in the grounding number indicatesthat the accident occurred after, and “B” before, implementation of the GOFREP system.
No Date Lat. Lon. Ship Ship type Ship size Shipdraught
(m)
Cause Piloton-board
Offence Damage
AG1 12.8.2004 60,0667 28,3167 ShuyaRussia
Dry cargovessel
2889 GT 5 Humanfactor
No navigationrules, ship
order
no
AG2 6.10.2004 59,9500 26,8667 Amur-2521Russia
Dry cargovessel
3086 GT 4 Humanfactor
No navigationrules
damage tohullleakage
AG3 9.11.2004 59,6116 25,0806 MSC LieselottePanama
Containership
21586 GT 10 Humanfactorabsent
Yes operationof the ship
hull damaged
AG4 9.2.2007 60,0090 26,5930 PropontisGreece
Crudeoil
tanker
117055dwt
15 cracks in bowdents in right
side
AG5 25.3.2007 59,2000 23,3100 BALTIYSKIY-102
Russia
Generalcargo
1926 GT Humanfactor
Yes n.i.
AG6 2.4.2008 60,2376 26,4027 Anne SibumCyprus
Containership
10585 GT 9 Humanfactor
no propeller,rudder damage
AG7 9.6.2008 60,1680 25,8330 SabinaFinland
Drybulk
2006 GT < 7m Humanfactor
No n.i. dents andtears in hull
BG1 1.4.1999 59,8170 27,2500 EotumsGreat Britain
Tanker 22000dwt
n.i. n.i. n.i. n.i. n.i.
BG2 1.11.1999 59,8000 26,9101 VoshodRussia
Other 234 dwt n.i. n.i. n.i. n.i. n.i.
BG3 8.12.1999 60,1870 25,7690 Spanvik Other 650 dwt n.i. n.i. n.i. n.i. n.i.
BG4 28.2.2000 59,5900 25,6900 ShuyaRussia
Tanker 5082 dwt n.i. n.i. n.i. n.i. n.i.
BG5 6.3.2000 60,1000 24,9700 AuroraNorway,
CargoRo-Ro
20381 GT n.i. n.i. n.i. n.i. n.i.
BG6 11.3.2000 60,2400 28,2100 KontulaFinland
CargoDry bulk
19854 GT n.i. n.i. n.i. n.i. n.i.
BG7 6.9.2000 59,0800 22,2700 AldebaranRussia
OtherFishingvessel
748 dwt n.i. n.i. n.i. n.i. n.i.

RESEARCH REPORT VTT-R-06593-09
25 (32)
Table 10 Comparison of calculated grounding frequencies with grounding frequenciesregistered in the Gulf of Finland.
After GOFREP Before GOFREPShip type Calculatedgroundingfrequency[Inc./Year]
Number ofgroundings
Groundingfrequency[Inc./Year]
Number ofgroundings
Groundingfrequency[Inc./Year]
Tanker (crude oil-, oilproducts-, chemical-and gas tanker)
0.0757 1 0.22 4 0.73
Container ship 0.2743 2 0.44
General cargo ship 0.0848 3 0.67 5 0.91
Bulk carrier 0.0345 1 0.22 4 0.73
Ro-Ro cargo ship 0.0482 1 0.18
Passenger ship 0.0029
Fast ferry 0.0053
Support ship 0.0236
Fishing ship 0.0005 1 0.18
Pleasure boat 0.0005
Other ship 0.0223 2 0.36
Sum 0.5724 7 1.56 17 3.09
6.3 Qualitative validation
Qualitative validation of the calculated accident results was performed first by comparing the“hot spot” areas identified by the calculations with the locations of accidents that occurred inthe Gulf of Finland. Next the “high risk” ship types identified by the calculations werecompared with the ship types actually involved in accidents.
Only two collisions occurred in the Gulf of Finland that were relevant for comparison. One ofthem took place in “hot spot” area No. 5 in Figure 14, which was identified by calculations.Due to insufficient information it is not known whether this was an overtaking collision aspredicted by the calculations. In addition, the collision occurred before implementation ofGOFREP, which slightly decreases its relevance.
According to the calculations, the powered grounding “hot spot” is at the southern point ofGogland island. However, no accidents have been reported in that area. Powered groundingsare concentrated in three areas of the Gulf of Finland: in the Finnish coastal area east ofHelsinki, in the coastal area between Mohni lighthouse and Hiiumaa island in Estonia, and inthe central area of the eastern Gulf of Finland (Figure 4). The entire Finnish coast in Figure 14is marked in yellow, indicating a slightly increased risk for powered groundings, whereasgroundings have occurred only near the coastline east of Helsinki (Figure 4).
RESEARCH REPORT VTT-R-06593-09
26 (32)
The parties involved in the collisions were a refrigerated vessel and a bulker in the collisionthat occurred after GOFREP, and a general cargo ship and a bulker in the collision beforeGOFREP. General cargo ship is the ship type having the highest collision risk according tothe calculations, whereas bulkers are only in sixth position.
Most of the grounded vessels both after and before GOFREP were general cargo ships, theship type with the second highest grounding risk according to the calculations. Thecalculations showed container ships to have the highest grounding risk whereas this ship typewas in second place in the grounding statistics collected after GOFREP.
6.4 Quantitative validation
Performing calculations with the default causation factor values and with the presented trafficmodel gives an expected total collision frequency of 0.243 per year and powered groundingfrequency of 0.572 per year, i.e. one collision in 4 years and one powered grounding in 1.7years.
The accident statistics show one collision for the 4.5 year period after implementation of theGOFREP system, or 0.22 collisions per year. As a comparison, before GOFREP there wasone collision in 5.5 years or 0.18 collisions per year. The predicted total collision frequenciesbased on the calculations are fairly consistent with the actual number of accidents. However,because of the small number of relevant accidents, the historical collision frequency is animprecise estimate of the predicted collision frequency.
Next, the types of expected collisions were studied in more detail. The high frequencies ofovertaking collisions on legs 4 and 5 in Figure 14 can be explained by the big speeddifference between the two major vessel groups — container ships and general cargo ships —and the narrow Traffic Separation Scheme (TSS). For example, on the easternmost leg (label5), based on the table in Figure 18 the annual number of container ships was 2418 vessels andthat of general cargo ships 2547 vessels. Their weighted average speeds were 21.6 knots and14.7 knots, respectively, taking into account in the calculations the number of vessels andaverage speed (table in Figure 19) in each ship type and size category.
By contrast, the predicted high frequency of bending collisions on waypoints 1 and 2 inFigure 14 seem somewhat surprising due to the long distance between opposite traffic lanes inthe TSS areas, as shown in Figure 4. The expected values would be more understandable ifthe calculation model took in to account not only bend collisions between vessels in oppositedirections, but also those in which the vessels are going in the same direction and one of themneglects or misses the turn.
According to the accident statistics there were seven groundings in the Gulf of Finland duringthe 4.5 year period following implementation of the GOFREP system. This translates to 1.56groundings per year. The predicted grounding frequency is 0.572 accidents per year, i.e. theGRISK software underestimates the number of groundings by a factor of 2.7. As acomparison, during the 5.5 year period before GOFREP there were 17 groundings, i.e. 3.09per year which is 5.4 times the expected frequency. At least two reasons for under-predictedgrounding frequency estimates can be identified. First, due to insufficient information aboutreported accidents some of the selected powered groundings may in fact have been driftgroundings. Second, if the outermost legs reaching as far as the ports were included in the

RESEARCH REPORT VTT-R-06593-09
27 (32)
fairway network used in the calculations, the expected grounding frequency would besomewhat higher.
Figure 18 Number of ships in different ship type and size categories on Leg 1 (label 5 inFigure 14).

RESEARCH REPORT VTT-R-06593-09
28 (32)
Figure 19 Average speeds of different ship types and sizes on Leg 1 (label 5 in Figure 14).
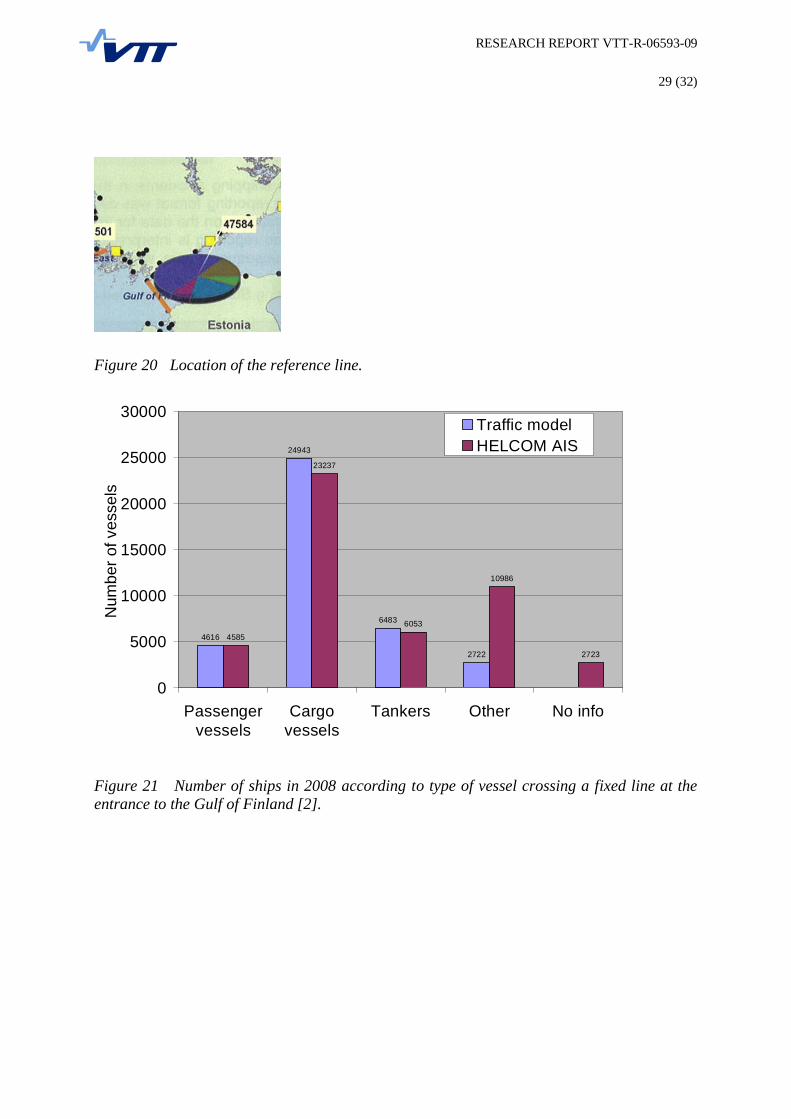
According to the HELCOM AIS database, the number of ships crossing in both directions thereference line at the entrance to the Gulf of Finland seen in Figure 20 was 47584 vessels in2008 [2]. Legs 40, 54, 65 and 103 in the GRISK traffic model (Figure 14) are in the area ofthe HELCOM AIS reference line. Summing up the traffic on these legs gives a total of 38764vessels, i.e. 81% of the HELCOM value. In Figure 21 the HELCOM traffic and trafficobtained from the GRISK traffic model in the same area is divided into main ship categories.The number of ships in the categories passenger vessels, cargo vessels and tankers is almostequal, whereas in the category other ship the difference is significant, being four times biggerin the HELCOM AIS. Category other ship consists of the GRISK ship types support ship,fishing ship, pleasure boat and other ship, which often does not follow the routes of the maintraffic and was thus omitted from the GRISK model.
RESEARCH REPORT VTT-R-06593-09
29 (32)
Figure 20 Location of the reference line.
4616
24943
6483
2722
4585
23237
6053
10986
2723
0
5000
10000
15000
20000
25000
30000
Passengervessels
Cargovessels
Tankers Other No info
Num
ber o
f ves
sels
Traffic modelHELCOM AIS
Figure 21 Number of ships in 2008 according to type of vessel crossing a fixed line at theentrance to the Gulf of Finland [2].

RESEARCH REPORT VTT-R-06593-09
30 (32)
7 Conclusions
The main objective of the study was to estimate the collision and grounding frequencies ofship traffic in the Gulf of Finland. The second objective was to exploit the usability of theGRISK software in risk analyses needed in the FSA process. The calculations are based onAIS data from 2008.
According to the calculations, the highest accident frequency areas are concentrated along thewhole routeing system in the Gulf of Finland.
The expected frequency for ship-to-ship collisions is 0.243 incidents per year, which is fairlyconsistent with the number of occurred collisions of 0.22 accidents per year. However,because of the small number of relevant accidents, the historical collision frequency is animprecise estimate of the expected collision frequency. The predicted “hot spots” of bendcollisions in the areas of the two westernmost TSSs in the Gulf of Finland seems odd, becausethe lanes of opposite traffic are quite far apart. However, the predicted high frequencies ofovertaking collisions in the narrow TSS areas in the eastern Gulf of Finland are realistic dueto the big speed differences of ships.
The expected frequency of powered groundings is 0.572 incidents per year, which is barelyone third of the average annual number of groundings in the Gulf of Finland. One reason forthe low frequency estimates could be that the route legs nearest the ports were omitted fromthe calculation model. Another reason could be insufficient information reported from theaccidents. Some of the grounding accidents selected for verification should perhaps beclassified as drift groundings, which are not taken into account in the calculation model.
The most probable ship type according to the calculations is general cargo ship in collisionsand container ship in groundings, which makes sense as these two ship types are the mostcommon in the Gulf of Finland.
About 80% of traffic is included in the traffic model used in the calculations. The main shiptraffic consisting of passenger vessels, cargo vessels and tankers is well represented in themodel, compared to about 25% of traffic in the categories support ship, fishing ship andleisure boat. This is due to the route network creation process of the traffic model, in whichroute legs are placed in the high traffic density areas. Vessels like support ships, fishing shipsand leisure boats often keep away from high-density routes.

RESEARCH REPORT VTT-R-06593-09
31 (32)
Appendices
1 Electronic chart data conversion from shapefile format to xml format
2 Traffic volumes on legs

RESEARCH REPORT VTT-R-06593-09
32 (32)
References
1 Friis-Hansen, P. 2007. Basic Modelling Principles for Prediction of Collision andGrounding Frequencies. Unpublished working paper. Technical University ofDenmark.
2 HELCOM. Report on shipping accidents in the Baltic Sea area for the year 2008.HELSINKI COMMISSION Baltic Marine Environment Protection Commission.http://www.helcom.fi/stc/files/shipping/shipping_accidents_2008.pdf.
3 http://www.helcom.fi/shipping/accidents/en_GB/accidents
4 Kujala, P. et al. Analysis of the marine traffic safety in the Gulf of Finland.Reliability Engineering and System Safety, Volume 94, August 2009, Pages 1349-1357.
5 Finnish Maritime Administration. Accident analysis 2001 – 2005 (In Finnish.Alusonnettomuusanalyysi 2001 – 2005). Publications of the Finnish MaritimeAdministration No. 5/2007. Helsinki 2007.
6 Finnish Maritime Administration. Accident analysis 1990 – 2000 Groundings andcollisions with vessel. (In Finnish. Onnettomuusanalyysi 1990 – 2000 Karilleajot jayhteentörmäykset) Publications of the Finnish Maritime Administration No. 7/2001.Helsinki 2001.
7 http://www.onnettomuustutkinta.fi/2596.htm