college of business san josé state university business assessment test spring 2005
TRANSCRIPT
College of BusinessCollege of BusinessSan José State UniversitySan José State University
Business Assessment TestBusiness Assessment Test
Spring 2005Spring 2005

About the CSU BATAbout the CSU BAT
• Business Assessment TestBusiness Assessment Test– Developed as lower-cost alternative to the ETS major Developed as lower-cost alternative to the ETS major
field testfield test
• Categories of questionsCategories of questions
• SJSU COB - Scores range from 14 to 61 out of 79SJSU COB - Scores range from 14 to 61 out of 79
Accountancy Business Law Economics Finance
Management Marketing MIS Statistics
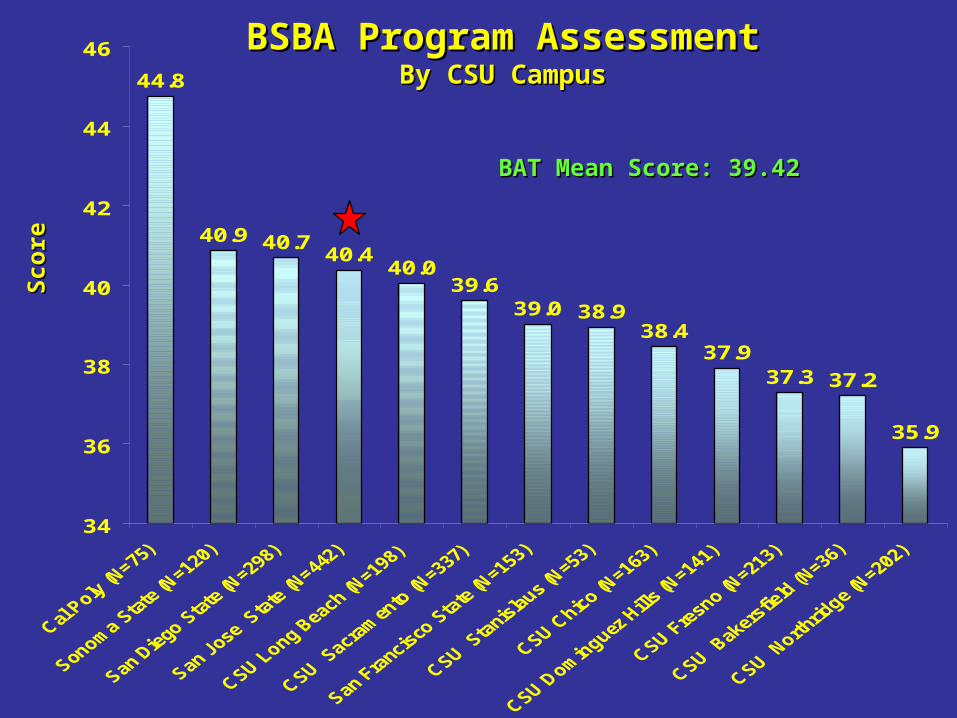
44.8
40.9 40.740.4
40.039.6
39.0 38.938.4
37.937.3 37.2
35.9
34
36
38
40
42
44
46 BSBA Program AssessmentBSBA Program AssessmentBy CSU CampusBy CSU Campus
BAT Mean Score: 39.42BAT Mean Score: 39.42
Sco
reS
core

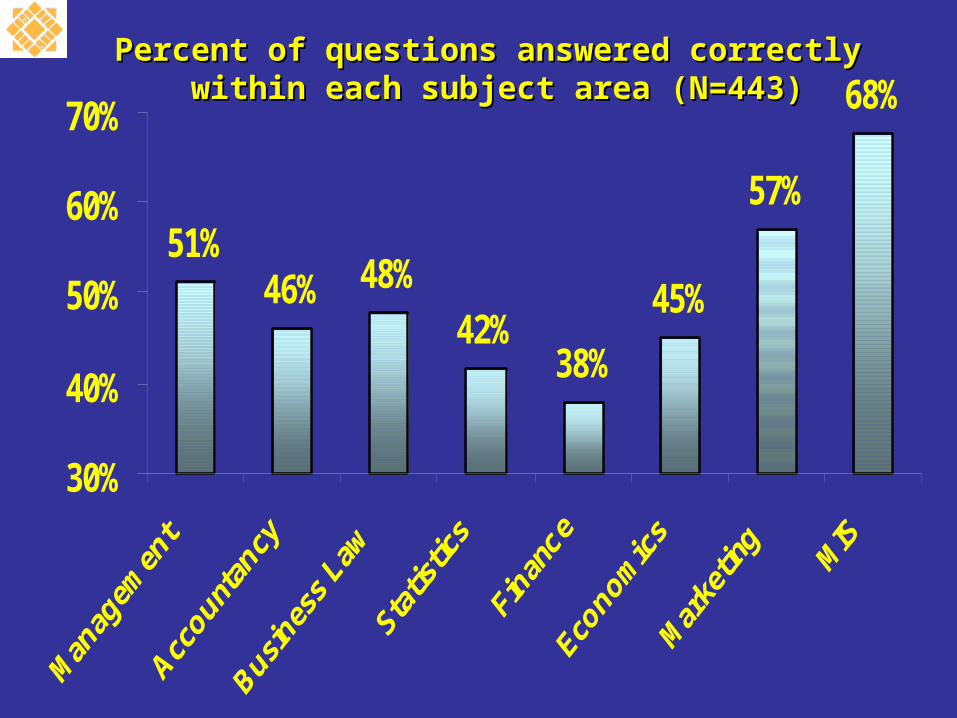
Percent of questions answered correctly Percent of questions answered correctly within each subject area (N=443)within each subject area (N=443)
51%46% 48%
42%38%
45%
57%
68%
30%
40%
50%
60%
70%
qu
esti
on
s an
swer
ed c
orr
ectl
yq
ues
tio
ns
answ
ered
co
rrec
tly

Percent of questions answered correctly Percent of questions answered correctly within each subject area (N=443)within each subject area (N=443)
51.3%46.2% 47.7%
41.6%37.8%
45.1%
57.0%
67.7%
30%
40%
50%
60%
70%
qu
esti
on
s an
swer
ed c
orr
ectl
yq
ues
tio
ns
answ
ered
co
rrec
tly
Compared with ETS 2002
51.3%46.1%
37.8% 37.8%38.2%
47.3%

Percent of questions answered correctly Percent of questions answered correctly by by ConcentrationConcentration
53%50%
47% 49% 50% 48% 48%
30%
40%
50%
60%
70%
qu
esti
on
s an
swer
ed c
orr
ectl
yq
ues
tio
ns
answ
ered
co
rrec
tly
N=53 N=65 N=18 N=73 N=13 N=86 N=113
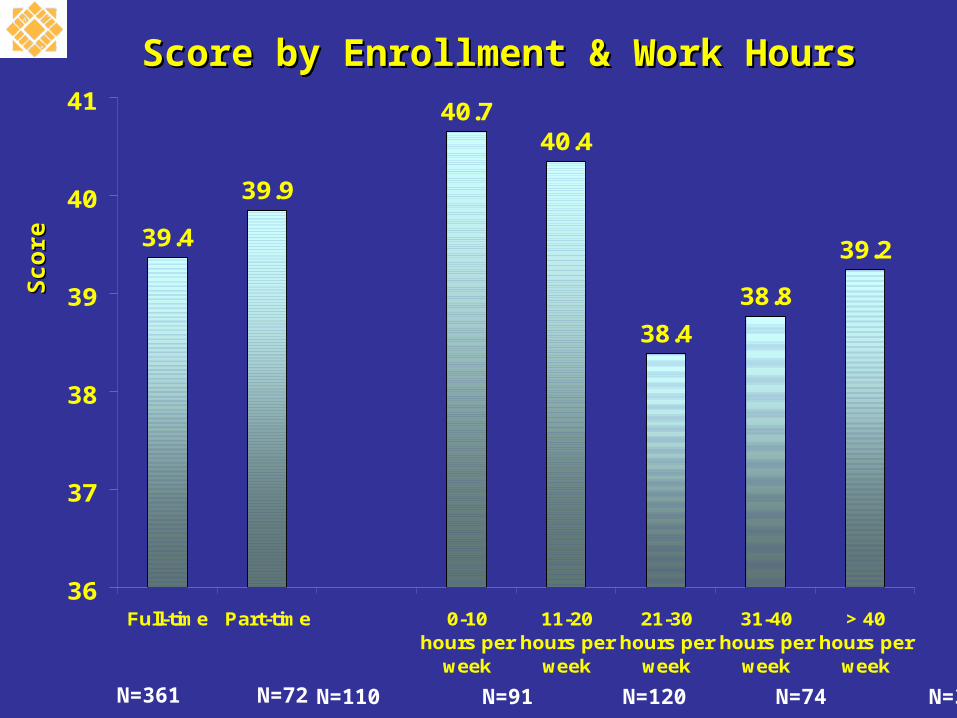
Score by Enrollment & Work HoursScore by Enrollment & Work Hours
39.4
40.740.4
38.4
38.8
39.2
39.9
36
37
38
39
40
41
Full-time Part-time 0-10hours per
week
11-20hours per
week
21-30hours per
week
31-40hours per
week
> 40hours per
week
Sco
reS
core
N=361 N=72 N=110 N=91 N=120 N=74 N=33
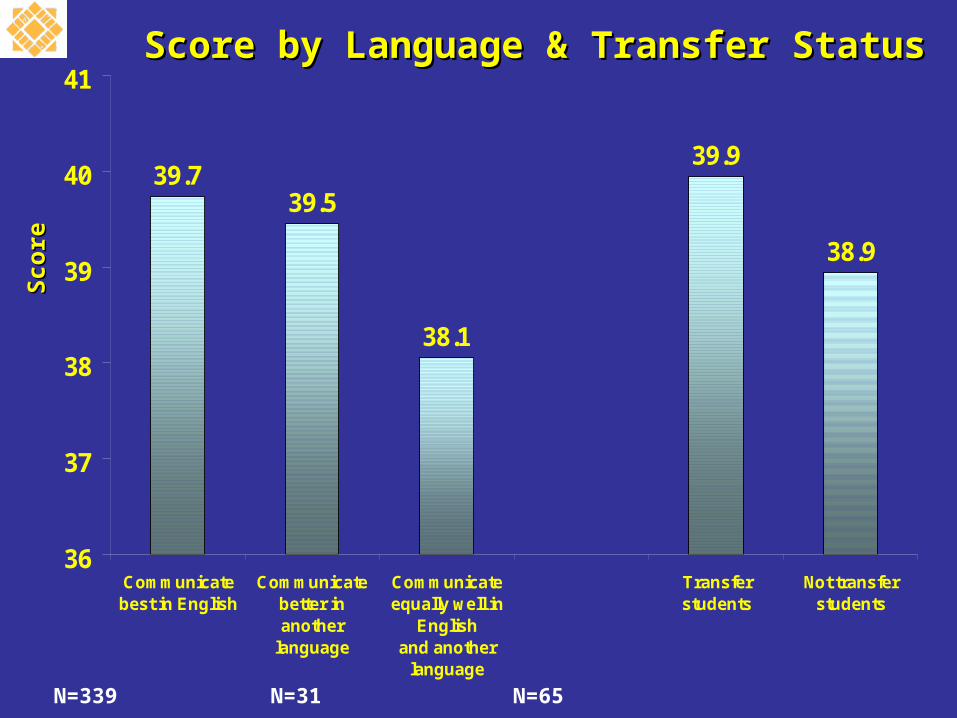
Score by Language & Transfer StatusScore by Language & Transfer Status
39.739.5
38.1
39.9
38.9
36
37
38
39
40
41
Communicatebest in English
Communicatebetter inanother
language
Communicateequally well in
Englishand another
language
Transferstudents
Not transferstudents
Sco
reS
core
N=339 N=31 N=65

38.439.0
37.836.5
43.0 42.9
40.139.3
34
36
38
40
42
44
46
Asian/AsianAmerican
Black orAfrican-
American
Mexican-American,
Latin-American,
otherHispanic
MiddleEastern
NativeAmerican
White Other Decline tospecify
Score by EthnicityScore by EthnicityS
core
Sco
re
N=216 N=7 N=44 N=10 N=1 N=94 N=28 N=8
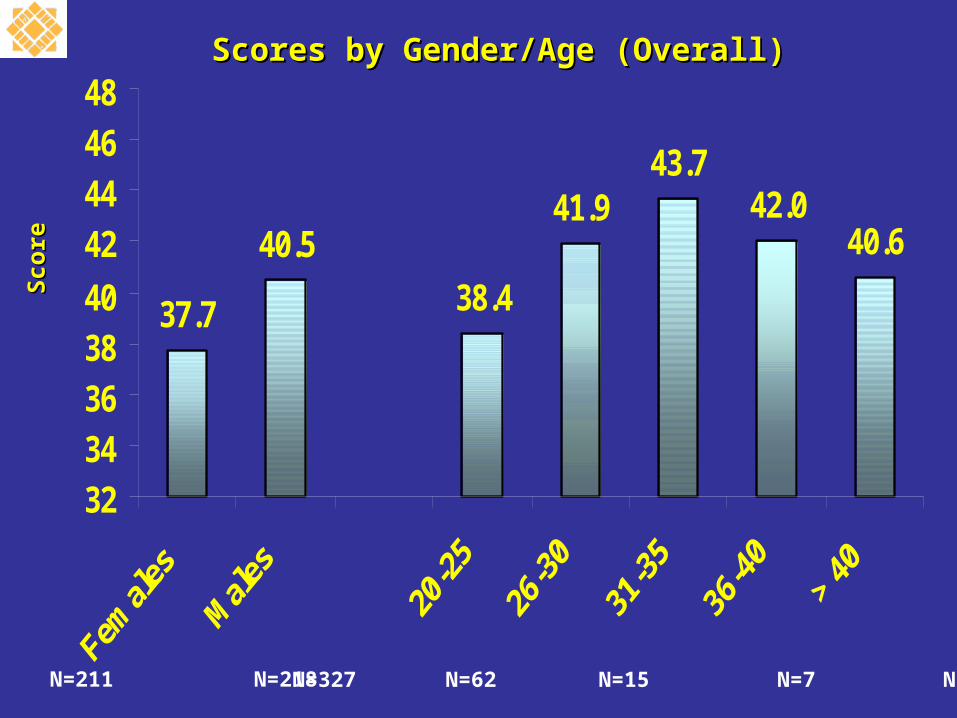
Scores by Gender/Age (Overall)Scores by Gender/Age (Overall)
37.7
40.5
38.4
41.943.7
42.040.6
3234363840
42444648
Sco
reS
core
N=211 N=218 N=327 N=62 N=15 N=7 N=7

38.3
41.5 41.9
39.8
37.7
39.5
42.4
45.3
34.0
42.8
32
34
36
38
40
42
44
46
48
20-25
26-30
31-35
36-40
> 40 20-25
26-30
31-35
36-40
> 40
Scores by Gender/AgeScores by Gender/Age
MalesMalesFemalesFemales
Sco
reS
core
Age
N=155 N=32 N=9 N=5 N=3 N=172 N=30 N=6 N=2 N=4
Percent of questions answered correctly Percent of questions answered correctly within each subject area (N=443)within each subject area (N=443)
51%46% 48%
42%38%
45%
57%
68%
30%
40%
50%
60%
70%
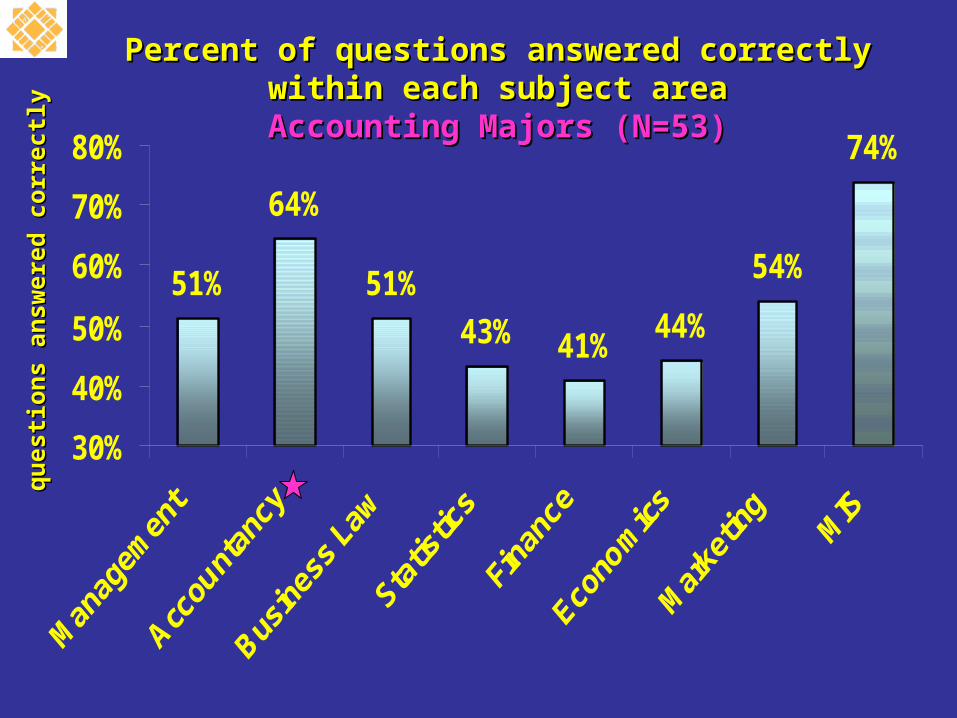
Percent of questions answered correctlyPercent of questions answered correctlywithin each subject areawithin each subject area
Accounting Majors (N=53)Accounting Majors (N=53)
51%
64%
51%
43% 41%44%
54%
74%
30%
40%
50%
60%
70%
80%
qu
esti
on
s an
swer
ed c
orr
ectl
yq
ues
tio
ns
answ
ered
co
rrec
tly

50%46% 46%
40%
49% 48%
55%
66%
30%
40%
50%
60%
70%
80%
Percent of questions answered correctlyPercent of questions answered correctlywithin each subject areawithin each subject area
Finance & Corp. Finance Majors (N=65Finance & Corp. Finance Majors (N=65))
qu
esti
on
s an
swer
ed c
orr
ectl
yq
ues
tio
ns
answ
ered
co
rrec
tly
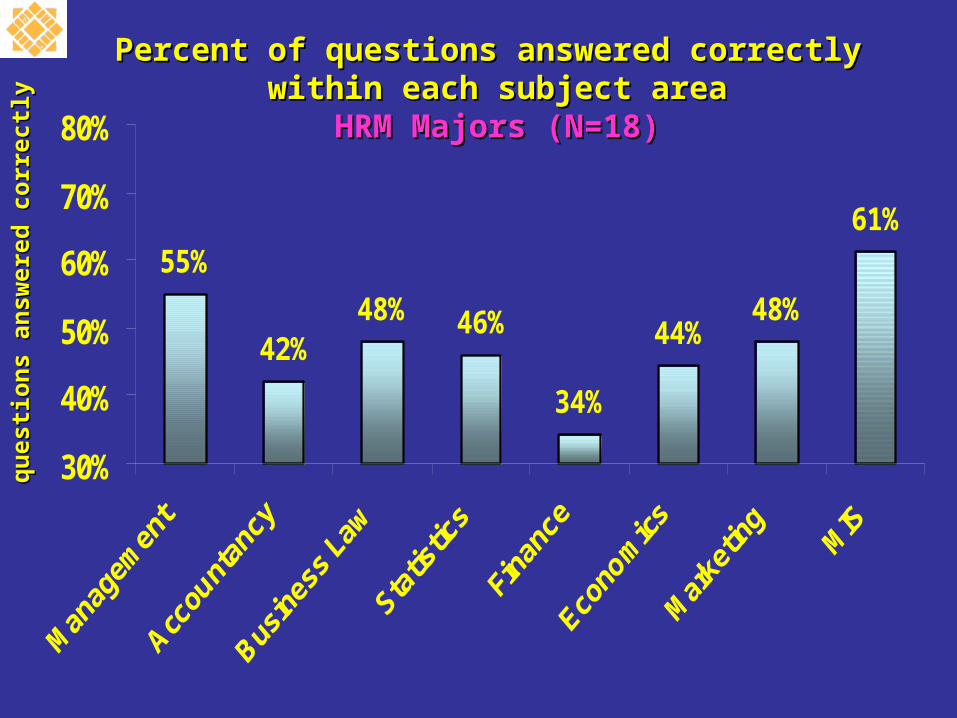
55%
42%48% 46%
34%
44%48%
61%
30%
40%
50%
60%
70%
80%
Percent of questions answered correctly Percent of questions answered correctly within each subject areawithin each subject area
HRM Majors (N=18)HRM Majors (N=18)
qu
esti
on
s an
swer
ed c
orr
ectl
yq
ues
tio
ns
answ
ered
co
rrec
tly
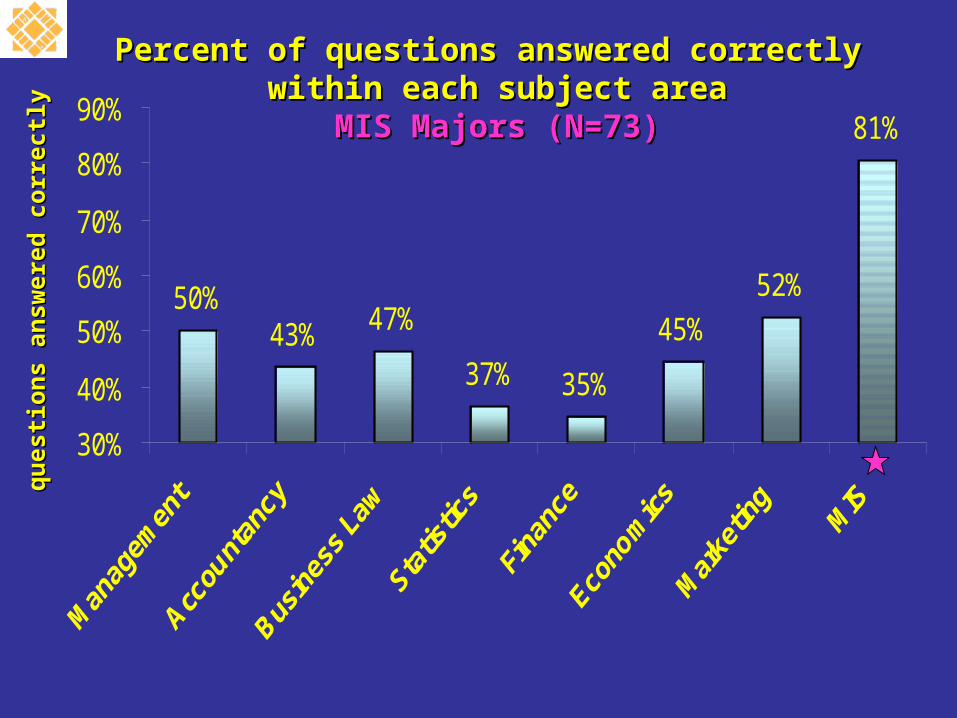
Percent of questions answered correctly Percent of questions answered correctly within each subject areawithin each subject area
MIS Majors (N=73)MIS Majors (N=73)
50%43% 47%
37% 35%
45%
52%
81%
30%
40%
50%
60%
70%
80%
90%
qu
esti
on
s an
swer
ed c
orr
ectl
yq
ues
tio
ns
answ
ered
co
rrec
tly
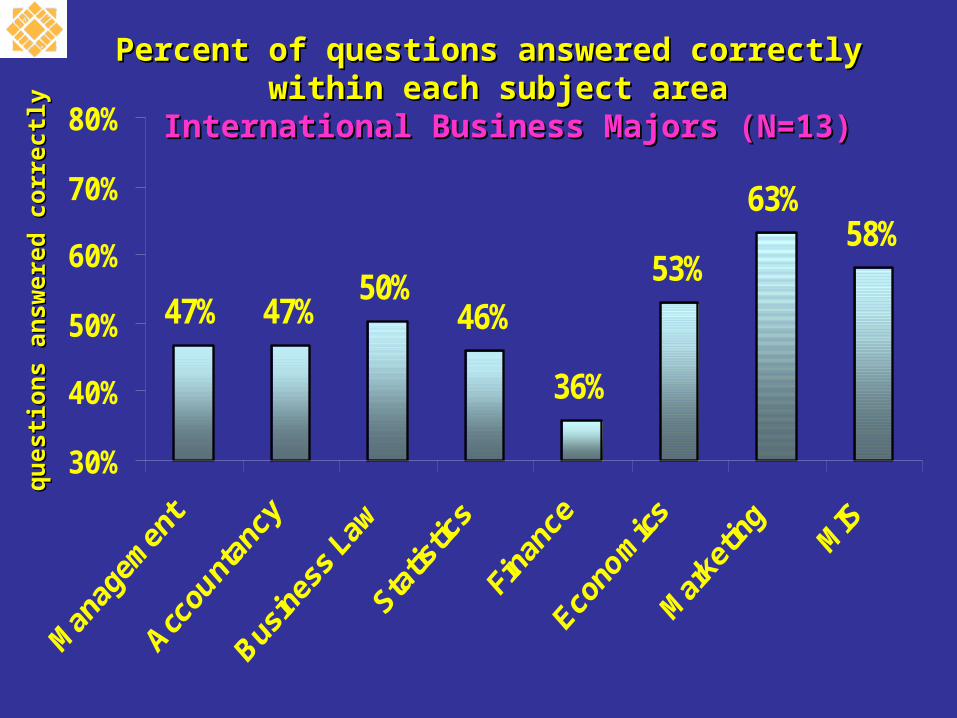
47% 47%50%
46%
36%
53%
63%58%
30%
40%
50%
60%
70%
80%
Percent of questions answered correctly Percent of questions answered correctly within each subject areawithin each subject area
International Business Majors (N=13)International Business Majors (N=13)
qu
esti
on
s an
swer
ed c
orr
ectl
yq
ues
tio
ns
answ
ered
co
rrec
tly
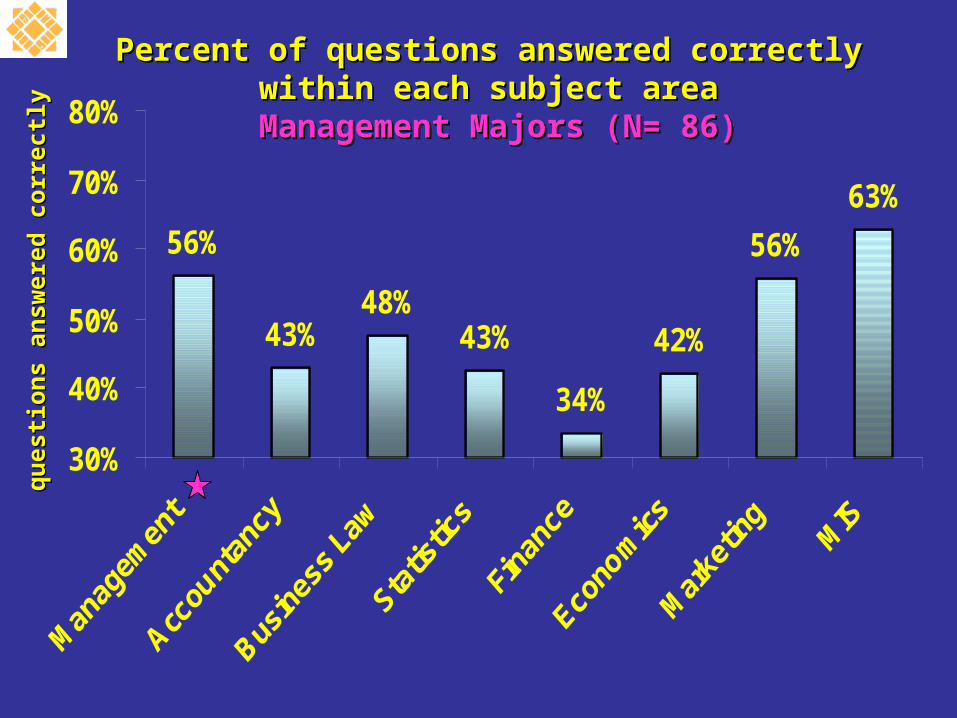
Percent of questions answered correctly Percent of questions answered correctly within each subject area within each subject area
Management Majors (N= 86)Management Majors (N= 86)
56%
43%48%
43%
34%
42%
56%
63%
30%
40%
50%
60%
70%
80%
qu
esti
on
s an
swer
ed c
orr
ectl
yq
ues
tio
ns
answ
ered
co
rrec
tly

48.9%
41.0%
46.8%43.8%
34.9%
44.8%
63.8% 63.4%
30%
40%
50%
60%
70%
Percent of questions answered correctly Percent of questions answered correctly within each subject area within each subject area
Marketing Majors (N= 113)Marketing Majors (N= 113)
qu
esti
on
s an
swer
ed c
orr
ectl
yq
ues
tio
ns
answ
ered
co
rrec
tly