college attrition and the dynamics of information ... · college attrition and the dynamics of...
TRANSCRIPT

College Attrition and the Dynamics of InformationRevelation
Preliminary and Incomplete
P.Arcidiacono, E.Aucejo, A.Maurel and T.Ransom
Duke University
April 10, 2013
Arcidiacono, Aucejo, Maurel and Ransom () College dropout, stopout and learning April 10, 2013 1 / 46

Motivation
Conditional on starting college, bachelor’s completion rates in the70’s were around 50% and have been falling over time (Bound,Lovenheim, and Turner, 2010).
Substantial returns to completing a four-year degree (Bound andTurner, 2011, Goldin and Katz, 2008, Heckman, Lochner, and Todd,2006).
Learning about schooling ability, labor market productivity andpreferences may then be important to the schooling decision.
Stinebrickner and Stinebrickner (2012) find that learning about one’sability in college is particularly important.
Arcidiacono, Aucejo, Maurel and Ransom () College dropout, stopout and learning April 10, 2013 2 / 46

Motivation (Cont’d)
Learning can take place both in college and in the labor market.
Individuals often take breaks before completing their degree.
In the NLSY97, 16% of those who started at a four-year college andobtained a degree took a break at some point.43% of dropouts returned to college at some point (stopouts).
Descriptive evidence suggests that learning about schooling abilityand labor market productivity is important.
Those with low GPA residuals more likely to leave college.Those with low wage residuals more likely to come back to college.
Arcidiacono, Aucejo, Maurel and Ransom () College dropout, stopout and learning April 10, 2013 3 / 46

College attrition: stylized facts
Fraction of college entrants who obtain a degree (Source: OECD)
Arcidiacono, Aucejo, Maurel and Ransom () College dropout, stopout and learning April 10, 2013 4 / 46

Our approach
Using the NLSY97, we estimate a model that allows:
Individuals to enroll or re-enroll in two or four-year colleges(Science/non-Science majors) in every period.
Work part-time, full-time, or not at all - potentially while in college.
Learn about their ability and productivity through grades and wages.
Use the estimates to:
Examine the degree of sorting in the labor market as well as in college.
Examine how changes in the flow of information affect sorting, andcompute the value of information.
Quantify the role of imperfect information about ability andproductivity, vs. transitory shocks, in school-to-work transitions.
Arcidiacono, Aucejo, Maurel and Ransom () College dropout, stopout and learning April 10, 2013 5 / 46

Preview of the results
Some evidence of correlation between schooling ability and labormarket productivity. Schooling ability is highly correlated acrosscollege types and majors, substantial correlation between skilled andunskilled productivity.
Evidence of sorting on ability/productivity based on college enrollment andlabor market participation decisions, suggesting that school-to-worktransitions are partly driven by ability learning:
Those who continuously enroll and graduate from college have higherposterior schooling abilities.
Stopouts who eventually graduate have lower schooling abilities thancontinuous enrollees, but they also have a relatively high productivityin the skilled sector.
Stopouts who eventually drop out have low abilities and productivitiesacross the board (lower ability and productivity than dropouts).
Arcidiacono, Aucejo, Maurel and Ransom () College dropout, stopout and learning April 10, 2013 6 / 46

Rest of the talk
1 Data and motivating evidence
2 Model
3 Results
4 Concluding remarks and work in progress
Arcidiacono, Aucejo, Maurel and Ransom () College dropout, stopout and learning April 10, 2013 7 / 46

Outline
1 Data and motivating evidence
2 Model
3 Results
4 Concluding remarks and work in progress
Arcidiacono, Aucejo, Maurel and Ransom () College dropout, stopout and learning April 10, 2013 8 / 46

Data: NLSY97
The NLSY97 is a random sample of 8,984 Americans born betweenJan 1, 1980 and Dec 31, 1984.
Respondents were first interviewed in 1997 and have continued to beinterviewed annually (for a total of 14 Rounds as of 2010, which isthe last point in our sample) on such topics as labor force activities,education, and marriage and fertility, among many others.
Cut individuals who did not graduate from high school (or have aGED) or who were missing key variables (AFQT).
Stop following individuals once either a grade or wage observation ismissing.
Resultant sample size is 32,256 person-years containing 4,238 peopleaveraging 8 years of data each.
Arcidiacono, Aucejo, Maurel and Ransom () College dropout, stopout and learning April 10, 2013 9 / 46

Data (Cont’d)
Table: Choice Set Comparisons
Choice Raw NLSY97 Our Sample
2yr College 7.1% 6.1%4yr College & Science 2.4% 3.4%4yr College & Others 12.0% 11.0%
Work Part-time 13.0% 15.7%Work Full-time 37.4% 43.0%
Home Production 28.1% 20.9%
Arcidiacono, Aucejo, Maurel and Ransom () College dropout, stopout and learning April 10, 2013 10 / 46

Stopout and dropout prevalence
Total Start 2-year Start 4-year Sci. Start 4-year Hum.
Continuous college 45.87% 29.15% 62.33% 56.48%Stopout but grad. 14.04% 18.01% 9.33% 11.81%
Stopout then dropout 9.86% 13.74% 7.00% 7.06%Dropout 30.23% 39.10% 21.33% 24.65%
Arcidiacono, Aucejo, Maurel and Ransom () College dropout, stopout and learning April 10, 2013 11 / 46
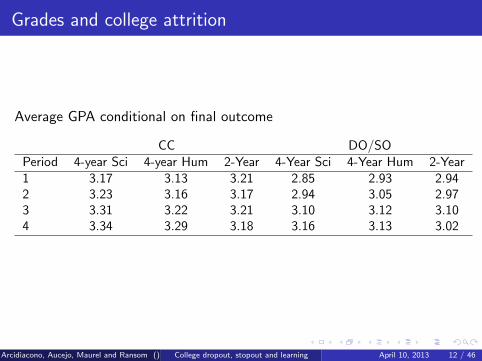
Grades and college attrition
Average GPA conditional on final outcome
CC DO/SOPeriod 4-year Sci 4-year Hum 2-Year 4-Year Sci 4-Year Hum 2-Year1 3.17 3.13 3.21 2.85 2.93 2.942 3.23 3.16 3.17 2.94 3.05 2.973 3.31 3.22 3.21 3.10 3.12 3.104 3.34 3.29 3.18 3.16 3.13 3.02
Arcidiacono, Aucejo, Maurel and Ransom () College dropout, stopout and learning April 10, 2013 12 / 46

Learning and grades
Difference between actual and expected period-t grades (by t + 1 periodcollege decision):
Residual Std Dev N Mean diff T (p-val)
Leave 4-year college & science -0.277 0.673 71 4.24Stay in 4-year college (or switch) 0.019 0.562 1010 (0.00)
Leave 4-year college & humanities -0.159 0.647 347 6.11Stay in 4-year college (or switch) 0.018 0.495 3109 (0.00)
Leave 2-year college -0.127 0.774 525 5.24Stay in 2-year college (or switch) 0.048 0.597 1398 (0.00)
Arcidiacono, Aucejo, Maurel and Ransom () College dropout, stopout and learning April 10, 2013 13 / 46

Learning and grades (Cont’d)
Residual Std Dev N Mean diff T (p-val)
Switch to 2-year college -0.205 0.754 88 3.67Stay in 4-year college (any major) 0.004 0.524 4449 (0.00)
Switch to 4-year college 0.103 0.517 185 2.25Stay in 2-year college -0.011 0.667 1738 (0.03)
Arcidiacono, Aucejo, Maurel and Ransom () College dropout, stopout and learning April 10, 2013 14 / 46

Learning and wages
Log-wage residuals at time t conditional on t + 1 decision andstopping-out at some point during the sample period:
Residual Std Dev N Mean diff T (p-val)
Stay in work 0.029 0.471 4,719 -2.59Return to school -0.052 0.335 219 (0.01)
Arcidiacono, Aucejo, Maurel and Ransom () College dropout, stopout and learning April 10, 2013 15 / 46

Outline
1 Data and motivating evidence
2 Model
3 Results
4 Concluding remarks and work in progress
Arcidiacono, Aucejo, Maurel and Ransom () College dropout, stopout and learning April 10, 2013 16 / 46

Choice set
In each period, individuals choose among a combination of work andschooling alternatives:
Schooling: two-year college, four-year college - Science major, four-yearcollege - non-Science major, none.Work: Part-time, Full-time, none.Home production: reference alternative.
Time is discrete, forward-looking individuals choose the sequence ofactions maximizing the present value of expected lifetime utility.
Arcidiacono, Aucejo, Maurel and Ransom () College dropout, stopout and learning April 10, 2013 17 / 46

Information structure
Key component of the model. Aside from the future state-specificidiosyncratic shocks, individuals have imperfect information abouttheir schooling ability and labor market productivity.
If they attend college, individuals learn about their ability byobserving their performance (GPA) at the end of the year. The gapbetween the observed and expected GPA provides a noisy signal fortheir ability, which is used to update their belief in a Bayesian fashion.
Similarly, wages are used as productivity signals in the labor market.
Arcidiacono, Aucejo, Maurel and Ransom () College dropout, stopout and learning April 10, 2013 18 / 46

Graduation
Those who are not at a four-year college have graduation probabilitiesset at zero.
Those with less than two years of college have graduationprobabilities set at zeros.
All others face probability of graduating that depends on:
Characteristics known throughout (AFQT, HS GPA, race..)Years of different types of schoolingPosterior schooling ability in the 4-year college sector
We estimate the DDC model by imposing the constraint thatindividuals never re-enroll in college after graduating from a four-yearcollege. In practice, this restriction helps fitting the data.
Arcidiacono, Aucejo, Maurel and Ransom () College dropout, stopout and learning April 10, 2013 19 / 46

Grades
Grades in two-year colleges and in the first two years of four-yearcolleges (Science or Non-Science majors) are given by, denoting by τthe period of college enrollment and j the type of college/major :
Gijτ = γ0j + Xictγ1j + Aij + εijτ
where Xict is known to the individual i, Aij is an unknown abilityfactor, and εijτ is a normally distributed noise.
Xict includes demographics (race, parental education...), abilitymeasures (AFQT, HS GPA) and dummies for work while in college.
Arcidiacono, Aucejo, Maurel and Ransom () College dropout, stopout and learning April 10, 2013 20 / 46

Grades (Cont’d)
Let AIijt = γ0j + Xictγ1j + Aij (academic index). For four-year collegesand periods τ > 2, grades are given by:
Gijτ = λ0j + λ1jAIijt + εijτ
This specification allows for time-varying effect of latent ability ongrades (see also Hansen, Heckman and Mullen, 2004).
Precision of the signal allowed to vary over time and across types ofcollege and majors.
Arcidiacono, Aucejo, Maurel and Ransom () College dropout, stopout and learning April 10, 2013 21 / 46

Wages
We assume there are two sectors in the labor market: (four-year)college and non-college.
Wages in the college sector follow:
ln(Wist) = Xistγs + Ais + εist
Wages in the non-college sector follow:
ln(Wiut) = Xiutγu + Aiu + εiut
Xist (and Xiut) include ability measures, demographics, college majors,skilled and unskilled labor market experience, work part-time andcalendar year dummies (business cycle effects).
Arcidiacono, Aucejo, Maurel and Ransom () College dropout, stopout and learning April 10, 2013 22 / 46

Learning
Individuals are uncertain about their schooling ability and labor marketproductivity, given by the ability factors A = (Ai2,Ai4s ,Ai4h,Ais ,Aiu)′,and learn about them in a Bayesian fashion.
A is assumed to be joint normal, with mean zero and unrestrictedcovariance matrix.
Arcidiacono, Aucejo, Maurel and Ransom () College dropout, stopout and learning April 10, 2013 23 / 46
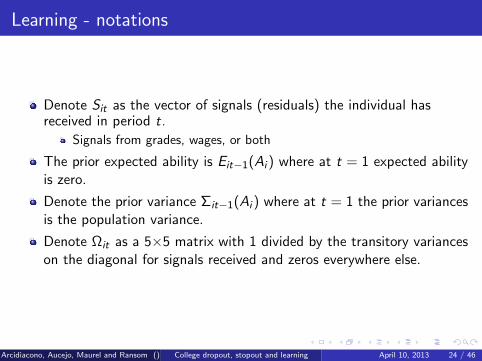
Learning - notations
Denote Sit as the vector of signals (residuals) the individual hasreceived in period t.
Signals from grades, wages, or both
The prior expected ability is Eit−1(Ai ) where at t = 1 expected abilityis zero.
Denote the prior variance Σit−1(Ai ) where at t = 1 the prior variancesis the population variance.
Denote Ωit as a 5×5 matrix with 1 divided by the transitory varianceson the diagonal for signals received and zeros everywhere else.
Arcidiacono, Aucejo, Maurel and Ransom () College dropout, stopout and learning April 10, 2013 24 / 46

Learning - updating
Eit(Ai ) and Σit(Ai ) are updated according to:
Eit(Ai ) = (Σ−1it−1(Ai ) + Ωit)−1 (Σ−1it−1(Ai )Et−1(Ai ) + ΩitSit
)Σit(Ai ) = (Σ−1it−1(Ai ) + Ωit)
−1
With additional signals, prior variance moves towards zero, giving moreweight to the prior and less to the signal.
(reduces down to signal-to-noise ratio times the signal plus noise-to-signalratio times the prior in the one-dimensional case)
Arcidiacono, Aucejo, Maurel and Ransom () College dropout, stopout and learning April 10, 2013 25 / 46

Flow utilities
The flow utility for a particular schooling j/work k combination is:
ujkt(Zit , εijk) = αjk + Z1itαj + Z2itαk + εijkt
where the (εijkt) are i.i.d. Type 1 extreme value.
Aside from demographics, expected schooling ability is embedded inZ1it representing a cost of effort.
Expected log wages are embedded in Z2it .
State variables that transition over time are:1 Expected ability2 Age and experience3 Lagged decision (switching costs)
Arcidiacono, Aucejo, Maurel and Ransom () College dropout, stopout and learning April 10, 2013 26 / 46

Value functions
The conditional value function is given by:
vjkt(Zit) = ujkt(Zit) + βEt(Vt+1(Zt+1)|Zit , dit = j , k)
Assuming that the ε’s are i.i.d. Type 1 extreme value,
vjkt(Zit) = ujkt(Zit) + βEt
[ln
(∑j
∑k
exp(vjkt+1(Zit+1))
)∣∣∣∣∣Zit , dit = j , k
]+βγ
Arcidiacono, Aucejo, Maurel and Ransom () College dropout, stopout and learning April 10, 2013 27 / 46

Finite dependence
Conditional on the one-period-ahead state variables besides ε, thefuture utility term can be expressed as:
ln
∑j ,k
exp(vjkt+1(Zit+1))
= vj ′k ′t+1(Zit+1)− ln(pj ′k ′t+1(Zit+1))
for any choice j ′, k ′.Consider any choice j ′, k ′ as well as the choice 0, 0 (Home).Given these initial choices, there exists a sequence of choices suchthat, in expectation, individuals will be in the same state threeperiods ahead, implying:
Et
[Vt+3(Zit+3)|dit = 0, 0, dit+1 = j ′, k ′, dit+2 = 0, 0
]=
Et
[Vt+3(Zit+3)|dit = j ′, k ′, dit+1 = 0, 0, dit+2 = 0, 0
]Arcidiacono, Aucejo, Maurel and Ransom () College dropout, stopout and learning April 10, 2013 28 / 46

Finite dependence (Cont’d)
Since in estimation we use differences of conditional value functions, wecan reformulate the problem in terms of two-period ahead flow payoffs andconditional choice probabilities and then estimate the conditional choiceprobabilities in a first stage.
Arcidiacono, Aucejo, Maurel and Ransom () College dropout, stopout and learning April 10, 2013 29 / 46

Unobserved heterogeneity
It seems desirable to relax the implicit assumption that individualshave (by the end of the observed paths) the same information set asthe econometrician’s.
This would also account for correlation across the unobservedpreference terms.
Arcidiacono, Aucejo, Maurel and Ransom () College dropout, stopout and learning April 10, 2013 30 / 46

Unobserved heterogeneity (Cont’d)
We extend the model to account for unobserved (to theeconometrician only) heterogeneity, using a finite mixture approach(Heckman and Singer, 1984).
We assume that there are R types of individuals in the population,and type-specific intercepts are included in grades, wages as well as inflow utilities.
Arcidiacono, Aucejo, Maurel and Ransom () College dropout, stopout and learning April 10, 2013 31 / 46

Identification
Selection issue: GPA Gijτ is only observed for the individuals who areenrolled in a type-j (college, major) in their τ -th period of collegeenrollment.
Identification can be shown by using the prior ability at the beginningof the period (Et−1(Aij)) as a control function in the grade equation.Namely, consider the following augmented regression for four-yearcolleges and period τ > 2:
Gijτ = λ0j + λ1j(γ0j + Xictγ1j) + λ1jEt−1(Aij) + νijτ
Under the assumption that decisions only depend on ability throughthe ability beliefs, application of OLS identifies (λ0j , λ1j), with(γ0j , γ1j) being identified from the first and second period grades.
Arcidiacono, Aucejo, Maurel and Ransom () College dropout, stopout and learning April 10, 2013 32 / 46

Identification (Cont’d)
Signal-to-noise ratios as well as ability covariance matrix are identifiedfrom the past ability signal coefficients. In particular, correlationsbetween the different ability components are identified fromindividuals switching occupations.
In-school work identifies more directly the correlation betweenunskilled labor market productivity and schooling abilities.
Type-specific heterogeneity components identified separately from theability beliefs through first-period choices.
Arcidiacono, Aucejo, Maurel and Ransom () College dropout, stopout and learning April 10, 2013 33 / 46

Estimation steps (without type-specific heterogeneity)
Step 1: Use the EM algorithm to recover parameters of the wage andgrade equations.
Step 2 (DDC model):
Calculate prior abilities and variances at each decision point.
Estimate conditional choice probabilities (CCP).
Use the CCPs and distributions of the signals to form expected futureutility terms.
Estimate a multinomial logit with a pre-calculated adjustment termon the school/work choices (the future value term).
Key insight: selection on observables only (at least without unobservedheterogeneity) since we see what the individual sees. The choice model isestimated separately from the outcome equations.
Arcidiacono, Aucejo, Maurel and Ransom () College dropout, stopout and learning April 10, 2013 34 / 46

Estimating learning parameters
Need to integrate out over all the abilities
EM algorithm, M-step: maximize the expected completelog-likelihood, i.e. act as if we knew abilities and weight using theprior ability distribution.
E-step: given the parameter estimates at the current guess, updateprior abilities, variances, and population covariance matrix.
Arcidiacono, Aucejo, Maurel and Ransom () College dropout, stopout and learning April 10, 2013 35 / 46

Type-specific unobserved heterogeneity
Breaks down the separability between choice and outcomecomponents of the likelihood.
Following Arcidiacono and Miller (2011), we use an adaptation of theEM algorithm to reinstate the separability between the two stages atthe maximization step.
Two-step procedure: (1) EM estimation of the outcome parameters,unobserved heterogeneity distribution and CCPs; (2) Estimation ofthe flow utility parameters (weighted multinomial logit).
Arcidiacono, Aucejo, Maurel and Ransom () College dropout, stopout and learning April 10, 2013 36 / 46

Outline
1 Data and motivating evidence
2 Model
3 Results
4 Concluding remarks and work in progress
Arcidiacono, Aucejo, Maurel and Ransom () College dropout, stopout and learning April 10, 2013 37 / 46
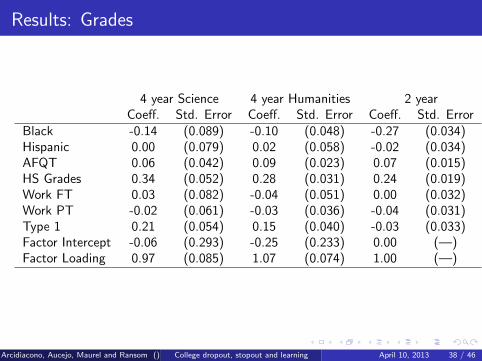
Results: Grades
4 year Science 4 year Humanities 2 yearCoeff. Std. Error Coeff. Std. Error Coeff. Std. Error
Black -0.14 (0.089) -0.10 (0.048) -0.27 (0.034)Hispanic 0.00 (0.079) 0.02 (0.058) -0.02 (0.034)AFQT 0.06 (0.042) 0.09 (0.023) 0.07 (0.015)HS Grades 0.34 (0.052) 0.28 (0.031) 0.24 (0.019)Work FT 0.03 (0.082) -0.04 (0.051) 0.00 (0.032)Work PT -0.02 (0.061) -0.03 (0.036) -0.04 (0.031)Type 1 0.21 (0.054) 0.15 (0.040) -0.03 (0.033)Factor Intercept -0.06 (0.293) -0.25 (0.233) 0.00 (—)Factor Loading 0.97 (0.085) 1.07 (0.074) 1.00 (—)
Arcidiacono, Aucejo, Maurel and Ransom () College dropout, stopout and learning April 10, 2013 38 / 46

Results: Wages
Skilled UnskilledCoeff. Std. Error Coeff. Std. Error
Black -0.08 (0.025) -0.09 (0.007)Hispanic 0.01 (0.028) -0.03 (0.007)AFQT -0.08 (0.012) 0.00 (0.003)HS Grades 0.07 (0.015) 0.02 (0.004)Unskilled Experience -0.01 (0.007) 0.06 (0.002)Skilled Experience 0.08 (0.007)Science Major 0.13 (0.017)Type 1 0.29 (0.017) 0.13 (0.006)PT -0.03 (0.022) -0.02 (0.007)PT 2-year -0.12 (0.017)PT 4-year -0.18 (0.012)FT 2-year 0.00 (0.017)FT 4-year -0.10 (0.015)1 year of college 0.04 (0.009)2 years of college 0.08 (0.010)3 years of college 0.10 (0.013)4+ years of college 0.13 (0.013)
Arcidiacono, Aucejo, Maurel and Ransom () College dropout, stopout and learning April 10, 2013 39 / 46

Ability/productivity correlation matrix
Skilled Unskilled 4-year Science 4-year Hum 2-yearVariances 0.102 0.071 0.177 0.097 0.106
CorrelationSkilled Unskilled 4-year Science 4-year Hum 2-year
Skilled 1.000 0.572 0.051 0.004 0.162Unskilled 0.572 1.000 0.204 0.073 0.2004-year Science 0.051 0.204 1.000 0.686 0.4384-year Hum 0.004 0.073 0.686 1.000 0.7272-year 0.162 0.200 0.438 0.727 1.000
Arcidiacono, Aucejo, Maurel and Ransom () College dropout, stopout and learning April 10, 2013 40 / 46

Transitory variances
Period Skilled Unskilled 4-year Science 4-year Hum 2-year
1 0.15 0.16 0.27 0.31 0.392 0.12 0.14 0.233 0.13 0.09 0.134 0.07 0.11
Arcidiacono, Aucejo, Maurel and Ransom () College dropout, stopout and learning April 10, 2013 41 / 46

Sorting
Average posterior abilities in 2010 for different choice paths:Choice Path Skilled Unskilled 4-year Science 4-year Hum 2-yearContinuous college, no work -0.02 -0.02 0.02 0.02 0.01Continuous college, work 0.00 0.00 0.01 0.00 0.01Stopout, graduate 0.04 0.00 -0.03 -0.02 -0.02Stopout, do not graduate -0.02 -0.04 -0.08 -0.05 -0.04Dropout 0.01 0.02 -0.04 -0.04 -0.03
Arcidiacono, Aucejo, Maurel and Ransom () College dropout, stopout and learning April 10, 2013 42 / 46

Preferences
2-year 4yr sci 4yr hum Work PT Work FT
AFQT 0.868 6.467 3.830 0.672 0.218black -0.666 4.450 2.981 -1.409 -1.145hispanic -0.075 -0.917 -2.177 -0.789 -0.532HS Grades 1.645 7.341 6.784 -0.097 0.254Parent college 0.558 4.280 4.341 -0.433 -0.429E[Schooling ability] 8.236 5.938 6.018E[ln wage] -0.346 1.722exper 0.242 0.418prev HS -2.146 0.379 0.313 0.848 0.692prev 2yr 2.773 1.419 1.158 0.310 0.202prev 4yr sci 1.521 5.226 2.821 0.679 0.438prev 4yr hum 0.871 2.647 4.127 0.584 0.521prev PT -0.005 0.005 0.212 1.733 1.310prev FT -0.174 -0.363 0.057 1.313 2.067grad 4yr -1.285 1.807work PT -3.516 -0.227 -1.447work FT -1.128 4.424 7.545Type 1 -1.078 0.635 -1.168 -0.028 -0.480
Arcidiacono, Aucejo, Maurel and Ransom () College dropout, stopout and learning April 10, 2013 43 / 46

Outline
1 Data and motivating evidence
2 Model
3 Results
4 Concluding remarks and work in progress
Arcidiacono, Aucejo, Maurel and Ransom () College dropout, stopout and learning April 10, 2013 44 / 46

Conclusion
We investigate the determinants of college-to-work transitions, with afocus on the role played by learning about schooling ability and labormarket productivity.
Using data from the NLSY97, we estimate a dynamic model of collegeattendance and work decisions. We account for correlated learningabout ability and productivity through college grades and wages.
Our preliminary results suggest that imperfect information about eachof these components plays an important role in explaining collegedropout and re-entry decisions.
We find evidence of sorting through the cost of effort (collegedropouts), and wage returns to college graduation (school re-entry).
Arcidiacono, Aucejo, Maurel and Ransom () College dropout, stopout and learning April 10, 2013 45 / 46

Work in progress
Aggregate labor market (and utility) gains to sorting.
Relative value of revealed (vs. known beforehand) ability.
Speed of learning for different choice paths/subpopulations...
Arcidiacono, Aucejo, Maurel and Ransom () College dropout, stopout and learning April 10, 2013 46 / 46

Work in progress
Aggregate labor market (and utility) gains to sorting.
Relative value of revealed (vs. known beforehand) ability.
Speed of learning for different choice paths/subpopulations...
Arcidiacono, Aucejo, Maurel and Ransom () College dropout, stopout and learning April 10, 2013 46 / 46