collecting and gridding complementary in-situ sst/sss...
TRANSCRIPT
Joint Coriolis- Mercator Ocean Quarterly Newsletter #41 – April 2011 – Page 33
Collecting and gridding complementary in-situ SST/SSS data for the calibration and validation of SMOS
Collecting and gridding complementary in-situ SST/SSS data for the calibration and validation of SMOS
By Emilie Brion1, Fabienne Gaillard1, Loïc Petit de la Villéon2, Thierry Delcroix3, Gaël Alory3, Gilles Reverdin4
1LPO/IFREMER-CNRS-UBO-IRD, Plouzané, FRANCE 2SISMER/IFREMER, Plouzané, France 3LEGOS, Toulouse, France 4LOCEAN, UMR 7159 CNRS / IRD / Université Pierre et Marie Curie/MNHN / Institut Pierre Simon Laplace, PARIS, France
Introduction
Providing reliable in-situ surface temperature and salinity data over the global ocean within short delay is critical for the calibration and validation of the recently launched Soil Moisture and Ocean Salinity Satellite (SMOS). The work presented here has been undertaken as a contribution to GLOSCAL (Global Ocean Surface Salinity Calibration and Validation), retained as one of the ESA CalVal Projects. Based on the Coriolis datasets and using In Situ Analysis System (ISAS) tool, a near real time analysis system has been developed. It provides gridded fields of sea surface salinity and temperature and the corresponding in-situ dataset. In addition to research activities, these products would be used to help the quality control of SMOS satellite data, and to improve the algorithms and monitor sensor drifts and biases.
Dataset: Temperature and Salinity
The in-situ observations used to build our dataset are collected and processed by the Coriolis data centre. The main data provider is the Argo international array of profiling floats that reached its nominal coverage of the global ocean at 3° resolution at the end of 2007. Argo profilers report Temperature and Salinity when ascending from their deepest diving level (nominally 2000m) to a near surface level. To preserve the conductivity cell, the near surface measurement is performed at 4 or 5m (sometimes 10m) below surface, and this measurement can be a local sampling or a layer average. More isolated measurements from CTDs, sensor equipped marine mammals and moorings (such as TAO/PIRATA in the tropics) complement the dataset but provide little information on the surface levels. Within the context of GLOSCAL, we intent to incorporate data from surface dedicated instruments that are not yet in the Coriolis standard data flow. At present time, the only surface dataset providing global coverage for salinity is the network of Thermosalinographs (TSG) coordinated within the Global Ocean Surface Underway Data international program (GOSUD, http://www.coriolis.eu.org/Observing-the-ocean/Observing-system-networks/GOSUD). Newly developed drifting buoys equipped with conductivity sensors appear as a promising complementary system, but they remain at the moment limited to a few areas. We have thus focused on the French contribution to the TSG dataset. The method developed here will be extended later to TSG datasets from other contributors and to the drifting buoys data.
The Coriolis Near-real time dataset
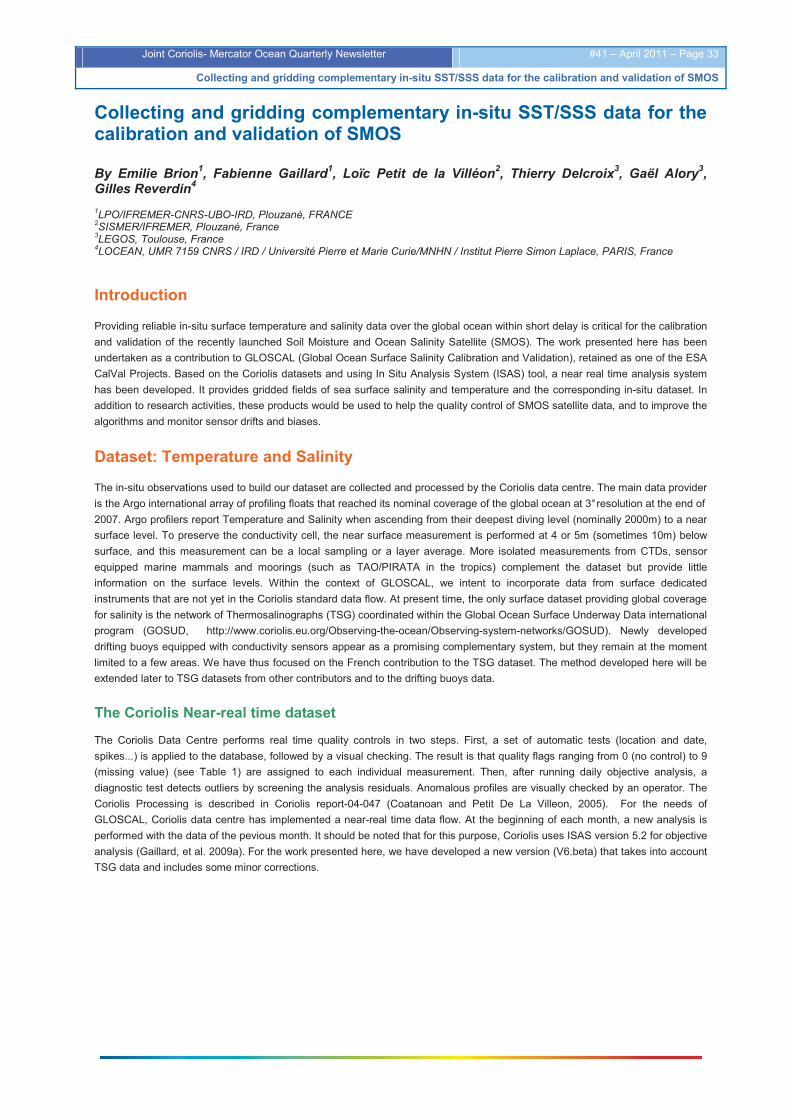
The Coriolis Data Centre performs real time quality controls in two steps. First, a set of automatic tests (location and date, spikes...) is applied to the database, followed by a visual checking. The result is that quality flags ranging from 0 (no control) to 9 (missing value) (see Table 1) are assigned to each individual measurement. Then, after running daily objective analysis, a diagnostic test detects outliers by screening the analysis residuals. Anomalous profiles are visually checked by an operator. The Coriolis Processing is described in Coriolis report-04-047 (Coatanoan and Petit De La Villeon, 2005). For the needs of GLOSCAL, Coriolis data centre has implemented a near-real time data flow. At the beginning of each month, a new analysis is performed with the data of the pevious month. It should be noted that for this purpose, Coriolis uses ISAS version 5.2 for objective analysis (Gaillard, et al. 2009a). For the work presented here, we have developed a new version (V6.beta) that takes into account TSG data and includes some minor corrections.
Joint Coriolis- Mercator Ocean Quarterly Newsletter #41 – April 2011 – Page 34
Collecting and gridding complementary in-situ SST/SSS data for the calibration and validation of SMOS
Table 1: Quality flags used at Coriolis Data Centre
The thermosalinograph datasets
Sources of data
The TSG data are collected within the context of GOSUD international project. The GOSUD dataset is hosted by Coriolis that performs the project agreed real time quality controls on this dataset. For our analysis, only data that have passed delayed mode processing are used. For that reason we limit our selection to the fleet of commercial ships (managed by the ORE-SSS (Sea Surface Salinity Observation Service, http://www.legos.obs-mip.fr/observations/sss/)) and the French research vessels, all transmitting their data in real time. The instruments are rigorously calibrated by the sensor manufacturers or by the SHOM (Service Hydrographique et Océanographique de la Marine) following the Coriolis recommendations (Reverdin et al. 2006). Water samples collected aboard at regular intervals are analyzed in order to infer and correct the salinity drift due to the fouling and/or scouring that may occur. In addition to the water sample analysis, the LOCEAN (Laboratoire d'Océanographie et du Climat: Expérimentation et Approches Numériques) update Argo datasets co-localized with ship tracks on a regular basis. Data from a few sailing ships, used as experimental platforms, are also taken into account. The processing flow can be summarized as follows:
� For French Research vessels, the TSG real time data are available on the corresponding GOSUD FTP site. Water sample analysis are provided by Coriolis. The delayed mode processing is performed at Laboratoire de Physique des Océans (LPO) in Brest.
� ORE-SSS merchant ships delayed mode data are processed at the IRD Centres in Nouméa and Brest, then at LEGOS in Toulouse and made available on a FTP site.
� Experimental sailing ships (CANOE project) are provided by Coriolis or sent directly to LPO. Some water samples are available. Delayed mode processing is done at LPO.
Delayed mode processing
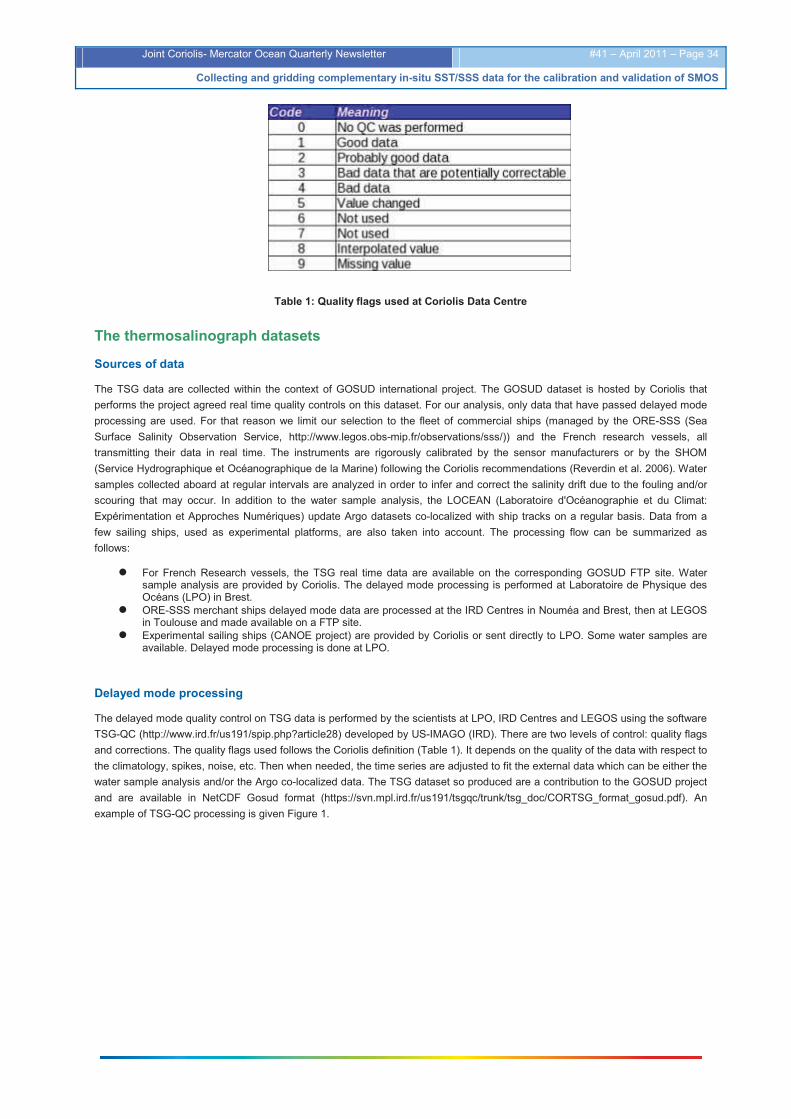
The delayed mode quality control on TSG data is performed by the scientists at LPO, IRD Centres and LEGOS using the software TSG-QC (http://www.ird.fr/us191/spip.php?article28) developed by US-IMAGO (IRD). There are two levels of control: quality flags and corrections. The quality flags used follows the Coriolis definition (Table 1). It depends on the quality of the data with respect to the climatology, spikes, noise, etc. Then when needed, the time series are adjusted to fit the external data which can be either the water sample analysis and/or the Argo co-localized data. The TSG dataset so produced are a contribution to the GOSUD project and are available in NetCDF Gosud format (https://svn.mpl.ird.fr/us191/tsgqc/trunk/tsg_doc/CORTSG_format_gosud.pdf). An example of TSG-QC processing is given Figure 1.
Joint Coriolis- Mercator Ocean Quarterly Newsletter #41 – April 2011 – Page 35
Collecting and gridding complementary in-situ SST/SSS data for the calibration and validation of SMOS
Figure 1: One example of quality control on TSG timeserie. Top panel: timeserie of salinity (PSS 78) with quality flags (color) and external data (salinity from Argo colocalised (circle) and Water Sample (triangle)). Only good quality external data are shown. Bottom panel : Adjusment of timeserie to good quality external data. Timeserie before adjustment (black), timeserie adjusted (red), error on adjustment (green).
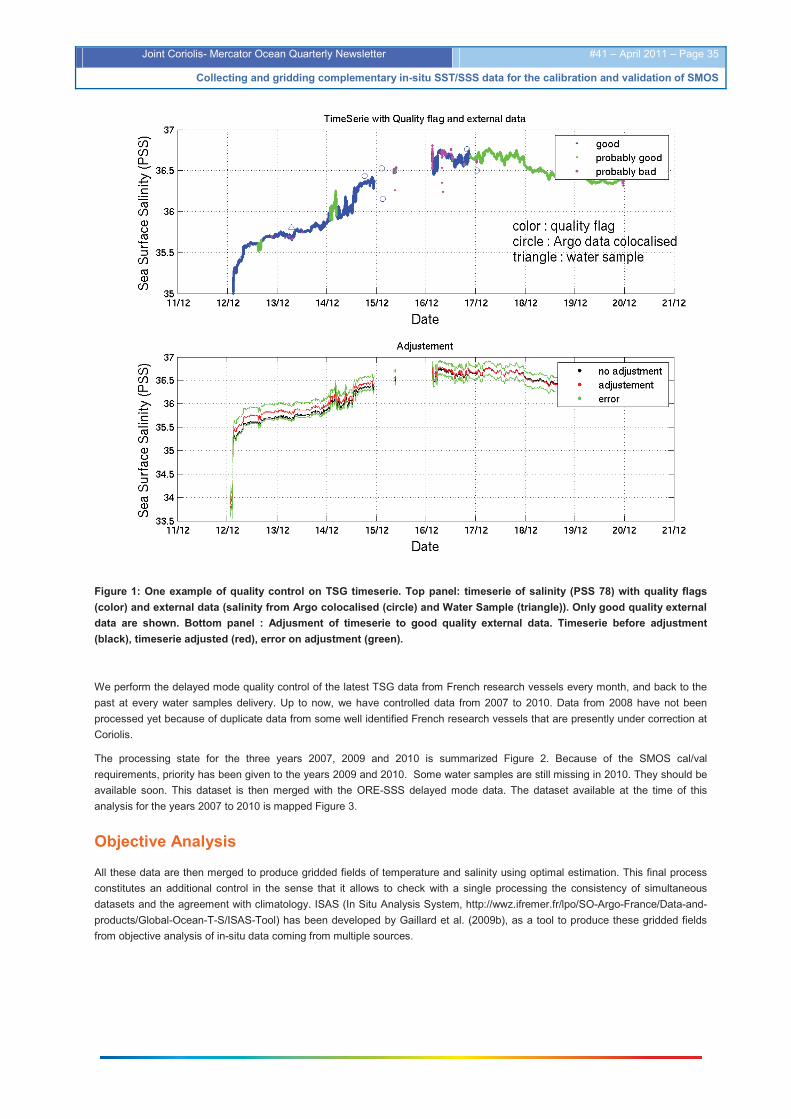
We perform the delayed mode quality control of the latest TSG data from French research vessels every month, and back to the past at every water samples delivery. Up to now, we have controlled data from 2007 to 2010. Data from 2008 have not been processed yet because of duplicate data from some well identified French research vessels that are presently under correction at Coriolis.
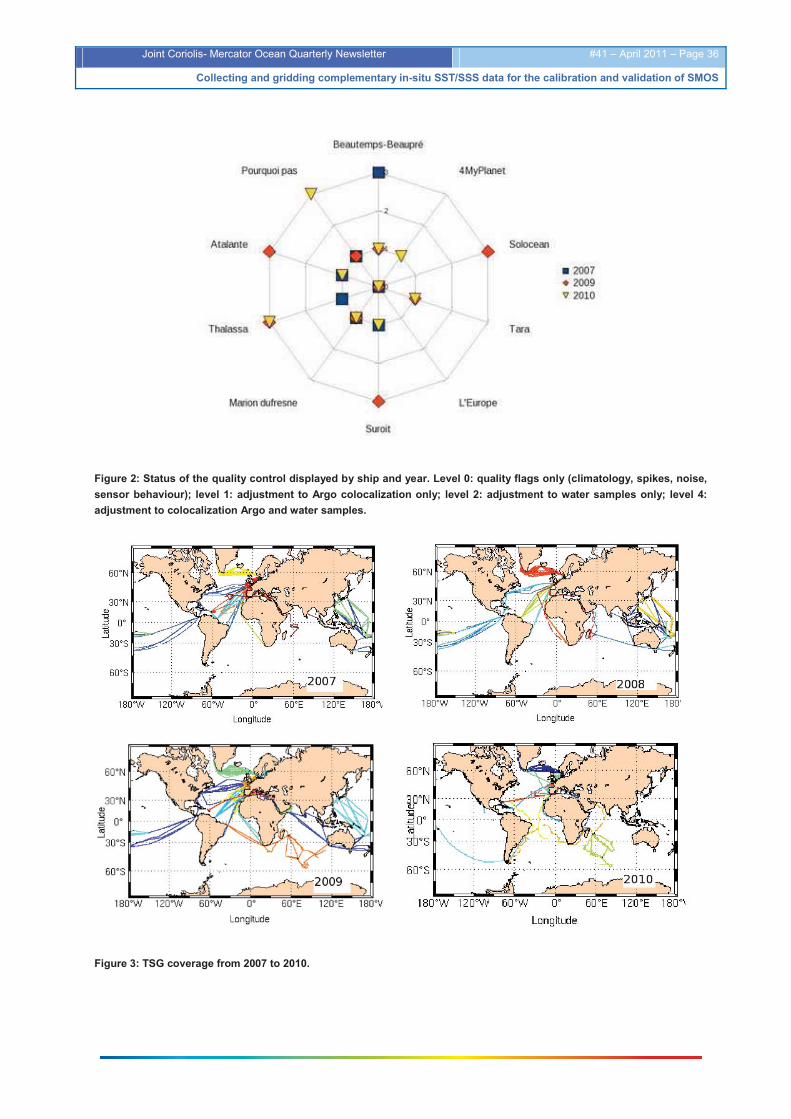
The processing state for the three years 2007, 2009 and 2010 is summarized Figure 2. Because of the SMOS cal/val requirements, priority has been given to the years 2009 and 2010. Some water samples are still missing in 2010. They should be available soon. This dataset is then merged with the ORE-SSS delayed mode data. The dataset available at the time of this analysis for the years 2007 to 2010 is mapped Figure 3.
Objective Analysis
All these data are then merged to produce gridded fields of temperature and salinity using optimal estimation. This final process constitutes an additional control in the sense that it allows to check with a single processing the consistency of simultaneous datasets and the agreement with climatology. ISAS (In Situ Analysis System, http://wwz.ifremer.fr/lpo/SO-Argo-France/Data-and-products/Global-Ocean-T-S/ISAS-Tool) has been developed by Gaillard et al. (2009b), as a tool to produce these gridded fields from objective analysis of in-situ data coming from multiple sources.
Joint Coriolis- Mercator Ocean Quarterly Newsletter #41 – April 2011 – Page 36
Collecting and gridding complementary in-situ SST/SSS data for the calibration and validation of SMOS
Figure 2: Status of the quality control displayed by ship and year. Level 0: quality flags only (climatology, spikes, noise, sensor behaviour); level 1: adjustment to Argo colocalization only; level 2: adjustment to water samples only; level 4: adjustment to colocalization Argo and water samples.
Figure 3: TSG coverage from 2007 to 2010.

Joint Coriolis- Mercator Ocean Quarterly Newsletter #41 – April 2011 – Page 37
Collecting and gridding complementary in-situ SST/SSS data for the calibration and validation of SMOS
The ISAS tool V6.beta
In the context of SMOS cal/val, the objective is to provide and extended and validated in-situ dataset and the corresponding gridded fields at the sea surface. As ISAS has not been specifically developed for the surface, a preliminary work was required to adapt it to this need.
The work started from ISAS V5.3. The ISAS grid covers the globe from 80°S to 90°N with 1/2° Mercator r esolution, on 151 standard depth levels between 0 and 2000m. A priori statistics are needed for the analysis: they were obtained from a previous analysis of the period 2002-2008 (von Schuckmann et al. 2009), providing the following reference fields:
• a mean seasonal cycle, or climatology, of temperature and salinity representative of the period • the corresponding variances (deviation between profiles and monthly mean field) (see Figure 4). • spatial scales deduced from the Rossby radius of the annual climatology (see Figure 4).
These reference fields and statistics are also used by ISAS for preliminary controls on the dataset and by the CATDS (Centre Aval de Traitement et des Données SMOS) for the real time validation of SMOS data.
The main change with respect to the initial version was to adapt the ISAS-STD pre-processing module to consider specifically the surface layer (levels extending from 0 to 20 meters). For profile data, the surface layer is assumed perfectly mixed above the level of the last measurement, which is then repeated up to the surface. For TSG data, the level sampled by the instrument is assumed to represent the whole surface layer and is repeated over this layer. Most of the time the thermosalinographs measure temperature and salinity at levels varying between 3m and 15m, depending on the vessels and their draught. The error associated with extrapolated data is increased proportionally to the distance from the measurement level. A second processing is applied to the data before producing the final ‘STD’ (standardized) files to be used by ISAS. Data from the same platform obtained within a given time and space window are averaged to reduce the oversampling that may induce matrices ill conditioning. This processing is particularly efficient on the high frequency sampled TSG data.
Figure 4: Top panel: Covariance scales. Bottom panel: a priori variance of salinity (PSS 78).
Joint Coriolis- Mercator Ocean Quarterly Newsletter #41 – April 2011 – Page 38
Collecting and gridding complementary in-situ SST/SSS data for the calibration and validation of SMOS
Near Real Time Analysis in support of SMOS
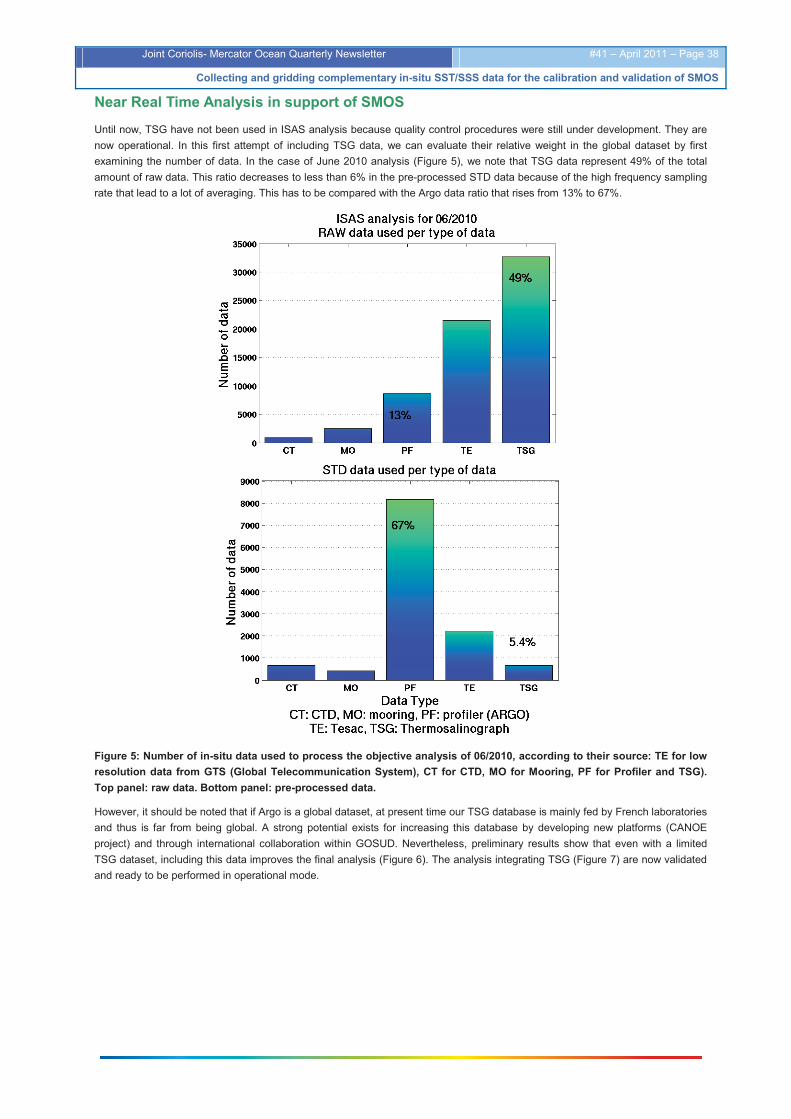
Until now, TSG have not been used in ISAS analysis because quality control procedures were still under development. They are now operational. In this first attempt of including TSG data, we can evaluate their relative weight in the global dataset by first examining the number of data. In the case of June 2010 analysis (Figure 5), we note that TSG data represent 49% of the total amount of raw data. This ratio decreases to less than 6% in the pre-processed STD data because of the high frequency sampling rate that lead to a lot of averaging. This has to be compared with the Argo data ratio that rises from 13% to 67%.
Figure 5: Number of in-situ data used to process the objective analysis of 06/2010, according to their source: TE for low resolution data from GTS (Global Telecommunication System), CT for CTD, MO for Mooring, PF for Profiler and TSG). Top panel: raw data. Bottom panel: pre-processed data.
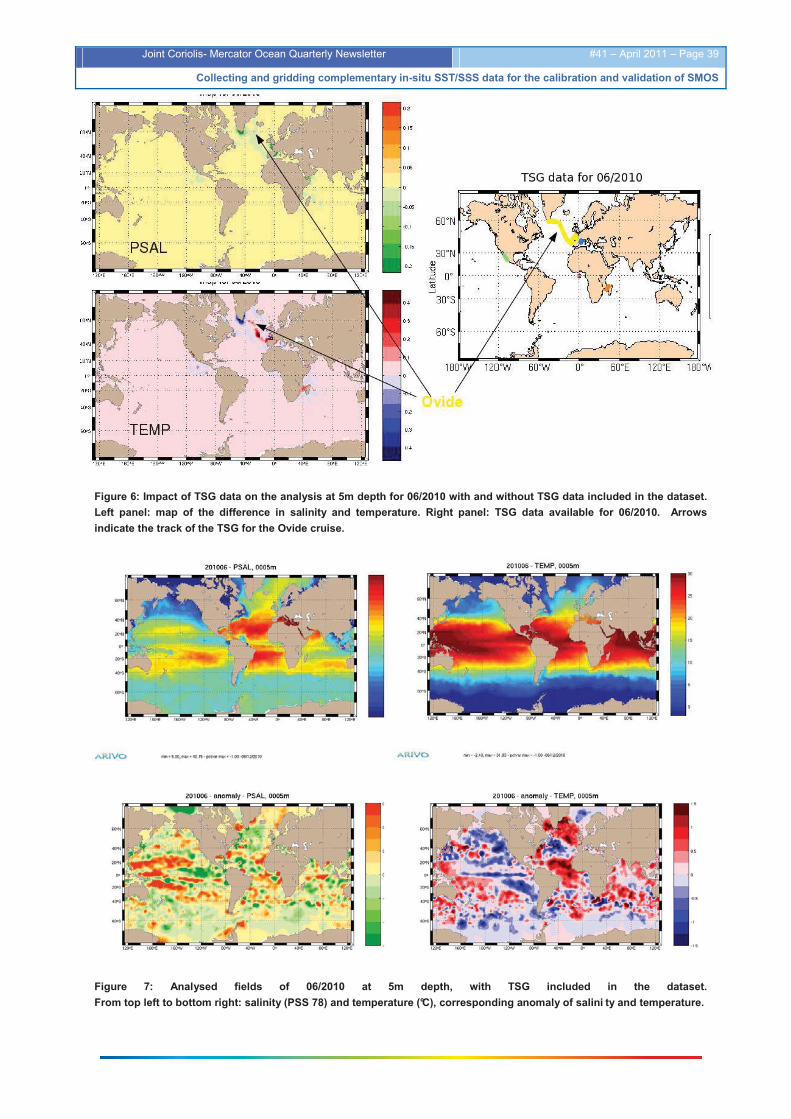
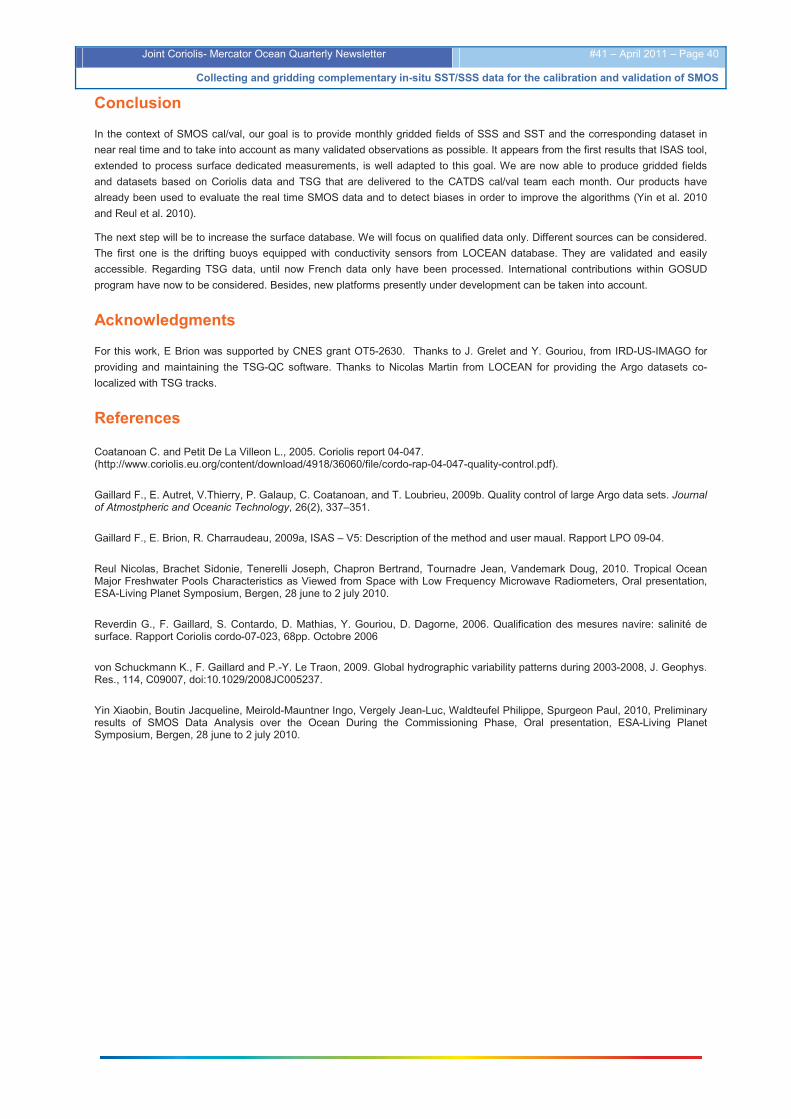
However, it should be noted that if Argo is a global dataset, at present time our TSG database is mainly fed by French laboratories and thus is far from being global. A strong potential exists for increasing this database by developing new platforms (CANOE project) and through international collaboration within GOSUD. Nevertheless, preliminary results show that even with a limited TSG dataset, including this data improves the final analysis (Figure 6). The analysis integrating TSG (Figure 7) are now validated and ready to be performed in operational mode.
Joint Coriolis- Mercator Ocean Quarterly Newsletter #41 – April 2011 – Page 39
Collecting and gridding complementary in-situ SST/SSS data for the calibration and validation of SMOS
Figure 6: Impact of TSG data on the analysis at 5m depth for 06/2010 with and without TSG data included in the dataset. Left panel: map of the difference in salinity and temperature. Right panel: TSG data available for 06/2010. Arrows indicate the track of the TSG for the Ovide cruise.
Figure 7: Analysed fields of 06/2010 at 5m depth, with TSG included in the dataset. From top left to bottom right: salinity (PSS 78) and temperature (°C), corresponding anomaly of salini ty and temperature.
Joint Coriolis- Mercator Ocean Quarterly Newsletter #41 – April 2011 – Page 40
Collecting and gridding complementary in-situ SST/SSS data for the calibration and validation of SMOS
Conclusion
In the context of SMOS cal/val, our goal is to provide monthly gridded fields of SSS and SST and the corresponding dataset in near real time and to take into account as many validated observations as possible. It appears from the first results that ISAS tool, extended to process surface dedicated measurements, is well adapted to this goal. We are now able to produce gridded fields and datasets based on Coriolis data and TSG that are delivered to the CATDS cal/val team each month. Our products have already been used to evaluate the real time SMOS data and to detect biases in order to improve the algorithms (Yin et al. 2010 and Reul et al. 2010).
The next step will be to increase the surface database. We will focus on qualified data only. Different sources can be considered. The first one is the drifting buoys equipped with conductivity sensors from LOCEAN database. They are validated and easily accessible. Regarding TSG data, until now French data only have been processed. International contributions within GOSUD program have now to be considered. Besides, new platforms presently under development can be taken into account.
Acknowledgments
For this work, E Brion was supported by CNES grant OT5-2630. Thanks to J. Grelet and Y. Gouriou, from IRD-US-IMAGO for providing and maintaining the TSG-QC software. Thanks to Nicolas Martin from LOCEAN for providing the Argo datasets co-localized with TSG tracks.
References
Coatanoan C. and Petit De La Villeon L., 2005. Coriolis report 04-047. (http://www.coriolis.eu.org/content/download/4918/36060/file/cordo-rap-04-047-quality-control.pdf).
Gaillard F., E. Autret, V.Thierry, P. Galaup, C. Coatanoan, and T. Loubrieu, 2009b. Quality control of large Argo data sets. Journal of Atmostpheric and Oceanic Technology, 26(2), 337–351.
Gaillard F., E. Brion, R. Charraudeau, 2009a, ISAS – V5: Description of the method and user maual. Rapport LPO 09-04.
Reul Nicolas, Brachet Sidonie, Tenerelli Joseph, Chapron Bertrand, Tournadre Jean, Vandemark Doug, 2010. Tropical Ocean Major Freshwater Pools Characteristics as Viewed from Space with Low Frequency Microwave Radiometers, Oral presentation, ESA-Living Planet Symposium, Bergen, 28 june to 2 july 2010.
Reverdin G., F. Gaillard, S. Contardo, D. Mathias, Y. Gouriou, D. Dagorne, 2006. Qualification des mesures navire: salinité de surface. Rapport Coriolis cordo-07-023, 68pp. Octobre 2006
von Schuckmann K., F. Gaillard and P.-Y. Le Traon, 2009. Global hydrographic variability patterns during 2003-2008, J. Geophys. Res., 114, C09007, doi:10.1029/2008JC005237.
Yin Xiaobin, Boutin Jacqueline, Meirold-Mauntner Ingo, Vergely Jean-Luc, Waldteufel Philippe, Spurgeon Paul, 2010, Preliminary results of SMOS Data Analysis over the Ocean During the Commissioning Phase, Oral presentation, ESA-Living Planet Symposium, Bergen, 28 june to 2 july 2010.