coincidence methods in gamma-ray ... -...
TRANSCRIPT

General rights Copyright and moral rights for the publications made accessible in the public portal are retained by the authors and/or other copyright owners and it is a condition of accessing publications that users recognise and abide by the legal requirements associated with these rights.
• Users may download and print one copy of any publication from the public portal for the purpose of private study or research. • You may not further distribute the material or use it for any profit-making activity or commercial gain • You may freely distribute the URL identifying the publication in the public portal
If you believe that this document breaches copyright please contact us providing details, and we will remove access to the work immediately and investigate your claim.
Downloaded from orbit.dtu.dk on: Sep 12, 2018
Coincidence methods in gamma-ray spectrometry for radioecological applications
Markovic, Nikola
Publication date:2018
Document VersionPublisher's PDF, also known as Version of record
Link back to DTU Orbit
Citation (APA):Markovic, N. (2018). Coincidence methods in gamma-ray spectrometry for radioecological applications. DTUNutech.

Dissertation for the Degree of Doctor of Philosophy
Technical University of Denmark
Coincidence methods in gamma-ray spectrometry for radioecological applications
by
Nikola Marković
Radioecology Section
The Hevesy Laboratory, Center for Nuclear Technologies
Technical University of Denmark

Supervisor
Senior scientist Per Roos
Radioecology Section
The Hevesy Laboratory, Center for Nuclear Technologies
Technical University of Denmark
Co-supervisor
Senior scientist Sven Poul Nielsen
Radioecology Section
The Hevesy Laboratory, Center for Nuclear Technologies
Technical University of Denmark
Opponents
Professor Mikael Jensen
The Hevesy Laboratory, Center for Nuclear Technologies
Technical University of Denmark
Professor Andrew Sean Murray
Nordic Laboratory for Luminescence Dating
Department of Geoscience
Aarhus University
Dr. Mikael Hult
European Commission, Joint Research Centre
Directorate for nuclear safety and security
JRC-Geel

Preface
This thesis is submitted to the Department of Physics, Technical University of Denmark (DTU), in partial fulfilment of the PhD degree in Physics. The work presented in this thesis was carried out at Radioecology Section of the Hevesy Laboratory, DTU Nutech from 1st December 2014 to 30st November 2017. The work consisted of installation of the new low-level gamma spectrometric laboratory, and applications of gamma spectrometry in the research carried out at the Radioecology Section. The project was supervised by Dr. Per Roos (main supervisor, Senior scientist at DTU Nutech) and Dr. Sven Poul Nielsen (co-supervisor, Senior scientist at DTU Nutech).
The work is presented in three separate chapters. Chapter 1 is a general introduction to the field of coincidence techniques and digital acquisition systems in gamma spectrometric measurements. Chapter 2 describes different approaches to lowering of detection limits in gamma spectrometry. Chapter 3 deals with absolute activity measurements using gamma-gamma coincidences. A general conclusion & perspectives are given in the end.

Acknowledgements I would like to thank to my supervisors, Dr. Sven Nielsen and Dr. Per Roos, for giving me the opportunity to work on such an interesting topic in the motivating environment of DTU Nutech. Dr. Per Roos was always around and available, providing support in the days when the experiments did not work, and encouraging me to continue. His in-depth knowledge of broad range of experimental techniques provided a good guidance in choosing the way where to direct and how to apply the development of new methods. I have been lucky to have the opportunity to work with and learn from Dr. Sven Nielsen, who shared a part of his great experience and wisdom. His organizational and management competences were very important in the hard times of setting-up the laboratory. His eye for details proved to be indispensable in method proof-checking and manuscript preparation.
All the colleagues from the Radioecology Section are sincerely thanked for making supportive and pleasant working atmosphere.
Special thanks go to all JRC-Geel radionuclide laboratory team under the guidance of Dr. Mikael Hult. Spending three months in a positive and motivating atmosphere of his lab was very important for my professional development. Faidra Tzika, Stefaan Pommé, Gerd Marissens, Heiko Stroh and Guillaume Lutter introduced me to high-end research and shared with me their passion for radionuclide measurements.
In addition, I would like to thank to:
Søren Dalsgaard for his advice on multiple mechanical issues, for his help in machining on many occasions, for allowing me to use his workshop and for patiently answering all of my questions on how to use the tools (and for not getting angry when something breaks).
Henrik Prip for the great help in many technical aspects; he saves the day by having the right cable and connector. Without his initiative and help with moving-in a few tons heavy lead shield for NaI-NaI coincidence system, one chapter of this thesis would not have existed.
All my fellow PhD students and colleagues from 201 building are acknowledged for their support and friendship.
To the ones I missed mentioning, I hope there will be an opportunity to thank in person.

List of papers related to the thesis
I. N. Marković, P. Roos, and S. P. Nielsen. Low-level gamma-ray spectrometry for the determination of 210Pb. Journal of Radioanalytical and Nuclear Chemistry, vol. 311, pp. 1473–1478, 2017.
II. N. Marković, P. Roos, S. P. Nielsen and X. X. Cai. Background reduction at DTU Nutech surface gamma laboratory. Manuscript in preparation.
III. N. Marković, P. Roos, and S. P. Nielsen. Digital gamma-gamma coincidence HPGe system for environmental analysis. Applied Radiation and Isotopes, vol. 126, pp. 194–196, 2017.
IV. N. Marković, P. Roos, and S. P. Nielsen. Coincidence Gamma-Ray Spectrometry. Proceedings of 11th Symposium of the Croatian Radiation Protection Association, 2017. http://www.hdzz.hr/wp-content/uploads/2017/04/11HDZZ_zbornik.pdf
V. N. Marković, P. Roos, and S. P. Nielsen. Sum-coincidence mode operation of dual HPGe system. Manuscript in preparation.
VI. N. Marković, P. Roos, X. Hou and S.P. Nielsen. Calibration of HPGe – HPGe coincidence spectrometer through performing standardisation of 125I activity by X-ray-gamma coincidence spectrometry using two HPGe detectors. Nuclear Instruments and Methods in Physics Research Section A: Accelerators, Spectrometers, Detectors and Associated Equipment, 880 (2018) 194–200.

List of abbreviations and acronyms
ADC Analogue-to-digital converter
BEGe Broad energy range germanium
BIPM International Bureau of Weights and Measures (Bureau International des Poids et Mesures)
EC Electron capture
FEP Full-energy peak
FWHM Full Width at Half Maximum
GUM Guide to the Expression of Uncertainty in Measurement
HPGe High-purity germanium
MC Monte Carlo
MDA Minimum detectable activity
NUCLeGeS Nutech Coincidence Low Energy Germanium Sandwich Spectrometer
PMT Photomultiplier tube
ROI Region of interest
SI International System of Units (Système international)
TCS True coincidence summing

Abstract Gamma spectrometry is one of the most powerful radiometric techniques available. The non-destructive method enables both quantitative determination and identification of the majority of radioisotopes. Compared to other radiometric techniques, it has a great advantage in being able to detect minor isotopes, even in the presence of a large background from a multitude of other radioactive elements without any need for separating the isotopes. This has enabled the technique to be used as the standard tool in nearly all disciplines where radioisotopes are analyzed.
The technique plays an important role in environmental radioactivity, nuclear safety and reactor monitoring, nuclear medicine, isotope geology… Gamma spectrometric analysis of artificial radioisotopes in man (whole body counting) has improved the understanding of human metabolism, while the analysis of the very same radioisotopes in sea water has shed light on Arctic Ocean water circulation.
All of this is thanks to a deliberate and continuous effort to improve the technique over the years. With improvements in energy resolution, detector size and performance, coupled to better background reduction, studies of new phenomena in environmental radioactivity have become possible. Not seldom have these improvements occurred suddenly though discrete events. The introduction of digital signal processing in gamma spectrometry is definitely one such event, and it will, in the next coming years, revolutionize the way in which we acquire information through environmental gamma spectrometry.
Up till now, gamma spectra were measured in a way that the energy deposited in a detector was measured with an analogue chain (preamplifier, amplifier, ADC), events were saved in computer memory with its energy and arranged into a histogram called spectrum. With digital list-mode systems each event is saved with its energy and time-stamp when the event happened. In simple words, the difference between the standard gamma spectrum and time-stamped list-mode file can be compared to a difference between the long exposition photography and a video.
Coincidence gamma spectrometry exists from the early-days of nuclear research, but the complexity of such systems usually limited its use to large experiments or highly specialized applications. The systems needed delicate tuning for each particular experiment, and once the system was set-up and working, making changes was a cumbersome procedure. Often a change of a single cable (in a fast signal branch) made the system not working. With digital list mode gamma spectrometry, once the acquisition parameters are adjusted and the sample is measured, all the coincidence settings can be tested in post-processing. That means if different coincidence timing or energy gating is needed, it takes only minutes to generate a new spectrum, in contrast to ‘standard’ approach where the new measurement needed to be done (often a long time measurement if we’re dealing with low activity levels). That significantly simplified the process of setting up coincidence experiment. Widespread use of the field-programmable gate array (FPGA) technology led to reduction in size and price. A single digital unit replaced a whole set of special analogue units (like CFD, TAC, Coincidence unit, delay unit, shaper…). Small physical size enables integration of coincidence system to mobile (or hand-held) instruments. All that will make changes to gamma spectrometry in coming years, which cannot even be foreseen. Even now some producers are completely stopping the manufacturing of

standard analogue NIM bin modules, although the use of time-stamping is still at its start. Developments of IEC standard for list-mode data acquisition will certainly speed-up the things by making the implementation of the new technology into laboratory even easier. The standard will make the implementation easy, enabling universal coincidence acquisition and analysis software, in contrast to current approach where the most groups are developing its own software.
This thesis reveals some promising aspects of digital-list mode acquisition systems when applied to gamma spectrometry, from low-level measurements, where it can be used with veto detectors or multiple HPGe detectors for background reduction and efficiency enhancement, to measurements of high activity levels where, in some cases, coincidence signals with narrow energy gating, enable extraction of weaker signal hidden in high activity matrix.
The use of a sum-coincidence mode resulted in 17% efficiency increase. Summing of coincident events energies reconstructed the full energy of a photon Compton scattered between two detectors. Applying anticoincidence setting enables better sensitivity for 210Pb determination by reducing background continuum for ~15%. The two abovementioned methods can be applied also for low or ultra low-level measurements. For high activity samples, narrow energy window gates combined with coincidence gating resulted in almost complete background reduction, revealing the 605 keV 134Cs peak under high 137Cs background. This approach seems promising for determination of impurities in radiopharmaceuticals or characterization of decommissioning samples.
Application of digital systems in activity standardization measurements with liquid scintillation counting (LSC) has become a standard, but its introduction to photon-photon coincidence techniques is still pending full recognition. The last chapter gives some reasoning on possible ways how it could be done. Primary standardization method for 125I using two NaI(Tl) detectors has been set-up at the Radioecology Section. New standardization method for 125I based on two HPGe detectors has been developed. The method, although inferior in precision compared to NaI(Tl) method, has an advantage of not relying on total count rate measurement allowing 125I activity standardization in the presence of impurities. Review of 60Co standardization method is presented with a theoretical solution for extension to 134Cs gamma-gamma standardization.

Resumé (in Danish) Gammaspektrometri er en af de mest udbredte og effektive radiometriske analyseteknikker. Analysemetoden er ikke-destruktiv og muliggør både kvantitativ bestemmelse og identifikation af radioisotoper, der udsender gamma- og røntgenstråling. Sammenlignet med andre radiometriske teknikker har gammaspektrometri en stor fordel ved at kunne detektere små mængder radioisotoper selv med tilstedeværelse af en betydelig mængde andre radioaktive stoffer uden behov for (kemisk) at adskille isotoperne. Derfor anvendes gammaspektrometri som standardværktøj i næsten alle discipliner, hvor man analyserer radioaktive isotoper.
Teknikken spiller en vigtig rolle inden for radioaktivitet i miljøet, nuklear sikkerhed og overvågning af kernereaktorer, nuklearmedicin, isotopgeologi mv. Gammaspektrometrisk analyse af menneskeskabte radioisotoper ved helkropsmålinger af mennesker har forbedret forståelsen af human metabolisme, mens analyser af de samme radioisotoper i havvand har belyst stor-skala cirkulation af vandmasser i det Arktiske Ocean.
Alt dette er takket være en bevidst og kontinuerlig indsats gennem årene for at forbedre teknikken. Med forbedringer i energiopløsning, størrelse og ydeevne af detektorer, kombineret med bedre reduktion af baggrund, er erkendelser af nye fænomener inden for radioaktivitet i miljøet blevet mulige. Disse forbedringer har ofte fundet sted pludseligt, som diskrete begivenheder. Indførelse af digital signalbehandling i gammaspektrometri er afgjort en sådan begivenhed, og denne teknik vil i de kommende år revolutionere måden, hvorpå vi erhverver ny viden gennem undersøgelser af radioaktivitet i miljøet.
Indtil for nylig blev gammaspektre registreret ved, at energien deponeret i en detektor blev målt gennem en analog kæde af elektronikmoduler (forforstærker, forstærker, ADC), hændelser blev sorteret efter gammaenergi, gemt i et digitalt lager og fremvist i et histogram eller gammaspektrum. Digitale list-mode systemer gemmer hver begivenhed med energi og tidsstempel, når begivenheden sker. Forenklet kan forskellen mellem et standard gammaspektrum og en list-mode fil med tidsstempler sammenlignes med forskelen mellem et langtidseksponeret fotografi og en video.
Gammaspektrometri kombineret med koincidens-teknik har været anvendt fra tidlig nuklear forskning, men kompleksiteten af sådanne systemer har normalt begrænset brugen til større eksperimenter eller højt specialiserede anvendelser. Systemerne skulle fine-tunes til hvert enkelt eksperiment, og det var besværligt at foretage ændringer, når først systemet var etableret. Ofte kunne en ændring af et enkelt kabel (i en hurtig signal-kæde) gøre, at systemet ikke mere fungerede. Med gammaspektrometri i digital list-mode kan alle indstillinger af koincidensparametre efterfølgende afprøves, når først inputspecifikationer er justeret, og prøven målt. Det betyder, at hvis der er ønske om at ændre koinidens-parametre, f.eks. tids- og/eller energivinduer, tager det kun få minutter at generere et nyt spektrum i modsætning til "standard" tilgangen, som kræver en ny måling (langvarig, hvis det drejer sig om lave niveauer af radioaktivitet). Herved gøres det betydeligt enklere at etablere koincidens-eksperimenter. Den udbredte anvendelse af field-programmable gate array (FPGA) teknologi har ført til reduktion i størrelse og pris. En enkelt digital enhed erstatter et helt sæt analoge enheder (som CFD, TAC, koincidensmodul, delay-enhed, shaper ...). Den lille fysiske størrelse af en FPGA-enhed gør det muligt at integrere koincidens-

systemer i mobile eller håndholdte instrumenter. Alt dette vil medføre uforudsigelige ændringer i gammaspektrometri i de kommende år. Nogle producenter er allerede ophørt med at fremstille traditionelle analoge NIM-bin moduler, men brug af tidstempler er stadig på begyndelsesstadiet. Udvikling af IEC-standarden for list-mode dataindsamling vil helt sikkert fremskynde tingene ved at gøre implementeringen af den nye teknologi til brug i laboratoriet endnu lettere. Standarden vil forenkle udviklingen ved at skabe grundlag for generel software til koincidens-analyse i modsætning til den nuværende situation, hvor de fleste grupper udvikler egen software.
Denne afhandling præsenterer lovende aspekter af digitale list-mode datasystemer anvendt til gammaspektrometri. Fra low-level målinger, hvor teknikken kan bruges med scintillations-detektorer (veto-detektorer) eller multiple HPGe detektorer til reduktion af baggrund og forøgelse af effektivitet til målinger af prøver med høje aktivitetsniveauer. Det er således muligt at bestemme gammaisotoper med meget lave aktiviteter fra andre isotoper med høje aktiviteter ved at benytte koincidens-teknik og snævre energivinduer.
Kombineret brug af summations- og koincidensteknik har medført en forøgelse af analyseeffektivitet på 17%. Summation af koincidente hændelser har gjort det muligt at rekonstruere den samlede energi af Compton spredning af en foton med mellem to detektorer. Med brug af antikoincidens-teknik reduceres baggrunden, hvorved følsomheden forbedres med omkring 15%. De to ovennævnte metoder kan også anvendes til low-level eller ultra low-level målinger. For højaktivitetsprøver resulterede brug af snævre energivinduer kombineret med koincidens-teknik næsten komplet eliminering af baggrund med identifikation af 605 keV gammafotoner fra 134Cs under en høj baggrund fra 137Cs. Denne metode virker lovende til at bestemme urenheder i radioaktive lægemidler eller i prøver fra dekommissionering af nukleare anlæg.
Det er i dag almindeligt at anvende digitale systemer til at standardisere målinger af radioaktive isotoper med brug af væskescintillation (LSC), men introduktion af digital list-mode systemer til gammaspektrometri afventer stadig at blive anerkendt. Afhandlingens sidste kapitel omfatter en diskussion af, hvordan det kunne gøres. En metode til at absolutbestemme 125I ved brug af to NaI(Tl) detektorer og koincidens-teknik er blevet etableret. Endvidere er en ny metode til at standardisere 125I baseret på to HPGe detektorer blevet udviklet. Metoden med HPGe detektorer er mindre præcis end med NaI(Tl) detektorer, men har den fordel at ikke være afhængig af total tællingshastighedsmåling, hvilket tillader standardisering af 125I aktivitet i tilstedevær af urenheder. Desuden præsenteres en metode til at standardisere 60Co med en teoretisk løsning, der kan udvides til gamma-gamma standardisering af 134Cs.
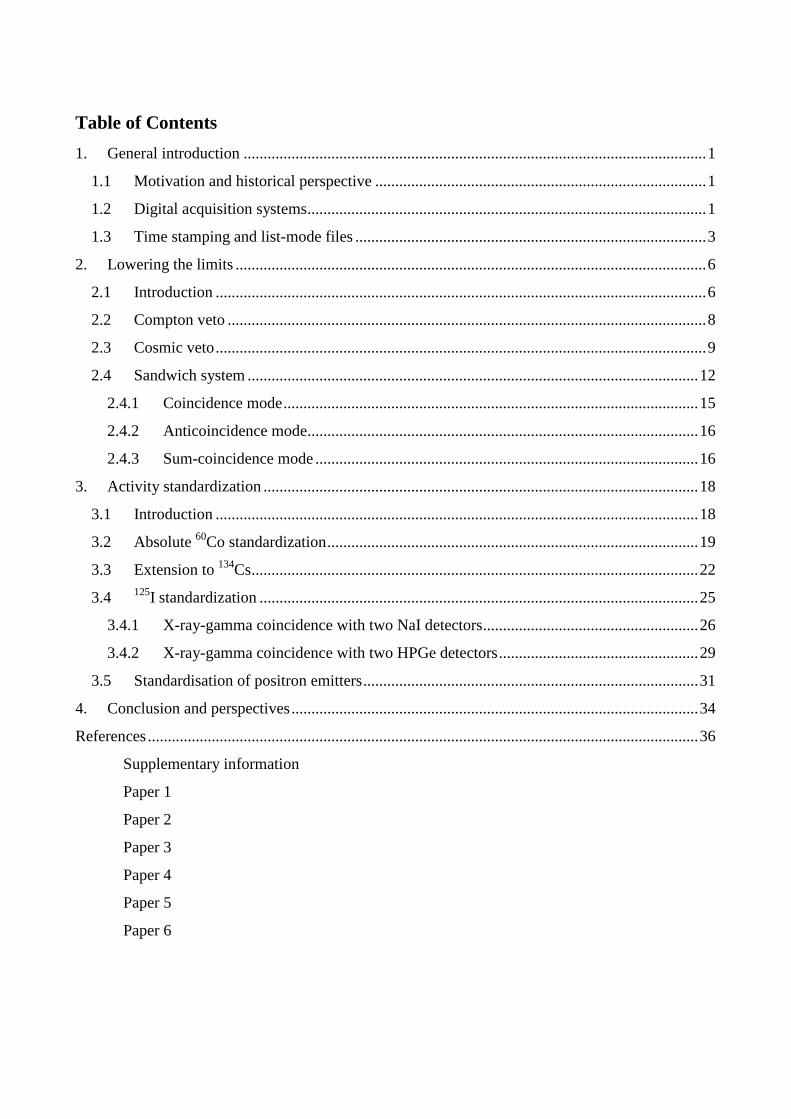
Table of Contents 1. General introduction .................................................................................................................... 1
1.1 Motivation and historical perspective ................................................................................... 1
1.2 Digital acquisition systems .................................................................................................... 1
1.3 Time stamping and list-mode files ........................................................................................ 3
2. Lowering the limits ...................................................................................................................... 6
2.1 Introduction ........................................................................................................................... 6
2.2 Compton veto ........................................................................................................................ 8
2.3 Cosmic veto ........................................................................................................................... 9
2.4 Sandwich system ................................................................................................................. 12
2.4.1 Coincidence mode ........................................................................................................ 15
2.4.2 Anticoincidence mode.................................................................................................. 16
2.4.3 Sum-coincidence mode ................................................................................................ 16
3. Activity standardization ............................................................................................................. 18
3.1 Introduction ......................................................................................................................... 18
3.2 Absolute 60Co standardization ............................................................................................. 19
3.3 Extension to 134Cs ................................................................................................................ 22
3.4 125I standardization .............................................................................................................. 25
3.4.1 X-ray-gamma coincidence with two NaI detectors ...................................................... 26
3.4.2 X-ray-gamma coincidence with two HPGe detectors .................................................. 29
3.5 Standardisation of positron emitters .................................................................................... 31
4. Conclusion and perspectives ...................................................................................................... 34
References .......................................................................................................................................... 36
Supplementary information
Paper 1
Paper 2
Paper 3
Paper 4
Paper 5
Paper 6

1
1. General introduction
The following chapter is an introduction to gamma spectrometry with multiple detector systems. A historical overview is presented with focus on the impact of development in digital acquisition systems. Later in the text, the digital acquisition system and post-processing software used in this work are also described.
1.1 Motivation and historical perspective Gamma-ray spectrometry with high-purity germanium (HPGe) detectors is often the technique of choice in an environmental radioactivity laboratory. It is non-destructive, special radio-chemical sample preparation is not needed, and many radionuclides can be determined in a single measurement, so it is used for fast and routine determination of radionuclides.
From the early days of nuclear physics research, gamma-ray detector arrays have been used in coincidence experiments for nuclear structure studies (Eberth and Simpson, 2008). The best multi-detector array of the time, NORDBALL, consisting of 20 Compton suppressed HPGe detectors was situated at Risø (Jerrestam et al., 1989; Piiparinen et al., 1993). Still today, large HPGe detector arrays are used for nuclear structure studies (Beck, 1992; Collins et al., 2017; Söderström et al., 2013; Van Duppen and Riisager, 2011; Venhart et al., 2017) and measurements of rare events (Agostini et al., 2013; Van Duppen and Riisager, 2011). Those are all large-scale facilities operated by large collaborations with experts in separate sub-fields, covering separately data-acquisition, experiment design, data analysis…
Bringing the methodologies from the large scale experimental nuclear and particle physics experiments to environmental radioactivity laboratories operated by a small group or even a single experimentalist, has become possible largely due to the developments in digital acquisition technologies. Systems which are easy to connect and adjust, replace a large number of NIM based analogue electronic units needed for coincidence measurements. List-mode data acquisition with time-stamped events enables change of various coincidence parameters in post-processing, that otherwise, with analogue systems, had to be pre-defined before the measurement. That significantly reduces the time needed for optimization measurements, as changes in coincidence widths or energy discriminators are introduced in the analysis steps. The same is true for the dead-time corrections.
Multiple multi-detector HPGe systems equipped with digital acquisition systems with time-stamping capabilities emerged during the last few years (R. Britton et al., 2015; Cagniant et al., 2015; Zhang et al., 2014). The digital acquisition systems have also been used for the Compton and cosmic veto detectors. The main suppliers are CAEN and XIA; Canberra is also trying to get its share with the LYNX system. Still, many labs are using in-house developed systems.
1.2 Digital acquisition systems CAEN digital multichannel analysers (MCA), models N6781 and DT5780, were used for the work conducted in this thesis. The following chapter is based mostly on the user manuals for CAEN
2
MCAs (CAEN Electronic Instrumentation, 2015a, 2015b) and MC2 acquisition software (CAEN Electronic Instrumentation, 2017).
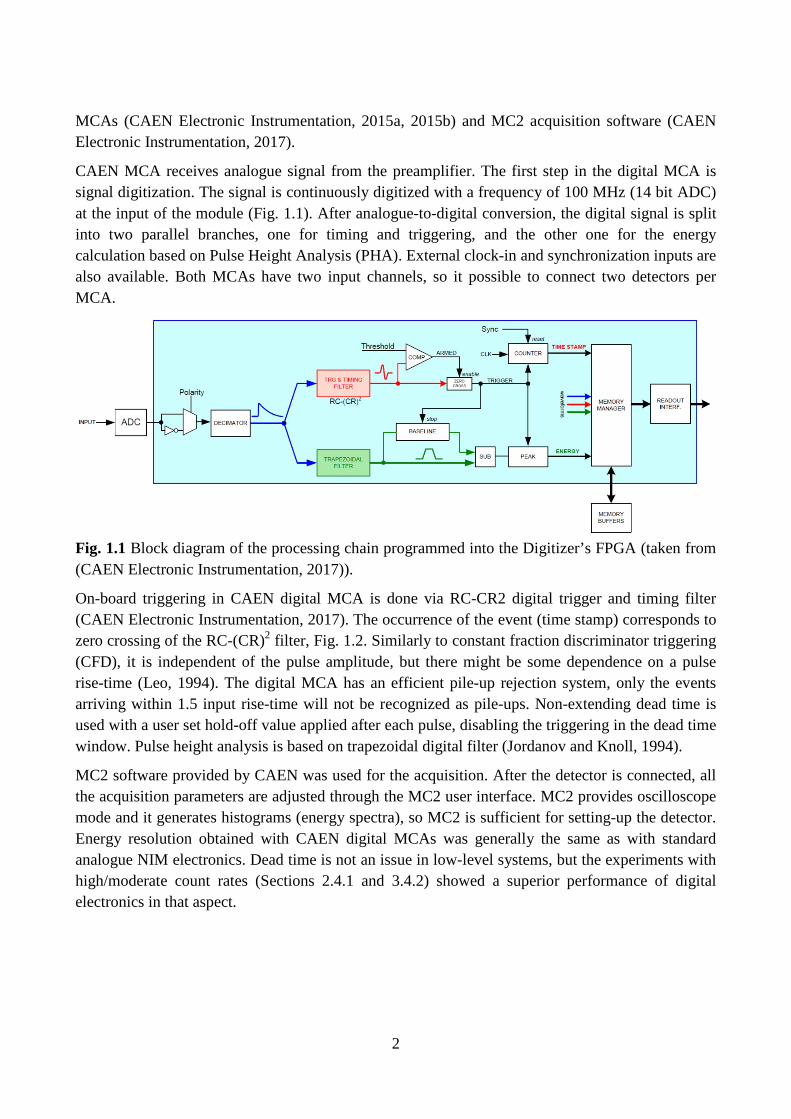
CAEN MCA receives analogue signal from the preamplifier. The first step in the digital MCA is signal digitization. The signal is continuously digitized with a frequency of 100 MHz (14 bit ADC) at the input of the module (Fig. 1.1). After analogue-to-digital conversion, the digital signal is split into two parallel branches, one for timing and triggering, and the other one for the energy calculation based on Pulse Height Analysis (PHA). External clock-in and synchronization inputs are also available. Both MCAs have two input channels, so it possible to connect two detectors per MCA.
Fig. 1.1 Block diagram of the processing chain programmed into the Digitizer’s FPGA (taken from (CAEN Electronic Instrumentation, 2017)).
On-board triggering in CAEN digital MCA is done via RC-CR2 digital trigger and timing filter (CAEN Electronic Instrumentation, 2017). The occurrence of the event (time stamp) corresponds to zero crossing of the RC-(CR)2 filter, Fig. 1.2. Similarly to constant fraction discriminator triggering (CFD), it is independent of the pulse amplitude, but there might be some dependence on a pulse rise-time (Leo, 1994). The digital MCA has an efficient pile-up rejection system, only the events arriving within 1.5 input rise-time will not be recognized as pile-ups. Non-extending dead time is used with a user set hold-off value applied after each pulse, disabling the triggering in the dead time window. Pulse height analysis is based on trapezoidal digital filter (Jordanov and Knoll, 1994).
MC2 software provided by CAEN was used for the acquisition. After the detector is connected, all the acquisition parameters are adjusted through the MC2 user interface. MC2 provides oscilloscope mode and it generates histograms (energy spectra), so MC2 is sufficient for setting-up the detector. Energy resolution obtained with CAEN digital MCAs was generally the same as with standard analogue NIM electronics. Dead time is not an issue in low-level systems, but the experiments with high/moderate count rates (Sections 2.4.1 and 3.4.2) showed a superior performance of digital electronics in that aspect.

3
All the measurements were done in list-mode. MC2 is used to start and stop the acquisition. It provides real time1 and builds a simple energy spectrum for each channel.
Fig. 1.2. Simplified signals scheme of the Trigger and Timing filter (red) and the Trapezoidal Filter (green). In blue the input pulses from preamplifier (taken from (CAEN Electronic Instrumentation, 2017)).
1.3 Time stamping and list-mode files Once the measurement is over there are two list-mode files available, one for each detector used. List-mode files contain energy (ADC number) of each event detected along with a time-stamp when the event happened. MATLAB based post-processing software was developed and used to generate the spectra from the list-mode files. Spectral analysis (peak area calculation, efficiency calibration, nuclide identification, calculation of detection limits …) is done by using Cabrera’s Genie 2000 software (Canberra Industries, 2013). Additional coincidence spectra are identified based on the selected coincidence resolving time and optional energy gating. MATLAB software is fully automated producing Genie 2000 CAM spectral files ready for further analysis. In the main graphical user interface (GUI) window (Fig. 1.3) the user selects the list mode files for each acquisition channel (detector). For coincidence spectrum generation coincidence resolving time is set to cover the coincidence time peak (see e.g. Fig. 4 in Paper VI). If energy gate is to be used upper and lower energy discriminators are set by the user and program transfers that to ADC numbers by using the corresponding energy calibration. Only one energy gate (region) can be used in a default version with GUI, but it is possible to add a larger number of energy gate ROIs programmatically if needed. The program has additional functions (e.g. coincidence delay time spectrum and two-dimensional coincidence spectrum output) that have not been embedded into the main GUI so far. Processing time of a typical low count rate measurement is only a couple of 1 Dead time calculation provided with the default firmware is not managing dead time correctly with low count rate systems.

4
minutes (generating normal spectra, coincidence spectra and energy gated spectra for each channel). If high activities are measured for longer time post-processing is slower. For example, with 5 kHz count rate on each detector and 4 days measurement time, it took around 2 hours for the calculation of coincidence and energy gated coincidence spectra.
Fig. 1.3. NUCLeGeS post processing software user input window.

5
Fig. 1.4. Flowchart representing the interface between the various analysis steps.
All the spectra are saved in TKA format and then converted to GENIE 2000 CAM files using FILECNVT batch command (Canberra, 2009a). The summation of the spectra from the two detectors is performed by first normalizing the spectra to match energy calibration using the NORMAL batch command, and then adding the spectra using STRIP with factor -1. Energy calibration is taken from the energy calibrated spectra for each channel that was prepared before the analysis. Genie 2000 batch command MOVEDATA, with /ECAL /OVERWRITE qualifiers, transfers the energy calibration from the calibrated files to the newly generated spectrum. Spectrum preparation (summation of the spectra from the two detectors, coincidence identification, spectrum manipulation etc.) is controlled from the MATLAB program, while spectrum analysis (peak search, activity calculation etc.) is done using GENIE 2000 software, Fig. 1.4.

6
2. Lowering the limits
Reducing the background enables determination of lower activity levels. In this chapter some of the active background suppression methods are presented. Section 2.2 is based on the Paper I, published in the Journal of Radioanalytical and Nuclear Chemistry. Cosmic veto system is part of the work related to background characterization of the detectors used for routine gamma spectrometric measurements (Paper II, manuscript in preparation). Section 2.3 describes dual HPGe spectrometer installed at the Radioecology Section and describes methodologies developed in Paper III (published in the Applied Radiation and Isotopes), Paper IV (part of the Proceedings of 11th Symposium of the Croatian Radiation Protection Association) and Paper V (manuscript in preparation).
2.1 Introduction When measuring low activities, such as usually found in environmental samples, the quantity of interest is the minimum detectable activity (MDA). MDA is the smallest activity value of radioactive nuclide that we can be confident will be detected by our system. It answers a priori question, how good is our method/system. In Supplementary information section some aspects of detection limits and MDA determination are treated in more detail. Through this thesis, MDA per unit mass is calculated using the Currie equation (Currie, 1968) for 95% confidence level:
𝑀𝑀𝑀𝑀𝑀𝑀 = 2.71+4.65∗√𝐵𝐵𝑌𝑌∗𝜀𝜀𝐹𝐹𝐹𝐹𝐹𝐹∗𝑡𝑡∗𝑚𝑚
(2.1)
Y is photon emission probability (intensity), εFEP is the FEP efficiency for the gamma line of interest (including the TCS correction and self-absorption correction), t counting time, m mass of the sample and B is the number of background counts in the region of interest. If low activity levels are to be measured MDA needs to be lowered. That can be achieved by:
- Increasing the efficiency by taking bigger detector or a better source-detector configuration. - Measuring for longer time. - Measuring bigger sample. - Improving energy resolution of the detector. - Reducing the background. - Using radiochemical procedures for preconcentration and purification to enhance the signal
from the desired radionuclide.
The first three methods will generally also induce higher background. Radiochemistry is out of the scope of this work so the best way to start is by background reduction. Background count rate in the region of interest is also influenced by the width of the region of interest (where the background is determined). This means that detectors with better energy resolution will have lover MDAs (when all the other parameters are the same).
Background is defined as a number of events of no interest in the region of specific line in the spectrum (ISO, 2010). Background can be divided into two main contributions: one originating from the sample itself and the other coming from outside the sample. Background from the sample itself can have interference peaks contribution (from other lines/nuclides present) and a continuum part. Sample induced continuum background is a consequence of incomplete absorptions of
7
radiation in the detector, scattering from a surrounding material, bremsstrahlung or X-ray fluorescence. The first two are Compton scattering processes. Reduction of a Compton background component was described in Paper I.
External background contribution can be divided into cosmic, airborne radon, construction materials and environmental component.
Environmental component comes from gamma emitting radionuclides in the laboratory environment (238U, 235U and 232Th series and 40K). It is mostly attenuated in the lead shield but high energy 40K and 208Tl gamma rays are still reaching the detector. In surface laboratories 10 cm thick lead shields are recommended, providing a good balance between the environmental attenuation (more than three orders of magnitude on 1 MeV) and the increase of cosmic induced neutron background in the oversized lead shields (Heusser, 1986).
The airborne radon, while entering the shield, can induce significant background interfering with the lines measured in NORM samples. Therefore, laboratory ventilation, air-tight shields and inner shield cavity venting with the nitrogen boiling off from the Dewar are used for its reduction.
In low-level applications, the detector cryostat and the components close to the crystal are made of special radiopure materials with low radioactivity content. Components that do not need to be in the vicinity of the crystal are moved outside the shield (remote preamplifier), and U-type cryostats are used to prevent direct line-of-sight from outside of the shield to the crystal element. In some vertical dipstick configurations, an offset between the upper and the lower part of the cryostat shielding the detector element from vacuum sieves (Verplancke, 1992) is introduced. The impurities in the shield need to be considered as well. Modern iron and lead can be contaminated with anthropogenic nuclides used for monitoring the production process. Even if the pure lead is selected it would contain some 210Pb that cannot be removed chemically in the lead production. 210Pb radiation, 46.54 keV gamma line and 16.96 keV and 63.5 keV Emax β are removed by lead itself, and the surface component is removed by copper lining inside the shield. However, its daughter 210Bi has energetic β electron with maximum energy of 1161.2 keV producing bremsstrahlung, which can reach the detector from deep inside the lead shield. It contributes to the detector low energy background with a maximum of around 170 keV (Heusser, 1995). To reduce this part of background, extra radio-pure lead is used inside the shield. There are different purities on the market going down to 0.3 Bq/kg. For ultra-low levels, archaeological lead, where all 210Pb has decayed, is used.
In a surface laboratory, the most significant is a cosmic induced background component. Earth atmosphere is constantly bombarded with a cosmic radiation consisting of high energy particles, mainly protons and alphas. They interact with the atmosphere producing pions, muons, protons, electrons, positrons and neutrons. Muons reach the surface with a flux of around 0.015 particles per second per square centimetre (Gilmore, 2008). Protons and electrons are effectively removed by the lead shield, but muons and neutrons are passing through and interacting with the detector and its surroundings. Muons interact with the shielding and the detector producing bremsstrahlung radiation; charged particles production and muon capture result in high energy gammas and tertiary neutrons (Gastrich et al., 2016; Heusser, 1995). Muons deposit their energy directly in the detector or via charged particles they produce, while neutrons contribute the detector background by
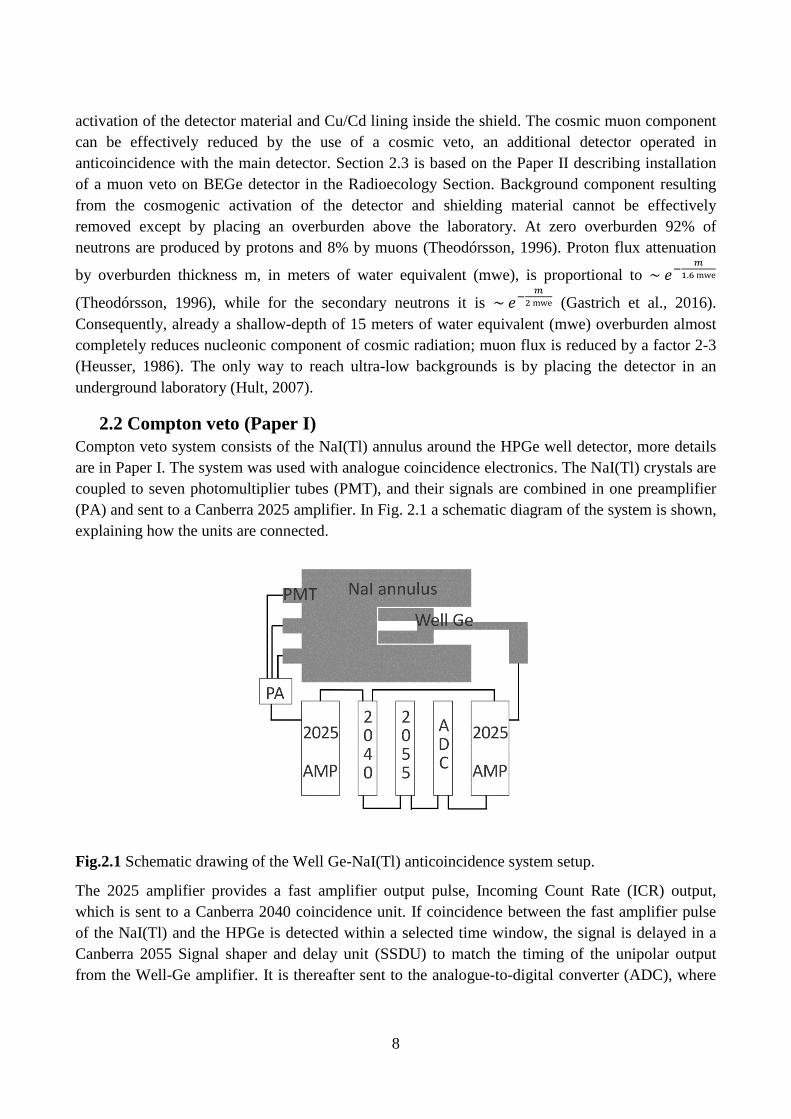
8
activation of the detector material and Cu/Cd lining inside the shield. The cosmic muon component can be effectively reduced by the use of a cosmic veto, an additional detector operated in anticoincidence with the main detector. Section 2.3 is based on the Paper II describing installation of a muon veto on BEGe detector in the Radioecology Section. Background component resulting from the cosmogenic activation of the detector and shielding material cannot be effectively removed except by placing an overburden above the laboratory. At zero overburden 92% of neutrons are produced by protons and 8% by muons (Theodórsson, 1996). Proton flux attenuation
by overburden thickness m, in meters of water equivalent (mwe), is proportional to ~ 𝑒𝑒−𝑚𝑚
1.6 mwe
(Theodórsson, 1996), while for the secondary neutrons it is ~ 𝑒𝑒−𝑚𝑚
2 mwe (Gastrich et al., 2016). Consequently, already a shallow-depth of 15 meters of water equivalent (mwe) overburden almost completely reduces nucleonic component of cosmic radiation; muon flux is reduced by a factor 2-3 (Heusser, 1986). The only way to reach ultra-low backgrounds is by placing the detector in an underground laboratory (Hult, 2007).
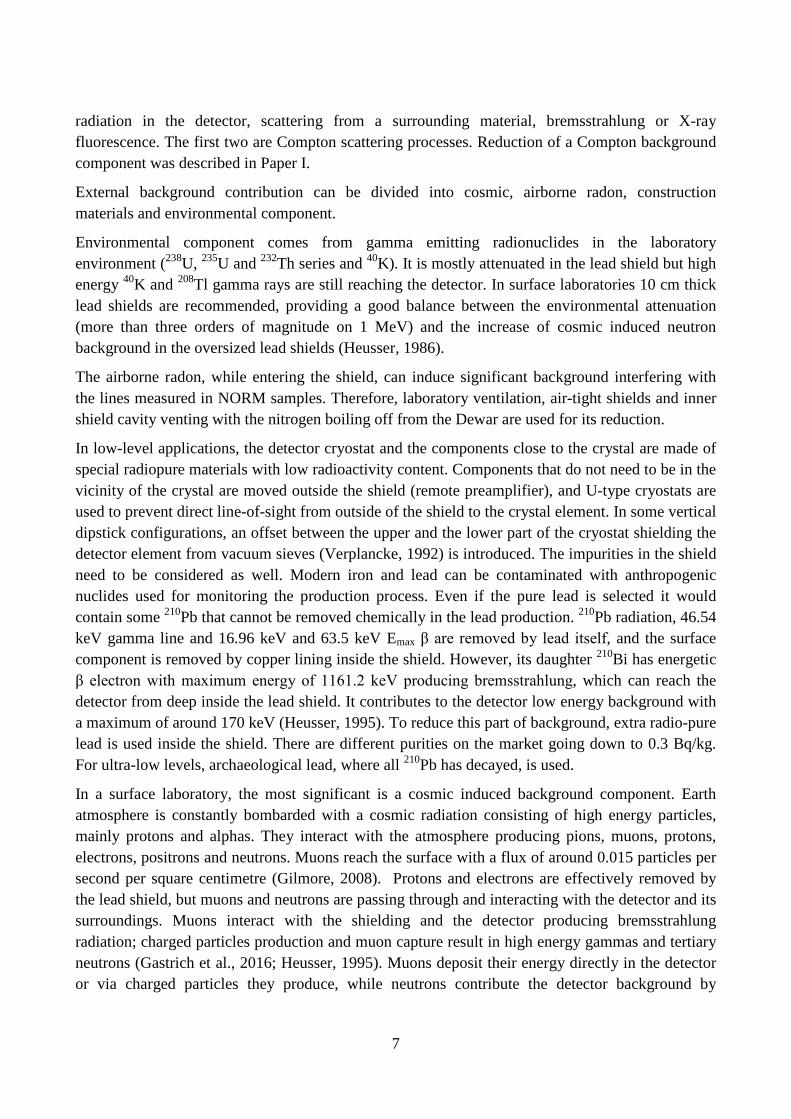
2.2 Compton veto (Paper I) Compton veto system consists of the NaI(Tl) annulus around the HPGe well detector, more details are in Paper I. The system was used with analogue coincidence electronics. The NaI(Tl) crystals are coupled to seven photomultiplier tubes (PMT), and their signals are combined in one preamplifier (PA) and sent to a Canberra 2025 amplifier. In Fig. 2.1 a schematic diagram of the system is shown, explaining how the units are connected.
Fig.2.1 Schematic drawing of the Well Ge-NaI(Tl) anticoincidence system setup.
The 2025 amplifier provides a fast amplifier output pulse, Incoming Count Rate (ICR) output, which is sent to a Canberra 2040 coincidence unit. If coincidence between the fast amplifier pulse of the NaI(Tl) and the HPGe is detected within a selected time window, the signal is delayed in a Canberra 2055 Signal shaper and delay unit (SSDU) to match the timing of the unipolar output from the Well-Ge amplifier. It is thereafter sent to the analogue-to-digital converter (ADC), where
9
the anticoincidence option is selected. The system is adjusted using an oscilloscope, so that the delayed signal from the 2055 SSDU covers the duration of the unipolar output signal from the HPGe well. Further adjustments were made by observing the HPGe well coincidence spectrum, especially its low energy part, where we are interested in the background reduction. It is necessary to carefully adjust these parameters, as selecting too long anticoincidence pulse width unnecessarily increases the dead time, while too short does not cover all detected Compton events as there is a time-walk effect (R Britton et al., 2015; Leo, 1994) related to the ICR output pulse generation in both amplifiers. The delay is a consequence of the faster pulse formation in the scintillation detector. At the end, the coincidence resolving time was set to 0.6 µs, the signal was delayed for 6.5 µs, and the minimum width for anticoincidence gate signal of 0.5 µs was chosen. Because of low efficiency of the HPGe well detector on high photon energies, the system is intended for the measurements of low-energy gamma emitters. Small well volume makes it suitable for high resolution depth profiling in 210Pb analysis of sediments. Compton suppression factor of 1.8 in 210Pb ROI was obtained, corresponding to literature values of ~2 (Murray and Aitken, 1988; Savva et al., 2014). Due to limited sample volume (1.7 cm3) that can fit in the well and poor energy resolution, when compared to modern BEGe 5030 type detector, HPGe well system showed benefits only for the samples where only a small sample quantity is available. For the samples where more of 4 g of sample material is available, BEGe detector outperforms the HPGe well system. A well detector, with energy resolution comparable to that of Broad Energy Germanium (BE) type detectors, would significantly outperform any planar detector in the analysis of low-energy gamma emitters when equipped with a Compton suppression system. Canberra has recently introduced a new detector called SAGe-well detector (Small Anode Germanium), which combines the features of the BEGe-detector and traditional well-detector, resulting in a resolution similar to the one for a BEGe-detector along with a high efficiency of well-detector. Bigger crystals are available that allow larger well sizes, and thus enable lower detections limits in much broader range of applications (Britton and Davies, 2015; Canberra, 2016; Hult et al., 2017).
Compton veto reduces FEP efficiencies for cascade emitters (as there is a probability that one photon will interact with the veto). The analogue set-up described here has a drawback that additional measurement needs to be done, without the anticoincidence, to determine the multi-photon emitters. Otherwise two ADCs could be used (one with anticoincidence and the other without) or complicated calibrations with FEP efficiency reduction can be performed (for each nuclide separately). With digital list-mode systems, only one measurement provides both normal and anticoincidence spectra.
2.3 Cosmic veto (Paper II) Active cosmic shield, or muon veto, is a special detector providing anticoincidence signal for the main HPGe detector. This way, events originating from muons depositing energy in both detectors are not counted by the main detector. Various types of detectors can be used as veto, e.g. (Agostini et al., 2015; Heusser, 1991; Rios et al., 2011), but plastic scintillators are prevailing in gamma spectrometry applications (Burnett and Davies, 2014; Mrđa et al., 2007). Usually, veto is placed outside the lead shield, covering the shield from all sides (or top surface, if only one plate is available). In some special configurations, an in-shield veto can be added to enhance the muon

10
shielding by detecting the muons that did not interact with the main shield (Heusser et al., 2015). Environmental gamma background is also detected by the muon veto, so the proper energy threshold should be selected to discriminate environmental and muon component in order to prevent unnecessary dead-time introduction or suboptimal efficiency of the veto system. Veto detectors are usually designed so the environmental and muon component peaks are far apart, enabling setting-up proper low-level discriminator (LLD) to filter the environmental gamma events. An additional lead shield around the veto can be used to shield against the environmental γ radiation (Gilmore, 2008; Heusser, 1995). Use of two veto plates operated in coincidence (Wieslander et al., 2009) is also possible. That way, long energy tailing of environmental gamma (from coincidence summing) is rejected reducing the dead time. However, the coincidence criteria also reduces the efficiency for muon detection counting only those events interacting with both plates (the reduction is not significant as reported by (Gastrich et al., 2016)).
Paper II describes the plastic scintillator veto (Scionix, 50×40×5 cm, polyvinyltoulene) installation over a BEGe detector in a routine gamma laboratory of the Radioecology Section. A CAEN DT5781P digital multichannel analyser was used for list-mode acquisition, enabling time-stamped data collection with 10 ns time resolution and 15 bit ADC resolution. Genie 2000 spectra were generated using MATLAB based coincidence analysis software described in Chapter 1. For the background peaks location and area calculation, Canberra Genie 2000 software (Canberra, 2013) was used via the interactive peak fit package (Canberra, 2009b). Spectra from both detectors were saved in a list-mode with a time stamp for each detected event.
Fig. 2.2 Time distribution (spectrum) of differences in signal generation between the coincident events in the HPGe and the veto detector (the time an event is registered in HPGe minus the time stamp of the closest veto event). If environmental background counts are not discriminated in veto detector random coincidence continuum is high (black curve). By setting the low-level discriminator around 5 MeV on veto detector, random coincidence count rate is reduced and timing properties become clearer.
11
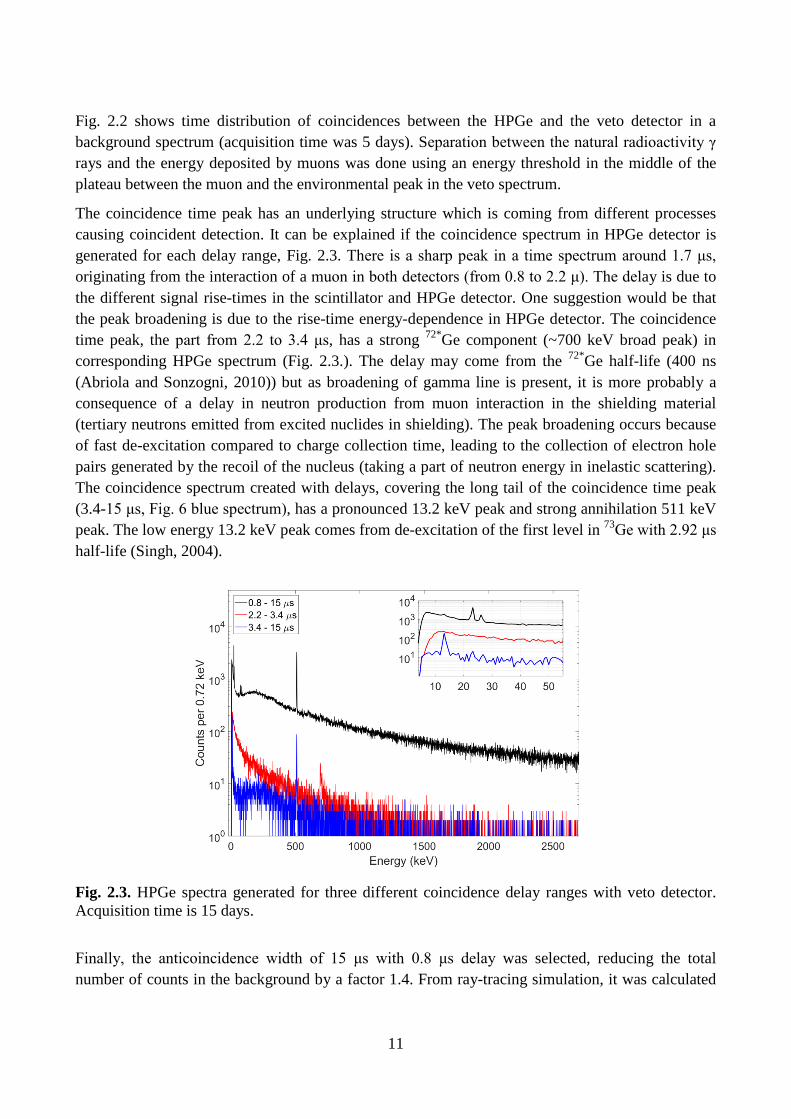
Fig. 2.2 shows time distribution of coincidences between the HPGe and the veto detector in a background spectrum (acquisition time was 5 days). Separation between the natural radioactivity γ rays and the energy deposited by muons was done using an energy threshold in the middle of the plateau between the muon and the environmental peak in the veto spectrum.
The coincidence time peak has an underlying structure which is coming from different processes causing coincident detection. It can be explained if the coincidence spectrum in HPGe detector is generated for each delay range, Fig. 2.3. There is a sharp peak in a time spectrum around 1.7 μs, originating from the interaction of a muon in both detectors (from 0.8 to 2.2 μ). The delay is due to the different signal rise-times in the scintillator and HPGe detector. One suggestion would be that the peak broadening is due to the rise-time energy-dependence in HPGe detector. The coincidence time peak, the part from 2.2 to 3.4 μs, has a strong 72*Ge component (~700 keV broad peak) in corresponding HPGe spectrum (Fig. 2.3.). The delay may come from the 72*Ge half-life (400 ns (Abriola and Sonzogni, 2010)) but as broadening of gamma line is present, it is more probably a consequence of a delay in neutron production from muon interaction in the shielding material (tertiary neutrons emitted from excited nuclides in shielding). The peak broadening occurs because of fast de-excitation compared to charge collection time, leading to the collection of electron hole pairs generated by the recoil of the nucleus (taking a part of neutron energy in inelastic scattering). The coincidence spectrum created with delays, covering the long tail of the coincidence time peak (3.4-15 μs, Fig. 6 blue spectrum), has a pronounced 13.2 keV peak and strong annihilation 511 keV peak. The low energy 13.2 keV peak comes from de-excitation of the first level in 73Ge with 2.92 μs half-life (Singh, 2004).
Fig. 2.3. HPGe spectra generated for three different coincidence delay ranges with veto detector. Acquisition time is 15 days.
Finally, the anticoincidence width of 15 μs with 0.8 μs delay was selected, reducing the total number of counts in the background by a factor 1.4. From ray-tracing simulation, it was calculated

12
that the effect of additional 4 plates surrounding the sides of the shield would yield the total reduction for factor 2.4. The effect of the cosmic ray background reduction on detection limits in our case was not significant (lowering by a factor of √1.4~1.2). More important was that by reducing general background continuum, counting the statistics in environmental background peaks (e.g. radon progeny), was enhanced, enabling easier monitoring of background variability (Hult et al., 2012).
2.4 Sandwich system (Paper III) In coincidence detection systems, background is reduced by coincident detection of radiation from a single decay in multiple detectors. Coincidence systems comprise alpha-gamma (Breitenecker et al., 2009; Peräjärvi et al., 2011), beta-gamma (Cagniant et al., 2014; Ringbom et al., 2003), UV-gamma (Ihantola et al., 2013, 2012), alpha-conversion electron (Dion et al., 2016) and gamma-gamma coincidences. Probably all the other possible combinations are also possible, but the trend is to use coincidence gating with gamma spectrometry, as it generally has the highest background, or with scintillation gamma detectors to compensate for the low energy resolution (Roedel, 1968). In this way, the background is significantly reduced, but at the cost of efficiency reduction. Therefore, the coincidence techniques are often employed in high activity measurements, such as neutron activation analysis (NAA) (Horne and Landsberger, 2012; Tomlin et al., 2008; Yoho and Landsberger, 2016), or for uranium isotopes and nuclear fuel characterization (Drescher, 2017; Horne et al., 2014; Zhang et al., 2011). Another hot area for coincidence gamma-gamma spectrometry applications is within the Comprehensive-Nuclear-Test Ban Treaty (CTBTO) programme, where in fast determination of air-filters samples contain elevated activity levels. If there is no time to wait for the filters to cool down (mainly radon and thoron contribution), or to apply radiochemical methods, and to send the samples to an underground laboratory, classic low background spectrometric approach does not work and coincidence gamma spectrometry is an obvious choice (R. Britton et al., 2015; Cagniant et al., 2017).
In this section, HPGe-HPGe coincidence system, installed at the Radioecology Section, will be described. Beside well known coincidence mode, the spectrometer has been tested in two additional modes, anticoincidence and sum-coincidence. Anticoincidence mode operates in a way similar to Compton veto, reducing the background and increasing the sensitivity for single gamma emitters. Sum-coincidence mode is a novel operation mode, where the coincident signal is used to reconstruct the full energy of the photon Compton scattered between the two detectors, thus increasing FEP efficiency. The last two modes do not reduce the efficiency of the system, and therefore can be used even in ultra low-level systems, where the background is not a problem and the use of coincidence gamma spectrometry is generally not justified (Lutter et al., 2013; Paradis et al., 2017; Quintana et al., 2017; Wieslander et al., 2009).
Nutech Coincidence Low Energy Germanium Sandwich Spectrometer (NUCLeGeS) consists of two Canberra LEGe detectors in a sandwich configuration. Detectors are suited for low energy measurements because of their low thicknesses (25 mm) and thin carbon (0.5mm) entrance windows. Detectors are placed in a 20 cm thick lead shield, which inner cavity is lined with 5 mm Sn and 3 mm Cu to absorb scattered radiation and lead X-rays. The upper detector is movable; the

13
distance between the detectors can be varied from 0 to 6 cm, Fig. 2.4. After the preamplifiers (Canberra 2002CP), signals from the detectors are passed to separate channels on a CAEN N6781A digital multichannel analyser. Measurements are saved in a list-mode with 10 ns time-stamp resolution.
Fig. 2.4 Picture showing inside of the NUCLeGeS spectrometer lead cave. Left (a) and right (b) side show two different distances between the HPGe detectors. Bottom detector is fixed, while the upper one has a vertical cryostat enabling the movement in a vertical direction.
List of background gamma-ray peaks for total spectrum from both germanium detectors (summed) is given in Table 1. The spectrometer normalized background count rate in the 30-1900 keV energy range is 1.1 cps/kgGe.

14
Table 2.1 List of background peaks and corresponding count rates for the NUCLeGeS spectrometer. Count rate uncertainties are given in brackets.
Energy (keV) Origin Count rate (counts/day)
23.4 71mGe 35 (13)
53.2 – 53.4 214Pb 73mGe 64 (10)
66.7 73mGe 112 (10)
68.2 – 81.3 73*Ge PbKα 500 (13)
109.2 235U, 19F 20 (13)
139.7 75mGe 112 (13)
159.7 77mGe 77 (13.7)
185.7 235U 21 (10)
198.4 71mGe 12 (13)
241.9 214Pb 10 (7)
278.3 64*Cu 35 (9)
295.2 214Pb 25.75 (9)
351.9 214Pb 33 (8)
511.0 annihilation 1060 (23)
569.7 207mPb 11 (5)
593.9 – 612.9 74*Ge 214Bi 364 (33)
669.7 63*Cu 58 (8)
689.6 72*Ge 297 (34)
768.4 214Bi 15 (5)
803.1 206*Pb 25 (6)
962.1 63*Cu 63 (7)
1115.6 65*Cu 21 (5)
1173.2 60Co 12 (4)
1332.5 60Co 3 (3)
1460.8 40K 8 (3)
1764.5 214Bi 3 (2)
15
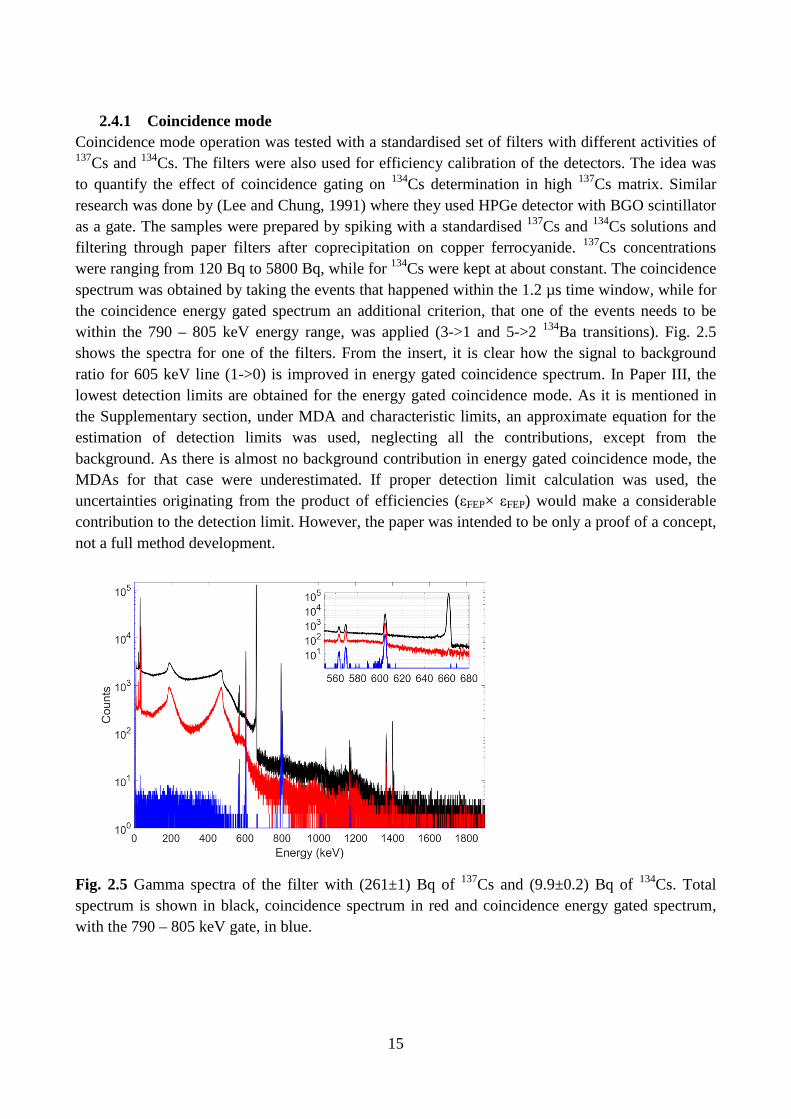
2.4.1 Coincidence mode Coincidence mode operation was tested with a standardised set of filters with different activities of 137Cs and 134Cs. The filters were also used for efficiency calibration of the detectors. The idea was to quantify the effect of coincidence gating on 134Cs determination in high 137Cs matrix. Similar research was done by (Lee and Chung, 1991) where they used HPGe detector with BGO scintillator as a gate. The samples were prepared by spiking with a standardised 137Cs and 134Cs solutions and filtering through paper filters after coprecipitation on copper ferrocyanide. 137Cs concentrations were ranging from 120 Bq to 5800 Bq, while for 134Cs were kept at about constant. The coincidence spectrum was obtained by taking the events that happened within the 1.2 µs time window, while for the coincidence energy gated spectrum an additional criterion, that one of the events needs to be within the 790 – 805 keV energy range, was applied (3->1 and 5->2 134Ba transitions). Fig. 2.5 shows the spectra for one of the filters. From the insert, it is clear how the signal to background ratio for 605 keV line (1->0) is improved in energy gated coincidence spectrum. In Paper III, the lowest detection limits are obtained for the energy gated coincidence mode. As it is mentioned in the Supplementary section, under MDA and characteristic limits, an approximate equation for the estimation of detection limits was used, neglecting all the contributions, except from the background. As there is almost no background contribution in energy gated coincidence mode, the MDAs for that case were underestimated. If proper detection limit calculation was used, the uncertainties originating from the product of efficiencies (εFEP× εFEP) would make a considerable contribution to the detection limit. However, the paper was intended to be only a proof of a concept, not a full method development.
Fig. 2.5 Gamma spectra of the filter with (261±1) Bq of 137Cs and (9.9±0.2) Bq of 134Cs. Total spectrum is shown in black, coincidence spectrum in red and coincidence energy gated spectrum, with the 790 – 805 keV gate, in blue.

16
It was observed that for filters with higher 134Cs activities, calculated detection limits are rising rapidly. That is because the continuum background in energy gated coincidence mode is originating primarily from incomplete absorptions of photons from 134Ba de-excitations.
2.4.2 Anticoincidence mode Anticoincidence mode is used to reduce the background continuum around single gamma emitters on low energies. By applying anticoincidence criterion, the count rate from the cascade emitters (e.g. 214Bi and 214Pb) will be significantly reduced, also the events where one photon deposited a part of its energy in each detector will not be counted. A set of measurements with certified uranium reference material (NBL 103) was preformed to calibrate the detectors for 210Pb. Anticoincidence yielded 15% background decrease around the 210Pb peak, Fig. 2.6. It is not a significant reduction, but when combined with high efficiency of the dual system, it enables reaching lower detection limits than on BEGe 5030 detectors. Additional reconfiguration of the acquisition system settings done for 125I measurements provided even better energy resolution on low energies. FWHM on 210Pb was reduced from 0.83 keV, as reported in the Paper III, to 0.68 keV, reducing the MDAs for additional 10%.
Fig. 2.6 NBL103 uranium certified reference material NUCLeGeS spectrum from both detectors (black), coincidence counts from both detectors (red) and total anticoincidence (blue).
2.4.3 Sum-coincidence mode (Papers IV and V) Sum-coincidence mode is used for increasing the efficiency of the coincidence system by summing the coincident signals to reconstruct the full energy of a photon that is Compton scattered between the two detectors. Spectrum obtained that way is added to the normal spectrum. If single gamma emitters are measured coincidence spectrum can be subtracted (anticoincidence mode). This is to our knowledge the first use of the method in above described way. There is a special section in Knoll (Knoll, 2010) describing the same procedure that was used in the 1960s with small Ge(Li) crystals, but there only sum-coincidence spectrum is considered (for Compton reduction) without adding it to normal spectrum, resulting in significant FEP loss. Those systems were based on gain matching from the two detectors and coincident signal addition in the separate MCA. With list-

17
mode data acquisition such problems are non-existent as all sum-coincidences, anti-coincidences or coincidences are applied in post-processing in a way to enhance the signal from the nuclide of interest. From a single measurement, multiple spectra can be calculated, each for a selected type of radionuclides (single gamma emitters, cascade emitters …). Paper IV is a proof-of-concept for sum-coincidence mode, showing 10% increase in efficiency for 137Cs line when the sum-coincidence spectrum is generated. Paper V applies sum-coincidence method for standard baker geometries used with NUCLeGeS system. For detector-detector distance of 9.5 mm and with a Petri baker (cylindrical d=50 mm) filled to 3 mm height, efficiency enhancement of ~17% is obtained for 661.6 keV line of 137Cs and 834.8 keV line of 54Mn (Fig. 2.7., Table 2.2). For grey-yellow baker geometry (cylindrical d=70mm, filling height 14mm) and 39 mm detector-detector distance efficiency enhancement is around 8%.
Fig. 2.7 Spectrum created by summation of singles spectra from both detectors (black) and sum-coincidence spectrum (red) of the calibration source measurement in Petri geometry.
Table 2.2. Measured FEP efficiency increase by sum-coincidence method for Petri geometry.
Energy LEGE2 LEGE3 Compton coincidence FEP
increase (%) Counts
FWHM (keV) Counts
FWHM (keV) Counts FWHM (keV)
661.6keV 5290 1.32 4710 1.23 1700 1.53 17 834keV 2090 1.42 2010 1.44 719 1.52 17.5 1115keV 1680 1.76 1540 1.61 537 1.68 16.7 1173KeV 3740 1.84 3390 1.63 1090 1.79 15.3 1332keV 3170 2 3060 1.82 981 1.86 15.7

18
3. Activity standardization
When samples are being measured on our gamma detectors, the result, activity of a nuclide of interest, is stated in units of becquerel (Bq). It is obtained with reference to a calibration source that was measured as a part of detector calibration process. Calibration sources contain one or multiple radionuclides of known activities. Activity values of a calibration sources are known very precisely (usually with the relative uncertainty of ~3% on k=2). But how is the activity of a calibration source determined? Described in this chapter are the methodologies for standardization of activity. Introduction presents an overview of the primary standardization methods, while the rest of the chapter is focused on photon-photon coincidence methods. Standardization methods based on digital coincidence spectrometry are presented for several radionuclides. Standardization method for 125I based on X-ray-gamma coincidence using two HPGe detectors was published in Nuclear Instruments and Methods in Physics Research Section A (Paper VI).
3.1 Introduction “The activity, A, of an amount of a radionuclide in a particular energy state at a given time is the quotient of -dN by dt, where dN is the mean change in the number of nuclei in that energy state due to spontaneous nuclear transformations in the time interval dt, thus A = -dN/dt. Unit: s-1. The special name for the unit of activity is becquerel (Bq).” (ICRU, 2011)
The definition of activity is rather simple, but its realization is quite challenging, covering various aspects from a source preparation (Sibbens and Altzitzoglou, 2007) to different measurement techniques and devices (Pommé, 2007). Becquerel is a SI derived unit (s-1), where the crucial quantity is (dimensionless) number of transitions in an amount of substance of a radionuclide (Debertin, 1996). Measurements of time and mass/volume are straight-forward, but determining the number of transitions poses a real problem, causing a great diversification in activity standardization methods. There are several types of processes in the de-excitation of radionuclides, i.e. α decay, β decay, electron capture, internal conversion, γ-ray emission, and spontaneous fission, and each process is characterised by the release of energy in a form of nuclear particles (α, β or β+) and/or photons (Hou and Roos, 2008). The appropriate measurement method and device have to be used, based on a decay scheme of the considered radionuclide and physical detection principle for the emitted radiation. As all of the standardisation techniques rely on knowledge of the half-life and decay scheme (at least to certain extent) of the radionuclide, good quality of such data is essential. Decay data (such as radionuclide half-lives, particle emission probabilities and energies) are available from different databases, of which the one provided by the Decay Data Evaluation Project (CEA/LNHB, 2017) is considered to be the most accurate.
It is a task of radionuclide metrology to ensure international equivalence and consistency of a becquerel unit; meaning a becquerel of 60Co in Denmark and France are the same. That is carried out through frequent international comparisons under the guidance of BPIM. The other task is ensuring equivalence between different radionuclides; meaning one becquerel of 60Co has the same number of disintegrations per unit time as one becquerel of 90Sr. National radiation metrology institutes, independent of industry and governments, contribute to reliable measurements in the areas of environmental protection (e.g. nuclear industry related discharges) and safety of the

19
workforce (e.g. calibration of radiation protection instruments). The most important impact is related to medical applications, where the proper quantity and quality of radiopharmaceuticals has to be administered, ensuring not only patients’ safety but also a consistent footing for international clinical trials (Judge et al., 2014).
There are various reviews covering activity standardisation methods in great detail, e.g. (IAEA, 1967; ICRU, 1994). Here, a short overview of the methods, following the approach used in (Pommé, 2007), will be presented. Methods for activity standardization can be roughly divided into high-geometry methods, counting at defined solid angle (DSA) and coincidence counting methods.
The high-geometry (4π) systems cover the full solid angle, aiming at the detection of all decays in the source. Critical aspect is the reduction (and estimation) of non-efficiency, which comes due to self-absorption in the sample, absorption in non-active detector material, or radiation escape from the detector. Typical devices are 4π (pressurized) proportional counters, liquid scintillation counters, internal gas counters, well-detectors and sandwich configurations of (windowless) detectors.
Defined solid angle counting is mostly used for the standardization of alpha-emitters. It relies on excellent control over geometrical conditions (solid angle covered by the detector), knowledge of detector efficiency (usually intrinsic FEP efficiency is ~100% for alpha particles) and source preparation.
Coincidence counting methods rely on a simultaneous detection of coincidentally emitted radiations. As the ratio of single to coincidence count rate is used for the activity determination, coincidence counting methods do not depend so heavily on well-defined counting geometry (and efficiency). Coincident and single detection efficiencies are strongly correlated quantities, so relative uncertainties of their ratios are much lower than the relative uncertainties assigned to each of the quantities. When two different types of radiation are detected, 4πβ-γ coincidence counting is used. It is generally applied on the radionuclides decaying by β-decay followed by γ-emission, but it is also applicable to α-decay or electron capture radionuclides. Coincidence counting methods detecting two photons emitted in coincidence are the sum-peak method and photon-photon coincidence method. For certain radionuclides, the activity can be obtained as a combination of a single and coincidence count rates in a way that detection efficiencies cancel out. The sum-peak method utilizes a single detector, discriminating between the single photon event and the true-coincidence summing events higher in the energy spectrum. Photon-photon coincidence counting is based on the same principle, except the two (or multiple) detectors are used for coincidence identification.
Activity standardization techniques require high accuracy and precision. Uncertainty propagation rules should be used as defined in GUM (Joint Committee For Guides In Metrology, 2008)., with all ‘known’ and ‘unknown’ sources of uncertainty covered (Karam et al., 2015; Pommé, 2016).
3.2 Absolute 60Co standardization This section describes photon-photon coincidence method on 60Co example. It is based on absolute 60Co measurement presented in the paper by Volkovitsky and Naudus (Volkovitsky and Naudus,

20
2009). The focus is on spectrometric coincidence methods (not counting), where the total count rate is not used for the measurement, enabling characterization of mixed sources. Digital list-mode acquisition enables accumulation of all the necessary data in a single measurement. Single and coincidence count rates for each detector can be obtained in post-processing analysis of the time stamped list-mode file. 60Co decays by β- decay to an excited state of 60Ni which is de—excited through a two-step process (Fig. 3.1). Two gamma photons are emitted simultaneously.
Fig. 3.1 Decay scheme of 60Co (from (CEA/LNHB, 2017)). The 3->1 and 1->0 transitions result in 1173.2 keV and 1332.5 keV gamma emissions.
The methodology is developed for two NaI(Tl) detectors, but the same equations hold for a HPGe system. The equations are not strictly following (Volkovitsky and Naudus, 2009), but the final results agree. X1 and X2 are emission probabilities for 1173.2 keV and 1332.5 keV photons; εj𝑖𝑖,𝑝𝑝stands for the full-peak efficiency on detector j for photon i; εj
𝑖𝑖,totdesignates total efficiency. Single count rates in photopeak i (i=1, 2) on detector 1 are:
𝑁𝑁1 = 𝑁𝑁0 ∗ 𝑋𝑋1ε11,𝑝𝑝�1 − 𝑋𝑋2𝜀𝜀1
2,𝑡𝑡𝑡𝑡𝑡𝑡� (3.1a)
𝑁𝑁2 = 𝑁𝑁0 ∗ 𝑋𝑋2ε12,𝑝𝑝�1− 𝑋𝑋1𝜀𝜀1
1,𝑡𝑡𝑡𝑡𝑡𝑡� (3.1b)
On detector 2:
𝑁𝑁3 = 𝑁𝑁0 ∗ 𝑋𝑋1ε21,𝑝𝑝�1 − 𝑋𝑋2𝜀𝜀2
2,𝑡𝑡𝑡𝑡𝑡𝑡� (3.2a)
𝑁𝑁4 = 𝑁𝑁0 ∗ 𝑋𝑋2ε22,𝑝𝑝�1− 𝑋𝑋1𝜀𝜀2
1,𝑡𝑡𝑡𝑡𝑡𝑡� (3.2b)
Coincidence peak (i=1, 2) count rates in the first detector are:
𝑁𝑁5 = 𝑁𝑁0 ∗ 𝑋𝑋1ε11,𝑝𝑝𝑋𝑋2𝜀𝜀2
2,𝑡𝑡𝑡𝑡𝑡𝑡 (3.3a)
𝑁𝑁6 = 𝑁𝑁0 ∗ 𝑋𝑋2ε12,𝑝𝑝𝑋𝑋1𝜀𝜀2
1,𝑡𝑡𝑡𝑡𝑡𝑡 (3.3b)

21
And for second detector:
𝑁𝑁7 = 𝑁𝑁0 ∗ 𝑋𝑋1ε21,𝑝𝑝𝑋𝑋2𝜀𝜀1
2,𝑡𝑡𝑡𝑡𝑡𝑡 (3.4a)
𝑁𝑁8 = 𝑁𝑁0 ∗ 𝑋𝑋2ε22,𝑝𝑝𝑋𝑋1𝜀𝜀1
1,𝑡𝑡𝑡𝑡𝑡𝑡 (3.4b)
Sum peak count rates on detectors one (N9) and two (N10) are:
𝑁𝑁9 = 𝑁𝑁0 ∗ 𝑋𝑋1ε11,𝑝𝑝𝑋𝑋2𝜀𝜀1
2,p (3.5a)
𝑁𝑁10 = 𝑁𝑁0 ∗ 𝑋𝑋2ε21,𝑝𝑝𝑋𝑋1𝜀𝜀2
2,p (3.5b)
The above system of equations (3.1-3.4 plus one of the equations 3.5a or 3.5b) has analytical solution independent of detection efficiencies and emission probabilities. If the Eq. (3.5a) is used, it gives the solution:
𝑁𝑁01 = (𝑁𝑁1𝑁𝑁3−𝑁𝑁5𝑁𝑁7)(𝑁𝑁2𝑁𝑁4−𝑁𝑁6𝑁𝑁8)𝑁𝑁9(𝑁𝑁3−𝑁𝑁7)(𝑁𝑁4−𝑁𝑁8)
(3.6a)
While (5b) gives:
𝑁𝑁02 = (𝑁𝑁1𝑁𝑁3−𝑁𝑁5𝑁𝑁7)(𝑁𝑁2𝑁𝑁4−𝑁𝑁6𝑁𝑁8)𝑁𝑁10(𝑁𝑁1−𝑁𝑁5)(𝑁𝑁2−𝑁𝑁6)
(3.6b)
The final solution for the source activity is a combination of N01 and N02:
𝑁𝑁0 = �𝑁𝑁01𝑁𝑁02 (3.7)
The method is valid only for point-sources (Oderkerk and Brinkman, 1990). If the integration over the source volume is carried on any of the equations (3.1a-3.5b), assuming that the efficiencies are position dependant (𝜀𝜀 = 𝜀𝜀(𝑉𝑉� )), convoluted quantities that cannot be replaced with simple averages over the source volume:
𝜀𝜀1� 𝜀𝜀2� ≠ �𝜀𝜀1(��𝑥)𝜀𝜀2(��𝑥)𝑉𝑉
𝑑𝑑𝑉𝑉
Where the efficiency averaged over the source volume is defined as:
𝜀𝜀𝚤𝚤� = �𝜀𝜀𝑖𝑖(��𝑥)𝑉𝑉
𝑑𝑑𝑉𝑉
Corrections for a volume source geometry should be possible in a similar way as for the sum-peak method (Vidmar et al., 2009). Angular correlations have been neglected in the derivation of Eq. 3.7. (Volkovitsky and Naudus, 2009) show that for 60Co, if the source is located in the centre between the two identical detectors, the probabilities for emission of the second gamma ray in the same and opposite direction are equal, so the equations are valid. If detectors are further apart and in asymmetric configuration, angular correlations need to be taken into account. In all the above equations, the second (coincident) gamma ray comes with the factor 𝑊𝑊𝑡𝑡,𝑝𝑝������ (t for total and p for full peak), called the effective angular correlation (Kim et al., 2003, 2002). For short source to detector distances (up to 5 cm) and large geometrical coverage factors angular correlations can be neglected (Hult et al., 2014; Warren et al., 2006).

22
The main advantage of the method presented here over a sum-peak method is that no total count rate is used, enabling standardization in the presence of impurities or even standardization of mixed nuclide sources. The method is also less dependent on external background. Use of the method with HPGe detector systems, due to their superior energy resolution, is even more promising than with NaI(Tl). The method has not received significant attention, although it is bearing a potential of paving a new way in photon-photon coincidence measurements. The method can be used on any dual-emitter isotope, e.g. 46Sc, 94Nb, 75Se (Erikson et al., 2013) or 44Ti. Recently it has been tested and applied by (Collins, 2016; Collins et al., 2017) at newly commissioned National Nuclear Array (NANA). NANA is showing a great potential as a gamma array used for nuclear structure experiments (similar to ones mentioned in Chapter 1), where absolute activity measurement methods could be exploited in research of complicated short-lived radionuclides.
Fig. 3.2 134Cs decay scheme (CEA/LNHB, 2017).
3.3 Extension to 134Cs In the following section a proposal for equivalent to 60Co standardization method, applied for standardisation of 134Cs will be presented. 134Cs decay scheme is more complicated (Fig. 3.2), and at first glance, the equations used for 60Co cannot be applied in this case. But if the decay is divided into 5-> … ->1 and 1->0 transitions, the two state equations can be applied. Only in this case transition 1 will stand for all the transitions starting at level 5 and ending at level 1. εj
1,𝑝𝑝 stands for the full peak efficiency of detecting 5->1 equivalent (direct 5->1 or segmented 5->4*4->1, 5->3*3->1, 5->2*2->1 and higher order transitions) with the associated emission probability X1. Along with εj
1,𝑡𝑡𝑡𝑡𝑡𝑡, new emission probability coefficient X3 is introduced, and those two quantities describe the probability for detection and emission of any photon coincident with 1->0 604.7 keV photon. When the photopeak count rate of the 604.7 keV line (1->0) is measured the emission probability is different (X4 is the emission probability for 604.7 keV gamma) than for the events that remove

23
1365.2 keV peak (5->1 and TCS) when it comes with different probability X2 (conditional probability).
Single photopeak count rates on detector 1 are:
𝑁𝑁1 = 𝑁𝑁0 ∗ 𝑋𝑋1ε11,𝑝𝑝�1 − 𝑋𝑋2𝜀𝜀1
2,𝑡𝑡𝑡𝑡𝑡𝑡� (3.8a)
𝑁𝑁2 = 𝑁𝑁0 ∗ 𝑋𝑋4ε12,𝑝𝑝�1− 𝑋𝑋3𝜀𝜀1
1,𝑡𝑡𝑡𝑡𝑡𝑡� (3.8b)
Where X4 is the total probability for 0.6 MeV emission and 𝑋𝑋3𝜀𝜀11,𝑡𝑡𝑡𝑡𝑡𝑡 represents all that may sum-in.
For single photopeak count rates on detector 2 we have:
𝑁𝑁3 = 𝑁𝑁0 ∗ 𝑋𝑋1ε21,𝑝𝑝�1 − 𝑋𝑋2𝜀𝜀2
2,𝑡𝑡𝑡𝑡𝑡𝑡� (3.9a)
𝑁𝑁4 = 𝑁𝑁0 ∗ 𝑋𝑋4ε22,𝑝𝑝�1− 𝑋𝑋3𝜀𝜀2
1,𝑡𝑡𝑡𝑡𝑡𝑡� (3.9b)
Coincidence peak count rates on detector 1 are:
𝑁𝑁5 = 𝑁𝑁0 ∗ 𝑋𝑋1ε11,𝑝𝑝𝑋𝑋2𝜀𝜀2
2,𝑡𝑡𝑡𝑡𝑡𝑡 (3.10a)
𝑁𝑁6 = 𝑁𝑁0 ∗ 𝑋𝑋4ε12,𝑝𝑝𝑋𝑋3𝜀𝜀2
1,𝑡𝑡𝑡𝑡𝑡𝑡 (3.10b)
And on detector 2:
𝑁𝑁7 = 𝑁𝑁0 ∗ 𝑋𝑋1ε21,𝑝𝑝𝑋𝑋2𝜀𝜀1
2,𝑡𝑡𝑡𝑡𝑡𝑡 (3.11a)
𝑁𝑁8 = 𝑁𝑁0 ∗ 𝑋𝑋4ε22,𝑝𝑝𝑋𝑋3𝜀𝜀1
1,𝑡𝑡𝑡𝑡𝑡𝑡 (3.11b)
Sum peak count rates cannot be used because processes like 5->4 + 4->0 or 5->3 + 3->0 may lead to the same full peak. Instead of a count rate in the sum peak, energy gated coincidence count rate is used with the gate on 1365.2 keV (transitions equivalent to 5->1):
𝑁𝑁9 = 𝑁𝑁0 ∗ 𝑋𝑋1ε11,𝑝𝑝𝑋𝑋2𝜀𝜀2
2,p (3.12a)
𝑁𝑁10 = 𝑁𝑁0 ∗ 𝑋𝑋1ε21,𝑝𝑝𝑋𝑋2𝜀𝜀1
2,p (3.12b)
If the Eq. (3.12a) is used (with Eqs. 3.8-3.11) it gives the solution:
𝑁𝑁01 = (𝑁𝑁1𝑁𝑁3−𝑁𝑁5𝑁𝑁7)(𝑁𝑁2𝑁𝑁4−𝑁𝑁6𝑁𝑁8)𝑋𝑋2𝑁𝑁9(𝑁𝑁2−𝑁𝑁6)(𝑁𝑁3−𝑁𝑁7)𝑋𝑋4
(3.13a)
While (3.12b) yields:
𝑁𝑁02 = (𝑁𝑁1𝑁𝑁3−𝑁𝑁5𝑁𝑁7)(𝑁𝑁2𝑁𝑁4−𝑁𝑁6𝑁𝑁8)𝑋𝑋2𝑁𝑁10(𝑁𝑁1−𝑁𝑁5)(𝑁𝑁4−𝑁𝑁8)𝑋𝑋4
(3.13b)
The final solution is a combination of N01 and N02:
𝑁𝑁0 = �𝑁𝑁01𝑁𝑁02 (3.14)
To summarize, in Eqs (3.8a), (3.10a) and (3.12a) we are not interested in the value of 𝑋𝑋1ε11,𝑝𝑝, it is
only important that the same process is described by all three equations (transitions leading to 1365.2 keV equivalent absorption in single detector). The same is valid for detector 2 (𝑋𝑋1ε2
1,𝑝𝑝). 𝑋𝑋3𝜀𝜀1
1,𝑡𝑡𝑡𝑡𝑡𝑡 in Eqs (3.8b) and (3.11b) (with 𝑋𝑋3𝜀𝜀21,𝑡𝑡𝑡𝑡𝑡𝑡 equivalent on detector 2) describe different

24
process, total efficiency for all the transitions ending in level 1 (including for example only 3->1 that is highly probable or X-rays).
It is important to note that in the case of 60Co the final solution does not depend on decay constants, so we do have a true absolute activity measurement method, while for 134Cs we need to know the total emission probability for 604.7 keV gamma X4 = 0.9763 (0.0008) and conditional emission probability for the photon to be emitted after the 5->1 transition and emission of 1365.2 keV photon, X2 = 0.99407 (0.00009) (that is 1 – conversion electron emission probability for 1->0 transition).
The sample can be encapsulated in epoxy disc (standard closed point source), that is an advantage when compared to commonly used β-γ coincidence method. The method does not work for NaI(Tl) detectors because of poor energy resolution (no discrimination between 569 and 604 keV lines for example).
A MC simulation was performed to confirm the derived formulae. EGSnrc package (Kawrakow et al., 2017) with additional decay generator (Lutter et al., 2017) reproducing decays from ENSDF data was used for MC simulations. A high-efficiency dual HPGe system was used with r=0.1 mm and h=2.5 µm point source.
Table 3.1 EGSnrc simulation results for a dual HPGe system and a point source on.
EGSnrc simulation
DET1 FEP events DET2 FEP events
Total Energy (keV)
1365.2 604.7 1365.2 604.7
Single n1
697342
n2
25061201
n3
382177
n4
13430733
6.0*108
Coincidence n5
103349
n6
4325719
n7
81792
n8
3205502
6.0*108
Energy gated coincidence
n9
23555
n10
23227
6.0*108
Inserting the values from Table 3.1 into equations (3.13a) and (3.13b) yields:
N01 = 5.86e+07
N02 = 5.92+07
With a combined value of N0 = (5.90±0.06)*108. Uncertainty of number of counts is calculated as √𝑛𝑛, while decay parameters X2 and X4 are taken with the uncertainties from (CEA/LNHB, 2017). The differences of N01 and N02 from the final result N0 are added as squared (independent) quantities to the total uncertainty. Relative error less than 2% looks promising and demands for further, more detailed, investigation. For low energy detectors there might be a problem with X-ray bremsstrahlung from 𝛽𝛽0,5
− electron (Emax=89 keV, Eavg=23 keV) summing in with 1.3 MeV photon. All the other electrons (with higher average energies) emitted in transitions to lower states summing in with 0.6 MeV photon are not a problem as they are included in the (unknown) factors 𝑋𝑋3𝜀𝜀𝑖𝑖
1,𝑡𝑡𝑡𝑡𝑡𝑡.

25
Another problem with the method is measurement time needed to reach the desired precision. 5->1 and 1->0 coincident full peak detection in two detectors (referred to as energy gated coincidence), is a very inefficient process both from the detector efficiency point and emission point (only 3% probability for 1.3 MeV gamma emission). For our NUCLeGeS system measurement time, it would be unreasonably high (the detectors are only 25 mm thick), but on higher efficiency system (~100% relative efficiency) it can be done faster. Based on EGSnrc simulation expected measurement time to reach 1.5% uncertainty (k=1) with 1 kBq point source would be less than a day.
3.4 125I standardization 125I has a simple decay scheme, being suitable for standardization using different methods; (Pommé et al., 2005) uses seven techniques for radioactivity measurement in 125I standardization. It is its medical applications (radiolabelling compound, radiopharmaceutical, brachytherapy source …) that make this radionuclide interesting. In our case it was a European Spallation Source related project (involving the estimate of iodine release from the target) that motivated the introduction of 125I standardization method. Energy calibrations on our detectors did not cover such a low energy range, TCS correction for X-ray-γ summing had to be checked, and certified 125I source delivery was delayed. After introducing the well-known X-ray-gamma coincidence method with two NaI detectors, the next inevitable step was its extension to the HPGe coincidence system.
This section is based on the results presented in Paper VI. X-ray-gamma coincidence with two NaI detectors has not been explained in detail in the publication, so the experimental system description and the theoretical basis are given here. X-ray-gamma coincidence with two HPGe detectors is explained in detail in the publication, therefore only the critical points are raised in the following section.
Fig. 3.3 125I decay scheme (CEA/LNHB, 2017). 125I decays by electron capture (EC) to the 35.5 keV excited state of 125Te which de-excites (half-life 1.48 ns) by either gamma emission (6.63%) to the ground state or by conversion electrons followed by X-ray emission (Fig. 3.3). The decay thus results in coincident emission of characteristic X-rays from the EC process with the 35.5 keV gamma line as well as with

26
characteristic X-rays originating from the internal conversion process. With X-ray emissions there are angular correlations.
3.4.1 X-ray-gamma coincidence with two NaI detectors Standard equations used in photon – photon coincidence counting with two NaI(Tl) detectors (for example from (Pommé et al., 2005)) for singles count rate in each detector and coincidence count rate are:
𝑁𝑁1 = 𝑁𝑁0(𝑋𝑋1 + 𝑋𝑋2 − 𝑋𝑋1𝑋𝑋2𝜀𝜀1)𝜀𝜀1 (3.15a)
𝑁𝑁2 = 𝑁𝑁0(𝑋𝑋1 + 𝑋𝑋2 − 𝑋𝑋1𝑋𝑋2𝜀𝜀2)𝜀𝜀2 (3.15b)
𝑁𝑁𝑐𝑐 = 𝑁𝑁0(2𝑋𝑋1𝑋𝑋2) 𝜀𝜀1𝜀𝜀2 (3.15c)
Where following symbols are used:
X1=PKωK=0.7010 KX-ray emission probability in the electron capture (EC) branch
X2= 𝛼𝛼𝐾𝐾𝜔𝜔𝐾𝐾+11+𝛼𝛼
=0.75 KX-ray or γ-ray emission probability in the isomeric transition (IT)
N1, N2 total count rates on detectors 1 and 2 (including the sum peak)
Nc coincidence count rate
ε1 and ε2 efficiencies for photon detection on detectors 1 and 2.
Equations above assume identical efficiencies on X-ray and γ energies (Schrader and Walz, 1987). The final solution for the disintegration rate N0 is:
𝑁𝑁0 = 𝑋𝑋1𝑋𝑋2(𝑋𝑋1+𝑋𝑋2)2
(𝑁𝑁𝑐𝑐2−4𝑁𝑁1𝑁𝑁2)2
2𝑁𝑁𝑐𝑐(2𝑁𝑁1−𝑁𝑁𝑐𝑐)(2𝑁𝑁2−𝑁𝑁𝑐𝑐) (3.16)
However, it can be shown that it is a pure coincidence that this coincidence method works. The condition of equivalence for the efficiencies on different energies is not satisfied. MC model of a standard 3’ NaI(Tl) detector was developed (Fig. 3.4) using EGSnrc package (Kawrakow et al., 2017). Efficiencies for different photon energies were simulated and efficiency energy dependence calculated (Fig. 3.5). From Fig. 3.5 it can be seen that the differences between the efficiencies on Kα energy and γ energy are ~20%, while the differences in efficiencies for Kα and Kβ photons are even bigger, reaching 30%. This is due to iodine K-edge effect on 33.2 keV, making possible X-ray escapes from the detector volume. Similar effects of iodine K-edge can be seen on peak-to-total (PT) calculations from (Saint-Gobain, 2016). It is a wonderful property of the 125I decay and NaI(Tl) detector that these differences cancel out in a way that the solution made under the equivalence assumption is valid.

27
In Supplementary information section derivation of the three group equation, with separate efficiencies for γ-ray, Kα and Kβ X-rays is presented with the final solution:
𝑁𝑁0 = (𝑋𝑋1𝛼𝛼∗𝑧𝑧1+𝑋𝑋1𝛽𝛽∗𝑧𝑧2)(𝑋𝑋2𝛾𝛾+𝑋𝑋2𝛼𝛼∗𝑧𝑧1+𝑋𝑋2𝛽𝛽∗𝑧𝑧2)(𝑋𝑋1𝛼𝛼∗𝑧𝑧1+𝑋𝑋1𝛽𝛽∗𝑧𝑧2+𝑋𝑋2𝛾𝛾+𝑋𝑋2𝛼𝛼∗𝑧𝑧1+𝑋𝑋2𝛽𝛽∗𝑧𝑧2)2
(𝑁𝑁𝑐𝑐2−4𝑁𝑁1𝑁𝑁2)2
2𝑁𝑁𝑐𝑐(2𝑁𝑁1−𝑁𝑁𝑐𝑐)(2𝑁𝑁2−𝑁𝑁𝑐𝑐) (3.17)
Where z1 and z2 are defined as the ratios of efficiencies on X-ray energies and γ ray energy:
ε1Xα=z1*ε1γ
ε2Xα= z1*ε2γ
ε1Xβ= z2*ε1γ
ε2Xβ= z2*ε2γ
If the coefficients z are calculated from the MC simulation the difference between the Eqs. 3.16 and 3.17 of only 0.04% is obtained:
(𝑋𝑋1𝛼𝛼 ∗ 𝑧𝑧1 + 𝑋𝑋1𝛽𝛽 ∗ 𝑧𝑧2)(𝑋𝑋2𝛾𝛾 + 𝑋𝑋2𝛼𝛼 ∗ 𝑧𝑧1 + 𝑋𝑋2𝛽𝛽 ∗ 𝑧𝑧2)(𝑋𝑋1𝛼𝛼 ∗ 𝑧𝑧1 + 𝑋𝑋1𝛽𝛽 ∗ 𝑧𝑧2+𝑋𝑋2𝛾𝛾 + 𝑋𝑋2𝛼𝛼 ∗ 𝑧𝑧1 + 𝑋𝑋2𝛽𝛽 ∗ 𝑧𝑧2)2
= 0.24966 ± 0.00019
𝑋𝑋1𝑋𝑋2(𝑋𝑋1 + 𝑋𝑋2)2
= 0.24977 ± 0.00013
Therefore, the error introduced by the efficiency equivalence assumption is negligible, although the efficiencies themselves differ significantly.
Fig. 3.4 3’’ NaI(Tl) scintillation detector used in EGSnrc Monte Carlo simulation (standard detector from the Scionix).

28
Fig. 3.5 NaI(Tl) detector efficiency for photon energies of interest.
Experimental set-up for photon-photon coincidence using NaI detectors was installed in the late 2016. A NaI(Tl) detector system, consisting of two Bicron 3’ NaI(Tl) detectors, placed in a long lead shield of 10 cm thickness, enabling detectors to be positioned from 0 cm to 15 cm window-to-window distance is shown in Fig. 3.6. A CAEN DT5780A digital multichannel analyser was used for the acquisition. It is a standalone desktop unit providing also high voltage for the photomultiplier tubes. All measurements were saved in list-mode and analysis performed in post-processing, using the software described in Chapter 1. Separate Matlab code was developed enabling fast calculation of the activity using Eq. 3.16 with implemented correction to reference date and correction for decay during the measurement time. Uncertainty budget was calculated using combined standard uncertainties as defined in the GUM (Joint Committee For Guides In Metrology, 2008).
The method works only for point source geometries. Detectors do not need to be the same and absorbers between the source and the detectors do not affect the result (except through lowering of the count rates introducing higher counting uncertainties). It was the last property that motivated the work resulting with Eq. 3.17. It is clear that photons of different energies are attenuated by different factors in additional absorbers (also in Al detector endcap) violating the efficiency equivalence assumption.
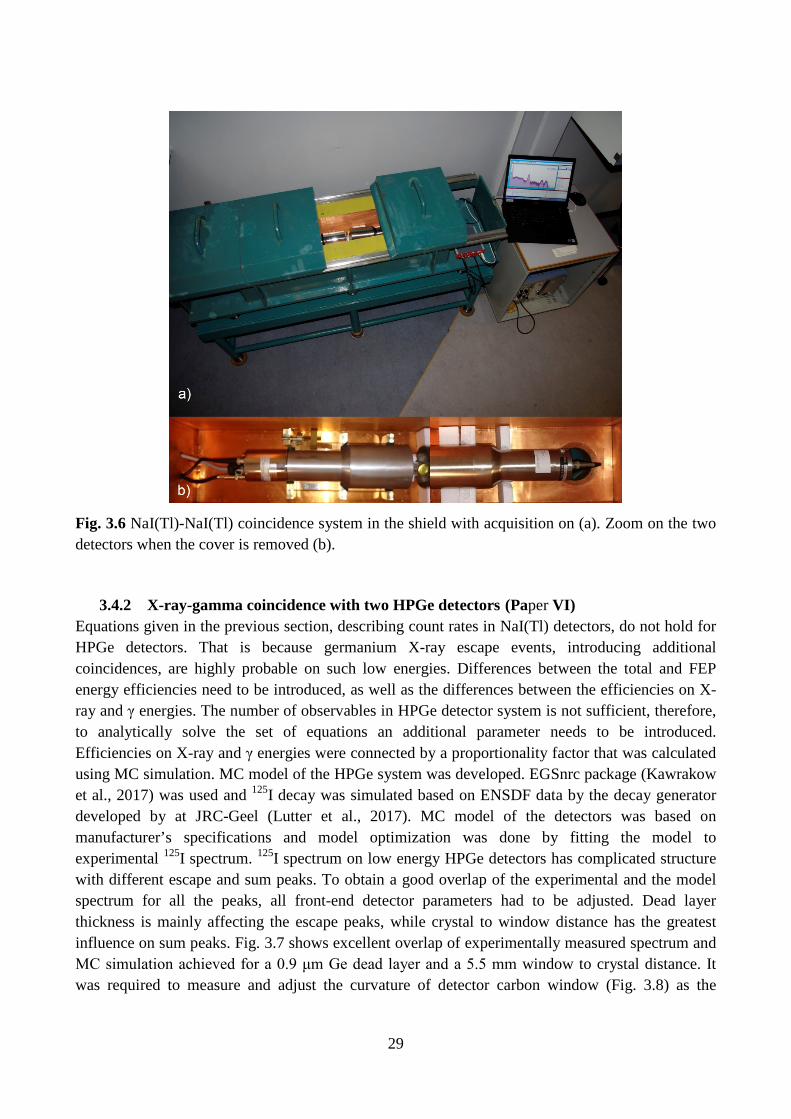
29
Fig. 3.6 NaI(Tl)-NaI(Tl) coincidence system in the shield with acquisition on (a). Zoom on the two detectors when the cover is removed (b).
3.4.2 X-ray-gamma coincidence with two HPGe detectors (Paper VI) Equations given in the previous section, describing count rates in NaI(Tl) detectors, do not hold for HPGe detectors. That is because germanium X-ray escape events, introducing additional coincidences, are highly probable on such low energies. Differences between the total and FEP energy efficiencies need to be introduced, as well as the differences between the efficiencies on X-ray and γ energies. The number of observables in HPGe detector system is not sufficient, therefore, to analytically solve the set of equations an additional parameter needs to be introduced. Efficiencies on X-ray and γ energies were connected by a proportionality factor that was calculated using MC simulation. MC model of the HPGe system was developed. EGSnrc package (Kawrakow et al., 2017) was used and 125I decay was simulated based on ENSDF data by the decay generator developed by at JRC-Geel (Lutter et al., 2017). MC model of the detectors was based on manufacturer’s specifications and model optimization was done by fitting the model to experimental 125I spectrum. 125I spectrum on low energy HPGe detectors has complicated structure with different escape and sum peaks. To obtain a good overlap of the experimental and the model spectrum for all the peaks, all front-end detector parameters had to be adjusted. Dead layer thickness is mainly affecting the escape peaks, while crystal to window distance has the greatest influence on sum peaks. Fig. 3.7 shows excellent overlap of experimentally measured spectrum and MC simulation achieved for a 0.9 μm Ge dead layer and a 5.5 mm window to crystal distance. It was required to measure and adjust the curvature of detector carbon window (Fig. 3.8) as the

30
attenuation of low-energy photons in air is higher than the attenuation in vacuum. The lowest point of the carbon window is 4 mm below the endcap zero plane.
Fig. 3.7 MC spectrum (black) added on exponential background over experimentally measured spectrum (red). 𝛾𝛾 peak area of simulated spectrum is normalised to the experimental one (15*106 decays simulated). Two small peaks above 70 keV are Pb X-rays.
Fig. 3.8 Schematic representation of EGSnrc model for LEGe 2 detector. When compared to photon–photon coincidence counting measurements using two NaI(Tl) detectors, the new method gives much higher uncertainties (Table 3.2). The main uncertainty contribution is from the uncertainties in nuclear data and it is higher than with NaI method (because more parameters are used). The other downside is due to the fact that in the spectra obtained using
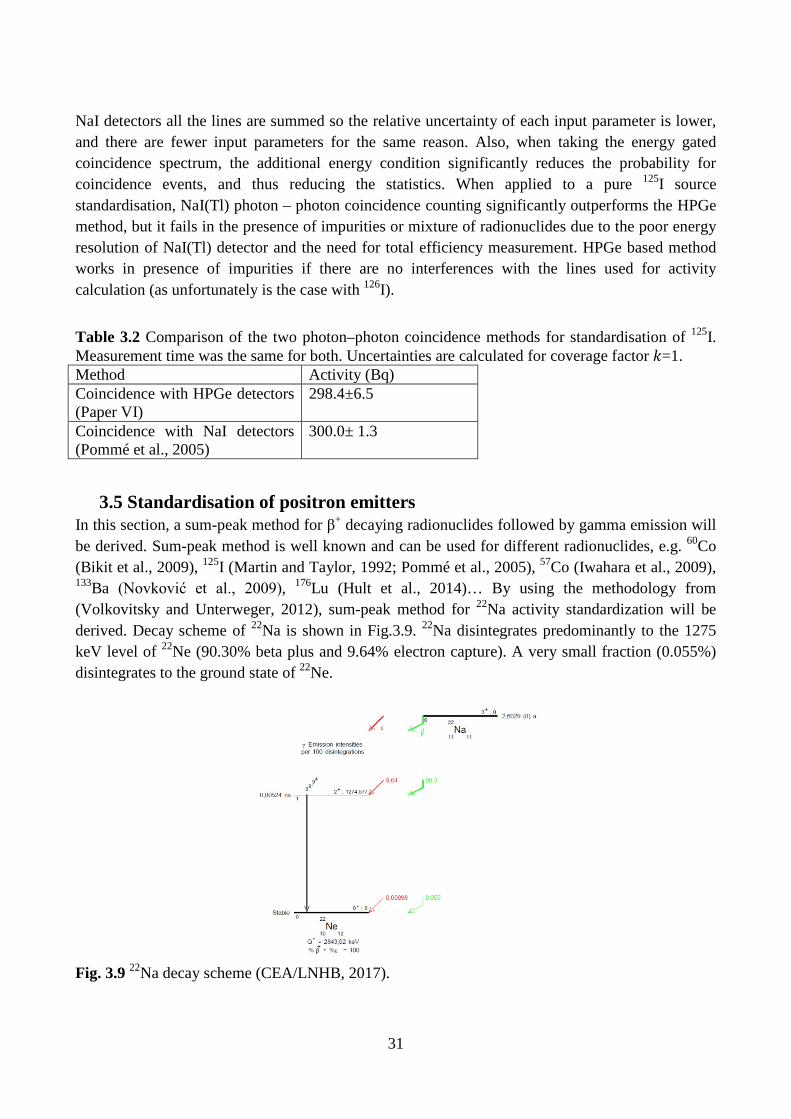
31
NaI detectors all the lines are summed so the relative uncertainty of each input parameter is lower, and there are fewer input parameters for the same reason. Also, when taking the energy gated coincidence spectrum, the additional energy condition significantly reduces the probability for coincidence events, and thus reducing the statistics. When applied to a pure 125I source standardisation, NaI(Tl) photon – photon coincidence counting significantly outperforms the HPGe method, but it fails in the presence of impurities or mixture of radionuclides due to the poor energy resolution of NaI(Tl) detector and the need for total efficiency measurement. HPGe based method works in presence of impurities if there are no interferences with the lines used for activity calculation (as unfortunately is the case with 126I).
Table 3.2 Comparison of the two photon–photon coincidence methods for standardisation of 125I. Measurement time was the same for both. Uncertainties are calculated for coverage factor 𝑘𝑘=1. Method Activity (Bq) Coincidence with HPGe detectors (Paper VI)
298.4±6.5
Coincidence with NaI detectors (Pommé et al., 2005)
300.0± 1.3
3.5 Standardisation of positron emitters In this section, a sum-peak method for β+ decaying radionuclides followed by gamma emission will be derived. Sum-peak method is well known and can be used for different radionuclides, e.g. 60Co (Bikit et al., 2009), 125I (Martin and Taylor, 1992; Pommé et al., 2005), 57Co (Iwahara et al., 2009), 133Ba (Novković et al., 2009), 176Lu (Hult et al., 2014)… By using the methodology from (Volkovitsky and Unterweger, 2012), sum-peak method for 22Na activity standardization will be derived. Decay scheme of 22Na is shown in Fig.3.9. 22Na disintegrates predominantly to the 1275 keV level of 22Ne (90.30% beta plus and 9.64% electron capture). A very small fraction (0.055%) disintegrates to the ground state of 22Ne.
Fig. 3.9 22Na decay scheme (CEA/LNHB, 2017).

32
Positron emitting decays result in a two strongly correlated 511 keV photons (emitted in the opposite directions). For an exact description of that kind of decay, angular correlations need to be taken into account. The system consists of only four equations for count rates in a single detector.
Count rate in 511 keV peak:
𝑁𝑁1 = 𝑁𝑁0𝑃𝑃𝛽𝛽(𝑤𝑤𝑝𝑝𝑝𝑝 + 𝑤𝑤𝑝𝑝𝑐𝑐 + 𝑤𝑤𝑝𝑝0)(1− 𝜀𝜀1𝑡𝑡) (3.19)
Count rate in 1274 keV peak:
𝑁𝑁2 = 𝑁𝑁0𝜀𝜀1𝑝𝑝(𝑃𝑃𝐸𝐸 + 𝑃𝑃𝛽𝛽(𝑤𝑤0𝑐𝑐 + 𝑤𝑤0𝑝𝑝 + 𝑤𝑤00)) (3.20)
Sum-peak count rate (1786 keV peak):
𝑁𝑁3 = 𝑁𝑁0𝜀𝜀1𝑝𝑝𝑃𝑃𝛽𝛽(𝑤𝑤𝑝𝑝𝑝𝑝 + 𝑤𝑤𝑝𝑝𝑐𝑐 + 𝑤𝑤𝑝𝑝0) (3.21)
And total count rate:
𝑁𝑁4 = 𝑁𝑁0𝜀𝜀1𝑡𝑡(𝑃𝑃𝐸𝐸 + 𝑃𝑃𝛽𝛽) + 𝑁𝑁0𝑃𝑃𝛽𝛽(1 − 𝑤𝑤0𝑐𝑐 − 𝑤𝑤0𝑝𝑝 − 𝑤𝑤00) − 𝑁𝑁0𝜀𝜀1𝑡𝑡𝑃𝑃𝛽𝛽(1 − 𝑤𝑤0𝑐𝑐 − 𝑤𝑤0𝑝𝑝 − 𝑤𝑤00) (3.22)
PE stands for EC probability while Pβ denotes beta decay probability. For 511 keV photons there are 3×3 correlated detection probabilities: wpp, the probability that both photons are simultaneously detected in both detectors in photopeaks; wpc and wcp, probabilities that one photon is detected in the photopeak at first detector and another photon detected in the Compton continuum (not fully absorbed in active detector volume) by the second detector; wp0 and w0p, probabilities that one photon is detected in photopeak by one detector and the other photon is not detected; wc0 and w0c, probabilities that one photon is not fully absorbed and another is not detected; wcc, probability that both photons are detected but not in the full peak; w00, probability that both photons escaped detection. The sum of all probabilities equals unity: ∑ 𝑤𝑤𝑖𝑖𝑖𝑖𝑖𝑖,𝑖𝑖 = 1 = 𝑤𝑤𝑝𝑝𝑝𝑝 + 𝑤𝑤𝑝𝑝𝑐𝑐 + 𝑤𝑤𝑐𝑐𝑝𝑝 + 𝑤𝑤𝑝𝑝0 + 𝑤𝑤0𝑝𝑝 + 𝑤𝑤𝑐𝑐0 + 𝑤𝑤0𝑐𝑐 + 𝑤𝑤𝑐𝑐𝑐𝑐 + 𝑤𝑤00 (3.23)
Eqs (3.19-3.23) yield the solution:
𝑁𝑁0 = 𝑁𝑁1𝑁𝑁2+𝑁𝑁3𝑁𝑁4𝑁𝑁3(𝑃𝑃𝐹𝐹+𝑃𝑃𝛽𝛽)
(3.24)
As only a small fraction (0.056%) disintegrates to the ground state of 22Ne, 𝑃𝑃𝐸𝐸 + 𝑃𝑃𝛽𝛽 can be set to 1:
𝑁𝑁0 = 𝑁𝑁4 + 𝑁𝑁1𝑁𝑁2𝑁𝑁3
(3.25)
That is a variant of a sum-peak method, already used for 22Na standardization with a HPGe detector (De Oliveira et al., 2012).
Similar approach can be used for 18F nuclide, emitting only two annihilation photons (X-rays originating from electron capture branch are of very low energies and emission probabilities, thus can be neglected). The method is applicable for a coincidence gamma system equipped with digital acquisition (it does not matter if it is NaI(Tl), HPGe or other).
Let us consider count rates detected by such a system. Let N1 be the total count rate on detector 1, N2 total anti-coincidence count rate on detector 2 (all counts on detector 2 when there is no event on detector 1) and N3 energy gated coincidence peak area (meaning that we put energy gate around 511

33
on one of the detectors and measure 511 keV coincidence peak area on the other). If N0 is activity (times the probability for positron emission):
Total spectrum on detector 1:
𝑁𝑁1 = 𝑁𝑁0(𝑤𝑤𝑝𝑝𝑝𝑝 + 𝑤𝑤𝑝𝑝𝑐𝑐 + 𝑤𝑤𝑝𝑝0 + 𝑤𝑤𝑐𝑐𝑝𝑝 + 𝑤𝑤𝑐𝑐𝑐𝑐 + 𝑤𝑤𝑐𝑐0) (3.26)
Anti-coincidence total on detector 2:
𝑁𝑁2 = 𝑁𝑁0(𝑤𝑤0𝑝𝑝 + 𝑤𝑤0𝑐𝑐) (3.27)
Energy-gated coinc spectrum:
𝑁𝑁3 = 𝑁𝑁0(𝑤𝑤𝑝𝑝𝑝𝑝) (3.28)
For 511 keV photons there are 3×3 correlated detection probabilities: wpp, the probability that both photons are simultaneously detected in both detectors in photopeaks; wpc and wcp, probabilities that one photon is detected in the photopeak at first detector and another photon detected in the Compton continuum (not fully absorbed in active detector volume) by the second detector; wp0 and w0p, probabilities that one photon is detected in photopeak by one detector and the other photon is not detected; wc0 and w0c, probabilities that one photon is not fully absorbed and another is not detected; wcc, probability that both photons are detected but not in the full peak; w00, probability that both photons escaped detection. The sum of all probabilities equals unity:
∑ 𝑤𝑤𝑖𝑖𝑖𝑖𝑖𝑖,𝑖𝑖 = 1 = 𝑤𝑤𝑝𝑝𝑝𝑝 + 𝑤𝑤𝑝𝑝𝑐𝑐 + 𝑤𝑤𝑐𝑐𝑝𝑝 + 𝑤𝑤𝑝𝑝0 + 𝑤𝑤0𝑝𝑝 + 𝑤𝑤𝑐𝑐0 + 𝑤𝑤0𝑐𝑐 + 𝑤𝑤𝑐𝑐𝑐𝑐 + 𝑤𝑤00 (3.29)
All the factors from Eq. (3.29) can be determined (measured) except w00; w00 is not connected to N0 in any of the equations (1-3). It can be either determined from experimental measurements of another positron emitter (e.g. 22Na), well detector can be used (NaI(Tl)) so that in 4π geometry w00->0, or by Monte Carlo (MC) calculations.
If W00 is determined relative to other probabilities by MC calculations (here w00/wpp ratio is used but other combinations are possible:
𝑤𝑤00 = 𝑧𝑧 × 𝑤𝑤𝑝𝑝𝑝𝑝 (3.30)
The final solution is very simple:
𝑁𝑁0 = 𝑁𝑁1 + 𝑁𝑁2 + 𝑁𝑁3 × 𝑧𝑧 (3.31)
Here count rate N3 is the lowest number so the relative contribution from the uncertainty of z to the total uncertainty should be low. This holds especially for close geometries. If the detectors are further apart then the contribution from z becomes more significant (because w00 becomes bigger). Relative uncertainty of the output quantity originating from the uncertainty in z is:
𝑢𝑢𝑖𝑖 = 𝑁𝑁3 ∗ 𝑢𝑢𝑧𝑧/𝑁𝑁0 (3.32)
We can reasonably assume to be able calculating z with 10% relative uncertainty. Z contributes with relative sensitivity factor N3/ (N1+N2+z*N3); so if N3/ (N1+N2+z*N3) < 1/10 we can expect our result to be within 1% relative combined uncertainty

34
4. Conclusion and perspectives
The work presented in this thesis was conducted using the experimental set-up that did not exist prior to the beginning of the project (or was deposited in warehouse). Reinforcing the laboratory floor, building up the lead shields and adjusting the detectors is an integral part of this thesis.
The studies presented in this thesis show some promising aspects of list-mode acquisition implementation in an environmental radioactivity gamma laboratory. Two different approaches have been used; active shields for background reduction and multiple detectors for efficiency enhancement in low-level measurements; on the other side, rather high activity levels in standardization measurements and coincidence background reduction for isolation of weak signals in high activity matrices.
For low-level measurements list-mode data acquisition with dual HPGe system enables lowering the limits by background reduction, using anticoincidence mode for single gamma emitters or by increasing the efficiency by the use of sum-coincidence method. Setting-up and the use of veto detectors is much simpler with the list-mode data acquisition.
Post-processing program for coincidence evaluation developed in this work is rather simple and probably not fully optimized. It provided satisfactory performance for the analysis of low count rate experiments. If the methods are going to be used with higher-count rates, multiple energy gates and/or on mobile units, where fast calculation will be needed (e.g. with air-filter or for safeguards), memory mapping and parallel computing capabilities will need to be introduced. Development of the IEC standard for list-mode (Paepen et al., 2015) will probably solve that problem, by making possible the use of state-of-the-art software, e.g. (Shetty and Şahin, 2016), on all commercial systems.
Digital acquisition systems have found its application in activity standardization mainly in Triple to Double Coincidence Ratio method based on liquid scintillation (TDCR) and 4πβ-μ coincidence counting (Bobin et al., 2017; Keightley et al., 2013), but in authors opinion the full capability on HPGe-HPGe systems is still to be discovered (Collins, 2016). Extending photon-photon coincidence methods to volume sources, following the work by Vidmar et al. (Vidmar et al., 2009), should make them competitive with TDCR and CIEMAT standardization methods, that owe its success to simpler sample preparation as easier-to-weigh samples are used.
Angular correlations (e.g. 60Co, 134Cs …) should be treated properly in coincidence measurements for activity determination and standardization. Some MC simulation programs embed the angular correlations in its photon generation from decay data, but EGSnrc (Kawrakow et al., 2017) based decay generator (Lutter et al., 2017) used through this thesis still need that implementation if going to be used in high precision coincidence measurements.
Full uncertainty budget and detection limits calculation according to the ISO 11929 standard (ISO, 2010) still need to be applied for the experiments described in the thesis.

35
Whole area of application of digital acquisition systems for pulse shape analysis (PSA) in gamma spectrometry has been fully omitted here (see e.g. (González De Orduña et al., 2010; Mi et al., 2017; Wagner, 2017)). It, especially if combined with some of the methods presented here, opens the capabilities of really superior performance of digital multi-detector systems compared to standard gamma spectrometric approach.
36
References
Abriola, D., Sonzogni, A.A., 2010. Nuclear Data Sheets for A = 72*. Nucl. Data Sheets 111, 1–140.
Agostini, M., Allardt, M., Andreotti, E., Bakalyarov, A.M., Balata, M., Barabanov, I., Barnabe, M., Barros, N., Baudis, L., Bauer, C., Bellotti, E., Belogurov, S., Belyaev, S.T., Caldwell, A., Benato, G., Bettini, A., Bezrukov, L., Bode, T., Brudanin, V., Brugnera, R., Budja, D., Cattadori, C., Chernogorov, A., Cossavella, F., Demidova, E. V, Domula, A., Egorov, V., Falkenstein, R., Ferella, A., Freund, K., Frodyma, N., Gangapshev, A., Garfagnini, A., Gotti, C., Grabmayr, P., Gurentsov, V., Gusev, K., Guthikonda, K.K., Hampel, W., Hegai, A., Heisel, M., Hemmer, S., Jochum, J., Heusser, G., Hofmann, W., Hult, M., Inzhechik, L. V, Ioannucci, L., Janicsko, J., Kochetov, O., Junker, M., Kihm, T., Kirpichnikov, I. V, Kirsch, A., Klimenko, A., Kno, K.T., Kornoukhov, V.N., Kuzminov, V. V, Laubenstein, M., Lazzaro, A., Lebedev, V.I., Lehnert, B., Liao, H.Y., Lindner, M., Lippi, I., Liu, X., Lubashevskiy, A., Lubsandorzhiev, B., Lutter, G., Macolino, C., Machado, A.A., Majorovits, B., Maneschg, W., Misiaszek, M., Nemchenok, I., Nisi, S., Pandola, L., Pelczar, K., Pessina, G., Pullia, A., Riboldi, S., Rumyantseva, N., Sada, C., Salathe, M., Schmitt, C., Shevchik, E., Shirchenko, M., Simgen, H., Schreiner, J., Schulz, O., Schwingenheuer, B., Scho, S., Smolnikov, A., Stanco, L., Strecker, H., Tarka, M., Ur, C.A., Vasenko, A.A., Volynets, O., Wagner, V., Walter, M., Wegmann, A., Wester, T., Wojcik, M., Yanovich, E., Zavarise, P., Zhitnikov, I., Zhukov, S. V, Zinatulina, D., Zuber, K., Zuzel, G., 2013. Results on Neutrinoless Double-β Decay of 76Ge from Phase I of the GERDA Experiment. Phys. Rev. Lett. 111, 1–6.
Agostini, M., Barnabé-Heider, M., Budjáš, D., Cattadori, C., Gangapshev, A., Gusev, K., Heisel, M., 2015. LArGe: active background suppression using argon scintillation for the Gerda 0νββ-experiment. Eur. Phys. J. C 75.
Beck, F.A., 1992. EUROBALL: Large gamma ray spectrometers through european collaborations. Prog. Part. Nucl. Phys. 28, 443–461.
Bikit, I., Nemes, T., Mrda, D., 2009. Simple method for absolute activity measurement of 60Co source. Nucl. Instruments Methods Phys. Res. Sect. A Accel. Spectrometers, Detect. Assoc. Equip. 603, 333–336.
Bobin, C., Bouchard, J., Pierre, S., Thiam, C., 2017. Overview of a FPGA-based nuclear instrumentation dedicated to primary activity measurements. Appl. Radiat. Isot. 70, 2012–2017. doi:10.1016/j.apradiso.2012.02.068
Breitenecker, K., Donohue, D., Eisenwagner, H., Maddison, A.P., Siegmund, H., 2009. Configuration of an alpha – gamma coincidence spectrometer for utilization of safeguards measurements. Appl. Radiat. Isot. 67, 2088–2091.
Britton, R., Burnett, J.L., Davies, A. V, Regan, P.H., 2015. Coincidence corrections for a multi-detector gamma spectrometer. Nucl. Inst. Methods Phys. Res. A 769, 20–25.
Britton, R., Davies, A.V., Burnett, J.L., Jackson, M.J., 2015. A high-efficiency HPGe coincidence system for environmental analysis. J. Environ. Radioact. 146, 1–5.
37
Britton, R., Davies, A. V, 2015. Characterisation of a SAGe well detector using GEANT4 and LabSOCS. Nucl. Inst. Methods Phys. Res. A 786, 12–16.
Burnett, J.L., Davies, A. V, 2014. Cosmic veto gamma-spectrometry for Comprehensive Nuclear-Test-Ban Treaty samples. Nucl. Inst. Methods Phys. Res. A 747, 37–40.
CAEN Electronic Instrumentation, 2017. MC2Analyzer User Manual Software for digital Multi Channel Analyzer, User Manual UM3182.
CAEN Electronic Instrumentation, 2015a. DT5780 Dual Digital MCA, User Manual UM2606.
CAEN Electronic Instrumentation, 2015b. N6781 Dual/Quad Digital MCA. User Man. UM3189.
Cagniant, A., Delaune, O., Réglat, M., Douysset, G., Gross, P., Le Petit, G., 2017. Ground surface ultralow background spectrometer: Active shielding improvements and coincidence measurements for the Gamma3spectrometer. Appl. Radiat. Isot. 126, 197–200.
Cagniant, A., Douysset, G., Fontaine, J.-P., Gross, P., Petit, G. Le, 2015. An introduction to γ3 a new versatile ultralow background gamma spectrometer. Background description and analysis. Appl. Radiat. Isot. 98, 125–133.
Cagniant, A., Petit, G. Le, Gross, P., Douysset, G., Fontaine, J., 2014. Improvements of low-level radioxenon detection sensitivity by a state-of-the art coincidence setup. Appl. Radiat. Isot. 87, 48–52.
Canberra, 2016. Application Note The SAGe Well : A New Revolution in Well [WWW Document]. URL http://www.canberra.com/products/detectors/germanium-detectors.asp
Canberra, 2013. GenieTM 2000 Spectroscopy Software Customization Tools Manual.
Canberra, 2009a. Model S561 GenieTM 2000 Batch Tools Support.
Canberra, 2009b. Model S506 Interactive Peak Fit User’s Manual.
Canberra Industries, 2013. GenieTM 2000 Operations Manual v3.4.
CEA/LNHB, 2017. Table of Radionuclides.
Collins, S.M., 2016. Absolute primary standardisation of the activity of 60Co by 4πβ-γ digital coincidence counting and the investigation of γ-γ coincidence absolute counting using the National Nuclear Array. MScThesis. University of Surrey.
Collins, S.M., Shearman, R., Keightley, J.D., Regan, P.H., 2017. Investigation of γ-γ coincidence counting using the National Nuclear Array (NANA) as a primary standard. Appl. Radiat. Isot.
Currie, L.A., 1968. Limits for Qualitative Detection and Quantitative Determination Application to Radiochemistry. Anal. Chem. 40, 586–593.
De Oliveira, E.M., Iwahara, A., Poledna, R., Da Silva, M.A.L., Tauhata, L., Delgado, J.U., Lopes, R.T., 2012. Use of sum-peak and coincidence counting methods for activity standardization of 22Na. Nucl. Instruments Methods Phys. Res. Sect. A Accel. Spectrometers, Detect. Assoc. Equip. 687, 69–74.

38
Debertin, K., 1996. The art of realizing the Becquerel. Appl. Radiat. Isot. 47, 423–431.
Dion, M.P., Miller, B.W., Warren, G.A., 2016. Alpha and conversion electron spectroscopy of 238,239Pu and 241Am and alpha-conversion electron coincidence measurements. Nucl. Instruments Methods Phys. Res. Sect. A Accel. Spectrometers, Detect. Assoc. Equip. 830, 6–12.
Drescher, A., 2017. Characterization of LaBr3:Ce Detectors in a Gamma-Gamma Coincidence Configuration. MSc Thesis. The University of Texas at Austin.
Eberth, J., Simpson, J., 2008. From Ge(Li) detectors to gamma-ray tracking arrays-50 years of gamma spectroscopy with germanium detectors. Prog. Part. Nucl. Phys. 60, 283–337.
Erikson, L., Keillor, M., Aalseth, C., Hossbach, T., Mizouni, L., Stavenger, T., McDonald, B.S., Lepel, E., Greenwood, L., Rutherford, C., 2013. Determining HPGe total detection efficiency using γ-γ coincidence. J. Radioanal. Nucl. Chem. 296, 705–710.
Gastrich, H., Gößling, C., Klingenberg, R., Kröninger, K., Neddermann, T., Nitsch, C., Quante, T., Zuber, K., 2016. The Dortmund Low Background Facility — Low-background gamma ray spectrometry with an artificial overburden. Appl. Radiat. Isot. 112, 165–176.
Gilmore, G.R., 2008. Practical Gamma-ray Spectrometry, 2nd ed. Wiley.
Glavič-Cindro, D., Korun, M., Vodenik, B., Zorko, B., 2017. Calculation of the detection limits by explicit expressions. Appl. Radiat. Isot. 126, 267–269.
González De Orduña, R., Hult, M., Andreotti, E., Budjáš, D., Schönert, S., Misiaszek, M., 2010. Pulse shape analysis to reduce the background of BEGe detectors. J. Radioanal. Nucl. Chem. 286, 477–482. doi:10.1007/s10967-010-0729-8
Heusser, G., 1995. Low-Radioactivity Background Techniques. Ann. Rev. Nucl. Part. Sci. 45, 543–90.
Heusser, G., 1991. Studies of y-ray background with a low level germanium spectrometer. Nucl. Inst. Methods Phys. Res. B 58, 79–84.
Heusser, G., 1986. The background components of germanium low-level spectrometers. Nucl. Inst. Methods Phys. Res. B 17, 418–422.
Heusser, G., Weber, M., Hakenmüller, J., Laubenstein, M., Lindner, M., Maneschg, W., Simgen, H., Stolzenburg, D., Strecker, H., 2015. GIOVE: a new detector setup for high sensitivity germanium spectroscopy at shallow depth. Eur. Phys. J. C 75, 1–16.
Horne, S., Landsberger, S., 2012. Selenium and mercury determination in biological samples using gamma-gamma coincidence and Compton suppression. J. Radioanal. Nucl. Chem. 291, 49–53.
Horne, S., Landsberger, S., Dickson, B., 2014. Determination of isotopic ratios of uranium samples using passive gamma spectroscopy with multiple detectors. J. Radioanal. Nucl. Chem. 299, 1171–1175.
Hou, X., Roos, P., 2008. Critical comparison of radiometric and mass spectrometric methods for the determination of radionuclides in environmental, biological and nuclear waste samples. Anal.

39
Chim. Acta 608, 105–139.
Hult, M., 2007. Low-level gamma-ray spectrometry using Ge-detectors. Metrologia 44, S87–S94.
Hult, M., Andreotti, E., De Orduña, R.G., Pommé, S., Yeltepe, E., 2012. Quantification of uranium-238 in environmental samples using gamma-ray spectrometry. EPJ Web Conf. 24, 1–12.
Hult, M., Marissens, G., Stroh, H., Lutter, G., Tzika, F., Marković, N., 2017. Characterisation of an ultra low-background point contact HPGe well-detector for an underground laboratory. Appl. Radiat. Isot.
Hult, M., Vidmar, T., Rosengård, U., Marissens, G., Lutter, G., Sahin, N., 2014. Half-life measurements of lutetium-176 using underground. Appl. Radiat. Isot. 87, 112–117.
IAEA, 1967. Standardization of Radionuclides, Proceedings of a symposium on Standardization of Radionuclides held by the International Atomic Agency (Vienna, 10–14 October 1966). IAEA, Vienna.
ICRU, 2011. Fundamental Quantities And Units For Ionizing Radiation (Revised) ICRU-report No 85.
ICRU, 1994. Particle counting in radioactivity measurements, ICRU Report 52. Maryland, USA.
Ihantola, S., Sand, J., Per, K., Toivonen, J., Toivonen, H., 2012. Principles of UV – gamma coincidence spectrometry. Nucl. Instruments Methods Phys. Res. A 690, 79–84.
Ihantola, S., Sand, J., Peräjärvi, K., Toivonen, J., Toivonen, H., 2013. Fluorescence-assisted gamma spectrometry for surface contamination analysis. IEEE Trans. Nucl. Sci. 60, 305–309.
ISO, 2010. ISO 11929:2010(E) Determination of the characteristic limits (decision threshold, detection limit and limits of the confidence interval) for measurements of ionizing radiation—Fundamentals and application.
Iwahara, A., Poledna, R., da Silva, C.J., Tauhata, L., 2009. Primary activity standardization of 57Co by sum-peak method. Appl. Radiat. Isot. 67, 1887–1891.
Jerrestam, D., Forycki, A., Holm, A., P., H.-C., Shen, T.J., 1989. Multiprocessor data acquisition for NORDBALL. Nucl. Inst. Methods Phys. Res. A 285, 469–476.
Joint Committee For Guides In Metrology, 2008. Evaluation of measurement data — Guide to the expression of uncertainty in measurement, JCGM 100:2008.
Jordanov, V.T., Knoll, G.F., 1994. Digital synthesis of pulse shapes in real time for high resolution radiation spectroscopy. Nucl. Instruments Methods Phys. Res. Sect. A Accel. Spectrometers, Detect. Assoc. Equip. 345, 337–345.
Judge, S.M., Arnold, D., Chauvenet, B., Collé, R., De Felice, P., García-Toraño, E., Wätjen, U., 2014. 100 Years of radionuclide metrology. Appl. Radiat. Isot. 87, 27–31.
Karam, L., Keightley, J., Arcos, J.M.L., 2015. Uncertainties in radionuclide metrology - special issue. Metrologia 52, S1–S212.
Kawrakow, I., Mainegra-Hing, E., Rogers, D.W.O., Tessier, F., Walters, B.R.B., 2017. The EGSnrc

40
Code System: Monte Carlo Simulation of Electron and Photon Transport. Ottawa, Canda.
Keightley, J., Bobin, C., Bouchard, J., Capogni, M., Loreti, S., Roteta, M., 2013. Recent advances in digital coincidence counting for Radionuclide Metrology. 3rd Int. Conf. Adv. Nucl. Instrum. Meas. Methods their Appl.
Kim, I.J., Park, C.S., Choi, H.D., 2003. Absolute calibration of 60Co by using sum-peak method and an HPGe detector. Appl. Radiat. Isot. 58, 227–233.
Kim, I.J., Sun, G.M., Choi, H.D., 2002. Calculation of Effective Angular correlation in the HPGe Spectroscopy of Co-60 gamma rays. J. Korean Nucl. Soc. 34, 22–29.
Knoll, G.F., 2010. Radiation Detection and Measurement, 4th ed. Wiley.
Lee, C.-J., Chung, C., 1991. Determination of 134Cs in Environmental Samples Using a Coincidence Gamma-ray Spectrometer. Appl. Radiat. Isot. 42, 783–788.
Leo, W.R., 1994. Techniques for Nuclear and Particle Physics Experiments, 2nd ed. Springer-Verlag.
Lutter, G., Hult, M., Marissens, G., Andreotti, E., Rosengård, U., Misiaszek, M., Yüksel, A., Sahin, N., 2013. A new versatile underground gamma-ray spectrometry system. Appl. Radiat. Isot. 81, 81–86.
Lutter, G., Hult, M., Tzika, F., Stroh, H., Marissen, G., 2017. Gamma-ray spectrometry analysis software environment. Appl. Radiat. Isot.
Martin, R.H., Taylor, J.G. V, 1992. The standardization of 125I: a comparison of three methods. Nucl. Inst. Methods Phys. Res. A 312, 64–66.
Mi, Y.-H., Ma, H., Zeng, Z., Cheng, J.-P., Li, J.-L., Zhang, H., 2017. Compton suppression in BEGe detectors by digital pulse shape analysis. Appl. Radiat. Isot. 121, 96–100.
Mrđa, D., Bikit, I., Zikić-Todorović, N., S., F., Slivka, J., Vesković, M., 2007. First tests of the active shield for a gamma ray spectrometer. Radiat. Meas. 42, 1361–1367.
Murray, A.S., Aitken, M.J., 1988. Analysis of Low-level Natural Radioactivity in Small Mineral Samples for use in Thermoluminescence Dating, using High-resolution Gamma Spectrometry. Appl. Radiat. Isot. 39, 145–158.
Novković, D., Nadderd, L., Durašević, M., Vukanac, I., Kandić, A., Milošević, Z., 2009. The direct measurement of 133Ba activity by the sum-peak method. Nucl. Instruments Methods Phys. Res. Sect. A Accel. Spectrometers, Detect. Assoc. Equip. 608, 116–120.
Oderkerk, R.P., Brinkman, G.A., 1990. The Applicability of the Sum-peak to Extended Sources. Appl. Radiat. Isot. 41, 169–171.
Paepen, J., Keightley, J., Peräjärvi, K., Tengblad, O., Grim, P., Röning, J., 2015. Standardisation of the data format for list-mode digital data acquisition.
Paradis, H., de Vismes Ott, A., Cagnat, X., Piquemal, F., Gurriaran, R., 2017. Leda: A gamma-gamma coincidence spectrometer for the measurement of environment samples. Appl. Radiat. Isot. 126, 179–184.

41
Peräjärvi, K.A., Ihantola, S., Pöllänen, R.C., Toivonen, H.I., Turunen, J.A., 2011. Determination of 235U, 239Pu, 240Pu, and 241Am in a nuclear bomb particle using a position-sensitive α-γ Coincidence technique. Environ. Sci. Technol. 45, 1528–1533.
Piiparinen, M., Julin, R., Juutinen, S., Virtanen, A., Ahonen, P., Fahlander, C., Hattula, J., Lampinen, A., Lönnroth, T., Maj, A., Mitarai, S., Müller, D., Nyberg, J., Pakkanen, A., Sugawara, M., Thorslund, I., Törmänen, S., 1993. Lifetimes of yrast states in 110Cd. Nucl. Physics, Sect. A 565, 671–686.
Pommé, S., 2016. When the model doesn’t cover reality: examples from radionuclide metrology. Metrologia 53, S55–S64.
Pommé, S., 2007. Methods for primary standardization of activity. Metrologia 44, S17–S26.
Pommé, S., Altzitzoglou, T., Van Ammel, R., Sibbens, G., 2005. Standardisation of 125I using seven techniques for radioactivity measurement. Nucl. Inst. Methods Phys. Res. A 544, 584–592.
Quintana, B., Pedrosa, C., Bombín, R., Martín, S., Lozano, J.C., 2017. Mazinger, a γ-ray spectrometry system of high efficiency and very low background for paloeoclimate applications. Appl. Radiat. Isot. 126, 116–120.
Ringbom, A., Larson, T., Axelsson, A., Elmgren, K., Johansson, C., 2003. SAUNA - A system for automatic sampling, processing, and analysis of radioactive xenon. Nucl. Instruments Methods Phys. Res. Sect. A Accel. Spectrometers, Detect. Assoc. Equip. 508, 542–553.
Rios, R., Tatar, E., Bacon, J.D., Bowles, T.J., Hill, R., Green, J.A., Hogan, G.E., Ito, T.M., Makela, M., Morris, C.L., Mortenson, R., Pasukanics, F.E., Ramsey, J., Saunders, A., Seestrom, S.J., Sondheim, W.E., Teasdale, W., Saltus, M., Back, H.O., Cottrell, C.R., Holley, A.T., Pattie, R.W., Young, A.R., Broussard, L.J., Filippone, B.W., Hickerson, K.P., Liu, J., Mendenhall, M.P., Plaster, B., Mammei, R.R., Pitt, M.L., Vogelaar, R.B., Martin, J.W., 2011. Sealed drift tube cosmic ray veto counters. Nucl. Instruments Methods Phys. Res. Sect. A Accel. Spectrometers, Detect. Assoc. Equip. 637, 105–108.
Roedel, W., 1968. Low-level-µ-spectroscopy by β-µ -coincidence techniques. Nucl. Instruments Methods 61, 41–44.
Saint-Gobain, 2016. Efficiency Calculations for Selected Scintillators.
Savva, M.I., Karfopoulos, K.L., Karangelos, D.J., Anagnostakis, M.J., Simopoulos, S.E., 2014. Installation and performance testing of an XtRa – NaI(Tl) Compton Suppression System at the NED-NTUA. Appl. Radiat. Isot. 87, 361–364.
Schrader, H., Walz, K.F., 1987. Standardization of 125-I by Photon-Photon Coincidence Counting and Efficiency Extrapolation. Appl. Radiat. Isot. 38, 763–766.
Shetty, M., Şahin, D., 2016. Data acquisition and analysis software for gamma coincidence spectrometry. J. Radioanal. Nucl. Chem. 309, 243–247.
Sibbens, G., Altzitzoglou, T., 2007. Preparation of radioactive sources for radionuclide metrology. Metrologia 44, S71–S78.

42
Singh, B., 2004. Nuclear Data Sheets for A = 73 *. Nucl. Data Sheets 101, 193–323.
Söderström, P.A., Nishimura, S., Doornenbal, P., Lorusso, G., Sumikama, T., Watanabe, H., Xu, Z.Y., Baba, H., Browne, F., Go, S., Gey, G., Isobe, T., Jung, H.S., Kim, G.D., Kim, Y.K., Kojouharov, I., Kurz, N., Kwon, Y.K., Li, Z., Moschner, K., Nakao, T., Nishibata, H., Nishimura, M., Odahara, A., Sakurai, H., Schaffner, H., Shimoda, T., Taprogge, J., Vajta, Z., Werner, V., Wu, J., Yagi, A., Yoshinaga, K., 2013. Installation and commissioning of EURICA - Euroball-RIKEN Cluster Array. Nucl. Instruments Methods Phys. Res. Sect. B Beam Interact. with Mater. Atoms 317, 649–652.
Theodórsson, P., 1996. Measurement of Weak Radioactivity. World Scientific.
Tomlin, B.E.Ã., Zeisler, R., Lindstrom, R.M., 2008. γγ coincidence spectrometer for instrumental neutron-activation analysis 589, 243–249.
Van Duppen, P., Riisager, K., 2011. Physics with REX-ISOLDE: from experiment to facility. J. Phys. G Nucl. Part. Phys. 38, 24005.
Venhart, M., Wood, J.L., Boston, A.J., Cocolios, T.E., Harkness-Brennan, L.J., Herzberg, R.D., Joss, D.T., Judson, D.S., Kliman, J., Matoušek, V., Motyčák, Page, R.D., Patel, A., Petrík, K., Sedlák, M., Veselský, M., 2017. Application of the Broad Energy Germanium detector: A technique for elucidating β-decay schemes which involve daughter nuclei with very low energy excited states. Nucl. Instruments Methods Phys. Res. Sect. A Accel. Spectrometers, Detect. Assoc. Equip. 849, 112–118.
Verplancke, J., 1992. Low level gamma spectroscopy: low, lower, lowest. Nucl. Inst. Methods Phys. Res. A 312, 174–182.
Vidmar, T., Kossert, K., Nähle, O.J., Ott, O., 2009. Application of the sum-peak method to activity standardizations of extended 60Co sources. Appl. Radiat. Isot. 67, 160–163.
Volkovitsky, P., Naudus, P., 2009. Absolute 60Co characterization based on gamma-gamma coincident detection by two NaI(Tl) detectors. Nucl. Inst. Methods Phys. Res. A 607, 568–572.
Volkovitsky, P., Unterweger, M., 2012. Feasibility study of activity measurement of positron emitters based on gamma-gamma coincident detection by two NaI(Tl) detectors. Appl. Radiat. Isot. 70, 2037–2042.
Wagner, V.E., 2017. Pulse Shape Analysis for the GERDA Experiment to Set a New Limit on the Half-life of 0νββ Decay of 76Ge. PhD thesis. Ruperto-Carola-University of Heidelberg.
Warren, G.A., Smith, L.E., Aalseth, C.E., Ellis, E., Hossbach, T.W., Valsan, A.B., 2006. Determining activities of radionuclides from coincidence signatures. Nucl. Inst. Methods Phys. Res. A 560, 360–365.
Wieslander, J.S.E., Hult, M., Gasparro, J., Marissens, G., Misiaszek, M., Preusse, W., 2009. The Sandwich spectrometer for ultra low-level γ-ray spectrometry. Appl. Radiat. Isot. 67, 731–735.
Yoho, M., Landsberger, S., 2016. Determination of Selenium in coal fly ash via γ–γ coincidence neutron activation analysis. J. Radioanal. Nucl. Chem. 307, 733–737.
Zhang, W., Ungar, K., Stukel, M., Mekarski, P., 2014. A gamma-gamma

43
coincidence/anticoincidence spectrometer for low-level cosmogenic 22Na/7Be activity ratio measurement. J. Environ. Radioact. 130, 1–6.
Zhang, W., Yi, J., Mekarski, P., Ungar, K., Hauck, B., Kramer, G.H., 2011. Quantification of 235U and 238U activity concentrations for undeclared nuclear materials by a digital gamma–gamma coincidence spectroscopy. Appl. Radiat. Isot. 69, 904–907.

Supplementary information MDA and characteristic limits
For low-level measurements, where the number of counts in the line of interest is often low and comparable to background counts, the concept of detection limit becomes important. According to the ISO 11929 standard (ISO, 2010) two quantities need to be distinguished:
- “Decision threshold is a value of the estimator of the measurand, which when exceeded by the result of an actual measurement using a given measurement procedure of a measurand quantifying a physical effect, one decides that the physical effect is present.”
Decision threshold (sometimes also referred to as a critical limit (Gilmore, 2008)) answers a posteriori question whether the number of counts in a specific measurement is significant, i.e. tells us if there is a sample contribution present in our measurement. It defined by the probability, α, that our method will give positive identification with the zero value of the measurand (type I error): 𝑦𝑦∗ = 𝑘𝑘1−𝛼𝛼𝑢𝑢�(0) (S.1.1) Where y* is the decision threshold, k1-α is the quantile of the standardized normal distribution corresponding to the predefined probability α for making errors of type-I and 𝑢𝑢�(0) is a standard uncertainty of the estimator Y (Y=G(x1,..,xn)) as a function of the true zero value of the measurand (null-hypothesis). Standard uncertainty of the of the estimator is calculated according to GUM (Joint Committee For Guides In Metrology, 2008), taking into account all the input uncertainties (e.g. nuclear data, mass, efficiency, measurement time …).
- “Detection limit is smallest true value of the measurand which ensures a specific probability of being detectable by the measurement procedure.”
Detection limit answers a priori question how good is our method, i.e. what is the minimum number of counts we can be confident detecting using the selected method. Calculation of a detection limit is not straightforward. It is defined implicitly, by the uncertainty of the measurand having the value of the detection limit: 𝑦𝑦# = 𝑦𝑦∗ + 𝑘𝑘1−𝛽𝛽𝑢𝑢�(𝑦𝑦#) (S.1.2) Where y# denotes the detection limit, 𝑢𝑢�(𝑦𝑦#) is the uncertainty of the estimator at the detection limit and k1-β is the quantile of the standardized normal distribution corresponding to the predefined probability β for making errors of type-II. There is no general analytical solution therefore iterative method is recommended. Different approximate explicit expressions can be used, e.g. (Glavič-Cindro et al., 2017), providing sufficient reliability. Through this thesis MDA is used. It is equivalent to detection limit (based on Currie theory (Currie, 1968)) but it neglects the uncertainty contributions from all the input quantities except background counting statistics. MDA definition from (Gilmore, 2008), for 95% confidence levels, is used: 𝑀𝑀𝑀𝑀𝑀𝑀 = 𝐿𝐿𝐷𝐷
𝑌𝑌∗𝜀𝜀𝐹𝐹𝐹𝐹𝐹𝐹∗𝑡𝑡∗𝑚𝑚 (S.1.3)
Where 𝐿𝐿𝐷𝐷 = 2.71 + 4.65 ∗ √𝐵𝐵, Y is photon emission probability (intensity) for the selected line, εFEP is the FEP efficiency for the gamma line of interest (including the TCS correction and self-absorption correction), t counting time, m mass of the sample and B is the number of background counts in the region of interest. In MDA definition in Paper I, inaccurate phrase “total efficiency” instead of FEP efficiency, was used trying to explain for the included (total) effects of TCS and self-absorption. Another issue with MDA calculation is peak ROI width used for background calculation when no peak is detected. Genie2000 (Canberra, 2013) by default with Currie MDA option uses 4 FWHM (-2 channels) from the each side of the expected peak location for ROI determination used in background calculation. Total ROI width of 2.5 FWHM should be sufficient, as the corresponding peak area coverage is 99.68% (Gilmore, 2008). When there is a peak detected, Genie 2000 is using the area under the
peak as a background value. Anyway, all the MDAs in Paper I were calculated with the peak present in the spectrum and in a consistent way, so the relative comparisons between the different systems are valid. In Paper III Eq. (S.1.3) was used with LD calculated from Poisson distribution (because of the low number of background counts). Although the background uncertainty contribution was treated in proper way, detection limit as defined by ISO 11929 is significantly underestimated because of neglecting uncertainty contributions from other measurement input parameters. In the standard measurements the background statistics contribution is dominating (because of high number of background counts), but in low background cases the uncertainties from the efficiencies, geometry parameters etc. should become significant. One obvious thing is the product of efficiencies used in energy gated mode (εFEP(γ1)× εFEP(γ2)) bringing additional uncertainty through the functional relationship of the estimator.

Photon-photon coincidence counting without the efficiency equivalence on X-ray and gamma energies
The method described in Section 3.4.1 is refined by introducing different efficiencies for X-ray and γ-ray energies. A ‘two group’ model is established, with X-rays in the first group (energy span around 5 keV) and γ-ray in the second energy group. The new equations (equivalent to Eqs (3.15)) are: 𝑁𝑁1 = 𝑁𝑁0(𝑋𝑋1𝜀𝜀1𝑥𝑥 + 𝑋𝑋2𝑥𝑥𝜀𝜀1𝑥𝑥 + 𝑋𝑋2𝛾𝛾𝜀𝜀1𝛾𝛾 − 𝑋𝑋1𝑋𝑋2𝑥𝑥𝜀𝜀1𝑥𝑥𝜀𝜀1𝑥𝑥 − 𝑋𝑋1𝑋𝑋2𝛾𝛾𝜀𝜀1𝑥𝑥𝜀𝜀1𝛾𝛾) (S2.1a) 𝑁𝑁2 = 𝑁𝑁0(𝑋𝑋1𝜀𝜀2𝑥𝑥 + 𝑋𝑋2𝑥𝑥𝜀𝜀2𝑥𝑥 + 𝑋𝑋2𝛾𝛾𝜀𝜀2𝛾𝛾 − 𝑋𝑋1𝑋𝑋2𝑥𝑥𝜀𝜀2𝑥𝑥𝜀𝜀2𝑥𝑥 − 𝑋𝑋1𝑋𝑋2𝛾𝛾𝜀𝜀2𝑥𝑥𝜀𝜀2𝛾𝛾) (S2.1b) 𝑁𝑁𝑐𝑐 = 𝑁𝑁0(2𝑋𝑋1𝑋𝑋2𝑥𝑥𝜀𝜀1𝑥𝑥𝜀𝜀2𝑥𝑥 + 𝑋𝑋1𝑋𝑋2𝛾𝛾(𝜀𝜀1𝑥𝑥𝜀𝜀2𝛾𝛾 + 𝜀𝜀2𝑥𝑥𝜀𝜀1𝛾𝛾)) (S2.1c) With: X2x=
𝜔𝜔𝐾𝐾𝛼𝛼𝐾𝐾1+𝛼𝛼𝑇𝑇
KX-ray emission probability in the IT X2γ=0.0663(6) γ-ray emission probability in the IT εix and εiγ detection efficiencies for X and γ-ray energy photons on detector i Connecting the efficiencies on X-ray and γ-ray: 𝜀𝜀1𝑥𝑥 = 𝑧𝑧 ∗ 𝜀𝜀1𝛾𝛾 (S2.2a) 𝜀𝜀2𝑥𝑥 = 𝑧𝑧 ∗ 𝜀𝜀1𝛾𝛾 (S2.2b) Yields the final solution: 𝑁𝑁0 = 𝑧𝑧∗𝑋𝑋1(𝑋𝑋2𝛾𝛾+𝑋𝑋2𝑥𝑥∗𝑧𝑧)
(𝑋𝑋1∗𝑧𝑧+𝑋𝑋2𝛾𝛾+𝑋𝑋2𝑥𝑥∗𝑧𝑧)2(𝑁𝑁𝑐𝑐2−4𝑁𝑁1𝑁𝑁2)2
2𝑁𝑁𝑐𝑐(2𝑁𝑁1−𝑁𝑁𝑐𝑐)(2𝑁𝑁2−𝑁𝑁𝑐𝑐) (S2.3)
That is equivalent to Eq. (3.16) except for the factor z. The factor z can be obtained by Monte Carlo calculations. If we write three group equations (too long to fit in one page and be clearly readable) by dividing Kα and Kβ contributions, the same way X and γ were in Eqs.(S1a-c), with separate efficiencies for γ-ray, Kα and Kβ X-rays, the final solution is: 𝑁𝑁0 = (𝑋𝑋1𝛼𝛼∗𝑧𝑧1+𝑋𝑋1𝛽𝛽∗𝑧𝑧2)(𝑋𝑋2𝛾𝛾+𝑋𝑋2𝛼𝛼∗𝑧𝑧1+𝑋𝑋2𝛽𝛽∗𝑧𝑧2)
(𝑋𝑋1𝛼𝛼∗𝑧𝑧1+𝑋𝑋1𝛽𝛽∗𝑧𝑧2+𝑋𝑋2𝛾𝛾+𝑋𝑋2𝛼𝛼∗𝑧𝑧1+𝑋𝑋2𝛽𝛽∗𝑧𝑧2)2(𝑁𝑁𝑐𝑐2−4𝑁𝑁1𝑁𝑁2)2
2𝑁𝑁𝑐𝑐(2𝑁𝑁1−𝑁𝑁𝑐𝑐)(2𝑁𝑁2−𝑁𝑁𝑐𝑐) (S2.4)
Where z1 and z2 are defined by: ε1Xα=z1*ε1γ ε2Xα= z1*ε2γ ε1Xβ= z2*ε1γ ε2Xβ= z2*ε2γ Difference to Eq. (3.16) is in the factors z, if they are set to 1 the original solution is reconstructed. By using X1 and X2 defined in Section 3.4.1: 𝑋𝑋1𝛼𝛼 + 𝑋𝑋1𝛽𝛽 = 𝑋𝑋1 𝑋𝑋2𝛾𝛾 + 𝑋𝑋2𝛼𝛼 + 𝑋𝑋2𝛽𝛽 = 𝑋𝑋2

Paper 1
N. Marković, P. Roos, and S. P. Nielsen. Low-level gamma-ray spectrometry for the determination of 210Pb. Journal of Radioanalytical and Nuclear Chemistry, vol. 311, pp. 1473–1478, 2017.

Low-level gamma-ray spectrometry for the determination of 210Pb
Nikola Markovic1 • Per Roos1 • Sven P. Nielsen1
Received: 27 June 2016 / Published online: 5 November 2016
� Akademiai Kiado, Budapest, Hungary 2016
Abstract A well High purity germanium (HPGe) gamma
spectrometer with NaI(Tl) Compton anticoincidence shield
recently installed at DTU Nutech and specially designed
for low-level measurements was used for the 210Pb deter-
mination in environmental samples. The system is com-
pared to standard stand-alone HPGe spectrometers. The
choice between high efficiency well and planar detectors as
well as optimum sample size depending on available
sample quantity are discussed. Results show that the only
comparative advantage of the well anticoincidence system
is when just small sample sizes are available.
Keywords Gamma spectrometry � Anticoincidence �Compton suppression � Low-level measurements � 210Pb
Introduction
Gamma-spectrometry is a useful tool for determination of
radionuclides in environmental samples. It is non-destruc-
tive, there is no special radio-chemical sample preparation
and many radionuclides can be determined in a single
measurement. High purity germanium (HPGe) spectrome-
ters are usually used for low-level gamma-spectrometry.
When measuring low activities, such as usually found in
environmental samples, the quantity of interest is the
minimum detectable activity (MDA) which gives the limit
of minimum activity we expect to be able detecting with
our system with a 95% certainty [1]. Many factors affect
MDA for the nuclide of interest: detector efficiency, energy
resolution (FWHM), peak background and measurement
time. Detector efficiency and resolution are ‘‘intrinsic’’
detector properties and to reproduce the values quoted by
manufacturer it is important to properly set-up the detector
electronics and acquisition system. Electronic noise
reduction, shaping-time settings, good pole-zero cancella-
tion and enough channels in spectrum when analyzing low-
energy emitters are important [2, 3]. For the analysis of210Pb spectrometers with thin entrance windows (usually
0.5 mm carbon-epoxy, Be or Al), to minimize the
absorption of the 46.54 keV gamma ray before the detector
crystal, are favorable. Background, as the most critical
contribution to the MDA, can be divided into two main
contributions: one originating from the sample itself and
the other coming from outside the sample. Detectors are
placed in lead shields (usually 10–15 cm thick) to reduce
the latter. External contributions are cosmic background,
background induced by impurities in the shield and
detector material, air radon-induced background and Pb
characteristic X-rays. Lead shields with low 210Pb impu-
rities, inner shields of Cd and Cu to reduce Pb X-rays,
extra-pure elements used for detector production, nitrogen
overpressure in the shield to reduce Rn inflow and veto
detectors or underground laboratories for cosmic compo-
nent are all methods commonly used in background
reduction [4–11]. Background from the sample itself arises
from Compton scattered photons in the sample, shielding
material or the detector. That background is different for
every sample and depends on the amount of radionuclides
with higher gamma energies than that of interest, as well as
on the detector size, sample geometry and composition.
Active shields have been used for Compton background
suppression [12–19], in principle similar to cosmic veto
detectors, operated in anticoincidence with the main
& Nikola Markovic
1 Center for Nuclear Technologies, Technical University of
Denmark, Frederiksborgvej 399, 4000 Roskilde, Denmark
123
J Radioanal Nucl Chem (2017) 311:1473–1478
DOI 10.1007/s10967-016-5091-z

detector, but with the difference that the additional detec-
tors are placed inside the lead shielding, close to the main
detector to detect as much as possible of the Compton
scattered photons. Although increasing the background
component coming from outside the sample (mainly due to40K in the NaI(Tl) detectors when such are used as active
shields) Compton suppression is particularly useful on low
energies and background reduction for a factor of 2 around
50 keV has been reported [14, 15]. 210Pb is widely used as
a tracer in terrestrial and aquatic environments [20].
Lowering the MDA in 210Pb analysis of environmental
samples is particularly important for the dating of sedi-
ments and peat profiles [21, 22] where the improved
MDA’s enables analysis of smaller samples and thus
resulting in a higher spatial resolution. In this paper we
compare the HPGe-Well spectrometer with Compton sup-
pression to the standard stand-alone spectrometers rou-
tinely used for 210Pb determination and try to answer which
one is the detector of choice depending on the sample
quantity available.
Experimental
The Gamma Laboratory at the Radioecology Section at
DTU Center for Nuclear Technologies (Nutech) is a
surface laboratory operating around 20 HPGe detectors. In
this paper stand-alone systems used for low energy
measurements will be compared to a newly installed
HPGe Well spectrometer equipped with a NaI(Tl)
Compton suppression system. The Well HPGe—NaI
system consist of a horizontal integral (Canberra model
GCW2021, 125 cm3 Ge volume, 10 mm diameter and
40 mm deep well) well detector with 0.5 mm Al window
inserted into a large NaI(Tl) annulus crystal (300 9
300 mm annulus plus an additional plug, by Harshaw).
The entire system is placed in a 10 cm thick lead cave
made of low activity Boliden1 lead directly surrounding
the annulus. The NaI(Tl) crystal is coupled to seven
photomultiplier tubes (PMT) and their signals are com-
bined in one preamplifier (PA) and sent to a Canberra
2025 amplifier. In Fig. 1a schematic diagram of the sys-
tem is shown, explaining how the units are connected.
The 2025 amplifier provides a fast amplifier output pulse,
Incoming Count Rate (ICR) output, which is sent to a
Canberra 2040 coincidence unit. If coincidence between
the fast amplifier pulse of the NaI(Tl) and the HPGe-well
is detected within a selected time window the signal is
delayed in a Canberra 2055 Signal shaper and delay unit
(SSDU) to match the timing of the unipolar output from
the Well-Ge amplifier and thereafter sent to the analogue-
to-digital converter (ADC), where the anticoincidence
option is selected. The system is adjusted using an
oscilloscope so that the delayed signal from the 2055
SSDU covers the duration of the unipolar output signal
from the HPGe Well. Further adjustments were made by
observing the HPGe Well coincidence spectrum, espe-
cially its low energy part where we are interested in
background reduction. It is necessary to carefully adjust
these parameters as selecting too long anticoincidence
pulse width unnecessarily increases the dead time while
too short does not cover all detected Compton events as
there is a time-walk effect [23, 24] related to the ICR
output pulse generation in both amplifiers. The delay is a
consequence of the faster pulse formation in the scintil-
lation detector. At the end, coincidence resolving time
was set to 0.6 ls, signal was delayed for 6.5 ls and the
minimum width for anticoincidence gate signal of 0.5 ls
was chosen.
The other detectors used in the comparison were a
Canberra broad energy range BE5030, a Canberra low
energy semi-planar GL2020 with U-shaped cryostat and an
Ortec coaxial GMX series. Their specifications are given in
Table 1. Geometries used were 50 mm diameter Petri dish
filled up to 15 cm3 volume (corresponding to 7 mm filling
height) with 0.9 mm thick polystyrene walls for the stand-
alone detectors and 10 9 40 mm tube of 1.7 cm3 volume
(35 mm filling height) made of 1.1 mm thick acrylic
plastic for the HPGe Well.
A certified reference material, NBL-103 [24] (0.05% U,
Pitchblende ore in silica), with uranium daughters is sec-
ondary equilibrium giving (6.16 ± 0.09) Bq/g of 210Pb,
and a Baltic sea sediment sample were used throughout the
comparison. Sediment sample has been freeze dried and
mortared prior to measurement.1 The lead was bought from the Swedish mining company Boliden, in
early 1990s with certified 210Pb content of less than 35 Bq/kg.
Fig. 1 Schematic drawing of the Well Ge-NaI(Tl) anticoincidence
system setup
1474 J Radioanal Nucl Chem (2017) 311:1473–1478
123

Results and discussion
Calibration of 210Pb on all detectors was checked using the
NBL 103 certified reference material. An HPGe Well
spectrum for the NBL 103 obtained with and without the
Compton suppression system active is shown in Fig. 2. A
mass of 2.2 g of NBL 103 material was filled in the tube,
measuring time was set to 4700 s and 8192 ADC channels
were used. In the (44.4–49.3) keV energy range the
observed Compton reduction factor is 1.8, which corre-
sponds to values reported in the literature. Compton
reduction strongly depends on the other radionuclides
present in the sample. For samples with higher activities of
for instance 137Cs, 60Co or 40K, where high Compton
background is expected, it can be even higher. In Fig. 3 a
coincidence gated spectrum of the HPGe Well detector is
shown, counts that are normally rejected are present here. It
can be seen that there is a rejection of counts for coincident
multi-gamma emitters (e.g., 214Bi 609.3 and 1120.3 keV).
In the magnified (40–70) keV region the 50.13 keV line of227Th and the 53.23 keV line of 214Pb are visible, both
isotopes have several energetic gamma lines in coinci-
dence. As expected, there is no 210Pb signal as it is a single
gamma emitter and coincidence timings were set properly
so random coincidences are negligible. That actually
reduces the efficiency of the detector for those nuclides
when using an active Compton suppression and has to be
taken into consideration before deciding to use active
Compton shielding [18].
Detectors were compared using the NBL 103 certified
reference material. For the planar detectors a Petri dish
(50 mm diameter) was used with three different fillings: 5, 10
and 15 cm3, while for the well detector a plastic tube of
1.7 cm3 volume that fits the well was used. The Petri dish was
measured directly on the detector surface using only a plastic
protective sheet (\1 mm thick) covering the detectors. NBL
103 spectra for the different detectors are shown in Fig. 4.
Measurement time for all detectors was 47377 s. The sample
mass for the Petri geometry was 12.782 and 2.2183 g for well.
The GL2020 has the lowest background of planar detectors,
while BE5030 has the best resolution and efficiency. Table 2
shows the efficiencies and resolutions of the detectors for the
210Pb line along with the corresponding MDAs for 1 day
measurement time. For the efficiency, the total efficiency
value em, calculated by dividing the net count rate to the
sample activity and the gamma emission probability for210Pb, is given. MDA is calculated using the Currie equation
[1] for 95% confidence level:
Table 1 Characteristics of all the detectors used in comparison
Detector name Crystal
diameter (mm)
Crystal
thickness (mm)
Window
material
Window thickness
(mm)
GCW2021
HPGe-well
– – Al 0.5
BE5030 81 30.8 Carbon epoxy 0.6
GL2020 50.5 20 Carbon epoxy 0.5
Ortec GMX 54.9 73.4 Be 0.5
Fig. 2 NBL103 uranium certified reference material Well-Ge spec-
trum total counts (red) and counts in anticoincidence with the NaI(Tl)
annulus (black). (Color figure online)
Fig. 3 NBL103 uranium certified reference material Well-Ge spec-
trum in coincidence with NaI(Tl)
J Radioanal Nucl Chem (2017) 311:1473–1478 1475
123

MDA ¼ 2:71 þ 4:65 �ffiffiffi
Bp
Y � em � t � mð1Þ
Y is photon emission probability (intensity), em total
efficiency, t counting time, m mass of the sample and B is
the number of background counts. Number of background
counts, as well as the net number of counts used for the
efficiency calculation, are obtained using Canberra’s
GenieTM 2000 V3.4 software Sum/Non-linear LSQ Fit
method for peak area calculation [25]. Peak background
was determined using four channels on each side of the
peak to calculate continuum step function. It can be seen
that the BE5030 and the Well-NaI(Tl) detectors give the
lowest values for the MDAs, so additional measurements
for different sample masses were performed to determine
the optimal mass when the use of the well detector is
justified. In Fig. 5 the MDA values down to 0.5 g sample
masses are shown. The Well-NaI(Tl) system performs
better for the small sample masses, but for large sample
mass the BE5030 MDA is lower by an order of magnitude.
Fit functions were chosen proportional to the inverse
square root of mass (background proportional to mass and
constant efficiency simplification was used). The maximum
sample mass that fits the well detector is constrained by the
well size, so there is no decrease in MDA even if a larger
sample quantity is available. There are no improvements in
MDA by using the Well-NaI(Tl) system over the BE5030
detector for masses higher than about 4 g, as can be seen
from the intersection of the fit curves. Even for the BE
detector the increase in sample mass above about 12 g does
not improve MDA. The factors contributing to this are
decrease of the total efficiency (due to the detector-sample
geometry factor and self-absorption of the gamma-ray
photons in the sample) and increase of the Compton
background.
Finally, detectors were compared by means of MDA by
using a sediment sample containing 210Pb, 137Cs (0.076 ±
0.003), 60Co (0.037 ± 0.01) and 40K (0.51 ± 0.02) Bq/g, as
representative of low-activity samples measured at Nutech.
BE5030 is LABSOCS calibrated so the Canberra’s Genie
Geometry composer was used for the efficiency calculation,
while on the GL2020 detector self-absorption correction for
the 210Pb gamma ray was done using a point source
method [26]. For the stand-alone detectors 7.92 g of the
sample was used in a 15 cm3 Petri geometry while the
well tube contained 0.85 g of the sample (full tube, 1.7
cm3). From Table 3 it can be seen that detector BE5030
shows the best MDA performance in terms of activity per
mass (Bq/g,) while the HPGe Well system can detect
lowest total amount of total activity (Bq). It is necessary
Fig. 4 NBL 103 uranium certified reference material spectra. The
Well-NaI(Tl) Compton supressed spectrum is shown in black, GL2020
in blue, BE5030 in red and Ortec GMX in green. (Color figure online)
Table 2 Comparison of
detector performance for
different sample masses using
NBL certified reference material
(uncertainties are for a coverage
factor k = 1)
Detector Sample
mass (g)
em FWHM
(keV)
BKG MDA in
one day
(Bq/g)
GL2020 19.272 0.136 ± 0.002 0.69 2.31E?04 0.07
12.782 0.153 ± 0.003 1.73E?04 0.09
6.261 0.185 ± 0.003 8.38E?03 0.1
Ortec GMX 19.272 0.153 ± 0.002 0.93 3.30E?04 0.08
12.782 0.173 ± 0.003 2.31E?04 0.09
6.261 0.211 ± 0.003 1.29E?04 0.11
BE5030 19.272 0.223 ± 0.005 0.46 2.65E?04 0.05
12.782 0.253 ± 0.004 1.58E?04 0.05
6.261 0.291 ± 0.005 9.87E?03 0.07
Well single 2.2183 0.52 ± 0.01 1.20 1.18E?04 0.12
Well-
NaI(Tl)
2.2183 0.53 ± 0.01 6.70E?03 0.09
Background and MDA are given for a 1 day counting time (86,400 s)
1476 J Radioanal Nucl Chem (2017) 311:1473–1478
123

to emphasize that the sample mass used for the mea-
surement on the well detector was an order of magnitude
lower. The last column in Table 3, giving measured
activity concentrations, shows slightly higher value for
the well detector. That is probably because no self-ab-
sorption correction was used for the well-detector, and
although the tube diameter used for the well is only 8 mm
the difference in attenuation coefficients in the NBL
sample and sediment are observable. Self-absorption
should be included if high-density NORM samples are
analyzed.
Conclusions
Comparison of the Compton suppressed Well-HPGe
spectrometer with stand-alone spectrometers available at
the DTU-Nutech gamma laboratory showed that the only
comparative advantage of the Well-HPGe system over the
best performing stand-alone detector (Canberra BE5030)
for 210Pb determination is when only a small sample
quantity is available and even for small sample sizes the
difference is not very significant (Fig. 5). That is due to the
limited sample size that fits the well and particularly due to
lower capacitance and better charge collection in BE
detectors compared to classical HPGe-well detectors thus
providing better resolution (FWHM) in the BE-detector.
The resolution is a very important factor both for the
sensitivity (peak background component in MDA) and for
precision. Poor resolution of the well detector (1.20 keV
for the 210Pb line compared to 0.46 keV for the BE5030
detector) gives also higher uncertainties in the activity
determination as there is overlap with the 50.13 keV line of227Th so it is difficult to properly subtract the peak back-
ground (see Fig. 4). On the other side the efficiency within
the well is relatively constant so the system is less sensitive
to volume changes for small samples. A well detector with
energy resolution comparable to that of Broad Energy
Germanium (BE) type detectors would significantly out-
perform any planar detector in the analysis of low-energy
gamma emitters when equipped with a Compton suppres-
sion system. Here the new Canberra Small Anode Ger-
manium (SAGe) well looks promising [27, 28]. When
comparing gamma-ray spectrometry with other radiometric
techniques, such as alpha-particle counting (of the 210Po
daughter) or LSC/beta counting (210Bi), larger sample sizes
are needed and gamma-ray spectrometry gives significantly
higher detection limits [29]. Still, sample preparation
methods for gamma analysis are non-destructive and much
easier and additional radionuclides can be determined in
one measurement, thus gamma-ray spectrometry remains
the method of choice for fast and easy determination of210Pb in environmental samples.
References
1. Currie LA (1968) Limits for qualitative detection and quantitative
determination application to radiochemistry. Anal Chem
40:586–593
2. Gilmore GR (2008) Practical gamma-ray spectrometry, 2nd edn.
Wiley, Hoboken
3. Gehrke RJ, Davidson JR (2005) Acquisition of quality g-ray
spectra with HPGe spectrometers. Appl Radiat Isot 62:479–499
4. Theodorsson P (1996) Measurement of weak radioactivity. World
Scientific, Singapore
5. Gastrich H, Goßling C, Klingenberg R et al (2016) The dortmund
low background facility—low-background gamma ray spec-
trometry with an artificial overburden. Appl Radiat Isot
112:165–176
6. Hu Q, Ma H, He J et al (2016) Design of cosmic veto shielding
for HPGe-detector spectrometer. Appl Radiat Isot 109:474–478
7. Hofmann M, Mannel T, Sivers MV (2013) Low-background
gamma-ray spectrometry in the Garching underground labora-
tory. AIP Conf Proc 1549:38–41
8. Burnett JL, Davies AV (2014) Cosmic veto gamma-spectrometry
for comprehensive nuclear-test-ban treaty samples. Nucl Inst
Methods Phys Res A 747:37–40
9. Burnett JL, Davies AV, McLarty JL (2013) Further development
of a cosmic veto gamma-spectrometer. J Radioanal Nucl Chem
298:987–992
Fig. 5 MDA mass dependence for BE5030 and Well-Ge detector
with and without NaI(Tl) Compton suppression
Table 3 Comparison of 210Pb MDA for the selected detectors for a
sediment sample and 5 days counting time (uncertainties are for a
coverage factor k = 1)
Detector MDA
(mBq/g)
MDA
(mBq)
M (g) A (Bq/g)
BE5030 11 87 7.92 0.087 ± 0.003
GL2020 15 120 7.92 0.085 ± 0.005
Well-NaI(Tl) 30 25 0.85 0.092 ± 0.008
J Radioanal Nucl Chem (2017) 311:1473–1478 1477
123

10. Theodorsson P, Heusser G (1991) External guard counters for
low-level counting systems. Nucl Inst Methods Phys Res B
53:97–100
11. Heusser G (1991) Studies of y-ray background with a low level
germanium spectrometer. Nucl Inst Methods Phys Res B
58:79–84
12. Povinec PP (2008) Low-level gamma-ray spectrometry for
environmental samples. J Radioanal Nucl Chem 276:771–777
13. Britton R (2012) Compton suppression systems for environ-
mental radiological analysis. J Radioanal Nucl Chem 292:33–39
14. Savva MI, Karfopoulos KL, Karangelos DJ et al (2014) Instal-
lation and performance testing of an XtRa—NaI (Tl) compton
suppression system at the NED-NTUA. Appl Radiat Isot
87:361–364
15. Murray AS, Aitken MJ (1988) Analysis of low-level natural
radioactivity in small mineral samples for use in thermolumi-
nescence dating, using high-resolution gamma spectrometry.
Appl Radiat Isot 39:145–158
16. Burnett JL, Davies AV (2013) Compton suppressed gamma-
spectrometry for comprehensive nuclear-test-ban treaty samples.
J Radioanal Nucl Chem 295:497–499
17. El-Daoushy F, Garcia-Tenorio R (1995) Well Ge and semi-planar
Ge (HP) detectors for low-level gamma-spectrometry. Nucl
Instrum Methods Phys Res A 356:376–384
18. Długosz-Lisiecka M (2016) Comparison of two spectrometric
counting modes for fast analysis of selected radionuclides
activity. J Radioanal Nucl Chem 309:941–945
19. Grigorescu EL, De Felice P, Razdolescu A-C, Luca A (2004)
Low-level gamma spectrometry using beta coincidence and
Compton suppression. Appl Radiat Isot 61:191–195
20. Mabit L, Benmansour M, Abril JM et al (2014) Fallout 210Pb as
a soil and sediment tracer in catchment sediment budget inves-
tigations: a review. Earth Sci Rev 138:335–351
21. Ivanovich M, Harmon RS (1992) Uranium-series disequilibrium
applications to earth, marine, and environmental sciences, 2nd
edn. Clarendon press, Oxford
22. Appleby PG, Nolan PJ, Oldfield F et al (1988) 210Pb dating of
lake sediments and ombrotrophic peats by gamma essay. Sci
Total Environ 69:157–177
23. Britton R, Burnett JL, Davies AV, Regan PH (2015) Coincidence
corrections for a multi-detector gamma spectrometer. Nucl Inst
Methods Phys Res A 769:20–25
24. Leo WR (1994) Techniques for nuclear and particle physics
experiments, 2nd edn. Springer-Verlag, Berlin
25. Canberra (2013) GenieTM 2000 spectroscopy software cus-
tomization tools
26. Cutshall NH, Larsen IL, Olsen CR (1983) Direct analysis of 210Pb
in sediment samples: self-absorption corrections. Nucl Instrum
Methods Phys Res 206:309–312
27. Canberra (2016) Application Note The SAGe Well: A new rev-
olution in well and environmental counting. http://www.canberra.
com/products/detectors/germanium-detectors.asp
28. Britton R, Davies AV (2015) Characterisation of a SAGe well
detector using GEANT4 and LabSOCS. Nucl Inst Methods Phys
Res A 786:12–16
29. Hou X, Roos P (2008) Critical comparison of radiometric and
mass spectrometric methods for the determination of radionu-
clides in environmental, biological and nuclear waste samples.
Anal Chim Acta 608:105–139
1478 J Radioanal Nucl Chem (2017) 311:1473–1478
123

Paper 2
N. Marković, P. Roos, S. P. Nielsen and X. X. Cai. Background reduction at DTU Nutech surface gamma laboratory. Manuscript in preparation.

Background reduction at DTU Nutech surface gamma laboratory Nikola Marković, Per Roos, Sven Poul Nielsen, Xiao Xiao Cai Technical University of Denmark Center for Nuclear Technologies, Frederiksborgvej 399, 4000 Roskilde, Denmark Abstract Background of a broad energy range (BEGe) type HPGe spectrometer located in a surface laboratory has been studied. Sources of background and of background variation have been identified and different remediation strategies undertaken. By covering the shield with an air tight cover and venting inside of the shield with nitrogen boiling off from the Dewar, radon induced component and its variation have been significantly reduced. Laboratory has not any overburden so cosmic-ray induced background is dominating. Cosmic veto was installed and optimised using digital acquisition system in list-mode with time-stamped data. Muon component reduction resulted in total background reduction by a factor of 1.4. This is similar to previously published data on cosmic suppression by a single veto plate in surface laboratory. It has been estimated that surrounding the shield with four additional plates would yield reduction factor of 2.4. The thermal and fast neutron fluxes have been calculated from the peak areas of gamma lines originating from neutron capture and inelastic scattering reactions in germanium crystal. Keywords: cosmic veto, HPGe detector, low-level, anticoincidence, gamma spectrometry.
1. Introduction Gamma-ray spectrometry using high-purity germanium (HPGe) detectors is the most prevalent (radiometric) method for determination of radionuclides. Range of applications are wide, from measurements of very high activities in radiopharmaceuticals, over low activity levels in environmental samples to extremely low levels encountered in rare events detection. When low activity levels are measured low background detectors are used, with samples placed close to the detector (in some cases, e.g. [1], even the detector material itself is a ‘sample’) and measured over long time. Depending on activity levels that can be reached, systems can be roughly divided to low-level and ultra low-level. For low-level applications special radiopure materials are used for shielding and in detector production and for ultra low-level additional measures for background reduction are undertaken; such as placing the detectors in underground laboratories [2]. It is clear that background is an important factor in gamma-ray spectrometry. Usually, a background spectrum is considered to be a spectrum taken when there is no sample on a detector. The other possibility is to measure an empty beaker without the sample in, but that is rarely practiced. As any normal spectrum, background introduces both peaked counts and counts in continuum (Compton, bremsstrahlung or charged particle interactions in detector). Counts in peak are important because they need to be subtracted from the counts measured with sample on. Background continuum counts do not affect measurements directly but, together with the continuum coming from the sample itself (and counts in peak if present) determine the performance of the system through detection limits. Detection limit is proportional to the square root of background [3] in the region of interest for specific gamma line so the influence of background is more important for activity calculation where the contribution is linear. Good knowledge and control over background in gamma spectrometry is important not only because of reducing detection limits but also because, what is often neglected, variability in
background affecting measurement results [4][5]. Background contribution (total and variability) is the more important the lower activates being measured are, so in low-level laboratories background is (the most)/particularly important parameter. There are many factors that may lead to changes in background. Detector or in-shield contamination by sample or small changes in shield geometry (usually in moving parts, closing system etc.) will induce a sharp change. Airborne radon concentration in the laboratory can be affected by seasonal variations and meteorological conditions [6] but the most important is stability of laboratory ventilation. Deposition of radon and progenies on a plastic baker surfaces due to static charge is also observed [7], [8]. Care should be taken with detector plastic covers used for protection (from contamination or window damage). It is recommended starting the measurements with a delay (after placing the sample and closing the shield) to allow for a decay of short-lived 222Rn daughters. Improper radon background management can have high impact on 226Ra activity determination over 214Bi and 214Pb daughters [9]. Changes in cosmic radiation flux can also introduce background variability. All this can significantly affect measurement results. In standard gamma spectrometric applications it will mean reporting wrong activity values or decision limits, but sometimes one can be tempted to explain unexpected results by the decay law violation [10]. If only a counting uncertainty is used as uncertainty for background peaks that will underestimate the total uncertainty in background (because of variability) [11]. That is why background spectra should be recorded routinely (to account for variability and to detect possible sharp changes in the background) and good quality assurance system should also take background variability into account, as for example in [12]. In this work we present background budget in a typical low-level surface gamma laboratory used for routine measurements of environmental and radioecological samples. Contributions from different background sources are estimated and different background remediation strategies tested; active cosmic veto detector for the reduction of cosmic background component and flushing by evaporating nitrogen from the Dewar for the reduction of airborne radon concentration inside the shield. Reducing the cosmic ray background component enables reaching lower detection limits, but by reducing general background continuum it also enhances the counting statistics in environmental background peaks (e.g. radon progeny) thus enabling easier monitoring of background variability [13].
2. Experimental setup The Radioecology section of DTU Nutech operates 18 HPGe detectors with relative efficiencies ranging from 15% to 50%. Of those, 15 are used for routine measurements, where samples are changed and spectra evaluated by technicians. For quality control, sources of evaporated 241Am, 137Cs and 60Co embedded in epoxy glue in glass LSC vials are measured monthly to check the efficiency and energy calibration of the detectors. Short background checks are often performed, while long background measurements are taken once or twice per year (usually over holidays). The rest of the detectors is located in a special research laboratory and consist of a HPGe-well detector equipped with Compton anticoincidence shield [14] and a HPGe-HPGe coincidence gamma spectrometric system [15]. Gamma laboratories are situated in a single storey building with no overburden (there is no concrete slab/plate above, only a thin roof). The cosmic induced background will be much higher than in a laboratories placed under only a few storeys building. Anyway, low-level gamma spectrometry is not the main strength in the Radioecology section, as the expertise in radiochemistry is used for concentrating the radionuclides of interest in low activity samples. This work will focus on one of the three Canberra BEGe 5030 type detectors procured in 2016 (late 2015), named detector 8 (DET08). The detectors are intended for routine use and provide good

resolution and optimal efficiency for wide range of samples measured (mostly activity in food and environment). The detectors are placed in 10 cm thick lead shields (Fig. 1), manufactured in the years 70’s and 80’s from lead with low 210Pb content (mainly supplied from Boliden and Goslar). Radon contribution to the background is proportional to radon concentration in laboratory air and the volume of free space surrounding the detector inside the shield [16]. Our shields have a large free volume and are not tight so we expected radon background to be significant. Shields have different inner linings for Pb X-ray fluorescence attenuation. DET08 is equipped with 1 mm cadmium inner lining. Detector 8 is ~50% relative efficiency (germanium crystal diameter 81 mm, thickness 31 mm) in an ultra-low background dipstick cryostat (Model 7500SL-RDC-6-ULB) with remote preamplifier. Detector has 0.6 mm thick carbon epoxy window. One plastic (polyvinyltoulene) sheet manufactured by Scionix (model R400x50B500) with 5 cm active thickness was used as active cosmic veto detector. The veto was placed outside on the top of lead cave (Fig. 1). Acquisition for routine measurements is done using a standard amplifier – Canberra multiport chain, but with veto digital list-mode acquisition was used. A CAEN DT5781P digital multichannel analyser was used for list-mode acquisition, enabling time-stamped data collection with 10 ns time resolution and 15 bit ADC resolution. Genie 2000 spectra were generated using MATLAB based coincidence analysis software described in [15][17]. For the peak location and area calculation Canberra Genie 2000 software [18] was used via the interactive peak fit package [19].
Fig. 1 BEGe detector inside lead shield with plastic veto plate placed on top (dimensions are in mm). Shield opens by sliding the lid.

3. Results 3.1. Background variability and radon contribution
Background on detector 8 has been measured regularly over two years. Fig. 2 (b and c) shows background variation in ten measurements taken between March 2016 and October 2017. Measurement times range from 2 to 10 days with an average of 5 days. Relative variation in integral count rates is less than 5%, while count rates in peaks originating in cosmic activation of detector and shielding material vary less than 20%. As no lines overlapping with neutron activation lines are selected in our nuclide library, variations in that part of background contribute to the measurement results only via MDA determination where they come in as a square root of background counts so the effect of variation should not be important. Variation in radon daughters count rates is clear and important, Fig. 2 a). If only counting uncertainty of a single background measurement is taken as total uncertainty for a selected background line it significantly underestimates the total uncertainty dominated by background variability. Table 1 shows average, minimum and maximum count rates in the three most pronounced lines originating from radon progeny and 40K line. Variation in radon daughters’ count rates is up to factor ~3 while the variation in 40K peak count rate is less than 20%. Radon progenies variation is a consequence of varying radon concentration in lab air while 40K might come from small differences in shield geometry (e.g. incomplete lid closing) or LN2 filling (LN2 shielding effect has not been examined). When the effect of background variability on determination of 214Bi and 214Pb is calculated, estimated error of up to 0.3 Bq per sample or 20 Bq/kg (depending on sample size) can be introduced if variability is neglected, Table 2. The effect on 40K determination is lower but still significant because of lower FEP efficiency for 1.5 MeV photons and lower gamma emission probability for 40K. Here we neglected the effect of sample shielding the detector (by reducing the available volume inside the shield and by attenuation of gamma rays) that would reduce radon background component with the sample on. Shielding factors should be estimated either by measurements of blank samples or by modelling [20]. Daily (diurnal) radon oscillations although prominent [9] are also neglected. They do not make significant impact on low activity measurements as low activities are measured over a few days period so the high frequency background oscillation is averaged [6]. Fig. 3 shows dependence of integral background count rate in 40-2100 keV region on sum of count rates in 295 keV, 352 keV and 609 keV peaks. Two count rates are strongly correlated with Pearson's linear correlation coefficient of 0.92 (p<0.001). If extrapolated to zero 222Rn background contribution, it gives 1.24 cps for total background count rate. Taking into account average background count rate of 1.27(0.03) cps we calculate average radon contribution to be less than 3% in the total background. Radon background component, although insignificant in the total background, has strong impact on 222Rn daughters determination. Therefore we decided to reduce that background component. First step was covering of the shield with a simple motor boat cover (Sea Cover 420D 75x75x45 cm 420D polyester); that reduced air exchange between the lab and inside the shield. Then nitrogen boiling off the Dewar was fed through a small hole inside the shield to create overpressure and further reduce air coming inside the shield. Special plug was manufactured to tightly close the filling nitrogen inlet; hose was mounted on outgassing port and fed into the shield. Third outlet (safety) was not blocked. By that we managed to significantly reduce the variation in radon component (Table 1), but to confirm the stability further measurements are needed. 40K component was reduced by the by re-alignment of some lead bricks and introduction of Pb ring between the preamplifier and a Dewar (Fig. 1). This is to further enhance the effect of offset between the upper and lower part of the cryostat that shields the detector element from vacuum sieves [21]. We do not have a lead plate under the Dewar so this lead ring blocks direct line of sight from ground to crystal absorbing a part of 40K photons. The flow-rate of evaporating radon was calculated to be between

0.6 and 1 l/min. A test was made by using nitrogen from pressurized cylinder (that has been left for 2 months to allow any possible radon contamination to decay) and flow-rates ranging from 0.6-4 l/min, but no significant change have been observed, Appendix 2. One problem that remains is air exchange by opening the shield for sample changing. Our shields have a large free volume inside so that can introduce a lot of airborne radon. Therefore we decided the next step would be reducing the shield inner volume by introducing ultra-pure lead plates. Until then a ~4 hours delay between sample exchange (fast exchange to minimise the time shield is open) and start of the measurement will be introduced for low level measurements. That should be enough for 222Rn progeny to decay and possibly to exchange part of 222Rn with venting nitrogen. Now with the purging we expect background to be lower and more stable. Additional background measurements over longer time period are needed to update new uncertainties for the optimized system.
Fig. 2 Background variability. Variation in background count rate of natural sources, radon daughters and 40K, is shown in a). In September 2017 flushing with evaporating nitrogen from Dewar was started, reducing the overall Rn background and its variability (indicated with vertical line). Variation in peak count rates of cosmic induced lines and integral background are shown in b) and c). Table 1 Variation in background count rates before and after Rn reduction. Rn average values are reduced by factor 2-3 and variability up to order of magnitude. Count rate before (cps) Count rate after (cps) Source E (keV) Average Max Min Average Max Min

214-Pb 295.22 1.3E-03 4.0E-03 2.4E-04 4.8E-04 5.5E-04 4.1E-04 214-Pb 351.93 2.1E-03 6.6E-03 3.8E-04 7.6E-04 9.4E-04 5.9E-04 214-Bi 609.31 1.5E-03 4.4E-03 3.4E-04 5.6E-04 7.5E-04 4.1E-04 40-K 1460.82 2.3E-03 2.4E-03 2.1E-03 1.8E-03 1.9E-03 1.8E-03
Table 2 Background variation effect on activity calculation for two standard bakers used (before the radon component remediation installed).
Petri baker (5 cm3, water) Big baker (300 cm3, water)
LabSOCS Activity Max. - average LabSOCS Activity
Max. - average
E (keV) Iγ FEP eff TCS corr. Bq Bq/kg FEP eff TCS corr. Bq Bq/kg 214Pb 295.22 18.414 1.3E-01 1.01 1.1E-01 2.2E+01 4.3E-02 1.00 3.3E-01 1.1E00 214Pb 351.93 35.6 1.1E-01 1.00 1.1E-01 2.3E+01 3.7E-02 1.00 3.4E-01 1.1E00 214Bi 609.31 45.49 6.5E-02 0.82 1.2E-01 2.4E+01 2.3E-02 0.89 3.1E-01 1.0E00
40K 1460.82 10.55 3.0E-02 1.00 5.8E-02 1.2E+01 1.1E-02 1.00 1.6E-01 5.2E-01
Fig. 3 Total spectrum count rate in 40-2100 keV interval as a function of sum of count rates in three radon daughters’ peaks (295 keV, 352 keV and 609 keV).
3.2 Muon component reduction Active cosmic shield, or muon veto, is a special detector providing anticoincidence signal for the main HPGe detector. This way, events originating from muons depositing energy in both detectors are not counted by the main detector. Various types of detectors can be used as veto, e.g. [22][7][23], but plastic scintillators are prevailing in gamma spectrometry applications [24], [25]. Usually, veto is placed outside the lead shield covering the shield from all sides (or top surface if only one plate is available). In some special configurations, an in-shield veto can be added to enhance the muon shielding by detecting the muons that did not interact with the main shield [26] (this is not to be confused with Compton veto). Environmental gamma background is also detected by the muon veto so the proper energy threshold should be selected to discriminate environmental

and muon component in order to prevent unnecessary dead-time introduction. Veto detectors are usually designed so the environmental and muon component peaks are far apart enabling setting-up proper low level discriminator (LLD) to filter the environmental gamma events. An additional lead shield around the veto can be used to shield against the environmental γ radiation [27][28]. Use of two veto plates operated in coincidence [29] is also possible. That way long energy tailing of environmental gamma (from coincidence summing) is rejected reducing the dead time, but coincidence criteria also reduces the efficiency for muon detection counting only those events interacting with both plates (although not significantly [30]). Plastic scintillator veto was placed over detector 08 and spectra from both detectors were saved in a list-mode with a time stamp for each detected event. On-board triggering in CAEN digital MCA is done via RC-CR2 digital filter [31]; occurrence of the event (time stamp) corresponds to zero crossing of the RC-CR2 filter. Similar to constant fraction discriminator triggering (CFD), it is independent of the pulse amplitude, but there might some dependence on a pulse rise-time [32]. RC-CR2 signal is in our case smoothed using moving average filter of 32 samples width. Fig. 4 shows time distribution of coincidences between the HPGe and the veto detector (acquisition time is 5 days). Separation between the natural radioactivity γ rays and the energy deposited by muons was done using an energy threshold identified in Fig. 5. Coincidence time peak has an underlying structure coming from different processes causing coincident detection (Fig. 4 insert). It can be explained if coincidence spectrum in HPGe detector is generated for each delay range, Fig. 6. There is a sharp peak in a time spectrum around 1.7 μs, originating from the interaction of muon in both detectors (from 0.8 to 2.2 μ). The delay is due to the different signal rise-times in scintillator and HPGe detector. Peak broadening is due to the rise-time energy-dependence in HPGe detector. In the spectrum with 2.2 to 3.4 μs coincidence delay 72*Ge broad neutron activation line is visible (~700 keV broad peak in the red spectrum Fig. 6). This delay may come from the 72*Ge half-life (400 ns [33]) but as broadening of gamma line is present, it may also be a consequence of delay in neutron production from muon interaction in the shielding material (tertiary neutrons emitted from excited nuclides in shielding). Peak broadening occurs because of fast de-excitation compared to charge collection time leading to the collection of electron hole pairs generated by the recoil of the nucleus (taking a part of neutron energy in inelastic scattering). The coincidence spectrum created with delays covering the long tail of the coincidence time peak (3.4-15 μs, Fig. 6 blue spectrum) has a pronounced 13.2 keV peak and strong annihilation 511 keV peak. The low energy 13.2 keV peak comes from de-excitation of the first level in 73Ge with 2.92 μs half-life [34].

Fig. 4 Time distribution of differences in signal generation between the coincident events in the HPGe and the veto detector (time an event is registered in HPGe minus the time stamp of the closest veto event). If environmental background counts are not discriminated in veto detector random coincidence continuum is high (black curve). By setting the low level discriminator around 5 MeV on veto detector, random coincidence count rate is reduced and timing properties become clearer.
Fig. 5 Cosmic veto detector spectra (5 days). Spectrum of coincidences with HPGE detector (15 μs width and 0.8 μs delay) is shown in blue. Peak cantered around 10 MeV is originating from muons passing through the plate. Low energy part going up to 3 MeV comes from environmental

background radiation. Threshold energy for separation of environmental background and muon events is set in the middle of plateau between the two peaks, around 5 MeV. It is used together with time coincidence to reduce random coincidences between the environmental background in veto detector and counts in the HPGe detector. Fig. 7 shows background spectra for 15 days measuring period. Spectra are generated with ADC resolution of 16384 channels (0.18 keV per channel) but have been rebinned to 4096 channels (0.72 keV per channel) so the peaks are more apparent. Bottom part of the figure shows reduction factor (per 4 bins) calculated as a ratio of original spectrum and anticoincidence spectrum: 𝐼𝐼(veto OFF)/𝐼𝐼(veto ON). Reduction factor shows a weak energy dependence rising from 1.25 on low energy to 1.75 on high energy part of the spectrum, with an average of 1.45. The energy dependence is a consequence of change in the relative contribution from muon component to the total background with energy. Natural background component is falling with increasing energy (as detector efficiency for gamma photon detection), around 200 keV 210Bi bremsstrahlung becomes important and on very low energies microphonic (and electronic?) noise contributions start to appear. As expected, lines originating in natural background (40K, 214Bi, 214Pb, 208Tl) are outliers as the total peak areas are not changed. Neutron induced background lines (558.5 keV 114*Cd, 803.1 206*Pb and Ge lines) are also less reduced than overall continuum. Annihilation peak on 511 keV and Cd X-ray lines are reduced above the average. If this background reduction is accounted for in calculations done in [14], a new 210Pb MDA value of 75 mBq for standard sediment sample and 5 day counting is obtained (14% improvement compared to reported value of 87 mBq). That is not a grand improvement (1.3 days shorter counting time to achieve the same MDA as before). More important benefit is enhancement in the signal-to-noise ratio (peak to continuum) for radon induced peaks (see insert in Fig. 7), enabling better monitoring of the background variation in shorter counting times.
Fig. 6 HPGe spectra generated for three different coincidence delay ranges with veto detector. Acquisition time is 15 days.

Fig.7 Background spectra for 15 days measurement time. Anticoincidence width is 15 μs with 0.8 μs delay. Energy threshold is applied to veto pulses to remove the environmental gamma contribution. Bottom graph shows the energy dependence of reduction factor. Reduction factor of our system is almost the same as in reference [35] where the factor of 1.37 in 40-2715 keV range was reported; authors used single veto plate of the size similar to ours (theirs was 50x50x5 cm). A higher reduction factor 4, using only top plate (76*76 cm), is claimed by LBNL group [36]. Reduction factor 3 (50-2800 keV) was reported in [25], where authors used 5 plates covering the detector from top and four sides. We tried estimating the possible effect of using side plates by calculating the solid angle covered by veto plate convoluted with angular flux distribution (muon flux ~cos2φ, where φ is zenith angle [37]). Ray-tracing simulation (Appendix 4) gives 61% of generated particles are stopped in veto, meaning that the reduction factor with four additional plates would be around 2.4. BEGe detector ‘transparency’ effect for muons was neglected here. Detector is thin and wide, so expected side plate’s contribution is higher because of the higher probability for interaction with muons hitting Ge crystal from sides. Table 4 gives a summary of peaks observed in the background gamma spectrum with and without the background reduction (muon veto + Rn reduction). Integral count rate in 40-2700 keV region is reduced by a factor of 1.4. It is interesting to observe the difference in 73mGe lines in background reduced spectra and spectra without reduction. In the later, analogue acquisition chain was used (2025 Canberra amplifier + 8701 ADC + 556 AIM) with 6 μs amplifier shaping time. First excited state of 73Ge on 13.3 keV (already observed in Fig. 6) has a half-life of 2.92 μs, therefore analogue system has a high probability for summing 2->1 and 1->0 transitions in one 66.7 keV line (or pile-up somewhere between 53.4 and 66.7 keV). With digital system, trigger filter is able to discriminate the events when trapezoids (energy filter) overlap but input rise-times are separated [31]; in our case trapezoid rise time was 4 μs and input rise time to 0.95 μs. That is the reason why 53.4 keV line is not observed in analogue system, while sum peak on 66.7 keV is dominating. With digital system it is the opposite. The other unexpected effect is moderation effect of plastic veto plate on neutron flux. Based on count rates in 558.5 keV and 651.1 keV neutron induced lines in Cd (Fig. 2 and Table 3),

it can be concluded that neutron spectrum is shifted towards lower energies; cross section for the 113Cd(n,γ)114Cd reaction is a few orders of magnitude higher in thermal than in resonant region, as well as compared to thermal neutron induced reactions in Ge. Around twofold increase in total 73mGe count rate may also suggest the increase in thermal neutron flux, although the alternative explanation might be in reduced pile-up loss. Because of expected high neutron induced background and changes in neutron flux with the plastic veto plate placed over the shield, in the next chapter estimates for the fast and thermal neutron flux will be presented. Table 3 Count rates in observed gamma lines with and without background reduction.
No reduction Reduction ON
Energy Isotope/isomer Count rate (cps)
Uncertainty (cps)
Count rate (cps)
Uncertainty (cps)
10 Ge X-ray 6.4E-03 2.E-04 6.3E-03 1.E-04 13.2 73mGe 6.8E-04 1.E-04 3.4E-03 1.E-04 23.2 Cd Ka 5.4E-03 1.E-04 2.4E-03 9.E-05 26.1 Cd Kb 1.0E-03 8.E-05 6.0E-04 7.E-05 46.6 210Pb 2.1E-04 5.E-05 2.4E-04 5.E-05 53.4 73mGe 1.8E-03 6.E-05 66.7 73mGe 1.9E-03 9.E-05 5.5E-04 6.E-05
110.0 235U, 19F 2.4E-04 7.E-05 2.8E-04 4.E-05 139.7 75mGe 8.5E-04 6.E-05 9.0E-04 5.E-05 185.9 235U, 226Ra 1.7E-04 6.E-05 2.3E-04 4.E-05 197.1 19F1 4.2E-04 7.E-05 4.4E-04 5.E-05 198.3 71mGe 1.5E-03 1.E-04 1.3E-03 6.E-05 242.0 214Pb 2.8E-04 2.E-05 2.9E-04 4.E-05 295.2 214Pb 5.1E-04 4.E-03 4.8E-04 2.0E-04 351.9 214Pb 8.2E-04 6.E-03 7.6E-04 3.0E-04
511 Annihilation 2.2E-02 2.E-04 1.3E-02 1.E-04 558.5 113Cd(n,γ)114Cd 2.0E-03 6.E-05 2.7E-03 6.E-05 569.7 207mPb 5.6E-04 6.E-05 5.4E-04 4.E-05 583.2 208Tl 2.2E-04 4.E-05 1.6E-04 3.E-05 609.3 214Bi 7.0E-04 4.E-03 5.6E-04 3.E-04 617.4 43*Ca? 3.1E-04 3.E-05 651.1 113Cd(n,γ)114Cd 2.9E-04 4.E-05 3.9E-04 3.E-05 657.7 ? 1.4E-04 4.E-05 1.2E-04 3.E-05 661.6 137Cs 2.9E-04 4.E-05 2.0E-04 3.E-05
803 206Pb(n,n) 9.4E-04 5.E-05 8.8E-04 3.E-05 1173.2 60Co 1.7E-04 3.E-05 9.1E-05 2.E-05 1332.5 60Co 1.3E-04 3.E-05 4.6E-05 4.E-05 1460.6 40K 2.2E-03 6.E-05 1.8E-03 5.E-05 1764.5 214Bi 3.5E-04 3.E-04 4.0E-04 1.E-04 2614.5 208Tl 9.4E-04 4.E-05 1.0E-03 3.E-05
40-2700 keV 1.31 0.92 40-2100 keV 1.27 0.88
1 Alternative is 77mGe 197.2 prompt gamma from 76Ge(n,γ) reaction [56].

40-220 keV 0.37 0.26 40-60 keV 0.04 0.03
3.3 Cosmic-ray induced component and neutron flux
Neutrons (T1/2 ~ 10 min), as well as muons (T1/2 ~ 2 μs), are not part of primary cosmic rays. They are produced in showers originating in interactions of primary protons and alpha particles with atmosphere. Galactic cosmic rays (GCR) particle fluxes show latitudinal dependence (more and lower energy particles penetrating the atmosphere close to the magnetic poles) modulated by 11 y solar cycles (inverse relationships to solar activity as solar winds shield the Earth from GCR) [38]. Additional tertiary neutrons are produced by interactions of protons and muons with high Z shielding material [27]. At zero overburden 92% of neutrons are produced by protons and 8% by muons [16]. Our laboratories are without any overburden so both secondary and tertiary neutrons are present. Proton flux attenuation by overburden thickness m, in meters of water equivalent (mwe), is proportional to ~ 𝑒𝑒−
𝑚𝑚1.6 mwe [16], while for the secondary neutrons it is ~ 𝑒𝑒−
𝑚𝑚2 mwe [30].
Consequently, already a shallow-depth of 5 mwe overburden reduces neutron component by more than an order of magnitude. There have been many attempts to connect the neutron flux and spectrum with neutron induced lines in a gamma spectrum, e.g. [39][40][41], though when compared with accuracies of gamma spectrometric measurements it is still only descriptive. That is unfortunate because low background gamma spectrometers can be used a sensitive neutron monitors ([42]). The count rate in neutron induced peak is given by:
𝐼𝐼 = ℎ(𝐴𝐴)𝜔𝜔(𝐸𝐸)𝜀𝜀𝐹𝐹𝐹𝐹𝐹𝐹𝑁𝑁𝑍𝑍 ∫𝜎𝜎(𝐸𝐸′)𝛷𝛷(𝐸𝐸′)𝑑𝑑𝐸𝐸 ′ (1) Where h(A) is isotopic abundance, NZ number of atoms of element Z, ω(E) is transition probability, εFEP is the efficiency for detection of transition energy in full peak, σ(E’) is a neutron cross section for creation of desired excited state, and Φ(E) neutron spectrum. As neutron spectrum is not known and cross sections are energy dependant the problem can be solved only by modelling; unfolding of a priori neutron spectrum [43]. Here we’ll use experimentally derived estimate expressions for fast and slow neutron flux components [44]:
𝛷𝛷𝐹𝐹 = 𝑘𝑘 𝐼𝐼(691.3 keV)𝑉𝑉
(2) for fast (E>691 keV neutron component). Where k=900±150, V is detector volume and I(691.3 keV) count rate in selected energy peak. For thermal neutron flux the expression is:
𝛷𝛷𝑇𝑇 = 980 𝐼𝐼(139.7 keV)𝑉𝑉(𝜀𝜀𝛾𝛾+1.6)
(3)
where εγ is FEP efficiency for 139.7 keV gamma ray generated inside the crystal. Another approach is to rewrite Eq. (1) using average values for cross sections [30]:
𝛷𝛷𝑇𝑇 = 𝐼𝐼(139.7 𝑘𝑘𝑘𝑘𝑉𝑉)𝜀𝜀𝐹𝐹𝐹𝐹𝐹𝐹(𝛾𝛾)+𝛼𝛼𝑇𝑇
1+𝛼𝛼𝑇𝑇𝑁𝑁𝐺𝐺𝐺𝐺ℎ(74)𝜎𝜎(𝑛𝑛,𝛾𝛾)
(4)
where 100% efficiency for internal conversion electron absorption is assumed. And for fast component:
𝛷𝛷𝐹𝐹 = 𝐼𝐼(691.3 𝑘𝑘𝑘𝑘𝑉𝑉)𝜀𝜀𝐹𝐹𝐹𝐹𝐹𝐹(𝑘𝑘)𝑁𝑁𝐺𝐺𝐺𝐺ℎ(72)𝜎𝜎(𝑛𝑛,𝛾𝛾)
(5) As de-excitation of the first excited state in 72Ge is 100% through internal conversion [45]. Efficiencies have been calculated using EGSnrc [46] with additional gamma spectrum generator [47] – details in Appendix 3.75mGe peak areas are calculated using Genie 2000 Interactive Peak Fit, while broad (saw-tooth) inelastic neutron scattering induced line in 72Ge is calculated using a fit to convolution of complementary error function (ERFC) and exponential tail [48][40][43] in Matlab (See Appendix 5). Table 4 gives the fast and thermal neutron fluxes with and without veto plate on,
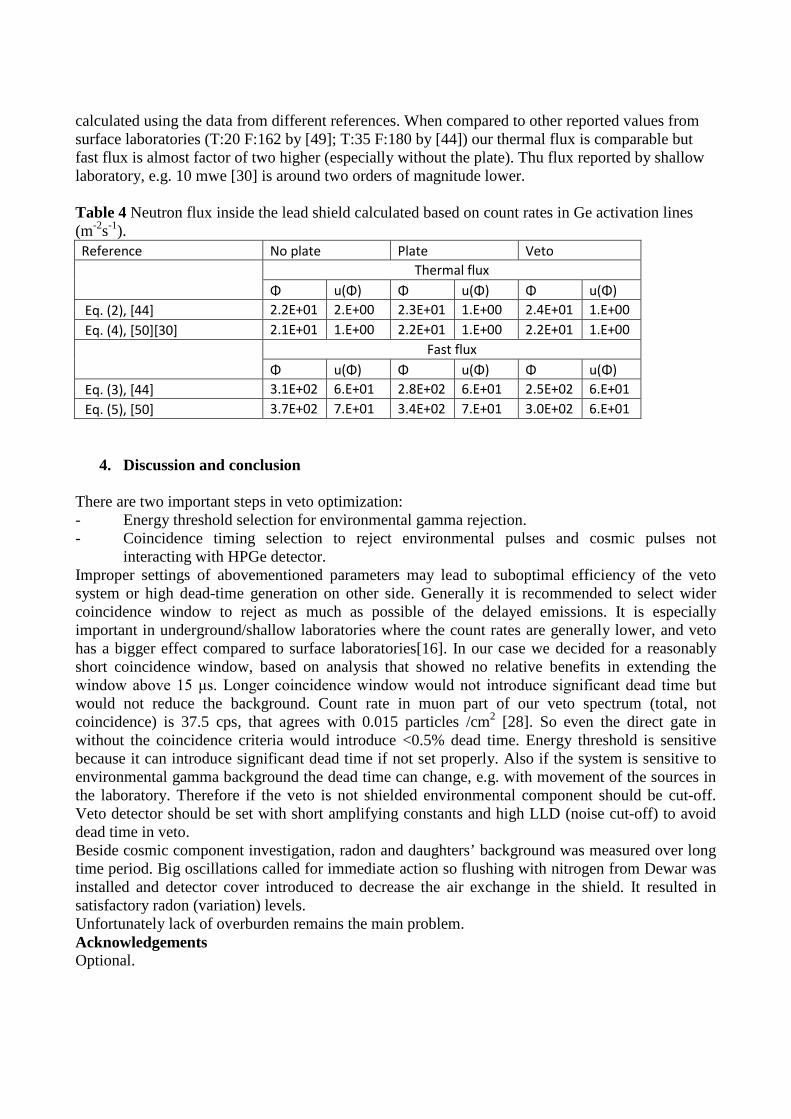
calculated using the data from different references. When compared to other reported values from surface laboratories (T:20 F:162 by [49]; T:35 F:180 by [44]) our thermal flux is comparable but fast flux is almost factor of two higher (especially without the plate). Thu flux reported by shallow laboratory, e.g. 10 mwe [30] is around two orders of magnitude lower. Table 4 Neutron flux inside the lead shield calculated based on count rates in Ge activation lines (m-2s-1). Reference No plate Plate Veto
Thermal flux
Φ u(Φ) Φ u(Φ) Φ u(Φ) Eq. (2), [44] 2.2E+01 2.E+00 2.3E+01 1.E+00 2.4E+01 1.E+00 Eq. (4), [50][30] 2.1E+01 1.E+00 2.2E+01 1.E+00 2.2E+01 1.E+00
Fast flux
Φ u(Φ) Φ u(Φ) Φ u(Φ) Eq. (3), [44] 3.1E+02 6.E+01 2.8E+02 6.E+01 2.5E+02 6.E+01 Eq. (5), [50] 3.7E+02 7.E+01 3.4E+02 7.E+01 3.0E+02 6.E+01
4. Discussion and conclusion There are two important steps in veto optimization: - Energy threshold selection for environmental gamma rejection. - Coincidence timing selection to reject environmental pulses and cosmic pulses not
interacting with HPGe detector. Improper settings of abovementioned parameters may lead to suboptimal efficiency of the veto system or high dead-time generation on other side. Generally it is recommended to select wider coincidence window to reject as much as possible of the delayed emissions. It is especially important in underground/shallow laboratories where the count rates are generally lower, and veto has a bigger effect compared to surface laboratories[16]. In our case we decided for a reasonably short coincidence window, based on analysis that showed no relative benefits in extending the window above 15 μs. Longer coincidence window would not introduce significant dead time but would not reduce the background. Count rate in muon part of our veto spectrum (total, not coincidence) is 37.5 cps, that agrees with 0.015 particles /cm2 [28]. So even the direct gate in without the coincidence criteria would introduce <0.5% dead time. Energy threshold is sensitive because it can introduce significant dead time if not set properly. Also if the system is sensitive to environmental gamma background the dead time can change, e.g. with movement of the sources in the laboratory. Therefore if the veto is not shielded environmental component should be cut-off. Veto detector should be set with short amplifying constants and high LLD (noise cut-off) to avoid dead time in veto. Beside cosmic component investigation, radon and daughters’ background was measured over long time period. Big oscillations called for immediate action so flushing with nitrogen from Dewar was installed and detector cover introduced to decrease the air exchange in the shield. It resulted in satisfactory radon (variation) levels. Unfortunately lack of overburden remains the main problem. Acknowledgements Optional.

References [1] M. Agostini et al., “Results on Neutrinoless Double-β Decay of 76Ge from Phase I of the
GERDA Experiment,” Phys. Rev. Lett., vol. 111, no. 122503, pp. 1–6, 2013.
[2] M. Hult, “Low-level gamma-ray spectrometry using Ge-detectors,” Metrologia, vol. 44, no. 4, pp. S87–S94, 2007.
[3] L. A. Currie, “Limits for Qualitative Detection and Quantitative Determination Application to Radiochemistry,” Anal. Chem., vol. 40, pp. 586–593, 1968.
[4] L. Dragounová and P. Rulík, “Low level activity determination by means of gamma spectrometry with respect to the natural background fluctuation,” Appl. Radiat. Isot., vol. 81, pp. 123–127, 2013.
[5] M. Hult, G. Lutter, A. Yüksel, G. Marissens, and M. Misiaszek, “Comparison of background in underground HPGe-detectors in different lead shield con fi gurations,” Appl. Radiat. Isot., vol. 81, pp. 103–108, 2013.
[6] P. Maver Modec, M. Korun, M. Martelanc, and B. Vodenik, “A comparative study of the radon-induced background in low-level gamma-ray spectrometers,” Appl. Radiat. Isot., vol. 70, no. 1, pp. 324–331, 2012.
[7] G. Heusser, “Studies of y-ray background with a low level germanium spectrometer,” Nucl. Inst. Methods Phys. Res. B, vol. 58, pp. 79–84, 1991.
[8] J. Turunen, S. Ihantola, K. Peräjärvi, R. Pöllänen, H. Toivonen, and E. Hrnecek, “Collection and behaviour of radon progenies on thin Mylar foils,” Radiat. Meas., vol. 46, no. 6–7, pp. 631–634, 2011.
[9] A. Mauring, T. Gäfvert, and T. Bandur Aleksandersen, “Implications for analysis of 226Ra in a low-level gamma spectrometry laboratory due to variations in radon background levels,” Appl. Radiat. Isot., vol. 94, pp. 54–59, 2014.
[10] S. Pommé et al., “Evidence against solar influence on nuclear decay constants,” Phys. Lett. Sect. B Nucl. Elem. Part. High-Energy Phys., vol. 761, pp. 281–286, 2016.
[11] M. C. Lépy, A. Pearce, and O. Sima, “Uncertainties in gamma-ray spectrometry,” Metrologia, vol. 52, no. 3, pp. S123–S145, 2015.
[12] M. Bruggeman, L. Verheyen, and T. Vidmar, “A dedicated LIMS for routine gamma-ray spectrometry,” Appl. Radiat. Isot., vol. 87, pp. 425–428, 2014.
[13] M. Hult, E. Andreotti, R. G. De Orduña, S. Pommé, and E. Yeltepe, “Quantification of uranium-238 in environmental samples using gamma-ray spectrometry,” EPJ Web Conf., vol. 24, pp. 1–12, 2012.
[14] N. Marković, P. Roos, and S. P. Nielsen, “Low-level gamma-ray spectrometry for the determination of 210Pb,” J. Radioanal. Nucl. Chem., vol. 311, pp. 1473–1478, 2017.
[15] N. Marković, P. Roos, and S. P. Nielsen, “Digital gamma-gamma coincidence HPGe system for environmental analysis,” Appl. Radiat. Isot., vol. 126, pp. 194–196, 2017.

[16] P. Theodórsson, Measurement of Weak Radioactivity. World Scientific, 1996.
[17] N. Marković, P. Roos, X. Hou, G. Lutter, and S. P. Nielsen, “Calibration of HPGe – HPGe coincidence spectrometer through performing standardisation of 125I activity by X-ray-gamma coincidence spectrometry using two HPGe detectors,” Nucl. Inst. Methods Phys. Res. A, vol. 880, pp. 194–200, 2018.
[18] Canberra, “GenieTM 2000 Spectroscopy Software Customization Tools Manual.” 2013.
[19] Canberra, Model S506 Interactive Peak Fit User’s Manual. 2009.
[20] M. Korun, B. Vodenik, and B. Zorko, “Determination of the shielding factors for gamma-ray spectrometers,” Appl. Radiat. Isot., vol. 87, pp. 372–375, 2014.
[21] J. Verplancke, “Low level gamma spectroscopy: low, lower, lowest,” Nucl. Inst. Methods Phys. Res. A, vol. 312, pp. 174–182, 1992.
[22] M. Agostini et al., “LArGe: active background suppression using argon scintillation for the Gerda 0νββ-experiment,” Eur. Phys. J. C, vol. 75, no. 506, 2015.
[23] R. Rios et al., “Sealed drift tube cosmic ray veto counters,” Nucl. Instruments Methods Phys. Res. Sect. A Accel. Spectrometers, Detect. Assoc. Equip., vol. 637, no. 1, pp. 105–108, 2011.
[24] J. L. Burnett and A. V Davies, “Cosmic veto gamma-spectrometry for Comprehensive Nuclear-Test-Ban Treaty samples,” Nucl. Inst. Methods Phys. Res. A, vol. 747, pp. 37–40, 2014.
[25] D. Mrđa, I. Bikit, N. Zikić-Todorović, F. S., J. Slivka, and M. Vesković, “First tests of the active shield for a gamma ray spectrometer,” Radiat. Meas., vol. 42, pp. 1361–1367, 2007.
[26] G. Heusser et al., “GIOVE: a new detector setup for high sensitivity germanium spectroscopy at shallow depth,” Eur. Phys. J. C, vol. 75, no. 11, pp. 1–16, 2015.
[27] G. Heusser, “Low-Radioactivity Background Techniques,” Ann. Rev. Nucl. Part. Sci., vol. 45, pp. 543–90, 1995.
[28] G. R. Gilmore, Practical Gamma-ray Spectrometry, 2nd ed. Wiley, 2008.
[29] J. S. E. Wieslander, M. Hult, J. Gasparro, G. Marissens, M. Misiaszek, and W. Preusse, “The Sandwich spectrometer for ultra low-level γ-ray spectrometry,” Appl. Radiat. Isot., vol. 67, pp. 731–735, 2009.
[30] H. Gastrich et al., “The Dortmund Low Background Facility — Low-background gamma ray spectrometry with an artificial overburden,” Appl. Radiat. Isot., vol. 112, pp. 165–176, 2016.
[31] CAEN Electronic Instrumentation, “MC2Analyzer User Manual,” 2017.
[32] W. R. Leo, Techniques for Nuclear and Particle Physics Experiments, 2nd ed. Springer-Verlag, 1994.
[33] D. Abriola and A. A. Sonzogni, “Nuclear Data Sheets for A = 72*,” Nucl. Data Sheets, vol. 111, pp. 1–140, 2010.

[34] B. Singh, “Nuclear Data Sheets for A = 73 *,” Nucl. Data Sheets, vol. 101, pp. 193–323, 2004.
[35] S. Hurtado, M. Garcia-Leon, and R. Garcia-Tenorio, “Optimized background reduction in low-level gamma-ray spectrometry at a surface laboratory,” Appl. Radiat. Isot., vol. 64, pp. 1006–1012, 2006.
[36] K. J. Thomas, E. B. Norman, A. R. Smith, and Y. D. Chan, “Installation of a muon veto for low background gamma spectroscopy at the LBNL low-background facility,” Nucl. Inst. Methods Phys. Res. A, vol. 724, pp. 47–53, 2013.
[37] Particle Data Group, “Review of particle properties,” Phys. Rev. D, vol. 50, no. 3, p. 1269, 1994.
[38] D. H. Hathaway, “The solar cycle,” Living Rev. Sol. Phys., vol. 7, 2010.
[39] G. Fehrenbacher, R. Meckbach, and H. G. Paretzke, “Fast neutron detection with germanium detectors: Computation of response functions for the 692 keV inelastic scattering peak,” Nucl. Instruments Methods Phys. Res. Sect. A Accel. Spectrometers, Detect. Assoc. Equip., vol. 372, no. 1–2, pp. 239–245, 1996.
[40] T. Siiskonen and H. Toivonen, “A model for fitting peaks induced by fast neutrons in an HPGe detector,” Nucl. Instruments Methods Phys. Res. Sect. A Accel. Spectrometers, Detect. Assoc. Equip., vol. 540, no. 2–3, pp. 403–411, 2005.
[41] N. Jovančević, M. Krmar, D. Mrda, J. Slivka, and I. Bikit, “Neutron induced background gamma activity in low-level Ge-spectroscopy systems,” Nucl. Inst. Methods Phys. Res. A, vol. 612, pp. 303–308, 2010.
[42] J. Chao and C. Chung, “Low-level neutron monitoring by use of germanium detectors,” Nucl. Inst. Methods Phys. Res. A, vol. 321, pp. 535–538, 1992.
[43] D. Knežević, N. Jovančević, M. Krmar, and J. Petrović, “Modeling of neutron spectrum in the gamma spectroscopy measurements with Ge-detectors,” Nucl. Instruments Methods Phys. Res. Sect. A Accel. Spectrometers, Detect. Assoc. Equip., vol. 833, pp. 23–26, 2016.
[44] G. P. Škoro et al., “Environmental neutrons as seen by a germanium gamma-ray spectrometer,” Nucl. Inst. Methods Phys. Res. A, vol. 316, pp. 333–336, 1992.
[45] D. G. Jenkins, R. Glover, R. D. Herzberg, A. J. Boston, C. Gray-Jones, and A. Nordlund, “Proof-of-principle for fast neutron detection with advanced tracking arrays of highly segmented germanium detectors,” Nucl. Instruments Methods Phys. Res. Sect. A Accel. Spectrometers, Detect. Assoc. Equip., vol. 602, no. 2, pp. 457–460, 2009.
[46] I. Kawrakow, E. Mainegra-Hing, D. W. O. Rogers, F. Tessier, and B. R. B. Walters, “The EGSnrc Code System: Monte Carlo Simulation of Electron and Photon Transport,” Ottawa, Canda, 2017.
[47] G. Lutter, M. Hult, F. Tzika, H. Stroh, and G. Marissen, “Gamma-ray spectrometry analysis software environment,” Appl. Radiat. Isot., 2017.
[48] E. Gete, D. F. Measday, B. A. Moftah, M. A. Saliba, and T. J. Stocki, “Neutron-induced
peaks in Ge detectors from evaporation neutrons,” Nucl. Inst. Methods Phys. Res. A, vol. 388, pp. 212–219, 1997.
[49] R. Wordel, D. Mouchel, T. Altzitzoglou, G. Heusser, B. Q. Arnes, and P.Meynendonckx, “Study of neutron and muon background in low-level germanium gamma-ray spectrometry,” Nucl. Inst. Methods Phys. Res. A, vol. 369, pp. 557–562, 1996.
[50] S. Niesed, “Underground laboratories for low-level radioactivity measurements,” in Analysis of Environmental Radionuclides, P. P. Povinec, Ed. Elsevier, 2008, pp. 209–239.
[51] P. Mekarski, W. Zhang, C. Liu, and K. Ungar, “Accurate efficiency characterization of a BEGe detector in the low-energy range using empirical and Monte Carlo simulation approaches,” J. Radioanal. Nucl. Chem., vol. 314, no. 1, pp. 273–279, 2017.
[52] C. Liu, K. Ungar, D. Pierce, I. Hoffman, and W. Zhang, “Detection efficiency calculations using Geant4 for a broad-energy germanium gamma spectrometer,” J. Radioanal. Nucl. Chem., vol. 312, no. 3, pp. 471–478, 2017.
[53] M. Bruggeman, T. Vidmar, F. Amouriq, and L. Verheyen, “Efficiency calibration of BEGe and extended range detectors,” Appl. Radiat. Isot., vol. 87, pp. 356–360, 2014.
[54] E. Andreotti et al., “Determination of dead-layer variation in HPGe detectors,” Appl. Radiat. Isot., vol. 87, pp. 331–335, 2014.
[55] Z. Zeng et al., “Characterization of a broad-energy germanium detector for its use in CJPL,” Nucl. Sci. Tech., vol. 28, no. 1, pp. 1–7, 2017.
[56] G. Meierhofer, P. Grabmayr, L. Canella, P. Kudejova, J. Jolie, and N. Warr, “Prompt γ rays in 77Ge and 75Ge after thermal neutron capture,” Eur. Phys. J. A, vol. 48, no. 2, p. 20, 2012.

Appendix 2 A test with nitrogen gas from a pressurised cylinder that had been left for a few months to age has been undertaken. Flow rate was controlled and measured with a welding gas flow-meter. No effect on background was observed, Table A2.1. There is even a slight increase in the low energy count rate for 4 l/min flow. It could be due to the increased noise and vibration induced by such a high flow-rate. This supports the results from Section 3.1 that purging with LN2 boil off is enough for radon background reduction; at least in our case where the cosmic component is dominating. Table A2.1 Change of count rate with gas flow. Total count rate is ROIs is shown as measurement times with gas on were too short to obtain peak areas with good statistics.
Flow rate
(l/min) measurement
time (s)
Count rate in selected ROI (cps)
40-60 40-220 40-2100 293.4 - 296.9 349.6 - 353.4 607.4 - 611.6 0.6 57157 4.4E-02 3.8E-01 1.3E+00 6.2E-03 5.5E-03 3.4E-03 1 42281 4.4E-02 3.7E-01 1.3E+00 6.0E-03 5.1E-03 4.0E-03 4 41756 4.6E-02 3.8E-01 1.3E+00 5.5E-03 5.9E-03 4.0E-03
LN2 413658 4.4E-02 3.7E-01 1.3E+00 6.4E-03 6.3E-03 4.5E-03 / 86779 4.5E-02 3.8E-01 1.3E+00 7.5E-03 8.4E-03 5.5E-03

Appendix 3 BEGe5030 detector EGSnrc model development. The same detector we used is described in [51] and from there we take 6 um upper dead layer – seems they have a strategy of publishing each work twice [52]; [53] use 0.3 um for their top dead layer and 50 um for side; Andreotti and Hult also claim 0.3 um top dead layer [54] and 800 um side, while [55] measured 0.17 mm top dead layer and 1.18 mm side (probably wrong). All that is not important now as neutron flux calculations are only approximate. I will use 0.5 um top and 800 um side for now but it is priority to resolve this question by analysing our calibration results and with one 125I measurement.
Fig. A3.1 Schematic representation of the EGSnrc model of detector DET08 used in the Monte Carlo simulations. Note that the model is not an exact representation of the reality. Table A3.1 Full peak efficiencies for the source distributed inside the Ge volume. 15% uncertainty will be used in flux calculations. Energy (keV) Particle histories peak FEP eff
692 e- 6000000 5518951 0.92 139.7 γ 6000000 4745518 0.79
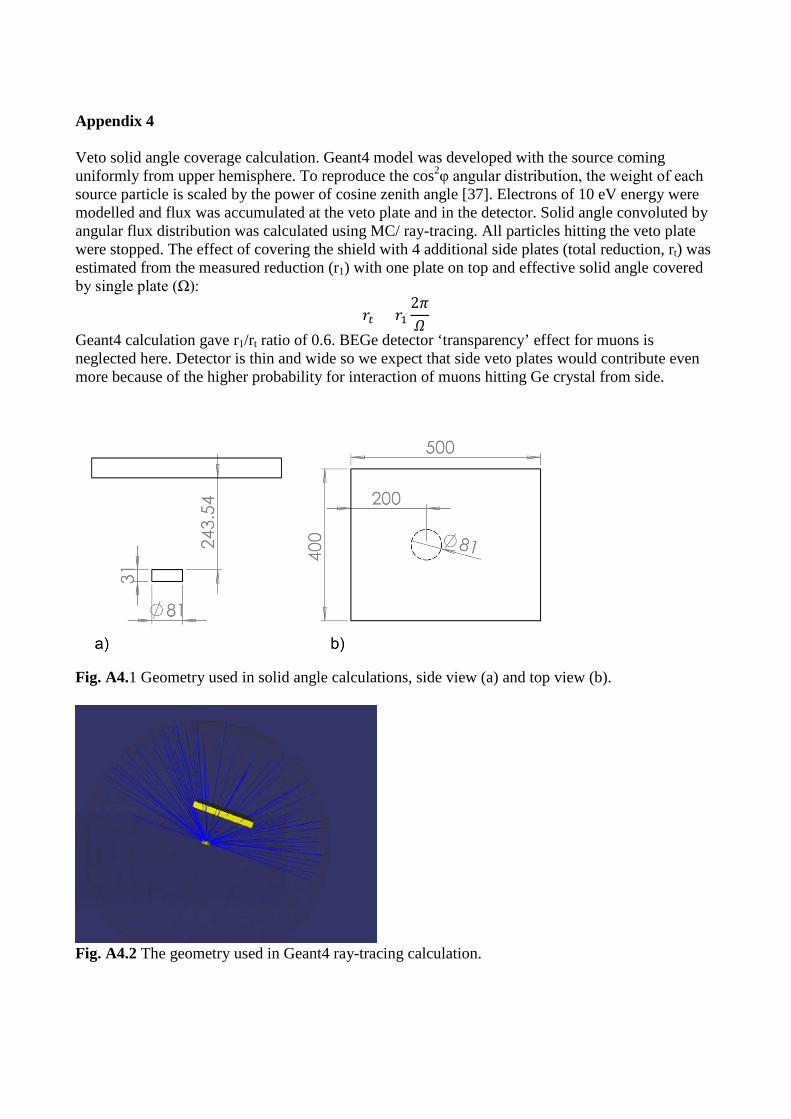
Appendix 4 Veto solid angle coverage calculation. Geant4 model was developed with the source coming uniformly from upper hemisphere. To reproduce the cos2φ angular distribution, the weight of each source particle is scaled by the power of cosine zenith angle [37]. Electrons of 10 eV energy were modelled and flux was accumulated at the veto plate and in the detector. Solid angle convoluted by angular flux distribution was calculated using MC/ ray-tracing. All particles hitting the veto plate were stopped. The effect of covering the shield with 4 additional side plates (total reduction, rt) was estimated from the measured reduction (r1) with one plate on top and effective solid angle covered by single plate (Ω):
𝑟𝑟𝑡𝑡 = 𝑟𝑟12𝜋𝜋𝛺𝛺
Geant4 calculation gave r1/rt ratio of 0.6. BEGe detector ‘transparency’ effect for muons is neglected here. Detector is thin and wide so we expect that side veto plates would contribute even more because of the higher probability for interaction of muons hitting Ge crystal from side.
Fig. A4.1 Geometry used in solid angle calculations, side view (a) and top view (b).
Fig. A4.2 The geometry used in Geant4 ray-tracing calculation.

Appendix 5 Broad asymmetric inelastic neutron scattering peak area determination. Note the difference in number of channels when digital acquisition system is used (0.18 keV/channel) and with analogue electronics (0.32 keV/channel).
Fig. A5.1 Fast neutron activation line with plastic veto plate on the detector. The spectrum is 25 day background spectrum on DET008. The fit to 72Ge(n,n’)72Ge broad peak and background continuum is shown in blue.
Fig. A5.2 The background spectrum measured for 25 days and with the plastic veto plate on. The fit to 74Ge(n,n’)74Ge broad peak, 609 keV 214Bi background line and background continuum is shown in blue. Origin of the 617.6 keV line is not resolved - 117Cd or Ge activation or both (it is broad)?

Fig. A5.3 The background spectrum measured for 21 days without the plastic veto plate on. The fit to 74Ge(n,n’)74Ge broad peak, 609 keV 214Bi background line and background continuum is shown in blue. Origin of the 617.6 keV line is not resolved - 117Cd or Ge activation or both (it is broad)?
Fig. A5.4 Fast neutron activation line without the plastic plate on the detector. The spectrum is 21 day background spectrum on DET008. The fit to 72Ge(n,n’)72Ge broad peak and background continuum is shown in blue.

Paper 3
N. Marković, P. Roos, and S. P. Nielsen. Digital gamma-gamma coincidence HPGe system for environmental analysis. Applied Radiation and Isotopes, vol. 126, pp. 194–196, 2017.

Contents lists available at ScienceDirect
Applied Radiation and Isotopes
journal homepage: www.elsevier.com/locate/apradiso
Digital gamma-gamma coincidence HPGe system for environmental analysis
Nikola Marković⁎, Per Roos, Sven Poul NielsenTechnical University of Denmark, Center for Nuclear Technologies, Frederiksborgvej 399, 4000 Roskilde, Denmark
A R T I C L E I N F O
Keywords:Gamma spectrometryEnvironmental radioactivityGamma-gamma coincidence
A B S T R A C T
The performance of a new gamma-gamma coincidence spectrometer system for environmental samples analysisat the Center for Nuclear Technologies of the Technical University of Denmark (DTU) is reported. NutechCoincidence Low Energy Germanium Sandwich (NUCLeGeS) system consists of two HPGe detectors in a surfacelaboratory with a digital acquisition system used to collect the data in time-stamped list mode with 10 ns timeresolution. The spectrometer is used in both anticoincidence and coincidence modes.
1. Introduction
To achieve lower detection limits in gamma-ray spectrometry manydifferent approaches have been applied. Recently, many methodsrelying on acquisition and post-processing of multi-detector time-stamped data in environmental analysis have been developed (Brittonet al., 2015; Cagniant et al., 2015; Konki et al., 2012; Zhang et al.,2011). In all of these methods the events are recorded along with theirtime stamp, and later coincident signals belonging to the same multigamma emitter are extracted. This way the background is significantlyreduced leading to reduction in the detection limits.
A new spectrometer, Nutech Coincidence Low Energy GermaniumSandwich (NUCLeGeS), has been developed at the surface gammalaboratory at the Radioecology Section of DTU Center for NuclearTechnologies, consisting of two HPGe detectors placed in low activitylead shield and a digital acquisition system used to collect the data intime-stamped list mode.
2. Experimental setup
Detectors are placed in a 20 cm lead shield whose inner cavity islined with 5 mm Sn and 3 mm Cu to absorb low-energy radiation andscattered X-rays. A picture of a setup is shown in Fig. 1. The lowerdetector is equipped with an integral U-type cryostat, similar to thesystem developed at the HADES laboratory (Wieslander et al., 2009),and the upper detector is equipped with an integral vertical cryostatwith the detector facing down, thus enabling easier movement in thevertical direction. The detection setup is composed of two Canberra(GL3825R) detectors; the upper is a 70×25 mm (diameter × height)HPGe crystal with 0.5 mm carbon epoxy window, while the lower is70×24.5 mm crystal with the same window. Crystal to window
distance is 5 mm for both detectors and the detectors were positioned10 mm apart, giving a total crystal to crystal distance of 2 cm. After thepreamplifiers (Canberra 2002CP) signals from the detectors are passedto separate channels on a CAEN N6781A digital multichannel analyser.Data is recorded in a list mode file with 10 ns time resolution; for eachdetector counts with corresponding time of detection and energy arelisted. Data analysis is performed in post-processing using MATLABbased software that creates two energy spectra out of list mode files.Additional coincidence spectra are identified based on the selectedcoincidence resolving time and optional energy gating. All the spectraare saved in .TKA format and then converted to GENIE 2000 .CAM filesusing FILECNVT batch command (Canberra, 2009). The summation ofthe spectra from the two detectors is performed by first normalizing thespectra to match energy calibration using the NORMAL batch commandand then adding the spectra using STRIP with factor −1. Spectrumpreparation (summation of the spectra from two detectors, coincidenceidentification, spectrum manipulation etc.) is controlled from theMATLAB program, while spectrum analysis (peak search, activitycalculation etc.) is done using GENIE 2000 software.
3. Results
3.1. 210Pb measurements
Performance of the system for 210Pb analysis was checked using theNBL 103 certified reference material (0.05 wt% uranium). A mass of8.6 g of NBL 103 material was filled in 53 mm diameter plastic Petridish to height of 3.1 mm. Fig. 2 shows NUCLeGeS NBL 103 spectra.Measuring time was 100,000 s and 16,384 ADC channels were used. Inpost-processing spectra from the two detectors are added making thetotal spectrum. Coincidences are identified (1.2 µs time window) and
http://dx.doi.org/10.1016/j.apradiso.2016.12.017Received 26 August 2016; Received in revised form 28 October 2016; Accepted 13 December 2016
⁎ Corresponding author.E-mail address: [email protected] (N. Marković).
Applied Radiation and Isotopes 126 (2017) 194–196
Available online 24 December 20160969-8043/ © 2016 Elsevier Ltd. All rights reserved.
MARK

total coincidence spectrum consisting of coincidence spectra from bothdetectors is produced. Anticoincidence spectrum was obtained bysubtracting the total coincidence spectrum from the total spectrum.Thus Compton scattered events coming from cascade-gamma emittersor Ge detectors crosstalk are removed resulting in 15% decrease inbackground for the 210Pb peak. FWHM of 210Pb peak is 0.83 keV andthe total efficiency for the specified geometry is 0.47 counts/photon.This gives an MDA of 47 mBq/g in 100,000 s measuring time. Whenmeasuring the same sample on the standard single HPGe spectrometeravailable in the lab, Canberra broad energy range BE5030 (crystaldiameter 81 mm, thickness 30.8 mm, 0.6 mm carbon epoxy window,crystal to window distance 5.5 mm), value obtained for MDA is
53 mBq/g. The small difference in MDA is result of better resolutionof BE5030 detector, 0.46 keV for 210Pb, while the total efficiency in thiscase is 0.25 counts/photon.
3.2. 134Cs measurements
A standardised set of filters with different activities of 137Cs and134Cs were prepared. The filters were measured for a day each and datawas analysed using the MATLAB software so three different spectrawere prepared. Fig. 3 shows the spectra for one of the filters. Thecoincidence spectrum is obtained by taking the events that happenedwithin the 1.2 µs time window, while for the coincidence gatedspectrum an additional criterion that one of the events needs to bewithin the 790 – 805 keV energy range is applied. As can be seen fromthe Fig. 3, the background in the energy gated spectrum is significantlyreduced but at the cost of reducing the efficiency. MDAs for 604.7 keVand 795.9 keV 134Cs lines for total and coincidence spectra werecalculated using the Genie2000 software with Currie MDA option (at95% confidence level). Due to low number of background counts inenergy gated spectrum, 577.3–632.5 keV ROI was used for backgroundcalculation around 604.7 keV peak (peak ROI is 602.3–607.3 keV).There were 1 or 2 counts in this ROI for all the measurements, giving0.1 or 0.2 background counts in the peak. MDA was calculated usingPoisson statistics (Cagniant et al., 2014; Gilmore, 2008). All MDAvalues are given for one day counting time. As shown in Fig. 4 energygated coincidence spectrum gives the lowest MDA values.
Fig. 1. Picture showing inside of the NUCLeGeS spectrometer lead cave.
Fig. 2. NBL103 uranium certified reference material NUCLeGeS spectrum total countsfrom both detectors (black), coincidence counts from both detectors (red) and totalanticoincidence (blue). (For interpretation of the references to color in this figure legend,the reader is referred to the web version of this article.)
Fig. 3. Gamma spectra of the filter with (261± 1) Bq of 137Cs and (9.9±0.2) Bq of134Cs. Total spectrum is shown in black, coincidence spectrum in red and coincidencegated spectrum, with the 790 – 805 keV gate, in blue. (For interpretation of the referencesto color in this figure legend, the reader is referred to the web version of this article.)
Fig. 4. 134Cs MDA dependence on the 137Cs activity. 134Cs activity was kept constant at0.1 Bq and counting time was 1 d.
N. Marković et al. Applied Radiation and Isotopes 126 (2017) 194–196
195

3.3. Background
Fig. 5 shows the background spectrum of NUCLeGeS spectrometerfor 20 days measurement time. In total spectrum the 511 keV peak, Geand Cu activation peaks and 214Bi, 214Pb, 60Co and 40K gamma lines aredetected. The spectrometer normalized background count rate in the30–1900 keV energy range is 1.1 cps/kgGe. In the coincidence spectrumonly the 511 keV annihilation peak and 595.9 keV Ge activation peakare pronounced, while the coincidence gated spectrum gives 36 countsin the 577.3–632.5 keV region which is consistent with 1 or 2 counts forone day measurements described in 3.2..
4. Summary
The new gamma coincidence spectrometer consisting of two HPGe
detectors has been developed. Digital data acquisition system allowsevent by event time-stamped data collection. Coincident events can beidentified in post-processing and subtracted from total spectrum forsingle gamma emitters or further analysed in the case of multi-gammaemitters detection. The first measurements with the new system showthat it is competitive with the single detector systems used in thelaboratory for 210Pb analysis. Important results are obtained for 134Csanalysis showing no MDA dependence of 604.7 keV energy line inenergy gated coincidence spectrum on 137Cs background activity.Coincidence based measurements proved to be an efficient way toimprove MDAs for cascade emitting isotopes.
Acknowledgements
The authors would like to thank to Henrik Larsson from Canberrafor assistance with Genie batch programming.
References
Britton, R., Davies, A.V., Burnett, J.L., Jackson, M.J., 2015. A high-efficiency HPGecoincidence system for environmental analysis. J. Environ. Radioact. 146, 1–5.
Cagniant, A., Douysset, G., Fontaine, J.-P., Gross, P., Petit, G. Le, 2015. An introduction toγ 3 a new versatile ultralow background gamma spectrometer. Backgrounddescription and analysis. Appl. Radiat. Isot. 98, 125–133.
Cagniant, A., Petit, G., Le, Gross, P., Douysset, G., Fontaine, J., 2014. Improvements oflow-level radioxenon detection sensitivity by a state-of-the art coincidence setup.Appl. Radiat. Isot. 87, 48–52.
Canberra, 2009. Model S561 Genie™2000 Batch Tools Support.Gilmore, G.R., 2008. Practical Gamma-ray Spectrometry 2nd ed.. Wiley.Konki, J., Greenlees, P.T., Jakobsson, U., Jones, P., Julin, R., Juutinen, S., Ketelhut, S.,
Sorri, J., Toivonen, H., Turunen, J., Uusitalo, J., 2012. Comparison of gamma-raycoincidence and low-background gamma-ray singles spectrometry 70, 392–396.
Wieslander, J.S.E., Hult, M., Gasparro, J., Marissens, G., Misiaszek, M., Preusse, W., 2009.The sandwich spectrometer for ultra low-level γ-ray spectrometry. Appl. Radiat. Isot.67, 731–735.
Zhang, W., Yi, J., Mekarski, P., Ungar, K., Hauck, B., Kramer, G.H., 2011. Quantificationof 235U and 238U activity concentrations for undeclared nuclear materials by adigital gamma–gamma coincidence spectroscopy. Appl. Radiat. Isot. 69, 904–907.
Fig. 5. NUCLeGeS spectrum for background measurement time of 20 days. Totalspectrum is showed in black, coincidence spectrum in red and energy gated coincidencespectrum, with the same energy gate as used in 134Cs example, in blue. (For interpretationof the references to color in this figure legend, the reader is referred to the web version ofthis article.)
N. Marković et al. Applied Radiation and Isotopes 126 (2017) 194–196
196

Paper 4
N. Marković, P. Roos, and S. P. Nielsen. Coincidence Gamma-Ray Spectrometry. Proceedings of 11th Symposium of the Croatian Radiation Protection Association, 2017. http://www.hdzz.hr/wp-content/uploads/2017/04/11HDZZ_zbornik.pdf

182
COINCIDENCE GAMMA-RAY SPECTROMETRY
Nikola Marković, Per Roos and Sven Poul Nielsen Technical University of Denmark, Center for Nuclear Technologies,
Radioecology Section, Roskilde, Denmark [email protected]
INTRODUCTION
Gamma-ray spectrometry with high-purity germanium (HPGe) detectors is often the technique of choice in an environmental radioactivity laboratory. It is non-destructive, special radio-chemical sample preparation is not needed and many radionuclides can be determined in single measurement so it is used for fast and routine determination of radionuclides. When measuring environmental samples associated activities are usually low so an important parameter that describes the performance of the spectrometer for a nuclide of interest is the minimum detectable activity (MDA), the lowest activity which ensures a specified probability of being detectable by the measurement procedure (following the ISO11929 standard). To lower the detection limits and MDAs, spectrometers with higher efficiencies are used, larger sample sizes are counted for longer time and spectrometer background is reduced. There are many methods for background reduction and they can be roughly divided into the passive and active ones. Passive methods include placing detectors in lead shields made of special radiopure lead to reduce the outside background component. To reduce Pb X-rays produced in the shield, inner graded lining of Cd/Sn and Cu is introduced. Nitrogen boiling-off from Dewar flask is used for flushing inside the shield and making overpressure thus reducing the inflow of airborne radon from outside the shield. Special radiopure materials are used in low-level detectors production and detectors are made with remote preamplifiers to minimize the presence of radio-impurities within the shield. Finally, for the ultimate low-level measurements, detectors are placed deep underground to remove the cosmic-ray induced background component [1]. Active background reduction includes special veto detectors surrounding the shield operated in anticoincidence with the HPGe detector for cosmic background reduction [2,3], pulse-shape analysis (PSA) methods [4,5] and additional detectors placed inside the shield around the main detector for reduction of the incompletely absorbed photons (Compton) background

183
component [6–8] and the use of multiple HPGe detectors operated in coincidence. When coincidence gamma-spectrometry is used, coincident signals coming from cascade emitting nuclides can be extracted thus significantly reducing the background as random coincidences are very unlikely. This is especially evident when there is high activity of other nuclides in the sample contributing to high Compton background. When the nuclide of interest is a single-gamma emitter, coincidence signal can be subtracted from the total to lower the background.
Recent developments of fast and compact digital acquisition systems, with equivalent or better energy resolution when compared to standard analog electronics, led to growing number of applications in which multiple detectors are used. Majority of the applications are within the Comprehensive-Nuclear-Test Ban Treaty (CTBTO) programme where rapid and sensitive determination is needed [9,10] but there is also justification for the use in the standard environmental radioactivity measurement laboratories [11,12].
In this work, we present a new method for increasing the efficiency of two detector coincidence system by summing the coincident signal to reconstruct the full energy of a photon that is Compton scattered between the two detectors.
MATERIAL AND METHODS
The Gamma Laboratory at the Radioecology Section at Center for Nuclear Technologies (DTU Nutech) is a surface laboratory operating around 20 HPGe detectors. Two of those are part of a coincidence gamma system NUCLeGeS [11]. The detectors are placed in 20 cm thick lead shied with 5 mm Sn and 3 mm Cu inner lining. Both detectors are in remote preamplifier configurations. The lower detector has an integral U-type cryostat, while the upper has integral vertical cryostat with the detector facing down. This configuration enables easy movement of the upper detector thus allowing various sample heights to fit in between the detectors. The detectors are low-energy (Canberra GL3825R), with 0.5 mm carbon window. A two channel digital multichannel analyser CAEN N6781A is used for acquisition. The preamplifier signal from each of the detectors is fed into the separate input of the digital multichannel analyser, data is recorded in a list mode file with 10 ns time resolution (100 MS/s sampling rate) and each event is saved with its energy and trigger timestamp. This way all the acquired information is saved and data is analysed in post-processing enabling optimal setting of coincidence and energy gating

184
parameters. From only one measurement multiple spectra can be produced with the parameter settings matching the nuclide of interest. Post-processing analysis is based on the software developed in MATLAB that does the coincidence identification and optional energy gating, calculates all the necessary spectra parameters like acquisition start time, live and dead time, and prepares in GENIE2000.CAM format ready for the analysis. RESULTS
To examine the possibility of a full energy reconstruction for photons that are Compton scattered between the detectors, list mode measurements with 60Co and 137Cs point sources are done. Point sources were placed between the detectors and the detectors were set around 4 cm apart. A coincidence map is generated in post-processing, Figure 1a, showing all the events detected within the time window of 1.8 μs. Gamma-gamma coincidences contribute to vertical and horizontal line in the map, while coincidences originating from single photon depositing its energy in both detectors are in diagonal lines. In Figure 1b, two possible gamma traces for a photon interacting with both of the detectors are shown. Such a photon would be represented on a diagonal line in the 2D coincidence spectrum. The sum of X and Y axis energies from the events in diagonal lines gives the total gamma energy.
Figure 1. a) 2D coincidence spectrum of 60Co point source. Coincidences that are coming from a single 1332.5 keV gamma line depositing its energy in both detectors are shown in red square. b) Example of two gamma ray traces leading to diagonal lines in the left.

185
Total gamma spectrum from both detectors and reconstructed spectrum obtained by summing the energies of coincident events are shown in Figure 2. When the peak areas from both spectra are added, an efficiency increase of around 9 % for each of the lines is achieved. The same was tested with 137Cs point source. The efficiency increase for 661.7 keV line is around 9.5 %. A 226Ra point source was used to test the low energy part where only 3.3 % gain is observed at 186.2 keV. The detectors are low-energy types, with thin crystals and not intended for high energy applications where Compton scattering is more probable. More pronounced effects can be expected at higher energies and with bigger detectors. The method works for both single gamma and cascade-emitting nuclides, but with cascade-emitting nuclides special care has to be taken so that the coincidence sum of two photons in cascade is not attributed to the line coming from direct transition to the ground state (as for example 214Bi 1764.5 keV line).
Figure 2. 60Co spectrum of total events from both detectors (black) and spectrum generated by adding energies of coincident signals to reconstruct the full photon energy.
CONCLUSION
Up to 10 % increase in efficiency is achieved by taking the sum of coincident events from a low-energy dual HPGe spectrometer system. The effect of this on MDA is probably slightly lower because there is also an increase in background around the peaks, but if developed further this could be a nice addition to the coincidence analysis toolbox.

186
REFERENCES [1] Hult M. Low-level gamma-ray spectrometry using Ge-detectors, Metrologia
2007;44:S87–S94. [2] Theodorsson P, Heusser G. External guard counters for low-level counting
systems, Nucl. Inst. Methods Phys. Res. B. 1991;53:97–100. [3] Mrđa D, Bikit I, Zikić-Todorović N, Forkapić S, Slivka J, Vesković M. First
tests of the active shield for a gamma ray spectrometer, Radiat. Meas. 2007;42:1361–1367.
[4] González De Orduña R, Hult M, Andreotti E, Budjáš D, Schönert S, Misiaszek M. Pulse shape analysis to reduce the background of BEGe detectors, J. Radioanal. Nucl. Chem. 2010;286:477–482.
[5] Mi YH, Ma H, Zeng Z, Cheng JP, Li JL, Zhang H. Compton suppression in BEGe detectors by digital pulse shape analysis, Appl. Radiat. Isot. 2017;121:96–100.
[6] Murray AS, Aitken MJ. Analysis of Low-level Natural Radioactivity in Small Mineral Samples for use in Thermoluminescence Dating, using High-resolution Gamma Spectrometry, Appl. Radiat. Isot. 1988;39:145–158.
[7] Britton R. Compton suppression systems for environmental radiological analysis, J. Radioanal. Nucl. Chem. 2012;292:33–39.
[8] Marković M, Roos P, Nielsen SP. Low-level gamma-ray spectrometry for the determination of 210Pb, J. Radioanal. Nucl. Chem. 2017;311:1473–1478.
[9] Britton R, Davies AV, Burnett JL, Jackson MJ. A high-efficiency HPGe coincidence system for environmental analysis, J. Environ. Radioact. 2015;146:1–5.
[10] Cagniant A, Delaune O, Réglat M, Douysset G, Gross P, Le Petit G. Ground surface ultralow background spectrometer: Active shielding improvements and coincidence measurements for the Gamma3 spectrometer, Appl. Radiat. Isot. 2017;doi:10.1016/j.apradiso.2017.01.044.
[11] Marković N, Roos P, Nielsen SP. Digital gamma-gamma coincidence HPGe system for environmental analysis, Appl. Radiat. Isot. 2017; doi:10.1016/j.apradiso.2016.12.017.
[12] Paradis H, Ott AdeV, Cagant X, Piquemal F, Gurriaran R. Leda: a gamma-gamma coincidence spectrometer for the measurement of environment samples, Appl. Radiat. Isot. 2017;doi:10.1016/j.apradiso.2016.12.049.

Paper 5
N. Marković, P. Roos, and S. P. Nielsen. Sum-coincidence mode operation of dual HPGe system. Manuscript in preparation.

Sum-coincidence mode operation of dual HPGe system
Nikola Marković, Per Roos, Sven Poul Nielsen
Technical University of Denmark
Center for Nuclear Technologies, Frederiksborgvej 399, 4000 Roskilde, Denmark
Abstract
We report on the novel operation mode for the dual HPGe detector system. Energies of two
coincident signals are added (summed) so the full peak energy of a Compton scattered photon is
reconstructed. Full energy peak efficiency increase of 17% is reported. Sum-coincidence spectrum
is generated in post-processing of list-mode file. When combined with anticoincidence mode for
Compton background reduction, it results in significant reduction of detection limits.
This operation mode of dual HPGe systems can be used in low-level measurements as there is no
efficiency reduction related to standard coincidence mode.
Keywords: Gamma spectrometry; Coincidence measurements; Low-level measurements;
Environmental radioactivity; HPGe coincidence system.
1. Introduction
From the early days of nuclear physics research, gamma-ray detector arrays have been used in
coincidence experiments for nuclear structure studies (Eberth and Simpson, 2008). Developments in
field-programmable gate array (FPGA) technology enabled easier integration of multiple detectors
in one spectrometric system. Digital gamma spectrometric system with list-mode data acquisition
replaces large number of standard NIM bin modules used in coincidence experiments. Setting-up
the system is much faster as only the on-board filters need to be adjusted for proper time-stamp and
energy measurement. All the other coincidence and gating parameters are applied in post-
processing; only one measurement is needed contrary to coincidence measurements with analogue
systems where whole series of measurements was needed for adjusting parameters for each
coincidence experiment. That developments led to growing number of dual HPGe systems based on
digital list-mode approach (Britton et al., 2015; Burnett et al., 2017; Cagniant et al., 2017; Zhang et
al., 2017). But the flaw of coincidence measurements is that they can be applied only for cascade
emitters with the cost of efficiency reduction (Quintana et al., 2017). For low-level applications
efficiency reduction is not an option because the total number decays in the sample during
measurement is low and the background reduction by taking coincidences is not compensating the
efficiency loss. The benefits in the use of dual systems for low-level measurements were limited to
increase in solid angle/efficiency (because the two detectors are used) and the use of additional
Compton or cosmic veto shield with list-mode acquisition (Lutter et al., 2013; Wieslander et al.,
2009).
In the previous work, NUCLeGeS dual-HPGe system at DTU Nutech, was used in anticoincidence
mode for 210
Pb measurement (Marković et al., 2017). Compton background reduction of 15%
around 46 keV was reported. That mode of operation of dual HPGe system is suitable for use in
low-level measurements as there is no efficiency loss for single-gamma emitters (minor dead time
increase is introduced). Here we propose a novel operation mode called sum-coincidence where the
energies of two coincident signals are summed resulting in full-energy peak (FEP) efficiency

increase. This way energy of a Compton scattered photon that interacted in both detectors is
reconstructed resulting in a full-peak count. This is to our knowledge the first use of the method in
above described way. There is a special section in Knoll (Knoll, 2010) describing the same
procedure, as it was used in the 1960s with small Ge(Li) crystals, but there only sum-coincidence
spectrum is considered (for Compton reduction) without adding it to normal spectrum, resulting in
significant FEP loss. Those systems were based on gain matching from the two detectors and
coincident signal addition in the separate MCA. With list-mode data acquisition such problems are
non-existent as all sum-coincidences, anti-coincidences or coincidences are applied in post-
processing in a way to enhance the signal from the nuclide of interest. From a single measurement,
multiple spectra can be calculated, each for a selected type of radionuclides (single gamma emitters,
cascade emitters …).
2. Experimental setup
Dual HPGe system, NUCLeGeS (Marković et al., 2018, 2017), was used. It consists of two low-
energy HPGe detectors (LEGE2 and LEGE3) in a sandwich configuration. Detectors are placed in
15 cm thick lead shield and upper detector is movable allowing different detector distances (0-6 cm
window to window). The system was used with CAEN N6781 digital acquisition system (CAEN
Electronic Instrumentation, 2015). All the measurements were saved to list-mode with 10 ns time
resolution. The post-processing analysis is done using in-house developed software.
3. Results
Detector was calibrated using multi-isotope calibration solution (AREVA N°CT/160097/16/0269).
Two baker geometries were used; Petri, cylindrical geometry with 50 mm diameter and 3 mm
filling height and yellow-grey baker (YG), cylindrical geometry with 70 mm diameter and 14 mm
filling height. Fig. 1 shows how the sum-coincidence and total (sum of counts in both detectors)
spectrum of the calibration measurement with Petri Geometry. Tables 1 and 2 show the efficiency
increased calculated for the measurements of calibration sources.
Fig. 1 Spectrum created by summation of singles spectra from both detectors (black) and sum-
coincidence spectrum (red) of the calibration source measurement in Petri geometry.

Table 1 Petri geometry
Energy LEGE2 LEGE3 Compton coincidence FEP
increase (%) Counts
FWHM (keV) Counts
FWHM (keV) Counts FWHM (keV)
661.6keV 5290 1.32 4710 1.23 1700 1.53 17
834keV 2090 1.42 2010 1.44 719 1.52 17.5
1115keV 1680 1.76 1540 1.61 537 1.68 16.7
1173KeV 3740 1.84 3390 1.63 1090 1.79 15.3
1332keV 3170 2 3060 1.82 981 1.86 15.7
Table 2 GY geometry
Energy LEGE2 LEGE3
Compton coincidence FEP increase
(%) Counts
FWHM (keV) Counts
FWHM (keV) Counts
FWHM (keV)
661.6keV 1.46E+04 1.35 9.64E+03 1.3 1.76E+03 1.64 7.3
834keV 6.20E+03 1.54 3.99E+03 1.51 8.01E+02 1.68 7.9
1115keV 4.91E+03 1.84 3.21E+03 1.72 6.41E+02 1.8 7.9
1173KeV 1.12E+04 1.88 7.64E+03 1.74 1.46E+03 1.95 7.7
1332keV 9.53E+03 2.03 6.80E+03 1.82 1.25E+03 2.02 7.7
4. Conclusion and perspectives
The first results show increase in sensitivity if sum-coincidence method is used. For single gamma
emitters it is used in combination with anticoincidence so the same counts are not counted twice. It
can also be used with cascade emitters but then anticoincidence method cannot be applied as it
results in efficiency decrease. Background component introduced with sum-coincidence spectrum is
not significant.

References
Britton, R., Davies, A.V., Burnett, J.L., Jackson, M.J., 2015. A high-efficiency HPGe coincidence
system for environmental analysis. J. Environ. Radioact. 146, 1–5.
Burnett, J.L., Cantaloub, M.G., Mayer, M.F., Miley, H.S., 2017. Development of a
multidimensional gamma-spectrometer. J. Radioanal. Nucl. Chem. 312, 81–86.
CAEN Electronic Instrumentation, 2015. N6781 Dual/Quad Digital MCA. User Man. UM3189.
Cagniant, A., Delaune, O., Réglat, M., Douysset, G., Gross, P., Le Petit, G., 2017. Ground surface
ultralow background spectrometer: Active shielding improvements and coincidence
measurements for the Gamma3 spectrometer. Appl. Radiat. Isot. 126, 197–200.
Eberth, J., Simpson, J., 2008. From Ge(Li) detectors to gamma-ray tracking arrays-50 years of
gamma spectroscopy with germanium detectors. Prog. Part. Nucl. Phys. 60, 283–337.
Knoll, G.F., 2010. Radiation Detection and Measurement, 4th ed. Wiley.
Lutter, G., Hult, M., Marissens, G., Andreotti, E., Rosengård, U., Misiaszek, M., Yüksel, A., Sahin,
N., 2013. A new versatile underground gamma-ray spectrometry system. Appl. Radiat. Isot.
81, 81–86.
Marković, N., Roos, P., Hou, X., Lutter, G., Nielsen, S.P., 2018. Calibration of HPGe – HPGe
coincidence spectrometer through performing standardisation of 125I activity by X-ray-gamma
coincidence spectrometry using two HPGe detectors. Nucl. Inst. Methods Phys. Res. A 880,
194–200.
Marković, N., Roos, P., Nielsen, S.P., 2017. Digital gamma-gamma coincidence HPGe system for
environmental analysis. Appl. Radiat. Isot. 126, 194–196.
Quintana, B., Pedrosa, C., Bombín, R., Martín, S., Lozano, J.C., 2017. Mazinger, a γ-ray
spectrometry system of high efficiency and very low background for paloeoclimate
applications. Appl. Radiat. Isot. 126, 116–120.
Wieslander, J.S.E., Hult, M., Gasparro, J., Marissens, G., Misiaszek, M., Preusse, W., 2009. The
Sandwich spectrometer for ultra low-level γ-ray spectrometry. Appl. Radiat. Isot. 67, 731–735.
Zhang, W., Ro, H., Liu, C., Hoffman, I., Ungar, K., 2017. Design and Optimization of a Dual-
HPGe Gamma Spectrometer and Its Cosmic Veto System. IEEE Trans. Nucl. Sci. 64, 894–
900.

Paper 6
N. Marković, P. Roos, X. Hou and S.P. Nielsen. Calibration of HPGe – HPGe coincidence spectrometer through performing standardisation of 125I activity by X-ray-gamma coincidence spectrometry using two HPGe detectors. Nuclear Instruments and Methods in Physics Research Section A: Accelerators, Spectrometers, Detectors and Associated Equipment, 880 (2018) 194–200.

Nuclear Inst. and Methods in Physics Research, A 880 (2018) 194–200
Contents lists available at ScienceDirect
Nuclear Inst. and Methods in Physics Research, A
journal homepage: www.elsevier.com/locate/nima
Calibration of HPGe–HPGe coincidence spectrometer through performingstandardisation of 125I activity by X-ray-gamma coincidence spectrometryusing two HPGe detectorsNikola Marković a,*, Per Roos a, Xiaolin Hou a, Guillaume Lutter b, Sven Poul Nielsen a
a Technical University of Denmark, Center for Nuclear Technologies, Frederiksborgvej 399, 4000 Roskilde, Denmarkb European Commission, Joint Research Centre, Directorate for nuclear safety and security, JRC-Geel, Retieseweg 111, 2440 Geel, Belgium
a r t i c l e i n f o
Keywords:Gamma-ray spectrometryEfficiency calibrationMonte CarloCoincidenceStandardisationLow energy
a b s t r a c t
An X-ray-gamma coincidence measurement method for efficiency calibration of a HPGe–HPGe system, usingthe methodology for activity standardisation of 125I, has been developed. By taking one list-mode time-stampedmeasurement of the 125I source, six spectra were generated in post-processing: total spectra, coincidence spectraand energy gated coincidence spectra for each of the two detectors. The method provides enough observablesfor source activity to be determined without a prior knowledge of the detector efficiencies. In addition, oncethe source is calibrated in this way the same spectra can also be used to perform efficiency calibration of theindividual detectors in the low energy range. This new methodology for source activity determination is analternative to the already established X-ray-(X-ray, gamma) coincidence counting method; with two NaI(Tl)detectors and the sum-peak method using a single HPGe detector. When compared to the coincidence countingmethod using two NaI(Tl) detectors, the newly developed method displays improved energy resolution of HPGedetectors combined with measurement of only full peak areas, without the need for total efficiency determination.This enables activity determination even in presence of other gamma emitters in the sample. Standard coincidencecounting with NaI(Tl) detectors provides lower uncertainties. The method has been used for calibration of acoincidence HPGe spectrometer in the low energy range of 125I and fine adjustments of a Monte Carlo model ofthe coincidence system.
© 2017 Elsevier B.V. All rights reserved.
1. Introduction
The diversification of HPGe gamma coincidence systems [1–4] hasbeen driven by the development of cheaper and easier to use digitalacquisition systems. This raises questions relating to calibration routinesfor such systems. Coincidence HPGe detectors are very sensitive andrequire accurate and precise efficiency calibration. This is because theproduct of these efficiencies is used for activity determination (𝜀det1 ×𝜀det2), and all associated errors and uncertainties contribute increasingthe total uncertainty. Activity determination is either based on MonteCarlo (MC) calculations or reference sample. The first option is moreversatile and does not require a dedicated calibration for each isotope tobe measured; it does however generally introduce larger uncertainties.Full Energy Peak (FEP) efficiency calibration of a detector in lowenergy range is problematic because of true coincidence summing (TCS)effects with X-rays and MC model sensitivity to dead layer thickness.
* Corresponding author.E-mail address: [email protected] (N. Marković).
Development of a MC model relies on proper estimation of the deadlayer thickness of the germanium crystal, as this is the main parameteraffecting low energy response. FEP efficiencies measured using a ref-erence material need to be corrected for TCS effect in case of multi-gamma cascade emitters. There are only a few radioisotopes providingcalibration points under 210Pb 46.5 keV (26.3 keV 241Am line needs aTCS correction as does 14 keV from 57Co). Here we propose a method forFEP calibration of HPGe–HPGe coincidence spectrometer based on 125Imeasurements. The basic principle presented here shares similaritieswith the methodology described by Erikson et al. [5] for calibration offull energy peak and total efficiency by absolute measurement of 60Co;the main methodological difference outlined in this paper relates tothe low energy range calibration of the detector. No standardisedsource of 125I is needed as the coincidence system is used for absolutemeasurement.
https://doi.org/10.1016/j.nima.2017.10.086Received 26 July 2017; Received in revised form 23 October 2017; Accepted 27 October 2017Available online 4 November 20170168-9002/© 2017 Elsevier B.V. All rights reserved.

N. Marković et al. Nuclear Inst. and Methods in Physics Research, A 880 (2018) 194–200
Different methods have been reported for 125I absolute activity mea-surement and source standardisation. Pommé et al. [6] described andused seven techniques for 125I solution standardisation. When limited tophoton detection, the two methods most widely used are photon–photoncoincidence counting and the sum peak coincidence method [7–13].In photon–photon coincidence counting method, two NaI(Tl) detectorsare used to identify coincidence events between X-rays originatingfrom 125I EC and gamma-rays or X-rays originating from the 125Tede-excitation (isomeric transition). Knowing the count rates of eachdetector, and the coincidence count rate provides enough observablesfor the accurate determination of source activity [14,15]. This methodprovides sufficient accuracy and precision; with the main uncertaintycomponent coming from the uncertainties in nuclear data [6]. X-ray-(X-ray, gamma) photon coincidence counting method for NaI detectorscannot be used with HPGe detectors because Germanium X-ray escapeevents are introducing additional coincidences. The sum peak coinci-dence method relies on the identification of a coincidence sum countrate, when both photons originating from the EC and isomeric transitionare absorbed in a single detector, and a single count rate when onlyone photon from a single decay is detected [8,16]. NaI(Tl) detectors aswell as HPGe can be used for this method. Both methods work only forpoint sources [17], although modifications correcting for voluminoussource [18] are possible. Abovementioned methods are sensitive tothe presence of impurities as they rely wholly upon total count ratemeasurement (for total efficiency measurement).
In this work, we present a photon–photon coincidence spectrometrymethod for standardisation of 125I using two HPGe spectrometers witha digital list-mode acquisition system. After only one time-stampedmeasurement, six spectra are generated in post processing; single detec-tor spectra, coincidence spectra and energy gated coincidence spectraprovide enough independent observables for the exact activity deter-mination and thus for precise efficiency calibration of the individualdetectors in the low-energy range. An additional advantage of thismethod is that it is not sensitive to the presence of impurities.
2. Theory125I decays by electron capture (EC) to the 35.5 keV excited state
of 125Te which de-excites (half-life 1.48 ns) by either gamma emission(6.63%) to the ground state or by conversion electrons followed by X-ray emission, Fig. 1. The decay thus results in coincident emission ofcharacteristic X-rays from the EC process with the 35.5 keV gammaline, as well as with characteristic X-rays originating from the internalconversion process. Decay data were taken from [19] and the followingvalues are used through the rest of this paper:
𝑇1∕2 = 59.388(28) days, 𝑋2 = 𝑃k𝜔k×P(XK𝛽)/P(XK)=0.12950(65) forK𝛽 X-ray emission probability in the EC branch and 𝑋𝛾 = 0.0663(6) for𝛾-ray emission probability.
If using two HPGe detectors their single count rates of the 35 keVphotopeak, 𝑁1 and 𝑁2, for a point source with activity 𝑁0 can bewritten:
𝑁1 = 𝑁0(𝑋𝛾𝜀𝛾,𝑝1 −𝑋𝛾𝜀
𝛾,𝑝1 ×𝑋1𝜀
𝑋,𝑡𝑜𝑡1 ) (1a)
𝑁2 = 𝑁0(𝑋𝛾𝜀𝛾,𝑝2 −𝑋𝛾𝜀
𝛾,𝑝2 ×𝑋1𝜀
𝑋,𝑡𝑜𝑡2 ), (1b)
with 𝑋𝛾 and 𝑋1 for gamma the emission probability and the total KX-ray emission probability in the EC branch (the gamma line cannot be incoincidence with X-rays in the internal conversion process so that is whyonly X-ray-gamma coincidences are subtracted). 𝜀𝑖,𝑝𝑘 is the FEP efficiencyof photon, KX or gamma-ray, detection by detector k.𝜀𝑖,𝑡𝑜𝑡𝑘 is the totalefficiency of detecting KX or 𝛾-ray in detector k; this is the probability ofany deposition of energy higher than the low energy threshold (around5 keV on our system).
For energy gated coincidence count rate on each detector we have:
𝑁3 = 𝑁0𝑋𝛾𝜀𝛾,𝑝2 ×𝑋2𝜀
𝑋,𝑝1 (2a)
Fig. 1. Decay scheme of 125I (from [19]).
𝑁4 = 𝑁0𝑋𝛾𝜀𝛾,𝑝1 ×𝑋2𝜀
𝑋,𝑝2 (2b)
𝑁3 is the count rate under the X-ray peaks on detector 1 that are incoincidence with the FEP gamma events on detector 2 and 𝑁4 is thecount rate under the X-ray peaks on detector 2 that are in coincidencewith the FEP gamma events on detector 1, see Fig. 5. We used only theK𝛽 X-rays (30.9–31.8 keV) to avoid the problem of more complicatedpeak area calculation for the non-resolved K𝛼 X-rays lines from theescape peak, see Fig. 6; so 𝑋2 stands for K𝛽 X-ray emission probabilityin the EC branch.
Finally, for coincidence count rate under gamma peak we get:
𝑁5 = 𝑁0𝑋𝛾𝜀𝛾,𝑝1 ×𝑋1𝜀
𝑋,tot2 (3a)
𝑁6 = 𝑁0𝑋𝛾𝜀𝛾,𝑝2 ×𝑋1𝜀
𝑋,tot1 (3b)
To solve analytically the system of Eqs. (1)–(3) we need an additionalassumption. Connecting the FEP efficiencies for K𝛽X-ray and 𝛾-rayinvolves:
𝜀𝑋,𝑝1 = 𝑧1𝜀
𝛾,𝑝1 (4a)
𝜀𝑋,𝑝2 = 𝑧2𝜀
𝛾,𝑝2 (4b)
This leads to two analytical solutions for decay rate 𝑁0:
𝑁01 =𝑧1(𝑁1𝑁2 −𝑁5𝑁6)2𝑋2
𝑁3(𝑁1 −𝑁5)(𝑁2 −𝑁6)𝑋𝛾(5a)
𝑁02 =𝑧2(𝑁1𝑁2 −𝑁5𝑁6)2𝑋2
𝑁4(𝑁1 −𝑁5)(𝑁2 −𝑁6)𝑋𝛾(5b)
Assuming that the FEP efficiencies 𝜀𝑖,𝑝1 on X-ray energies and on gammaenergy are proportional by factor 𝑧1on detector one, Eq. (4a), we get thesolution Eq. (5a) and respective for the other detector.
The symmetric combination of Eqs. (5a) and (5b) is the final solutionfor the decay rate:
𝑁0 =√
𝑁01𝑁02 (6)
Eq. (6) is derived under the assumption that total detection ef-ficiencies are the same for all X-ray photons (27–31 keV) in eachof the detectors and the same is valid for X-ray FEP efficiencies.
195

N. Marković et al. Nuclear Inst. and Methods in Physics Research, A 880 (2018) 194–200
Fig. 2. Schematic representation of EGSnrc model for LEGe 2 detector, upward lookingone in the system (a), and two detectors with plastic source holder in between (b).
This means that different detectors can be used. Ratios of X-ray to𝛾 ray FEP efficiencies, Eqs. (4a) and (4b), are determined by MonteCarlo simulation (Chapter 4), but they can be roughly determined bysimple attenuation calculations as set out in section 5.3. X-ray emissionfrom EC and 𝛾-ray emission are independent processes so there is noangular correlation between the photons coming from the two. Anotherparameter of interest is the solution for the FEP efficiency:
𝜀𝛾,𝑝11 =𝑁3(𝑁1 −𝑁5)
𝑧1(𝑁1𝑁2 −𝑁5𝑁6)2𝑋2(7a)
𝜀𝛾,𝑝21 =𝑁4(𝑁1 −𝑁5)
𝑧2(𝑁1𝑁2 −𝑁5𝑁6)2𝑋2(7b)
Depending on the assumption (4a) or (4b) we get Eq. (7a) or (7b). Forthe efficiency on detector two simply exchange 𝑁1 with 𝑁2 and 𝑁5 with𝑁6. Similarly, as for the count rate, the final solution for the efficiencyis the symmetric combination of Eqs. (7a) and (7b):
𝜀𝛾,𝑝𝑘 =√
𝜀𝛾,𝑝1𝑘 𝜀𝛾,𝑝2𝑘 (8)
Eq. (8) gives the coincidence summing corrected value for gammaphoton FEP on detector k.
3. Materials and methods
A dual HPGe detector system, Nutech Coincidence Low EnergyGermanium Sandwich (NUCLeGeS) [20], recently installed at DTUCenter for nuclear technologies (Nutech) was used for all measurements.The system consists of two low-energy HPGe (Canberra LEGe GL3825R)detectors with carbon windows, Fig. 2a. The distance between thedetectors can be varied from 0 to 6 cm, Fig. 2b. A CAEN N6781Adigital multichannel analyser was used for data acquisition, enablingtime-stamped list-mode data collection with 10 ns time resolution and15 bit ADC resolution. All spectra were generated using MATLAB basedcoincidence analysis software and produced in a Genie 2000 compatibleformat, utilising Genie batch commands. Non-extending dead timeand random coincidence corrections [21] and acquisition time decaycorrections were implemented in the calculation software.
A NaI(Tl) detector system, consisting of two Bicron 3’ NaI(Tl) detec-tors (placed in a long lead shield of 10 cm thickness enabling detectorspositioned from 0 cm to 15 cm window-to-window distance), was usedfor X-ray-(X-ray, gamma) coincidence measurements. A CAEN DT5780Pdigital multichannel was used for the acquisition. This is similar to theone used with the HPGe system in all parameters except that it is nota NIM unit, but a standalone desktop that also provides a high voltagefeed for the photomultiplier tubes.
The first batch of 125I point sources were prepared by pipetting 5–20μL of 125I solution (PerkinElmer, NaI, pH9) onto adhesive coated paperwith plastic back support (0.1 mm thickness, 1.5×3.0 cm); the dropletof 125I solution was then evaporated to dryness at room temperature for1–4 h. Dried sources were then sealed by folding the sticky foil, andplaced into plastic bags (0.05 mm thickness) for measurement. Largevariations (of up to 10%) of the measured activity in these point sourceswere observed. This was attributed to loss of 125I during evaporation atroom temperature. With this in mind the second batch of point sourceswere prepared by immediately sealing them by folding the sticky paperafter pipetting the 125I solution (2–5 μl) onto an attached small filterpaper (0.3×0.3 cm2) before any significant evaporation could occur. Asbefore the folded sources were sealed in plastic bag for measurement.Additional 125I point source was prepared using 125I standard solutionof certified activity (provided by Eckert & Ziegler (California, USA)) anddiluted to 5.0 ml using water.
3.1. Monte Carlo simulations
MC model was derived based on manufacturers specifications,Fig. 2. MC simulations were undertaken using the EGSnrc package [22]with an additional decay generator [23] reproducing decays fromENSDF data. Rough model optimisation was derived by adjusting theMC model to reproduce experimental 125I spectrum (fine-tuning isexplained in Section 3.2.2). Dead layer thickness and window to crystaldistance were roughly estimated by adjusting the areas of X-ray escapepeaks and sum peaks, while keeping the gamma peak normalised to theexperimental area of 𝛾 peak. It was required to adjust the curvature of Cwindow (Fig. 2) as the attenuation in air is higher than the attenuationin vacuum. The upper and side germanium dead layers are not visible inthe figure as their thickness is in the submicron range. Fig. 3 displays agood overlap of experimentally measured spectrum and MC simulationof 125I for a 0.9 μm Ge dead layer and a 5.5 mm window to crystaldistance for each of the detectors.
The model with monoenergetic photon source of 31.1 keV and 35.5keV energies was used for calculation of X-ray to 𝛾 ray FEP efficiencyratio (𝑧 in Eq. (4a) and (4b)). As FEP efficiencies of X-ray and 𝛾 energiesare two strongly correlated quantities, relative uncertainties of theirratio are much lower than the relative uncertainties assigned to eachquantity.1 By this means it was possible to determine the coefficient𝑧 to 0.5% relative uncertainty (conservative estimate) with efficienciesvarying by 10%. Table 1 presents the values of total efficiencies andtheir ratios for different detector parameters. Values for 0.9 μm Gedead layer and 5.5 mm window to crystal distance are used as areference (𝑧∗1 and 𝜀𝛾,𝑝∗1 ) in the last two columns based on the MC modeloptimisation in Fig. 3. For standard carbon window detectors theratio of FEP efficiencies on K𝛽 X-ray energies over gamma-energy FEPefficiencies is around 0.97.2
4. Results and discussion
4.1. Certified source measurement
The method was tested by measurement of a 125I point source(prepared from E&Z solution) with activity of (936 ± 22) Bq (𝑘 = 2)on the reference date of 1 February 2017. After the source had beenmeasured all spectra were generated in post processing analysis of thetime-stamped data file. The first parameter required for coincidenceidentification is the coincidence window width. Fig. 4 shows the coinci-dence time spectrum generated by plotting the time difference between
1 For 𝑓 = 𝑥∕𝑦 the uncertainty is 𝑢2𝑐𝑓 2 ≈ 𝑢2𝑥
𝑥2+
𝑢2𝑦𝑦2
− 2 cov(𝑥,𝑦)𝑥𝑦
[24].2 The values for efficiencies we calculate using LABSOCS on our factory calibrated
Canberra BE5030 detector, for point source geometry, are 0.3241 and 0.3348 on 31.0keV and 35.5 keV energies respectively. And that is probably the trend on all similardetectors.
196

N. Marković et al. Nuclear Inst. and Methods in Physics Research, A 880 (2018) 194–200
Table 1FEP efficiencies at 31.1 keV (X-ray) and 35.5 keV (𝛾-ray) and their ratios for different detector geometry parameters (6*106 simulated gamma events for each geometry).
Dead layer thickness (μm) Crystal to window distance (mm) 𝜀𝛾,𝑝1 𝜀𝑋,𝑝1 𝑧1
𝑧∗1−𝑧1𝑧∗1
(%) 𝜀𝛾,𝑝∗1 −𝜀𝛾,𝑝1
𝜀𝛾,𝑝∗1(%)
0.1 5 0.3489 0.3443 0.9868 0.0278 −3.80080.1 7 0.3258 0.3217 0.9874 −0.0409 3.08850.1 9 0.3036 0.3006 0.9903 −0.3293 9.69780.5* 5.5* 0.3362 0.3318 0.9870 0.0000 0.00001.0 5 0.3463 0.3404 0.9830 0.4093 −3.00291.0 7 0.3236 0.3184 0.9842 0.2833 3.75121.0 9 0.3017 0.2971 0.9849 0.2168 10.2566Square root of quadratic sum of minimum and maximum value: 0.5 11
Fig. 3. MC spectrum (black) added on exponential background over experimentallymeasured spectrum (red). 𝛾 peak area of simulated spectrum is normalised to theexperimental one (15*106 decays simulated). (For interpretation of the references tocolour in this figure legend, the reader is referred to the web version of this article.)
Fig. 4. Coincidence delay spectrum showing the time difference in signal generationbetween the detectors. Coincidence width is taken to cover the area of coincidence peak.
the coincident signals in the two detectors. There is a sharp coincidencepeak symmetric around 0, as the detectors are essentially the samethere is no difference in charge collection and signal formation, andtherefore no need for a delay. A coincidence window width of 1.4 μswas selected and used in the further analyses. With this count rate therandom coincidence effect was negligible.
By taking all the events detected within the selected time window,a two-dimensional coincidence spectrum can be generated showing thecoincidence fingerprint of 125I, Fig. 5. An energy gated coincidence spec-trum can then be derived by projecting the two dimensional spectrumalong one detector axis around selected energy gate; i.e. by selecting all
Fig. 5. Two-dimensional coincidence spectrum of a 125I source. K𝛼–K𝛼 X-ray coincidencesaround 27 keV on both detectors are the most abundant coincidence events. Energy gated(34.5 keV–36.5 keV) coincidence regions used for production of spectra from which thecount rates 𝑁3 and 𝑁4 are calculated are shown in red rectangles.
coincident events where the energy loss in the other detector is withinthe energy gate. The energy range used as a gate to produce coincidencegamma gated spectra was 34.5 keV–36.5 keV.
A single spectrum, coincidence spectrum and an energy gated co-incidence spectrum for one of the detectors are shown in Fig. 6. Insingle spectrum all the X-ray peaks, 𝛾 peak, true coincidence sum peaks,germanium X-ray escapes and various combinations can be seen. Inthe coincidence spectrum, only a few events above the 35.5 keV 𝛾-rayenergy are present and those can be explained by the recapture of theescaped Ge X-ray from the other detector. This can be seen from Fig. 5(full energy of the two coincident photons minus 9.9 keV deposited inone detector and 9.9 keV in the other). The energy gated coincidencespectrum has two wide lines belonging to X-ray K𝛼 and K𝛽, and theirgermanium X-ray escapes shifted 9.9 keV to lower energies.
Count rates defined in Eqs. (1)–(3) have been determined followingpeak area calculation by dividing with the live measurement time.For the peak location and area calculation Canberra Genie 2000 soft-ware [25] was used via the interactive peak fit package [26]. Finally,when all the count rates are calculated, Eq. (6) is used. Followingdecay correction to reference date, and correction for decay during themeasurement time for 125I, a value of (938 ± 13) Bq (𝑘 = 1) was derived;this is in agreement with the one provided by Eckert&Ziegler. Herethe source was measured for 86 400 s to get uncertainty contributionfrom the counting statistics as low as possible. Using a shorter countingtime of 14 400 s an activity value of (931 ± 18) Bq (𝑘 = 1) wasderived. Uncertainty was calculated with the use of propagation formulafor dependent function3 under the assumption that the observablesare not correlated [27]. The uncertainty budget, which consists of 10
3 For the measurement result 𝑦 determined through 𝑁 quantities through a relationship
𝑦 = 𝑓 (𝑥1 , 𝑥2 ,… , 𝑥𝑁 ) the combined standard uncertainty is 𝑢2𝑐 (𝑦) =∑𝑁
𝑖=1
(
𝜕𝑓𝜕𝑥𝑖
)2𝑢2(𝑥𝑖), Eq.
(10) from [27], extended to 10 quantities used in this work.
197

N. Marković et al. Nuclear Inst. and Methods in Physics Research, A 880 (2018) 194–200
Table 2Uncertainty budget (𝑘 = 1) for 86 400 s measurement. Total uncertainty has been estimated as the square root of the sum of quadratic components (correlations neglected – conservativeapproach).
The source of uncertainty Relativeuncertainty ofinput quantity,𝑢 (𝑥𝑖)∕𝑥𝑖 (%)
Relativesensitivity factor,|
|
|
𝜕𝑓𝜕𝑥𝑖
|
|
|
( 𝑥𝑖𝑦)
Relative uncertaintyof output quantity,𝑢𝑖 (𝑦)∕𝑦 (%)
EGSnrc model 𝑍1 0.50 0.50 0.25 0.35𝑍2 0.50 0.50 0.25
Counting statistics in singlescount rate
𝑁1 0.20 0.73 0.15 0.22𝑁2 0.20 0.79 0.16
Counting statistics in energygated coincidence count rate
𝑁3 0.80 0.50 0.40 0.64𝑁4 0.99 0.50 0.50
Counting statistics in coincidencecount rate
𝑁5 0.30 0.27 0.08 0.11𝑁6 0.35 0.21 0.07
Difference between the twosolutions (Eqs. (5a) and (5b))
𝑁01-𝑁02
0.42 1 0.42 0.42
Uncertainty in nuclear data 𝑋2 0.50 1 0.50 1.04𝑋γ 0.90 1 0.90
Total uncertainty, 𝑢𝑐 (𝑦)∕𝑦 (%) 1.4
Fig. 6. 125I point source spectra. Single detector spectrum (black), coincidence spectrum(red) and energy gated coincidence spectrum (blue). (For interpretation of the referencesto colour in this figure legend, the reader is referred to the web version of this article.)
parameters, and presented in a way similar that in [15], is given inTable 2; note that here sources of uncertainty are divided into six groups.Relative uncertainty of the MCs model used for the determination ofparameters 𝑧1 and 𝑧2 is lower than the relative uncertainty of nucleardata. It was therefore considered pointless to attempt further refinementof that part. The main uncertainty contributions are coming from theuncertainties in energy gated coincidence count rates because of thelow probability for detection of 𝛾-ray and K𝛽 X-ray in two detectors anduncertainties in nuclear data.
The use of both K𝛼 and K𝛽 X-rays in energy gated coincidence modesignificantly improves counting statistics but introduces additional un-certainty in the final result that is harder to account for. Reasoning forthis involves not only complicated peak area determination for K𝛼 X-rays, but also harder relaying on the assumption of equivalence betweenefficiencies on different energies, Eqs. (4a) or (4b); the result is anextension to over almost twice the energy range when compared to usingonly K𝛽 X-rays. If the source activity is high enough we thus recommendusing only K𝛽 X-rays since this introduces less error. If both K𝛼 and K𝛽X-rays are going to be used 𝑋2 needs to be changed to 𝑋1 in Eq. (5).
4.2. Full energy peak efficiency
Calculation of the FEP efficiency on detector 1 using Eq. (8) and𝑧 = 0.9870 from MC simulation, results in a value of (0.3276 ± 0.0033)
counts/photon. The value obtained by dividing the count rate undergamma peak with the calculated photon flux is (0.2448 ± 0.0033)counts/photon. With the help of EFFTRAN code [28,29] the secondvalue is corrected for X-𝛾 coincidence summing with correction factorof a 1.331 using all sample and detector parameters (distance towindow, absorbers and with dead layer set to zero) as in the originalmeasurement. The resulting value after the correction becomes 0.33counts/photon, proving the EFFTRAN can be used for TCS with 125I.
Now the calculated FEP efficiencies (TCS corrected and uncorrectedvalue) can be used for fine adjustment of the geometry parametersin MC simulation, by minimising the value of difference between theexperimental and simulated quantities:
𝜎 =√
(𝜀noTCS(sim) − 𝜀noTCS(exp))2 + (𝜀TCS(sim) − 𝜀TCS(exp))2
Dead layer thickness was altered to account for different crystal towindow distances. The final value obtained by this procedure is 𝜎 =0.0035; that is considered within the uncertainty bounds of calculatedefficiencies (for dead layer thickness 0.9 μm and window to crystaldistance 5.5 mm). Comparison of measured and simulated spectradisplay very good agreement, not only for the main peaks but alsofor sum and X-ray escape peaks, Fig. 3. Dead layer thickness is animportant parameter of MC simulations of low-energy detectors as itplays a significant role in TCS correction of X-ray-𝛾 summing. Themodel is only a representation of the detector with best agreement tothe experimental measurements. This is not necessary the reality, asthe dead layer thickness is probably non-uniform [30]; here uniformthickness representation was used.
4.3. Effects of geometry and absorbers
Comparison of the results with point sources (from the second batch)is shown in Fig. 7. All the measurements were undertaken using an18 000 s counting time. Point sources had different 125I activities, withsolution mass being proportional to the source activity; the higheractivity of the source gives better counting statistics and thus loweruncertainties (at least in activity ranges presented here). The highestactivity was around 250 Bq at the time of measurement, giving adetector dead time of less than 0.1%.
Fig. 8 illustrates a set of measurements with different detector–detector distances and three absorbers (0.75 mm Al absorber on oneside, 1.45 mm Al absorber on one side and on both sides of the pointsource). The figure also shows normalised activities relative to theweighted mean of all measurements at different window to windowdistances (distance between the two HPGe detectors). When detectorsare closer count rates are higher giving lower uncertainties. Table 3
198

N. Marković et al. Nuclear Inst. and Methods in Physics Research, A 880 (2018) 194–200
Fig. 7. Relative 125I massic activities for different amounts of radioactive 125I solution.Weighted mean value of the massic activities (Bq/kg) calculated for the four samples wasused in the denominator to determine the relative massic activity. Vertical bars representstandard uncertainties (𝑘 = 1).
Fig. 8. Relative 125I activities of a point source measured at different window to windowdistances (black) and with different Al absorbers (red). Vertical bars represent standarduncertainties (𝑘 = 1). (For interpretation of the references to colour in this figure legend,the reader is referred to the web version of this article.)
Table 3Attenuation factor of 125I photons in aluminium calculated by XCOM and using EGSnrcmodel of the detector.
Al thickness (mm) XCOM EGSnrc
I/I0 (K𝛽) I/I0 (𝛾) 𝑧 𝑧
0 1 1 1 0.98700.75 0.8304 0.8748 0.95 0.90511.45 0.6982 0.7721 0.90 0.8403
shows attenuation factors for K𝛽 X-ray and 𝛾-ray of 125I (31.2 keV and35.5 keV photon energies are compared) for two different Al thicknessescalculated using XCOM [31] and EGSnrc simulation. In the first casea simple ratio of I/I0(K𝛽 ) over I/I0(𝛾) was obtained from XCOMcalculations and used to estimate 𝑧; this led to an underestimation of thedifferences in attenuation, considering that on average path lengths aregreater than absorber thickness. An additional factor for considerationis the difference in photon attenuation in detectors dead layer, windowand air (visible for zero absorber thickness).
Table 4Comparison of two different photon–photon coincidence counting methods for standardis-ation of 125I activity. Measurement time is 18 000 s for both. Standard uncertainties (𝑘 = 1).
Method Activity (Bq)
Coincidence with HPGe detectors [Eq. (6)] 298.4 ± 6.5Coincidence with NaI detectors [6] 300.0 ± 1.3
Fig. 9. 125I gamma spectra measured by HPGe detector (black) and NaI(Tl) detector(red). Coincidence spectrum on NaI(Tl) detector is shown in blue. Low-level discriminatoron both detectors is above XL-rays so those are not visible. (For interpretation of thereferences to colour in this figure legend, the reader is referred to the web version of thisarticle.)
4.4. Comparison to photon–photon coincidence with two NaI(Tl) detectors
In comparison with photon–photon coincidence counting measure-ments using two NaI(Tl) detectors the new method gives much higheruncertainties (Table 4). This is due to the fact that in the spectraobtained using NaI detectors all the lines are summed so the relativeuncertainty of each input parameter is lower, and there are fewer inputparameters for the same reason. Also when taking the energy gatedcoincidence spectrum, the additional energy condition significantly re-duces the probability for coincidence events thus reducing the statistics.When applied to a pure 125I source standardisation, photon – photoncoincidence counting significantly outperforms the method proposedin this work, but it fails in the presence of impurities or mixture ofradionuclides due to the poor energy resolution of NaI(Tl) detector (Fig.9) and the need for total efficiency measurement.
Table 4 Comparison of two different photon – photon coincidencecounting methods for standardisation of 125I activity. Measurement timeis 18 000 s for both. Standard uncertainties (𝑘 = 1).
5. Conclusion
When formulating this methodology the motivation was to developa counterpart to the well-established NaI–NaI source standardisationmethod that would work with the HPGe coincidence system. Themethod displays some promising characteristics, such as good energyresolution enabling source standardisation measurement even in thepresence of other radionuclides or impurities. Producing the most accu-rate, precise and time effective/fastest source standardisation methodwas not the aim of this research. X-ray-(X-ray, gamma) coincidencecounting method with two NaI detectors provides sufficient perfor-mance with a much simpler and cheaper detector system. Total un-certainty of the newly developed coincidence method for HPGe–HPGesystem is around 1.5% compared to 0.3% for NaI–NaI method.
Low photon energies such as from 125I are not routinely includedin standard multi-gamma calibration solutions. Occasionally it mightbe considered useful to be able to perform an activity standardisation
199

N. Marković et al. Nuclear Inst. and Methods in Physics Research, A 880 (2018) 194–200
measurement and extend the efficiency curve of the detector systemtowards lower energies. The efficiency calibration of HPGe coincidencesystems is very sensitive so this method (or equivalents for othernuclides) could therefore be used for calibration of such systems. Inaddition, it should be possible to extend the method to include othercascade emitting nuclides, expanding the applicability of HPGe–HPGecoincidence systems not only for low-level measurements (for which ithas already been used), but also into the field of activity standardisationor absolute activity measurements.
Acknowledgements
The authors wish to acknowledge Henrik Prip from the Hevesylaboratory, DTU Nutech, for providing and installing of the shieldsystem for NaI(Tl) detectors. Prof. Mikael Jensen is acknowledged forconstructive comments at the early stage of the project and for placinga NaI(Tl) detector at our disposal.
Warren Thompson is acknowledged for proof-reading the manuscript.
References
[1] R. Britton, A.V. Davies, J.L. Burnett, M.J. Jackson, A high-efficiency HPGe coinci-dence system for environmental analysis, J. Environ. Radioact. 146 (2015) 1–5.
[2] H. Paradis, A. de V. Ott, X. Cagant, F. Piquemal, R. Gurriaran, Leda: A gamma-gamma coincidence spectrometer for the measurement of environment samples,Appl. Radiat. Isot. (2016).
[3] J.S.E. Wieslander, M. Hult, J. Gasparro, G. Marissens, M. Misiaszek, W. Preusse, Thesandwich spectrometer for ultra low-level 𝛾-ray spectrometry, Appl. Radiat. Isot. 67(2009) 731–735.
[4] G. Lutter, M. Hult, G. Marissens, E. Andreotti, U. Rosengård, M. Misiaszek, A.Yüksel, N. Sahin, A new versatile underground gamma-ray spectrometry system,Appl. Radiat. Isot. 81 (2013) 81–86.
[5] L. Erikson, M. Keillor, C. Aalseth, T. Hossbach, L. Mizouni, T. Stavenger, B.S.McDonald, E. Lepel, L. Greenwood, C. Rutherford, Determining hpge total detectionefficiency using 𝛾-𝛾 coincidence, J. Radioanal. Nucl. Chem. 296 (2013) 705–710.
[6] S. Pommé, T. Altzitzoglou, R. Van Ammel, G. Sibbens, Standardisation of 125I usingseven techniques for radioactivity measurement, Nucl. Instrum. Methods Phys. Res.A 544 (2005) 584–592.
[7] S. Pommé, Methods for primary standardization of activity, Metrologia 44 (2007)S17–S26.
[8] R.H. Martin, J.G.V. Taylor, The standardization of 125I : A comparison of threemethods, Nucl. Instrum. Methods Phys. Res. A 312 (1992) 64–66.
[9] P. Marsoem, G. Wurdiyanto, H. Candra, Standardization of 125I and 109Cd by thephoton–photon coincidence method in PTKMR-BATAN, Appl. Radiat. Isot. 70 (2012)2060–2062.
[10] A. Iwahara, M.H.H. Marechal, C.J. Da Silva, R. Poledna, Determination of the activityconcentration of a 125I solution by X-(X, 𝛾) coincidence counting and an efficiencyextrapolation curve, Nucl. Instrum. Methods Phys. Res. A 286 (1990) 370–374.
[11] H. Schrader, Photon–photon coincidences for activity determination: I-125 and otherradionuclides, Appl. Radiat. Isot. 64 (2006) 1179–1185.
[12] M.C. Yuan, W.S. Hwang, The absolute counting of 125I, Appl. Radiat. Isot. 52 (2000)523–526.
[13] P. Marsoem, G. Wurdiyanto, H. Candra, H. Saibatulham, Direct measurement of60Co and 125I activity by the sum-peak method in PTKMR-BATAN, Appl. Radiat.Isot. 87 (2014) 200–202.
[14] J.G.V. Taylor, X-ray–X-ray coincidence counting methods for the standardization of125I and 197Hg in Standardization of Radionuclides, IAEA, Vienna, 1967.
[15] P. Volkovitsky, Absolute 60Co characterization based on gamma-gamma coincidentdetection by two NaI(Tl) detectors, Nucl. Instrum. Methods Phys. Res. A 607 (2009)568–572.
[16] J.S. Eldridge, P. Crowther, Absolute determination of I125 in clinical applications,Nucleonics 22 (1964) 56.
[17] R.P. Oderkerk, G.A. Brinkman, The applicability of the sum-peak to extendedsources, Appl. Radiat. Isot. 41 (1990) 169–171.
[18] T. Vidmar, K. Kossert, O.J. Nähle, O. Ott, Application of the sum-peak method toactivity standardizations of extended 60Co sources, Appl. Radiat. Isot. 67 (2009)160–163.
[19] LNHB, CEA, Table of Radionuclides, (2017). http://www.nucleide.org/DDEP_WG/DDEPdata.htm.
[20] N. Marković, P. Roos, S.P. Nielsen, Digital gamma-gamma coincidence HPGe systemfor environmental analysis, Appl. Radiat. Isot. (2017). http://dx.doi.org/10.1016/j.apradiso.2016.12.017.
[21] Particle counting in radioactivity measurements, ICRU Report 52, Maryland, USA,1994.
[22] I. Kawrakow, E. Mainegra-Hing, D.W.O. Rogers, F. Tessier, B.R.B. Walters, TheEGSnrc code system: Monte Carlo simulation of electron and photon transport,Ottawa, Canda, 2017.
[23] G. Lutter, M. Hult, F. Tzika, H. Stroh, G. Marissen, Gamma-ray spectrometry analysissoftware environment, Appl. Radiat. Isot. (2017).
[24] W.R. Leo, Techniques for Nuclear and Particle Physics Experiments, second ed.,Springer-Verlag, 1994.
[25] Canberra, GenieTM 2000 Spectroscopy Software Customization Tools Manual,(2013).
[26] Canberra, Model S506 Interactive Peak Fit User’s Manual, 2009.[27] Joint Committee For Guides In Metrology, Evaluation of measurement data —
Guide to the expression of uncertainty in measurement, JCGM 100:2008, 2008,http://www.bipm.org/en/publications/guides/gum.html.
[28] M. Bruggeman, T. Vidmar, F. Amouriq, L. Verheyen, Efficiency calibration of BEGeand extended range detectors, Appl. Radiat. Isot. 87 (2014) 356–360.
[29] T. Vidmar, G. Kanisch, G. Vidmar, Calculation of true coincidence summing correc-tions for extended sources with EFFTRAN, Appl. Radiat. Isot. 69 (2011) 908–911.
[30] E. Andreotti, M. Hult, G. Marissens, G. Lutter, A. Garfagnini, S. Hemmer, K. vonSturm, Determination of dead-layer variation in HPGe detectors, Appl. Radiat. Isot.87 (2014) 331–335.
[31] M.J. Berger, J.H. Hubbell, S.M. Seltzer, J. Chang, J.S. Coursey, R. Sukumar, D.S.Zucker, K. Olsen, XCOM: Photon Cross Sections Database, NIST Standard Refer-ence Database (XGAM), (2010). http://physics.nist.gov/xcom (accessed October 20,2017).
200