cognitive constraint in using learning portals: investigating its effects in oncourse cl ·...
TRANSCRIPT
COGNITIVE CONSTRAINTS ON USING COLLABORATIVE LEARNING
PORTALS: INVESTIGATING THEIR EFFECTS IN ONCOURSE CL
Piyanaat Taksaphan
Submitted to the faculty of the School of Informatics in partial fulfillment of the requirements
for the degree Master of Science, Indiana University
August 2006
Accepted by the Faculty of Indiana University, in partial fulfillment of the requirements for the degree of Master of Science
in Human-Computer Interaction.
Master’s Thesis Committee
________________________________________ Karl F. MacDorman, Ph.D., Chair
________________________________________ Anthony Faiola, Ph.D.
________________________________________ Joseph Defazio, Ph.D. (ABD)
ii

© 2006
Piyanaat Taksaphan
ALL RIGHTS RESERVED
iii
Dedicated to my dad.
iv
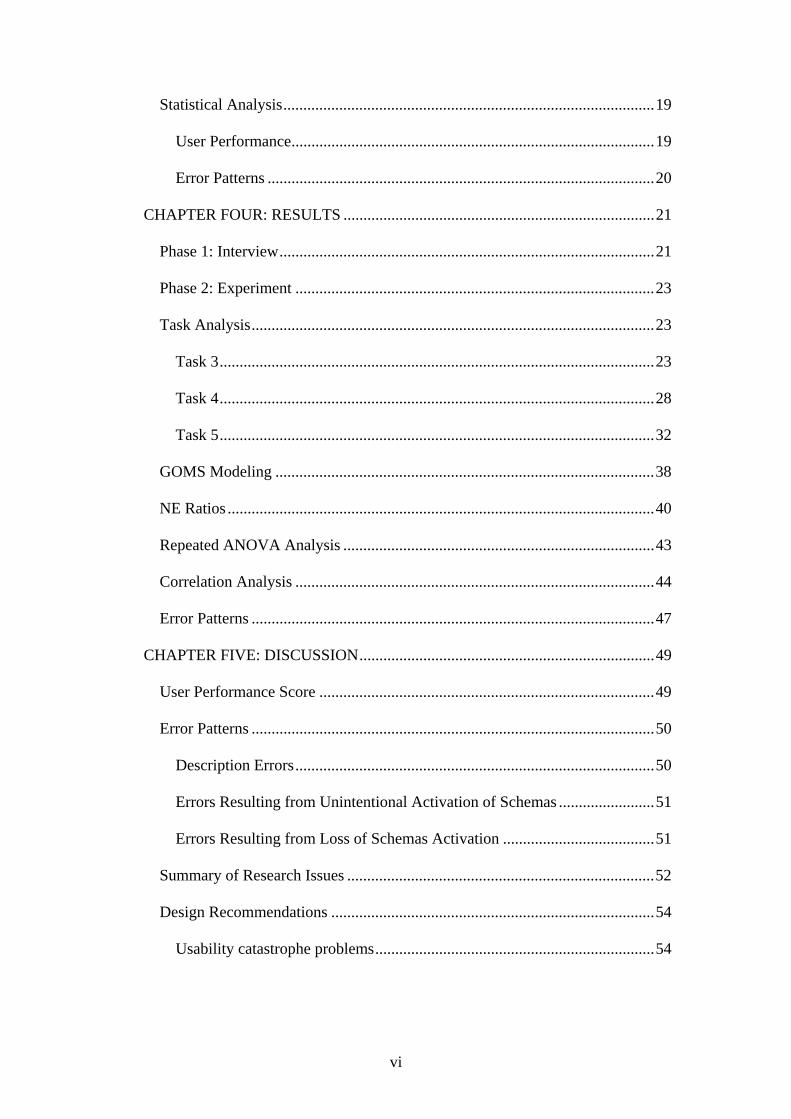
TABLE OF CONTENTS
Page
LIST OF TABLES .............................................................................................VIII
LIST OF FIGURES ..............................................................................................IX
ACKNOWLEDGMENTS ....................................................................................XI
ABSTRACT......................................................................................................... XII
CHAPTER ONE: INTRODUCTION & BACKGROUND ....................................1
Introduction to Collaborative Learning Portals ...................................................1
Importance of Collaborative Learning Portals.....................................................1
CHAPTER TWO: LITERATURE REVIEW..........................................................3
Online Collaborative Learning and the Sakai Project..........................................3
Portal Interface Usability .....................................................................................4
Cognitive Limitation in Cyberspace ....................................................................4
Knowledge Gap .................................................................................................10
Research Questions and Hypotheses .................................................................10
CHAPTER THREE: METHODOLOGY ..............................................................12
Cognitive Modeling Technique .........................................................................12
A Revision of the Novice-Expert ratio Method.............................................12
KLM-GOMS..................................................................................................13
Software Tools ...................................................................................................14
Samples and Participants ...................................................................................15
Procedures..........................................................................................................16
Phase 1: Interview..........................................................................................16
Phase 2: Experiment ......................................................................................17
v
Statistical Analysis.............................................................................................19
User Performance...........................................................................................19
Error Patterns .................................................................................................20
CHAPTER FOUR: RESULTS ..............................................................................21
Phase 1: Interview..............................................................................................21
Phase 2: Experiment ..........................................................................................23
Task Analysis.....................................................................................................23
Task 3.............................................................................................................23
Task 4.............................................................................................................28
Task 5.............................................................................................................32
GOMS Modeling ...............................................................................................38
NE Ratios ...........................................................................................................40
Repeated ANOVA Analysis ..............................................................................43
Correlation Analysis ..........................................................................................44
Error Patterns .....................................................................................................47
CHAPTER FIVE: DISCUSSION..........................................................................49
User Performance Score ....................................................................................49
Error Patterns .....................................................................................................50
Description Errors..........................................................................................50
Errors Resulting from Unintentional Activation of Schemas ........................51
Errors Resulting from Loss of Schemas Activation ......................................51
Summary of Research Issues .............................................................................52
Design Recommendations .................................................................................54
Usability catastrophe problems......................................................................54
vi
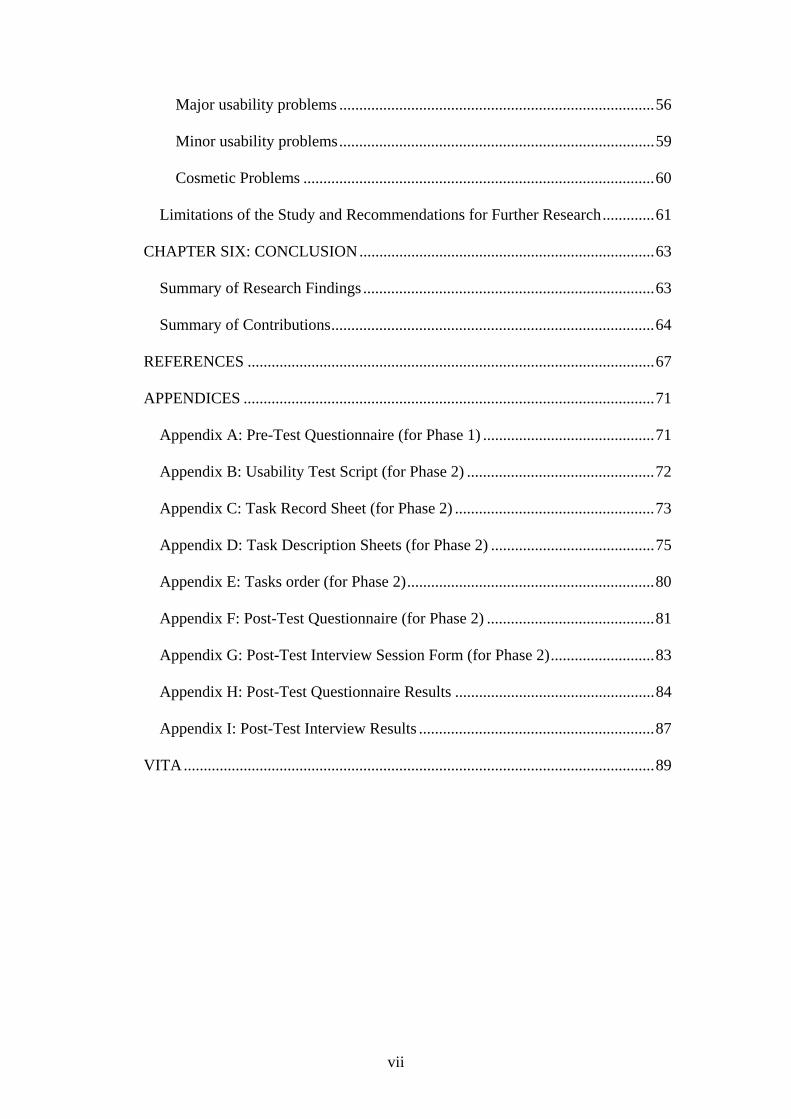
Major usability problems ...............................................................................56
Minor usability problems...............................................................................59
Cosmetic Problems ........................................................................................60
Limitations of the Study and Recommendations for Further Research.............61
CHAPTER SIX: CONCLUSION..........................................................................63
Summary of Research Findings .........................................................................63
Summary of Contributions.................................................................................64
REFERENCES ......................................................................................................67
APPENDICES .......................................................................................................71
Appendix A: Pre-Test Questionnaire (for Phase 1) ...........................................71
Appendix B: Usability Test Script (for Phase 2) ...............................................72
Appendix C: Task Record Sheet (for Phase 2) ..................................................73
Appendix D: Task Description Sheets (for Phase 2) .........................................75
Appendix E: Tasks order (for Phase 2)..............................................................80
Appendix F: Post-Test Questionnaire (for Phase 2) ..........................................81
Appendix G: Post-Test Interview Session Form (for Phase 2)..........................83
Appendix H: Post-Test Questionnaire Results ..................................................84
Appendix I: Post-Test Interview Results ...........................................................87
VITA......................................................................................................................89
vii
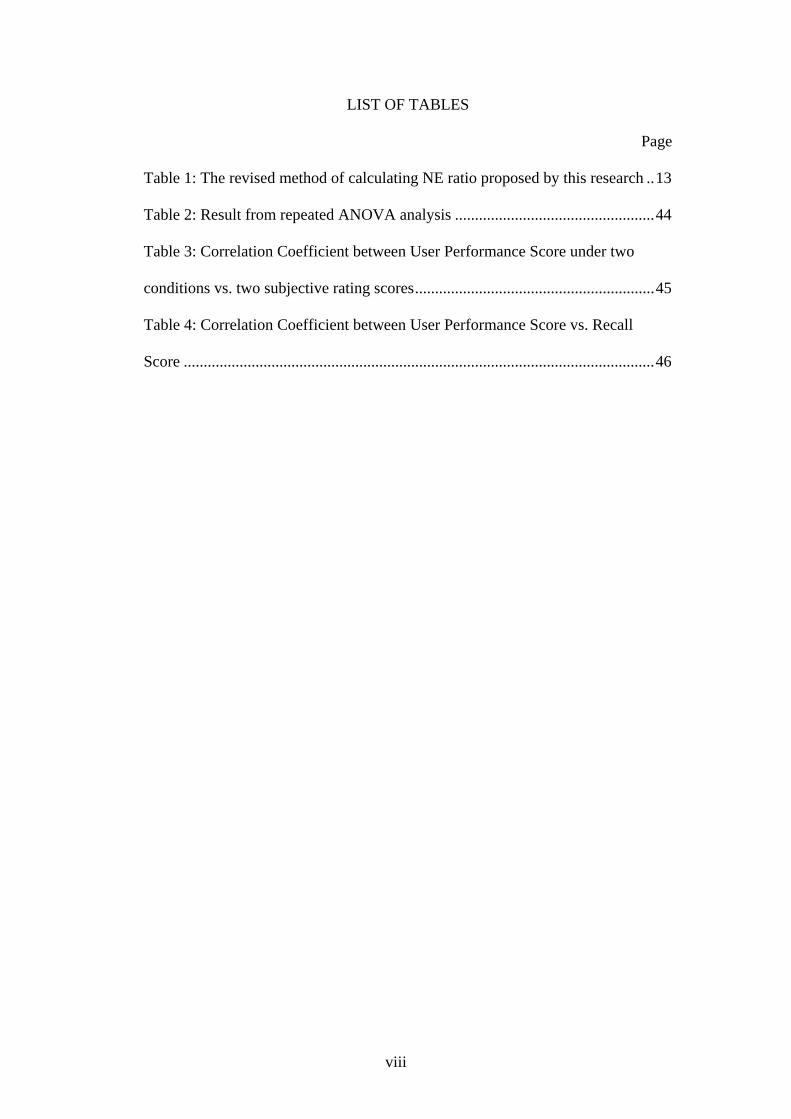
LIST OF TABLES
Page
Table 1: The revised method of calculating NE ratio proposed by this research ..13
Table 2: Result from repeated ANOVA analysis ..................................................44
Table 3: Correlation Coefficient between User Performance Score under two
conditions vs. two subjective rating scores............................................................45
Table 4: Correlation Coefficient between User Performance Score vs. Recall
Score ......................................................................................................................46
viii
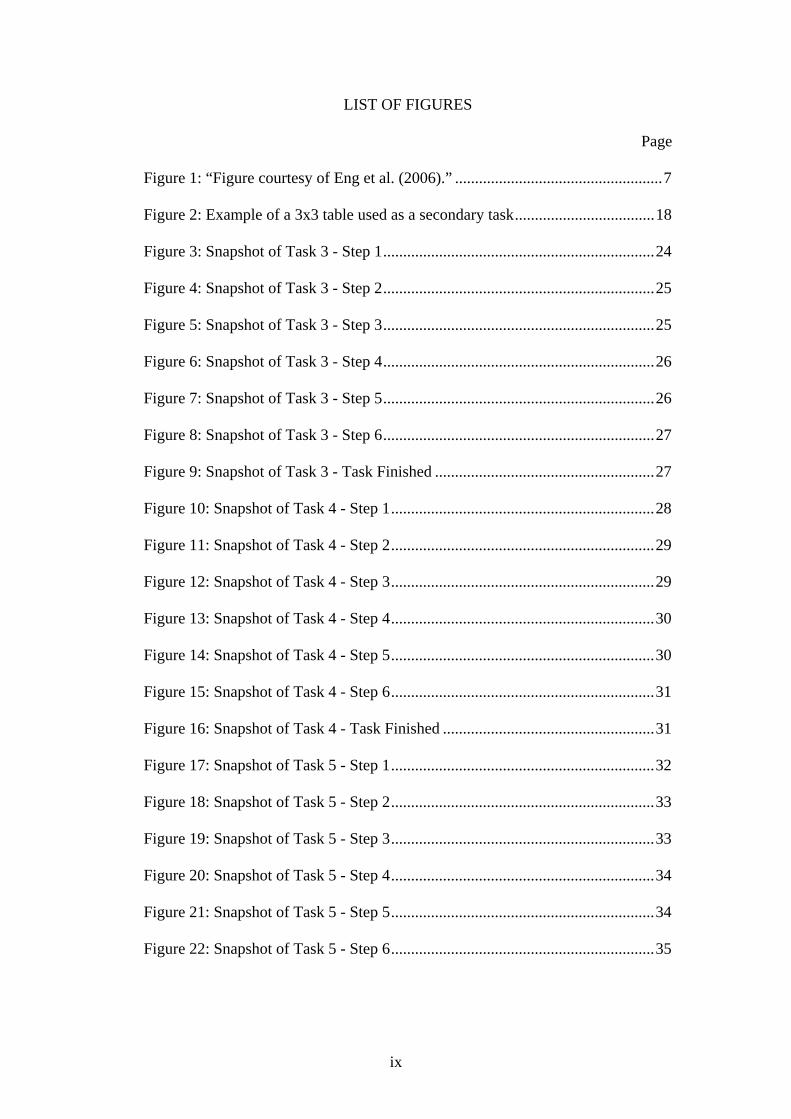
LIST OF FIGURES
Page
Figure 1: “Figure courtesy of Eng et al. (2006).” ....................................................7
Figure 2: Example of a 3x3 table used as a secondary task...................................18
Figure 3: Snapshot of Task 3 - Step 1....................................................................24
Figure 4: Snapshot of Task 3 - Step 2....................................................................25
Figure 5: Snapshot of Task 3 - Step 3....................................................................25
Figure 6: Snapshot of Task 3 - Step 4....................................................................26
Figure 7: Snapshot of Task 3 - Step 5....................................................................26
Figure 8: Snapshot of Task 3 - Step 6....................................................................27
Figure 9: Snapshot of Task 3 - Task Finished .......................................................27
Figure 10: Snapshot of Task 4 - Step 1..................................................................28
Figure 11: Snapshot of Task 4 - Step 2..................................................................29
Figure 12: Snapshot of Task 4 - Step 3..................................................................29
Figure 13: Snapshot of Task 4 - Step 4..................................................................30
Figure 14: Snapshot of Task 4 - Step 5..................................................................30
Figure 15: Snapshot of Task 4 - Step 6..................................................................31
Figure 16: Snapshot of Task 4 - Task Finished .....................................................31
Figure 17: Snapshot of Task 5 - Step 1..................................................................32
Figure 18: Snapshot of Task 5 - Step 2..................................................................33
Figure 19: Snapshot of Task 5 - Step 3..................................................................33
Figure 20: Snapshot of Task 5 - Step 4..................................................................34
Figure 21: Snapshot of Task 5 - Step 5..................................................................34
Figure 22: Snapshot of Task 5 - Step 6..................................................................35
ix

Figure 23: Snapshot of Task 5 - Step 7..................................................................35
Figure 24: Snapshot of Task 5 - Step 8..................................................................36
Figure 25: Snapshot of Task 5 - Step 9..................................................................36
Figure 26: Snapshot of Task 5 - Step 10................................................................37
Figure 27: Snapshot of Task 5 – Task Finished.....................................................37
Figure 28: Storyboard ............................................................................................38
Figure 29: Expert's time-on-task of Task 3............................................................39
Figure 30: Expert's time-on-task of Task 4............................................................39
Figure 31: Expert's time-on-task of Task 5............................................................40
Figure 32: NE Ratios of Task 3 (download file)....................................................41
Figure 33: NE Ratios of Task 4 (move file) ..........................................................42
Figure 34: NE Ratios of Task 5 (create folder and upload file).............................43
Figure 35: Scatter Plot of the User Performance Score vs. "It is easy to get lost."45
Figure 36: Scatter Plot of the User Performance Score vs. "I always know where I
am in OnCourse."...................................................................................................46
Figure 37: Scatter Plot of the User Performance Score vs. Recall Score ..............47
x
ACKNOWLEDGMENTS
I would like to thank Dr. Karl MacDorman and Dr. Anthony Faiola who
supervised my research and provided me with valuable comments on earlier
versions of this thesis. I would also like to express my gratitude to the other
member of my thesis committee: Dr. Joe Defazio. The comments and guidance of
my committee have been most helpful.
I would like to express my sincere appreciation to Haruhiko Urokohara for
his efforts in elucidating the Novice-Expert ratio Method. His untiring support has
made a deep impression on me.
Finally, my family deserves much gratitude. Without their encouragement,
it would have been impossible for me to finish this work.
xi
ABSTRACT
Piyanaat Taksaphan
COGNITIVE CONSTRAINTS ON USING COLLABORATIVE LEARNING
PORTALS: INVESTIGATING THEIR EFFECTS IN ONCOURSE CL
Collaborative learning portals help teachers and students attain
educational objectives (Ursula et al., 1997). They also reduce repeated requests for
the same information (Forbes-Pitt, 2002). An effective collaborative learning
portal should promote a collaborative learning environment. It is essential to
ensure the usability of learning portals.
Most researchers of interface usability conduct laboratory experiments.
Sellen and Norman (1992) pointed out that a laboratory environment is the least
likely place to see spontaneous errors. This study investigated students using a
collaborative learning portal under cognitive load. User performance with
cognitive load was found to be more highly correlated with user subjective ratings
of disorientation than was user performance without cognitive load. Three error
patterns were observed, particularly in the cognitive-load condition. These
findings indicate the importance of using cognitive load to simulate a user’s level
of distraction when conducting a usability evaluation. Finally, this study proposed
revising the Novice-Expert Ratio Method (NEM).
xii
CHAPTER ONE: INTRODUCTION & BACKGROUND
Introduction to Collaborative Learning Portals
Recent educational research has emphasized the benefits of collaborative
learning (CL). Previous research on the positive effects of collaborative learning
on student achievement has led to the development of Computer-Supported
Collaborative Learning (CSCL) (Margaret, 1997). Collaborative learning portals
are among the most effective CSCL tools by allowing students and instructors to
share information (Margaret, 1997). Collaborative learning portals help teachers
and students attain their educational objectives, since the responsibility for
learning, teamwork, and time management are explicitly placed with the students
while teachers can provide better coverage of the material (Ursula et al., 1997).
Economic considerations also stimulate the use of collaborative learning portals
by diminishing the need for campus group meeting rooms. It is possible for
students to work when and where they like (Ursula et al., 1997). Moreover,
collaborative learning portals eliminate duplication of efforts in the technology
infrastructure and reduce repeated requests for the same information (Forbes-Pitt,
2002).
Importance of Collaborative Learning Portals
The interface usability of the learning portal is a factor in the success of a
collaborative learning environment. If the interface is frustrating and cumbersome
to use, students and instructors will simply refuse to use it. Instructors spend
significant time and energy preparing class materials, answering questions,
1
providing feedback, and marking assignments. Similarly, students must plan their
schedules and work to turn in their reports on time. Students must be able to
exchange ideas easily and quickly. This shows the importance of having a user-
friendly collaborative tool. Because the purpose of a collaborative learning portal
is to help promote a collaborative learning environment, it is essential to ensure
that the portal itself helps reduce, or at least does not add to, the time and energy
demands on students and instructors.
This study investigates the ways in which measuring user performance
under cognitive load is a more accurate way of evaluating the performance of
novice OnCourse CL users, and how cognitive load influences the error patterns
of novice OnCourse CL users. This study also provides designers of learning
portal with design recommendations.
2
CHAPTER TWO: LITERATURE REVIEW
Online Collaborative Learning and the Sakai Project
A portal is a categorized and personalized gateway that provides
information, resources, and services. Each portal page consists of window-like
areas called “portlets” or “modules” containing related information. The purpose
of a portal is to collect information from disparate sources and create a single
point of access to that information (Strauss, 2003; Waloszek, 2001). By
integrating services and presenting portlets on the initial screen, portals reduce the
need to navigate (Nielsen, 1999).
Collaborative learning (CL) takes place when students work together in
small, heterogeneous groups to achieve a common academic goal, such as the
completion of an assignment or a project (Ursula et al., 1997). At Indiana
University Purdue University Indianapolis (IUPUI), the OnCourse CL portal is a
new online collaborative learning environment. Indiana University is one of four
founders of the Sakai community. The Sakai community was established when the
University of Michigan and Indiana University independently began open source
efforts to replicate and enhance the functionality of their course management
software (CMS). Massachusetts Institute of Technology and Stanford University
soon joined. With a grant from the Mellon Foundation, they formed the Sakai
Project.1 The mission of the Sakai Project is to deliver the Sakai application
framework and its associated CMS tools and components. These components also
support collaborative research.
1 http://www.sakaiproject.org
3
Portal Interface Usability
Portals that guide users to the information they seek create a good first
impression and attract more users, unlike portals that are difficult to use (Nielsen
& Wagner, 1996). A poorly designed learning portal is a deterrent to students and
instructors since usability problems impair productivity. Nielsen (1999) suggested
a design standard for all pages on the portal. A consistent look and feel lightens
the learning burden and is easier for users to know where they are and where they
can go when navigating a large information space.
Cognitive Limitation in Cyberspace
“Cognitive load” or “mental workload” describes the resource bottleneck
of human information processing. According to Proctor and Zandt (1993),
cognitive load is the amount of mental work or effort necessary to perform a task.
A high cognitive load occurs when the difference between the total cognitive load
and the processing capacity of the working memory approaches zero. According
to Byrne and Bovair (1997), several studies have implicated overloaded working
memory in the occurrence of errors. Their experiments confirmed that post-
completion errors can be produced in a laboratory as well as a naturalistic setting.
One such type of error is leaving one’s card in the automatic teller machine after
withdrawing cash. The occurrence of this type of error depends on the level of
working memory load at the time the step is to be performed. The error is made
when the cognitive load is high, but not when the load is low (Byrne & Bovair,
1997).
4
Cognitive load theory has also been applied in the design of web-based
instruction. The goal of instructional design is to optimize cognitive load for a
particular learner. Differences in effectiveness between instructional formats are
affected by differences in memory load (Paas, Tuovinen, Tabbers, & Van Gerven,
2003). A graphical user interface and multimedia format can increase extraneous
cognitive load and limit learning. Organizing information, using consistent page
layout, and adding dual-modality elements (audio and visual) all reduce
extraneous cognitive load (Feinberg & Murphy, 2000).
As cited by Lindmark (2000), high cognitive load is one main conclusion
related to error rate. The higher the cognitive workload, the higher the frequency
of errors (Olson & Olson, 1990). Lindmark (2000) presented an analysis of
symptoms and symptomatic behaviors involved in human-computer manual input.
Description Error, Motor Error, and Context Error were some symptoms of high
cognitive load. Examples of symptomatic behaviors included Click and Reclick,
Over Scrolling, Fast Movement, and High Force. In a speech input interface, task
performance was found to change based on users’ cognitive load. Disfluencies,
intersentential pausing, fragmented sentences, and slower speech rate were found
to increase with users’ cognitive load (Müller, Großmann-Hutter, Jameson,
Rummer, & Wittig, 2001).
Limitations in working memory play an important role in the ability of
users to learn and remember the structure of a Web site. Much research has
studied the tradeoff between breadth and depth in designing a hierarchical
structure for Web sites. The main tradeoff is between scanning and page traversal
time. Larson and Czerwinski (1998) conducted an experiment with three
5
categorization structures with 512 bottom level nodes each. The three structures
were 8x8x8, 16x32, and 32x16. Each participant was asked to perform eight
searches in each structure for a total of 24 searches. Data collected were measures
of being lost, reaction times, and subjective ratings. Before the experiment,
participants were tested with the visual scanning and memory span pre-tests. The
result showed that subjects performed best with the 16x32 hierarchy and worst
with the 8x8x8 hierarchy. It was also found that the memory span scores were
slightly more correlated with subjects’ reaction time than were the visual scanning
scores.
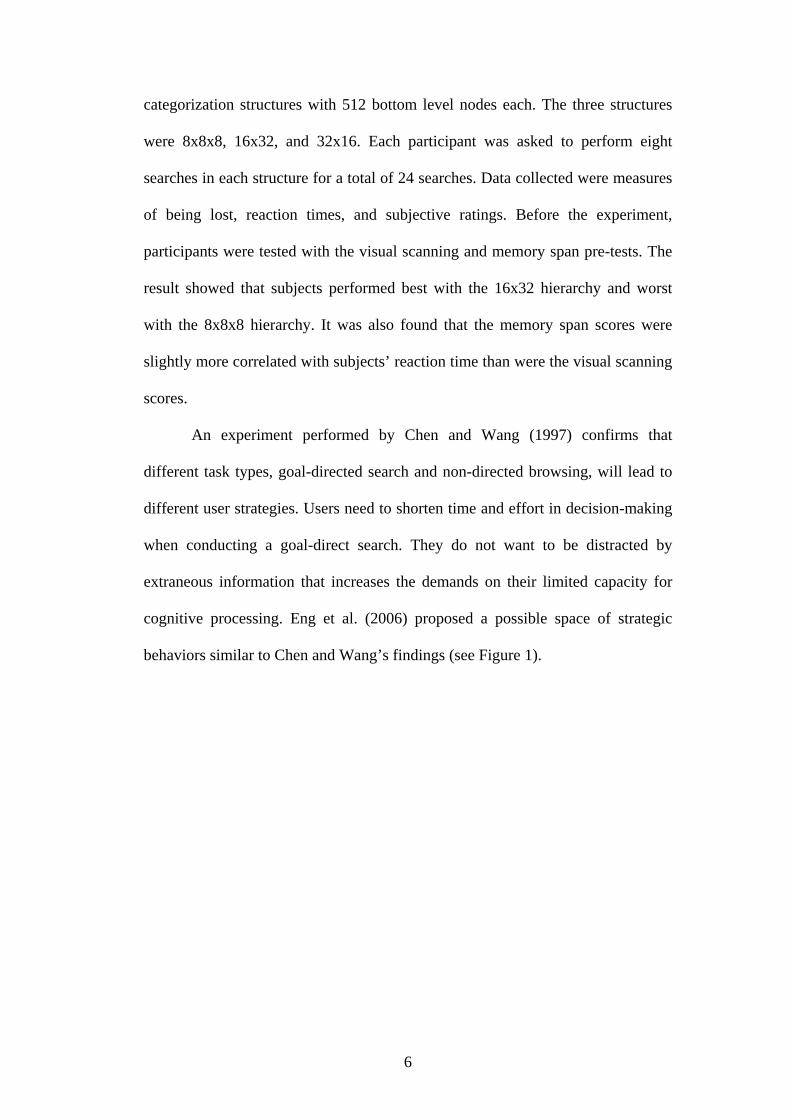
An experiment performed by Chen and Wang (1997) confirms that
different task types, goal-directed search and non-directed browsing, will lead to
different user strategies. Users need to shorten time and effort in decision-making
when conducting a goal-direct search. They do not want to be distracted by
extraneous information that increases the demands on their limited capacity for
cognitive processing. Eng et al. (2006) proposed a possible space of strategic
behaviors similar to Chen and Wang’s findings (see Figure 1).
6
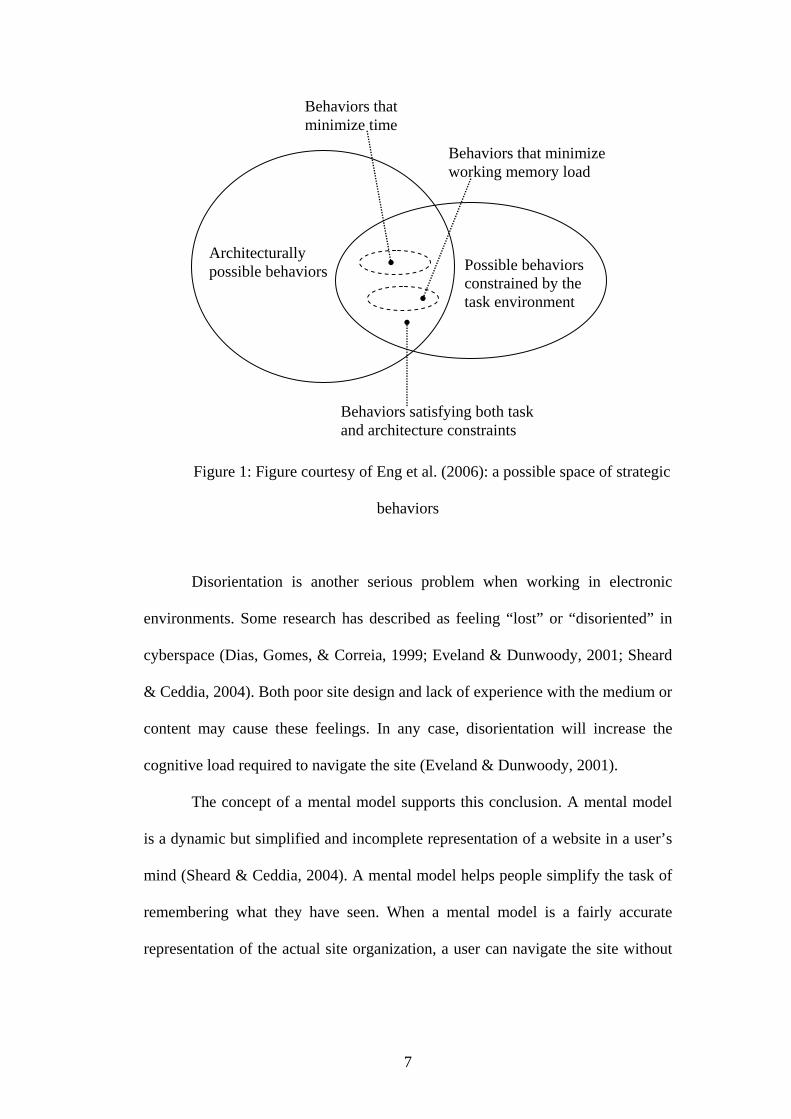
Figure 1: Figure courtesy of Eng et al. (2006): a possible space of strategic
behaviors
Disorientation is another serious problem when working in electronic
environments. Some research has described as feeling “lost” or “disoriented” in
cyberspace (Dias, Gomes, & Correia, 1999; Eveland & Dunwoody, 2001; Sheard
& Ceddia, 2004). Both poor site design and lack of experience with the medium or
content may cause these feelings. In any case, disorientation will increase the
cognitive load required to navigate the site (Eveland & Dunwoody, 2001).
The concept of a mental model supports this conclusion. A mental model
is a dynamic but simplified and incomplete representation of a website in a user’s
mind (Sheard & Ceddia, 2004). A mental model helps people simplify the task of
remembering what they have seen. When a mental model is a fairly accurate
representation of the actual site organization, a user can navigate the site without
Behaviors satisfying both task and architecture constraints
Architecturally possible behaviors
Behaviors that minimize time
Possible behaviors constrained by the task environment
Behaviors that minimize working memory load
7
much mental workload. However, when the mental model does not match the
actual site, navigation can be slow, and people can misunderstand what is and is
not included on the site because they cannot locate its content.
Zayour and Lethbridge (2000) applied cognitive analysis to identify
cognitively difficult aspects of software maintenance work. The software
maintenance work begins with understanding the maintenance request. Then, the
code relevant to the problem has to be located. Once the starting point of the
relevant code is located, the execution path is followed to identify the rest of the
code responsible for the maintenance problem. The execution tracing is then
mapped with the problem behavior. From their case study, it was found that one
activity is particularly exhausts the capacity of working memory. This referred to
the disorientation that the software engineer suffers during code exploration. The
authors explained that the disorientation occurs where the software engineer fails
to maintain a cognitive map that describes the relation between the related
artifacts he has visited during his current exploration due to the limitation of the
short-term memory. They concluded that the short-term memory overload is the
main source for cognitive difficulties including disorientation.
It should be possible to predict a user’s performance and error patterns by
comparing the user’s mental model with the system model of a website. Kellogg
and Breen (1987) claimed that user errors can be understood once a model of user
knowledge has been derived. With experience, a user’s mental model will come to
approximate the system model. Errors and difficulties in performance will result,
suggesting the need to improve system usability.
8
The work of Nakayama, Kato, and Yamane (2000) has proven the
effectiveness of this concept. They proposed a technique that revealed the gap
between Web site designers’ expectations and users’ behavior. The former were
assessed by measuring the inter-page conceptual relevance and the latter by
measuring the inter-page access co-occurrence. Under their assumption, Web
designers expect conceptually related pages to co-occur in the same visit if the site
is well designed. Thus, by plotting both data on the same graph, the gap between
designers and users is revealed.
Another example is the work of Urokohara, Tanaka, Furuta, Honda, and
Kurosu (2000), who proposed a Novice-Expert ratio Method (NEM) for
measuring user performance based on the concept of the mental model. This
method compares the time required by a novice and expert users. The rationale for
this method is that usability problems may arise from the discrepancy between the
designer’s system model and the user’s mental model. Urokohara et al. (2000)
assumed that the amount of mismatch between the system model and the user’s
model will result in a difference in the time required to complete a task.
Urokohara et al. (2000) explained that the actual value of time is not as important
in considering the time difference as is the ratio of the two time measures between
the novice user and the expert user. The time for completing the whole procedure
does not tell the analyst which parts of the interface cause usability problems and
how difficult it is for novices to perform particular steps. In contrast, the NEM
method compares novices’ and experts’ time step by step, so that the steps that
required a long time to achieve can be identified. This ratio also represents the
9
degree of difficulty of that specific procedural step. Their findings have confirmed
the usefulness of this method.
Knowledge Gap
Most studies of interface usability experiments are conducted under
laboratory conditions. This is not enough to elicit usability errors and difficulties
that users encounter in a real environment. Sellen and Norman (1992) pointed out
that a laboratory environment is the least likely place to find spontaneous, absent-
minded errors. A laboratory-setting experiment usually has participants work on
only one task at a time. In real environments, students are in a cognitively
constrained situation in which multiple tasks, interruptions, and distractions are
competing for attention and working memory. In using a learning portal, students
might be rushing to print out reading materials for class or submitting their
homework while planning their schedules.
Research Questions and Hypotheses
This study investigates how cognitive limitations affect the user. More
specifically, based on the observations of novices using the OnCourse CL portal,
this study investigates the effects of cognitive load on user performance and error
patterns.
RQ1: Do measurements of the performance of novice users of OnCourse CL,
under cognitive load, provide a better metric than those under controlled
observation and, if so, in what way are the measurements better?
10
H1: Subjective measures of disorientation correlate better with user performance
scores under cognitive load than under controlled observation.
RQ2: How does cognitive load influence the error patterns of novice users of
OnCourse CL?
RQ3: From the error patterns found in the experiment, what design
recommendations would help learning portal designers’ to create usable
learning portals?
11
CHAPTER THREE: METHODOLOGY
Cognitive Modeling Technique
The findings of the interviews and observations in Phase 1 of this study
elicit the problem of navigation through the portals. The participants often
reported that the system did not perform as expected. This interested the
researcher to compare the novice users’ time-on-task to that of the expert users.
Therefore, this research employed a user performance measurement method called
“Novice-Expert ratio Method (NEM)” proposed by Urokohara, Tanaka, Furuta,
Honda, and Kurosu (2000).
( )( )
Novice TNNE RatioExpert TE
=
)()(
SsteptaskofNumberNESstepstaskofNumber
ePerformancUser high−=
However, the original method proposed by Urokohara et al. (2000) does
not account for the data from participants who did not finish the task. Inability to
complete a task is considered a severe usability problem, so this research proposed
a revised method of calculating NE ratio and user performance.
A Revision of the Novice-Expert ratio Method
This research replaced the data of the first unfinished step by the
maximum time allowed for one step, which is 18 * expert-time-on-step. If any
steps took longer time than the maximum time, the data would also be replaced by
the maximum time. The steps following the first unfinished step were excluded
from the calculation. All incomplete steps were considered as steps with a high
12
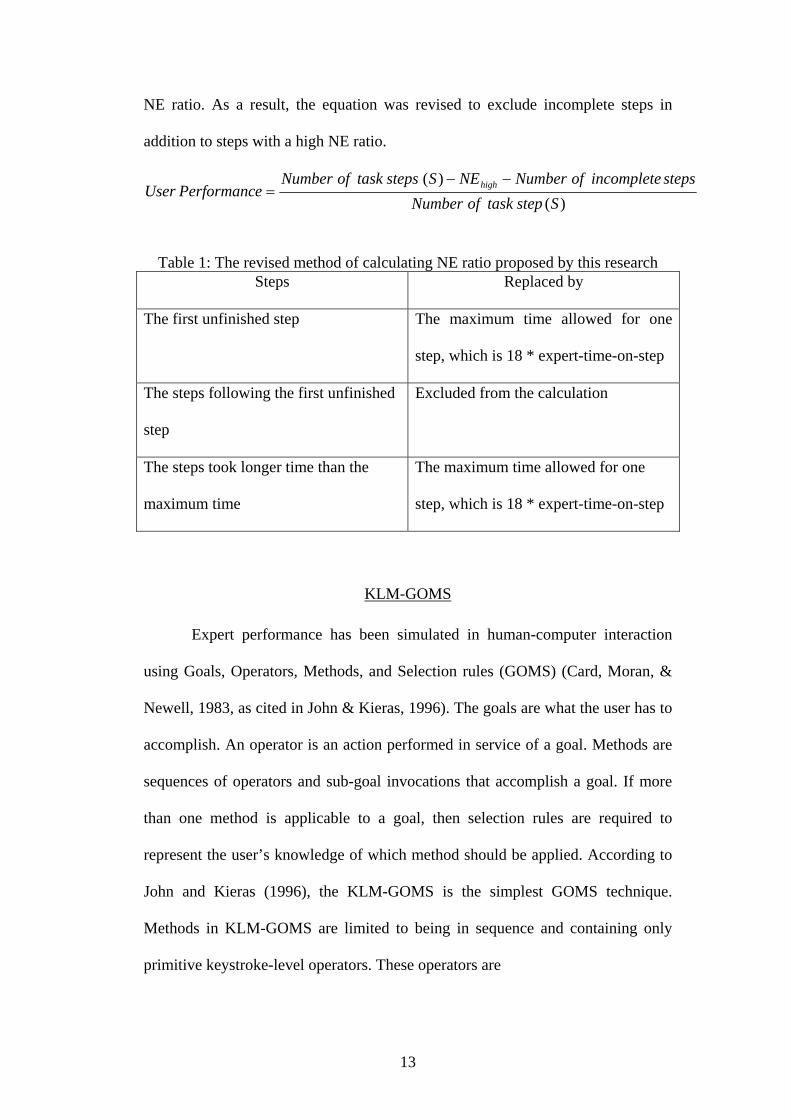
NE ratio. As a result, the equation was revised to exclude incomplete steps in
addition to steps with a high NE ratio.
)()(
SsteptaskofNumberstepsincompleteofNumberNESstepstaskofNumber
ePerformancUser high −−=
Table 1: The revised method of calculating NE ratio proposed by this research Steps Replaced by
The first unfinished step The maximum time allowed for one
step, which is 18 * expert-time-on-step
The steps following the first unfinished
step
Excluded from the calculation
The steps took longer time than the
maximum time
The maximum time allowed for one
step, which is 18 * expert-time-on-step
KLM-GOMS
Expert performance has been simulated in human-computer interaction
using Goals, Operators, Methods, and Selection rules (GOMS) (Card, Moran, &
Newell, 1983, as cited in John & Kieras, 1996). The goals are what the user has to
accomplish. An operator is an action performed in service of a goal. Methods are
sequences of operators and sub-goal invocations that accomplish a goal. If more
than one method is applicable to a goal, then selection rules are required to
represent the user’s knowledge of which method should be applied. According to
John and Kieras (1996), the KLM-GOMS is the simplest GOMS technique.
Methods in KLM-GOMS are limited to being in sequence and containing only
primitive keystroke-level operators. These operators are
13
K to press a key or button
P to point with a mouse to a target on a display
H to home hands on the keyboard or other device
D to draw a line segment on a grid
M to mentally prepare to perform an action or a closely related series
of primitive actions
R to represent the system response time during which the user has to
wait for the system
KLM-GOMS was used to estimate expert performance instead of data
from actual experts because of the difficulty of finding a sufficient number of
participants with expertise in OnCourse CL and it is also hard to control the level
of expertise.
Software Tools
Participants were asked to perform tasks on OnCourse CL2 learning portal
using Internet Explorer version 6.0 on Windows XP operating system. The screen
resolution was set at 1024x768 on the 15” monitor. User activities and mouse
movements were recorded using the LogSqare3 tool. The cognitive performance
modeling tool “CogTool4” was employed to create a Keystroke-Level Model
(KLM-GOMS) of each task to estimate the amount of time that expert users
would require to complete it.
2 https://oncourse.iu.edu/portal3 http://www.mangold.de/english/logsqare.html4 http://www.cs.cmu.edu/~bej/cogtool
14

Samples and Participants
Forty-one people participated in this study; five participants in Phase 1 and
36 in Phase 2. Since the user base of the OnCourse CL portal is IUPUI students,
this study drew from this population.
For Phase 1, purposive sampling was used to ensure that participants had
sufficient portal experience. The interviewees were three undergraduate students,
one graduate student, and one IUPUI faculty member. For Phase 2, the within-
subject method was used. Participants were recruited using convenience sampling,
which means the selection was based on their availability and convenience.
Minors were excluded from the study to simplify the design.5 The participants did
not receive payment for taking part in the study.
The minimum requirement for all participants was regular computer use
and moderate Internet experience. This was defined as follows:
1. A regular computer user:
a. Is familiar with the PC or Macintosh, including mouse, keyboard,
and graphical user interface (GUI), and has at least one year of
experience
b. Knows how to use a Web browser. Has at least one year of
experience
c. Has good eyesight, at least with correction.
2. A moderate Internet user:
a. Uses the Internet at least three days per week. 5 This is justified because most learning portals are designed to be used by college students and because the study focuses on human performance, not subject variables or individual differences. No individual was excluded from participation on the basis of gender, race, color, national origin, religion, creed, disability, veteran’s status, sexual orientation, or age.
15
Procedures
There are two phases in the study. The interviews and observations in the
first phase of the study were intended to collect data on the experience of using a
collaborative learning portal OnCourse CL. The second phase consisted of
usability testing of the file system interface on OnCourse CL. The findings are
used to test the hypotheses.
Phase 1: Interview
The interviewees were three undergraduate students, one graduate student,
and one IUPUI faculty member. First, the participants were asked to fill out the
pre-test questionnaire in which they provided demographic data and described
their familiarity with computers, the Internet, and OnCourse CL. After that,
participants were interviewed about their use of OnCourse CL. The interview
findings indicated that students and faculty members commonly use the file
manager, announcements, and the assignment tool. To narrow the scope of this
research, the researcher focused on the file manager because misuse of the file
manager can have catastrophic consequences such as loss of data. OnCourse CL
has two file manager tools. The first one, “Resources,” allowed users to make
materials available online. At IUPUI, the Resources tool was also the central file
storage service for students, faculty, and staff. The other file manager tool was the
“Drop Box.” The Drop Box allowed instructors and students to create private
folders for document sharing. The Drop Box, like Resources, allowed users to
upload many types of files at a time. The Drop Box allowed nested folders.
16

Instructors could use the Drop Box tool to share private progress reports with
students. (https://oncourse.iu.edu/portal/help/main)
Phase 2: Experiment
There were 36 participants in this phase. Each participant performed
usability testing with a think-aloud protocol. Participants were asked to perform
five tasks on the OnCourse CL portal. The goal of the first two tasks was to
familiarize participants with the OnCourse CL interface. They were relatively
simple, warm-up tasks to make the participants comfortable with the system. The
remaining tasks were used to test the hypotheses, and to capture usability
problems with the Resources and Drop Box tool. (See Appendix D)
Each participant performed the same sequence of tasks twice; once with
the cognitive-load constraint, and once without. To cross balance for the effect of
learning, half of the participants started with the high cognitive load condition first
and the other half started without a cognitive load. In addition, the order of the
tasks was varied (see Appendix E).
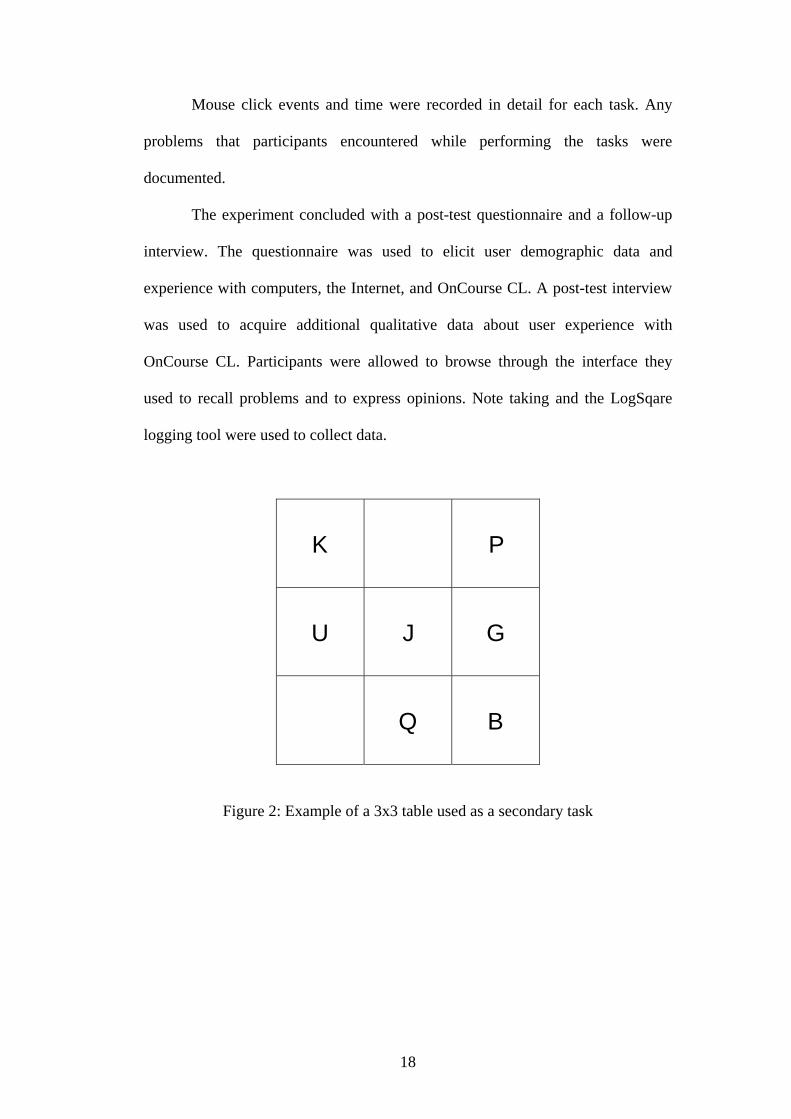
In the high cognitive-load condition, a 3x3 table randomly filled with
seven letters similar to Figure 2 was presented to the participants before the start
of each task. The participants had 30 seconds to memorize the table. They were
told that after finishing the task they would have to fill out a blank 3x3 table
exactly like the one they were being presented. While performing the task,
rehearsal was allowed as necessary.
17
Mouse click events and time were recorded in detail for each task. Any
problems that participants encountered while performing the tasks were
documented.
The experiment concluded with a post-test questionnaire and a follow-up
interview. The questionnaire was used to elicit user demographic data and
experience with computers, the Internet, and OnCourse CL. A post-test interview
was used to acquire additional qualitative data about user experience with
OnCourse CL. Participants were allowed to browse through the interface they
used to recall problems and to express opinions. Note taking and the LogSqare
logging tool were used to collect data.
K P
U J G
Q B
Figure 2: Example of a 3x3 table used as a secondary task
18
Statistical Analysis
The goal of the interview sessions in the first phase was to learn users’
attitudes, expectation, assumptions and experiences about the OnCourse CL
portal.
In the second phase, users performed usability testing tasks with the think
aloud technique. To measure user performance, users were asked to perform tasks
and the test was timed. The independent variable in this study is interface design
and the dependent variables are user performance score and error patterns.
User Performance
A performance score in this experiment was calculated using the NEM
concept proposed by Urokohara et al. (2000) :
( )( )
Novice TNNE RatioExpert TE
=
The novice’s time-on-task was obtained from the experiment, whereas the
expert’s time-on-task was calculated using KLM-GOMS because it was hard to
control the level of expertise of the participants. User performance is a percentage
of operational steps with a low NE ratio. This study used the revised user
performance equation explained earlier:
)()(
SsteptaskofNumberstepsincompleteofNumberNESstepstaskofNumber
ePerformancUser high −−=
Derived from the chi-square method, an NE ratio of around 4.5 was found
to be critical in differentiating low and high NE ratios (Urokohara et al., (2000).
19
This research also used this criterion. In other words, steps that were determined
to have a high NE ratio are steps with NE ratio greater than 4.5.
Error Patterns
Errors were compared to and classified according to the categorization of
slips proposed by Norman (1981) as cited in Lindmark (2000). These categories
are
• Errors in the formation of intention
o Context errors
o Description errors
• Errors resulting from a faulty activation of the action schemas
o Unintentional activation
o Loss of activation
• Errors that result from faulty triggering
20
CHAPTER FOUR: RESULTS
Phase 1: Interview
The time periods in using OnCourse CL ranged from 3 to 15 minutes for
the student participants, and 60 minutes for the faculty participant. All participants
access OnCourse CL once a day, mostly every weekday.
All of the students reported that they could not choose whether or not to
use OnCourse because it was the instructor’s decision. The students were asked
how they use OnCourse CL. The students use between three and five tools. The
most commonly used tool is the Announcements. Students reported that they
check the Announcements before class and before downloading assignments. The
use of other tools depends on the course. Some courses require students to submit
weekly assignments using the Assignments tool, whereas other courses use the
Drop Box. One participant found this confusing because these functions overlap
and were used differently from course to course. Courses with weekly readings
use the Resources tool to post the readings. After listing the tools they use, the
participants were asked to use those tools as if they were in a real situation.
Using think-aloud protocol, participants reported that they were seeing an
unexpected page. Two out of five participants reported that they “get lost” while
using OnCourse CL: “I don’t know where I am,” “There is no clue.” (OnCourse
CL remembers the last page the user visits for each tool. When users navigate to
any other tool or course and go back to the previous one, they do not remember
where the last page was visited. The tool’s home page was expected. However,
21
what the participants saw was the last page visited in that tool. This might explain
why the users were confused and reported seeing an unexpected page.)
Common problems occurred when the participants were trying to go up
one level and/or go back to the top level after they navigated further from each
tool’s home page. Two participants were trying to use the browser’s back button
only to find it took them to the unexpected page. Both of them tried several times
before giving up. Encountering the same problem, another participant said, “I
forgot. The back button doesn’t work here.” The two participants who navigated
back correctly (using the up arrow in front of the panel’s name) immediately
acknowledged that they had misused the browser’s back button before but now
remembered that they had to use this up-arrow button. However, excessive hitting
of this button was observed. Participants were often unsure whether they were
already at the top level and therefore would hit the button until they saw the same
pages twice. (The up-arrow button remains active even when there is no upper-
level page. If the user is currently at the very top page, the up-arrow button will
reload this current page instead. There is a breadcrumb navigation trail telling the
users where they are, but the participants, surprisingly, did not see it.)
One participant noticed that the tools listed on the left-hand side varied
from one course to another. This participant and the faculty participant explained
that their mental model of OnCourse CL is like a tree, while the rest described a
mental model that is more similar to a matrix.
When asked about how course links on the top are sorted, only one
participant knew that they are sorted alphabetically. The other four participants
answered that they have no idea. Their guesses were, listed alphabetically,
22
randomly, and by frequency of use. All participants prefer the course links to be
grouped by semester as they were in the original version of OnCourse.
Phase 2: Experiment
To make sure that data collected under the cognitive-load condition was
valid, recall scores were used to screen out data from the participants who might
not have been trying hard enough to remember the letters while performing the
tasks. Data of the participants with recall scores of less than the mean-SD were
excluded from the NEM analysis process. This resulted in totally screening out the
data from five participants.
Task Analysis
The first step in calculating the user performance score using NEM was
defining each step of the usability testing tasks. Since the first two tasks in the
experiment were used only to familiarize participants with the interface of
OnCourse CL, these tasks will not be considered. The following section will
define and illustrate steps in completing Task 3, Task 4, and Task 5.
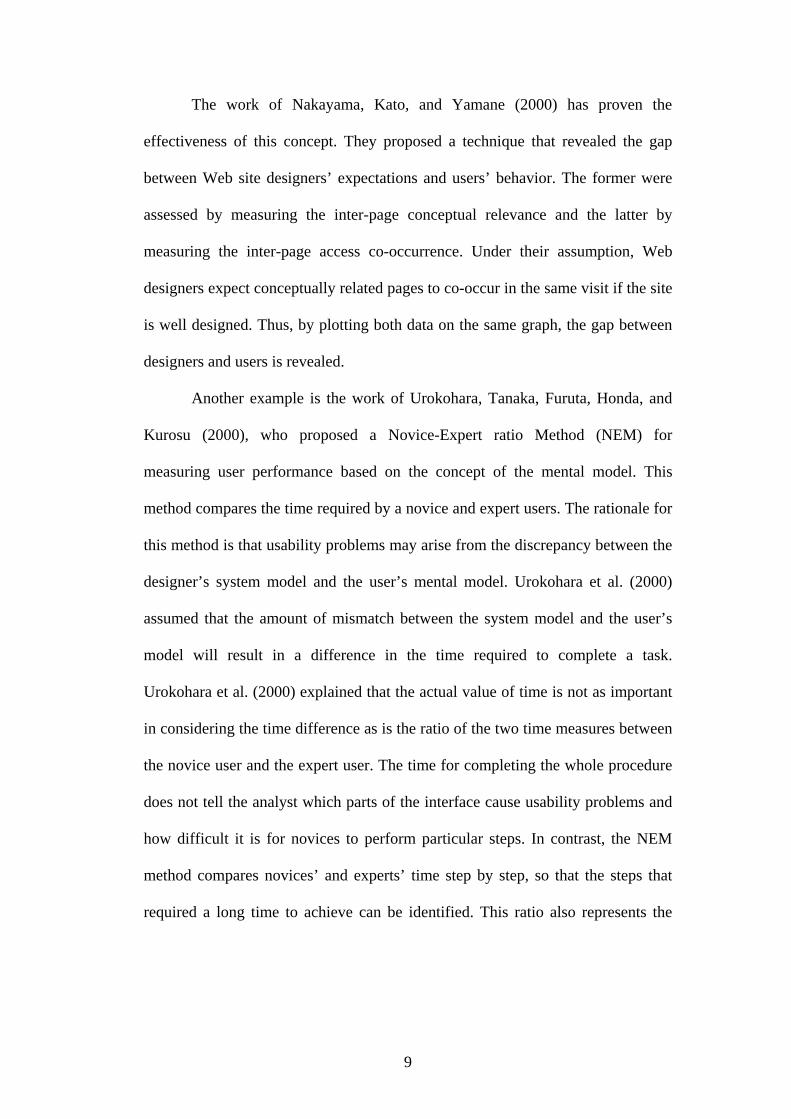
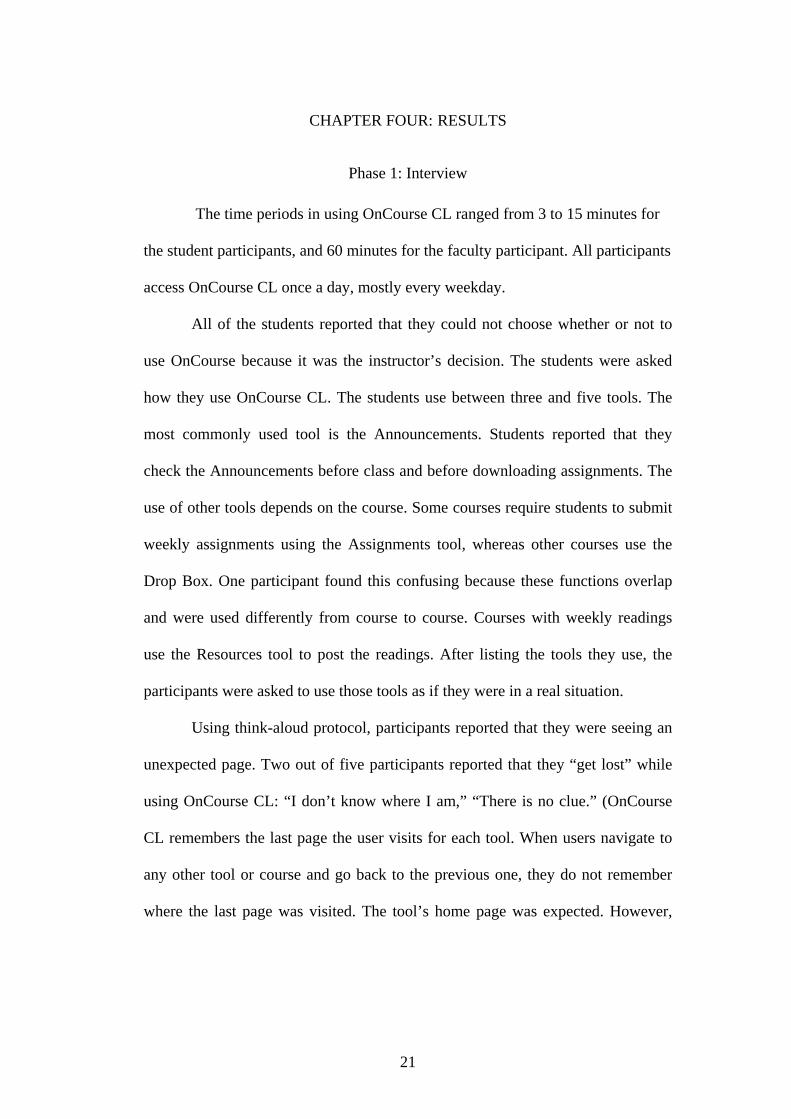
Task 3
Participants were asked to go to IN INFO PRAC 001282 class’s Resources
tool and download the file named “LectureNoteWeek5.doc” inside the folder
“Lecture Notes” to the desktop.
23
Steps 1. Select "IN INFO PRAC 001282" 2. Select "Resources" 3. Select "Lecture Notes" folder 4. Select file "LectureNoteWeek05.doc" 5. In “File Download” popup window , select "Save" 6. In “Save As” popup window, select "Save"
Figure 3: Snapshot of Task 3 - Step 1
24
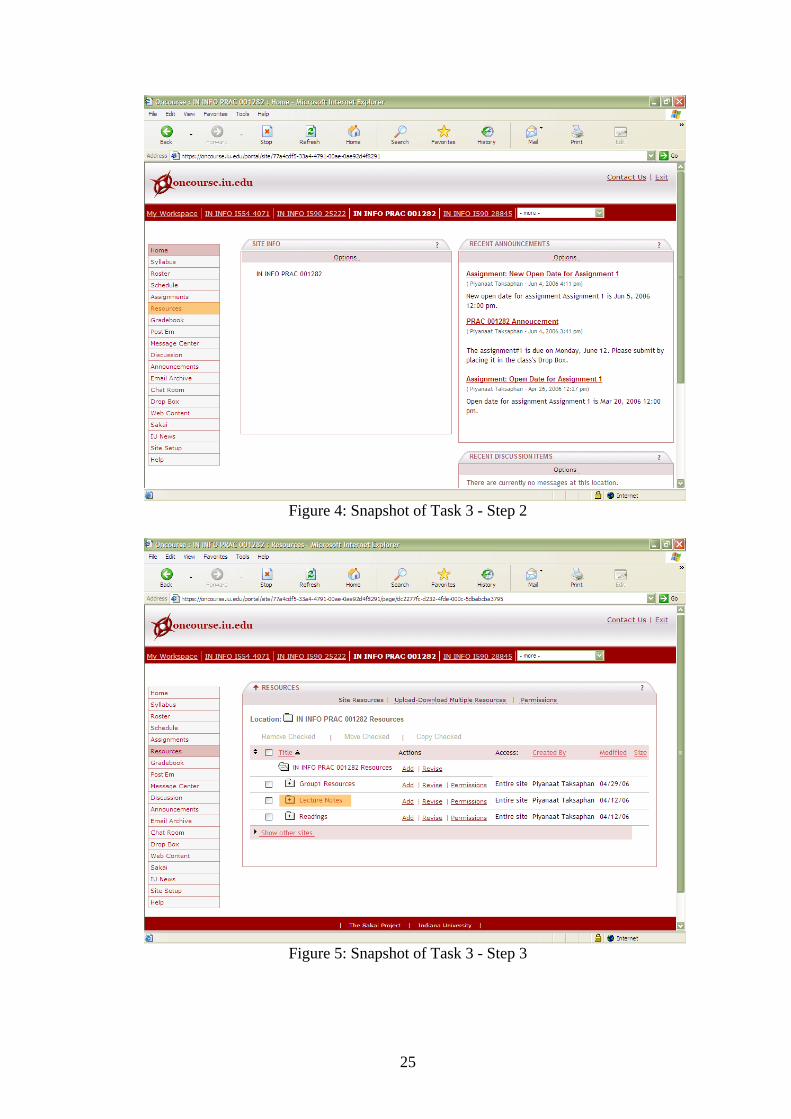
Figure 4: Snapshot of Task 3 - Step 2
Figure 5: Snapshot of Task 3 - Step 3
25
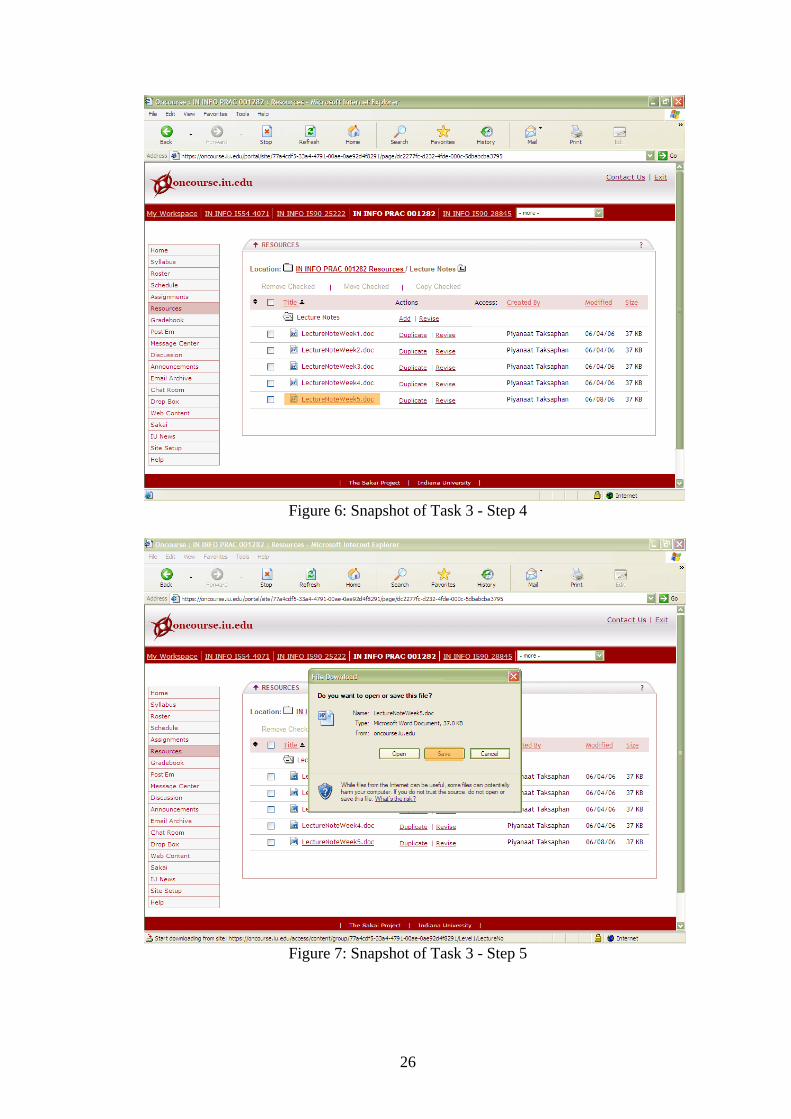
Figure 6: Snapshot of Task 3 - Step 4
Figure 7: Snapshot of Task 3 - Step 5
26
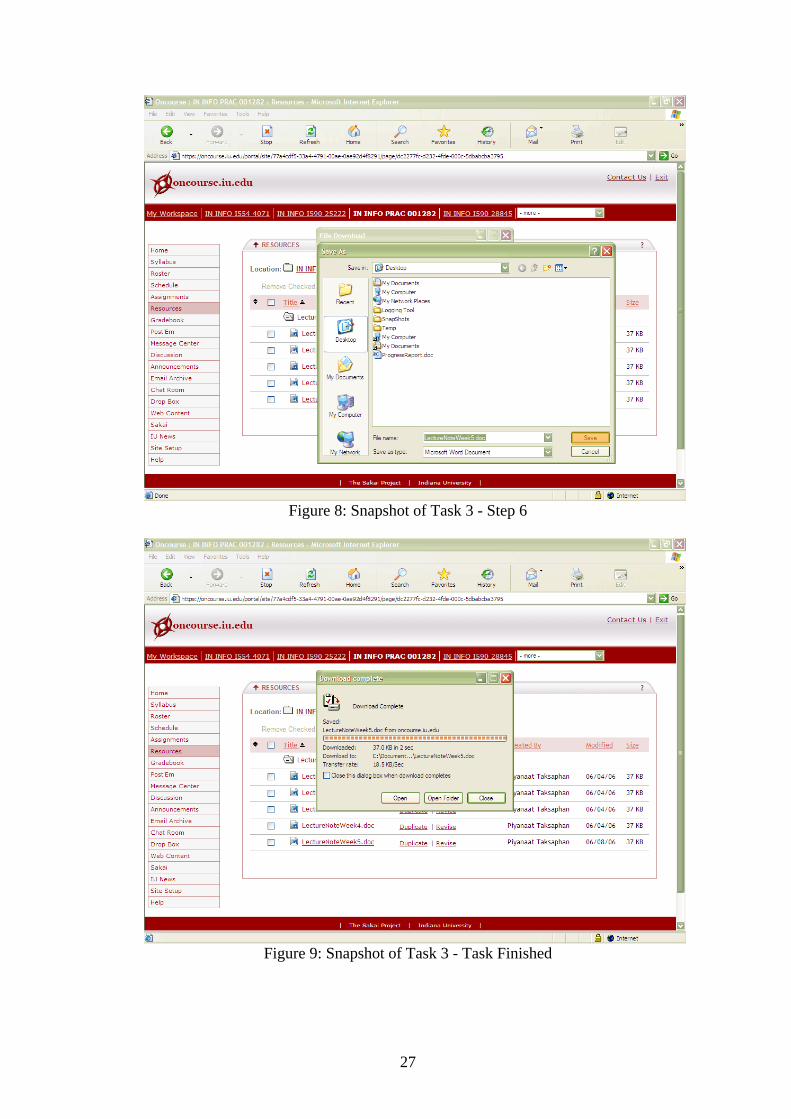
Figure 8: Snapshot of Task 3 - Step 6
Figure 9: Snapshot of Task 3 - Task Finished
27
Task 4
Participants were asked to go to the IN INFO PRAC 003074 class’s Drop
Box and move the “MidtermReport_Comments.doc” file to the “Midterm Project”
folder.
Steps 1. Select "More" drop-down 2. Select "IN INFO PRAC 003074" 3. Select "Drop Box" 4 .Select checkbox in front of "MidtermReport_Comment.doc" 5. Select "Move Checked" 6. Select "Paste Moved Items"
Figure 10: Snapshot of Task 4 - Step 1
28
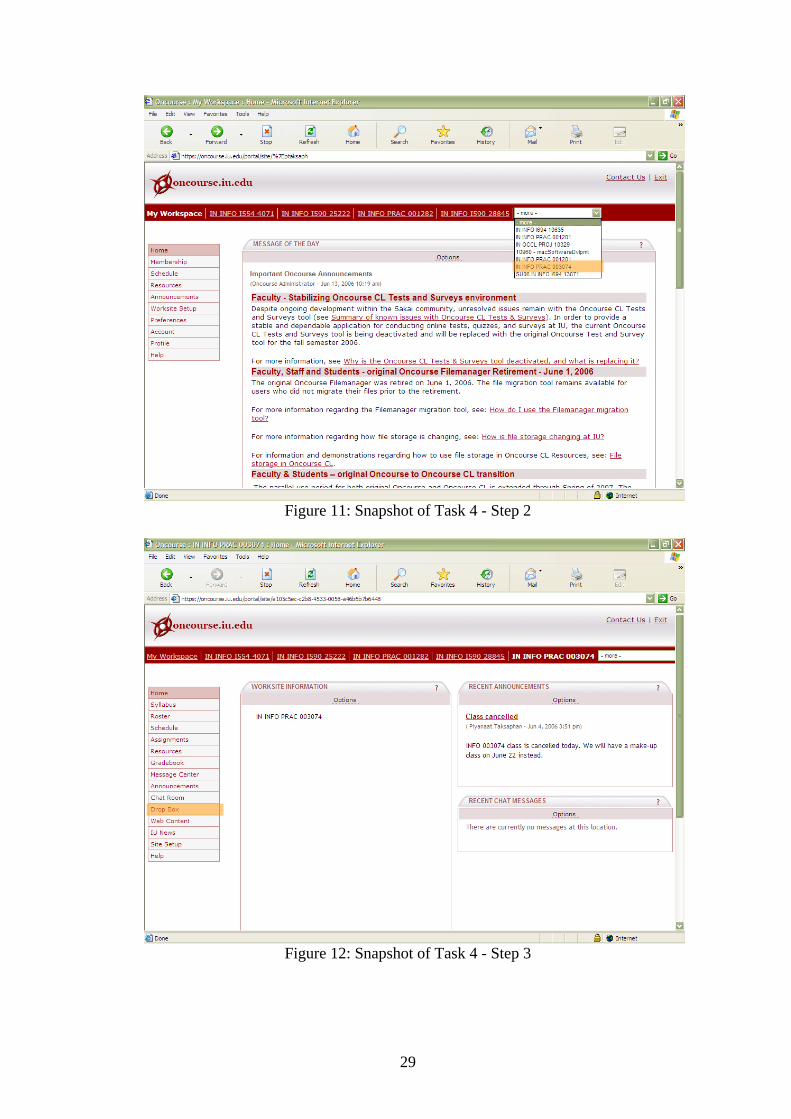
Figure 11: Snapshot of Task 4 - Step 2
Figure 12: Snapshot of Task 4 - Step 3
29
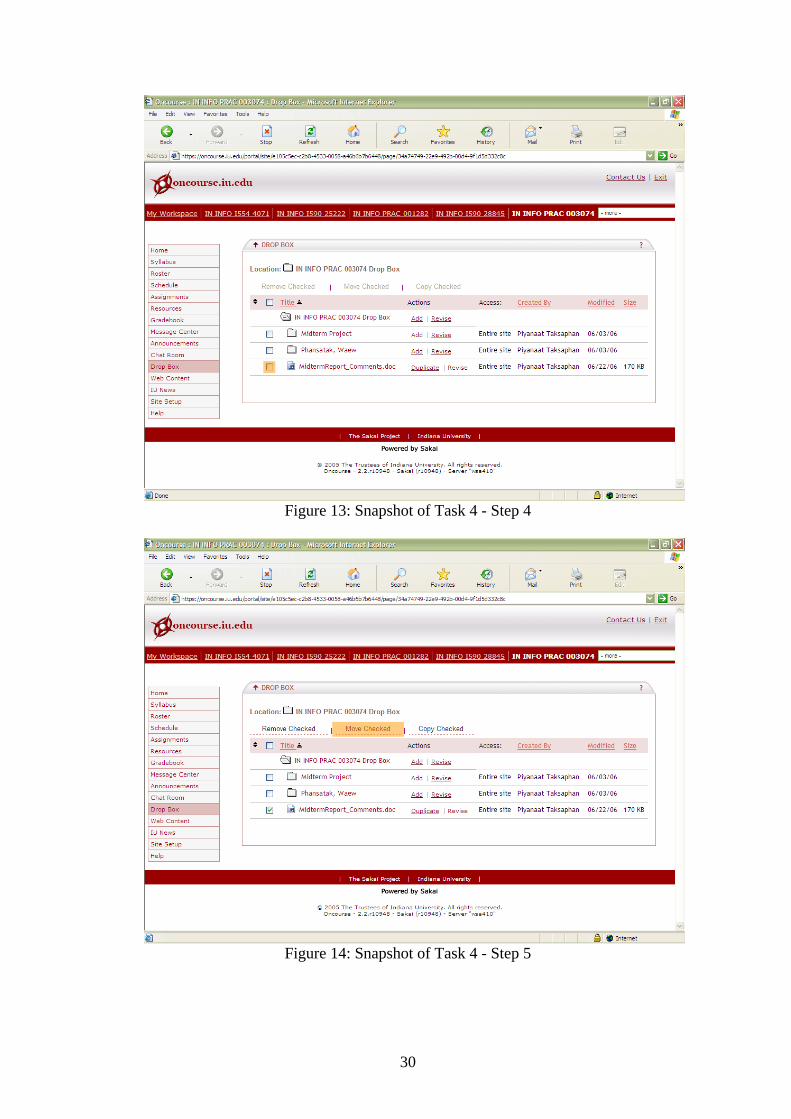
Figure 13: Snapshot of Task 4 - Step 4
Figure 14: Snapshot of Task 4 - Step 5
30
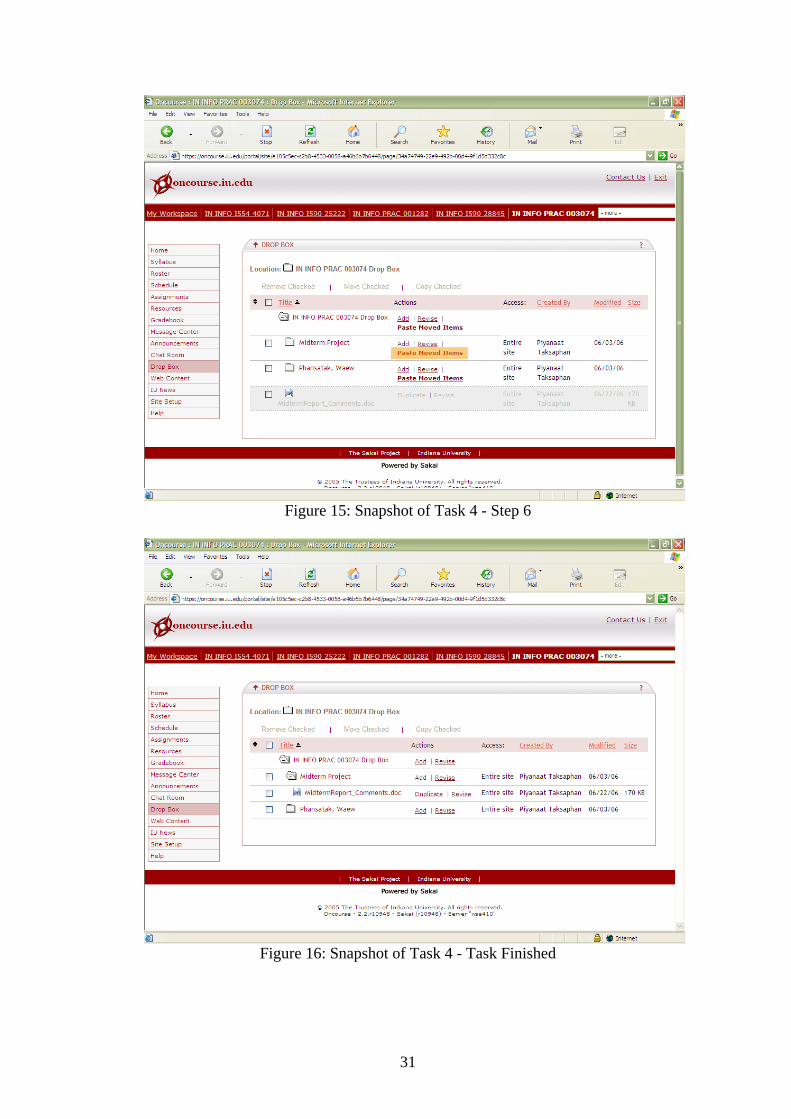
Figure 15: Snapshot of Task 4 - Step 6
Figure 16: Snapshot of Task 4 - Task Finished
31
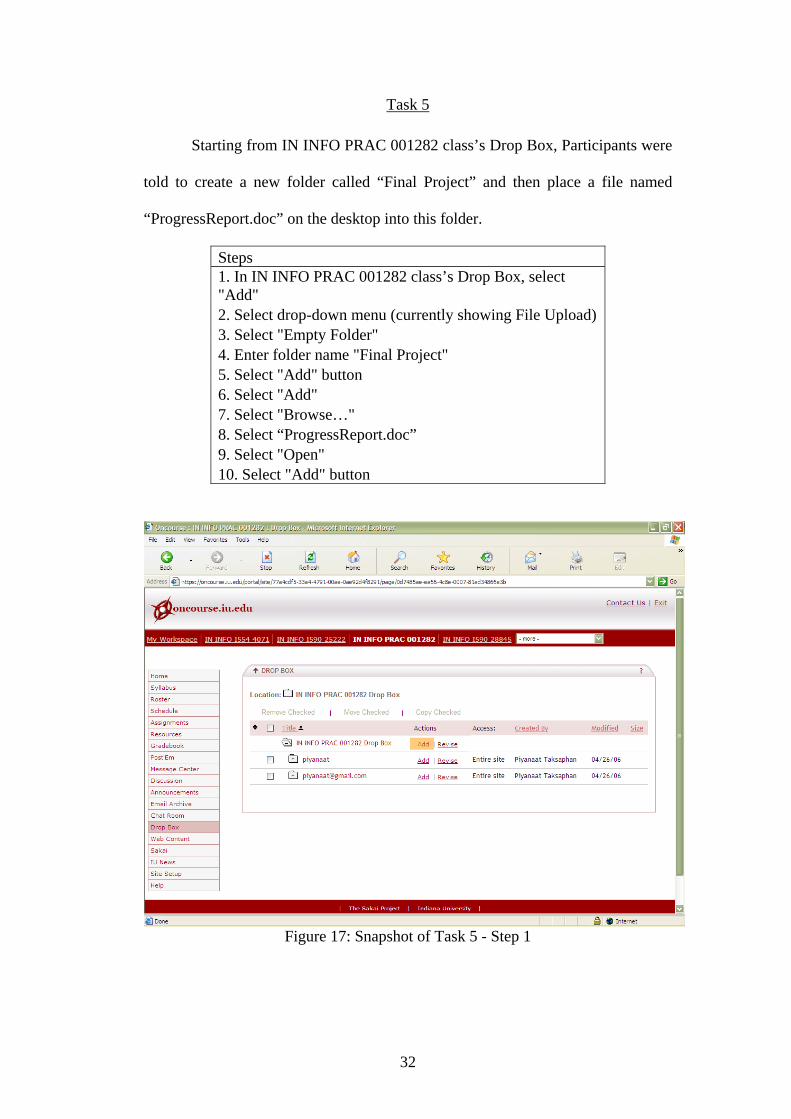
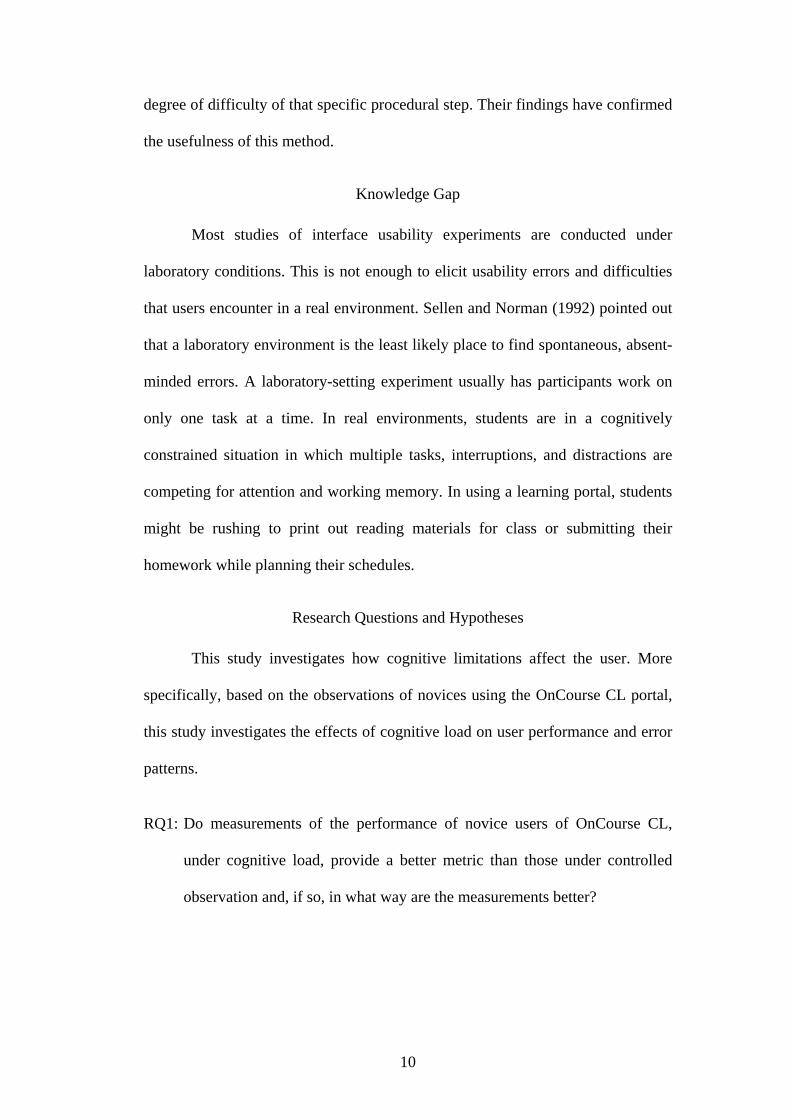
Task 5
Starting from IN INFO PRAC 001282 class’s Drop Box, Participants were
told to create a new folder called “Final Project” and then place a file named
“ProgressReport.doc” on the desktop into this folder.
Steps 1. In IN INFO PRAC 001282 class’s Drop Box, select "Add" 2. Select drop-down menu (currently showing File Upload) 3. Select "Empty Folder" 4. Enter folder name "Final Project" 5. Select "Add" button 6. Select "Add" 7. Select "Browse…" 8. Select “ProgressReport.doc” 9. Select "Open" 10. Select "Add" button
Figure 17: Snapshot of Task 5 - Step 1
32
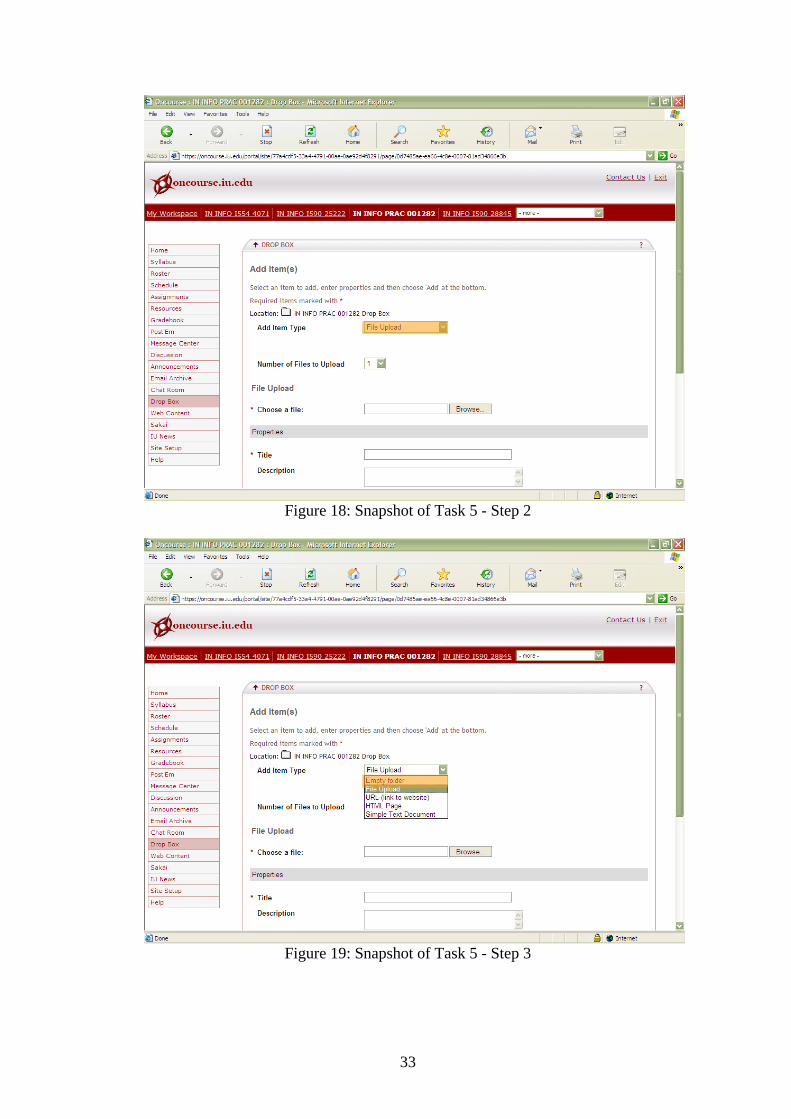
Figure 18: Snapshot of Task 5 - Step 2
Figure 19: Snapshot of Task 5 - Step 3
33
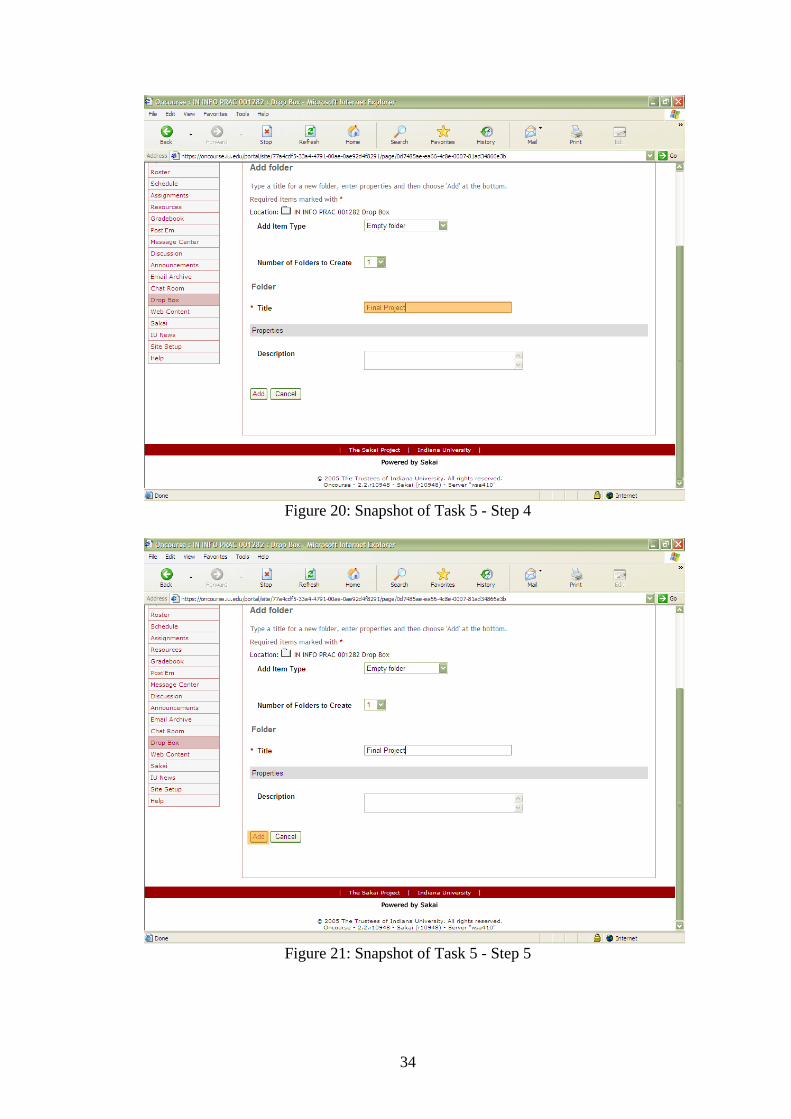
Figure 20: Snapshot of Task 5 - Step 4
Figure 21: Snapshot of Task 5 - Step 5
34
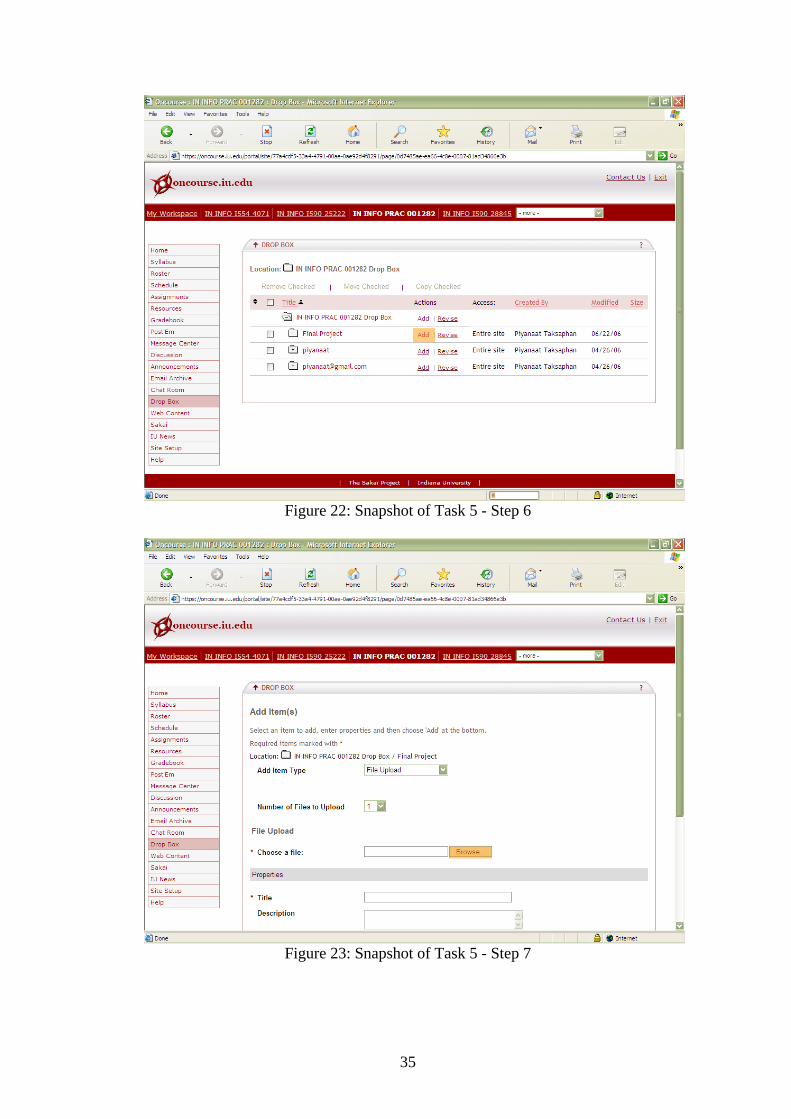
Figure 22: Snapshot of Task 5 - Step 6
Figure 23: Snapshot of Task 5 - Step 7
35
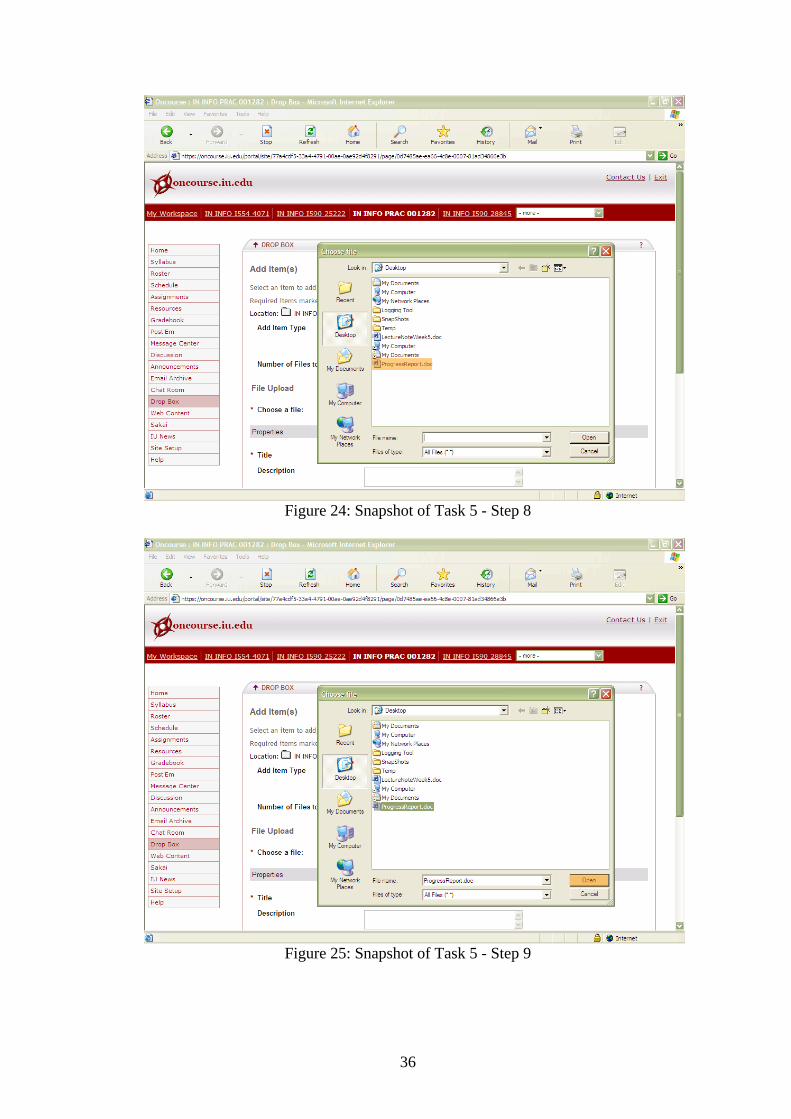
Figure 24: Snapshot of Task 5 - Step 8
Figure 25: Snapshot of Task 5 - Step 9
36
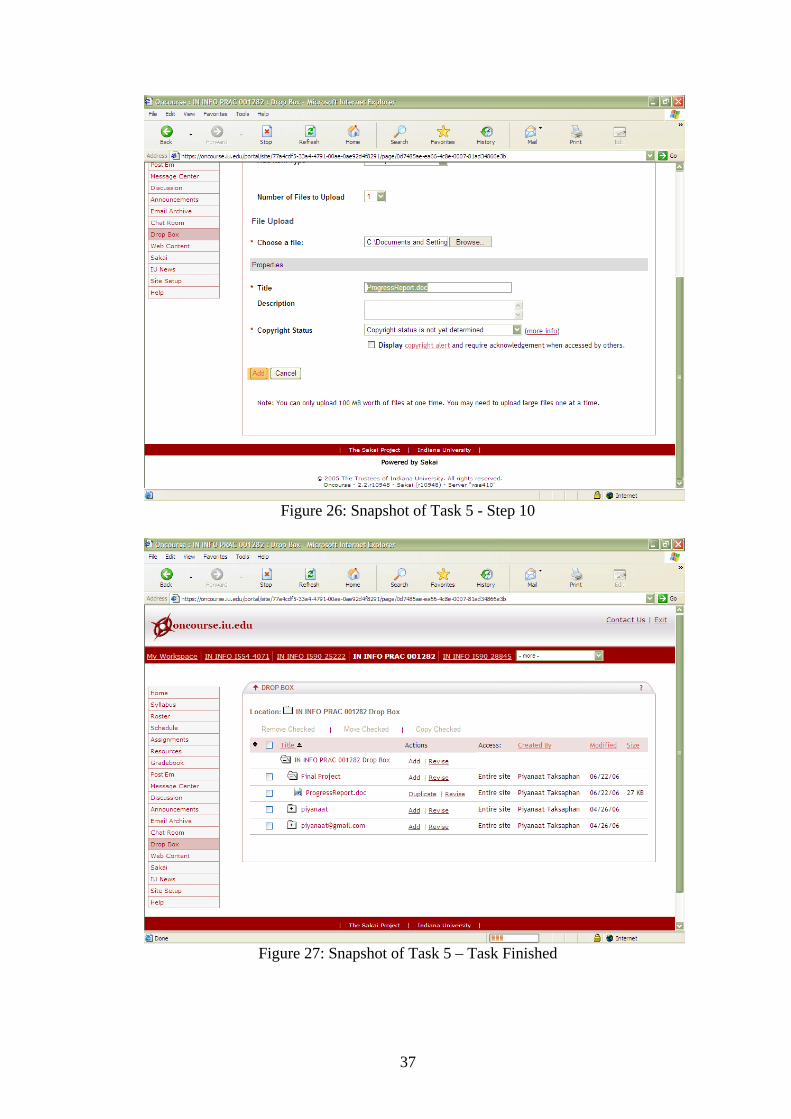
Figure 26: Snapshot of Task 5 - Step 10
Figure 27: Snapshot of Task 5 – Task Finished
37
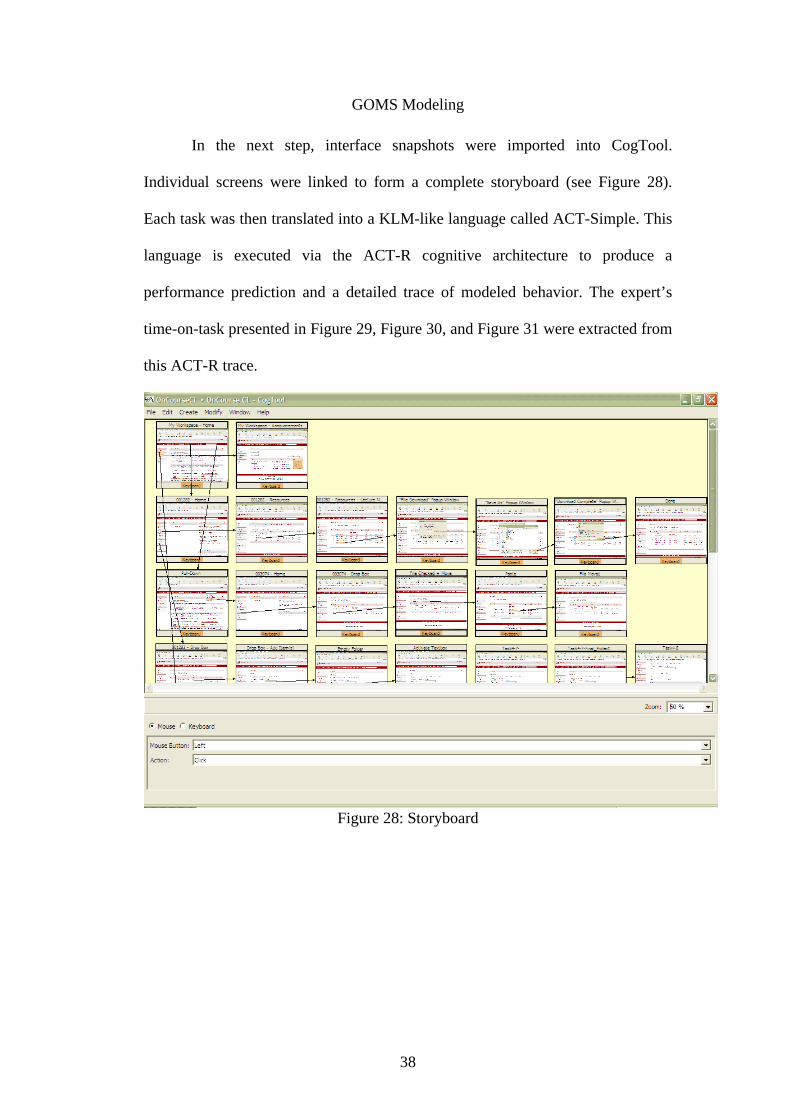
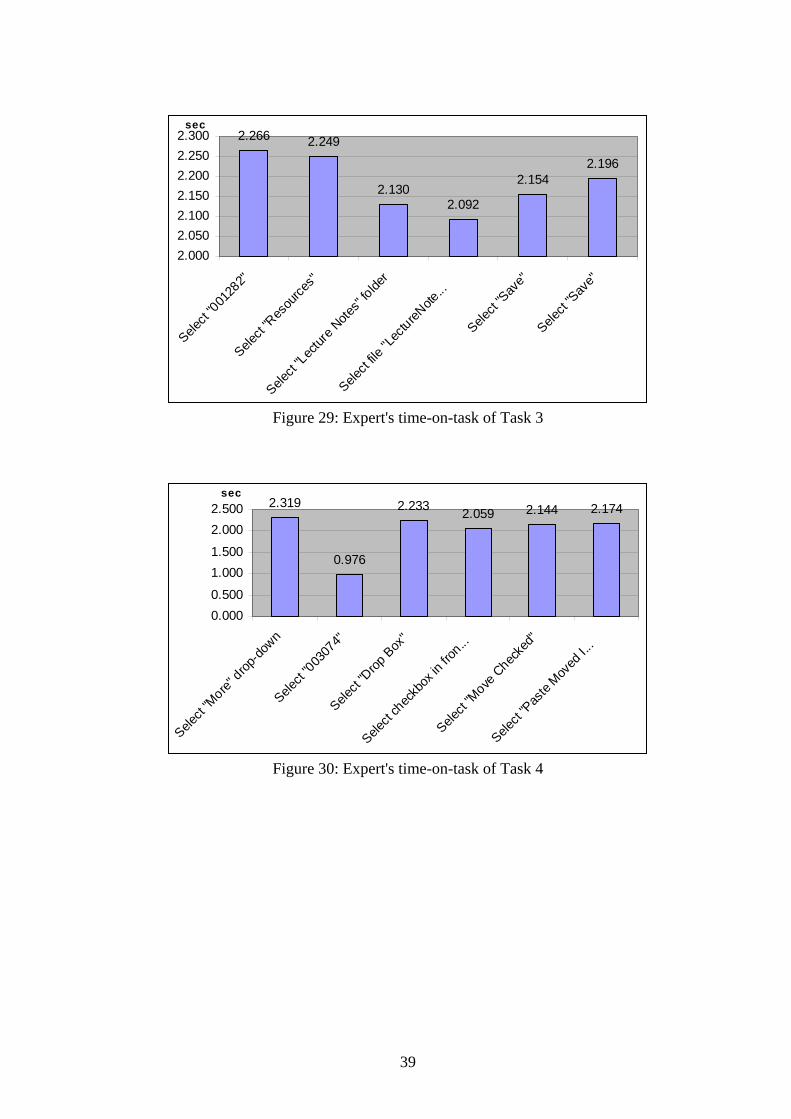
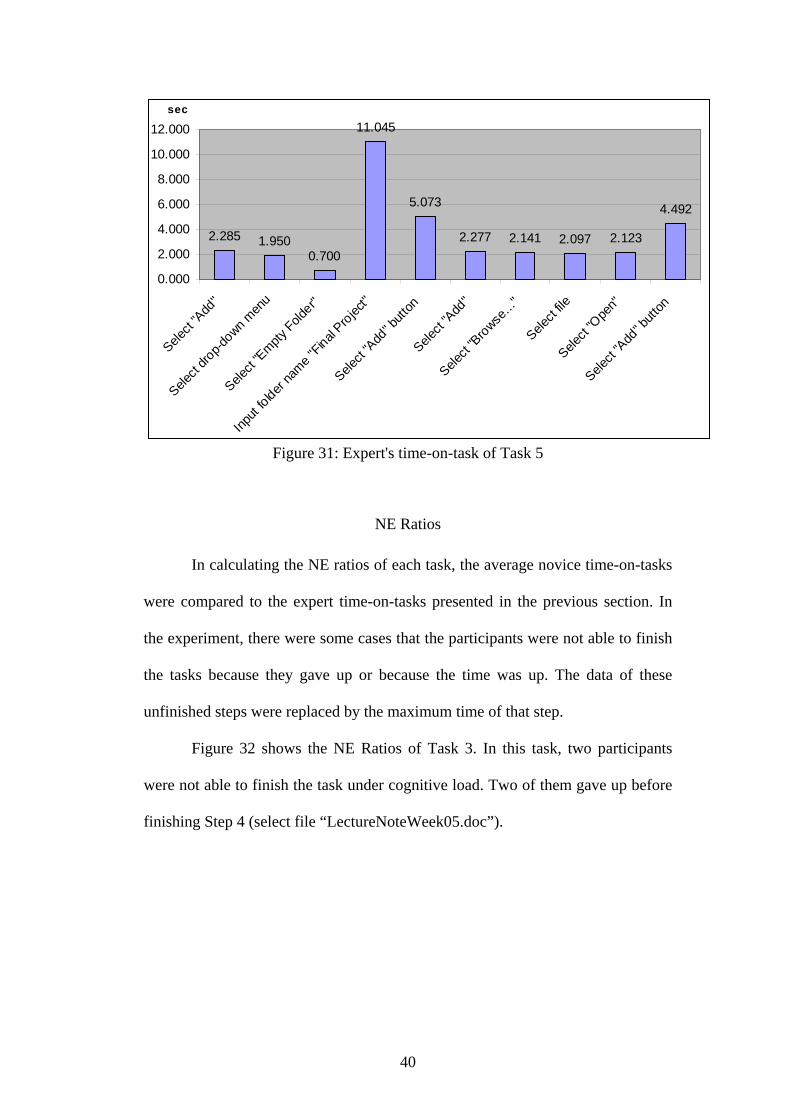
GOMS Modeling
In the next step, interface snapshots were imported into CogTool.
Individual screens were linked to form a complete storyboard (see Figure 28).
Each task was then translated into a KLM-like language called ACT-Simple. This
language is executed via the ACT-R cognitive architecture to produce a
performance prediction and a detailed trace of modeled behavior. The expert’s
time-on-task presented in Figure 29, Figure 30, and Figure 31 were extracted from
this ACT-R trace.
Figure 28: Storyboard
38
2.266 2.249
2.1302.092
2.1542.196
2.0002.0502.1002.1502.2002.2502.300
Select
"00128
2"
Select
"Res
ource
s"
Select
"Lectur
e Note
s" folde
r
Select
file "L
ectureN
ote...
Select
"Sav
e"
Select
"Sav
e"
sec
Figure 29: Expert's time-on-task of Task 3
2.319
0.976
2.233 2.059 2.144 2.174
0.0000.500
1.0001.500
2.0002.500
Select
"More"
drop-do
wn
Select
"00307
4"
Select
"Drop
Box"
Select
chec
kbox
in fro
n...
Select
"Move
Chec
ked"
Select
"Pas
te Mov
ed I..
.
sec
Figure 30: Expert's time-on-task of Task 4
39
2.285 1.9500.700
11.045
5.073
2.277 2.141 2.097 2.123
4.492
0.000
2.000
4.000
6.000
8.000
10.000
12.000
Select
"Add
"
Select
drop-d
own men
u
Select
"Empty
Folder"
Input
folder na
me "Final
Project"
Select
"Add
" butt
on
Select
"Add
"
Select
"Browse
…"
Select
file
Select
"Ope
n"
Select
"Add
" butt
on
sec
Figure 31: Expert's time-on-task of Task 5
NE Ratios
In calculating the NE ratios of each task, the average novice time-on-tasks
were compared to the expert time-on-tasks presented in the previous section. In
the experiment, there were some cases that the participants were not able to finish
the tasks because they gave up or because the time was up. The data of these
unfinished steps were replaced by the maximum time of that step.
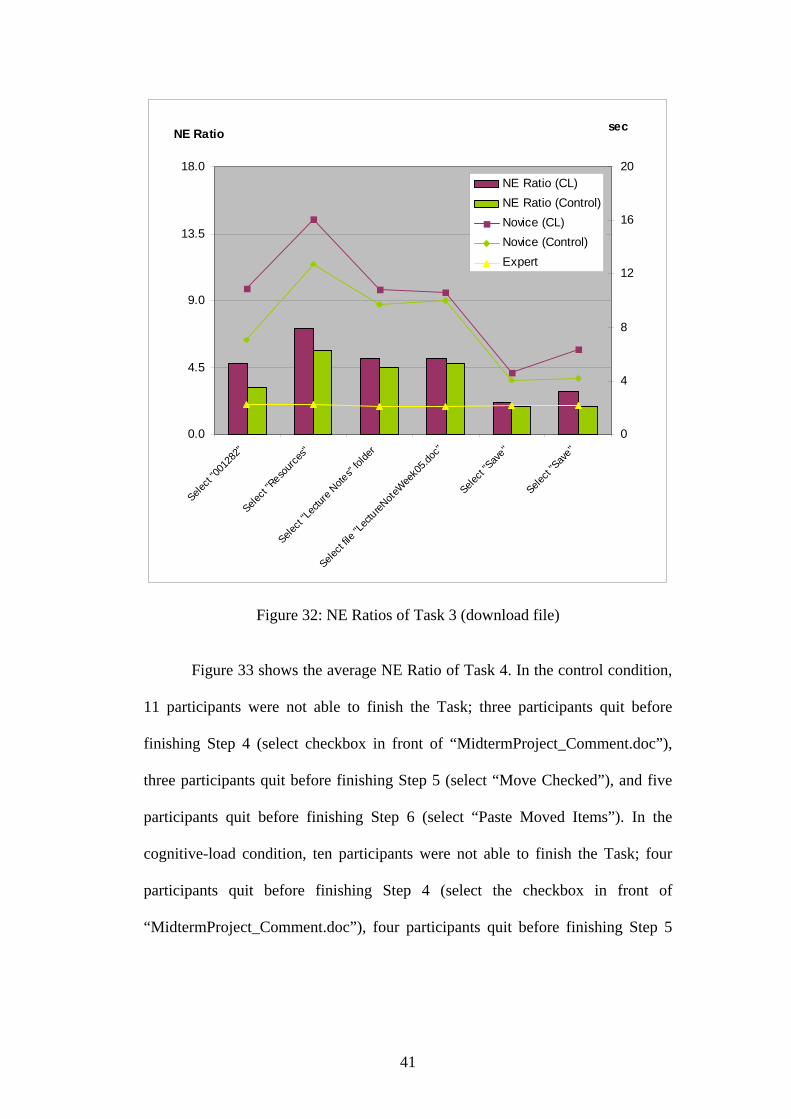
Figure 32 shows the NE Ratios of Task 3. In this task, two participants
were not able to finish the task under cognitive load. Two of them gave up before
finishing Step 4 (select file “LectureNoteWeek05.doc”).
40
0.0
4.5
9.0
13.5
18.0
Select
"0012
82"
Select
"Reso
urces
"
Select
"Lectu
re Note
s" fol
der
Select
file "L
ectureN
oteWee
k05.d
oc"
Select
"Sav
e"
Select
"Sav
e"
NE Ratio
0
4
8
12
16
20
sec
NE Ratio (CL)NE Ratio (Control)Novice (CL)Novice (Control)Expert
Figure 32: NE Ratios of Task 3 (download file)
Figure 33 shows the average NE Ratio of Task 4. In the control condition,
11 participants were not able to finish the Task; three participants quit before
finishing Step 4 (select checkbox in front of “MidtermProject_Comment.doc”),
three participants quit before finishing Step 5 (select “Move Checked”), and five
participants quit before finishing Step 6 (select “Paste Moved Items”). In the
cognitive-load condition, ten participants were not able to finish the Task; four
participants quit before finishing Step 4 (select the checkbox in front of
“MidtermProject_Comment.doc”), four participants quit before finishing Step 5
41
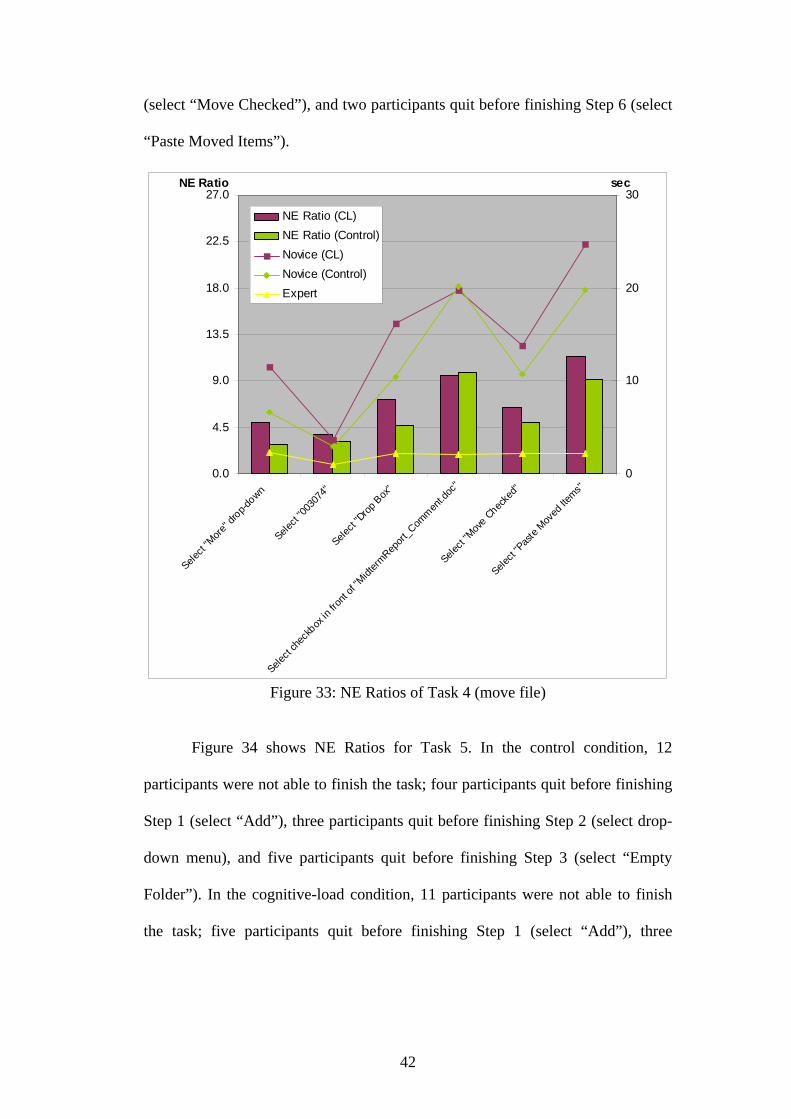
(select “Move Checked”), and two participants quit before finishing Step 6 (select
“Paste Moved Items”).
0.0
4.5
9.0
13.5
18.0
22.5
27.0
Select
"More
" drop-d
own
Select
"0030
74"
Select
"Drop
Box
"
Select
chec
kbox
in fro
nt of
"Midt
ermRep
ort_C
ommen
t.doc
"
Select
"Mov
e Chec
ked"
Select
"Pas
te Mov
ed Ite
ms"
NE Ratio
0
10
20
30sec
NE Ratio (CL)NE Ratio (Control)Novice (CL)Novice (Control)Expert
Figure 33: NE Ratios of Task 4 (move file)
Figure 34 shows NE Ratios for Task 5. In the control condition, 12
participants were not able to finish the task; four participants quit before finishing
Step 1 (select “Add”), three participants quit before finishing Step 2 (select drop-
down menu), and five participants quit before finishing Step 3 (select “Empty
Folder”). In the cognitive-load condition, 11 participants were not able to finish
the task; five participants quit before finishing Step 1 (select “Add”), three
42
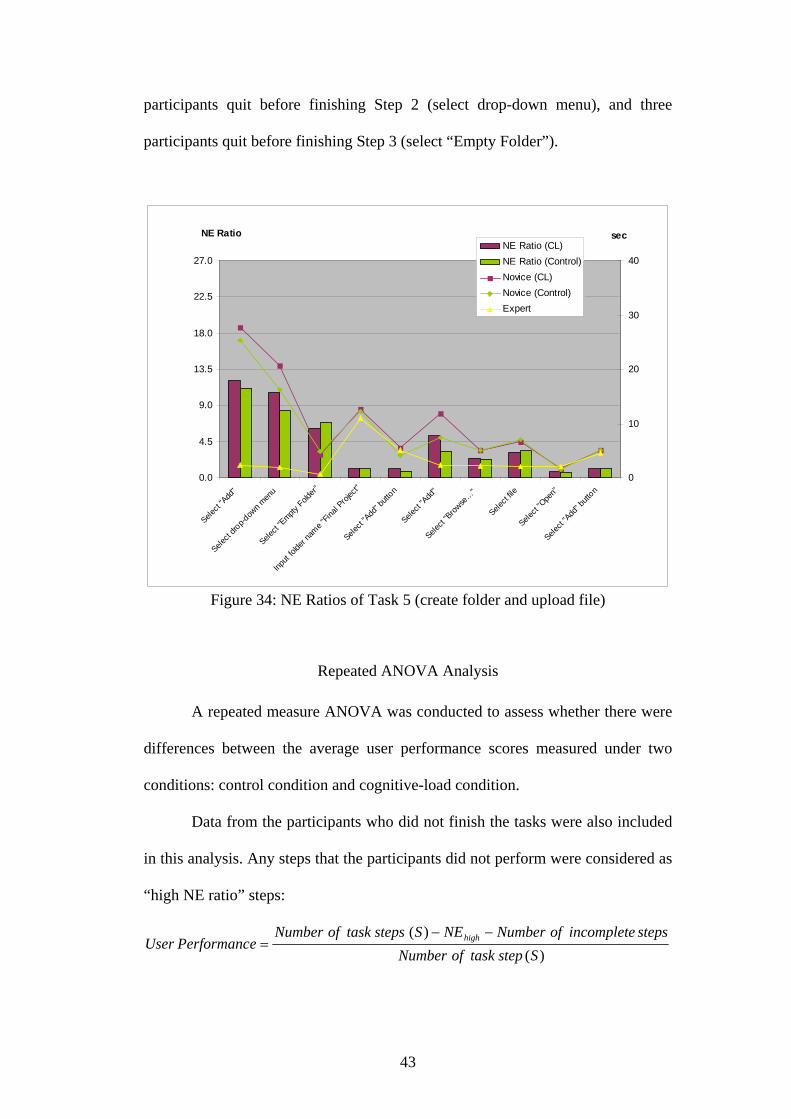
participants quit before finishing Step 2 (select drop-down menu), and three
participants quit before finishing Step 3 (select “Empty Folder”).
0.0
4.5
9.0
13.5
18.0
22.5
27.0
Select
"Add
"
Select
drop-d
own m
enu
Select
"Empty
Folder"
Input
folde
r nam
e "Fin
al Proj
ect"
Select
"Add
" butt
on
Select
"Add
"
Select
"Brow
se…
"
Select
file
Select
"Ope
n"
Select
"Add
" butt
on
NE Ratio
0
10
20
30
40
secNE Ratio (CL)NE Ratio (Control)Novice (CL)Novice (Control)Expert
Figure 34: NE Ratios of Task 5 (create folder and upload file)
Repeated ANOVA Analysis
A repeated measure ANOVA was conducted to assess whether there were
differences between the average user performance scores measured under two
conditions: control condition and cognitive-load condition.
Data from the participants who did not finish the tasks were also included
in this analysis. Any steps that the participants did not perform were considered as
“high NE ratio” steps:
)()(
SsteptaskofNumberstepsincompleteofNumberNESstepstaskofNumber
ePerformancUser high −−=
43
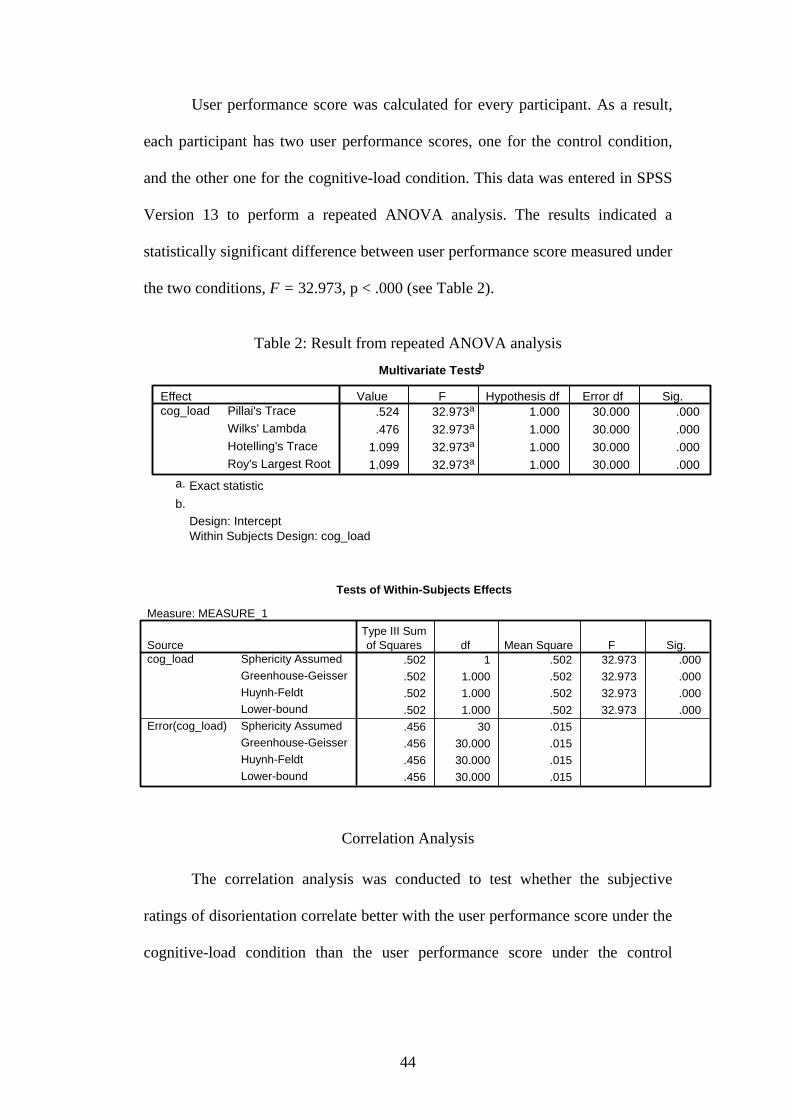
User performance score was calculated for every participant. As a result,
each participant has two user performance scores, one for the control condition,
and the other one for the cognitive-load condition. This data was entered in SPSS
Version 13 to perform a repeated ANOVA analysis. The results indicated a
statistically significant difference between user performance score measured under
the two conditions, F = 32.973, p < .000 (see Table 2).
Table 2: Result from repeated ANOVA analysis
Multivariate Testsb
.524 32.973a 1.000 30.000 .000
.476 32.973a 1.000 30.000 .0001.099 32.973a 1.000 30.000 .0001.099 32.973a 1.000 30.000 .000
Pillai's TraceWilks' LambdaHotelling's TraceRoy's Largest Root
Effectcog_load
Value F Hypothesis df Error df Sig.
Exact statistica.
Design: Intercept Within Subjects Design: cog_load
b.
Tests of Within-Subjects Effects
Measure: MEASURE_1
.502 1 .502 32.973 .000
.502 1.000 .502 32.973 .000
.502 1.000 .502 32.973 .000
.502 1.000 .502 32.973 .000
.456 30 .015
.456 30.000 .015
.456 30.000 .015
.456 30.000 .015
Sphericity AssumedGreenhouse-GeisserHuynh-FeldtLower-boundSphericity AssumedGreenhouse-GeisserHuynh-FeldtLower-bound
Sourcecog_load
Error(cog_load)
Type III Sumof Squares df Mean Square F Sig.
Correlation Analysis
The correlation analysis was conducted to test whether the subjective
ratings of disorientation correlate better with the user performance score under the
cognitive-load condition than the user performance score under the control
44
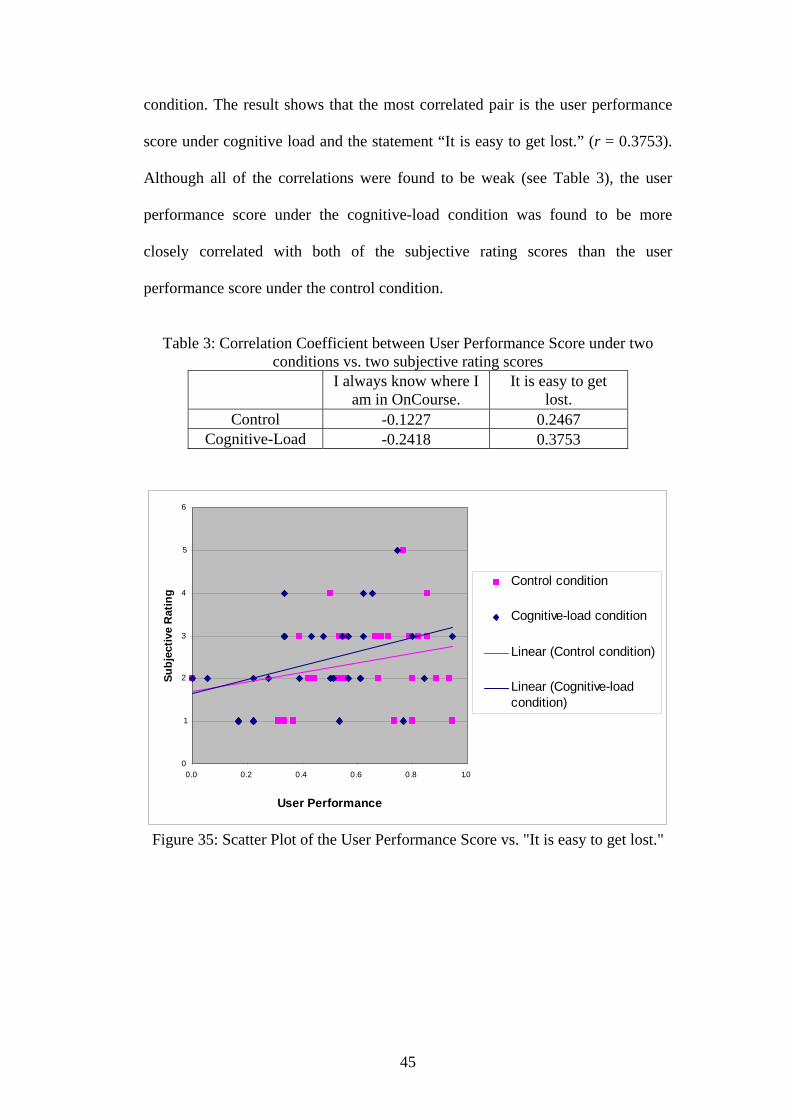
condition. The result shows that the most correlated pair is the user performance
score under cognitive load and the statement “It is easy to get lost.” (r = 0.3753).
Although all of the correlations were found to be weak (see Table 3), the user
performance score under the cognitive-load condition was found to be more
closely correlated with both of the subjective rating scores than the user
performance score under the control condition.
Table 3: Correlation Coefficient between User Performance Score under two
conditions vs. two subjective rating scores
I always know where I
am in OnCourse. It is easy to get
lost. Control -0.1227 0.2467
Cognitive-Load -0.2418 0.3753
0
1
2
3
4
5
6
0.0 0.2 0.4 0.6 0.8 1.0
User Performance
Subj
ectiv
e R
atin
g
Control condition
Cognitive-load condition
Linear (Control condition)
Linear (Cognitive-loadcondition)
Figure 35: Scatter Plot of the User Performance Score vs. "It is easy to get lost."
45
0
1
2
3
4
5
6
0.0 0.2 0.4 0.6 0.8 1.0
User Performance
Subj
ectiv
e R
atin
g
Control condition
Cognitive-load condition
Linear (Control condition)
Linear (Cognitive-loadcondition)
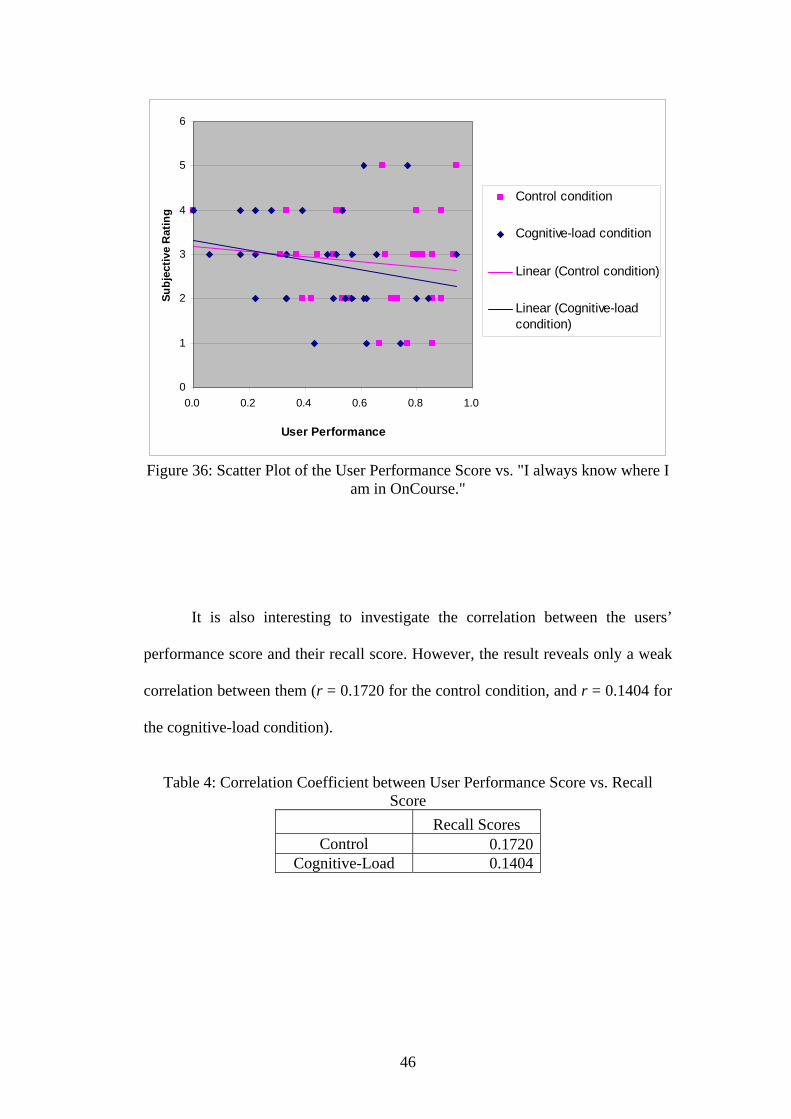
Figure 36: Scatter Plot of the User Performance Score vs. "I always know where I
am in OnCourse."
It is also interesting to investigate the correlation between the users’
performance score and their recall score. However, the result reveals only a weak
correlation between them (r = 0.1720 for the control condition, and r = 0.1404 for
the cognitive-load condition).
Table 4: Correlation Coefficient between User Performance Score vs. Recall
Score Recall Scores
Control 0.1720Cognitive-Load 0.1404
46

0
1
2
3
4
5
6
7
8
0.0 0.2 0.4 0.6 0.8 1.0
User Performace
Rec
all S
core
Control condition
Cognitive-load condition
Linear (Control condition)
Linear (Cognitive-loadcondition)
Figure 37: Scatter Plot of the User Performance Score vs. Recall Score
Error Patterns
From the experiment, 90 error occurrences were observed. Thirty-two
were observed in the control setting, and 58 were observed in the cognitive-load
setting.
Although there were some individual differences in user performance, the
most common error observed during the experiment sessions is that the users were
unable to find specific features to perform the intended action. This includes
failure to find facilities for moving, pasting, and adding an empty folder. This type
of error was observed in both experimental conditions.
In addition to those common errors, some error patterns happen
specifically in the cognitive-load condition. These are indications of the users’
high cognitive-load. Based on the researcher’s analysis, out of these 90 error
47
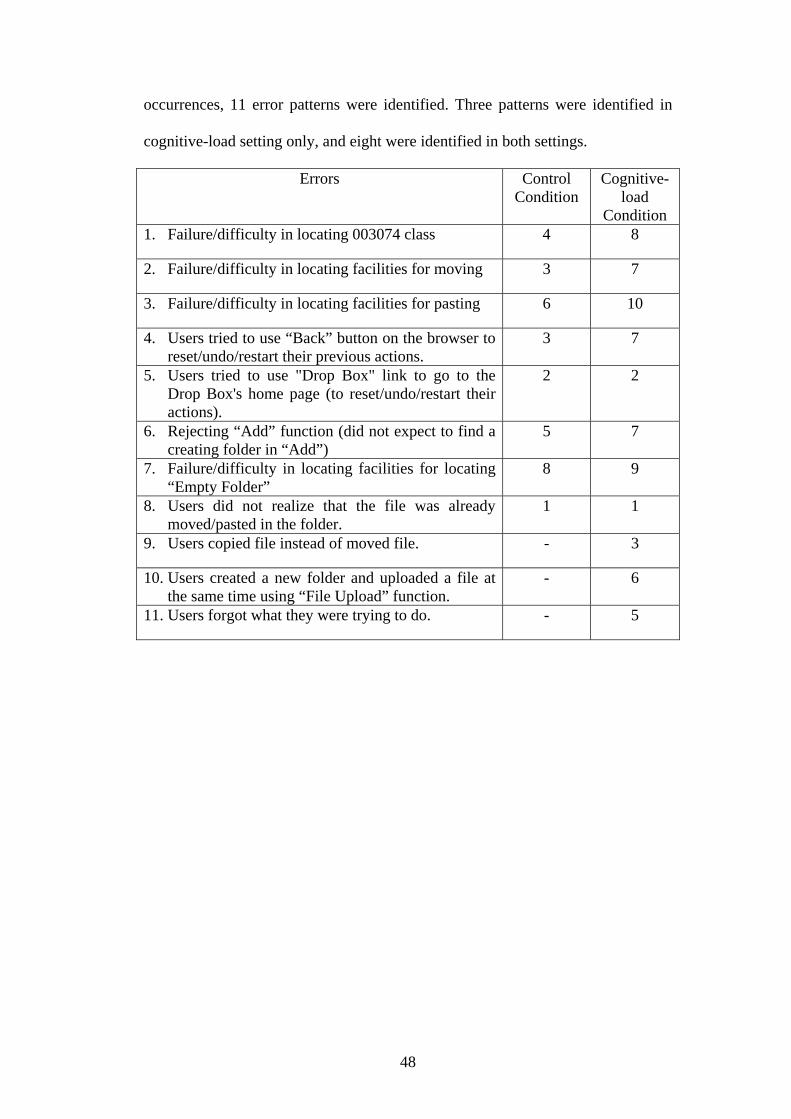
occurrences, 11 error patterns were identified. Three patterns were identified in
cognitive-load setting only, and eight were identified in both settings.
Errors Control Condition
Cognitive-load
Condition 1. Failure/difficulty in locating 003074 class 4 8
2. Failure/difficulty in locating facilities for moving 3 7
3. Failure/difficulty in locating facilities for pasting 6 10
4. Users tried to use “Back” button on the browser to reset/undo/restart their previous actions.
3 7
5. Users tried to use "Drop Box" link to go to the Drop Box's home page (to reset/undo/restart their actions).
2 2
6. Rejecting “Add” function (did not expect to find a creating folder in “Add”)
5 7
7. Failure/difficulty in locating facilities for locating “Empty Folder”
8 9
8. Users did not realize that the file was already moved/pasted in the folder.
1 1
9. Users copied file instead of moved file. - 3
10. Users created a new folder and uploaded a file at the same time using “File Upload” function.
- 6
11. Users forgot what they were trying to do. - 5
48
CHAPTER FIVE: DISCUSSION
User Performance Score
Overall, the NE ratios in the cognitive-load condition were found to be
higher than the NE ratios in the control condition. In other words, users took more
time to complete each step under the cognitive-load condition than they did under
the control condition. From the ANOVA analysis, it was found that the difference
between the user performance scores in the two experimental conditions was
statistically significant. The user performance score from the cognitive-load
condition was found to correlate more with both user subjective ratings of
disorientation than the user performance score from the control condition. The
highest correlation score exists between the user performance score under the
cognitive-load condition and the subjective rating of “It is easy to get lost.”
From the investigation during the experiment, it was observed that users
tried to use the browser’s “back” button to go back to the previous page they
visited, or to undo an action. However, the back button did not work as the users
expected. After the back button failed, the users often tried to click on the tool link
(Resources or Drop Box), expecting it to bring them to the homepage of the tool
and refresh any mistakes they wanted to undo. However, these links did not work
as expected. From the post-test interview, many participants reported feeling
disoriented because of these unexpected behaviors. This showed that the users’
mental model was incorrect. Their mental models were based on their previous
knowledge. When the system did not react as they expected, confusion and
disorientation resulted.
49
Error Patterns
A higher number of error occurrences was observed in the cognitive-load
condition than in the control condition. This is consistent with the result of the
study of Olson and Olson (1990) that showed the higher frequency of errors with a
heavier cognitive workload. The researcher’s analysis identified 11 eleven error
patterns from these occurrences, eight of which occurred in both settings. The
most common error is a failure or difficulty in finding specific features to perform
the intended action. This includes failure to find facilities for moving, pasting, and
adding an empty folder. Three out of 11 patterns occurred in the cognitive-load
condition. They might indicate the high cognitive-load condition of the users.
According to Norman’s error classification, as cited in Lindmark (2000), these
three patterns fall into a category of Description Errors, Errors Resulting from
Unintentional Activation of Schemas, and Errors Resulting from Loss of Schemas
Activation.
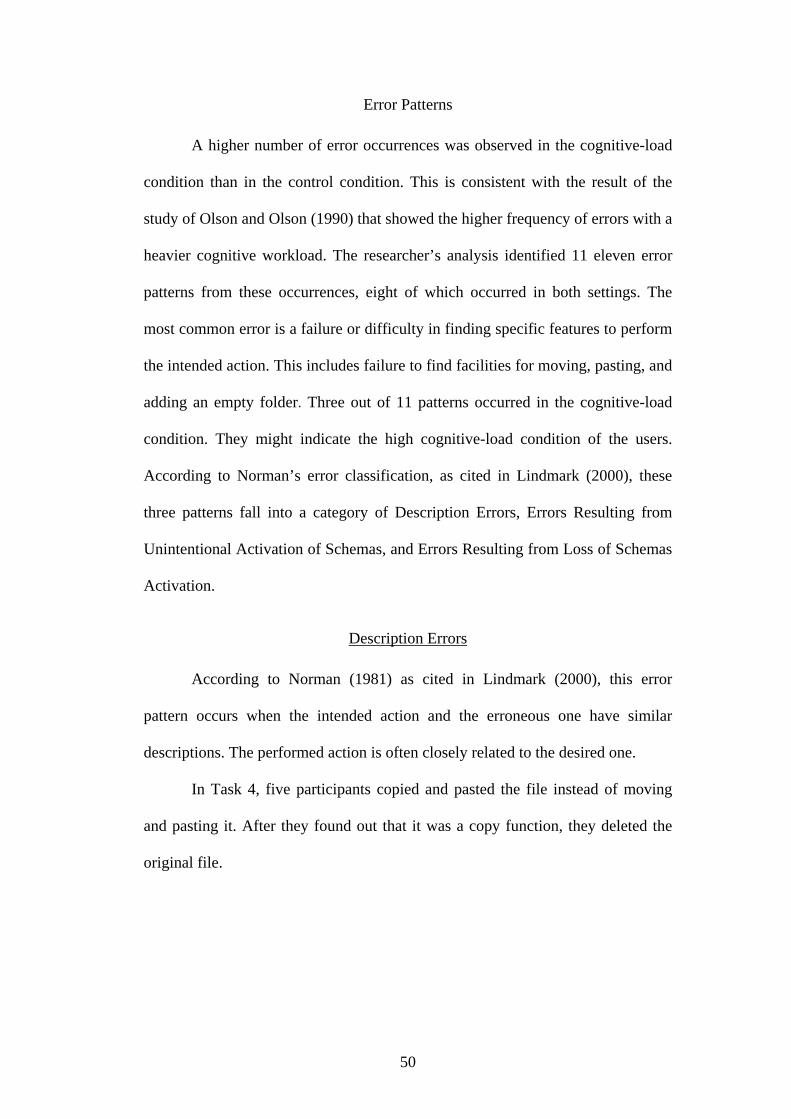
Description Errors
According to Norman (1981) as cited in Lindmark (2000), this error
pattern occurs when the intended action and the erroneous one have similar
descriptions. The performed action is often closely related to the desired one.
In Task 4, five participants copied and pasted the file instead of moving
and pasting it. After they found out that it was a copy function, they deleted the
original file.
50
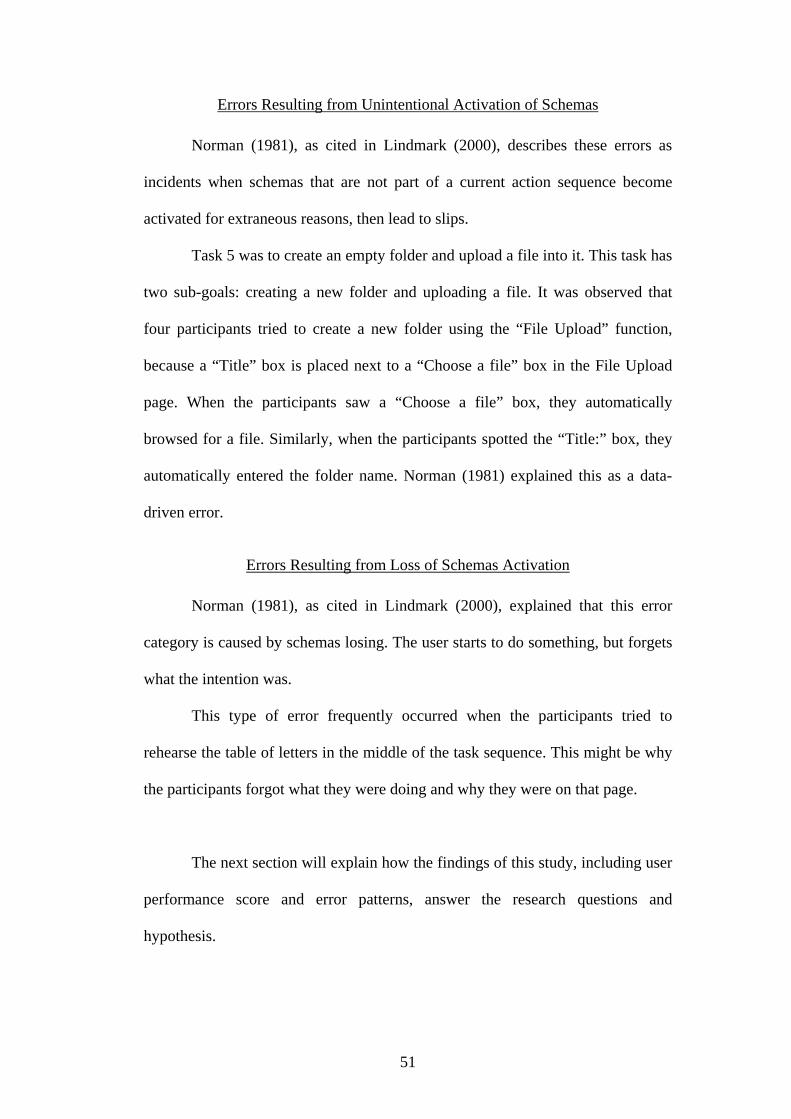
Errors Resulting from Unintentional Activation of Schemas
Norman (1981), as cited in Lindmark (2000), describes these errors as
incidents when schemas that are not part of a current action sequence become
activated for extraneous reasons, then lead to slips.
Task 5 was to create an empty folder and upload a file into it. This task has
two sub-goals: creating a new folder and uploading a file. It was observed that
four participants tried to create a new folder using the “File Upload” function,
because a “Title” box is placed next to a “Choose a file” box in the File Upload
page. When the participants saw a “Choose a file” box, they automatically
browsed for a file. Similarly, when the participants spotted the “Title:” box, they
automatically entered the folder name. Norman (1981) explained this as a data-
driven error.
Errors Resulting from Loss of Schemas Activation
Norman (1981), as cited in Lindmark (2000), explained that this error
category is caused by schemas losing. The user starts to do something, but forgets
what the intention was.
This type of error frequently occurred when the participants tried to
rehearse the table of letters in the middle of the task sequence. This might be why
the participants forgot what they were doing and why they were on that page.
The next section will explain how the findings of this study, including user
performance score and error patterns, answer the research questions and
hypothesis.
51
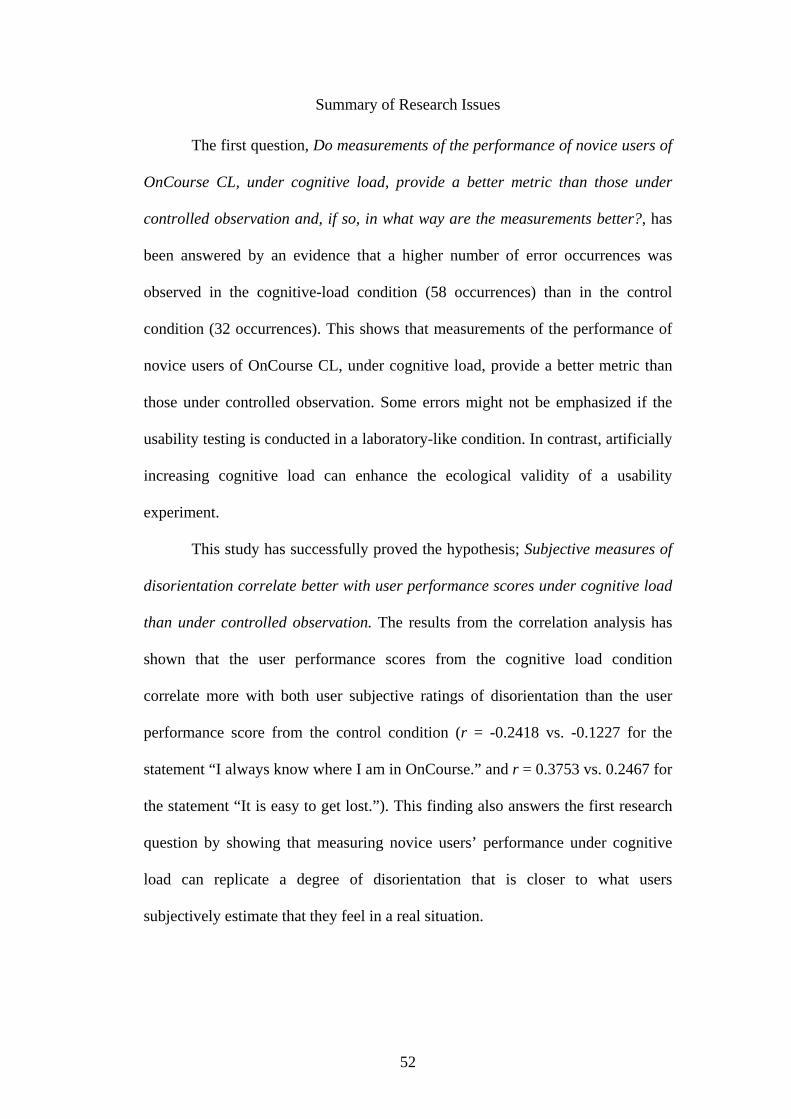
Summary of Research Issues
The first question, Do measurements of the performance of novice users of
OnCourse CL, under cognitive load, provide a better metric than those under
controlled observation and, if so, in what way are the measurements better?, has
been answered by an evidence that a higher number of error occurrences was
observed in the cognitive-load condition (58 occurrences) than in the control
condition (32 occurrences). This shows that measurements of the performance of
novice users of OnCourse CL, under cognitive load, provide a better metric than
those under controlled observation. Some errors might not be emphasized if the
usability testing is conducted in a laboratory-like condition. In contrast, artificially
increasing cognitive load can enhance the ecological validity of a usability
experiment.
This study has successfully proved the hypothesis; Subjective measures of
disorientation correlate better with user performance scores under cognitive load
than under controlled observation. The results from the correlation analysis has
shown that the user performance scores from the cognitive load condition
correlate more with both user subjective ratings of disorientation than the user
performance score from the control condition (r = -0.2418 vs. -0.1227 for the
statement “I always know where I am in OnCourse.” and r = 0.3753 vs. 0.2467 for
the statement “It is easy to get lost.”). This finding also answers the first research
question by showing that measuring novice users’ performance under cognitive
load can replicate a degree of disorientation that is closer to what users
subjectively estimate that they feel in a real situation.
52
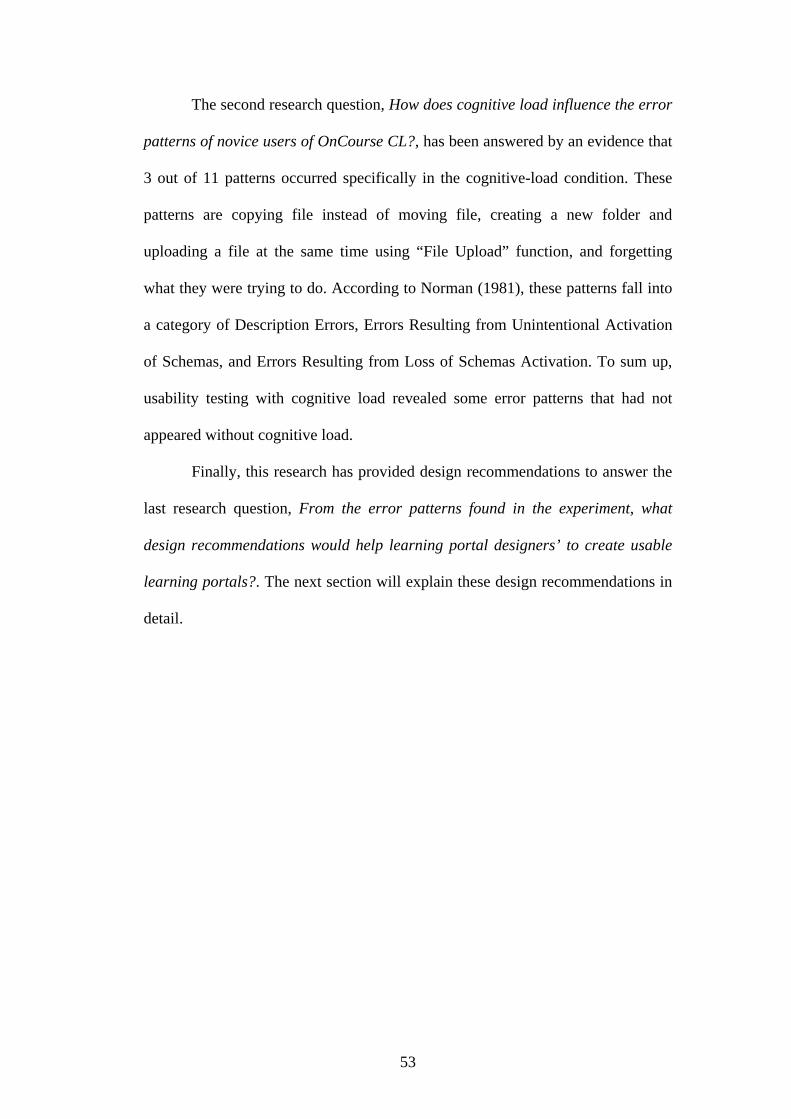
The second research question, How does cognitive load influence the error
patterns of novice users of OnCourse CL?, has been answered by an evidence that
3 out of 11 patterns occurred specifically in the cognitive-load condition. These
patterns are copying file instead of moving file, creating a new folder and
uploading a file at the same time using “File Upload” function, and forgetting
what they were trying to do. According to Norman (1981), these patterns fall into
a category of Description Errors, Errors Resulting from Unintentional Activation
of Schemas, and Errors Resulting from Loss of Schemas Activation. To sum up,
usability testing with cognitive load revealed some error patterns that had not
appeared without cognitive load.
Finally, this research has provided design recommendations to answer the
last research question, From the error patterns found in the experiment, what
design recommendations would help learning portal designers’ to create usable
learning portals?. The next section will explain these design recommendations in
detail.
53

Design Recommendations
From the error patterns found in this study, the recommendations for fixing
these problems are as follows. They are categorized according to Nielsen’s
severity rating.6
Usability catastrophe problems
Problem Users could not locate facilities for moving easily.
Explanation To move a file(s) or a folder(s), first the user has to select the
checkbox in front of the objects he/she want to move. Then,
the “Move Checked” (as well as the “Remove Checked” and
the “Copy Checked”) buttons will be active.
Observations The button looks inactivated for the users. Even when they
already check the checkbox in front of a file. When the users
move the mouse pointer over the buttons, they expected to see
a hand-shape pointer. However, the pointer shape is still an
arrow. As a result, the users thought that it is still not
clickable.
Recommendation Change the mouse-over shape of the pointer to a hand.
Problem Users could not locate facilities for pasting easily.
Explanation A link “Paste Moved Items” is available in the Actions
column after the users already clicked “Move Checked”
button.
6 http://www.useit.com/papers/heuristic/severityrating.html
54
Observations There are also “Add” and “Revise” in the Actions column.
These links are always available and there is too much text on
the interface so that when the “Paste Moved Items” appears on
the interface, the users did not notice it. Moreover, the
location of the link is not where the users expected. They
looked at the top row where the “Move Checked” button is
placed.
Recommendation Change the “Move Checked” button to a drop-down menu
with destination folders listed inside so that after the users
click move, they can select the destination folder immediately.
Problem Users could not find facilities for creating a new folder
easily.
Explanation To create a new folder, the users have to click on the “Add”
link to go to the “Add Item(s)” page, then select “Empty
Folder” from the drop-down list.
Observations Many participants reported that they did see the “Add” link but
did not think it was relevant, so that they ignored it. Although
most of the participants got as far as the “Add Item(s)” page,
they still could not find the “Empty Folder” on the drop-down
list. They explained that because the “File Upload” is
highlighted by default, they read from that highlighted line
down until the last item in the list. That is why they did not
notice that there is “Empty Folder” placed above the “File
55

Upload.”
Recommendation • Place “Empty Folder” down under “File Upload”
• Move the drop-down menu to the front page and rename it
to “Add new item(s)” or “Add new…” and place it at the
same location as “Remove Checked,” “Move Checked,”
and “Copy Checked” because that is the location the users
expected to find it.
Major usability problems
Problem Users created a new folder and uploaded a file at the same
time using the “File Upload” function.
Explanation The “Add Item(s)” page displays the “File Upload” function
by default. To create a new folder the users have to select
“Empty Folder” from the drop-down list first, then enter the
After click on the arrow
By default
56

title of the folder, and click “Add.”
Observations The highlight on the “Properties” line is more prominent than
the heading “File Upload,” “Folder,” or “Access.” As a result,
what users see is not what the designer intended to. The page
seems to be separated into Add Items and Properties instead of
Add Items and File Upload.
When the users saw “Choose a file,” they selected a file to
upload. Below the “Choose a file” line, is a Properties line
which is intended to be properties of the file. However, the
highlight makes it looks like it starts a new section. So, when
users saw the next line saying “Title” they thought that they
were supposed to enter the name of a folder they wanted to put
the file in.
Recommendation Make the Add Item(s) and File Upload heading more
57
prominent than the Properties one. It can also be simplified by
removing unnecessary items from the interface. For uploading
a file, the “Title” might not necessary.
Problem “Drop Box” links (as well as other tools’ link) do not bring
users to its front page as they expected.
Explanation The first time the users click the Drop Box link, it brings them
to Drop Box’s front page. If they are already in any folder
inside Drop Box, the link refreshes the page but goes nowhere.
If the users leave the Drop Box tool and go somewhere else,
when they come back to Drop Box, the interface shows the
page they visited before they leave.
Observations Whenever the users clicked on the Drop Box link, they
expected it to take them to the front page of Drop Box. If they
left the Drop Box tool and went somewhere else, when they
came back to Drop Box, the interface displayed the page they
had visited before they left. The users did not remember where
they had been, so they did not recognize the page. They were
confused by not seeing the front page.
Recommendation It should be more consistent. The same link should bring the
users to the same place. The “Drop Box” link should bring the
users to its front page every time. Otherwise, in case that the
users are already in Drop Box, the link should be disabled.
58
Problem The browser back button does not work.
Explanation Generally users use the browser’s back button to return to the
previous pages.
Observations The browser’s back button is disabled and it does not bring
users to the previous pages like they expected. The
breadcrumb navigation trail is available but somehow is not
working properly. When the users go 3-4 levels deep, the
breadcrumb does not keep track of the upper levels.
Recommendation If the back button must be disabled, the breadcrumb should be
working properly.
Minor usability problems
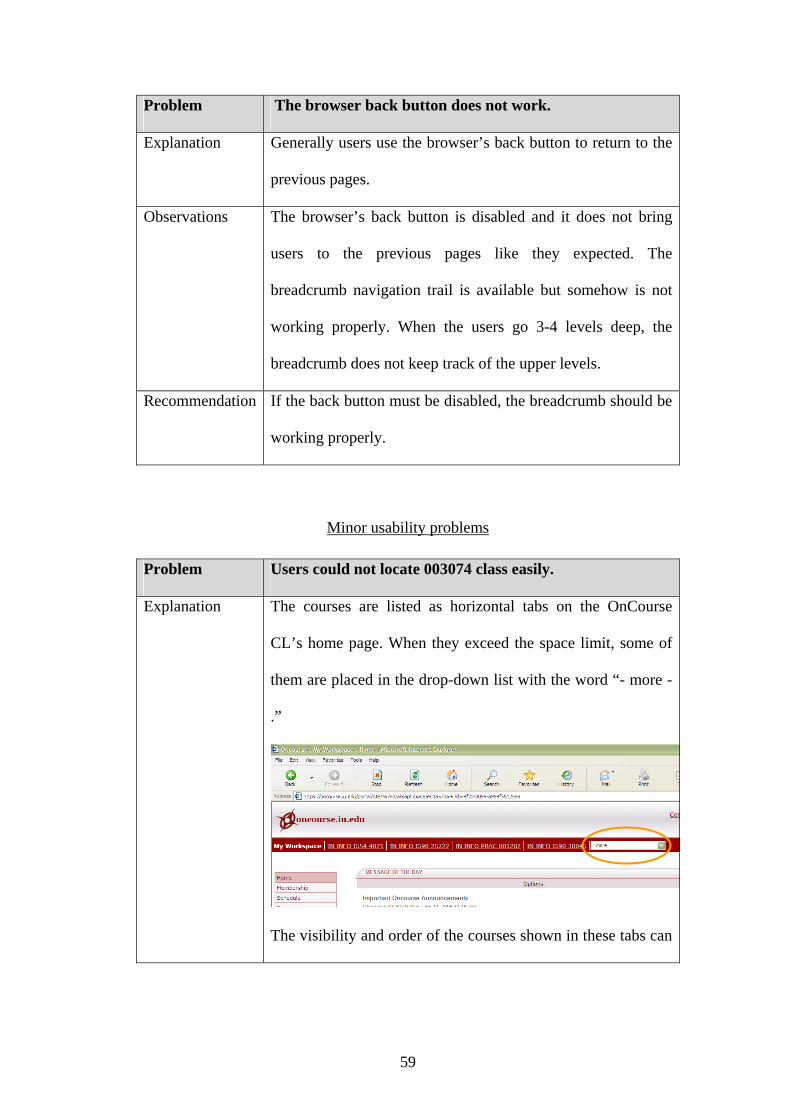
Problem Users could not locate 003074 class easily.
Explanation The courses are listed as horizontal tabs on the OnCourse
CL’s home page. When they exceed the space limit, some of
them are placed in the drop-down list with the word “- more -
.”
The visibility and order of the courses shown in these tabs can
59

be customized in “Preferences” > “Customize Tabs.” Users
can set any courses they do not want to show as “Sites not
visible in Tabs.” They can also rearrange the order of the
courses.
Observations • Two participants stated that the word “More” sounds like
there are more “Functions” in the drop-down list. They did
not know that it means more “Courses.”
• After showing the participants that the courses are listed
alphabetically, nine participants said that they prefer
courses to be listed by semester as they had been in the
original OnCourse.
• When showing them the function to customize these tabs,
almost all the users said that the function is too hard to
find and they probably would not know that it exists.
Recommendation The tabs should, by default, show the courses a student is
currently taking. Courses from previous semesters should be
listed by semester inside a drop-down list with a label
“Previous Semester” instead of “- more -.”
Cosmetic Problems
Problem Users did not notice that the file had already been moved
(pasted) into the folder.
60
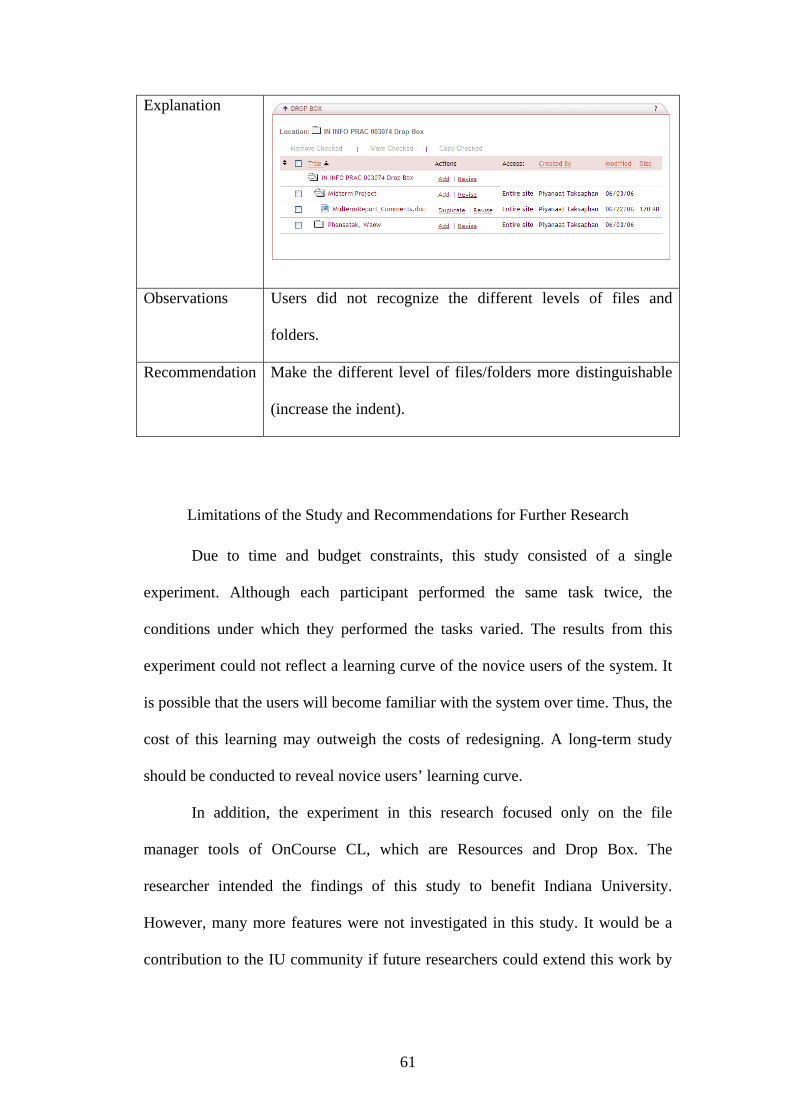
Explanation
Observations Users did not recognize the different levels of files and
folders.
Recommendation Make the different level of files/folders more distinguishable
(increase the indent).
Limitations of the Study and Recommendations for Further Research
Due to time and budget constraints, this study consisted of a single
experiment. Although each participant performed the same task twice, the
conditions under which they performed the tasks varied. The results from this
experiment could not reflect a learning curve of the novice users of the system. It
is possible that the users will become familiar with the system over time. Thus, the
cost of this learning may outweigh the costs of redesigning. A long-term study
should be conducted to reveal novice users’ learning curve.
In addition, the experiment in this research focused only on the file
manager tools of OnCourse CL, which are Resources and Drop Box. The
researcher intended the findings of this study to benefit Indiana University.
However, many more features were not investigated in this study. It would be a
contribution to the IU community if future researchers could extend this work by
61
focusing on other commonly-used tools on OnCourse CL, such as Assignments
and Announcements.
62
CHAPTER SIX: CONCLUSION
Summary of Research Findings
This research study has investigated how cognitive limitations affect users.
The users’ performance score and error patterns from the cognitive-load condition
were compared with those from the control condition. The results of this study
have shown that cognitive load affects users’ task performance. The user
performance score under the cognitive-load condition proved to be significantly
different from the control condition (F = 32.937, p < .000). The user performance
score under the cognitive-load condition was correlated better with both of the
subjective rating scores than the user performance score under the control
condition (r = -0.2418 vs. -0.1227 for the statement “I always know where I am in
OnCourse.” and r = 0.3753 vs. 0.2467 for the statement “It is easy to get lost.”).
The most correlated pair is the user performance score under cognitive load and
the statement “It is easy to get lost.” (r = 0.3753). Moreover, testing users under
cognitive load yields higher error frequency than testing users under the control
setting (58 vs. 32 occurrences). Specifically, three out of eleven error patterns
could be revealed only under the cognitive-load condition. These error patterns
were copying instead of moving files, creating a new folder, and uploading a file
at the same time using “File Upload” function, and forgetting what they were
trying to do. These error patterns fell into Norman’s error category of Description
Errors, Errors Resulting from Unintentional Activation of Schemas, and Errors
Resulting from Loss of Schemas Activation, respectively.
63
These findings suggest that it is necessary to simulate a cognitive-load
situation when conducting a usability evaluation to mimic users’ real situation.
Examples of such situations are a dynamic workplace, an environment of a
portable device, and a collaborative learning environment which was investigated
in this study. These environments have situational variability such as cognitive-
load, distraction, time-pressure, and task-switching that affects the user’s
cognitive resource limitations. A laboratory setting cannot replicate the error
patterns that occur in real life situations.
Summary of Contributions
This research study has made three contributions to the field of Human-
Computer Interaction (HCI) and to research on collaborative learning portals:
(1) The practical contribution: This thesis identifies some of the problems
with OnCourse CL, based on the findings from an empirical experiment, and
provides recommendations on how to fix them.
(2) A theoretical contribution: The thesis shows the benefits of artificially
increasing cognitive load to enhance the ecological validity of a usability
experiment conducted using the Novice-Expert ratio Method. A common
assumption in HCI work is that the higher the correlation between a
particular objective performance metric and a user’s subjective rating of
performance, the greater the construct validity of the objective performance
metric, because both the metric and the subjective rating are affected by the
same interface design and human cognitive constraints. Ultimately, they are
intended to measure the same thing: the system’s usability. Thus, the fact that
64
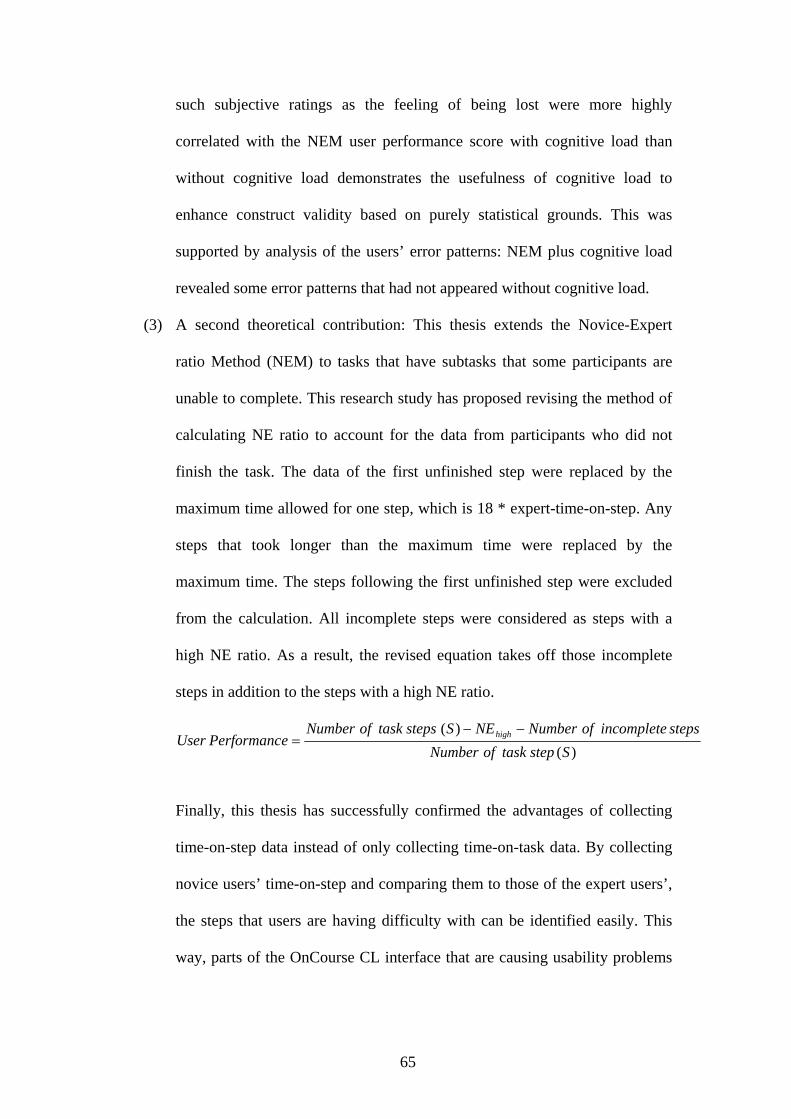
such subjective ratings as the feeling of being lost were more highly
correlated with the NEM user performance score with cognitive load than
without cognitive load demonstrates the usefulness of cognitive load to
enhance construct validity based on purely statistical grounds. This was
supported by analysis of the users’ error patterns: NEM plus cognitive load
revealed some error patterns that had not appeared without cognitive load.
(3) A second theoretical contribution: This thesis extends the Novice-Expert
ratio Method (NEM) to tasks that have subtasks that some participants are
unable to complete. This research study has proposed revising the method of
calculating NE ratio to account for the data from participants who did not
finish the task. The data of the first unfinished step were replaced by the
maximum time allowed for one step, which is 18 * expert-time-on-step. Any
steps that took longer than the maximum time were replaced by the
maximum time. The steps following the first unfinished step were excluded
from the calculation. All incomplete steps were considered as steps with a
high NE ratio. As a result, the revised equation takes off those incomplete
steps in addition to the steps with a high NE ratio.
)()(
SsteptaskofNumberstepsincompleteofNumberNESstepstaskofNumber
ePerformancUser high −−=
Finally, this thesis has successfully confirmed the advantages of collecting
time-on-step data instead of only collecting time-on-task data. By collecting
novice users’ time-on-step and comparing them to those of the expert users’,
the steps that users are having difficulty with can be identified easily. This
way, parts of the OnCourse CL interface that are causing usability problems
65
are emphasized and the degree of severity is presented via the ratio of the
novices’ time and the experts’ time.
66
REFERENCES
Byrne, M. D., & Bovair, S. (1997). A working memory model of a common
procedural error. Cognitive Science, 21(1), 31-61.
Chen, B., & Wang, H. (1997). A human-centered approach for designing World
Wide Web Browsers. Behavior Research Methods, Instruments, and
Computers, 29, 172-179.
Dias, P., Gomes, M. J., & Correia, A. P. (1999). Disorientation in hypermedia
environments: Mechanism to support navigation. Journal of Educational
Computing Research, 20(2), 93-117.
Eng, K., Lewis, R. L., Tollinger, I., Chu, A., Howes, A., & Vera, A. (2006).
Generating automated predictions of behavior strategically adapted to
specific performance objectives. Paper presented at the Proceedings of the
SIGCHI conference on Human Factors in computing systems, Montréal,
Québec, Canada.
Eveland, W. P., & Dunwoody, S. (2001). User control and structural isomorphism
or disorientation and cognitive load? Learning from the Web versus print.
Communication Research, 28(1), 48-78.
Feinberg, S., & Murphy, M. (2000). Applying cognitive load theory to the design
of web-based instruction. Paper presented at the Proceedings of IEEE
professional communication society international professional
communication conference and Proceedings of the 18th annual ACM
international conference on Computer documentation: technology &
teamwork, Cambridge, Massachusetts.
67
Forbes-Pitt, K. (2002). LSE for you: Secure interaction with personalised
information for students and staff delivered via the World Wide Web.
Paper presented at the Proceedings of the 30th Annual ACM SIGUCCS
Conference on User Services, Providence, Rhode Island, USA.
John, B. E., & Kieras, D. E. (1996). The GOMS family of user interface analysis
techniques. ACM Transactions on Computer-Human Interaction, 3(4).
Kellogg, W. A., & Breen, T. J. (1987). Evaluating user and system models:
Applying scaling techniques to problems in human-computer interaction.
Paper presented at the Proceedings of the SIGCHI/GI conference on
Human factors in computing systems and graphics interface, Toronto,
Ontario, Canada.
Larson, K., & Czerwinski, M. (1998). Web page design: Implications of memory,
structure and scent for information retrieval. Paper presented at the
Proceedings of the SIGCHI conference on Human factors in computing
systems, Los Angeles, California, United States.
Lindmark, K. (2000). Interpreting symptoms of cognitive load and time pressure
in manual input. Saarland University, Germany.
Margaret, M. M. (1997). CSCL report: Human computer interaction and
educational tools (HCI-ET) conference report. Paper presented at the
SIGGROUP Bull., Sozopol, Bulgaria.
Müller, C., Großmann-Hutter, B., Jameson, A., Rummer, R., & Wittig, F. (2001).
Recognizing Time Pressure and Cognitive Load on the Basis of Speech:
An Experimental Study. Paper presented at the Proceedings of the 8th
International Conference on User Modeling 2001.
68
Nakayama, T., Kato, H., & Yamane, Y. (2000). Discovering the gap between Web
site designers' expectations and users' behavior. Computer Networks, 33(1-
6), 811-822.
Nielsen, J. (1999, April 4). Intranet portals: The corporate information
infrastructure. Useit Retrieved November 22, 2005, from
http://www.useit.com/alertbox/990404.html
Nielsen, J., & Wagner, A. (1996). User interface design for the WWW. Paper
presented at the Conference Companion on Human factors in Computing
Systems: Common Ground, Vancouver, British Columbia, Canada.
Olson, J. R., & Olson, G. M. (1990). The growth of cognitive modeling in human-
computer interaction since GOMS. Human-Computer Interaction, 5, 221-
265.
Paas, F., Tuovinen, J. E., Tabbers, H., & Van Gerven, P. W. M. (2003). Cognitive
load measurement as a means to advance cognitive load theory.
Educational Psychologist, 38(1), 63-71.
Proctor, R. W., & Zandt, T. V. (1993). Human factors in simple and complex
systems (1st ed.): Allyn and Bacon.
Sellen, A. J., & Norman, D. A. (1992). The psychology of slips. In B. J. Baars
(Ed.), Experimental slips and human error: Exploring the architecture of
volition.New York: Plenum Press.
Sheard, J., & Ceddia, J. (2004). Conceptualisation of the Web and disorientation.
Paper presented at the AusWeb'04: The Tenth Australian World Wide Web
Conference, Gold Coast, Australia.
69
Strauss, H. (2003). Web portals: The future of information access and distribution.
The Serials Librarian, 44(1/2), 27-35.
Urokohara, H., Tanaka, K., Furuta, K., Honda, M., & Kurosu, M. (2000). NEM:
"Novice expert ratio method" A usability evaluation method to generate a
new performance measure. Paper presented at the CHI '00 extended
abstracts on Human factors in computing systems, The Hague, The
Netherlands.
Ursula, W., Jacob, P., Penny, A., Zhi, C., James, D., Goran, K., et al. (1997).
Computer-mediated communication in collaborative educational settings:
Report of the ITiCSE '97 working group on CMC in collaborative
educational settings. SIGCUE Outlook, 25(4), 51-68.
Waloszek, G. (2001). Portal usability - Is there such a thing? SAP Design Guide,
from http://www.sapdesignguild.org/editions/edition3/portal_usab.asp
Zayour, I., & Lethbridge, T. C. (2000). A cognitive and user centric based
approach for reverse engineering tool design. Paper presented at the
Proceedings of the 2000 conference of the Centre for Advanced Studies on
Collaborative research, Mississauga, Ontario, Canada.
70
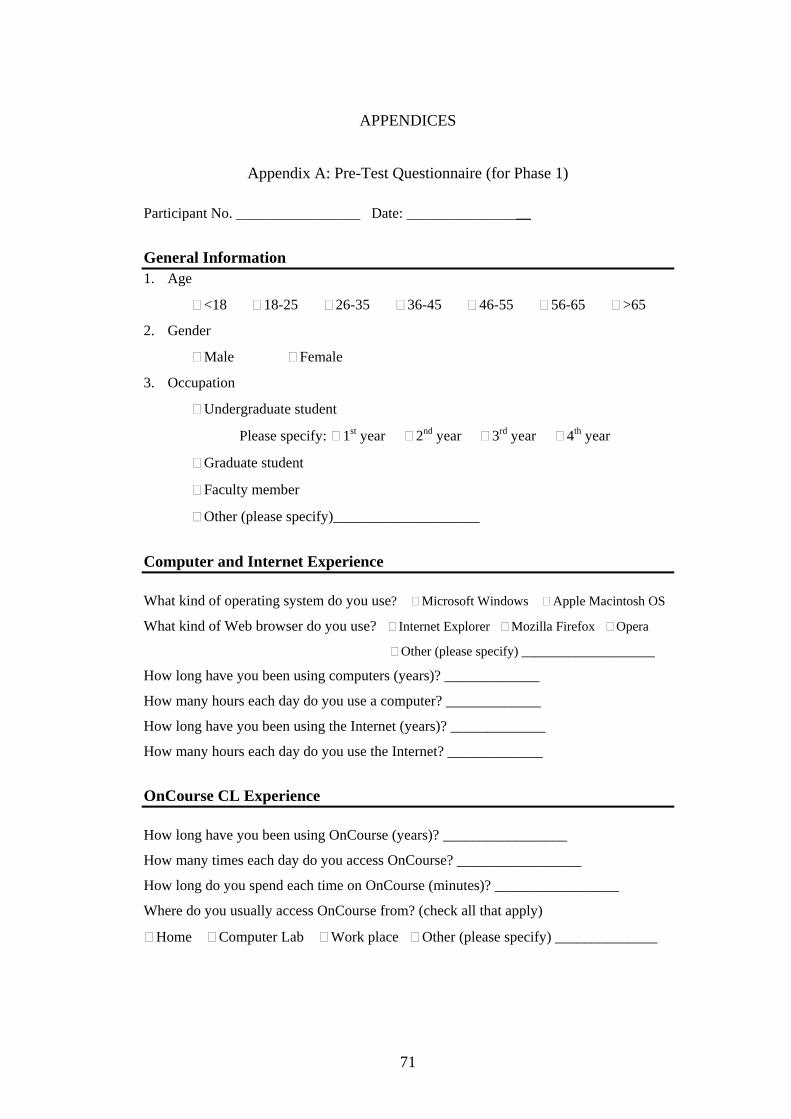
APPENDICES
Appendix A: Pre-Test Questionnaire (for Phase 1)
Participant No. _________________ Date: _________________
General Information 1. Age
<18 18-25 26-35 36-45 46-55 56-65 >65
2. Gender
Male Female
3. Occupation
Undergraduate student
Please specify: 1st year 2nd year 3rd year 4th year
Graduate student
Faculty member
Other (please specify)____________________
Computer and Internet Experience
What kind of operating system do you use? Microsoft Windows Apple Macintosh OS
What kind of Web browser do you use? Internet Explorer Mozilla Firefox Opera
Other (please specify) ____________________
How long have you been using computers (years)? _____________
How many hours each day do you use a computer? _____________
How long have you been using the Internet (years)? _____________
How many hours each day do you use the Internet? _____________
OnCourse CL Experience
How long have you been using OnCourse (years)? _________________
How many times each day do you access OnCourse? _________________
How long do you spend each time on OnCourse (minutes)? _________________
Where do you usually access OnCourse from? (check all that apply)
Home Computer Lab Work place Other (please specify) ______________
71
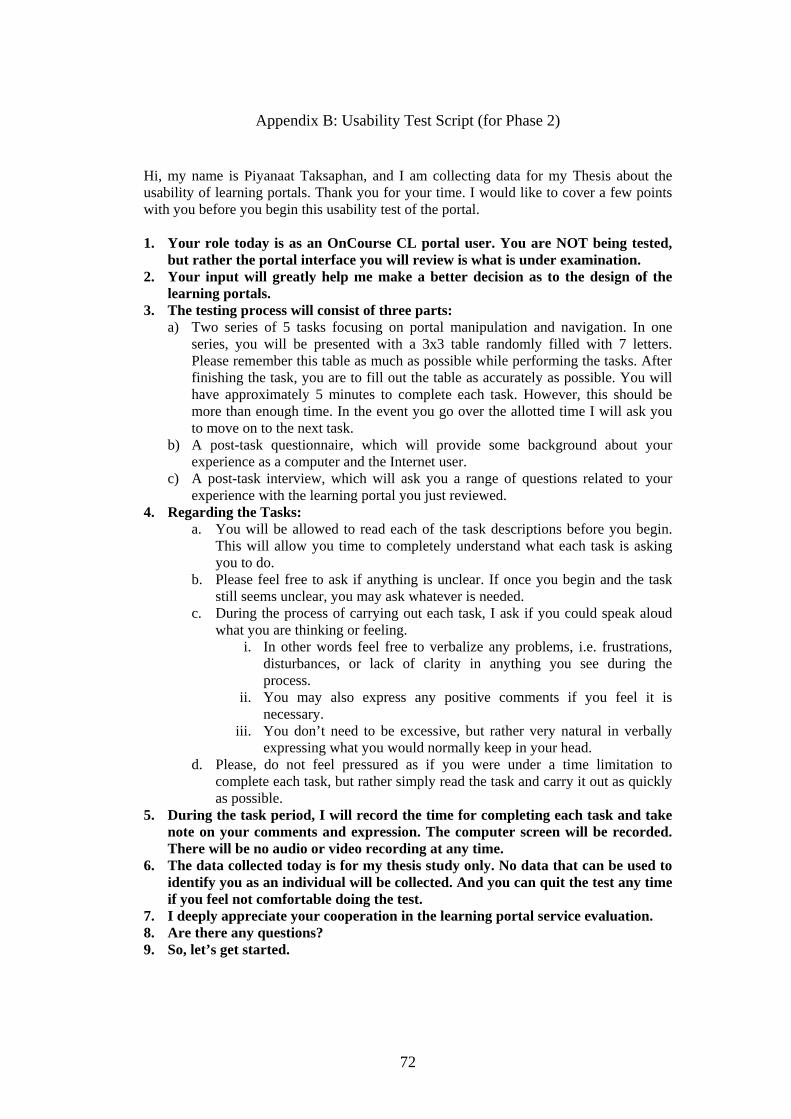
Appendix B: Usability Test Script (for Phase 2)
Hi, my name is Piyanaat Taksaphan, and I am collecting data for my Thesis about the usability of learning portals. Thank you for your time. I would like to cover a few points with you before you begin this usability test of the portal. 1. Your role today is as an OnCourse CL portal user. You are NOT being tested,
but rather the portal interface you will review is what is under examination. 2. Your input will greatly help me make a better decision as to the design of the
learning portals. 3. The testing process will consist of three parts:
a) Two series of 5 tasks focusing on portal manipulation and navigation. In one series, you will be presented with a 3x3 table randomly filled with 7 letters. Please remember this table as much as possible while performing the tasks. After finishing the task, you are to fill out the table as accurately as possible. You will have approximately 5 minutes to complete each task. However, this should be more than enough time. In the event you go over the allotted time I will ask you to move on to the next task.
b) A post-task questionnaire, which will provide some background about your experience as a computer and the Internet user.
c) A post-task interview, which will ask you a range of questions related to your experience with the learning portal you just reviewed.
4. Regarding the Tasks: a. You will be allowed to read each of the task descriptions before you begin.
This will allow you time to completely understand what each task is asking you to do.
b. Please feel free to ask if anything is unclear. If once you begin and the task still seems unclear, you may ask whatever is needed.
c. During the process of carrying out each task, I ask if you could speak aloud what you are thinking or feeling.
i. In other words feel free to verbalize any problems, i.e. frustrations, disturbances, or lack of clarity in anything you see during the process.
ii. You may also express any positive comments if you feel it is necessary.
iii. You don’t need to be excessive, but rather very natural in verbally expressing what you would normally keep in your head.
d. Please, do not feel pressured as if you were under a time limitation to complete each task, but rather simply read the task and carry it out as quickly as possible.
5. During the task period, I will record the time for completing each task and take note on your comments and expression. The computer screen will be recorded. There will be no audio or video recording at any time.
6. The data collected today is for my thesis study only. No data that can be used to identify you as an individual will be collected. And you can quit the test any time if you feel not comfortable doing the test.
7. I deeply appreciate your cooperation in the learning portal service evaluation. 8. Are there any questions? 9. So, let’s get started.
72
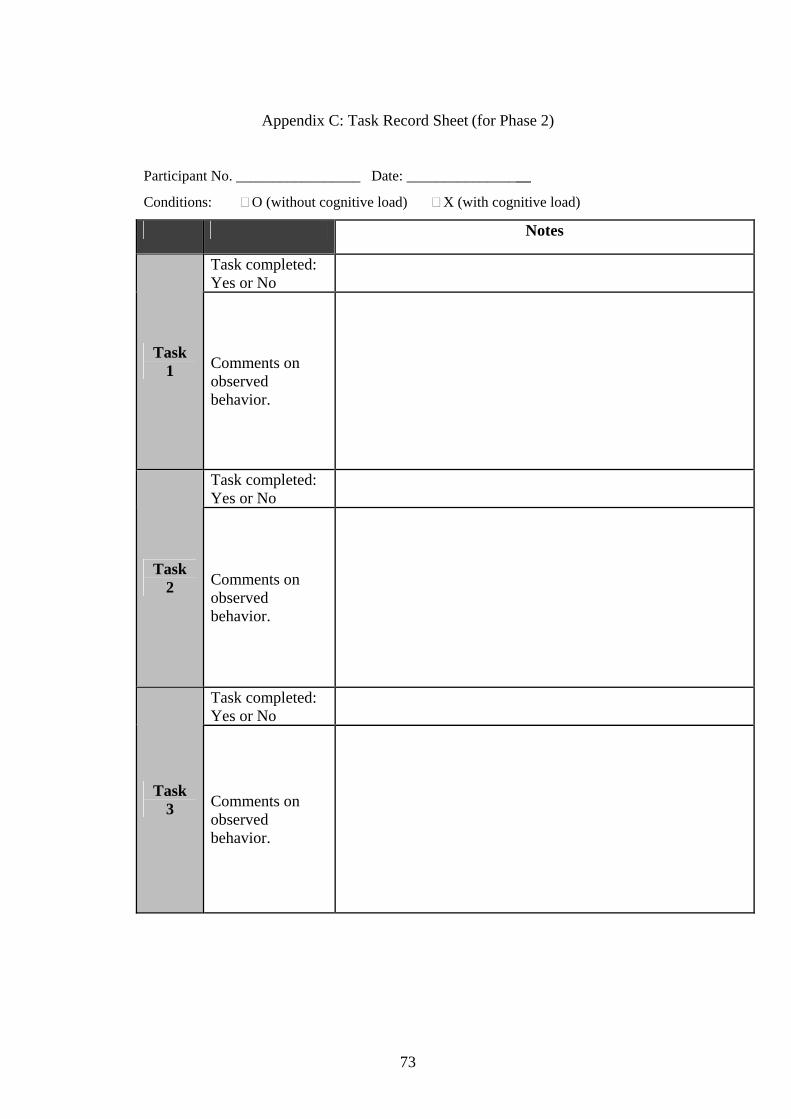
Appendix C: Task Record Sheet (for Phase 2)
Participant No. _________________ Date: _________________
Conditions: O (without cognitive load) X (with cognitive load)
Notes
Task completed: Yes or No
Task 1 Comments on
observed behavior.
Task completed: Yes or No
Task 2 Comments on
observed behavior.
Task completed: Yes or No
Task 3 Comments on
observed behavior.
73
Task completed: Yes or No
Task 4 Comments on
observed behavior.
Task completed: Yes or No
Task 5 Comments on
observed behavior.
74
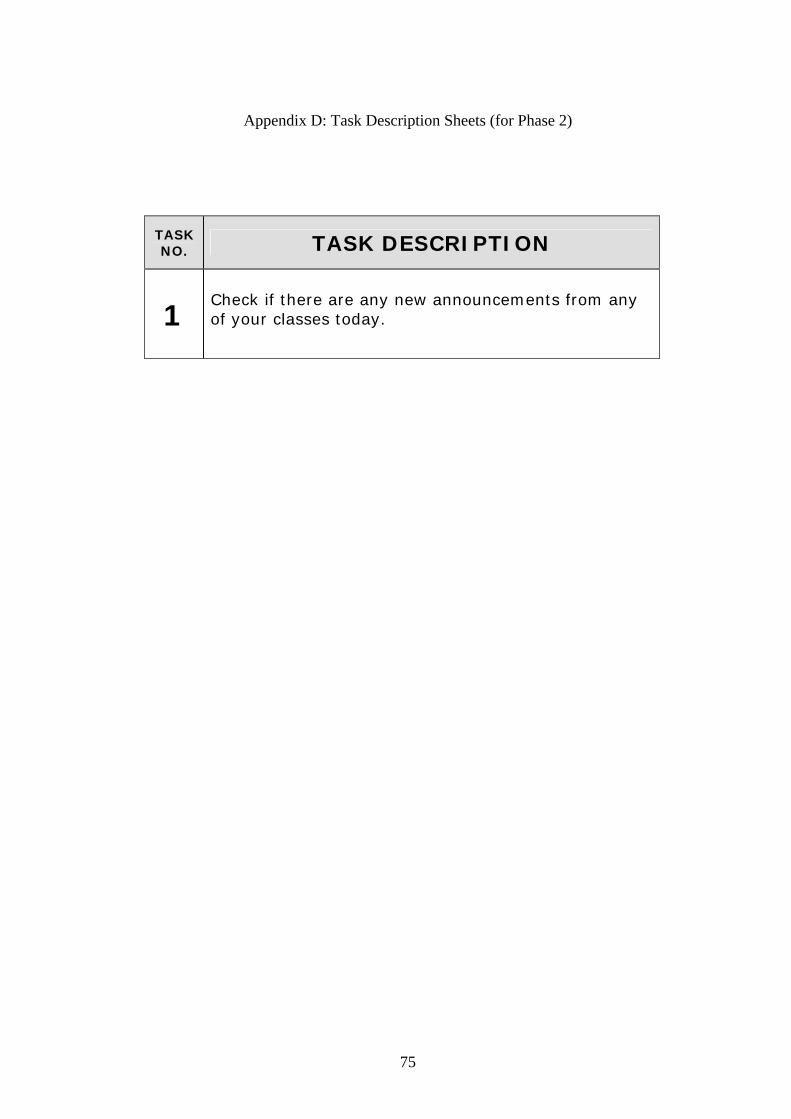
Appendix D: Task Description Sheets (for Phase 2)
TASK NO. TASK DESCRIPTION
1 Check if there are any new announcements from any of your classes today.
75
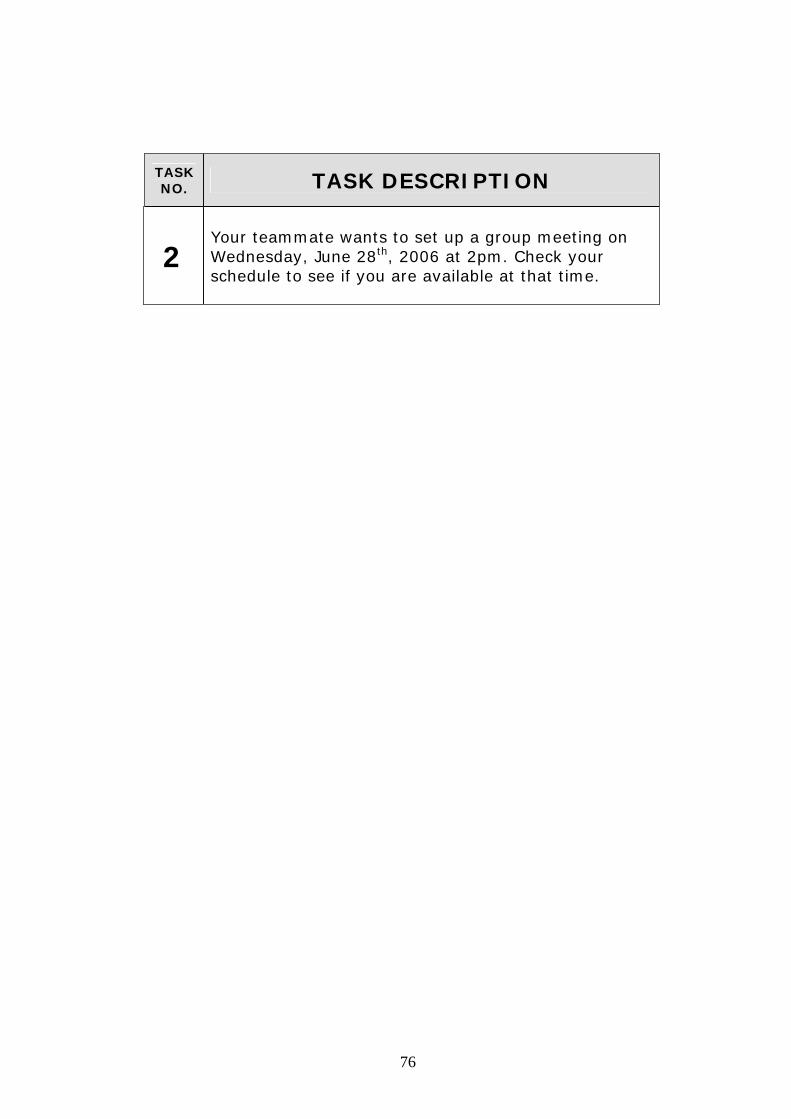
TASK NO. TASK DESCRIPTION
2 Your teammate wants to set up a group meeting on Wednesday, June 28th, 2006 at 2pm. Check your schedule to see if you are available at that time.
76
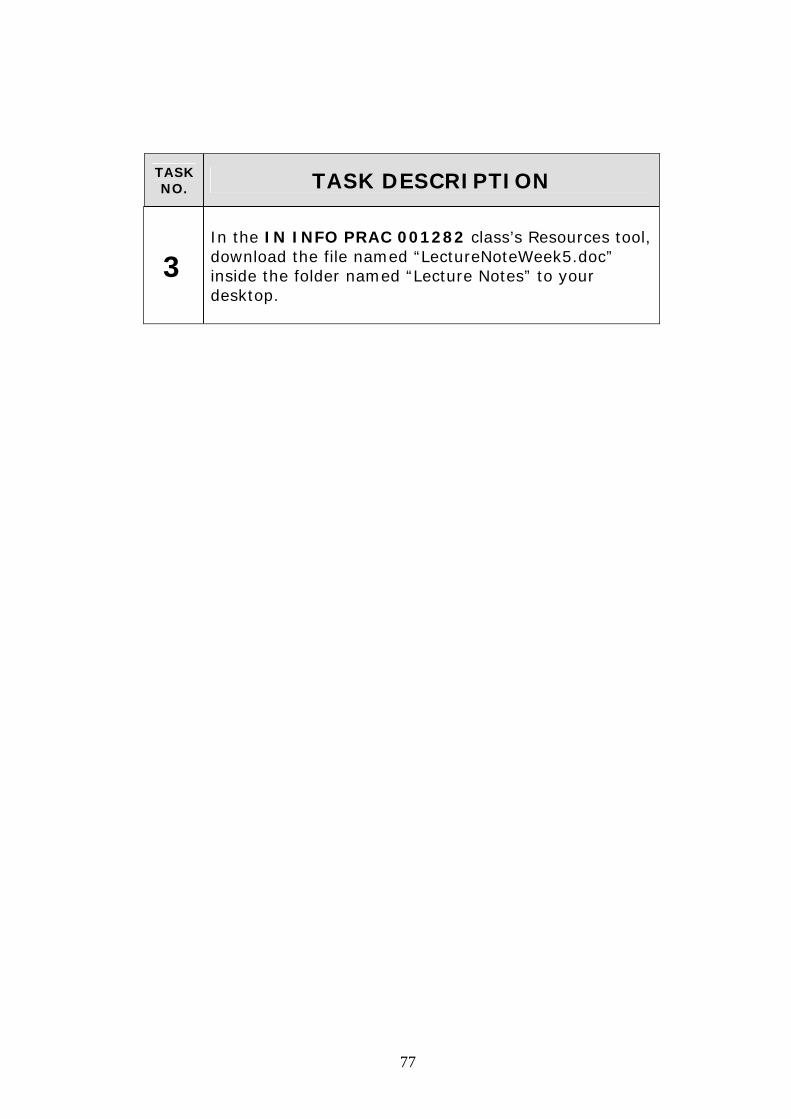
TASK NO. TASK DESCRIPTION
3
In the IN INFO PRAC 001282 class’s Resources tool, download the file named “LectureNoteWeek5.doc” inside the folder named “Lecture Notes” to your desktop.
77
TASK NO. TASK DESCRIPTION
4 In the IN INFO PRAC 003074 class’s Drop Box, move the “MidtermReport_Comments.doc” file to “Midterm Project” folder.
78
79
TASK NO. TASK DESCRIPTION
5
There is a file named “ProgressReport.doc” on the desktop. In your IN INFO PRAC 001282 class’s Drop Box, create a new folder called “Final Project”, and then place the file into this folder.
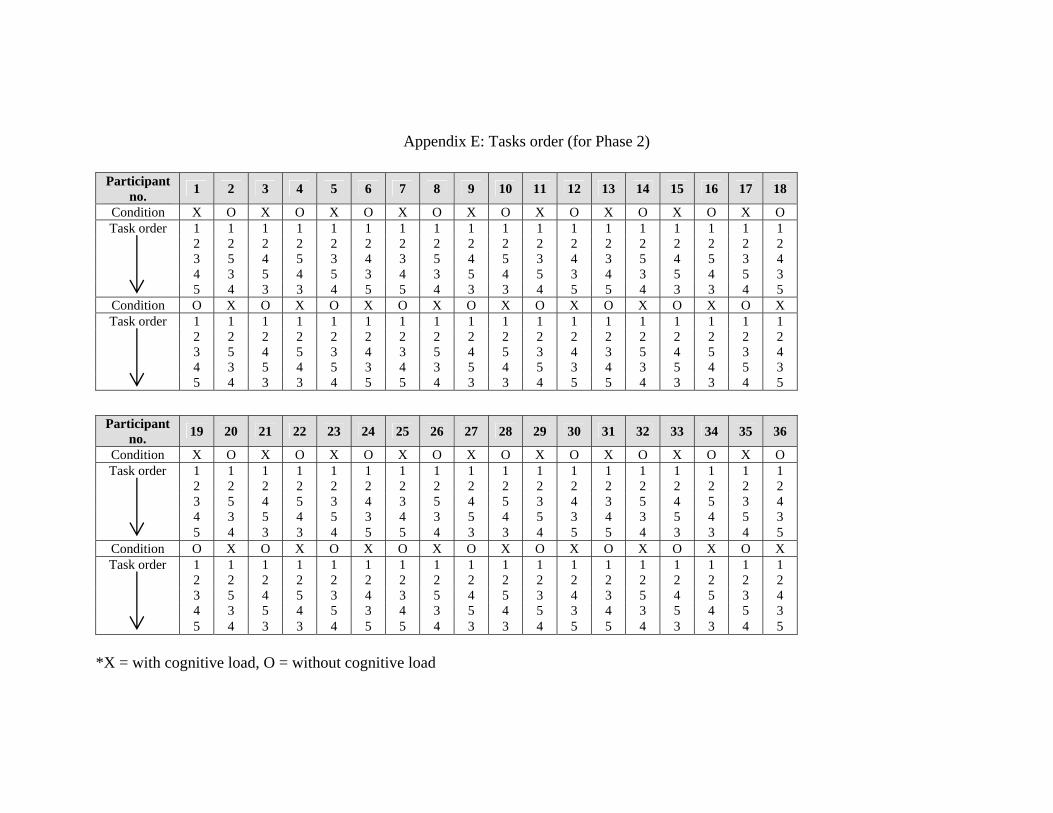
Appendix E: Tasks order (for Phase 2)
Participant no. 1 2 3 4 5 6 7 8 9 10 11 12 13 14 15 16 17 18
Condition X O X O X O X O X O X O X O X O X O1 1 1 1 1 1 1 1 1 1 1 1 1 1 1 1 1 12 2 2 2 2 2 2 2 2 2 2 2 2 2 2 2 2 23 5 4 5 3 4 3 5 4 5 3 4 3 5 4 5 3 44 3 5 4 5 3 4 3 5 4 5 3 4 3 5 4 5 3
Task order
5 4 3 3 4 5 5 4 3 3 4 5 5 4 3 3 4 5Condition O X O X O X O X O X O X O X O X O X
1 1 1 1 1 1 1 1 1 1 1 1 1 1 1 1 1 12 2 2 2 2 2 2 2 2 2 2 2 2 2 2 2 2 23 5 4 5 3 4 3 5 4 5 3 4 3 5 4 5 3 44 3 5 4 5 3 4 3 5 4 5 3 4 3 5 4 5 3
Task order
5 4 3 3 4 5 5 4 3 3 4 5 5 4 3 3 4 5
Participant no. 19 20 21 22 23 24 25 26 27 28 29 30 31 32 33 34 35 36
Condition X O X O X O X O X O X O X O X O X O1 1 1 1 1 1 1 1 1 1 1 1 1 1 1 1 1 12 2 2 2 2 2 2 2 2 2 2 2 2 2 2 2 2 23 5 4 5 3 4 3 5 4 5 3 4 3 5 4 5 3 44 3 5 4 5 3 4 3 5 4 5 3 4 3 5 4 5 3
Task order
5 4 3 3 4 5 5 4 3 3 4 5 5 4 3 3 4 5Condition O X O X O X O X O X O X O X O X O X
1 1 1 1 1 1 1 1 1 1 1 1 1 1 1 1 1 12 2 2 2 2 2 2 2 2 2 2 2 2 2 2 2 2 23 5 4 5 3 4 3 5 4 5 3 4 3 5 4 5 3 44 3 5 4 5 3 4 3 5 4 5 3 4 3 5 4 5 3
Task order
5 4 3 3 4 5 5 4 3 3 4 5 5 4 3 3 4 5 *X = with cognitive load, O = without cognitive load
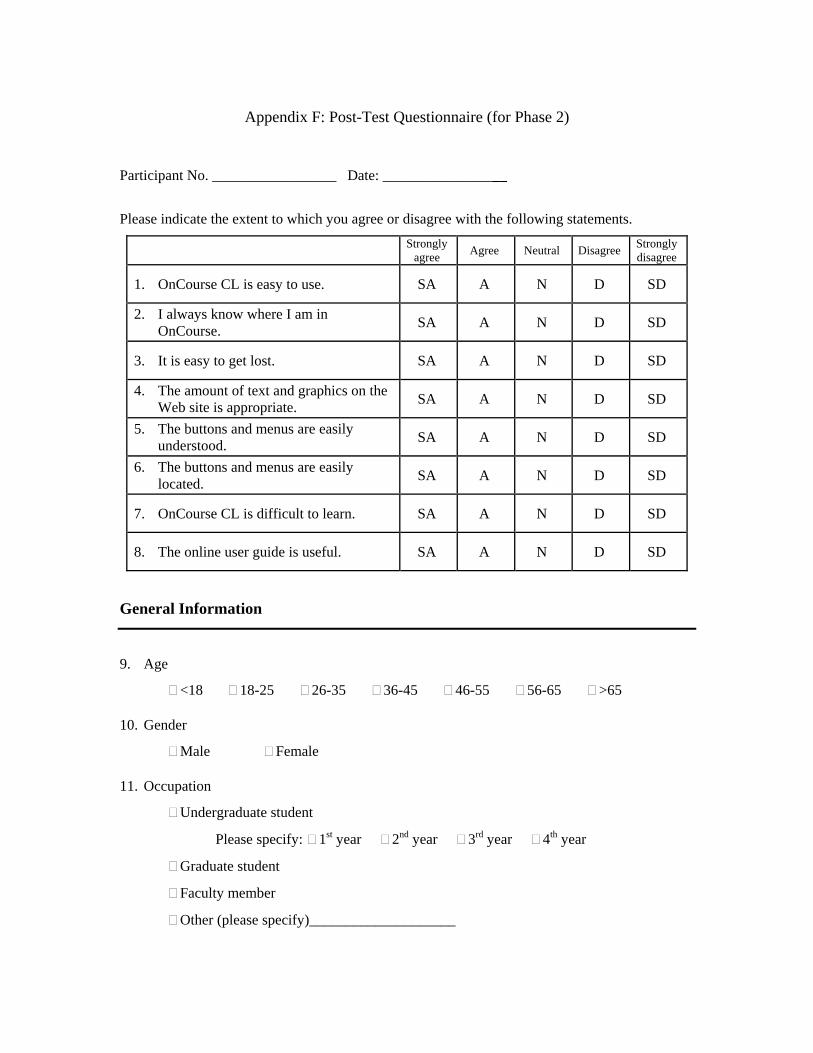
Appendix F: Post-Test Questionnaire (for Phase 2)
Participant No. _________________ Date: _________________
Please indicate the extent to which you agree or disagree with the following statements.
Strongly agree Agree Neutral Disagree Strongly
disagree
1. OnCourse CL is easy to use. SA A N D SD
2. I always know where I am in OnCourse. SA A N D SD
3. It is easy to get lost. SA A N D SD
4. The amount of text and graphics on the Web site is appropriate. SA A N D SD
5. The buttons and menus are easily understood. SA A N D SD
6. The buttons and menus are easily located. SA A N D SD
7. OnCourse CL is difficult to learn. SA A N D SD
8. The online user guide is useful. SA A N D SD
General Information
9. Age
<18 18-25 26-35 36-45 46-55 56-65 >65
10. Gender
Male Female
11. Occupation
Undergraduate student
Please specify: 1st year 2nd year 3rd year 4th year
Graduate student
Faculty member
Other (please specify)____________________
Computer and Internet Experience
12. What kind of operating system do you use?
Microsoft Windows Apple Macintosh OS Unix or Linux
13. What kind of Web browser do you use?
Internet Explorer Mozilla Firefox Opera
Netscape Other (please specify) ____________
14. How long have you been using computers (years)? _____________
15. How many hours each week do you use a computer? _____________
16. How long have you been using the Internet (years)? _____________
17. How many hours each week do you use the Internet? _____________
OnCourse (Old version) Experience
18. How long have you been using OnCourse (months)? _________________
19. How many days a week do you use OnCourse? _________________
20. How long do you spend each time on OnCourse (minutes)? _________________
21. Where do you usually access OnCourse from? (check all that apply)
Home Computer Lab Work place Other (please specify) ______________
82
Appendix G: Post-Test Interview Session Form (for Phase 2)
Participant No. _________________ Date: _________________
1. What were the biggest difficulties you found on the previous tasks?
______________________________________________________________________________________________________________________________________________________________________________________________________________________________________________________________________________________________________________________________________________________________________________________________________________________________ _____________________________________________________________________
2. What did you like about OnCourse CL?
______________________________________________________________________________________________________________________________________________________________________________________________________________________________________________________________________________________________________________________________________________________________________________________________________________________________ _____________________________________________________________________
3. What did you dislike about OnCourse CL?
___________________________________________________________________________________________________________________________________________________________________________________________________________________________________________________________________________________________________________________________________________________________________________________________________________________________________________________________________________________________________
4. Do you have any comments or suggestions that you feel could help improve the
interface of OnCourse CL?
____________________________________________________________________________________________________________________________________________________________________________________________________________________________________________________________________________________ __________________________________________________________________________________________________________________________________________ _____________________________________________________________________
83
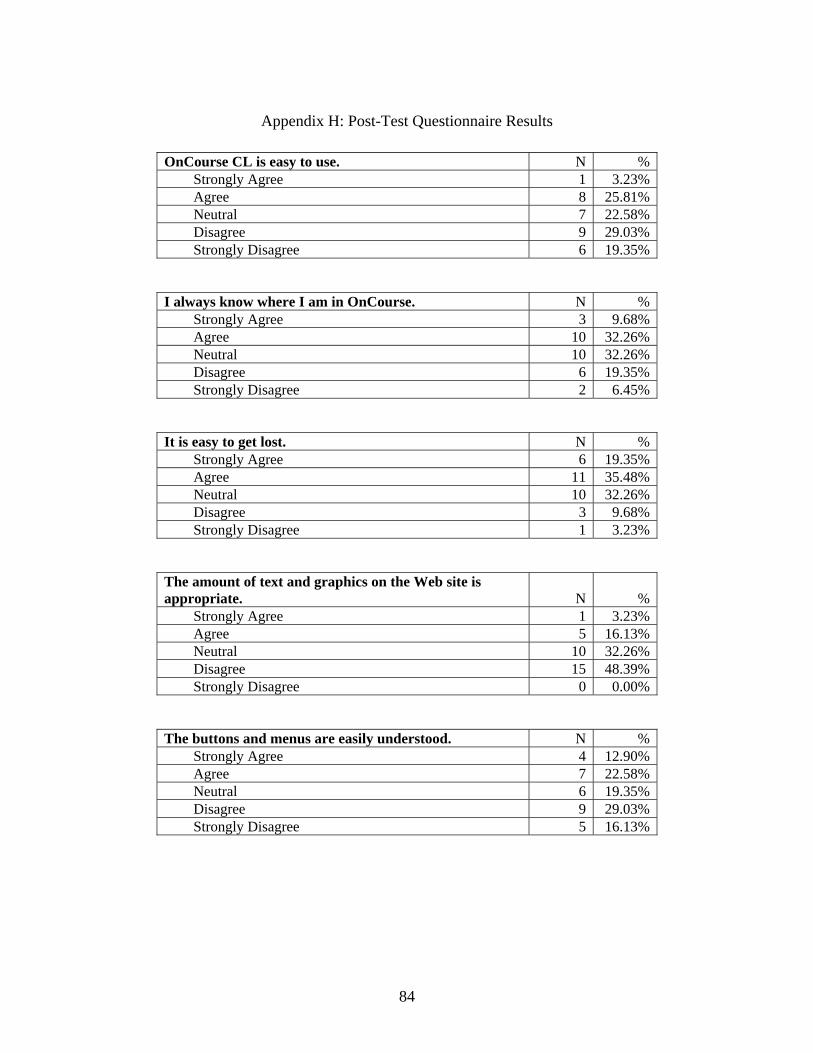
Appendix H: Post-Test Questionnaire Results
OnCourse CL is easy to use. N % Strongly Agree 1 3.23% Agree 8 25.81% Neutral 7 22.58% Disagree 9 29.03% Strongly Disagree 6 19.35%
I always know where I am in OnCourse. N % Strongly Agree 3 9.68% Agree 10 32.26% Neutral 10 32.26% Disagree 6 19.35% Strongly Disagree 2 6.45%
It is easy to get lost. N % Strongly Agree 6 19.35% Agree 11 35.48% Neutral 10 32.26% Disagree 3 9.68% Strongly Disagree 1 3.23%
The amount of text and graphics on the Web site is appropriate. N %
Strongly Agree 1 3.23% Agree 5 16.13% Neutral 10 32.26% Disagree 15 48.39% Strongly Disagree 0 0.00%
The buttons and menus are easily understood. N % Strongly Agree 4 12.90% Agree 7 22.58% Neutral 6 19.35% Disagree 9 29.03% Strongly Disagree 5 16.13%
84
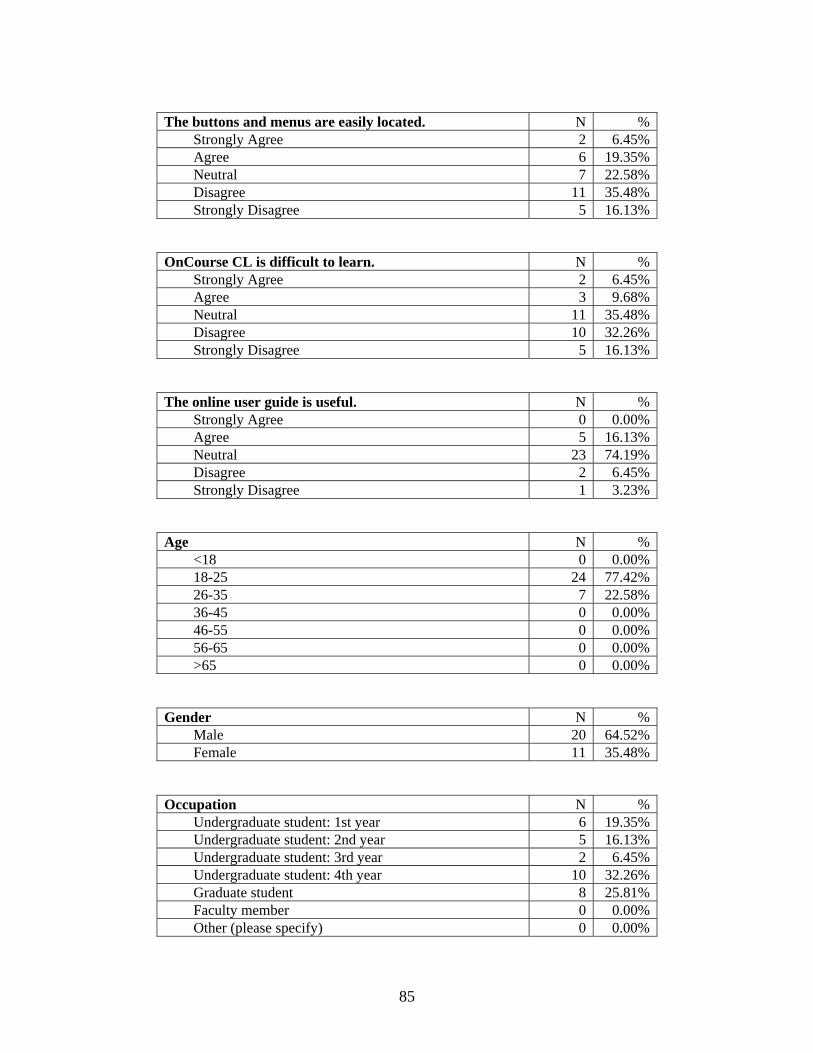
The buttons and menus are easily located. N %
Strongly Agree 2 6.45% Agree 6 19.35% Neutral 7 22.58% Disagree 11 35.48% Strongly Disagree 5 16.13%
OnCourse CL is difficult to learn. N % Strongly Agree 2 6.45% Agree 3 9.68% Neutral 11 35.48% Disagree 10 32.26% Strongly Disagree 5 16.13%
The online user guide is useful. N % Strongly Agree 0 0.00% Agree 5 16.13% Neutral 23 74.19% Disagree 2 6.45% Strongly Disagree 1 3.23%
Age N % <18 0 0.00% 18-25 24 77.42% 26-35 7 22.58% 36-45 0 0.00% 46-55 0 0.00% 56-65 0 0.00% >65 0 0.00%
Gender N % Male 20 64.52% Female 11 35.48%
Occupation N % Undergraduate student: 1st year 6 19.35% Undergraduate student: 2nd year 5 16.13% Undergraduate student: 3rd year 2 6.45% Undergraduate student: 4th year 10 32.26% Graduate student 8 25.81% Faculty member 0 0.00% Other (please specify) 0 0.00%
85
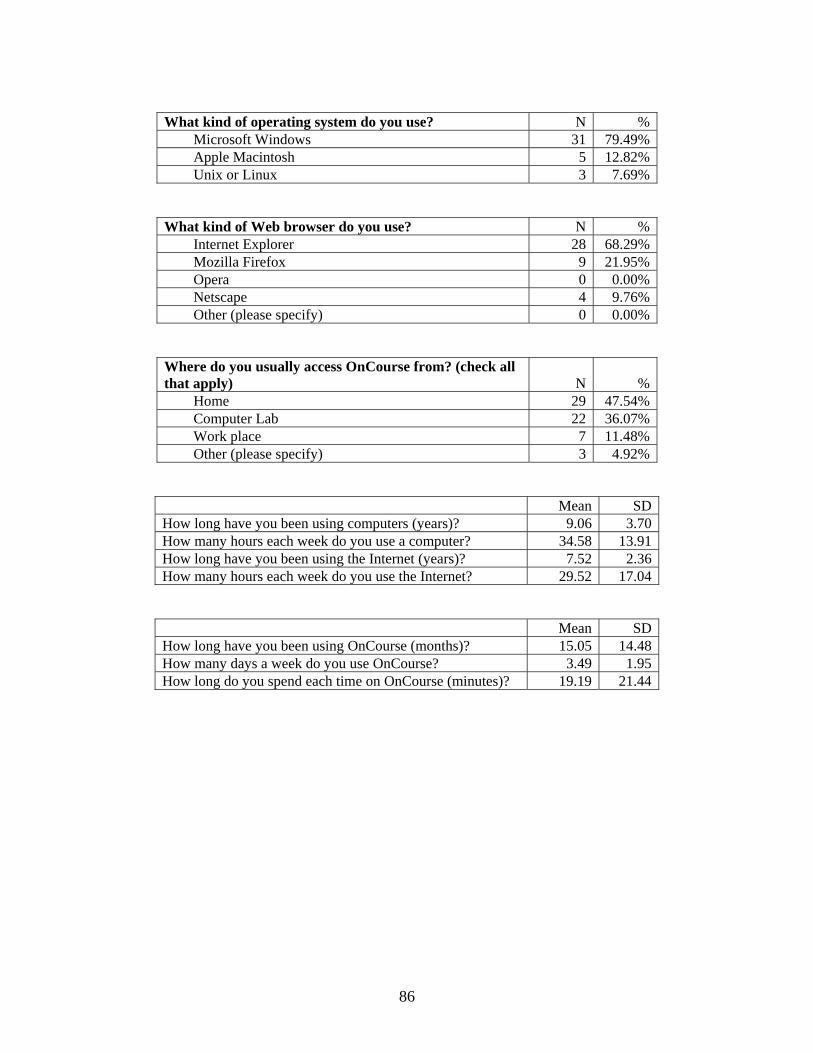
What kind of operating system do you use? N %
Microsoft Windows 31 79.49% Apple Macintosh 5 12.82% Unix or Linux 3 7.69%
What kind of Web browser do you use? N % Internet Explorer 28 68.29% Mozilla Firefox 9 21.95% Opera 0 0.00% Netscape 4 9.76% Other (please specify) 0 0.00%
Where do you usually access OnCourse from? (check all that apply) N %
Home 29 47.54% Computer Lab 22 36.07% Work place 7 11.48% Other (please specify) 3 4.92%
Mean SD How long have you been using computers (years)? 9.06 3.70 How many hours each week do you use a computer? 34.58 13.91 How long have you been using the Internet (years)? 7.52 2.36 How many hours each week do you use the Internet? 29.52 17.04
Mean SD How long have you been using OnCourse (months)? 15.05 14.48 How many days a week do you use OnCourse? 3.49 1.95 How long do you spend each time on OnCourse (minutes)? 19.19 21.44
86
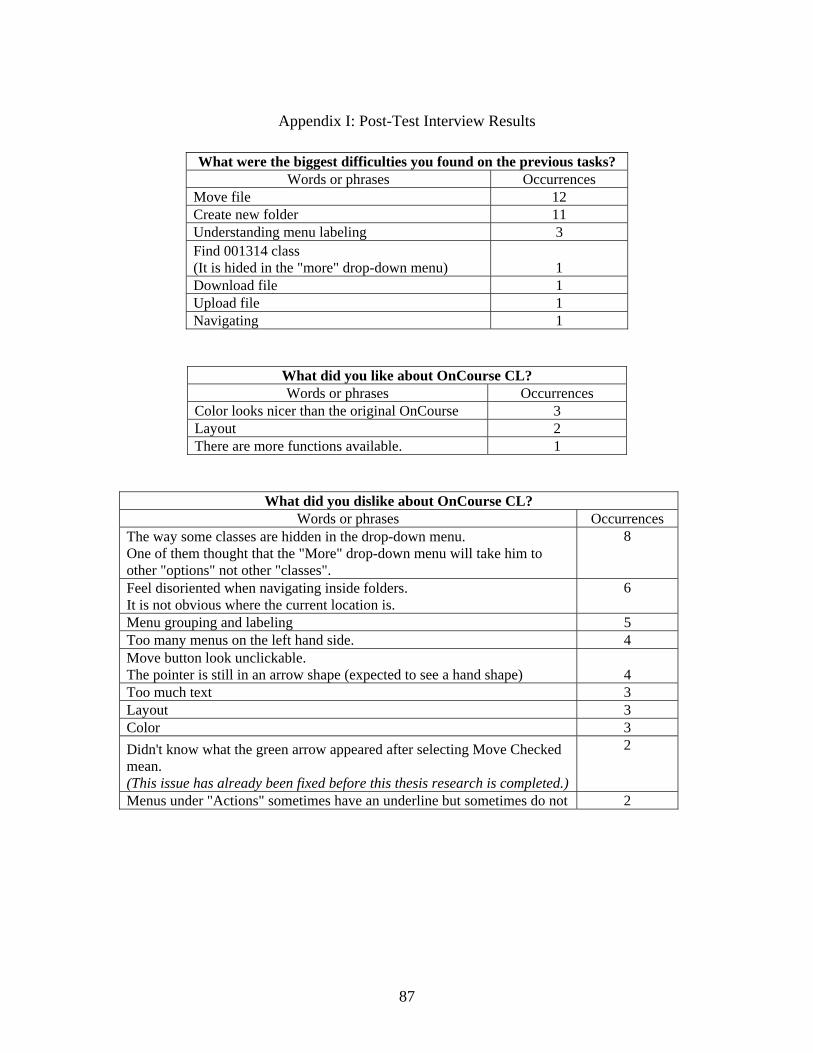
Appendix I: Post-Test Interview Results
What were the biggest difficulties you found on the previous tasks? Words or phrases Occurrences
Move file 12 Create new folder 11 Understanding menu labeling 3 Find 001314 class (It is hided in the "more" drop-down menu) 1 Download file 1 Upload file 1 Navigating 1
What did you like about OnCourse CL? Words or phrases Occurrences
Color looks nicer than the original OnCourse 3 Layout 2 There are more functions available. 1
What did you dislike about OnCourse CL? Words or phrases Occurrences
The way some classes are hidden in the drop-down menu. One of them thought that the "More" drop-down menu will take him to other "options" not other "classes".
8
Feel disoriented when navigating inside folders. It is not obvious where the current location is.
6
Menu grouping and labeling 5 Too many menus on the left hand side. 4 Move button look unclickable. The pointer is still in an arrow shape (expected to see a hand shape) 4 Too much text 3 Layout 3 Color 3 Didn't know what the green arrow appeared after selecting Move Checked mean. (This issue has already been fixed before this thesis research is completed.)
2
Menus under "Actions" sometimes have an underline but sometimes do not 2
87
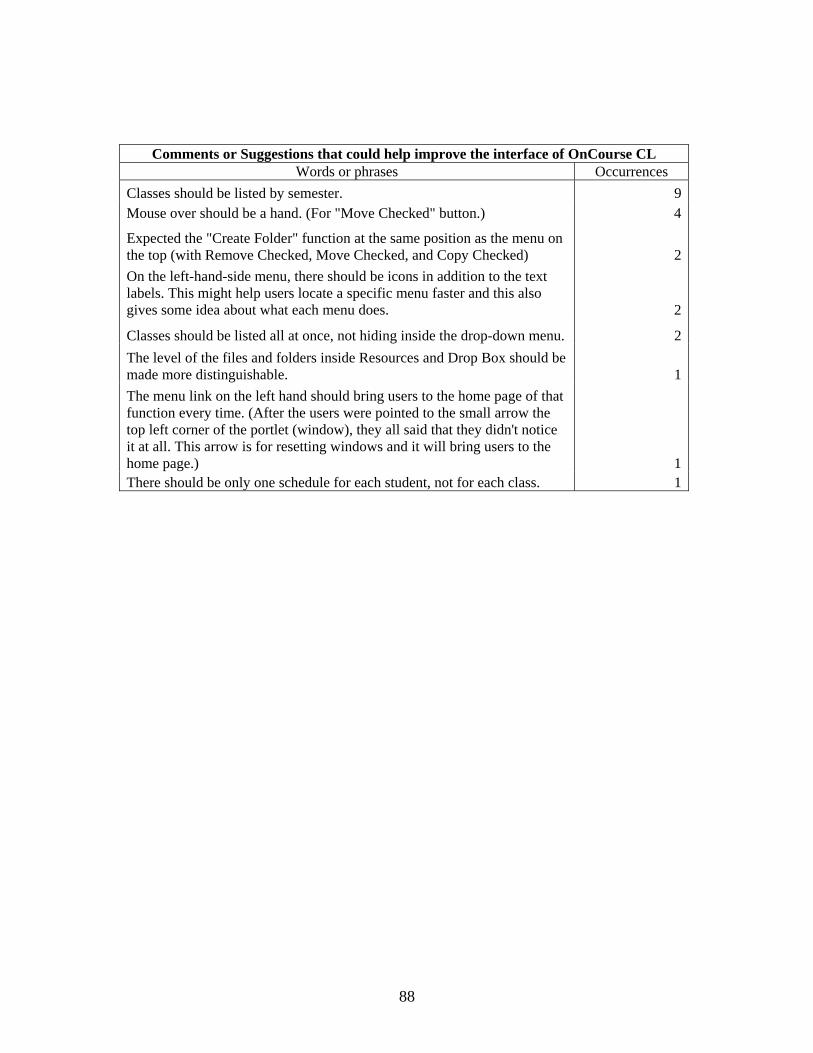
Comments or Suggestions that could help improve the interface of OnCourse CL Words or phrases Occurrences
Classes should be listed by semester. 9Mouse over should be a hand. (For "Move Checked" button.) 4
Expected the "Create Folder" function at the same position as the menu on the top (with Remove Checked, Move Checked, and Copy Checked) 2On the left-hand-side menu, there should be icons in addition to the text labels. This might help users locate a specific menu faster and this also gives some idea about what each menu does. 2
Classes should be listed all at once, not hiding inside the drop-down menu. 2The level of the files and folders inside Resources and Drop Box should be made more distinguishable. 1The menu link on the left hand should bring users to the home page of that function every time. (After the users were pointed to the small arrow the top left corner of the portlet (window), they all said that they didn't notice it at all. This arrow is for resetting windows and it will bring users to the home page.) 1There should be only one schedule for each student, not for each class. 1
88
VITA
Piyanaat Taksaphan [email protected] (317) 701-0661 765 Lockefield St. APT H Indianapolis, IN 46202 USA Education Master of Science in Human-Computer Interaction, Expected Graduation: Aug 2006 School of Informatics, Indiana University Purdue University at Indianapolis (IUPUI) Thesis: Cognitive Constraint in Using Learning Portals Bachelor of Engineering in Computer Engineering, Graduated in July 2004 Chulalongkorn University, Bangkok, Thailand Thesis: Experiments on Hand Geometry Verification System Experiences Part-time Web programmer, Aug 2005 – May 2006 Mathematics department, Indiana University Purdue University at Indianapolis (IUPUI)
Developed web-based applications using PHP and MySQL Developed a data bank using MathML with MapleTA application
Internship, Apr 2003 – May 2003 Thai Airways International Ltd., Bangkok, Thailand
Programmed flight simulator subsystem
89