cocomo software cost estimating model presentation by paul t. bathen for cis6516 “management of...
TRANSCRIPT

COCOMO Software Cost Estimating Model
Presentation by Paul T. Bathen
For CIS6516“Management of Software Projects and Personnel”
Summer B, 2008
Outline of Presentation• Brief overview of versions.
• Summary of email from Kurt Bittner.
• Cocomo 81; demonstration
• Cocomo II; demonstration
• CoStar by SoftStarSystems.com; demo

COCOMO Versions• CO (Constructive) CO (Cost) MO (Model)• First version: 1981 by Dr. Barry Boehm
– Now known now as “COCOMO 81”
• Second version: ADA Cocomo (ADA 87); parameterized exponent reflecting more modern practices and their economies of scale.
• Current Version: Cocomo II (circa 2000)• Commercial take-offs
– Costar (Softstarsystems.com)– Cost Xpert (CostXpert.com)
• Regression formula, with data taken from historical projects and current project characteristics.
Email from Kurt Bittner• “Is COCOMO II best for iterative process?”
• Yes. “(the models are) public, have evolved over almost two decades, and are based on solid, proven research with solid data.”
• Caveat: COCOMO II models are “post-architectural” (best for Construction phase). (PTB Note: Cocomo II software allows for calculating and reporting by Early Design and Post Architecture)
Bittner email cont’d• Inception phase: driven by
business/exploratory technology issues; generally defies estimation (because so little data exists at the beginning of a project).
• Elaboration phase: driven by technical risks and exploration of technology issues.
• Transition phase: not largely governed by software economics but is affected by a large number of factors other than software development.

Cocomo 81 Accuracy• Cocomo homepage: “Over 63 data points in the
COCOMO 81 calibration database, the Intermediate form demonstrates an accuracy of within 20% of actuals 68% of the time for effort, and within 20% of actuals 58% of the time for a non-incremental development schedule.”
• Kemerer 1993: “(estimating in general varies) from as much as 85 - 610 % between predicated and actual values. Calibration of the model can improve these figures, However, models still produce errors of 50-100%.”– Source: http://yunus.hacettepe.edu.tr/~sencer/cocomo.html
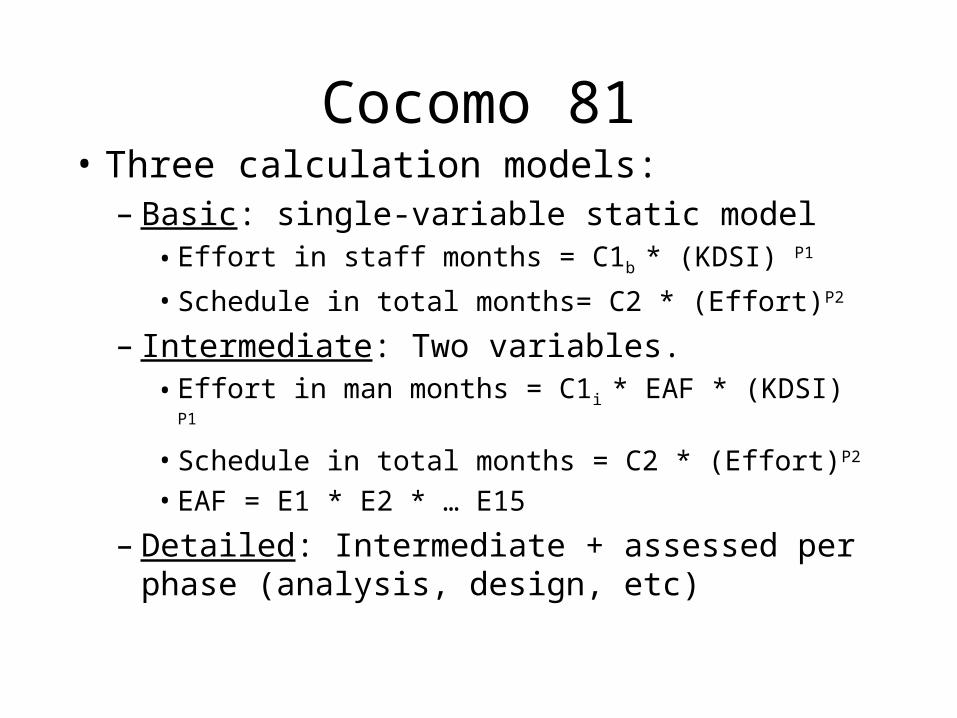
Cocomo 81• Three calculation models:
– Basic: single-variable static model• Effort in staff months = C1b * (KDSI) P1
• Schedule in total months= C2 * (Effort)P2
– Intermediate: Two variables.• Effort in man months = C1i * EAF * (KDSI) P1
• Schedule in total months = C2 * (Effort)P2
• EAF = E1 * E2 * … E15
– Detailed: Intermediate + assessed per phase (analysis, design, etc)
Cocomo 81
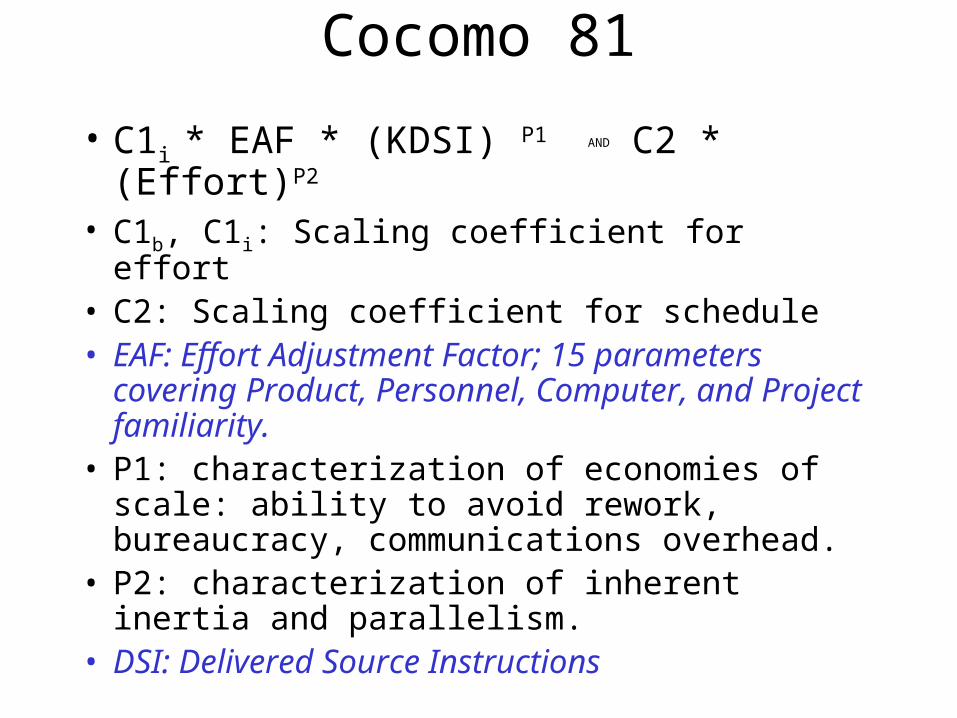
• C1i * EAF * (KDSI) P1 AND C2 * (Effort)P2
• C1b, C1i: Scaling coefficient for effort• C2: Scaling coefficient for schedule• EAF: Effort Adjustment Factor; 15 parameters
covering Product, Personnel, Computer, and Project familiarity.
• P1: characterization of economies of scale: ability to avoid rework, bureaucracy, communications overhead.
• P2: characterization of inherent inertia and parallelism.
• DSI: Delivered Source Instructions

Cocomo 81• Effort=C1* EAF * (KDSI) P1 and Sched= C2 * (Effort)P2
• * “Organic: in-house, less-complex developments with flexible processes. Features, qualities, cost and schedule are freely changed with minimal
• overhead.• * Embedded: typical defense community projects. Complex, requiring high
reliability, with real-time issues. Highly rigorous process. Features,• qualities, cost and schedule are tightly controlled.• * Semidetached: somewhere in-between organic and embedded.”
From the book Dr. Roggio loaned me
Cocomo 81 demo• See Excel demo of Cocomo 81
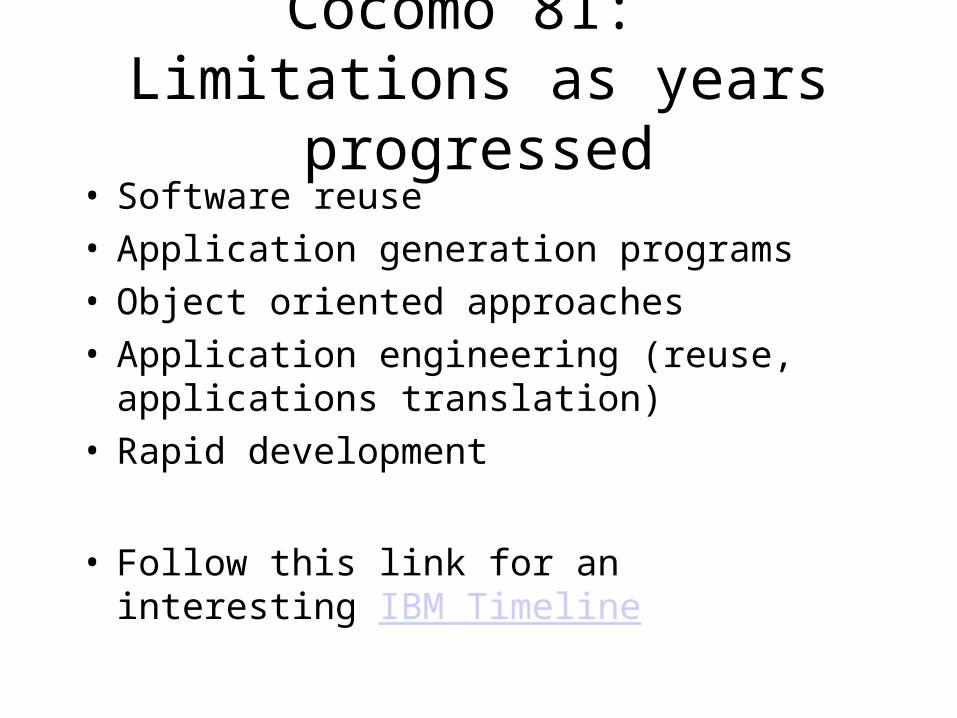
Cocomo 81: Limitations as years progressed
• Software reuse• Application generation programs• Object oriented approaches• Application engineering (reuse, applications
translation)• Rapid development
• Follow this link for an interesting IBM Timeline
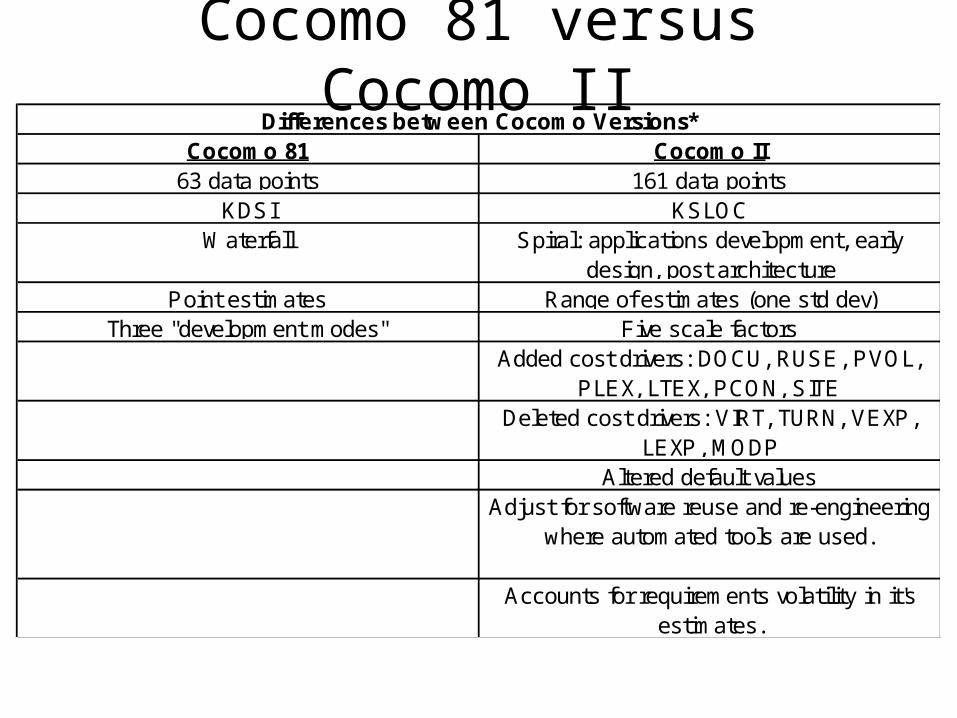
Cocomo 81 versus Cocomo IICocomo 81 Cocomo II
63 data points 161 data pointsKDSI KSLOC
Waterfall Spiral: applications development, early design, post architecture
Point estimates Range of estimates (one std dev)Three "development modes" Five scale factors
Added cost drivers: DOCU, RUSE, PVOL, PLEX, LTEX, PCON, SITE
Deleted cost drivers: VIRT, TURN, VEXP, LEXP, MODP
Altered default valuesAdjust for software reuse and re-engineering
where automated tools are used.
Accounts for requirements volatility in it's estimates.
Differences between Cocomo Versions*

Calc’s are based on SLOC• SLOC = “Source Lines Of Code”
• Only Source lines that are DELIVERED as part of the product are included -- test drivers and other support software is excluded
• SOURCE lines are created by the project staff -- code created by applications generators is excluded
• One SLOC is one logical line of code (an If-Then-Else is one line of code)
– In Cocomo 81, known as Delivered Source Instructions (DSI). One If-Then-Else = X lines of code.
• Declarations are counted as SLOC
• Comments are not counted as SLOC
Text from SoftStarSystems.com

Person Months• Default Value: 152 hours per month
– 19 days at 8 hours per day.
• Includes development & management time

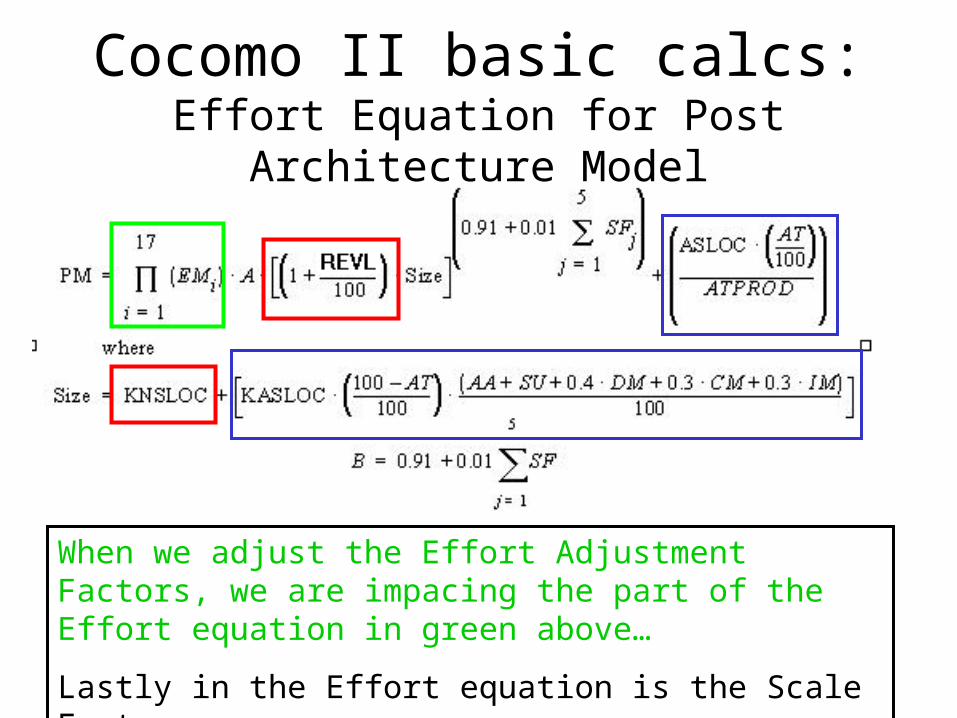
Cocomo II basic calcs:Effort Equation for Post Architecture Model
Caveat: I have seen various versions of this calculation but I believe this one to be basically correct, and good enough for purposes of demonstration.

Cocomo II screens
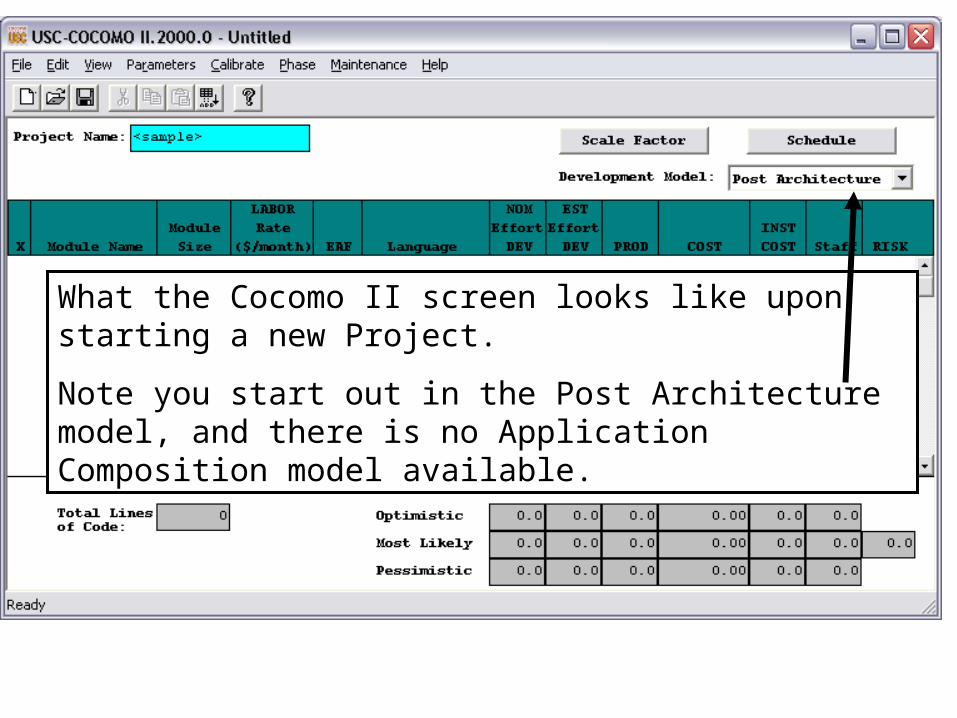
What the Cocomo II screen looks like upon starting a new Project.
Note you start out in the Post Architecture model, and there is no Application Composition model available.

Enter a Project Name

Can’t really do much unless we add a Module, so choose Edit Add Module. A new line shows up in the screen with a default module name.

1. Change the module name to whatever you want.
2. Now double click on the yellow rectangle under Module Size…

This screen will pop up allowing us to choose between Source Lines Of Code (SLOC), Function Points, or Adaptation and Re-Use. Let’s stick with SLOC for this module.
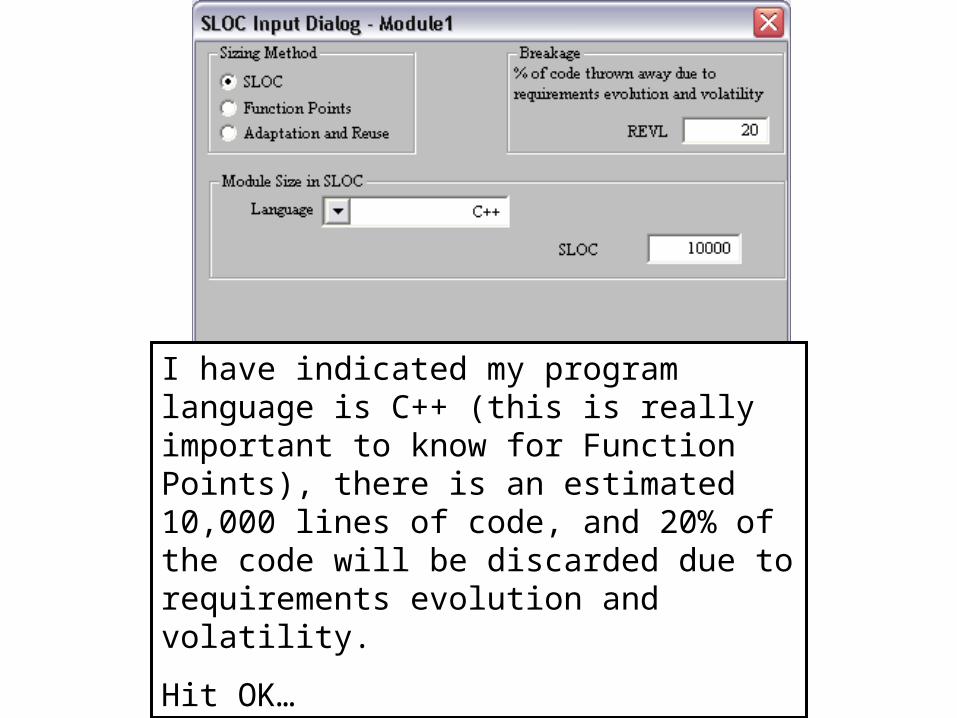
I have indicated my program language is C++ (this is really important to know for Function Points), there is an estimated 10,000 lines of code, and 20% of the code will be discarded due to requirements evolution and volatility.
Hit OK…
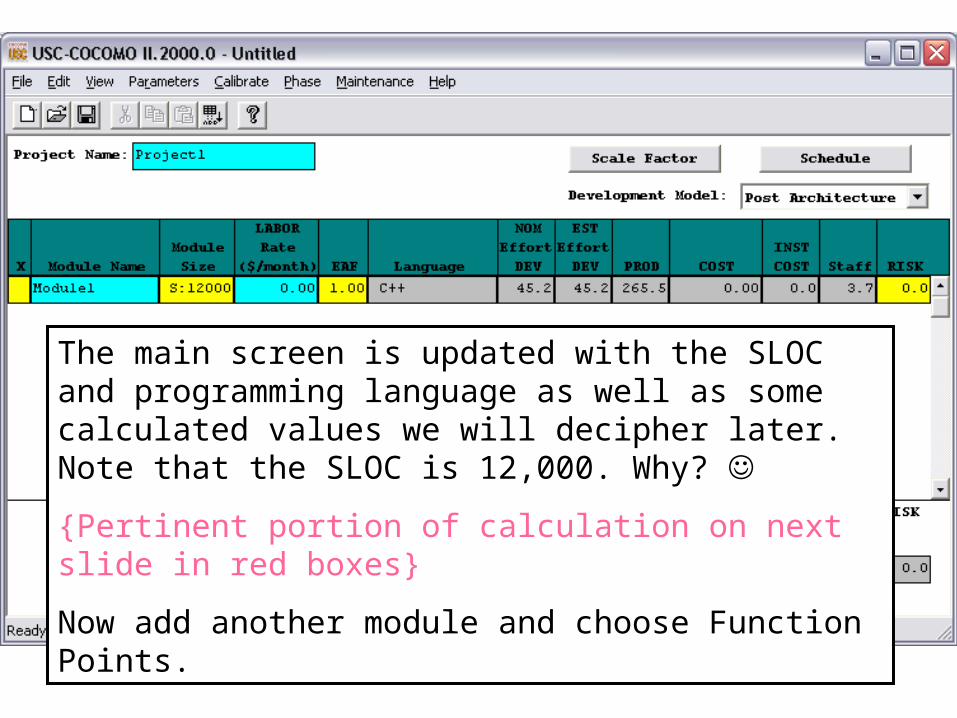
The main screen is updated with the SLOC and programming language as well as some calculated values we will decipher later. Note that the SLOC is 12,000. Why?
{Pertinent portion of calculation on next slide in red boxes}
Now add another module and choose Function Points.

Cocomo II basic calcs:Effort Equation for Post Architecture Model
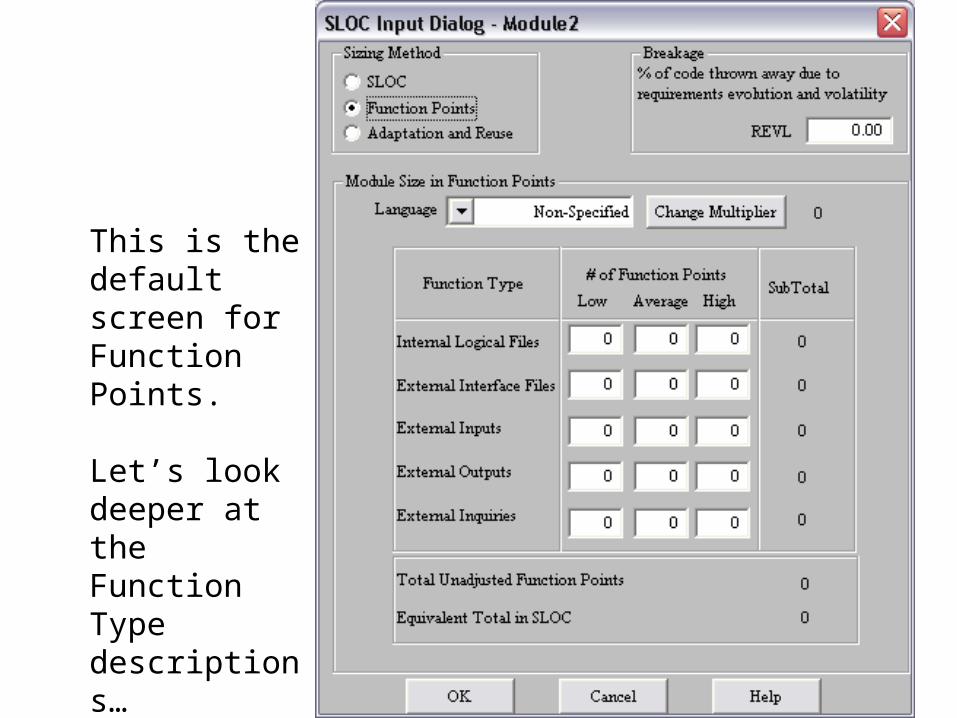
This is the default screen for Function Points.
Let’s look deeper at the Function Type descriptions…
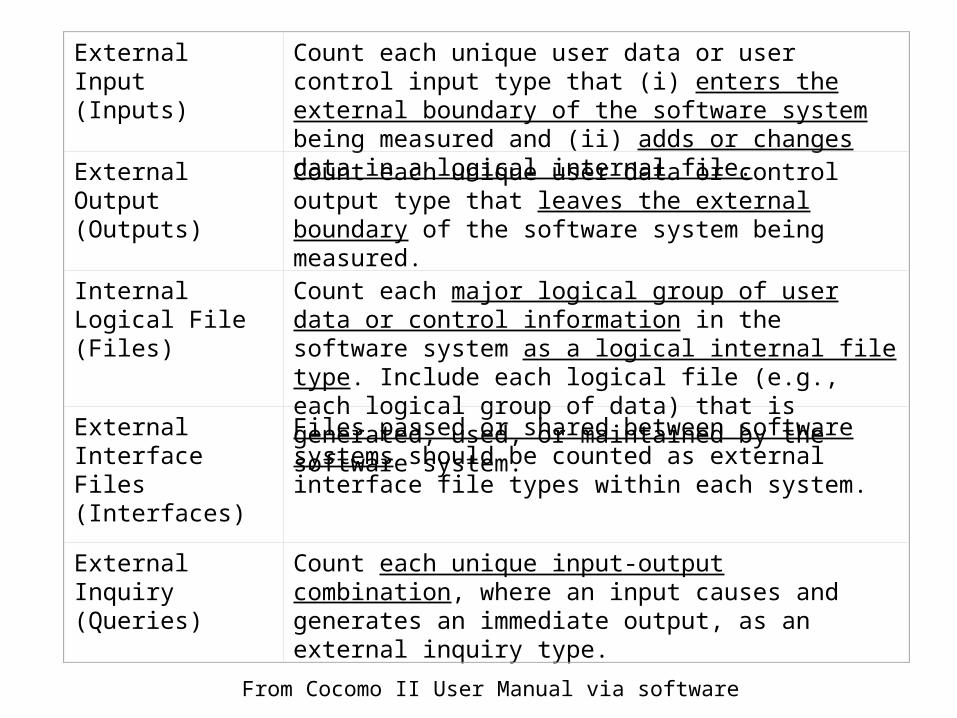
External Input (Inputs)
Count each unique user data or user control input type that (i) enters the external boundary of the software system being measured and (ii) adds or changes data in a logical internal file.
External Output (Outputs)
Count each unique user data or control output type that leaves the external boundary of the software system being measured.
Internal Logical File (Files)
Count each major logical group of user data or control information in the software system as a logical internal file type. Include each logical file (e.g., each logical group of data) that is generated, used, or maintained by the software system.
External Interface Files (Interfaces)
Files passed or shared between software systems should be counted as external interface file types within each system.
External Inquiry (Queries)
Count each unique input-output combination, where an input causes and generates an immediate output, as an external inquiry type.
From Cocomo II User Manual via software

So let’s go back into this screen and add some entries in the grid.
Notice, there are some kind of subtotals per line, but the Equivalent SLOC = 0.
Let’s change the Language and see what happens.

By changing the language to C++, we now have an Equivalent Total in SLOC.
Also, we can see a value next to the Change Multiplier button.
Let’s change the language to Machine Code!
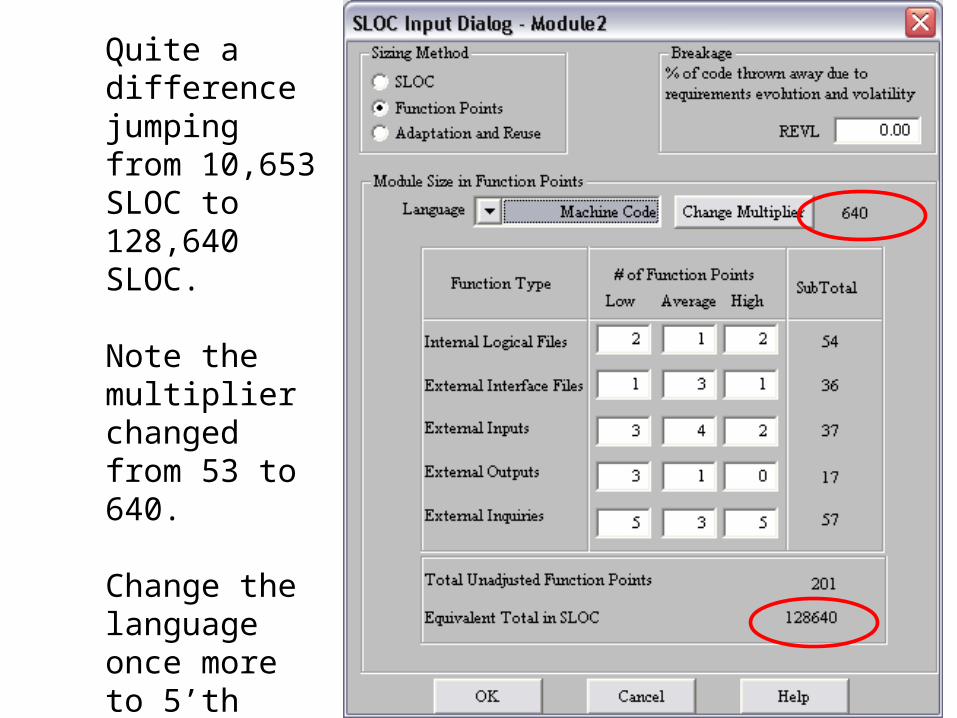
Quite a difference jumping from 10,653 SLOC to 128,640 SLOC.
Note the multiplier changed from 53 to 640.
Change the language once more to 5’th Generation.

So using a 5’th generation level language would cut our code base by a factor of 285 times according to Cocomo II’s default estimation (not calibrated for your environment, not taking into account other factors).
Change the language to C++ and change REVL to 20%…

So now Module2 has F:12783 or, in other words, it’s based on Function points (the F:) and it has an equivalent 12,783 lines of code (10,653 + 20% for volatility).
So how did the 12,783 (or even the 10,653) get calc’d?
Part 1 of the answer is to click on Parameters Function Points. You will see the following screen…
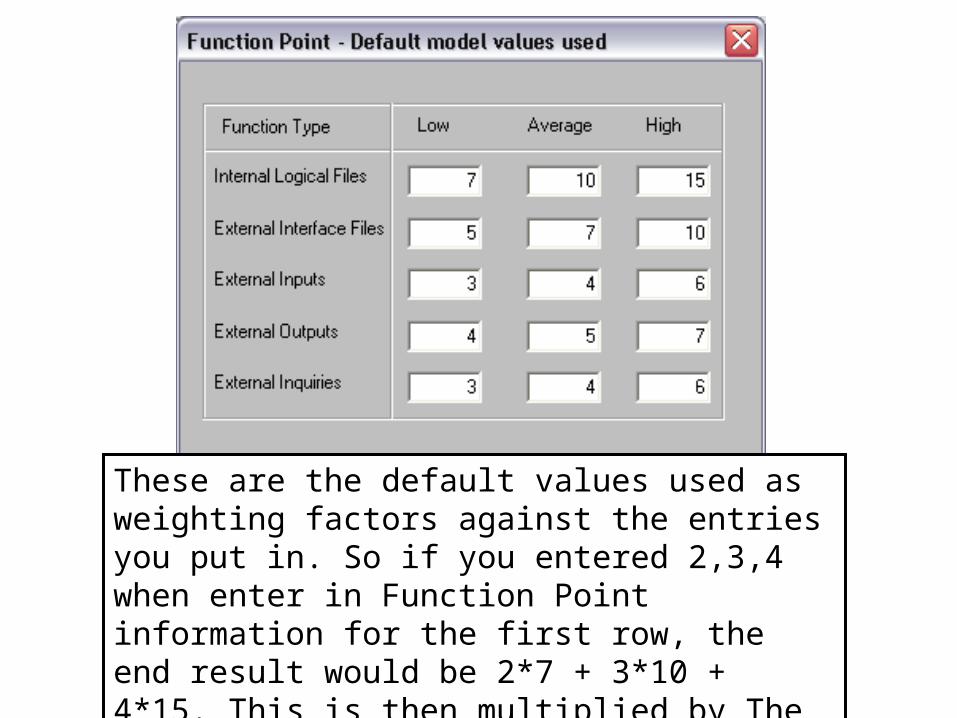
These are the default values used as weighting factors against the entries you put in. So if you entered 2,3,4 when enter in Function Point information for the first row, the end result would be 2*7 + 3*10 + 4*15. This is then multiplied by The Multiplier…

Language ValueMachine Code 640Assembly, Basic 320First Generation 320Assembly, Macro 213C 128Fortran77 107Second Generation 107Procedural 105Cobol 85, ANSI 91High Level 91Pascal 91Modula 2 80Report Generator 80Third Generation 80Ada 83 71Fortran 95 71Basic, ANSI 64Lisp 64Prolog 64C++ 53Java 53Ada 95 49AI Shell 49Basic, Compiled 49Forth 49
Language ValueSimulation Default 46Database Default 40Access 38Visual C++ 34APL 32Basic, Interpreted 32Object Oriented 29Visual Basic 5.0 29Perl 21UNIX Shell 21Fourth Generation 20PowerBuilder 16HTML 3.0 15Query Default 13Spreadsheet Default 6Fifth Generation 5USR_1 1USR_2 1USR_3 1USR_4 1USR_5 1
Default Multiplier values per Language
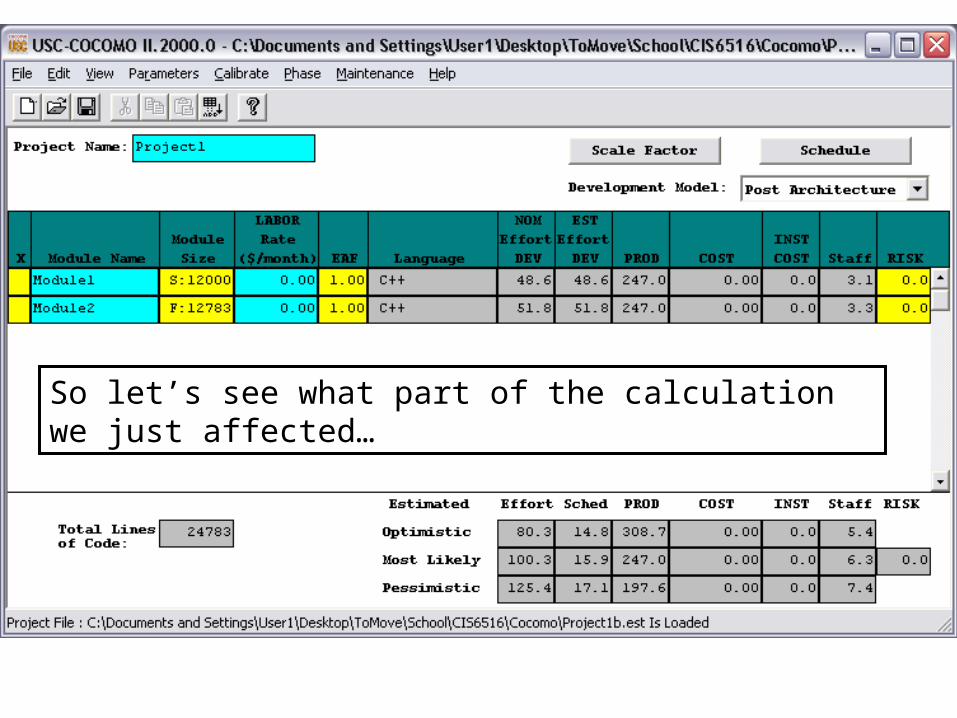
So let’s see what part of the calculation we just affected…

Cocomo II basic calcs:Effort Equation for Post Architecture Model
Again, we have affected the same portion of the effort calculation as when we entered source lines directly.
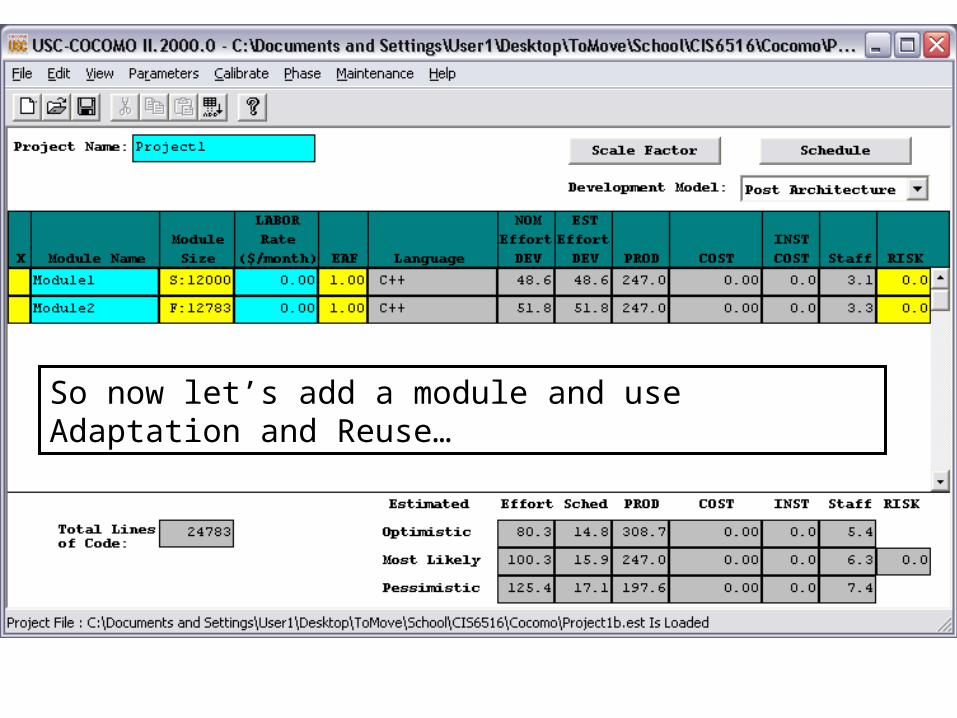
So now let’s add a module and use Adaptation and Reuse…
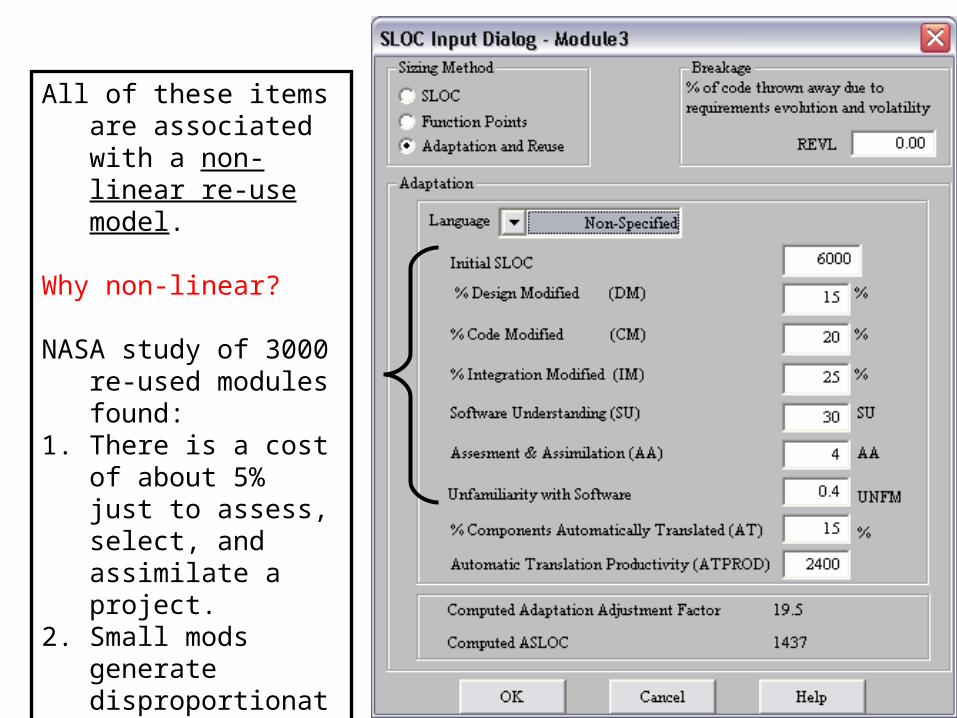
All of these items are associated with a non-linear re-use model.
Why non-linear?
NASA study of 3000 re-used modules found:
1. There is a cost of about 5% just to assess, select, and assimilate a project.
2. Small mods generate disproportionately large costs.
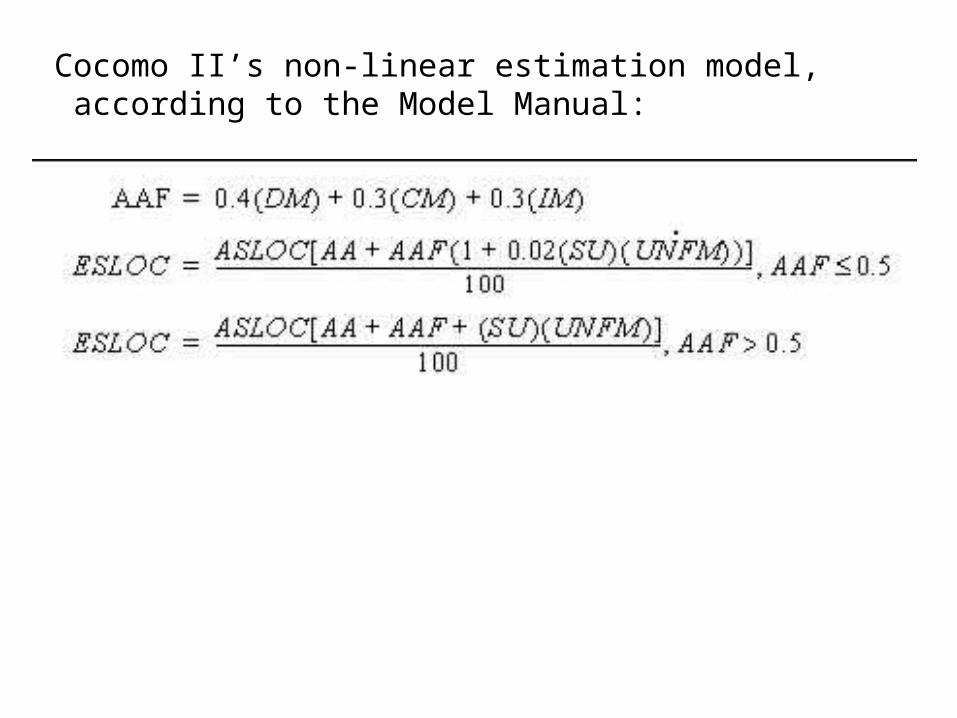
Cocomo II’s non-linear estimation model, according to the Model Manual:
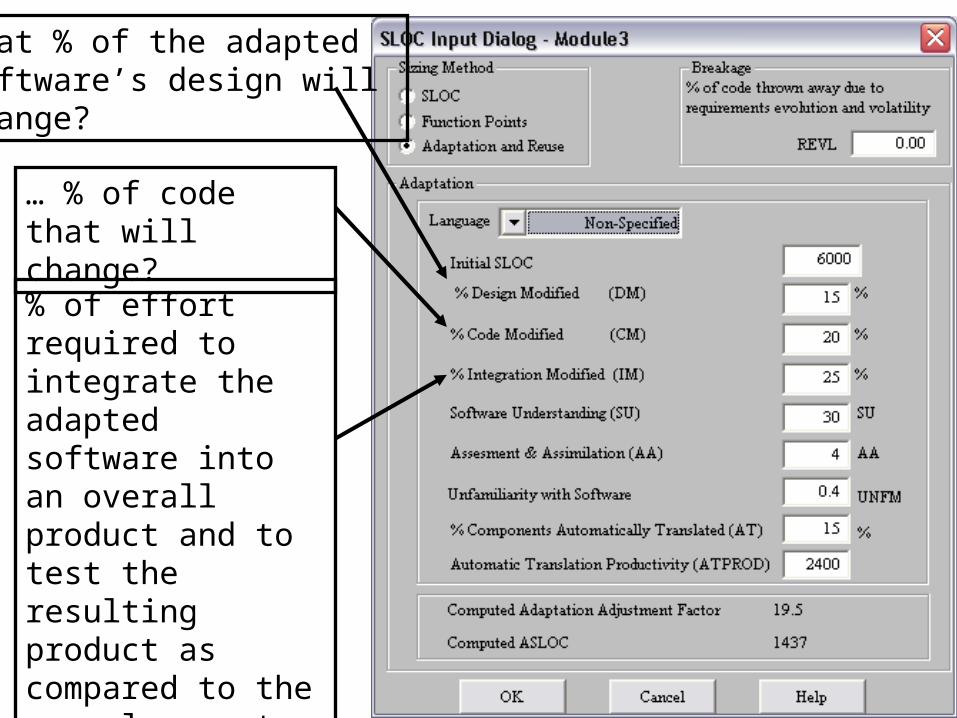
What % of the adapted software’s design will change?
… % of code that will change?
% of effort required to integrate the adaptedsoftware into an overall product and to test the resulting product as compared to the normal amount of integration and testeffort for software of comparable size.
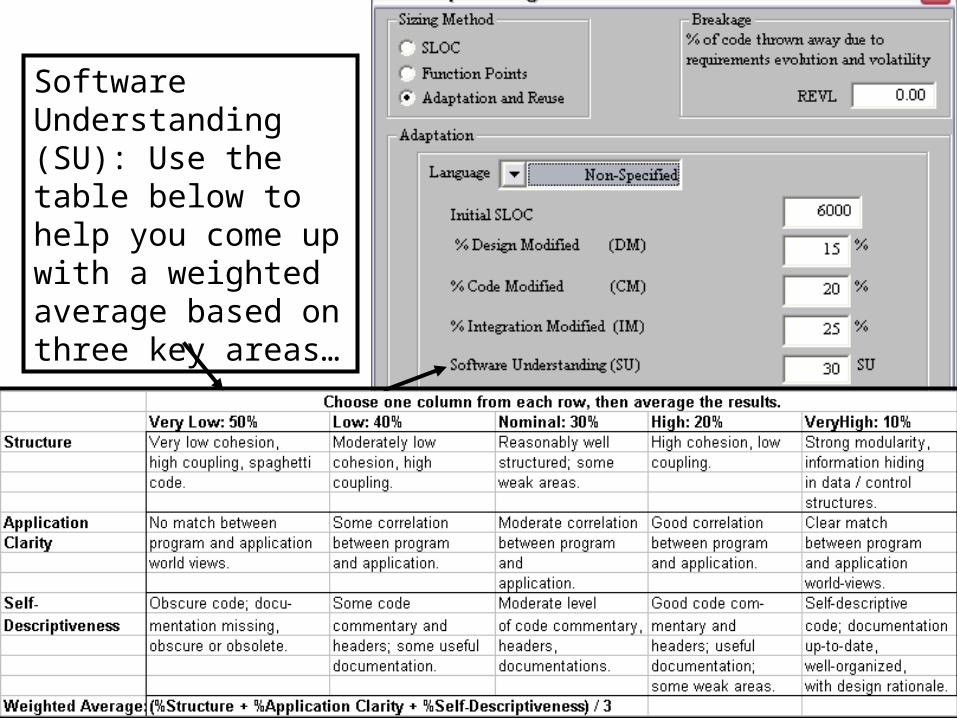
Software Understanding (SU): Use the table below to help you come up with a weighted average based on three key areas…

Assessment & Assimilation (AA): 0 to 8. Effort to determine whethera fully-reused software module is appropriate to the application, and to integrate its description into the overall productdescription
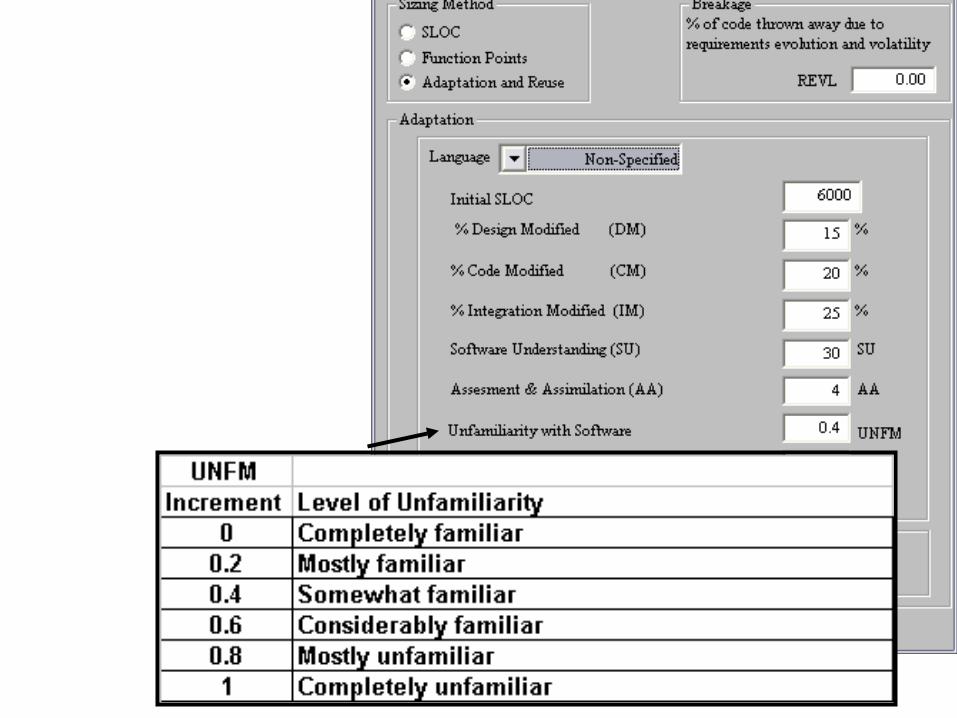

These last two areas haveto deal with automatically translating code.
The ATPROD figure is in source statements / person month.
The Model manual goes into more detail.
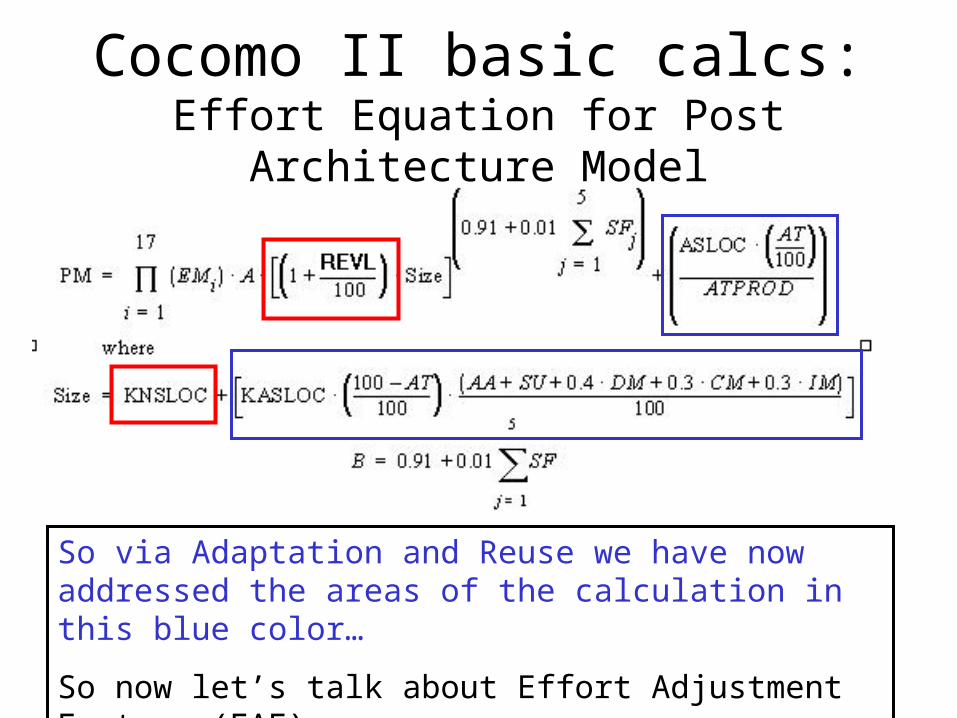
Cocomo II basic calcs:Effort Equation for Post Architecture Model
So via Adaptation and Reuse we have now addressed the areas of the calculation in this blue color…
So now let’s talk about Effort Adjustment Factors (EAF)

Double click on the yellow rectangle under EAF for Module1

This screen will pop-up. As you click on any given button top row button, the button’s title will change (Nom, High,Very High, Very Low, Low, etc) AND you will see the EAF at the bottom of the screen change.
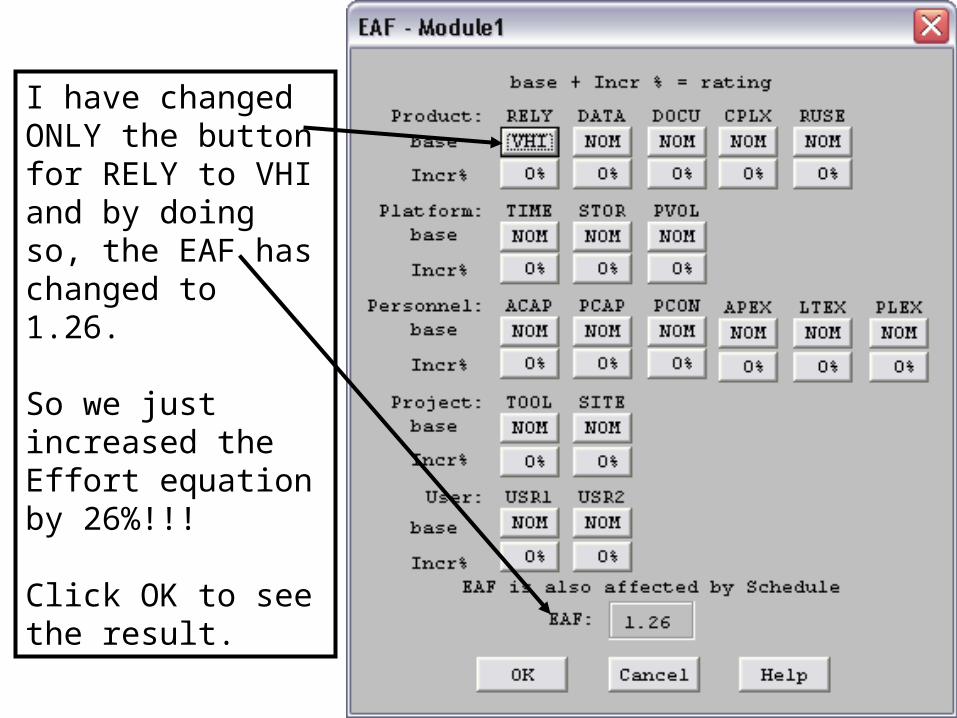
I have changed ONLY the button for RELY to VHI and by doing so, the EAF has changed to 1.26.
So we just increased the Effort equation by 26%!!!
Click OK to see the result.
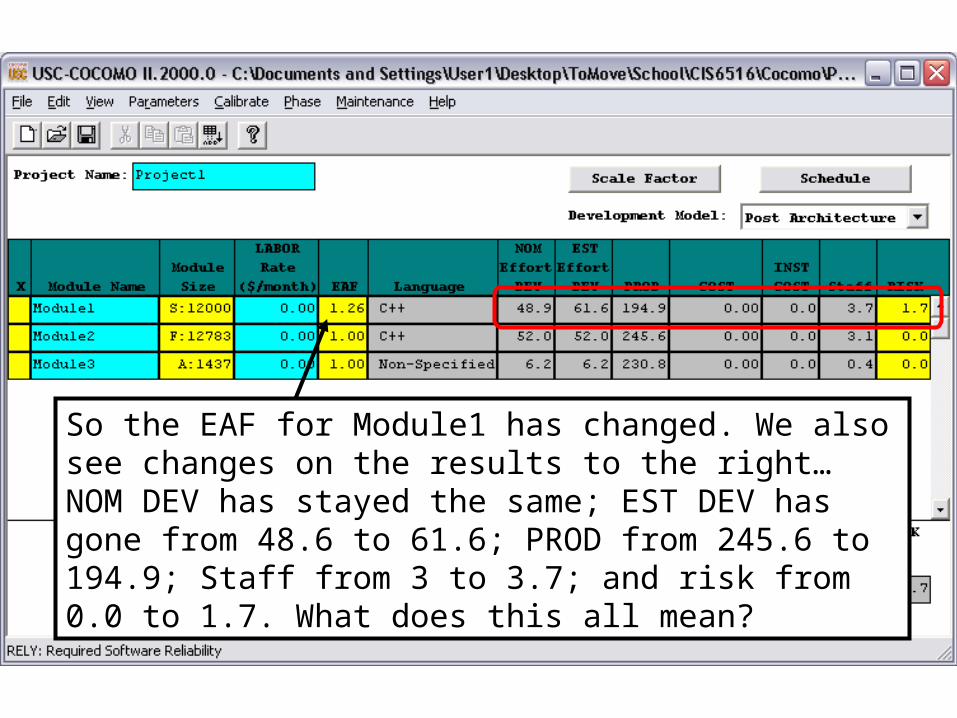
So the EAF for Module1 has changed. We also see changes on the results to the right… NOM DEV has stayed the same; EST DEV has gone from 48.6 to 61.6; PROD from 245.6 to 194.9; Staff from 3 to 3.7; and risk from 0.0 to 1.7. What does this all mean?
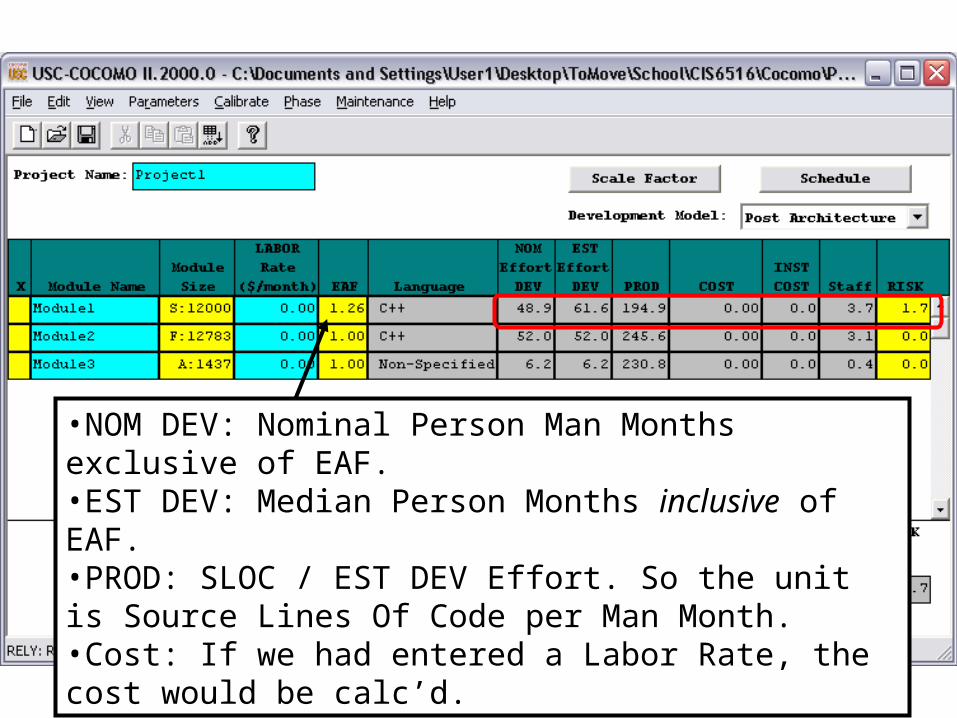
•NOM DEV: Nominal Person Man Months exclusive of EAF.•EST DEV: Median Person Months inclusive of EAF.•PROD: SLOC / EST DEV Effort. So the unit is Source Lines Of Code per Man Month.•Cost: If we had entered a Labor Rate, the cost would be calc’d.

•INST COST: calculated most likely cost per instruction. This number is calculated from Cost/SLOC in each module.•Staff: most likely estimate for the number of full-time developers that would be needed to complete a module in the estimated development time.•RISK: total_risk = schedule_risk + product_risk + personnel_risk + process_risk + platform_risk + reuse_risk. Then total risk of a module=total_risk/373.*100.

Let’s re-visit the EAF screen. What did it mean when we chose “VHI” (Very High)? Qualitatively, that’s a nice phrase. But what did it mean quantitatively?
Email received from USC after the presentation: the Incr% toggles are just a further refinement of the “base” in increments of 25% of the range…
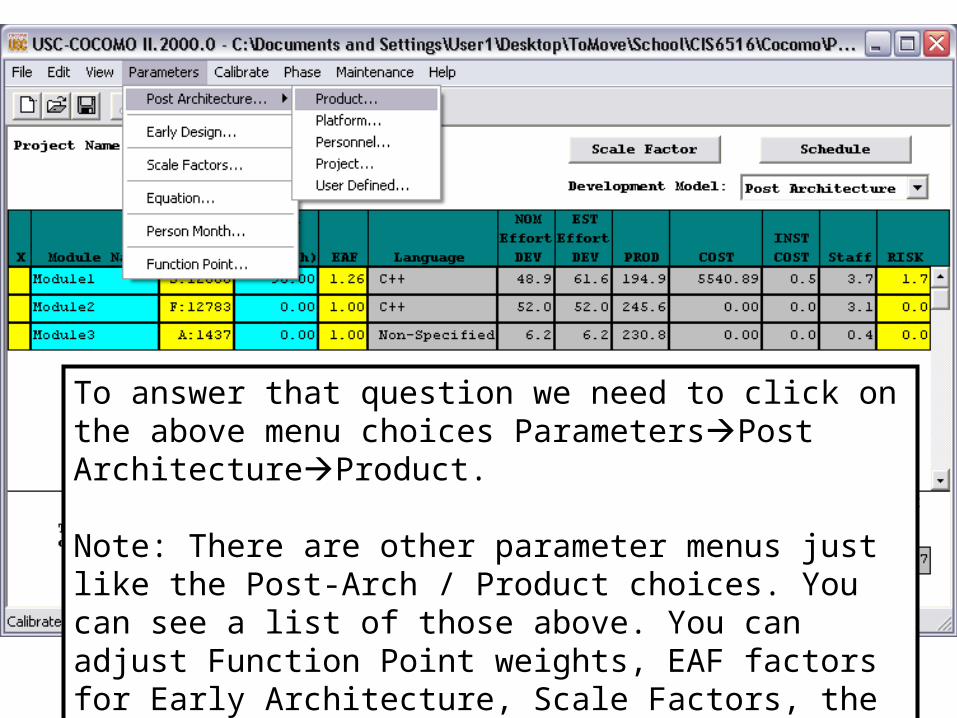
To answer that question we need to click on the above menu choices ParametersPost ArchitectureProduct.
Note: There are other parameter menus just like the Post-Arch / Product choices. You can see a list of those above. You can adjust Function Point weights, EAF factors for Early Architecture, Scale Factors, the number of hours in a Person Month, etc.
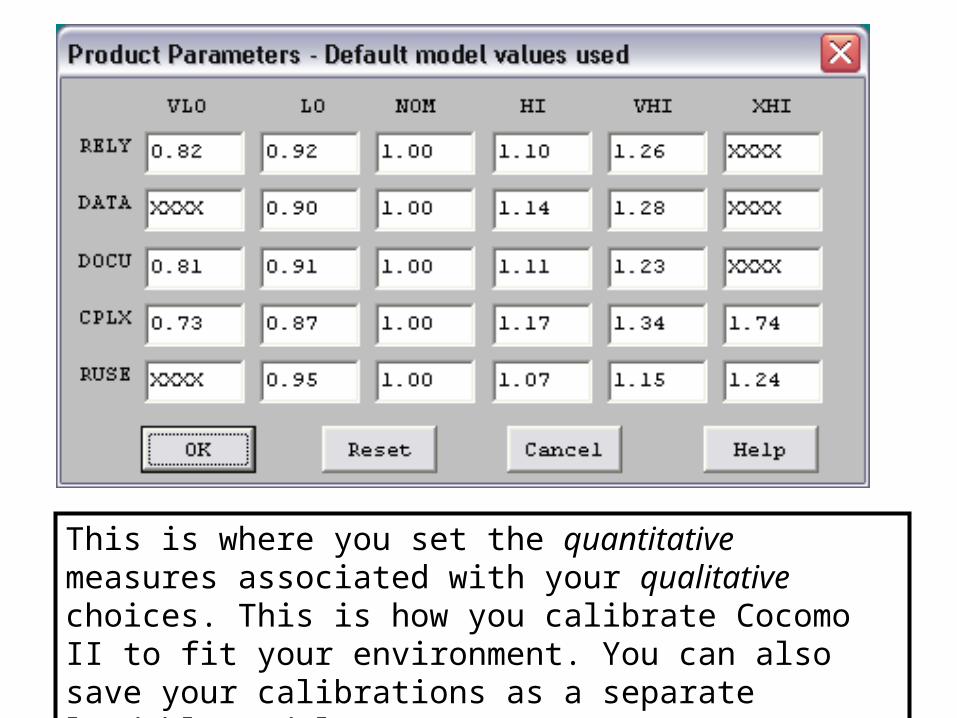
This is where you set the quantitative measures associated with your qualitative choices. This is how you calibrate Cocomo II to fit your environment. You can also save your calibrations as a separate loadable module.

“Very High”, “Very Low”, etc are ok, but what are the details behind them? To get this answer, you actually have to visit the Model Manual, which is a weakness in Cocomo II. So for RELY, here is what the Model Manual says:
So selecting “Very High” really meant “Risk to human life” and, through the ParametersPost ArchitectureProduct menu choice for RELY changed the EAF contribution by a factor of 1.26.
Cocomo II basic calcs:Effort Equation for Post Architecture Model
When we adjust the Effort Adjustment Factors, we are impacing the part of the Effort equation in green above…
Lastly in the Effort equation is the Scale Factors.
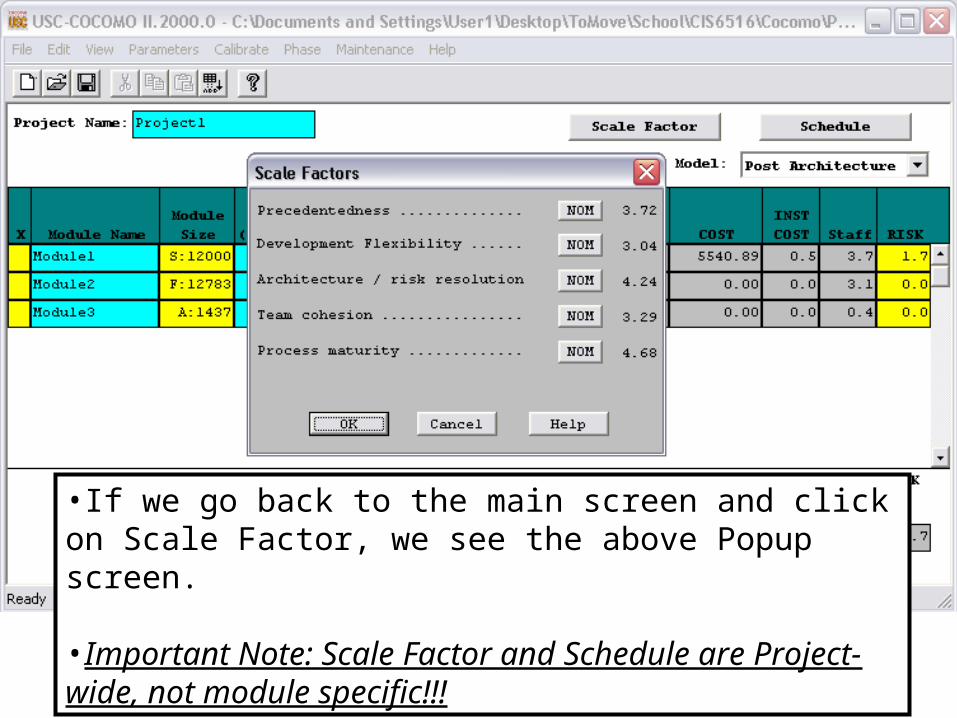
•If we go back to the main screen and click on Scale Factor, we see the above Popup screen.
•Important Note: Scale Factor and Schedule are Project-wide, not module specific!!!
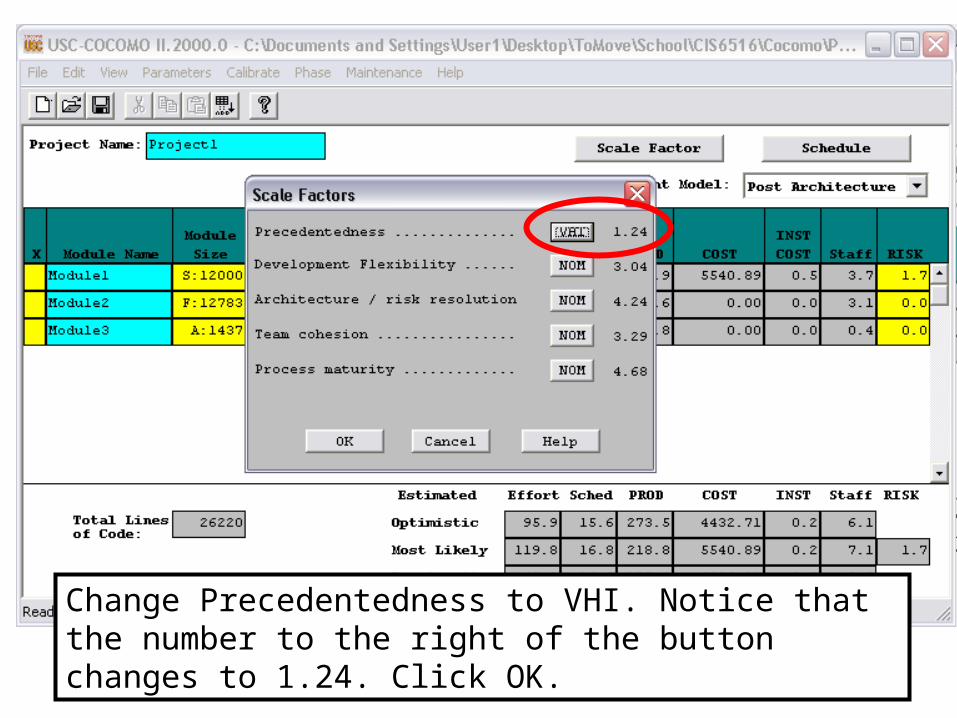
Change Precedentedness to VHI. Notice that the number to the right of the button changes to 1.24. Click OK.

Notice that some of the costs have changed. In particular, they have gone down. By decreasing the exponent in the effort equation, we have decreased the effort expenditure required.
Let’s see what area of the calculation we are talking about…

Cocomo II basic calcs:Effort Equation for Post Architecture Model
So the Scale Factor portion of the Effort Equation is now highlighted in purple!
Note; this IS B shown below!

Again, what does “VHI” mean quantitatively for “Precedentedness”, and what are the details?
From ParametersScale Factors, we can find the quantitative measures shown above in the pop-up…

… and again, from the Model Manual some help on determining how to choose Very Low, Nominal, Very High, etc.

Let’s talk about the SCED factor, which applies project-wide. The calculation for Schedule is:

One more input area to address on this first screen: Schedule.
If we click on the Schedule button in the upper right hand corner, we can adjust the Schedule compression / elongation via the pop-up we see on the screen.
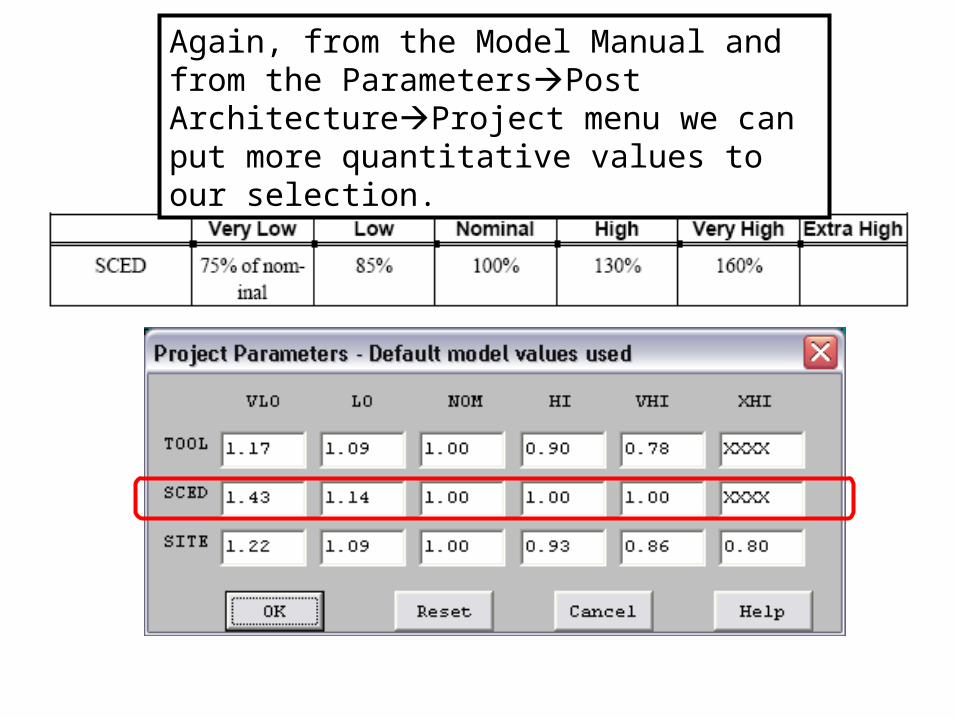
Again, from the Model Manual and from the ParametersPost ArchitectureProject menu we can put more quantitative values to our selection.
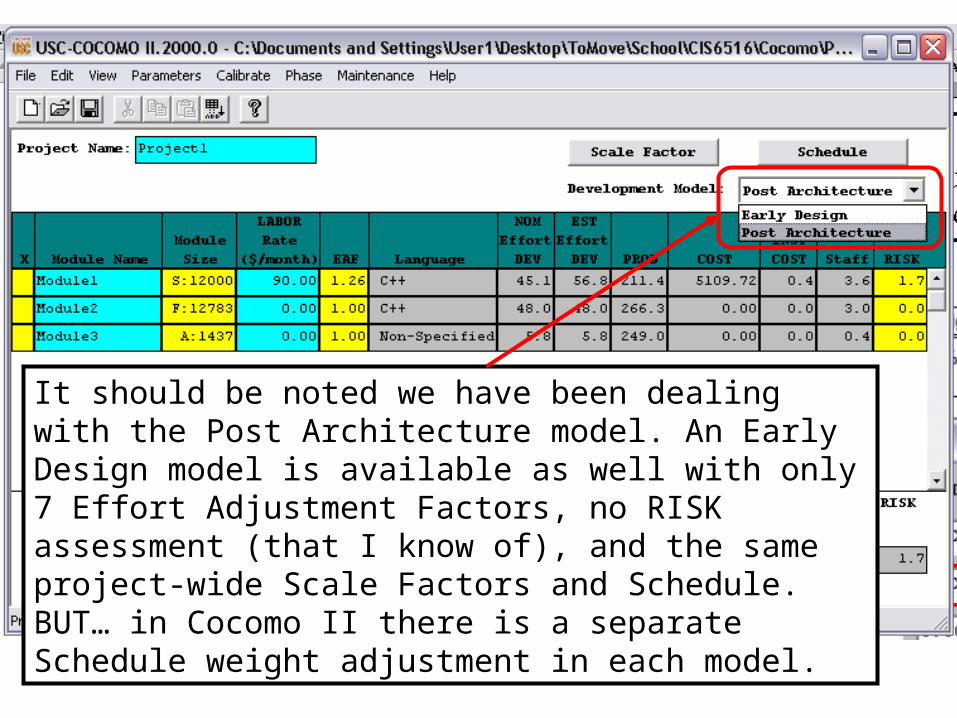
It should be noted we have been dealing with the Post Architecture model. An Early Design model is available as well with only 7 Effort Adjustment Factors, no RISK assessment (that I know of), and the same project-wide Scale Factors and Schedule. BUT… in Cocomo II there is a separate Schedule weight adjustment in each model.

What other information can be obtained from the calculations? Well, for one, we know the total lines of code estimated…
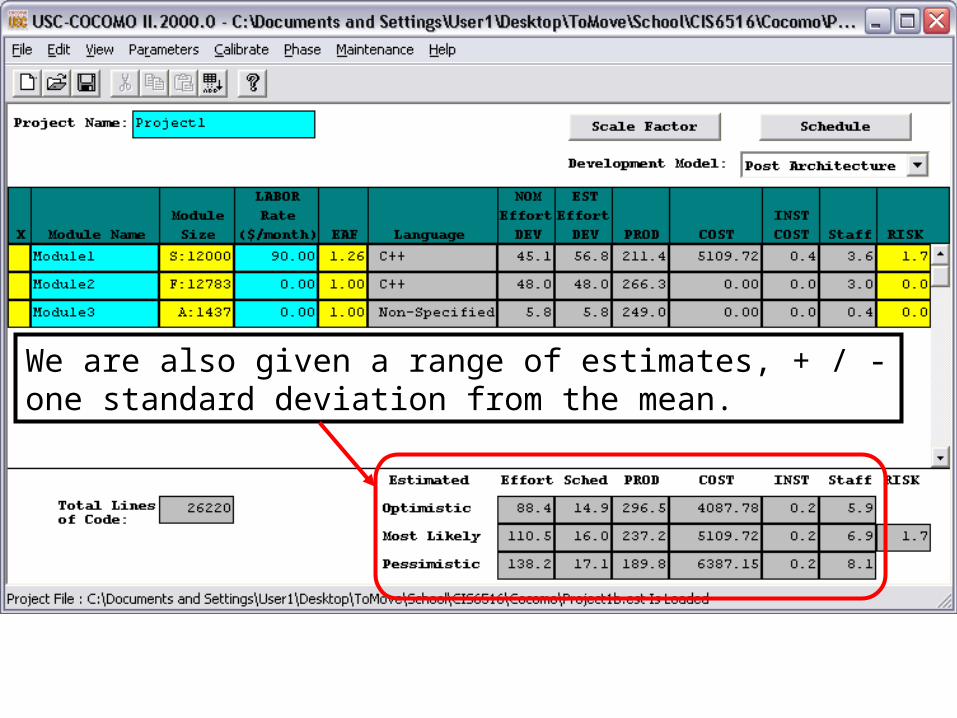
We are also given a range of estimates, + / - one standard deviation from the mean.

We can also see some reports with effort distribution, either as a Waterfall lifecycle or “MBASE” (a spiral model), and across all phases or for a specific phase.
So, from the above choices, let’s choose “Overall Phase”
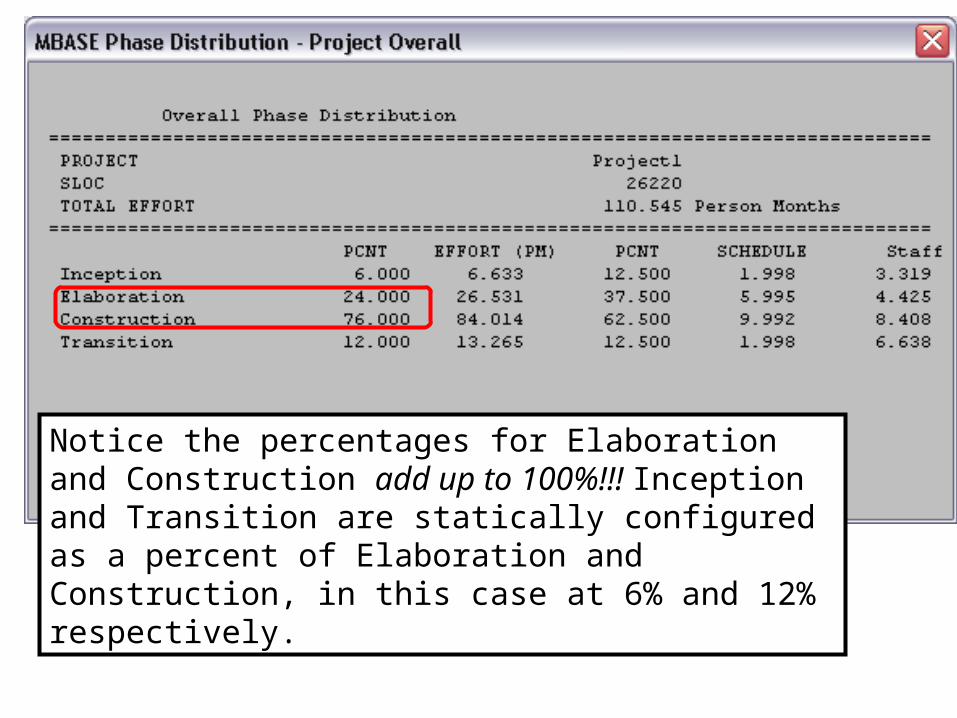
Notice the percentages for Elaboration and Construction add up to 100%!!! Inception and Transition are statically configured as a percent of Elaboration and Construction, in this case at 6% and 12% respectively.

Let’s take a look at the Inception phase in MBASE…
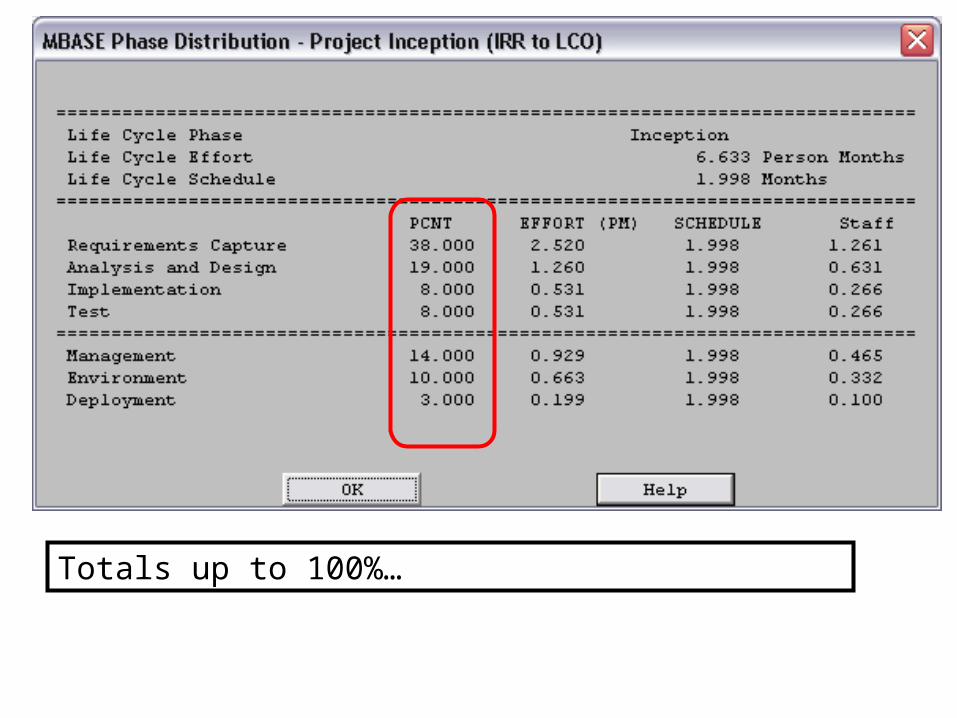
Totals up to 100%…
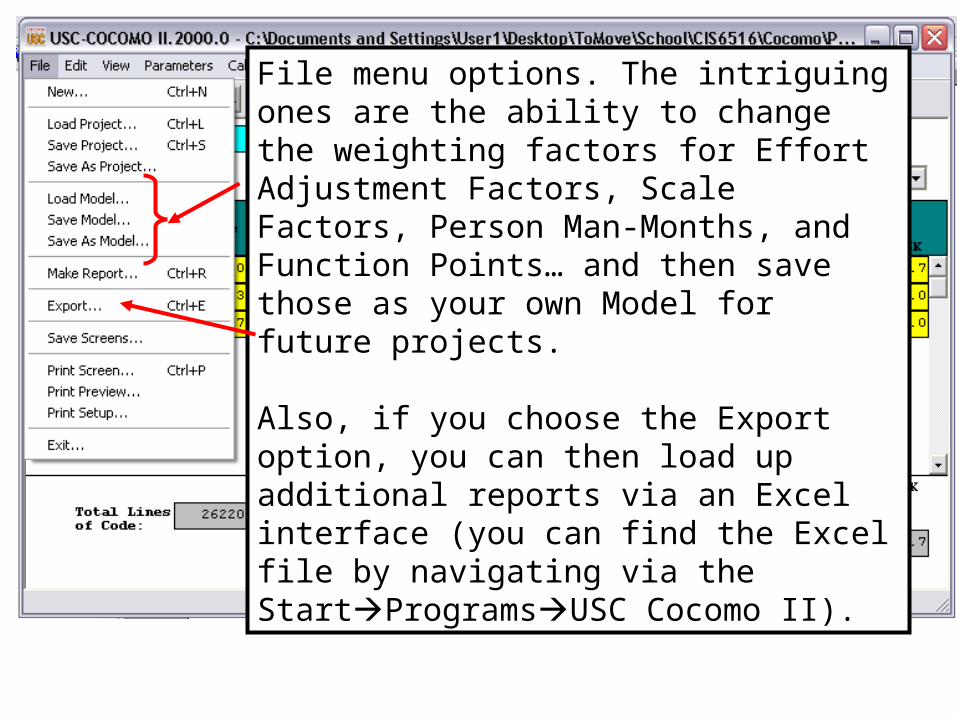
File menu options. The intriguing ones are the ability to change the weighting factors for Effort Adjustment Factors, Scale Factors, Person Man-Months, and Function Points… and then save those as your own Model for future projects.
Also, if you choose the Export option, you can then load up additional reports via an Excel interface (you can find the Excel file by navigating via the StartProgramsUSC Cocomo II).

Parting thoughts…1. There are limited online calculator versions of Cocomo 81 and Cocomo II:
http://sunset.usc.edu/research/COCOMOII/cocomo81_pgm/cocomo81.htmlhttp://sunset.usc.edu/research/COCOMOII/expert_cocomo/expert_cocomo2000.html
2. SoftStarSystems.com sells CoStar, a Cocomo II on steroids. A trial version limited to 5,000 lines of code is available. Single user license starts at $2,000!!!
3. It’s really hard getting a good handle on all the current algorithms for Cocomo II. It varies over time, administered by fluctuating grad students, etc.
4. Home website for Cocomo: http://sunset.usc.edu/csse/research/COCOMOII/cocomo_main.html
5. Email from USC student: There is no source code available for COCOMO II. This would be an interesting open source/thesis project if you could get their data!

Bibliography• Kemerer(1993) : Empirical studies of assumptions that underlie software
cost estimation. Information and Software Technol., 34(4), 211-18, 1992
• Software Size Estimating: http://yunus.hacettepe.edu.tr/~sencer/size.html
• COCOMO II.1999.0 Model Manual: ftp://ftp.usc.edu/pub/soft_engineering/COCOMOII/cocomo99.0/userman.pdf
• Cocomo II Help Manual available through the software.
• “Cocomo”, Seminar on Software Cost Estimation. Nancy Merlo-Schett.
http://www.ifi.uzh.ch/rerg/fileadmin/downloads/teaching/seminars/seminar_ws0203/Seminar_4.pdf
• “Overview of COCOMO” by SoftStarSystems.com. http://www.softstarsystems.com/overview.htm