coastside county water district 766 main street half...
TRANSCRIPT
COASTSIDE COUNTY WATER DISTRICT
766 MAIN STREET
HALF MOON BAY, CA 94019
REGULAR TUESDAY, NOVEMBER 13, 2018
MEETING OF THE BOARD OF DIRECTORS
AND
THE ADJOURNED OCTOBER 9, 2018 REGULAR
MEETING OF THE BOARD OF DIRECTORS
(Adjourned due to a lack of quorum)
MEETING TIME: 7:00 P.M.
AGENDA
The Coastside County Water District (CCWD) does not discriminate against persons with disabilities. Upon request, the agenda and agenda packet materials can be provided in a format to accommodate special needs. If you require a copy of the agenda or related materials in an alternative format to accommodate a disability, or if you wish to attend this public meeting and will require special assistance or other special equipment, please call the District at (650) 726-4405 in advance and we will make every reasonable attempt to provide such an accommodation.
All public records relating to an open session item on this agenda, which are not exempt from disclosure pursuant to the California Public Records Act, that are distributed to a majority of the legislative body will be available for public inspection at the CCWD District Office, located at 766 Main Street, Half Moon Bay, CA at the same time that the public records are distributed or made available to the legislative body. This agenda and accompanying materials can be viewed on Coastside County Water District’s website located at: www.coastsidewater.org. The Board of the Coastside County Water District reserves the right to take action on any item included on this agenda.
1) ROLL CALL
2) PLEDGE OF ALLEGIANCE
3) PUBLIC COMMENT
At this time members of the public may address the Board of Directors on issues not listed on the agenda which are within the purview of the Coastside County Water District. Comments on matters that are listed on the agenda may be made at the time the Board is considering each item. Each speaker is allowed a maximum of three (3) minutes and must complete and submit a speaker slip. The President of the Board will recognize each speaker, at which time the speaker should proceed to the podium, give their name and address and provide their comments to the Board.
4) CONSENT CALENDAR
The following matters before the Board of Directors are recommended for action as stated by the General Manager. All matters listed hereunder constitute a Consent Calendar, are considered as routine by the Board of Directors, and will be acted upon by a single vote of the Board. There will be no separate discussion of these items unless a member of the Board so requests, in which event the matter shall be removed from the Consent Calendar and considered as a separate item.
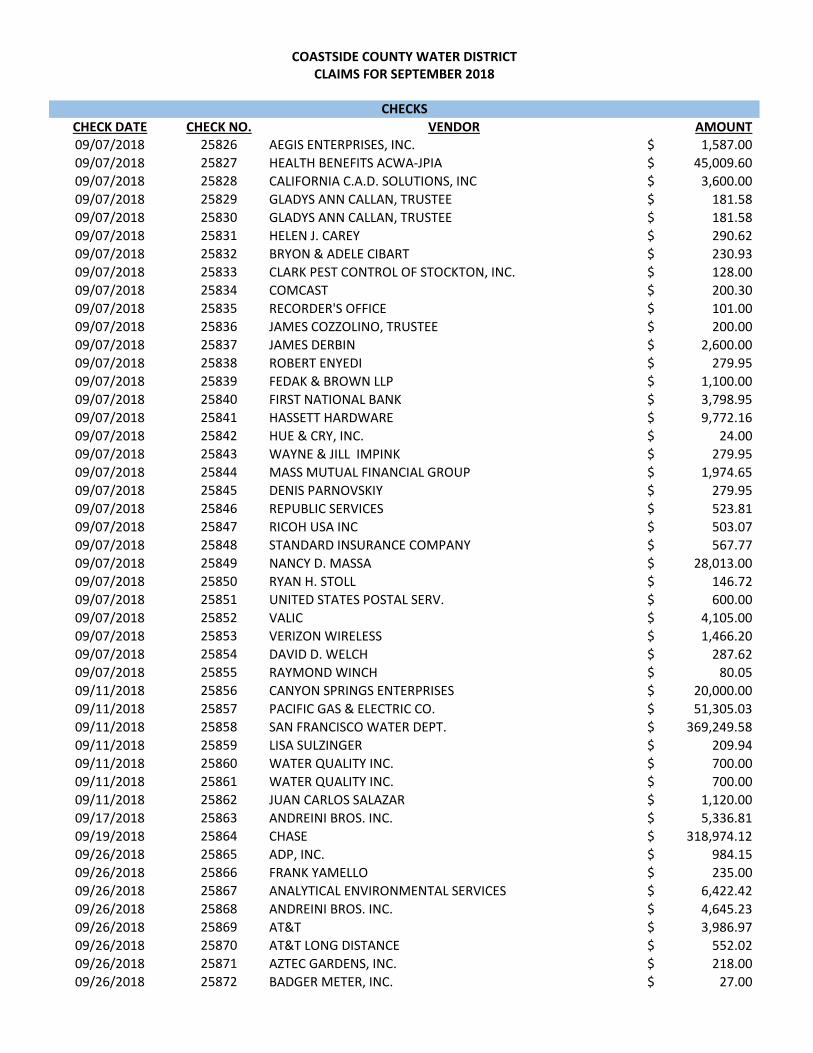
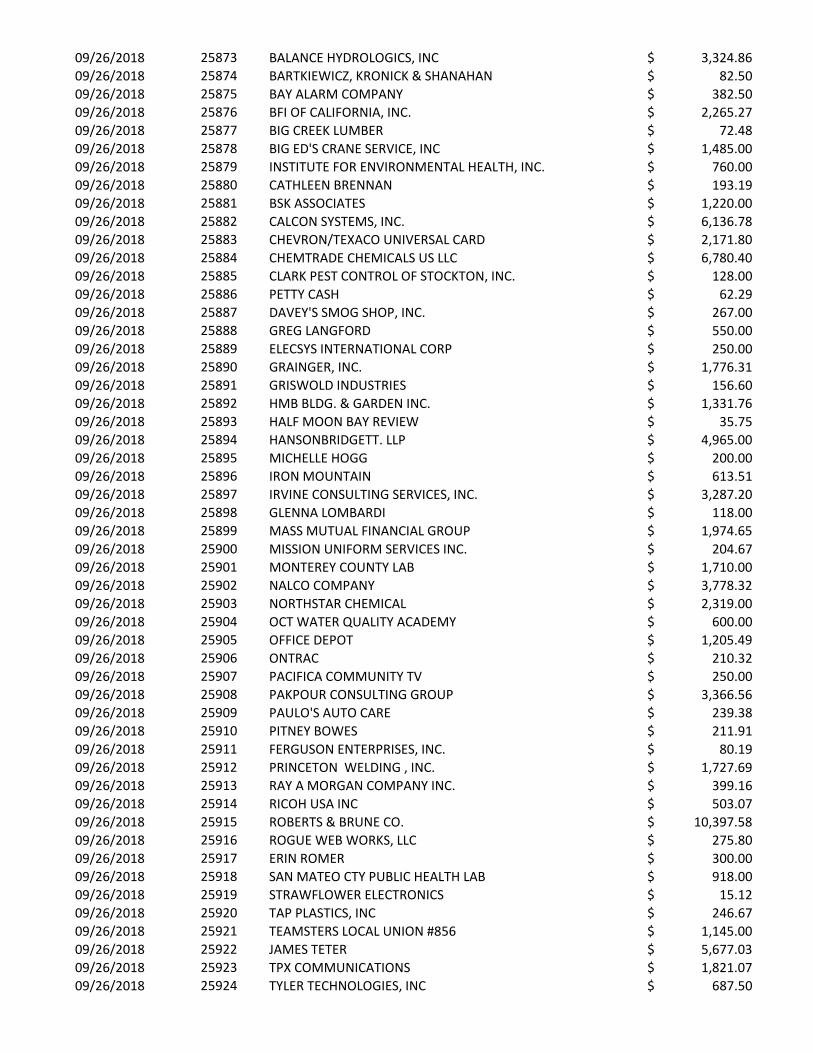
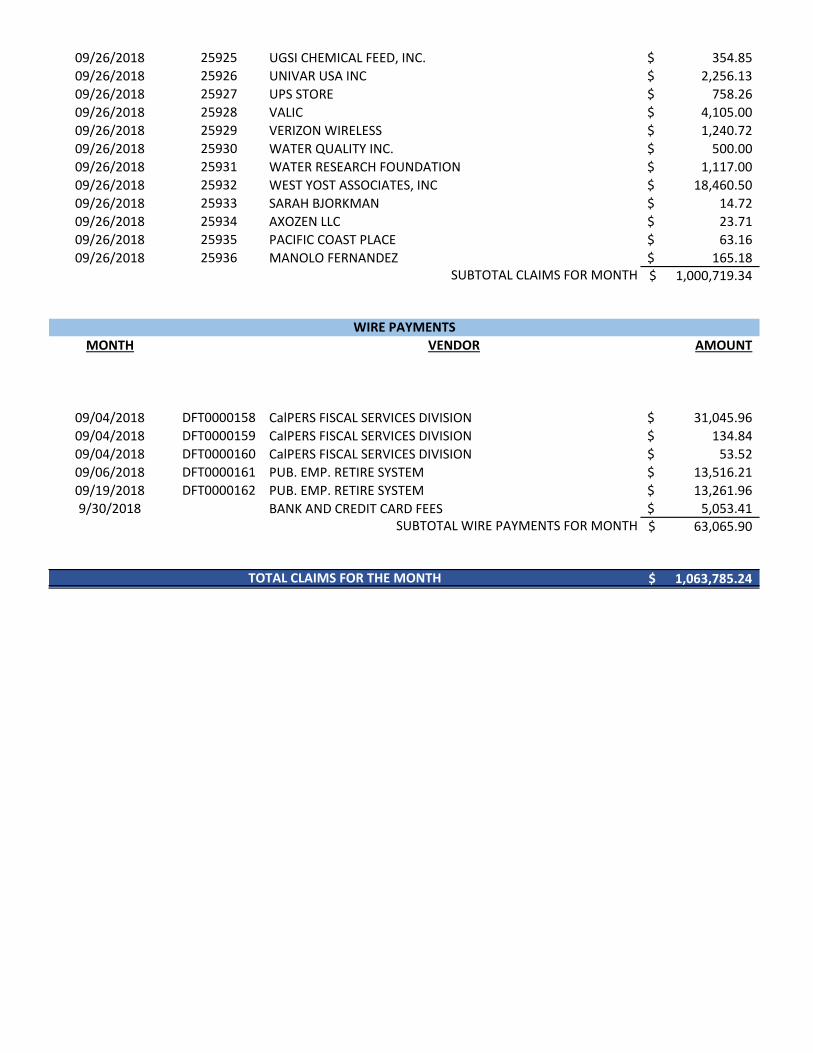
A. Approval of disbursements for the month ending September 30, 2018: Claims: $1,063,785.24; Payroll: $105,906.79 for a total of $1,169,692.03
(attachment) ! September Monthly Financial Claims reviewed and approved by President Feldman
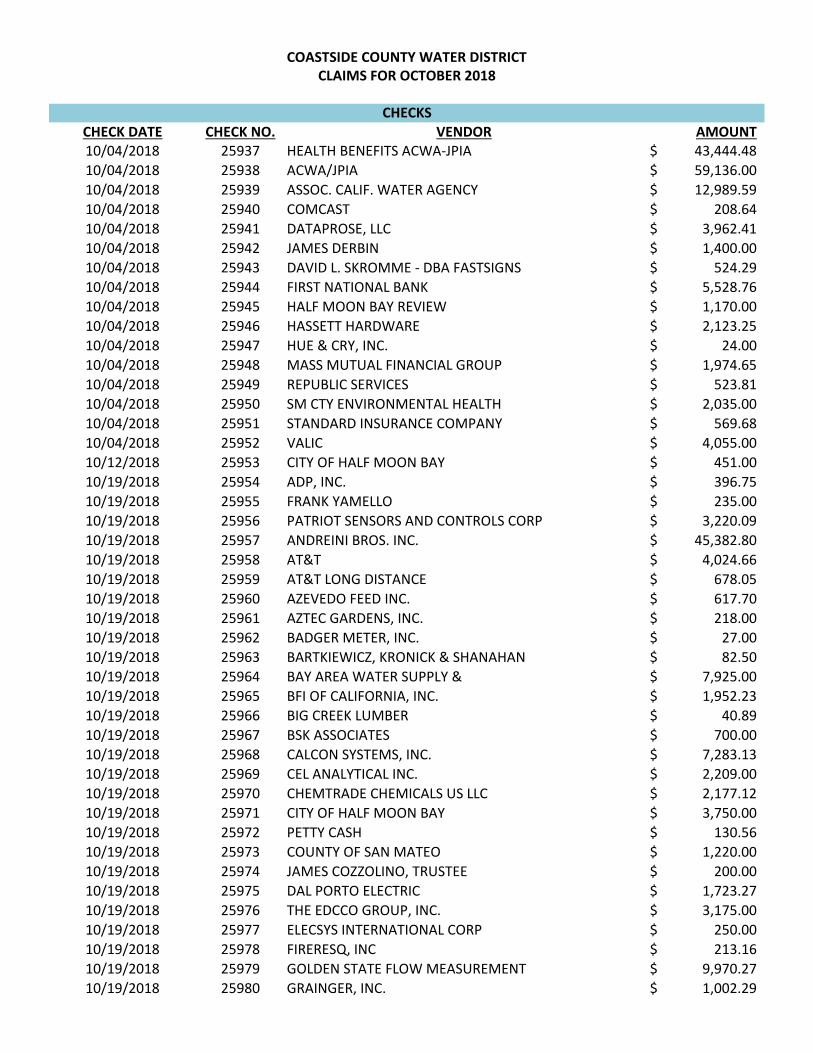
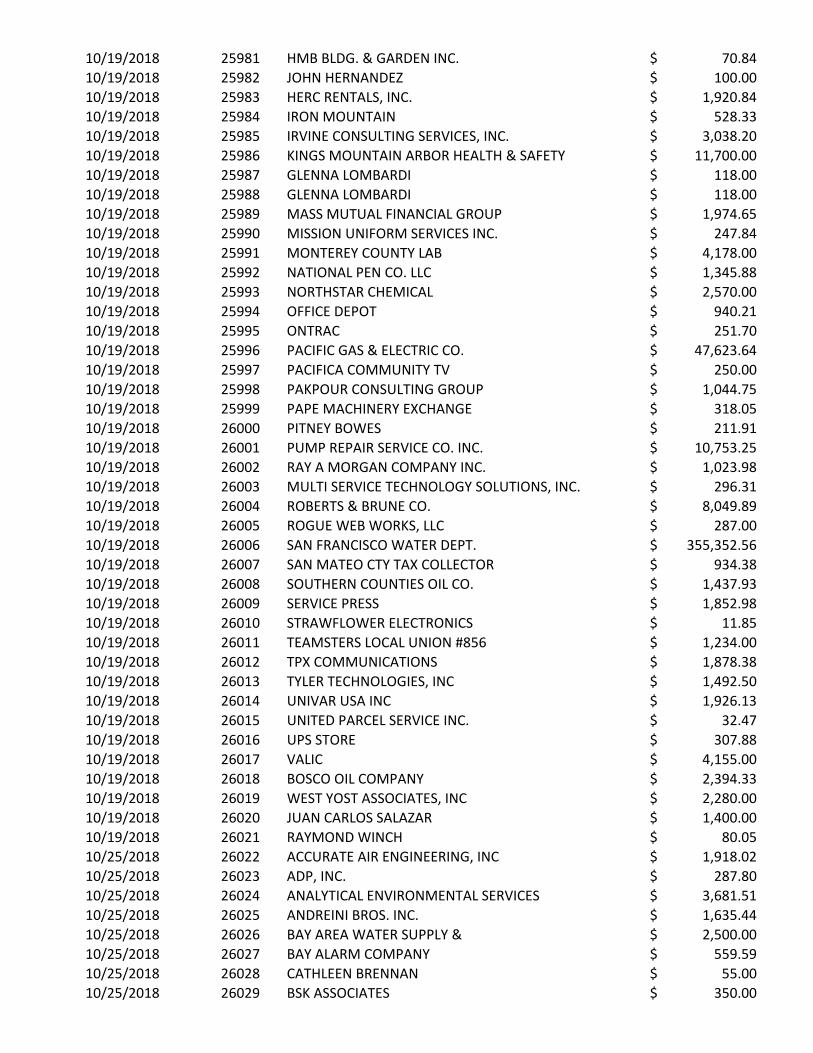
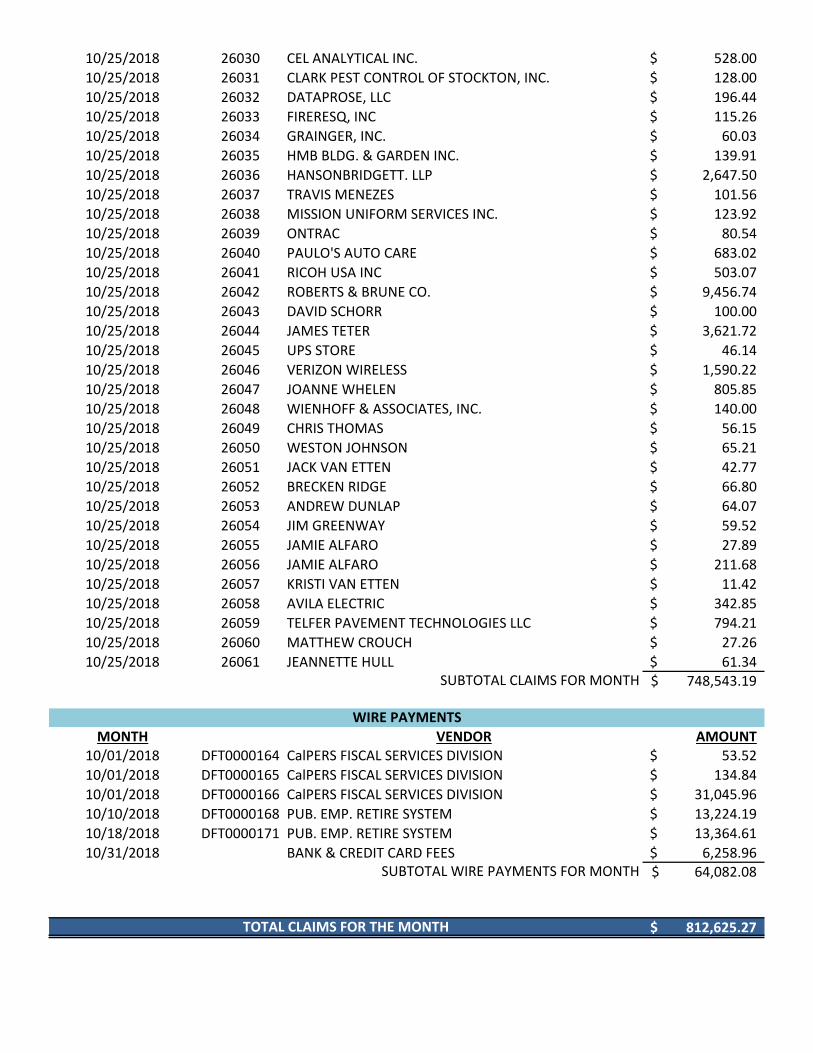
B. Approval of disbursements for the month ending October 31, 2018: Claims: $812,625.27; Payroll: $106,322.13 for a total of $918,947.40 (attachment)
! October Monthly Financial Claims reviewed and approved by Director Glassberg C. Acceptance of Financial Reports (September and October) (attachment) D. Approval of Minutes of September 11, 2018 Regular Board of Directors Meeting
(attachment) E. Installed Water Connection Capacity and Water Meters Report (September &
October) (attachment) F. Total CCWD Production Reports (September and October) (attachment) G. CCWD Monthly Sales by Category Report (September and October) (attachment) H. Monthly Planned Plant or Tank Discharge and New Water Line Flushing Report
(September and October) (attachment) I. Monthly Rainfall Reports (September and October) (attachment) J. SFPUC Hydrological Reports – August and September, 2018 (attachment) K. Notice of Completion – 2-inch Pipeline Downtown Pipeline Replacement Project
(attachment) L. Notice of Completion – Denniston Reservoir Maintenance Dredging Project –
2018 (attachment) 5) MEETINGS ATTENDED / DIRECTOR COMMENTS 6) GENERAL BUSINESS
A. Construction of Highway One South 2-Inch Main Emergency Replacement (attachment)
B. Agreement with Pakpour Consulting Group to Provide Plans and Specifications for the Alves Tank Improvements (attachment)
C. Approval to Purchase PAX Water Technologies Tank Mixers (attachment) D. Resolution Adopting A Surplus Property Policy for the Coastside County Water
District (attachment) E. Quarterly Financial Review (attachment)
7) MONTHLY INFORMATIONAL REPORTS
A. Assistant General Manager’s Report (attachment) B. Superintendent of Operations Report – for months of September and October
(attachment) C. Water Resources Informational Report (attachment)
8) DIRECTOR AGENDA ITEMS – FUTURE BOARD AND COMMITTEE MEETINGS
AND REQUESTS FOR FUTURE BOARD MEETINGS AGENDA ITEMS 9) ADJOURNMENT
CHECK DATE CHECK NO. VENDOR AMOUNT09/07/2018 25826 AEGIS ENTERPRISES, INC. 1,587.00$
09/07/2018 25827 HEALTH BENEFITS ACWA-JPIA 45,009.60$
09/07/2018 25828 CALIFORNIA C.A.D. SOLUTIONS, INC 3,600.00$
09/07/2018 25829 GLADYS ANN CALLAN, TRUSTEE 181.58$
09/07/2018 25830 GLADYS ANN CALLAN, TRUSTEE 181.58$
09/07/2018 25831 HELEN J. CAREY 290.62$
09/07/2018 25832 BRYON & ADELE CIBART 230.93$
09/07/2018 25833 CLARK PEST CONTROL OF STOCKTON, INC. 128.00$
09/07/2018 25834 COMCAST 200.30$
09/07/2018 25835 RECORDER'S OFFICE 101.00$
09/07/2018 25836 JAMES COZZOLINO, TRUSTEE 200.00$
09/07/2018 25837 JAMES DERBIN 2,600.00$
09/07/2018 25838 ROBERT ENYEDI 279.95$
09/07/2018 25839 FEDAK & BROWN LLP 1,100.00$
09/07/2018 25840 FIRST NATIONAL BANK 3,798.95$
09/07/2018 25841 HASSETT HARDWARE 9,772.16$
09/07/2018 25842 HUE & CRY, INC. 24.00$
09/07/2018 25843 WAYNE & JILL IMPINK 279.95$
09/07/2018 25844 MASS MUTUAL FINANCIAL GROUP 1,974.65$
09/07/2018 25845 DENIS PARNOVSKIY 279.95$
09/07/2018 25846 REPUBLIC SERVICES 523.81$
09/07/2018 25847 RICOH USA INC 503.07$
09/07/2018 25848 STANDARD INSURANCE COMPANY 567.77$
09/07/2018 25849 NANCY D. MASSA 28,013.00$
09/07/2018 25850 RYAN H. STOLL 146.72$
09/07/2018 25851 UNITED STATES POSTAL SERV. 600.00$
09/07/2018 25852 VALIC 4,105.00$
09/07/2018 25853 VERIZON WIRELESS 1,466.20$
09/07/2018 25854 DAVID D. WELCH 287.62$
09/07/2018 25855 RAYMOND WINCH 80.05$
09/11/2018 25856 CANYON SPRINGS ENTERPRISES 20,000.00$
09/11/2018 25857 PACIFIC GAS & ELECTRIC CO. 51,305.03$
09/11/2018 25858 SAN FRANCISCO WATER DEPT. 369,249.58$
09/11/2018 25859 LISA SULZINGER 209.94$
09/11/2018 25860 WATER QUALITY INC. 700.00$
09/11/2018 25861 WATER QUALITY INC. 700.00$
09/11/2018 25862 JUAN CARLOS SALAZAR 1,120.00$
09/17/2018 25863 ANDREINI BROS. INC. 5,336.81$
09/19/2018 25864 CHASE 318,974.12$
09/26/2018 25865 ADP, INC. 984.15$
09/26/2018 25866 FRANK YAMELLO 235.00$
09/26/2018 25867 ANALYTICAL ENVIRONMENTAL SERVICES 6,422.42$
09/26/2018 25868 ANDREINI BROS. INC. 4,645.23$
09/26/2018 25869 AT&T 3,986.97$
09/26/2018 25870 AT&T LONG DISTANCE 552.02$
09/26/2018 25871 AZTEC GARDENS, INC. 218.00$
09/26/2018 25872 BADGER METER, INC. 27.00$
COASTSIDE COUNTY WATER DISTRICTCLAIMS FOR SEPTEMBER 2018
CHECKS
09/26/2018 25873 BALANCE HYDROLOGICS, INC 3,324.86$
09/26/2018 25874 BARTKIEWICZ, KRONICK & SHANAHAN 82.50$
09/26/2018 25875 BAY ALARM COMPANY 382.50$
09/26/2018 25876 BFI OF CALIFORNIA, INC. 2,265.27$
09/26/2018 25877 BIG CREEK LUMBER 72.48$
09/26/2018 25878 BIG ED'S CRANE SERVICE, INC 1,485.00$
09/26/2018 25879 INSTITUTE FOR ENVIRONMENTAL HEALTH, INC. 760.00$
09/26/2018 25880 CATHLEEN BRENNAN 193.19$
09/26/2018 25881 BSK ASSOCIATES 1,220.00$
09/26/2018 25882 CALCON SYSTEMS, INC. 6,136.78$
09/26/2018 25883 CHEVRON/TEXACO UNIVERSAL CARD 2,171.80$
09/26/2018 25884 CHEMTRADE CHEMICALS US LLC 6,780.40$
09/26/2018 25885 CLARK PEST CONTROL OF STOCKTON, INC. 128.00$
09/26/2018 25886 PETTY CASH 62.29$
09/26/2018 25887 DAVEY'S SMOG SHOP, INC. 267.00$
09/26/2018 25888 GREG LANGFORD 550.00$
09/26/2018 25889 ELECSYS INTERNATIONAL CORP 250.00$
09/26/2018 25890 GRAINGER, INC. 1,776.31$
09/26/2018 25891 GRISWOLD INDUSTRIES 156.60$
09/26/2018 25892 HMB BLDG. & GARDEN INC. 1,331.76$
09/26/2018 25893 HALF MOON BAY REVIEW 35.75$
09/26/2018 25894 HANSONBRIDGETT. LLP 4,965.00$
09/26/2018 25895 MICHELLE HOGG 200.00$
09/26/2018 25896 IRON MOUNTAIN 613.51$
09/26/2018 25897 IRVINE CONSULTING SERVICES, INC. 3,287.20$
09/26/2018 25898 GLENNA LOMBARDI 118.00$
09/26/2018 25899 MASS MUTUAL FINANCIAL GROUP 1,974.65$
09/26/2018 25900 MISSION UNIFORM SERVICES INC. 204.67$
09/26/2018 25901 MONTEREY COUNTY LAB 1,710.00$
09/26/2018 25902 NALCO COMPANY 3,778.32$
09/26/2018 25903 NORTHSTAR CHEMICAL 2,319.00$
09/26/2018 25904 OCT WATER QUALITY ACADEMY 600.00$
09/26/2018 25905 OFFICE DEPOT 1,205.49$
09/26/2018 25906 ONTRAC 210.32$
09/26/2018 25907 PACIFICA COMMUNITY TV 250.00$
09/26/2018 25908 PAKPOUR CONSULTING GROUP 3,366.56$
09/26/2018 25909 PAULO'S AUTO CARE 239.38$
09/26/2018 25910 PITNEY BOWES 211.91$
09/26/2018 25911 FERGUSON ENTERPRISES, INC. 80.19$
09/26/2018 25912 PRINCETON WELDING , INC. 1,727.69$
09/26/2018 25913 RAY A MORGAN COMPANY INC. 399.16$
09/26/2018 25914 RICOH USA INC 503.07$
09/26/2018 25915 ROBERTS & BRUNE CO. 10,397.58$
09/26/2018 25916 ROGUE WEB WORKS, LLC 275.80$
09/26/2018 25917 ERIN ROMER 300.00$
09/26/2018 25918 SAN MATEO CTY PUBLIC HEALTH LAB 918.00$
09/26/2018 25919 STRAWFLOWER ELECTRONICS 15.12$
09/26/2018 25920 TAP PLASTICS, INC 246.67$
09/26/2018 25921 TEAMSTERS LOCAL UNION #856 1,145.00$
09/26/2018 25922 JAMES TETER 5,677.03$
09/26/2018 25923 TPX COMMUNICATIONS 1,821.07$
09/26/2018 25924 TYLER TECHNOLOGIES, INC 687.50$
09/26/2018 25925 UGSI CHEMICAL FEED, INC. 354.85$
09/26/2018 25926 UNIVAR USA INC 2,256.13$
09/26/2018 25927 UPS STORE 758.26$
09/26/2018 25928 VALIC 4,105.00$
09/26/2018 25929 VERIZON WIRELESS 1,240.72$
09/26/2018 25930 WATER QUALITY INC. 500.00$
09/26/2018 25931 WATER RESEARCH FOUNDATION 1,117.00$
09/26/2018 25932 WEST YOST ASSOCIATES, INC 18,460.50$
09/26/2018 25933 SARAH BJORKMAN 14.72$
09/26/2018 25934 AXOZEN LLC 23.71$
09/26/2018 25935 PACIFIC COAST PLACE 63.16$
09/26/2018 25936 MANOLO FERNANDEZ 165.18$ 1,000,719.34$
MONTH VENDOR AMOUNT
09/04/2018 DFT0000158 CalPERS FISCAL SERVICES DIVISION 31,045.96$
09/04/2018 DFT0000159 CalPERS FISCAL SERVICES DIVISION 134.84$
09/04/2018 DFT0000160 CalPERS FISCAL SERVICES DIVISION 53.52$
09/06/2018 DFT0000161 PUB. EMP. RETIRE SYSTEM 13,516.21$
09/19/2018 DFT0000162 PUB. EMP. RETIRE SYSTEM 13,261.96$
9/30/2018 BANK AND CREDIT CARD FEES 5,053.41$ 63,065.90$
1,063,785.24$ TOTAL CLAIMS FOR THE MONTH
SUBTOTAL CLAIMS FOR MONTH
WIRE PAYMENTS
SUBTOTAL WIRE PAYMENTS FOR MONTH
CHECK DATE CHECK NO. VENDOR AMOUNT10/04/2018 25937 HEALTH BENEFITS ACWA-JPIA 43,444.48$
10/04/2018 25938 ACWA/JPIA 59,136.00$
10/04/2018 25939 ASSOC. CALIF. WATER AGENCY 12,989.59$
10/04/2018 25940 COMCAST 208.64$
10/04/2018 25941 DATAPROSE, LLC 3,962.41$
10/04/2018 25942 JAMES DERBIN 1,400.00$
10/04/2018 25943 DAVID L. SKROMME - DBA FASTSIGNS 524.29$
10/04/2018 25944 FIRST NATIONAL BANK 5,528.76$
10/04/2018 25945 HALF MOON BAY REVIEW 1,170.00$
10/04/2018 25946 HASSETT HARDWARE 2,123.25$
10/04/2018 25947 HUE & CRY, INC. 24.00$
10/04/2018 25948 MASS MUTUAL FINANCIAL GROUP 1,974.65$
10/04/2018 25949 REPUBLIC SERVICES 523.81$
10/04/2018 25950 SM CTY ENVIRONMENTAL HEALTH 2,035.00$
10/04/2018 25951 STANDARD INSURANCE COMPANY 569.68$
10/04/2018 25952 VALIC 4,055.00$
10/12/2018 25953 CITY OF HALF MOON BAY 451.00$
10/19/2018 25954 ADP, INC. 396.75$
10/19/2018 25955 FRANK YAMELLO 235.00$
10/19/2018 25956 PATRIOT SENSORS AND CONTROLS CORP 3,220.09$
10/19/2018 25957 ANDREINI BROS. INC. 45,382.80$
10/19/2018 25958 AT&T 4,024.66$
10/19/2018 25959 AT&T LONG DISTANCE 678.05$
10/19/2018 25960 AZEVEDO FEED INC. 617.70$
10/19/2018 25961 AZTEC GARDENS, INC. 218.00$
10/19/2018 25962 BADGER METER, INC. 27.00$
10/19/2018 25963 BARTKIEWICZ, KRONICK & SHANAHAN 82.50$
10/19/2018 25964 BAY AREA WATER SUPPLY & 7,925.00$
10/19/2018 25965 BFI OF CALIFORNIA, INC. 1,952.23$
10/19/2018 25966 BIG CREEK LUMBER 40.89$
10/19/2018 25967 BSK ASSOCIATES 700.00$
10/19/2018 25968 CALCON SYSTEMS, INC. 7,283.13$
10/19/2018 25969 CEL ANALYTICAL INC. 2,209.00$
10/19/2018 25970 CHEMTRADE CHEMICALS US LLC 2,177.12$
10/19/2018 25971 CITY OF HALF MOON BAY 3,750.00$
10/19/2018 25972 PETTY CASH 130.56$
10/19/2018 25973 COUNTY OF SAN MATEO 1,220.00$
10/19/2018 25974 JAMES COZZOLINO, TRUSTEE 200.00$
10/19/2018 25975 DAL PORTO ELECTRIC 1,723.27$
10/19/2018 25976 THE EDCCO GROUP, INC. 3,175.00$
10/19/2018 25977 ELECSYS INTERNATIONAL CORP 250.00$
10/19/2018 25978 FIRERESQ, INC 213.16$
10/19/2018 25979 GOLDEN STATE FLOW MEASUREMENT 9,970.27$
10/19/2018 25980 GRAINGER, INC. 1,002.29$
CHECKS
CLAIMS FOR OCTOBER 2018COASTSIDE COUNTY WATER DISTRICT
10/19/2018 25981 HMB BLDG. & GARDEN INC. 70.84$
10/19/2018 25982 JOHN HERNANDEZ 100.00$
10/19/2018 25983 HERC RENTALS, INC. 1,920.84$
10/19/2018 25984 IRON MOUNTAIN 528.33$
10/19/2018 25985 IRVINE CONSULTING SERVICES, INC. 3,038.20$
10/19/2018 25986 KINGS MOUNTAIN ARBOR HEALTH & SAFETY 11,700.00$
10/19/2018 25987 GLENNA LOMBARDI 118.00$
10/19/2018 25988 GLENNA LOMBARDI 118.00$
10/19/2018 25989 MASS MUTUAL FINANCIAL GROUP 1,974.65$
10/19/2018 25990 MISSION UNIFORM SERVICES INC. 247.84$
10/19/2018 25991 MONTEREY COUNTY LAB 4,178.00$
10/19/2018 25992 NATIONAL PEN CO. LLC 1,345.88$
10/19/2018 25993 NORTHSTAR CHEMICAL 2,570.00$
10/19/2018 25994 OFFICE DEPOT 940.21$
10/19/2018 25995 ONTRAC 251.70$
10/19/2018 25996 PACIFIC GAS & ELECTRIC CO. 47,623.64$
10/19/2018 25997 PACIFICA COMMUNITY TV 250.00$
10/19/2018 25998 PAKPOUR CONSULTING GROUP 1,044.75$
10/19/2018 25999 PAPE MACHINERY EXCHANGE 318.05$
10/19/2018 26000 PITNEY BOWES 211.91$
10/19/2018 26001 PUMP REPAIR SERVICE CO. INC. 10,753.25$
10/19/2018 26002 RAY A MORGAN COMPANY INC. 1,023.98$
10/19/2018 26003 MULTI SERVICE TECHNOLOGY SOLUTIONS, INC. 296.31$
10/19/2018 26004 ROBERTS & BRUNE CO. 8,049.89$
10/19/2018 26005 ROGUE WEB WORKS, LLC 287.00$
10/19/2018 26006 SAN FRANCISCO WATER DEPT. 355,352.56$
10/19/2018 26007 SAN MATEO CTY TAX COLLECTOR 934.38$
10/19/2018 26008 SOUTHERN COUNTIES OIL CO. 1,437.93$
10/19/2018 26009 SERVICE PRESS 1,852.98$
10/19/2018 26010 STRAWFLOWER ELECTRONICS 11.85$
10/19/2018 26011 TEAMSTERS LOCAL UNION #856 1,234.00$
10/19/2018 26012 TPX COMMUNICATIONS 1,878.38$
10/19/2018 26013 TYLER TECHNOLOGIES, INC 1,492.50$
10/19/2018 26014 UNIVAR USA INC 1,926.13$
10/19/2018 26015 UNITED PARCEL SERVICE INC. 32.47$
10/19/2018 26016 UPS STORE 307.88$
10/19/2018 26017 VALIC 4,155.00$
10/19/2018 26018 BOSCO OIL COMPANY 2,394.33$
10/19/2018 26019 WEST YOST ASSOCIATES, INC 2,280.00$
10/19/2018 26020 JUAN CARLOS SALAZAR 1,400.00$
10/19/2018 26021 RAYMOND WINCH 80.05$
10/25/2018 26022 ACCURATE AIR ENGINEERING, INC 1,918.02$
10/25/2018 26023 ADP, INC. 287.80$
10/25/2018 26024 ANALYTICAL ENVIRONMENTAL SERVICES 3,681.51$
10/25/2018 26025 ANDREINI BROS. INC. 1,635.44$
10/25/2018 26026 BAY AREA WATER SUPPLY & 2,500.00$
10/25/2018 26027 BAY ALARM COMPANY 559.59$
10/25/2018 26028 CATHLEEN BRENNAN 55.00$
10/25/2018 26029 BSK ASSOCIATES 350.00$
10/25/2018 26030 CEL ANALYTICAL INC. 528.00$
10/25/2018 26031 CLARK PEST CONTROL OF STOCKTON, INC. 128.00$
10/25/2018 26032 DATAPROSE, LLC 196.44$
10/25/2018 26033 FIRERESQ, INC 115.26$
10/25/2018 26034 GRAINGER, INC. 60.03$
10/25/2018 26035 HMB BLDG. & GARDEN INC. 139.91$
10/25/2018 26036 HANSONBRIDGETT. LLP 2,647.50$
10/25/2018 26037 TRAVIS MENEZES 101.56$
10/25/2018 26038 MISSION UNIFORM SERVICES INC. 123.92$
10/25/2018 26039 ONTRAC 80.54$
10/25/2018 26040 PAULO'S AUTO CARE 683.02$
10/25/2018 26041 RICOH USA INC 503.07$
10/25/2018 26042 ROBERTS & BRUNE CO. 9,456.74$
10/25/2018 26043 DAVID SCHORR 100.00$
10/25/2018 26044 JAMES TETER 3,621.72$
10/25/2018 26045 UPS STORE 46.14$
10/25/2018 26046 VERIZON WIRELESS 1,590.22$
10/25/2018 26047 JOANNE WHELEN 805.85$
10/25/2018 26048 WIENHOFF & ASSOCIATES, INC. 140.00$
10/25/2018 26049 CHRIS THOMAS 56.15$
10/25/2018 26050 WESTON JOHNSON 65.21$
10/25/2018 26051 JACK VAN ETTEN 42.77$
10/25/2018 26052 BRECKEN RIDGE 66.80$
10/25/2018 26053 ANDREW DUNLAP 64.07$
10/25/2018 26054 JIM GREENWAY 59.52$
10/25/2018 26055 JAMIE ALFARO 27.89$
10/25/2018 26056 JAMIE ALFARO 211.68$
10/25/2018 26057 KRISTI VAN ETTEN 11.42$
10/25/2018 26058 AVILA ELECTRIC 342.85$
10/25/2018 26059 TELFER PAVEMENT TECHNOLOGIES LLC 794.21$
10/25/2018 26060 MATTHEW CROUCH 27.26$
10/25/2018 26061 JEANNETTE HULL 61.34$ 748,543.19$
MONTH VENDOR AMOUNT10/01/2018 DFT0000164 CalPERS FISCAL SERVICES DIVISION 53.52$
10/01/2018 DFT0000165 CalPERS FISCAL SERVICES DIVISION 134.84$
10/01/2018 DFT0000166 CalPERS FISCAL SERVICES DIVISION 31,045.96$
10/10/2018 DFT0000168 PUB. EMP. RETIRE SYSTEM 13,224.19$
10/18/2018 DFT0000171 PUB. EMP. RETIRE SYSTEM 13,364.61$
10/31/2018 BANK & CREDIT CARD FEES 6,258.96$ 64,082.08$
812,625.27$
SUBTOTAL WIRE PAYMENTS FOR MONTH
TOTAL CLAIMS FOR THE MONTH
SUBTOTAL CLAIMS FOR MONTH
WIRE PAYMENTS
10/3/2018 11:30:12 AM Page 1 of 2
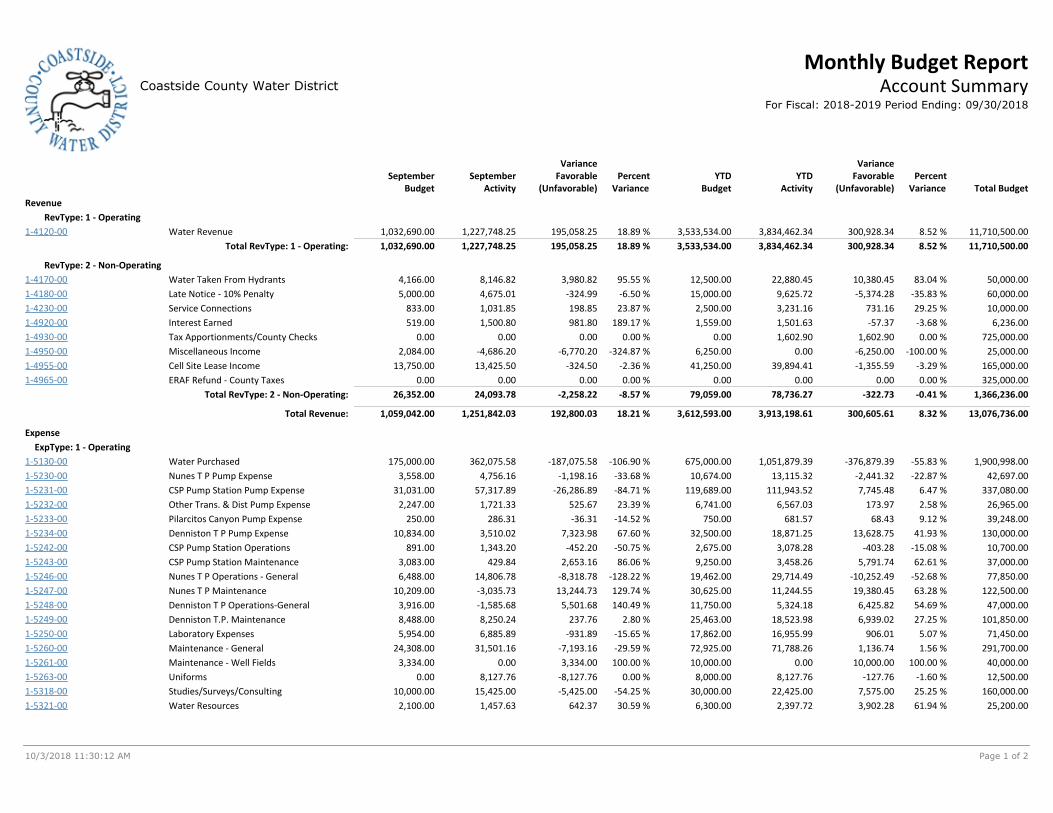
Monthly Budget ReportCoastside County Water District Account Summary
For Fiscal: 2018-2019 Period Ending: 09/30/2018
YTDActivity
VarianceFavorable
(Unfavorable)Percent
Variance Total BudgetSeptember
ActivitySeptember
Budget
VarianceFavorable
(Unfavorable)YTD
BudgetPercent
VarianceRevenue
RevType: 1 - Operating
Water Revenue 11,710,500.003,834,462.34 300,928.341,227,748.251-4120-00 1,032,690.00 195,058.25 3,533,534.0018.89 % 8.52 %
Total RevType: 1 - Operating: 11,710,500.00300,928.341,032,690.00 195,058.25 3,533,534.001,227,748.25 3,834,462.34 8.52 %18.89 %
RevType: 2 - Non-Operating
Water Taken From Hydrants 50,000.0022,880.45 10,380.458,146.821-4170-00 4,166.00 3,980.82 12,500.0095.55 % 83.04 %
Late Notice - 10% Penalty 60,000.009,625.72 -5,374.284,675.011-4180-00 5,000.00 -324.99 15,000.00-6.50 % -35.83 %
Service Connections 10,000.003,231.16 731.161,031.851-4230-00 833.00 198.85 2,500.0023.87 % 29.25 %
Interest Earned 6,236.001,501.63 -57.371,500.801-4920-00 519.00 981.80 1,559.00189.17 % -3.68 %
Tax Apportionments/County Checks 725,000.001,602.90 1,602.900.001-4930-00 0.00 0.00 0.000.00 % 0.00 %
Miscellaneous Income 25,000.000.00 -6,250.00-4,686.201-4950-00 2,084.00 -6,770.20 6,250.00-324.87 % -100.00 %
Cell Site Lease Income 165,000.0039,894.41 -1,355.5913,425.501-4955-00 13,750.00 -324.50 41,250.00-2.36 % -3.29 %
ERAF Refund - County Taxes 325,000.000.00 0.000.001-4965-00 0.00 0.00 0.000.00 % 0.00 %
Total RevType: 2 - Non-Operating: 1,366,236.00-322.7326,352.00 -2,258.22 79,059.0024,093.78 78,736.27 -0.41 %-8.57 %
Total Revenue: 13,076,736.00300,605.611,059,042.00 192,800.03 3,612,593.001,251,842.03 3,913,198.61 8.32 %18.21 %
Expense
ExpType: 1 - Operating
Water Purchased 1,900,998.001,051,879.39 -376,879.39362,075.581-5130-00 175,000.00 -187,075.58 675,000.00-106.90 % -55.83 %
Nunes T P Pump Expense 42,697.0013,115.32 -2,441.324,756.161-5230-00 3,558.00 -1,198.16 10,674.00-33.68 % -22.87 %
CSP Pump Station Pump Expense 337,080.00111,943.52 7,745.4857,317.891-5231-00 31,031.00 -26,286.89 119,689.00-84.71 % 6.47 %
Other Trans. & Dist Pump Expense 26,965.006,567.03 173.971,721.331-5232-00 2,247.00 525.67 6,741.0023.39 % 2.58 %
Pilarcitos Canyon Pump Expense 39,248.00681.57 68.43286.311-5233-00 250.00 -36.31 750.00-14.52 % 9.12 %
Denniston T P Pump Expense 130,000.0018,871.25 13,628.753,510.021-5234-00 10,834.00 7,323.98 32,500.0067.60 % 41.93 %
CSP Pump Station Operations 10,700.003,078.28 -403.281,343.201-5242-00 891.00 -452.20 2,675.00-50.75 % -15.08 %
CSP Pump Station Maintenance 37,000.003,458.26 5,791.74429.841-5243-00 3,083.00 2,653.16 9,250.0086.06 % 62.61 %
Nunes T P Operations - General 77,850.0029,714.49 -10,252.4914,806.781-5246-00 6,488.00 -8,318.78 19,462.00-128.22 % -52.68 %
Nunes T P Maintenance 122,500.0011,244.55 19,380.45-3,035.731-5247-00 10,209.00 13,244.73 30,625.00129.74 % 63.28 %
Denniston T P Operations-General 47,000.005,324.18 6,425.82-1,585.681-5248-00 3,916.00 5,501.68 11,750.00140.49 % 54.69 %
Denniston T.P. Maintenance 101,850.0018,523.98 6,939.028,250.241-5249-00 8,488.00 237.76 25,463.002.80 % 27.25 %
Laboratory Expenses 71,450.0016,955.99 906.016,885.891-5250-00 5,954.00 -931.89 17,862.00-15.65 % 5.07 %
Maintenance - General 291,700.0071,788.26 1,136.7431,501.161-5260-00 24,308.00 -7,193.16 72,925.00-29.59 % 1.56 %
Maintenance - Well Fields 40,000.000.00 10,000.000.001-5261-00 3,334.00 3,334.00 10,000.00100.00 % 100.00 %
Uniforms 12,500.008,127.76 -127.768,127.761-5263-00 0.00 -8,127.76 8,000.000.00 % -1.60 %
Studies/Surveys/Consulting 160,000.0022,425.00 7,575.0015,425.001-5318-00 10,000.00 -5,425.00 30,000.00-54.25 % 25.25 %
Water Resources 25,200.002,397.72 3,902.281,457.631-5321-00 2,100.00 642.37 6,300.0030.59 % 61.94 %
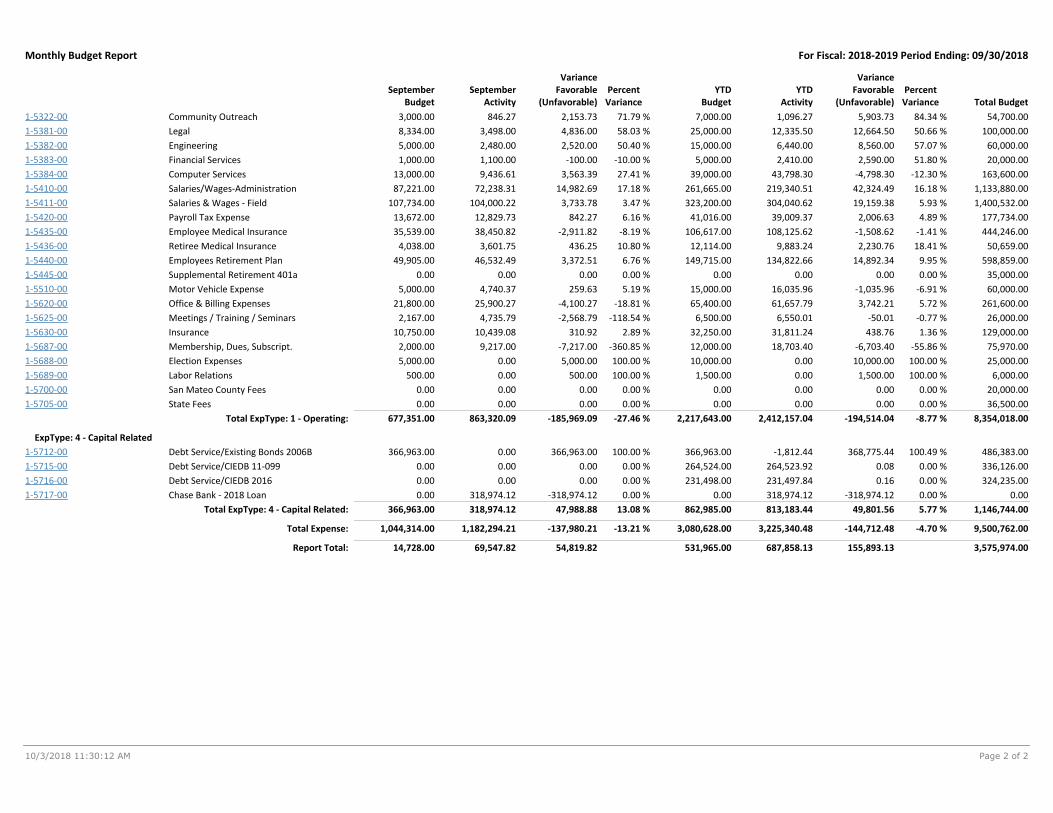
Monthly Budget Report For Fiscal: 2018-2019 Period Ending: 09/30/2018
10/3/2018 11:30:12 AM Page 2 of 2
YTDActivity
VarianceFavorable
(Unfavorable) Percent Variance Total Budget
SeptemberActivity
SeptemberBudget
VarianceFavorable
(Unfavorable)YTD
Budget Percent Variance
Community Outreach 54,700.001,096.27 5,903.73846.271-5322-00 3,000.00 2,153.73 7,000.0071.79 % 84.34 %
Legal 100,000.0012,335.50 12,664.503,498.001-5381-00 8,334.00 4,836.00 25,000.0058.03 % 50.66 %
Engineering 60,000.006,440.00 8,560.002,480.001-5382-00 5,000.00 2,520.00 15,000.0050.40 % 57.07 %
Financial Services 20,000.002,410.00 2,590.001,100.001-5383-00 1,000.00 -100.00 5,000.00-10.00 % 51.80 %
Computer Services 163,600.0043,798.30 -4,798.309,436.611-5384-00 13,000.00 3,563.39 39,000.0027.41 % -12.30 %
Salaries/Wages-Administration 1,133,880.00219,340.51 42,324.4972,238.311-5410-00 87,221.00 14,982.69 261,665.0017.18 % 16.18 %
Salaries & Wages - Field 1,400,532.00304,040.62 19,159.38104,000.221-5411-00 107,734.00 3,733.78 323,200.003.47 % 5.93 %
Payroll Tax Expense 177,734.0039,009.37 2,006.6312,829.731-5420-00 13,672.00 842.27 41,016.006.16 % 4.89 %
Employee Medical Insurance 444,246.00108,125.62 -1,508.6238,450.821-5435-00 35,539.00 -2,911.82 106,617.00-8.19 % -1.41 %
Retiree Medical Insurance 50,659.009,883.24 2,230.763,601.751-5436-00 4,038.00 436.25 12,114.0010.80 % 18.41 %
Employees Retirement Plan 598,859.00134,822.66 14,892.3446,532.491-5440-00 49,905.00 3,372.51 149,715.006.76 % 9.95 %
Supplemental Retirement 401a 35,000.000.00 0.000.001-5445-00 0.00 0.00 0.000.00 % 0.00 %
Motor Vehicle Expense 60,000.0016,035.96 -1,035.964,740.371-5510-00 5,000.00 259.63 15,000.005.19 % -6.91 %
Office & Billing Expenses 261,600.0061,657.79 3,742.2125,900.271-5620-00 21,800.00 -4,100.27 65,400.00-18.81 % 5.72 %
Meetings / Training / Seminars 26,000.006,550.01 -50.014,735.791-5625-00 2,167.00 -2,568.79 6,500.00-118.54 % -0.77 %
Insurance 129,000.0031,811.24 438.7610,439.081-5630-00 10,750.00 310.92 32,250.002.89 % 1.36 %
Membership, Dues, Subscript. 75,970.0018,703.40 -6,703.409,217.001-5687-00 2,000.00 -7,217.00 12,000.00-360.85 % -55.86 %
Election Expenses 25,000.000.00 10,000.000.001-5688-00 5,000.00 5,000.00 10,000.00100.00 % 100.00 %
Labor Relations 6,000.000.00 1,500.000.001-5689-00 500.00 500.00 1,500.00100.00 % 100.00 %
San Mateo County Fees 20,000.000.00 0.000.001-5700-00 0.00 0.00 0.000.00 % 0.00 %
State Fees 36,500.000.00 0.000.001-5705-00 0.00 0.00 0.000.00 % 0.00 %
Total ExpType: 1 - Operating: 8,354,018.00-194,514.04677,351.00 -185,969.09 2,217,643.00863,320.09 2,412,157.04 -8.77 %-27.46 %
ExpType: 4 - Capital Related
Debt Service/Existing Bonds 2006B 486,383.00-1,812.44 368,775.440.001-5712-00 366,963.00 366,963.00 366,963.00100.00 % 100.49 %
Debt Service/CIEDB 11-099 336,126.00264,523.92 0.080.001-5715-00 0.00 0.00 264,524.000.00 % 0.00 %
Debt Service/CIEDB 2016 324,235.00231,497.84 0.160.001-5716-00 0.00 0.00 231,498.000.00 % 0.00 %
Chase Bank - 2018 Loan 0.00318,974.12 -318,974.12318,974.121-5717-00 0.00 -318,974.12 0.000.00 % 0.00 %
Total ExpType: 4 - Capital Related: 1,146,744.0049,801.56366,963.00 47,988.88 862,985.00318,974.12 813,183.44 5.77 %13.08 %
Total Expense: 9,500,762.00-144,712.481,044,314.00 -137,980.21 3,080,628.001,182,294.21 3,225,340.48 -4.70 %-13.21 %
Report Total: 3,575,974.00155,893.1314,728.00 54,819.82 531,965.0069,547.82 687,858.13

Current Year Prior Year
as of 9/30/18 as of 9/30/17
$6,601,236.73 $4,782,904.69
$250,000.00 $250,000.00
TOTAL DISTRICT RESERVES $6,851,236.73 $5,032,904.69
ACCOUNT DETAIL
$4,621,566.15 $3,979,321.46
CSP T & S ACCOUNT $160,385.72 $16,930.17
MONEY MARKET GEN. FUND (Opened 7/20/17) $19,432.09 $2,500.00
$2,049,152.77 $1,033,453.06
DISTRICT CASH ON HAND $700.00 $700.00
TOTAL ACCOUNT BALANCES $6,851,236.73 $5,032,904.69
This report is in conformity with CCWD's Investment Policy.
LOCAL AGENCY INVESTMENT FUND (LAIF) BALANCE
CHECKING ACCOUNT*
September 30, 2018
COASTSIDE COUNTY WATER DISTRICT
MONTHLY INVESTMENT REPORT
CAPITAL AND OPERATING RESERVE
RATE STABILIZATION RESERVE
RESERVE BALANCES
ACCOUNTS WITH FIRST NATIONAL BANK (FNB)
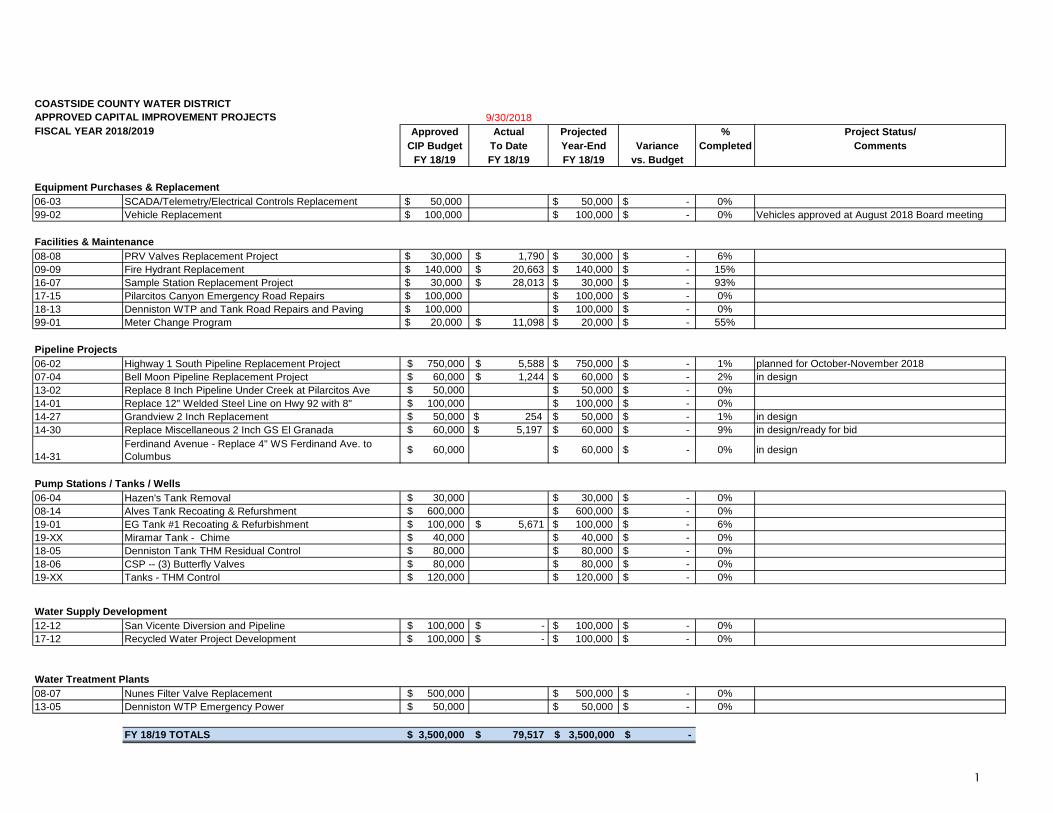
COASTSIDE COUNTY WATER DISTRICT9/30/2018
Approved Actual Projected % Project Status/CIP Budget To Date Year-End Variance Completed Comments
FY 18/19 FY 18/19 FY 18/19 vs. Budget
06‐03 SCADA/Telemetry/Electrical Controls Replacement $ 50,000 $ 50,000 $ - 0%99-02 Vehicle Replacement $ 100,000 $ 100,000 $ - 0% Vehicles approved at August 2018 Board meeting
08-08 PRV Valves Replacement Project $ 30,000 $ 1,790 $ 30,000 $ - 6%09-09 Fire Hydrant Replacement $ 140,000 $ 20,663 $ 140,000 $ - 15%16-07 Sample Station Replacement Project $ 30,000 $ 28,013 $ 30,000 $ - 93%17-15 Pilarcitos Canyon Emergency Road Repairs $ 100,000 $ 100,000 $ - 0%18-13 Denniston WTP and Tank Road Repairs and Paving $ 100,000 $ 100,000 $ - 0%99-01 Meter Change Program $ 20,000 $ 11,098 $ 20,000 $ - 55%
06-02 Highway 1 South Pipeline Replacement Project $ 750,000 $ 5,588 $ 750,000 $ - 1% planned for October-November 201807-04 Bell Moon Pipeline Replacement Project $ 60,000 $ 1,244 $ 60,000 $ - 2% in design13-02 Replace 8 Inch Pipeline Under Creek at Pilarcitos Ave $ 50,000 $ 50,000 $ - 0%14-01 Replace 12" Welded Steel Line on Hwy 92 with 8" $ 100,000 $ 100,000 $ - 0%14-27 Grandview 2 Inch Replacement $ 50,000 $ 254 $ 50,000 $ - 1% in design14-30 Replace Miscellaneous 2 Inch GS El Granada $ 60,000 $ 5,197 $ 60,000 $ - 9% in design/ready for bid
14-31Ferdinand Avenue - Replace 4" WS Ferdinand Ave. to Columbus $ 60,000 $ 60,000 $ - 0% in design
06-04 Hazen's Tank Removal $ 30,000 $ 30,000 $ - 0%08-14 Alves Tank Recoating & Refurshment $ 600,000 $ 600,000 $ - 0%19-01 EG Tank #1 Recoating & Refurbishment $ 100,000 $ 5,671 $ 100,000 $ - 6%19-XX Miramar Tank - Chime $ 40,000 $ 40,000 $ - 0%18-05 Denniston Tank THM Residual Control $ 80,000 $ 80,000 $ - 0%18-06 CSP -- (3) Butterfly Valves $ 80,000 $ 80,000 $ - 0%19-XX Tanks - THM Control $ 120,000 $ 120,000 $ - 0%
12-12 San Vicente Diversion and Pipeline $ 100,000 $ - $ 100,000 $ - 0%17-12 Recycled Water Project Development $ 100,000 $ - $ 100,000 $ - 0%
08-07 Nunes Filter Valve Replacement $ 500,000 $ 500,000 $ - 0%13-05 Denniston WTP Emergency Power $ 50,000 $ 50,000 $ - 0%
FY 18/19 TOTALS $ 3,500,000 $ 79,517 $ 3,500,000 $ -
FISCAL YEAR 2018/2019APPROVED CAPITAL IMPROVEMENT PROJECTS
Water Treatment Plants
Equipment Purchases & Replacement
Facilities & Maintenance
Pipeline Projects
Pump Stations / Tanks / Wells
Water Supply Development
1
COASTSIDE COUNTY WATER DISTRICT9/30/2018
Approved Actual Projected % Project Status/CIP Budget To Date Year-End Variance Completed Comments
FY 18/19 FY 18/19 FY 18/19 vs. Budget
FISCAL YEAR 2018/2019APPROVED CAPITAL IMPROVEMENT PROJECTS
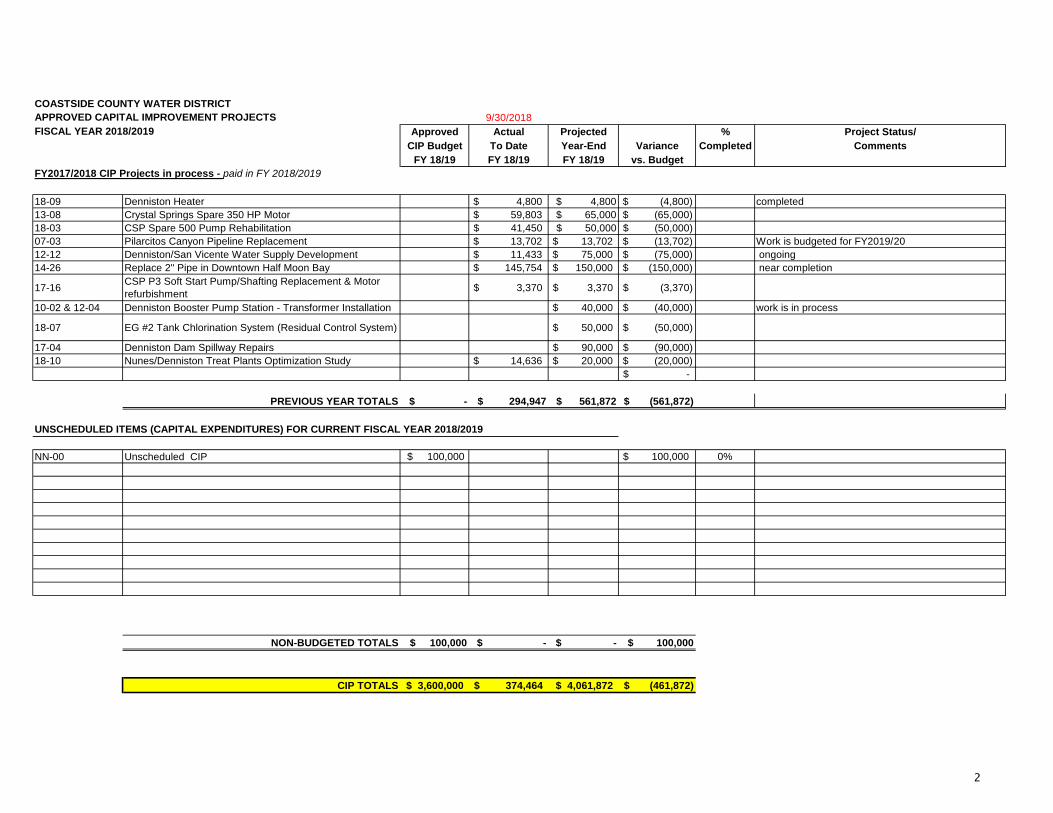
18-09 Denniston Heater $ 4,800 $ 4,800 $ (4,800) completed13-08 Crystal Springs Spare 350 HP Motor $ 59,803 $ 65,000 $ (65,000)18-03 CSP Spare 500 Pump Rehabilitation $ 41,450 $ 50,000 $ (50,000)07-03 Pilarcitos Canyon Pipeline Replacement $ 13,702 $ 13,702 $ (13,702) Work is budgeted for FY2019/2012-12 Denniston/San Vicente Water Supply Development $ 11,433 $ 75,000 $ (75,000) ongoing 14-26 Replace 2" Pipe in Downtown Half Moon Bay $ 145,754 $ 150,000 $ (150,000) near completion
17-16 CSP P3 Soft Start Pump/Shafting Replacement & Motor refurbishment $ 3,370 $ 3,370 $ (3,370)
10-02 & 12-04 Denniston Booster Pump Station - Transformer Installation $ 40,000 $ (40,000) work is in process
18-07 EG #2 Tank Chlorination System (Residual Control System) $ 50,000 $ (50,000)
17-04 Denniston Dam Spillway Repairs $ 90,000 $ (90,000)18-10 Nunes/Denniston Treat Plants Optimization Study $ 14,636 $ 20,000 $ (20,000)
$ -
PREVIOUS YEAR TOTALS $ - $ 294,947 $ 561,872 $ (561,872)
NN-00 Unscheduled CIP $ 100,000 $ 100,000 0%
NON-BUDGETED TOTALS $ 100,000 $ - $ - $ 100,000
CIP TOTALS 3,600,000$ 374,464$ 4,061,872$ (461,872)$
FY2017/2018 CIP Projects in process - paid in FY 2018/2019
UNSCHEDULED ITEMS (CAPITAL EXPENDITURES) FOR CURRENT FISCAL YEAR 2018/2019
2

Patrick Miyaki - HansonBridgett, LLP
Admin Water Transfer Water Infrastructure
(General Supply Recycled Program Shortage ProjectLegal Develpmnt Water ReviewFees)
(Reimbursable)
Oct-17 975 222 130 1,268 2,595Nov-17 2,418 226 2,340 525 5,509Dec-17 4,934 138 1,300 130 6,502Jan-18 878 412 260 2,178 3,727Feb-18 4,485 1,052 260 1,040 6,837Mar-18 1,268 454 962 1,203 3,886Apr-18 2,503 8,301 10,803May-18 6,754 1,404 8,158Jun-18 4,225 406 1,333 358 6,321Jul-18 7,430 1,680 488 65 9,662Aug-18 3,230 647 1,608 216 5,701Sep-18 3,246 757 963 4,965
TOTAL 42,343 0 0 5,993 16,335 7,600 0 0 2,394 74,664
Legal
Acct. No.5681
Legal Cost Tracking Report
12 Months At-A-Glance
Month CIP Personnel Litigation TOTAL
Admin & Studies & TOTAL ReimburseableMonth Retainer CIP Projects from
Projects
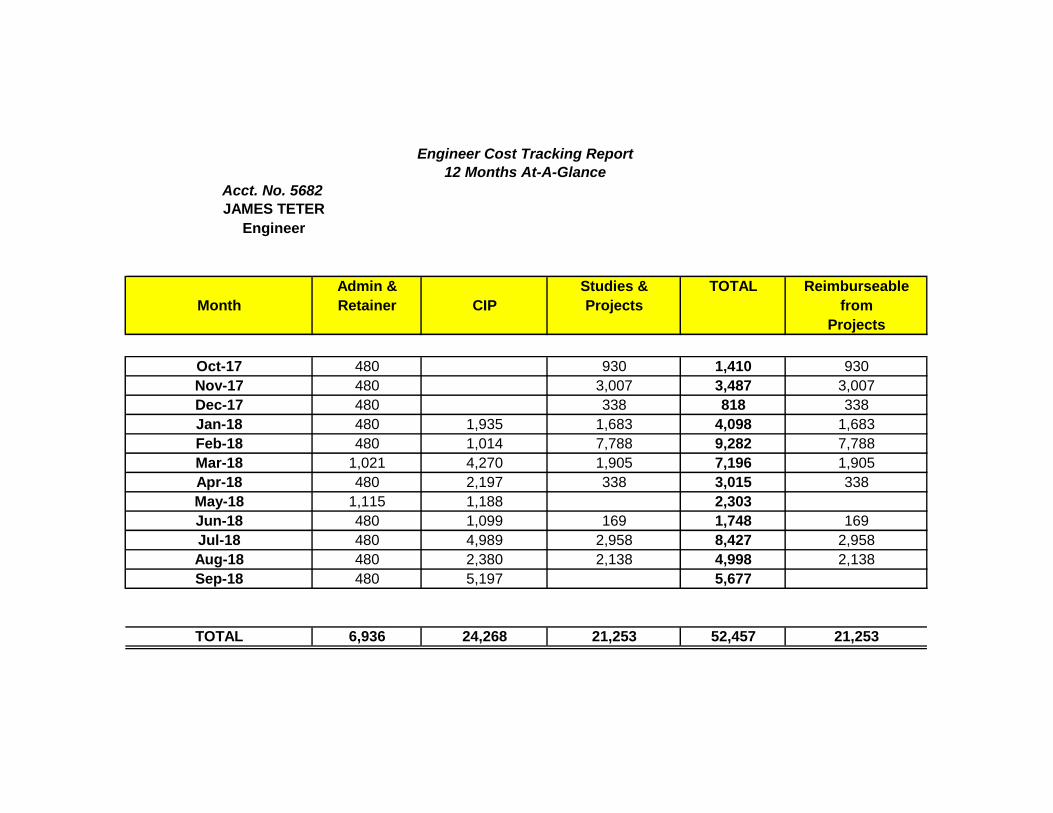
Oct-17 480 930 1,410 930Nov-17 480 3,007 3,487 3,007Dec-17 480 338 818 338Jan-18 480 1,935 1,683 4,098 1,683Feb-18 480 1,014 7,788 9,282 7,788Mar-18 1,021 4,270 1,905 7,196 1,905Apr-18 480 2,197 338 3,015 338May-18 1,115 1,188 2,303Jun-18 480 1,099 169 1,748 169Jul-18 480 4,989 2,958 8,427 2,958Aug-18 480 2,380 2,138 4,998 2,138Sep-18 480 5,197 5,677
TOTAL 6,936 24,268 21,253 52,457 21,253
Engineer
Acct. No. 5682
JAMES TETER
Engineer Cost Tracking Report
12 Months At-A-Glance

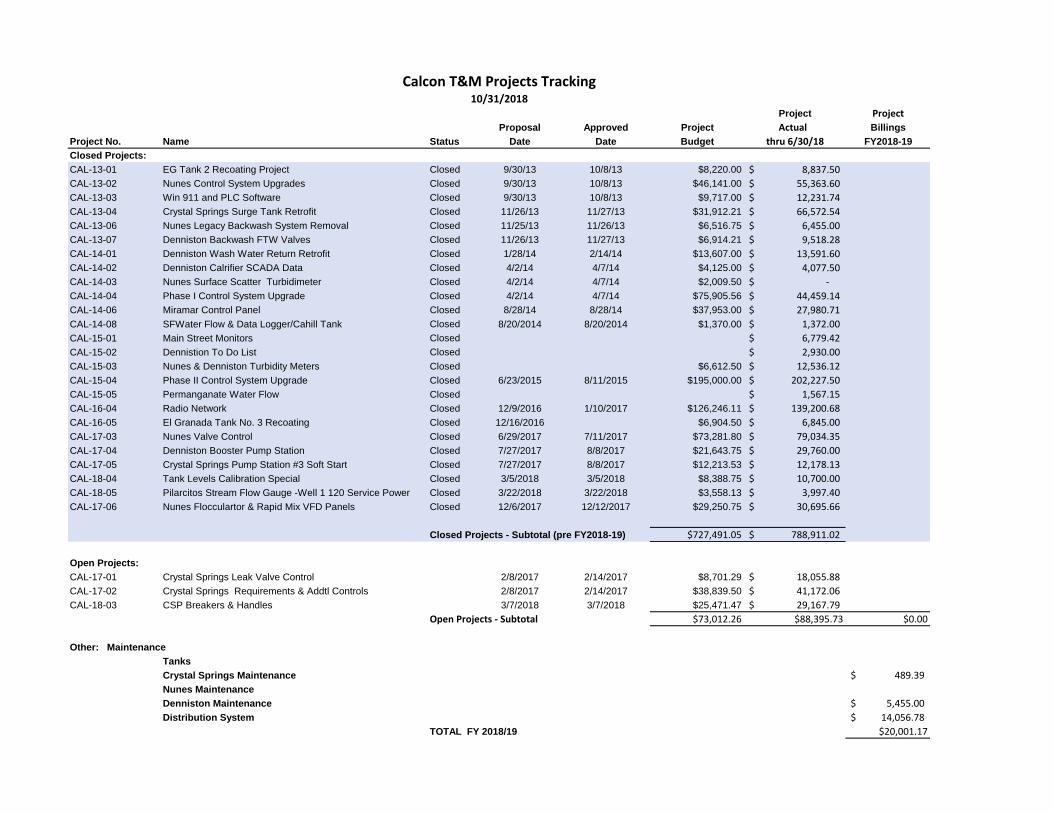
Project Project
Proposal Approved Project Actual BillingsProject No. Name Status Date Date Budget thru 6/30/18 FY2018-19Closed Projects:CAL-13-01 EG Tank 2 Recoating Project Closed 9/30/13 10/8/13 $8,220.00 8,837.50$
CAL-13-02 Nunes Control System Upgrades Closed 9/30/13 10/8/13 $46,141.00 55,363.60$
CAL-13-03 Win 911 and PLC Software Closed 9/30/13 10/8/13 $9,717.00 12,231.74$
CAL-13-04 Crystal Springs Surge Tank Retrofit Closed 11/26/13 11/27/13 $31,912.21 66,572.54$
CAL-13-06 Nunes Legacy Backwash System Removal Closed 11/25/13 11/26/13 $6,516.75 6,455.00$
CAL-13-07 Denniston Backwash FTW Valves Closed 11/26/13 11/27/13 $6,914.21 9,518.28$
CAL-14-01 Denniston Wash Water Return Retrofit Closed 1/28/14 2/14/14 $13,607.00 13,591.60$
CAL-14-02 Denniston Calrifier SCADA Data Closed 4/2/14 4/7/14 $4,125.00 4,077.50$
CAL-14-03 Nunes Surface Scatter Turbidimeter Closed 4/2/14 4/7/14 $2,009.50 -$
CAL-14-04 Phase I Control System Upgrade Closed 4/2/14 4/7/14 $75,905.56 44,459.14$
CAL-14-06 Miramar Control Panel Closed 8/28/14 8/28/14 $37,953.00 27,980.71$
CAL-14-08 SFWater Flow & Data Logger/Cahill Tank Closed 8/20/2014 8/20/2014 $1,370.00 1,372.00$
CAL-15-01 Main Street Monitors Closed 6,779.42$
CAL-15-02 Dennistion To Do List Closed 2,930.00$
CAL-15-03 Nunes & Denniston Turbidity Meters Closed $6,612.50 12,536.12$
CAL-15-04 Phase II Control System Upgrade Closed 6/23/2015 8/11/2015 $195,000.00 202,227.50$
CAL-15-05 Permanganate Water Flow Closed 1,567.15$
CAL-16-04 Radio Network Closed 12/9/2016 1/10/2017 $126,246.11 139,200.68$
CAL-16-05 El Granada Tank No. 3 Recoating Closed 12/16/2016 $6,904.50 6,845.00$
CAL-17-03 Nunes Valve Control Closed 6/29/2017 7/11/2017 $73,281.80 79,034.35$
CAL-17-04 Denniston Booster Pump Station Closed 7/27/2017 8/8/2017 $21,643.75 29,760.00$
CAL-17-05 Crystal Springs Pump Station #3 Soft Start Closed 7/27/2017 8/8/2017 $12,213.53 12,178.13$
CAL-18-04 Tank Levels Calibration Special Closed 3/5/2018 3/5/2018 $8,388.75 10,700.00$
CAL-18-05 Pilarcitos Stream Flow Gauge -Well 1 120 Service Power Closed 3/22/2018 3/22/2018 $3,558.13 3,997.40$
CAL-17-06 Nunes Flocculartor & Rapid Mix VFD Panels Closed 12/6/2017 12/12/2017 $29,250.75 30,695.66$
Closed Projects - Subtotal (pre FY2018-19) $727,491.05 788,911.02$
Open Projects:CAL-17-01 Crystal Springs Leak Valve Control 2/8/2017 2/14/2017 $8,701.29 18,055.88$
CAL-17-02 Crystal Springs Requirements & Addtl Controls 2/8/2017 2/14/2017 $38,839.50 41,172.06$
CAL-18-03 CSP Breakers & Handles 3/7/2018 3/7/2018 $25,471.47 29,167.79$
Open Projects - Subtotal $73,012.26 $88,395.73 $0.00
Other: MaintenanceTanksCrystal Springs Maintenance 326.26$
Nunes MaintenanceDenniston Maintenance 4,085.00$
Distribution System 8,306.78$
TOTAL FY 2018/19 $12,718.04
Calcon T&M Projects Tracking9/30/2018
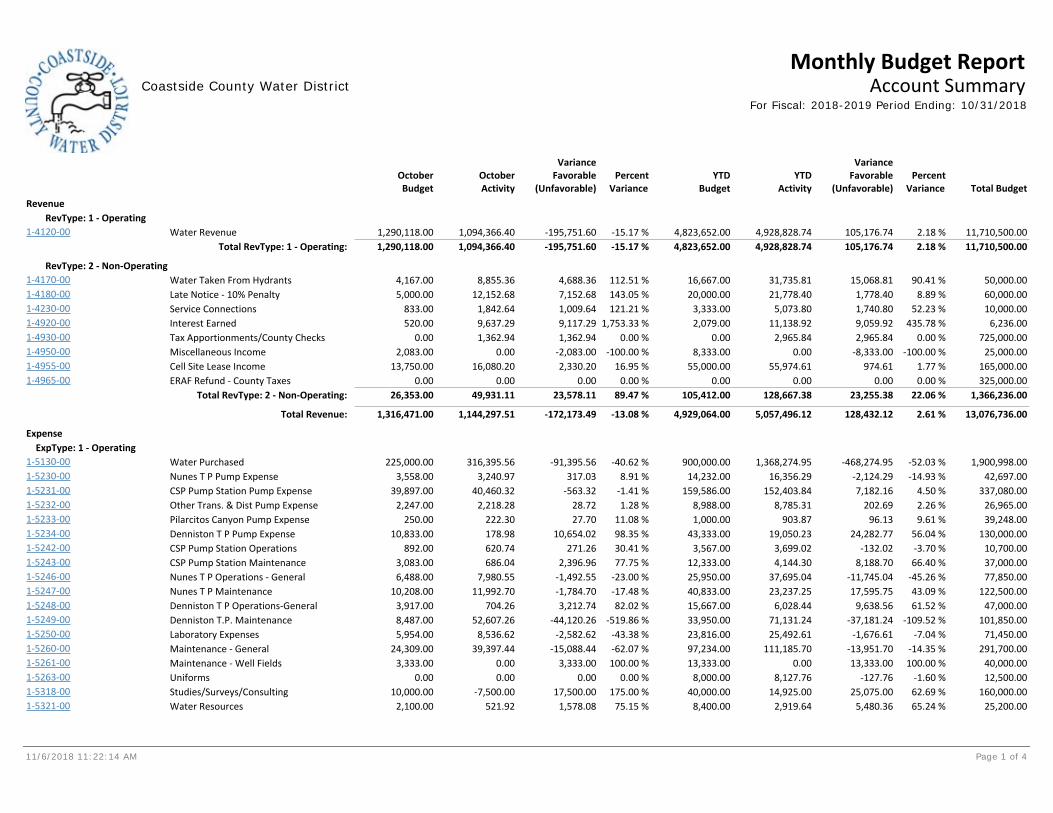
11/6/2018 11:22:14 AM Page 1 of 4
Monthly Budget ReportCoastside County Water District Account Summary
For Fiscal: 2018-2019 Period Ending: 10/31/2018
YTDActivity
VarianceFavorable
(Unfavorable)Percent
Variance Total BudgetOctoberActivity
OctoberBudget
VarianceFavorable
(Unfavorable)YTD
BudgetPercent
VarianceRevenue
RevType: 1 - OperatingWater Revenue 11,710,500.004,928,828.74 105,176.741,094,366.401-4120-00 1,290,118.00 -195,751.60 4,823,652.00-15.17 % 2.18 %
Total RevType: 1 - Operating: 11,710,500.00105,176.741,290,118.00 -195,751.60 4,823,652.001,094,366.40 4,928,828.74 2.18 %-15.17 %
RevType: 2 - Non-OperatingWater Taken From Hydrants 50,000.0031,735.81 15,068.818,855.361-4170-00 4,167.00 4,688.36 16,667.00112.51 % 90.41 %Late Notice - 10% Penalty 60,000.0021,778.40 1,778.4012,152.681-4180-00 5,000.00 7,152.68 20,000.00143.05 % 8.89 %Service Connections 10,000.005,073.80 1,740.801,842.641-4230-00 833.00 1,009.64 3,333.00121.21 % 52.23 %Interest Earned 6,236.0011,138.92 9,059.929,637.291-4920-00 520.00 9,117.29 2,079.001,753.33 % 435.78 %Tax Apportionments/County Checks 725,000.002,965.84 2,965.841,362.941-4930-00 0.00 1,362.94 0.000.00 % 0.00 %Miscellaneous Income 25,000.000.00 -8,333.000.001-4950-00 2,083.00 -2,083.00 8,333.00-100.00 % -100.00 %Cell Site Lease Income 165,000.0055,974.61 974.6116,080.201-4955-00 13,750.00 2,330.20 55,000.0016.95 % 1.77 %ERAF Refund - County Taxes 325,000.000.00 0.000.001-4965-00 0.00 0.00 0.000.00 % 0.00 %
Total RevType: 2 - Non-Operating: 1,366,236.0023,255.3826,353.00 23,578.11 105,412.0049,931.11 128,667.38 22.06 %89.47 %
Total Revenue: 13,076,736.00128,432.121,316,471.00 -172,173.49 4,929,064.001,144,297.51 5,057,496.12 2.61 %-13.08 %
ExpenseExpType: 1 - Operating
Water Purchased 1,900,998.001,368,274.95 -468,274.95316,395.561-5130-00 225,000.00 -91,395.56 900,000.00-40.62 % -52.03 %Nunes T P Pump Expense 42,697.0016,356.29 -2,124.293,240.971-5230-00 3,558.00 317.03 14,232.008.91 % -14.93 %CSP Pump Station Pump Expense 337,080.00152,403.84 7,182.1640,460.321-5231-00 39,897.00 -563.32 159,586.00-1.41 % 4.50 %Other Trans. & Dist Pump Expense 26,965.008,785.31 202.692,218.281-5232-00 2,247.00 28.72 8,988.001.28 % 2.26 %Pilarcitos Canyon Pump Expense 39,248.00903.87 96.13222.301-5233-00 250.00 27.70 1,000.0011.08 % 9.61 %Denniston T P Pump Expense 130,000.0019,050.23 24,282.77178.981-5234-00 10,833.00 10,654.02 43,333.0098.35 % 56.04 %CSP Pump Station Operations 10,700.003,699.02 -132.02620.741-5242-00 892.00 271.26 3,567.0030.41 % -3.70 %CSP Pump Station Maintenance 37,000.004,144.30 8,188.70686.041-5243-00 3,083.00 2,396.96 12,333.0077.75 % 66.40 %Nunes T P Operations - General 77,850.0037,695.04 -11,745.047,980.551-5246-00 6,488.00 -1,492.55 25,950.00-23.00 % -45.26 %Nunes T P Maintenance 122,500.0023,237.25 17,595.7511,992.701-5247-00 10,208.00 -1,784.70 40,833.00-17.48 % 43.09 %Denniston T P Operations-General 47,000.006,028.44 9,638.56704.261-5248-00 3,917.00 3,212.74 15,667.0082.02 % 61.52 %Denniston T.P. Maintenance 101,850.0071,131.24 -37,181.2452,607.261-5249-00 8,487.00 -44,120.26 33,950.00-519.86 % -109.52 %Laboratory Expenses 71,450.0025,492.61 -1,676.618,536.621-5250-00 5,954.00 -2,582.62 23,816.00-43.38 % -7.04 %Maintenance - General 291,700.00111,185.70 -13,951.7039,397.441-5260-00 24,309.00 -15,088.44 97,234.00-62.07 % -14.35 %Maintenance - Well Fields 40,000.000.00 13,333.000.001-5261-00 3,333.00 3,333.00 13,333.00100.00 % 100.00 %Uniforms 12,500.008,127.76 -127.760.001-5263-00 0.00 0.00 8,000.000.00 % -1.60 %Studies/Surveys/Consulting 160,000.0014,925.00 25,075.00-7,500.001-5318-00 10,000.00 17,500.00 40,000.00175.00 % 62.69 %Water Resources 25,200.002,919.64 5,480.36521.921-5321-00 2,100.00 1,578.08 8,400.0075.15 % 65.24 %
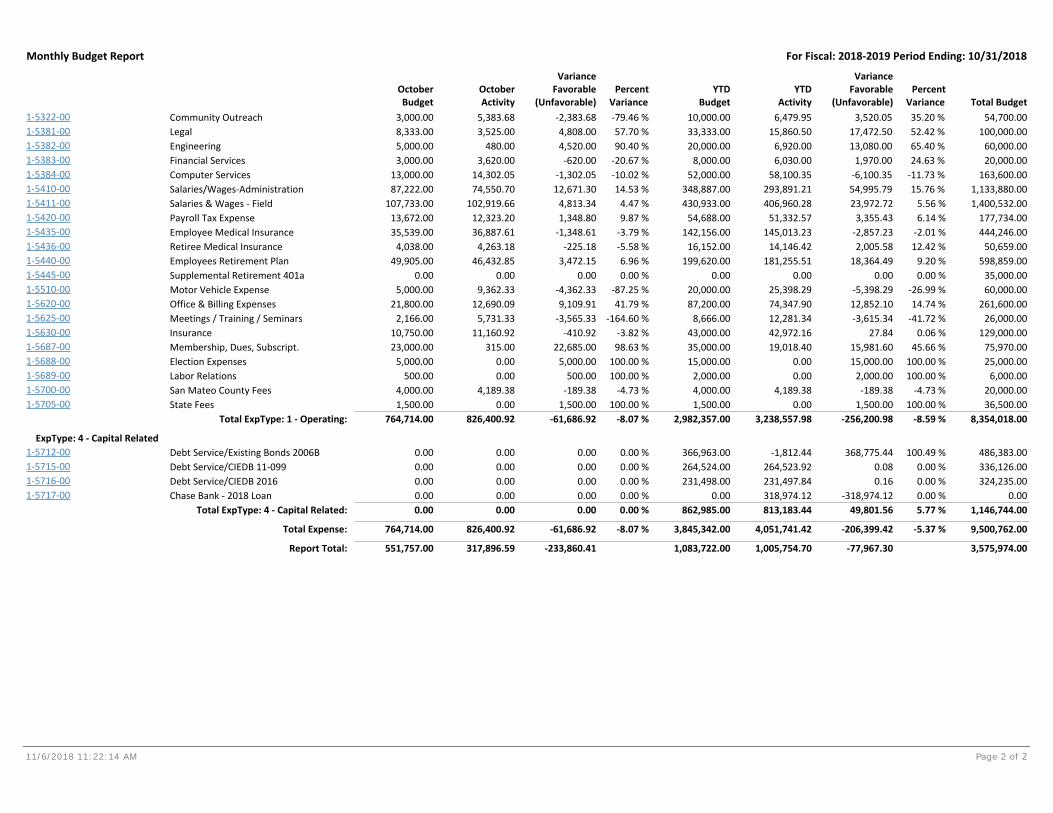
Monthly Budget Report For Fiscal: 2018-2019 Period Ending: 10/31/2018
11/6/2018 11:22:14 AM Page 2 of 2
YTDActivity
VarianceFavorable
(Unfavorable)Percent
Variance Total BudgetOctoberActivity
OctoberBudget
VarianceFavorable
(Unfavorable)YTD
BudgetPercent
VarianceCommunity Outreach 54,700.006,479.95 3,520.055,383.681-5322-00 3,000.00 -2,383.68 10,000.00-79.46 % 35.20 %Legal 100,000.0015,860.50 17,472.503,525.001-5381-00 8,333.00 4,808.00 33,333.0057.70 % 52.42 %Engineering 60,000.006,920.00 13,080.00480.001-5382-00 5,000.00 4,520.00 20,000.0090.40 % 65.40 %Financial Services 20,000.006,030.00 1,970.003,620.001-5383-00 3,000.00 -620.00 8,000.00-20.67 % 24.63 %Computer Services 163,600.0058,100.35 -6,100.3514,302.051-5384-00 13,000.00 -1,302.05 52,000.00-10.02 % -11.73 %Salaries/Wages-Administration 1,133,880.00293,891.21 54,995.7974,550.701-5410-00 87,222.00 12,671.30 348,887.0014.53 % 15.76 %Salaries & Wages - Field 1,400,532.00406,960.28 23,972.72102,919.661-5411-00 107,733.00 4,813.34 430,933.004.47 % 5.56 %Payroll Tax Expense 177,734.0051,332.57 3,355.4312,323.201-5420-00 13,672.00 1,348.80 54,688.009.87 % 6.14 %Employee Medical Insurance 444,246.00145,013.23 -2,857.2336,887.611-5435-00 35,539.00 -1,348.61 142,156.00-3.79 % -2.01 %Retiree Medical Insurance 50,659.0014,146.42 2,005.584,263.181-5436-00 4,038.00 -225.18 16,152.00-5.58 % 12.42 %Employees Retirement Plan 598,859.00181,255.51 18,364.4946,432.851-5440-00 49,905.00 3,472.15 199,620.006.96 % 9.20 %Supplemental Retirement 401a 35,000.000.00 0.000.001-5445-00 0.00 0.00 0.000.00 % 0.00 %Motor Vehicle Expense 60,000.0025,398.29 -5,398.299,362.331-5510-00 5,000.00 -4,362.33 20,000.00-87.25 % -26.99 %Office & Billing Expenses 261,600.0074,347.90 12,852.1012,690.091-5620-00 21,800.00 9,109.91 87,200.0041.79 % 14.74 %Meetings / Training / Seminars 26,000.0012,281.34 -3,615.345,731.331-5625-00 2,166.00 -3,565.33 8,666.00-164.60 % -41.72 %Insurance 129,000.0042,972.16 27.8411,160.921-5630-00 10,750.00 -410.92 43,000.00-3.82 % 0.06 %Membership, Dues, Subscript. 75,970.0019,018.40 15,981.60315.001-5687-00 23,000.00 22,685.00 35,000.0098.63 % 45.66 %Election Expenses 25,000.000.00 15,000.000.001-5688-00 5,000.00 5,000.00 15,000.00100.00 % 100.00 %Labor Relations 6,000.000.00 2,000.000.001-5689-00 500.00 500.00 2,000.00100.00 % 100.00 %San Mateo County Fees 20,000.004,189.38 -189.384,189.381-5700-00 4,000.00 -189.38 4,000.00-4.73 % -4.73 %State Fees 36,500.000.00 1,500.000.001-5705-00 1,500.00 1,500.00 1,500.00100.00 % 100.00 %
Total ExpType: 1 - Operating: 8,354,018.00-256,200.98764,714.00 -61,686.92 2,982,357.00826,400.92 3,238,557.98 -8.59 %-8.07 %
ExpType: 4 - Capital RelatedDebt Service/Existing Bonds 2006B 486,383.00-1,812.44 368,775.440.001-5712-00 0.00 0.00 366,963.000.00 % 100.49 %Debt Service/CIEDB 11-099 336,126.00264,523.92 0.080.001-5715-00 0.00 0.00 264,524.000.00 % 0.00 %Debt Service/CIEDB 2016 324,235.00231,497.84 0.160.001-5716-00 0.00 0.00 231,498.000.00 % 0.00 %Chase Bank - 2018 Loan 0.00318,974.12 -318,974.120.001-5717-00 0.00 0.00 0.000.00 % 0.00 %
Total ExpType: 4 - Capital Related: 1,146,744.0049,801.560.00 0.00 862,985.000.00 813,183.44 5.77 %0.00 %
Total Expense: 9,500,762.00-206,399.42764,714.00 -61,686.92 3,845,342.00826,400.92 4,051,741.42 -5.37 %-8.07 %
Report Total: 3,575,974.00-77,967.30551,757.00 -233,860.41 1,083,722.00317,896.59 1,005,754.70
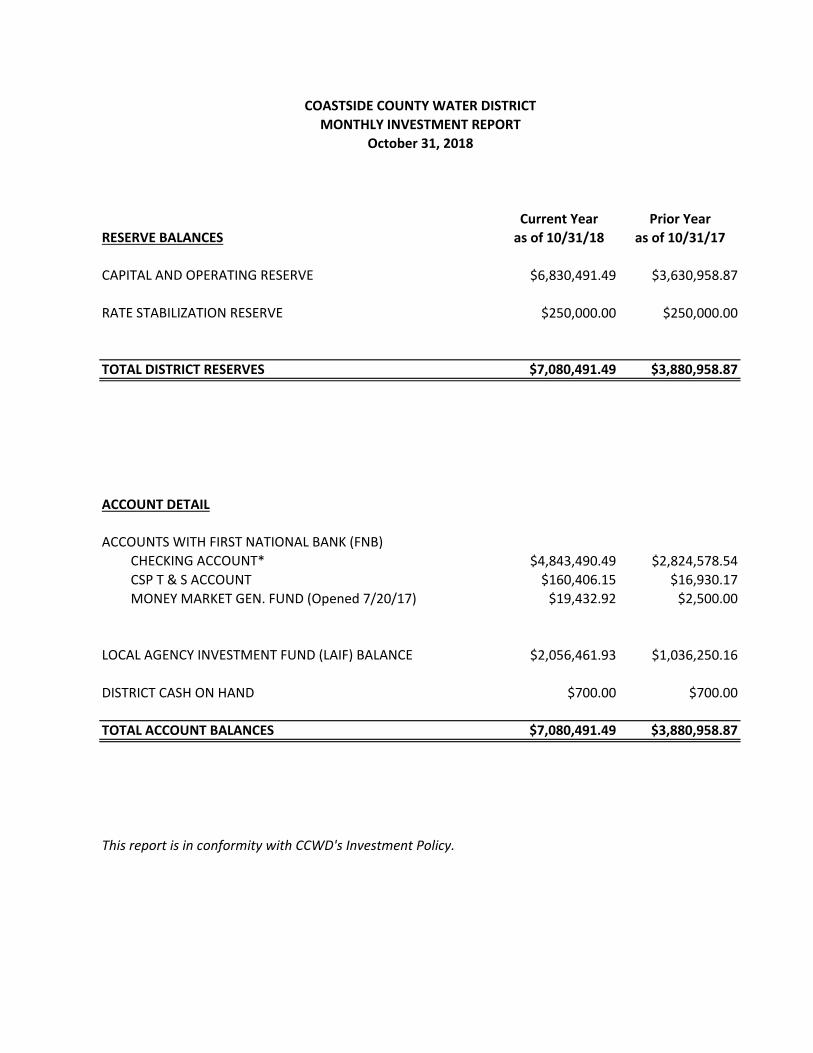
Current Year Prior Year
as of 10/31/18 as of 10/31/17
$6,830,491.49 $3,630,958.87
$250,000.00 $250,000.00
TOTAL DISTRICT RESERVES $7,080,491.49 $3,880,958.87
ACCOUNT DETAIL
$4,843,490.49 $2,824,578.54
CSP T & S ACCOUNT $160,406.15 $16,930.17
MONEY MARKET GEN. FUND (Opened 7/20/17) $19,432.92 $2,500.00
$2,056,461.93 $1,036,250.16
DISTRICT CASH ON HAND $700.00 $700.00
TOTAL ACCOUNT BALANCES $7,080,491.49 $3,880,958.87
This report is in conformity with CCWD's Investment Policy.
LOCAL AGENCY INVESTMENT FUND (LAIF) BALANCE
CHECKING ACCOUNT*
October 31, 2018
COASTSIDE COUNTY WATER DISTRICT
MONTHLY INVESTMENT REPORT
CAPITAL AND OPERATING RESERVE
RATE STABILIZATION RESERVE
RESERVE BALANCES
ACCOUNTS WITH FIRST NATIONAL BANK (FNB)

COASTSIDE COUNTY WATER DISTRICT10/31/2018
Approved Actual Projected % Project Status/CIP Budget To Date Year-End Variance Completed Comments
FY 18/19 FY 18/19 FY 18/19 vs. Budget
06‐03 SCADA/Telemetry/Electrical Controls Replacement $ 50,000 $ 50,000 $ - 0%99-02 Vehicle Replacement $ 100,000 $ 100,000 $ - 0% Vehicles approved at August 2018 Board meeting
08-08 PRV Valves Replacement Project $ 30,000 $ 3,701 $ 30,000 $ - 12%09-09 Fire Hydrant Replacement $ 140,000 $ 50,963 $ 140,000 $ - 36%16-07 Sample Station Replacement Project $ 30,000 $ 28,013 $ 30,000 $ - 93%17-15 Pilarcitos Canyon Emergency Road Repairs $ 100,000 $ 100,000 $ - 0%18-13 Denniston WTP and Tank Road Repairs and Paving $ 100,000 $ 100,000 $ - 0%99-01 Meter Change Program $ 20,000 $ 17,999 $ 20,000 $ - 90%
06-02 Highway 1 South Pipeline Replacement Project $ 750,000 $ 18,144 $ 750,000 $ - 2% work started in November 201807-04 Bell Moon Pipeline Replacement Project $ 60,000 $ 1,244 $ 60,000 $ - 2% in design13-02 Replace 8 Inch Pipeline Under Creek at Pilarcitos Ave $ 50,000 $ 50,000 $ - 0%14-01 Replace 12" Welded Steel Line on Hwy 92 with 8" $ 100,000 $ 100,000 $ - 0%14-27 Grandview 2 Inch Replacement $ 50,000 $ 2,381 $ 50,000 $ - 5% in design14-30 Replace Miscellaneous 2 Inch GS El Granada $ 60,000 $ 5,301 $ 60,000 $ - 9% in design/ready for bid
14-31Ferdinand Avenue - Replace 4" WS Ferdinand Ave. to Columbus $ 60,000 $ 60,000 $ - 0% in design
06-04 Hazen's Tank Removal $ 30,000 $ 30,000 $ - 0%08-14 Alves Tank Recoating & Refurshment $ 600,000 $ 742 $ 600,000 $ - 0%19-01 EG Tank #1 Recoating & Refurbishment $ 100,000 $ 5,671 $ 100,000 $ - 6%19-XX Miramar Tank - Chime $ 40,000 $ 40,000 $ - 0%18-05 Denniston Tank THM Residual Control $ 80,000 $ 80,000 $ - 0%18-06 CSP -- (3) Butterfly Valves $ 80,000 $ 7,319 $ 80,000 $ - 9%19-XX Tanks - THM Control $ 120,000 $ 120,000 $ - 0%
12-12 San Vicente Diversion and Pipeline $ 100,000 $ - $ 100,000 $ - 0%17-12 Recycled Water Project Development $ 100,000 $ - $ 100,000 $ - 0%
08-07 Nunes Filter Valve Replacement $ 500,000 $ 500,000 $ - 0%13-05 Denniston WTP Emergency Power $ 50,000 $ 50,000 $ - 0%
FY 18/19 TOTALS $ 3,500,000 $ 141,480 $ 3,500,000 $ -
FISCAL YEAR 2018/2019APPROVED CAPITAL IMPROVEMENT PROJECTS
Water Treatment Plants
Equipment Purchases & Replacement
Facilities & Maintenance
Pipeline Projects
Pump Stations / Tanks / Wells
Water Supply Development
1
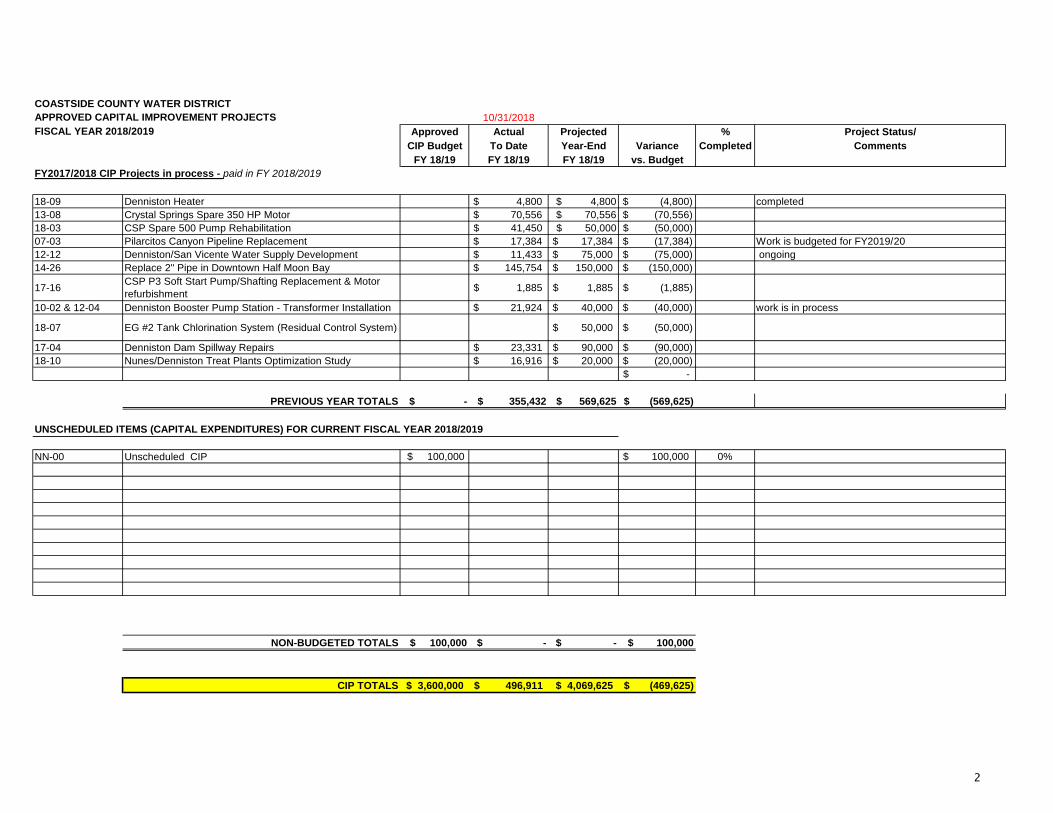
COASTSIDE COUNTY WATER DISTRICT10/31/2018
Approved Actual Projected % Project Status/CIP Budget To Date Year-End Variance Completed Comments
FY 18/19 FY 18/19 FY 18/19 vs. Budget
FISCAL YEAR 2018/2019APPROVED CAPITAL IMPROVEMENT PROJECTS
18-09 Denniston Heater $ 4,800 $ 4,800 $ (4,800) completed13-08 Crystal Springs Spare 350 HP Motor $ 70,556 $ 70,556 $ (70,556)18-03 CSP Spare 500 Pump Rehabilitation $ 41,450 $ 50,000 $ (50,000)07-03 Pilarcitos Canyon Pipeline Replacement $ 17,384 $ 17,384 $ (17,384) Work is budgeted for FY2019/2012-12 Denniston/San Vicente Water Supply Development $ 11,433 $ 75,000 $ (75,000) ongoing 14-26 Replace 2" Pipe in Downtown Half Moon Bay $ 145,754 $ 150,000 $ (150,000)
17-16 CSP P3 Soft Start Pump/Shafting Replacement & Motor refurbishment $ 1,885 $ 1,885 $ (1,885)
10-02 & 12-04 Denniston Booster Pump Station - Transformer Installation $ 21,924 $ 40,000 $ (40,000) work is in process
18-07 EG #2 Tank Chlorination System (Residual Control System) $ 50,000 $ (50,000)
17-04 Denniston Dam Spillway Repairs $ 23,331 $ 90,000 $ (90,000)18-10 Nunes/Denniston Treat Plants Optimization Study $ 16,916 $ 20,000 $ (20,000)
$ -
PREVIOUS YEAR TOTALS $ - $ 355,432 $ 569,625 $ (569,625)
NN-00 Unscheduled CIP $ 100,000 $ 100,000 0%
NON-BUDGETED TOTALS $ 100,000 $ - $ - $ 100,000
CIP TOTALS 3,600,000$ 496,911$ 4,069,625$ (469,625)$
FY2017/2018 CIP Projects in process - paid in FY 2018/2019
UNSCHEDULED ITEMS (CAPITAL EXPENDITURES) FOR CURRENT FISCAL YEAR 2018/2019
2
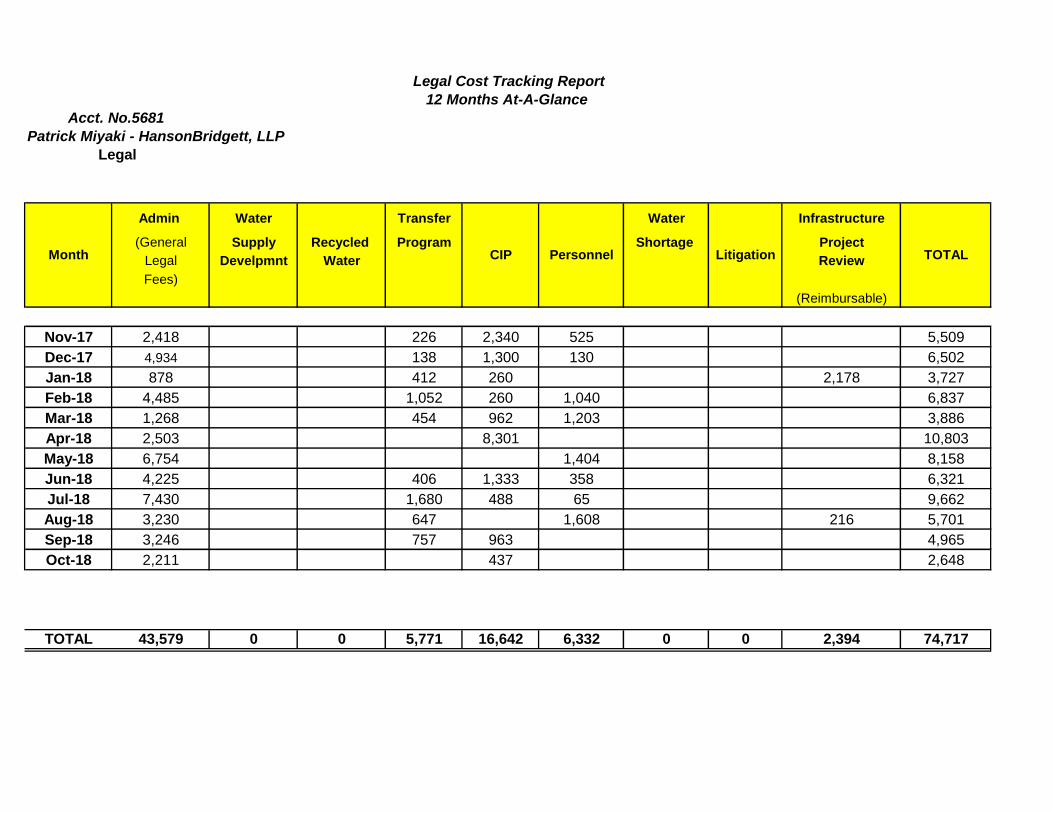
Patrick Miyaki - HansonBridgett, LLP
Admin Water Transfer Water Infrastructure
(General Supply Recycled Program Shortage ProjectLegal Develpmnt Water ReviewFees)
(Reimbursable)
Nov-17 2,418 226 2,340 525 5,509Dec-17 4,934 138 1,300 130 6,502Jan-18 878 412 260 2,178 3,727Feb-18 4,485 1,052 260 1,040 6,837Mar-18 1,268 454 962 1,203 3,886Apr-18 2,503 8,301 10,803May-18 6,754 1,404 8,158Jun-18 4,225 406 1,333 358 6,321Jul-18 7,430 1,680 488 65 9,662Aug-18 3,230 647 1,608 216 5,701Sep-18 3,246 757 963 4,965Oct-18 2,211 437 2,648
TOTAL 43,579 0 0 5,771 16,642 6,332 0 0 2,394 74,717
Legal
Acct. No.5681
Legal Cost Tracking Report
12 Months At-A-Glance
Month CIP Personnel Litigation TOTAL
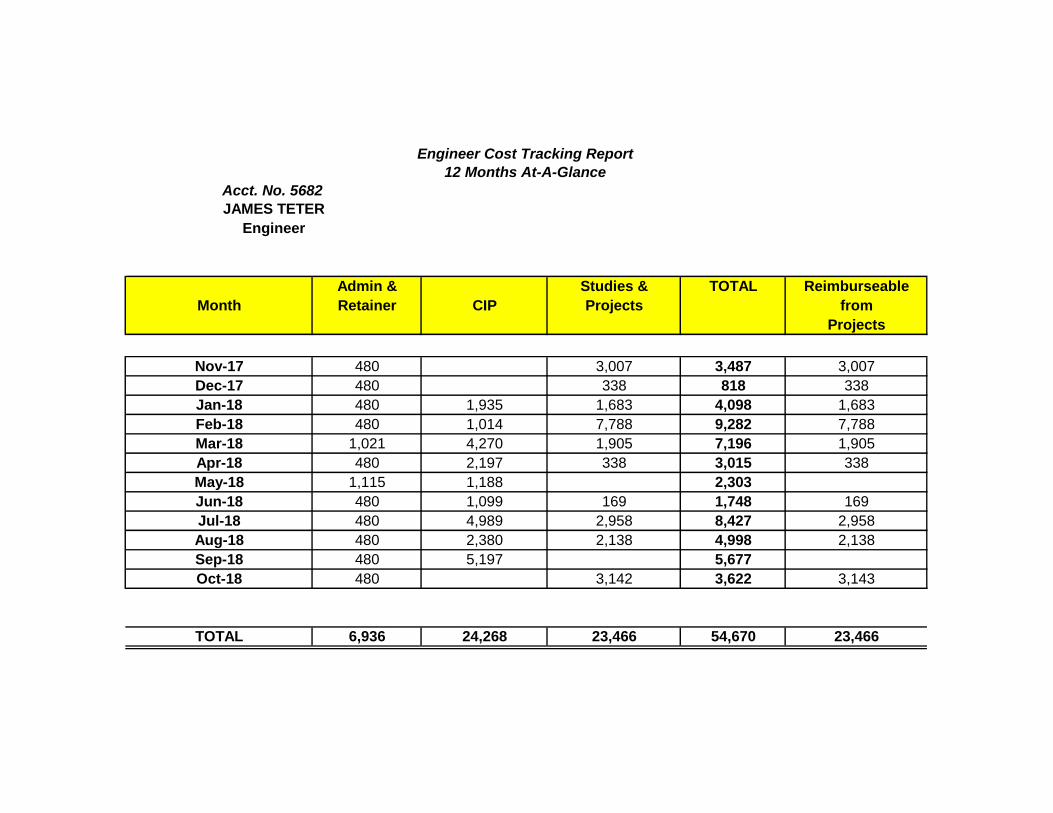
Admin & Studies & TOTAL ReimburseableMonth Retainer CIP Projects from
Projects
Nov-17 480 3,007 3,487 3,007Dec-17 480 338 818 338Jan-18 480 1,935 1,683 4,098 1,683Feb-18 480 1,014 7,788 9,282 7,788Mar-18 1,021 4,270 1,905 7,196 1,905Apr-18 480 2,197 338 3,015 338May-18 1,115 1,188 2,303Jun-18 480 1,099 169 1,748 169Jul-18 480 4,989 2,958 8,427 2,958Aug-18 480 2,380 2,138 4,998 2,138Sep-18 480 5,197 5,677Oct-18 480 3,142 3,622 3,143
TOTAL 6,936 24,268 23,466 54,670 23,466
Engineer
Acct. No. 5682
JAMES TETER
Engineer Cost Tracking Report
12 Months At-A-Glance
Project Project
Proposal Approved Project Actual BillingsProject No. Name Status Date Date Budget thru 6/30/18 FY2018-19Closed Projects:CAL-13-01 EG Tank 2 Recoating Project Closed 9/30/13 10/8/13 $8,220.00 8,837.50$
CAL-13-02 Nunes Control System Upgrades Closed 9/30/13 10/8/13 $46,141.00 55,363.60$
CAL-13-03 Win 911 and PLC Software Closed 9/30/13 10/8/13 $9,717.00 12,231.74$
CAL-13-04 Crystal Springs Surge Tank Retrofit Closed 11/26/13 11/27/13 $31,912.21 66,572.54$
CAL-13-06 Nunes Legacy Backwash System Removal Closed 11/25/13 11/26/13 $6,516.75 6,455.00$
CAL-13-07 Denniston Backwash FTW Valves Closed 11/26/13 11/27/13 $6,914.21 9,518.28$
CAL-14-01 Denniston Wash Water Return Retrofit Closed 1/28/14 2/14/14 $13,607.00 13,591.60$
CAL-14-02 Denniston Calrifier SCADA Data Closed 4/2/14 4/7/14 $4,125.00 4,077.50$
CAL-14-03 Nunes Surface Scatter Turbidimeter Closed 4/2/14 4/7/14 $2,009.50 -$
CAL-14-04 Phase I Control System Upgrade Closed 4/2/14 4/7/14 $75,905.56 44,459.14$
CAL-14-06 Miramar Control Panel Closed 8/28/14 8/28/14 $37,953.00 27,980.71$
CAL-14-08 SFWater Flow & Data Logger/Cahill Tank Closed 8/20/2014 8/20/2014 $1,370.00 1,372.00$
CAL-15-01 Main Street Monitors Closed 6,779.42$
CAL-15-02 Dennistion To Do List Closed 2,930.00$
CAL-15-03 Nunes & Denniston Turbidity Meters Closed $6,612.50 12,536.12$
CAL-15-04 Phase II Control System Upgrade Closed 6/23/2015 8/11/2015 $195,000.00 202,227.50$
CAL-15-05 Permanganate Water Flow Closed 1,567.15$
CAL-16-04 Radio Network Closed 12/9/2016 1/10/2017 $126,246.11 139,200.68$
CAL-16-05 El Granada Tank No. 3 Recoating Closed 12/16/2016 $6,904.50 6,845.00$
CAL-17-03 Nunes Valve Control Closed 6/29/2017 7/11/2017 $73,281.80 79,034.35$
CAL-17-04 Denniston Booster Pump Station Closed 7/27/2017 8/8/2017 $21,643.75 29,760.00$
CAL-17-05 Crystal Springs Pump Station #3 Soft Start Closed 7/27/2017 8/8/2017 $12,213.53 12,178.13$
CAL-18-04 Tank Levels Calibration Special Closed 3/5/2018 3/5/2018 $8,388.75 10,700.00$
CAL-18-05 Pilarcitos Stream Flow Gauge -Well 1 120 Service Power Closed 3/22/2018 3/22/2018 $3,558.13 3,997.40$
CAL-17-06 Nunes Flocculartor & Rapid Mix VFD Panels Closed 12/6/2017 12/12/2017 $29,250.75 30,695.66$
Closed Projects - Subtotal (pre FY2018-19) $727,491.05 788,911.02$
Open Projects:CAL-17-01 Crystal Springs Leak Valve Control 2/8/2017 2/14/2017 $8,701.29 18,055.88$
CAL-17-02 Crystal Springs Requirements & Addtl Controls 2/8/2017 2/14/2017 $38,839.50 41,172.06$
CAL-18-03 CSP Breakers & Handles 3/7/2018 3/7/2018 $25,471.47 29,167.79$
Open Projects - Subtotal $73,012.26 $88,395.73 $0.00
Other: MaintenanceTanksCrystal Springs Maintenance 489.39$
Nunes MaintenanceDenniston Maintenance 5,455.00$
Distribution System 14,056.78$
TOTAL FY 2018/19 $20,001.17
Calcon T&M Projects Tracking10/31/2018
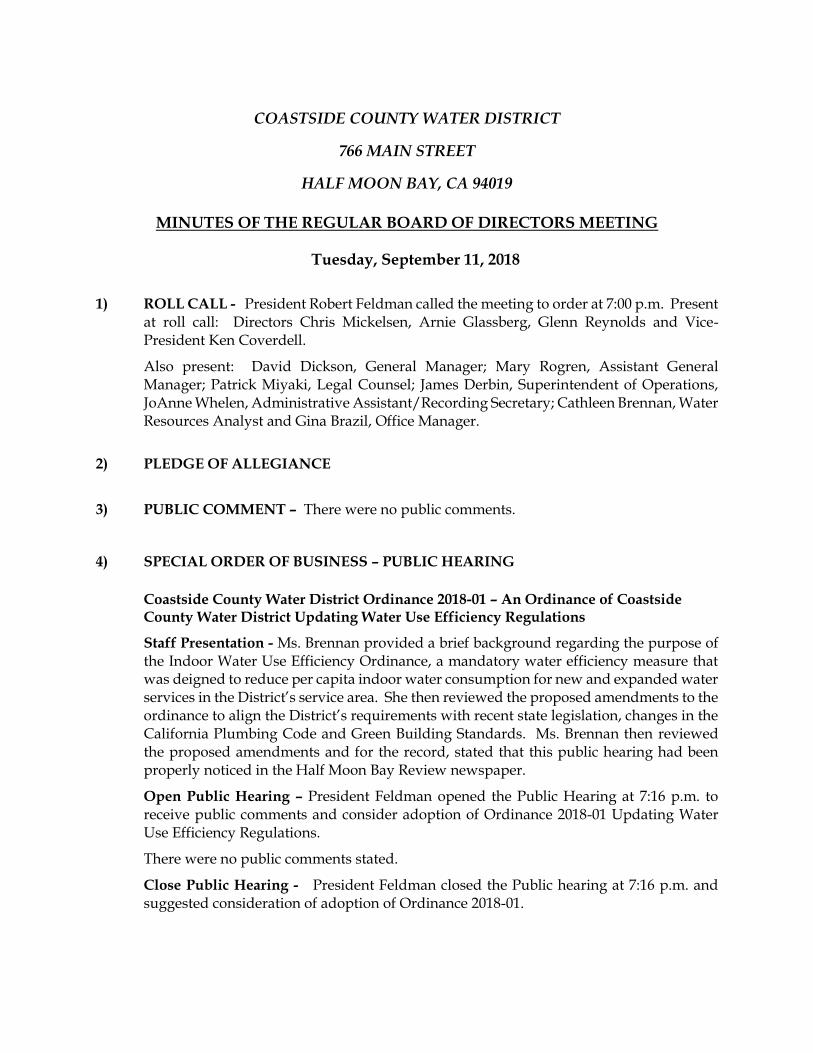
COASTSIDE COUNTY WATER DISTRICT
766 MAIN STREET
HALF MOON BAY, CA 94019
MINUTES OF THE REGULAR BOARD OF DIRECTORS MEETING
Tuesday, September 11, 2018
1) ROLL CALL - President Robert Feldman called the meeting to order at 7:00 p.m. Present at roll call: Directors Chris Mickelsen, Arnie Glassberg, Glenn Reynolds and Vice-President Ken Coverdell.
Also present: David Dickson, General Manager; Mary Rogren, Assistant General Manager; Patrick Miyaki, Legal Counsel; James Derbin, Superintendent of Operations, JoAnne Whelen, Administrative Assistant/Recording Secretary; Cathleen Brennan, Water Resources Analyst and Gina Brazil, Office Manager.
2) PLEDGE OF ALLEGIANCE
3) PUBLIC COMMENT – There were no public comments.
4) SPECIAL ORDER OF BUSINESS – PUBLIC HEARING
Coastside County Water District Ordinance 2018-01 – An Ordinance of Coastside County Water District Updating Water Use Efficiency Regulations
Staff Presentation - Ms. Brennan provided a brief background regarding the purpose of the Indoor Water Use Efficiency Ordinance, a mandatory water efficiency measure that was deigned to reduce per capita indoor water consumption for new and expanded water services in the District’s service area. She then reviewed the proposed amendments to the ordinance to align the District’s requirements with recent state legislation, changes in the California Plumbing Code and Green Building Standards. Ms. Brennan then reviewed the proposed amendments and for the record, stated that this public hearing had been properly noticed in the Half Moon Bay Review newspaper.
Open Public Hearing – President Feldman opened the Public Hearing at 7:16 p.m. to receive public comments and consider adoption of Ordinance 2018-01 Updating Water Use Efficiency Regulations.
There were no public comments stated.
Close Public Hearing - President Feldman closed the Public hearing at 7:16 p.m. and suggested consideration of adoption of Ordinance 2018-01.

ON MOTION BY Vice-President Coverdell and seconded by Director Reynolds, the Board voted by roll call vote to adopt Ordinance 2018-01 Updating Water Use Efficiency Regulations:
Vice-President Coverdell Aye Director Glassberg Aye
Director Mickelsen Aye Director Reynolds Aye President Feldman Aye
5) CONSENT CALENDAR
A. Approval of disbursements for the month ending August 31, 2018: Claims: $903,874.25; Payroll: $98,198.03 for a total of $1,002,072.28
B. Acceptance of Financial Reports C. Approval of Minutes of August 14, 2018 Regular Board of Directors Meeting D. Monthly Water Service Connection Transfer Report E. Installed Water Connection Capacity and Water Meters Report F. Total CCWD Production Reports G. CCWD Monthly Sales by Category Report –August 2018 H. Monthly Planned Plant or Tank Discharge and New Water Line Flushing Report I. Monthly Rainfall Reports Director Reynolds reported that he had reviewed the monthly financial claims and found all to be in order. President Feldman suggested that the District’s Facilities Committee members meet soon to discuss the progress of the District’s Capital Improvement Program. Vice-President Coverdell suggested that the District’s budget be reviewed further in terms of the amount initially budgeted for water purchased.
ON MOTION BY Director Glassberg and seconded by Director Reynolds, the Board voted by roll call vote to approve the Consent Calendar in its entirety:
Vice-President Coverdell Aye Director Glassberg Aye
Director Mickelsen Aye Director Reynolds Aye President Feldman Aye 6) MEETINGS ATTENDED / DIRECTOR COMMENTS
Director Mickelsen provided a brief report on a recent meeting with the San Francisco
Public Utilities Commission (SFPUC) that he had attended as a representative of the Bay
Area Water Supply and Conservation Agency (BAWSCA) and spoke to urge SFPUC to
seek a negotiated settlement with the State Water Resources Control Board over the Bay
Delta Plan.
7) GENERAL BUSINESS
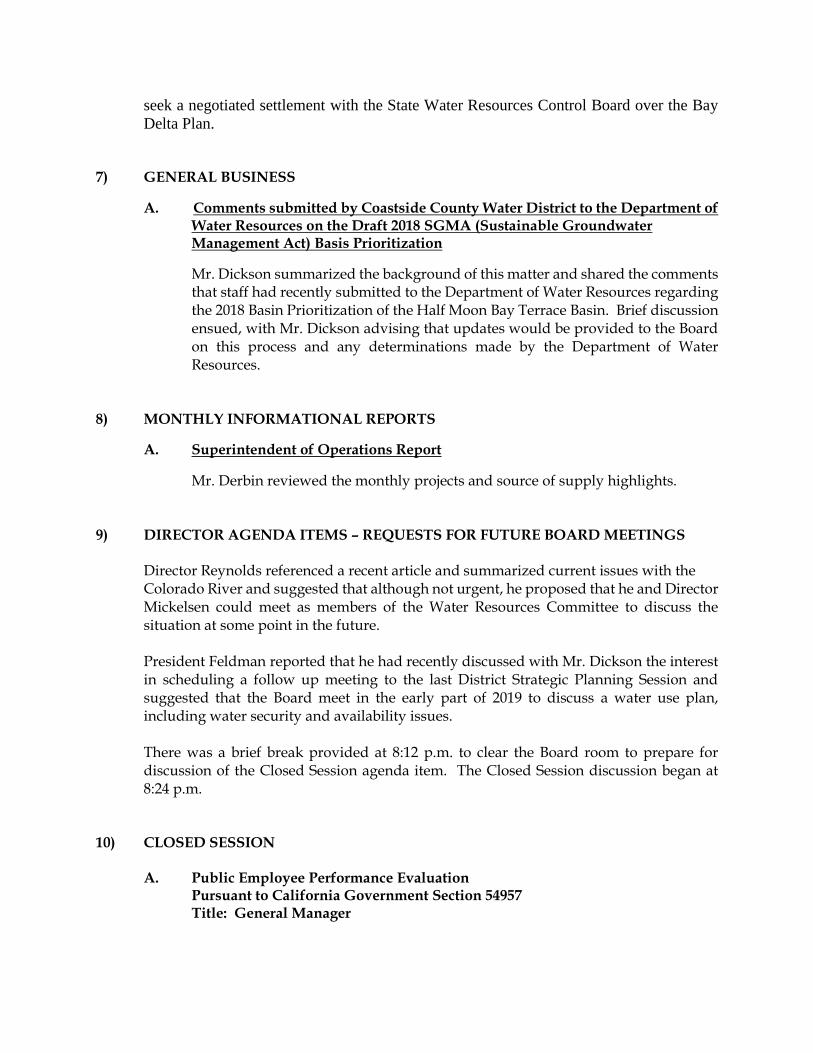
A. Comments submitted by Coastside County Water District to the Department of Water Resources on the Draft 2018 SGMA (Sustainable Groundwater Management Act) Basis Prioritization
Mr. Dickson summarized the background of this matter and shared the comments that staff had recently submitted to the Department of Water Resources regarding the 2018 Basin Prioritization of the Half Moon Bay Terrace Basin. Brief discussion ensued, with Mr. Dickson advising that updates would be provided to the Board on this process and any determinations made by the Department of Water Resources.
8) MONTHLY INFORMATIONAL REPORTS
A. Superintendent of Operations Report
Mr. Derbin reviewed the monthly projects and source of supply highlights. 9) DIRECTOR AGENDA ITEMS – REQUESTS FOR FUTURE BOARD MEETINGS Director Reynolds referenced a recent article and summarized current issues with the
Colorado River and suggested that although not urgent, he proposed that he and Director Mickelsen could meet as members of the Water Resources Committee to discuss the situation at some point in the future. President Feldman reported that he had recently discussed with Mr. Dickson the interest in scheduling a follow up meeting to the last District Strategic Planning Session and suggested that the Board meet in the early part of 2019 to discuss a water use plan, including water security and availability issues. There was a brief break provided at 8:12 p.m. to clear the Board room to prepare for discussion of the Closed Session agenda item. The Closed Session discussion began at 8:24 p.m.
10) CLOSED SESSION
A. Public Employee Performance Evaluation Pursuant to California Government Section 54957 Title: General Manager
11) RECONVENE TO OPEN SESSION – The meeting reconvened to open session at 8:33p.m. with David Dickson reporting that no action was taken in the closed session.
12) ADJOURNMENT – The meeting was adjourned at 8:33 p.m.
Respectfully submitted, ________________________________ David R. Dickson, General Manager
Secretary to the District
_____________________________ Robert C. Feldman, President
Board of Directors

Installed Water Meters July Aug Sept Oct Nov Dec Jan Feb Mar Apr May Jun TotalHMB Non-Priority0.5" capacity increase5/8" meter 1 23/4" meter 11" meter1 1/2" meter2" meter3" meterHMB Priority0.5" capacity increase5/8" meter3/4" meter1" meter1 1/2" meter2" meterCounty Non-Priority0.5" capacity increase5/8" meter 23/4" meter1" meterCounty Priority5/8" meter3/4" meter1" meterTotals 0 2 4
5/8" meter = 1 connection3/4" meter = 1.5 connections1" meter = 2.5 connections1.5" meter = 5 connections2" meter = 8 connections 3" meter= 17.5 connections
FY 2019 Capacity (5/8" connection equivalents) July Aug Sept Oct Nov Dec Jan Feb Mar Apr May Jun Totals
HMB Non-Priority 2.5 2HMB PriorityCounty Non-Priority 2County PriorityTotal 0 2.5 4
COASTSIDE COUNTY WATER DISTRICTInstalled Water Connection Capacity & Water Meters
FY 18/19 Meters
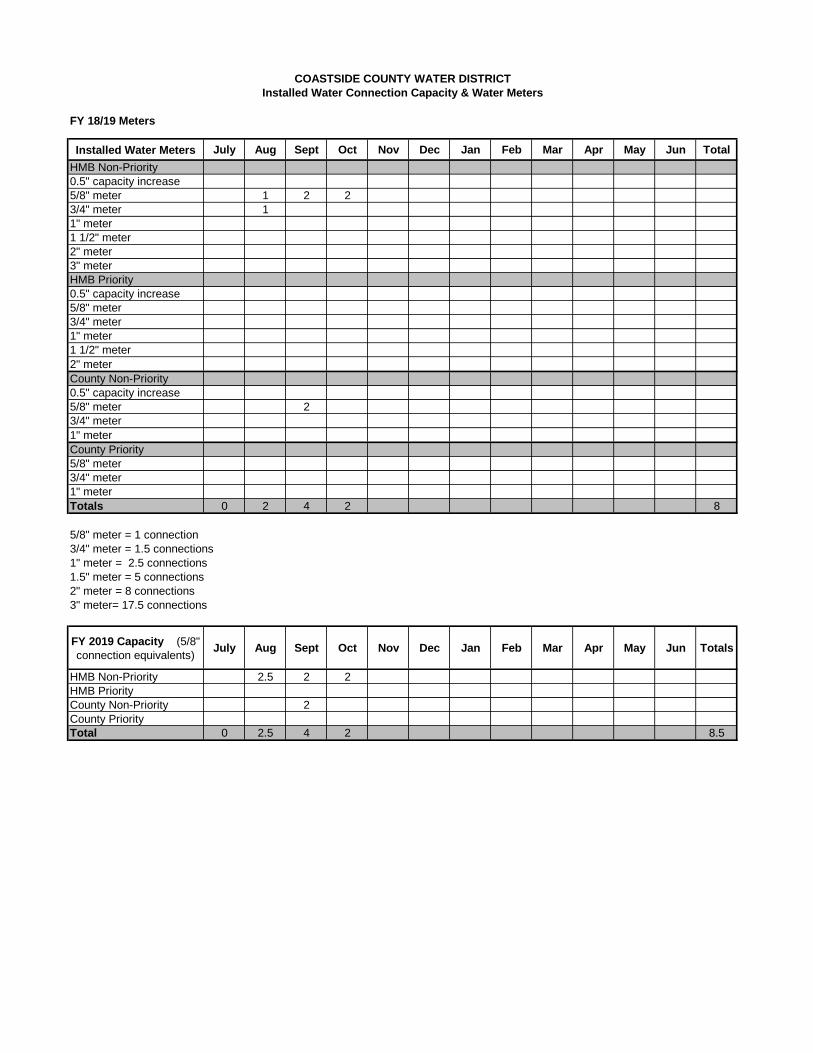
Installed Water Meters July Aug Sept Oct Nov Dec Jan Feb Mar Apr May Jun TotalHMB Non-Priority0.5" capacity increase5/8" meter 1 2 23/4" meter 11" meter1 1/2" meter2" meter3" meterHMB Priority0.5" capacity increase5/8" meter3/4" meter1" meter1 1/2" meter2" meterCounty Non-Priority0.5" capacity increase5/8" meter 23/4" meter1" meterCounty Priority5/8" meter3/4" meter1" meterTotals 0 2 4 2 8
5/8" meter = 1 connection3/4" meter = 1.5 connections1" meter = 2.5 connections1.5" meter = 5 connections2" meter = 8 connections 3" meter= 17.5 connections
FY 2019 Capacity (5/8" connection equivalents) July Aug Sept Oct Nov Dec Jan Feb Mar Apr May Jun Totals
HMB Non-Priority 2.5 2 2HMB PriorityCounty Non-Priority 2County PriorityTotal 0 2.5 4 2 8.5
COASTSIDE COUNTY WATER DISTRICTInstalled Water Connection Capacity & Water Meters
FY 18/19 Meters
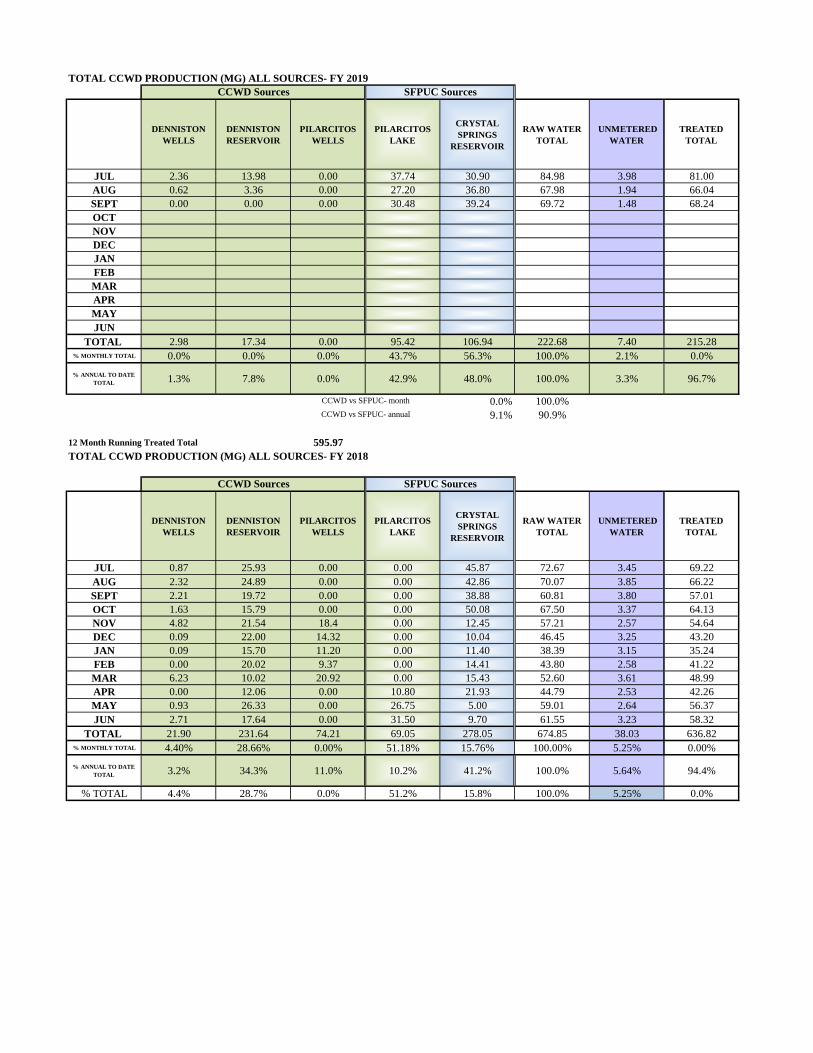
TOTAL CCWD PRODUCTION (MG) ALL SOURCES- FY 2019
DENNISTON WELLS
DENNISTON RESERVOIR
PILARCITOS WELLS
PILARCITOS LAKE
CRYSTAL SPRINGS
RESERVOIR
RAW WATER TOTAL
UNMETERED WATER
TREATED TOTAL
JUL 2.36 13.98 0.00 37.74 30.90 84.98 3.98 81.00AUG 0.62 3.36 0.00 27.20 36.80 67.98 1.94 66.04SEPT 0.00 0.00 0.00 30.48 39.24 69.72 1.48 68.24OCTNOVDECJANFEBMARAPRMAYJUN
TOTAL 2.98 17.34 0.00 95.42 106.94 222.68 7.40 215.28% MONTHLY TOTAL 0.0% 0.0% 0.0% 43.7% 56.3% 100.0% 2.1% 0.0%% ANNUAL TO DATE
TOTAL 1.3% 7.8% 0.0% 42.9% 48.0% 100.0% 3.3% 96.7%
0.0% 100.0%9.1% 90.9%
12 Month Running Treated Total 595.97TOTAL CCWD PRODUCTION (MG) ALL SOURCES- FY 2018
DENNISTON WELLS
DENNISTON RESERVOIR
PILARCITOS WELLS
PILARCITOS LAKE
CRYSTAL SPRINGS
RESERVOIR
RAW WATER TOTAL
UNMETERED WATER
TREATED TOTAL
JUL 0.87 25.93 0.00 0.00 45.87 72.67 3.45 69.22AUG 2.32 24.89 0.00 0.00 42.86 70.07 3.85 66.22SEPT 2.21 19.72 0.00 0.00 38.88 60.81 3.80 57.01OCT 1.63 15.79 0.00 0.00 50.08 67.50 3.37 64.13NOV 4.82 21.54 18.4 0.00 12.45 57.21 2.57 54.64DEC 0.09 22.00 14.32 0.00 10.04 46.45 3.25 43.20JAN 0.09 15.70 11.20 0.00 11.40 38.39 3.15 35.24FEB 0.00 20.02 9.37 0.00 14.41 43.80 2.58 41.22MAR 6.23 10.02 20.92 0.00 15.43 52.60 3.61 48.99APR 0.00 12.06 0.00 10.80 21.93 44.79 2.53 42.26MAY 0.93 26.33 0.00 26.75 5.00 59.01 2.64 56.37JUN 2.71 17.64 0.00 31.50 9.70 61.55 3.23 58.32
TOTAL 21.90 231.64 74.21 69.05 278.05 674.85 38.03 636.82% MONTHLY TOTAL 4.40% 28.66% 0.00% 51.18% 15.76% 100.00% 5.25% 0.00%% ANNUAL TO DATE
TOTAL 3.2% 34.3% 11.0% 10.2% 41.2% 100.0% 5.64% 94.4%
% TOTAL 4.4% 28.7% 0.0% 51.2% 15.8% 100.0% 5.25% 0.0%
CCWD Sources SFPUC Sources
CCWD vs SFPUC- month
CCWD vs SFPUC- annual
CCWD Sources SFPUC Sources
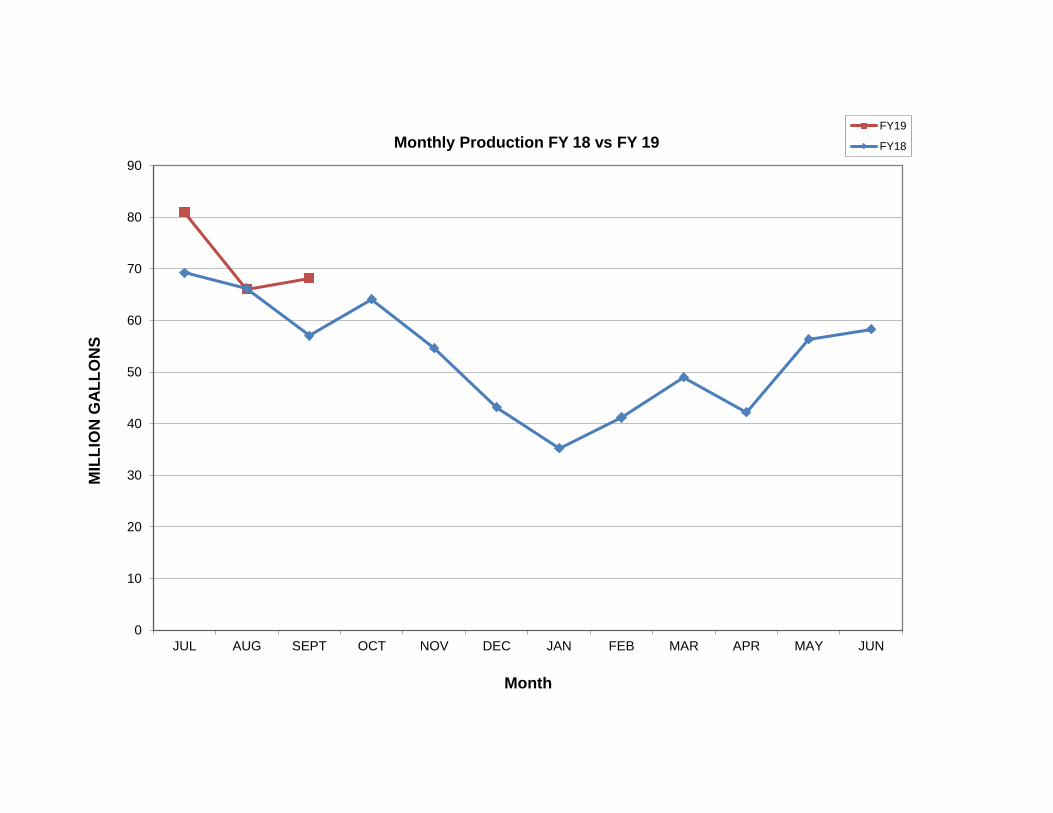
0
10
20
30
40
50
60
70
80
90
JUL AUG SEPT OCT NOV DEC JAN FEB MAR APR MAY JUN
MIL
LIO
N G
ALLO
NS
Month
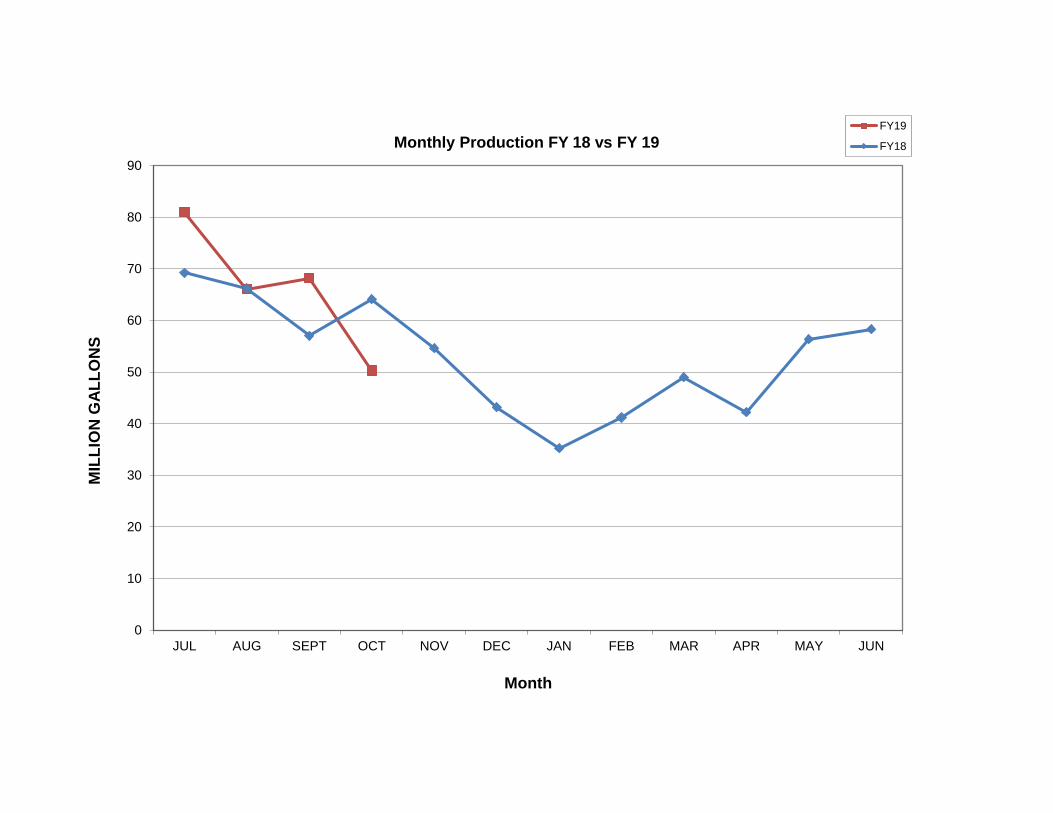
Monthly Production FY 18 vs FY 19FY19
FY18
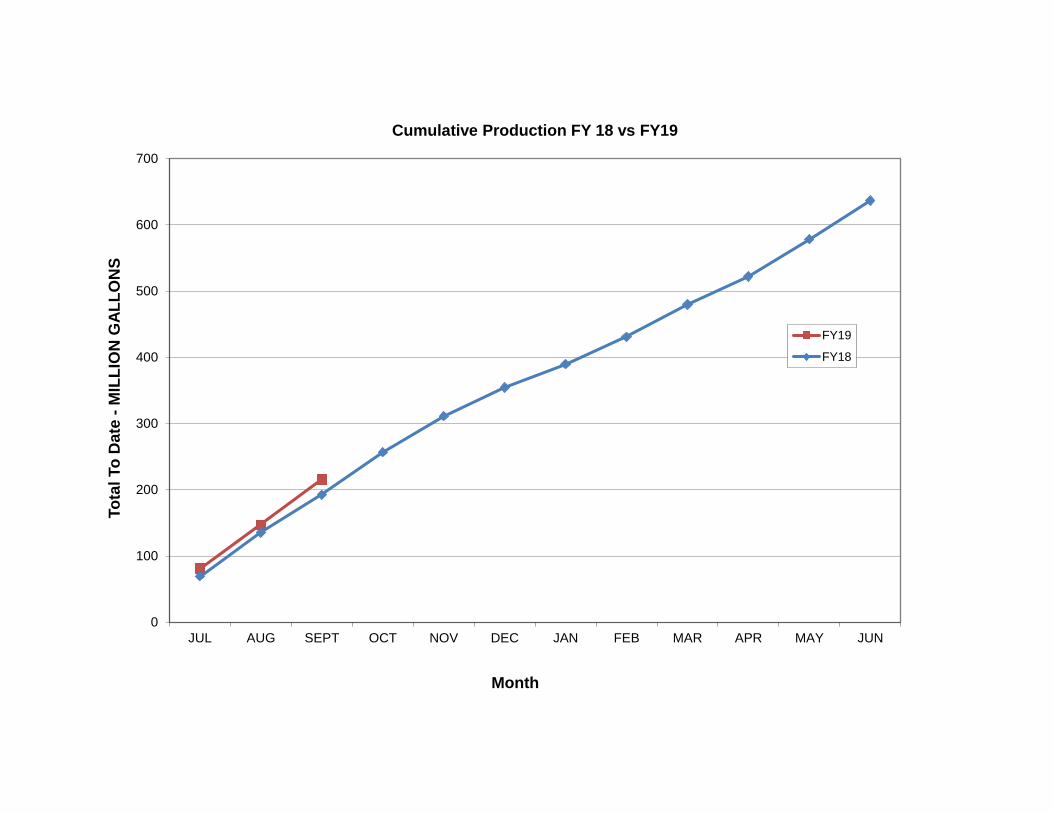
0
100
200
300
400
500
600
700
JUL AUG SEPT OCT NOV DEC JAN FEB MAR APR MAY JUN
Tota
l To
Dat
e -M
ILLI
ON
GAL
LON
S
Month
Cumulative Production FY 18 vs FY19
FY19
FY18
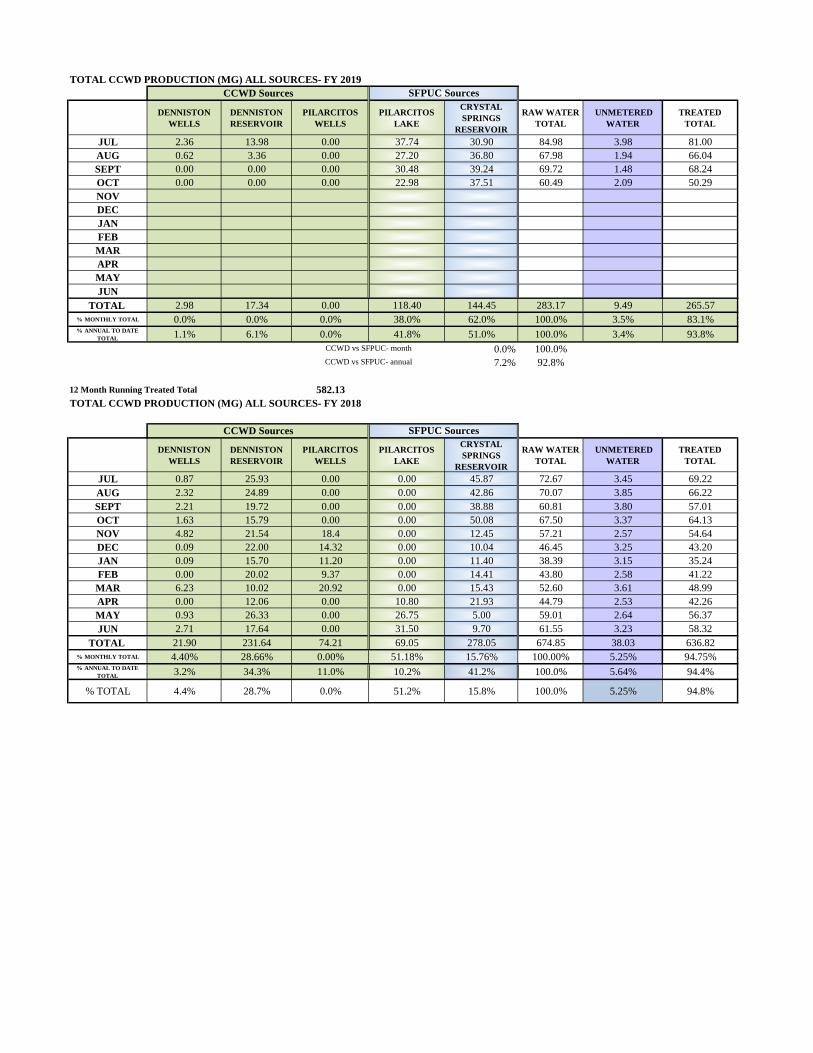
TOTAL CCWD PRODUCTION (MG) ALL SOURCES- FY 2019
DENNISTON
WELLS
DENNISTON
RESERVOIR
PILARCITOS
WELLS
PILARCITOS
LAKE
CRYSTAL
SPRINGS
RESERVOIR
RAW WATER
TOTAL
UNMETERED
WATER
TREATED
TOTAL
JUL 2.36 13.98 0.00 37.74 30.90 84.98 3.98 81.00
AUG 0.62 3.36 0.00 27.20 36.80 67.98 1.94 66.04
SEPT 0.00 0.00 0.00 30.48 39.24 69.72 1.48 68.24
OCT 0.00 0.00 0.00 22.98 37.51 60.49 2.09 50.29
NOV
DEC
JAN
FEB
MAR
APR
MAY
JUN
TOTAL 2.98 17.34 0.00 118.40 144.45 283.17 9.49 265.57
% MONTHLY TOTAL 0.0% 0.0% 0.0% 38.0% 62.0% 100.0% 3.5% 83.1%% ANNUAL TO DATE
TOTAL1.1% 6.1% 0.0% 41.8% 51.0% 100.0% 3.4% 93.8%
0.0% 100.0%
7.2% 92.8%
12 Month Running Treated Total 582.13
TOTAL CCWD PRODUCTION (MG) ALL SOURCES- FY 2018
DENNISTON
WELLS
DENNISTON
RESERVOIR
PILARCITOS
WELLS
PILARCITOS
LAKE
CRYSTAL
SPRINGS
RESERVOIR
RAW WATER
TOTAL
UNMETERED
WATER
TREATED
TOTAL
JUL 0.87 25.93 0.00 0.00 45.87 72.67 3.45 69.22
AUG 2.32 24.89 0.00 0.00 42.86 70.07 3.85 66.22
SEPT 2.21 19.72 0.00 0.00 38.88 60.81 3.80 57.01
OCT 1.63 15.79 0.00 0.00 50.08 67.50 3.37 64.13
NOV 4.82 21.54 18.4 0.00 12.45 57.21 2.57 54.64
DEC 0.09 22.00 14.32 0.00 10.04 46.45 3.25 43.20
JAN 0.09 15.70 11.20 0.00 11.40 38.39 3.15 35.24
FEB 0.00 20.02 9.37 0.00 14.41 43.80 2.58 41.22
MAR 6.23 10.02 20.92 0.00 15.43 52.60 3.61 48.99
APR 0.00 12.06 0.00 10.80 21.93 44.79 2.53 42.26
MAY 0.93 26.33 0.00 26.75 5.00 59.01 2.64 56.37
JUN 2.71 17.64 0.00 31.50 9.70 61.55 3.23 58.32
TOTAL 21.90 231.64 74.21 69.05 278.05 674.85 38.03 636.82
% MONTHLY TOTAL 4.40% 28.66% 0.00% 51.18% 15.76% 100.00% 5.25% 94.75%% ANNUAL TO DATE
TOTAL3.2% 34.3% 11.0% 10.2% 41.2% 100.0% 5.64% 94.4%
% TOTAL 4.4% 28.7% 0.0% 51.2% 15.8% 100.0% 5.25% 94.8%
SFPUC Sources
CCWD vs SFPUC- month
CCWD vs SFPUC- annual
SFPUC Sources
CCWD Sources
CCWD Sources
0
10
20
30
40
50
60
70
80
90
JUL AUG SEPT OCT NOV DEC JAN FEB MAR APR MAY JUN
MIL
LIO
N G
ALLO
NS
Month
Monthly Production FY 18 vs FY 19FY19
FY18

0
100
200
300
400
500
600
700
JUL AUG SEPT OCT NOV DEC JAN FEB MAR APR MAY JUN
Tota
l To
Dat
e -M
ILLI
ON
GAL
LON
S
Month
Cumulative Production FY 18 vs FY19
FY19
FY18
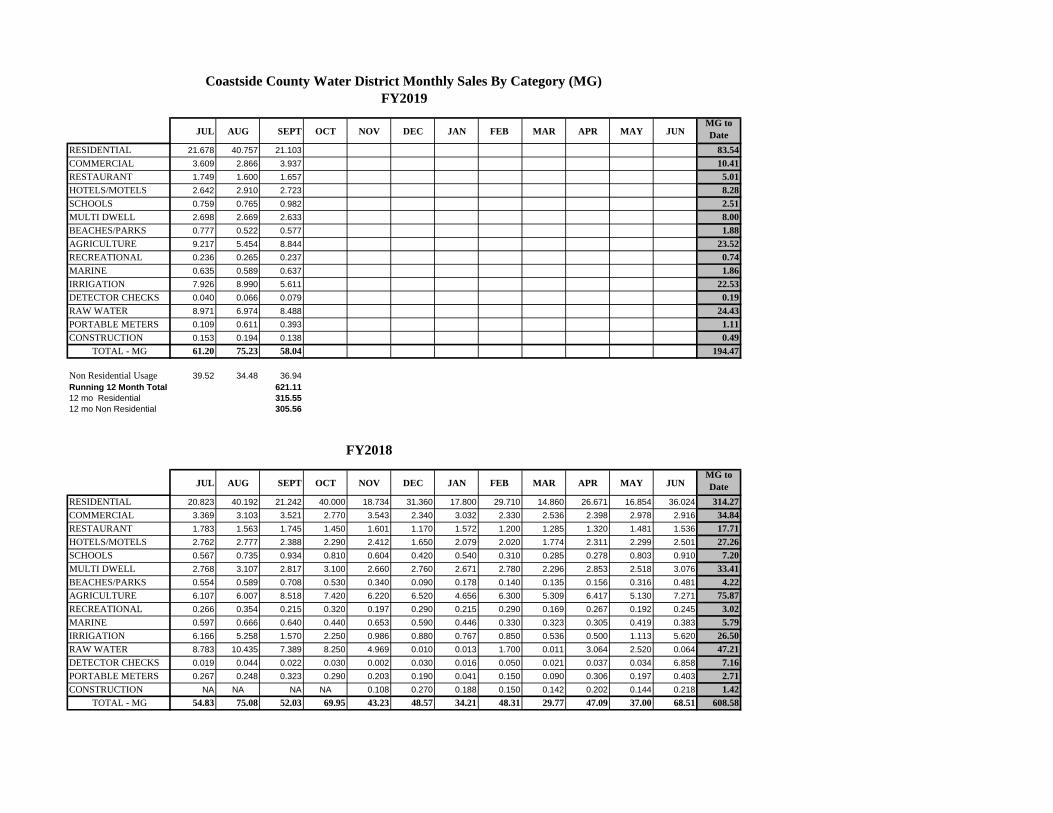
JUL AUG SEPT OCT NOV DEC JAN FEB MAR APR MAY JUNMG to Date
RESIDENTIAL 21.678 40.757 21.103 83.54COMMERCIAL 3.609 2.866 3.937 10.41RESTAURANT 1.749 1.600 1.657 5.01HOTELS/MOTELS 2.642 2.910 2.723 8.28SCHOOLS 0.759 0.765 0.982 2.51MULTI DWELL 2.698 2.669 2.633 8.00BEACHES/PARKS 0.777 0.522 0.577 1.88AGRICULTURE 9.217 5.454 8.844 23.52RECREATIONAL 0.236 0.265 0.237 0.74MARINE 0.635 0.589 0.637 1.86IRRIGATION 7.926 8.990 5.611 22.53DETECTOR CHECKS 0.040 0.066 0.079 0.19RAW WATER 8.971 6.974 8.488 24.43PORTABLE METERS 0.109 0.611 0.393 1.11CONSTRUCTION 0.153 0.194 0.138 0.49
TOTAL - MG 61.20 75.23 58.04 194.47
Non Residential Usage 39.52 34.48 36.94Running 12 Month Total 621.11 12 mo Residential 315.55 12 mo Non Residential 305.56
FY2018
JUL AUG SEPT OCT NOV DEC JAN FEB MAR APR MAY JUNMG to Date
RESIDENTIAL 20.823 40.192 21.242 40.000 18.734 31.360 17.800 29.710 14.860 26.671 16.854 36.024 314.27COMMERCIAL 3.369 3.103 3.521 2.770 3.543 2.340 3.032 2.330 2.536 2.398 2.978 2.916 34.84RESTAURANT 1.783 1.563 1.745 1.450 1.601 1.170 1.572 1.200 1.285 1.320 1.481 1.536 17.71HOTELS/MOTELS 2.762 2.777 2.388 2.290 2.412 1.650 2.079 2.020 1.774 2.311 2.299 2.501 27.26SCHOOLS 0.567 0.735 0.934 0.810 0.604 0.420 0.540 0.310 0.285 0.278 0.803 0.910 7.20MULTI DWELL 2.768 3.107 2.817 3.100 2.660 2.760 2.671 2.780 2.296 2.853 2.518 3.076 33.41BEACHES/PARKS 0.554 0.589 0.708 0.530 0.340 0.090 0.178 0.140 0.135 0.156 0.316 0.481 4.22AGRICULTURE 6.107 6.007 8.518 7.420 6.220 6.520 4.656 6.300 5.309 6.417 5.130 7.271 75.87RECREATIONAL 0.266 0.354 0.215 0.320 0.197 0.290 0.215 0.290 0.169 0.267 0.192 0.245 3.02MARINE 0.597 0.666 0.640 0.440 0.653 0.590 0.446 0.330 0.323 0.305 0.419 0.383 5.79IRRIGATION 6.166 5.258 1.570 2.250 0.986 0.880 0.767 0.850 0.536 0.500 1.113 5.620 26.50RAW WATER 8.783 10.435 7.389 8.250 4.969 0.010 0.013 1.700 0.011 3.064 2.520 0.064 47.21DETECTOR CHECKS 0.019 0.044 0.022 0.030 0.002 0.030 0.016 0.050 0.021 0.037 0.034 6.858 7.16PORTABLE METERS 0.267 0.248 0.323 0.290 0.203 0.190 0.041 0.150 0.090 0.306 0.197 0.403 2.71CONSTRUCTION NA NA NA NA 0.108 0.270 0.188 0.150 0.142 0.202 0.144 0.218 1.42
TOTAL - MG 54.83 75.08 52.03 69.95 43.23 48.57 34.21 48.31 29.77 47.09 37.00 68.51 608.58
Coastside County Water District Monthly Sales By Category (MG)FY2019
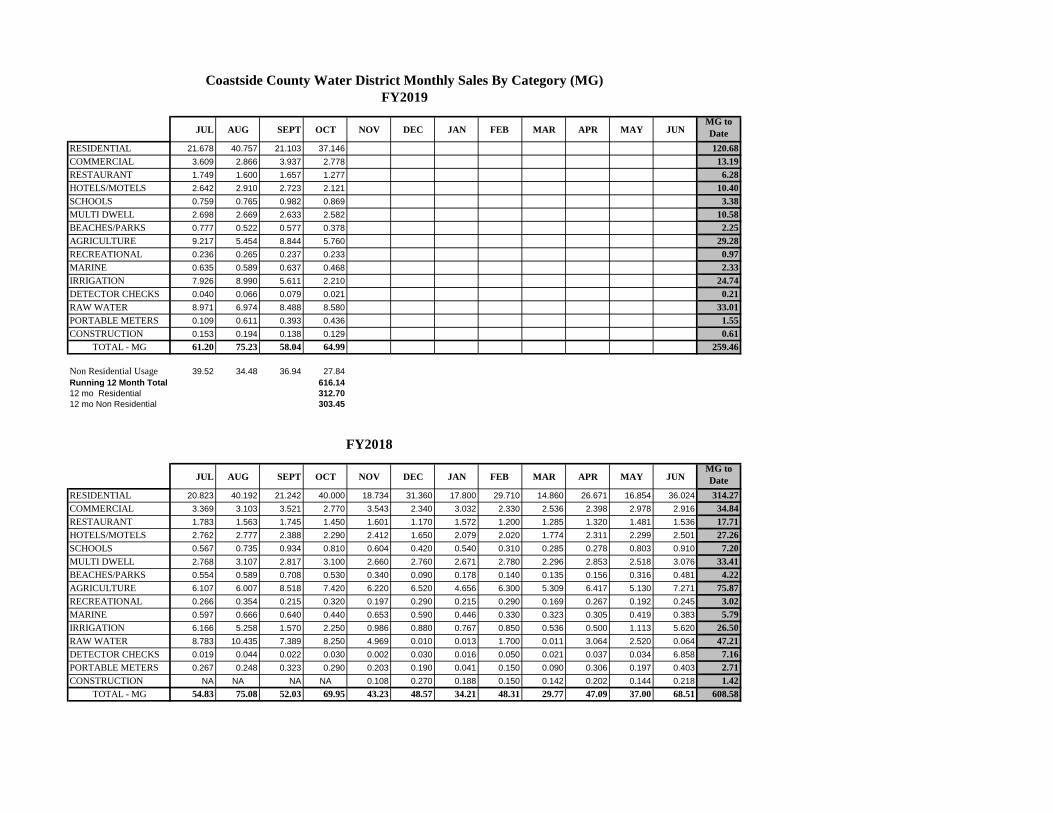
JUL AUG SEPT OCT NOV DEC JAN FEB MAR APR MAY JUNMG to
Date
RESIDENTIAL 21.678 40.757 21.103 37.146 120.68
COMMERCIAL 3.609 2.866 3.937 2.778 13.19
RESTAURANT 1.749 1.600 1.657 1.277 6.28
HOTELS/MOTELS 2.642 2.910 2.723 2.121 10.40
SCHOOLS 0.759 0.765 0.982 0.869 3.38
MULTI DWELL 2.698 2.669 2.633 2.582 10.58
BEACHES/PARKS 0.777 0.522 0.577 0.378 2.25
AGRICULTURE 9.217 5.454 8.844 5.760 29.28
RECREATIONAL 0.236 0.265 0.237 0.233 0.97
MARINE 0.635 0.589 0.637 0.468 2.33
IRRIGATION 7.926 8.990 5.611 2.210 24.74
DETECTOR CHECKS 0.040 0.066 0.079 0.021 0.21
RAW WATER 8.971 6.974 8.488 8.580 33.01
PORTABLE METERS 0.109 0.611 0.393 0.436 1.55
CONSTRUCTION 0.153 0.194 0.138 0.129 0.61
TOTAL - MG 61.20 75.23 58.04 64.99 259.46
Non Residential Usage 39.52 34.48 36.94 27.84Running 12 Month Total 616.14 12 mo Residential 312.70 12 mo Non Residential 303.45
FY2018
JUL AUG SEPT OCT NOV DEC JAN FEB MAR APR MAY JUNMG to
Date
RESIDENTIAL 20.823 40.192 21.242 40.000 18.734 31.360 17.800 29.710 14.860 26.671 16.854 36.024 314.27
COMMERCIAL 3.369 3.103 3.521 2.770 3.543 2.340 3.032 2.330 2.536 2.398 2.978 2.916 34.84
RESTAURANT 1.783 1.563 1.745 1.450 1.601 1.170 1.572 1.200 1.285 1.320 1.481 1.536 17.71
HOTELS/MOTELS 2.762 2.777 2.388 2.290 2.412 1.650 2.079 2.020 1.774 2.311 2.299 2.501 27.26
SCHOOLS 0.567 0.735 0.934 0.810 0.604 0.420 0.540 0.310 0.285 0.278 0.803 0.910 7.20
MULTI DWELL 2.768 3.107 2.817 3.100 2.660 2.760 2.671 2.780 2.296 2.853 2.518 3.076 33.41
BEACHES/PARKS 0.554 0.589 0.708 0.530 0.340 0.090 0.178 0.140 0.135 0.156 0.316 0.481 4.22
AGRICULTURE 6.107 6.007 8.518 7.420 6.220 6.520 4.656 6.300 5.309 6.417 5.130 7.271 75.87
RECREATIONAL 0.266 0.354 0.215 0.320 0.197 0.290 0.215 0.290 0.169 0.267 0.192 0.245 3.02
MARINE 0.597 0.666 0.640 0.440 0.653 0.590 0.446 0.330 0.323 0.305 0.419 0.383 5.79
IRRIGATION 6.166 5.258 1.570 2.250 0.986 0.880 0.767 0.850 0.536 0.500 1.113 5.620 26.50
RAW WATER 8.783 10.435 7.389 8.250 4.969 0.010 0.013 1.700 0.011 3.064 2.520 0.064 47.21
DETECTOR CHECKS 0.019 0.044 0.022 0.030 0.002 0.030 0.016 0.050 0.021 0.037 0.034 6.858 7.16
PORTABLE METERS 0.267 0.248 0.323 0.290 0.203 0.190 0.041 0.150 0.090 0.306 0.197 0.403 2.71
CONSTRUCTION NA NA NA NA 0.108 0.270 0.188 0.150 0.142 0.202 0.144 0.218 1.42
TOTAL - MG 54.83 75.08 52.03 69.95 43.23 48.57 34.21 48.31 29.77 47.09 37.00 68.51 608.58
Coastside County Water District Monthly Sales By Category (MG)
FY2019
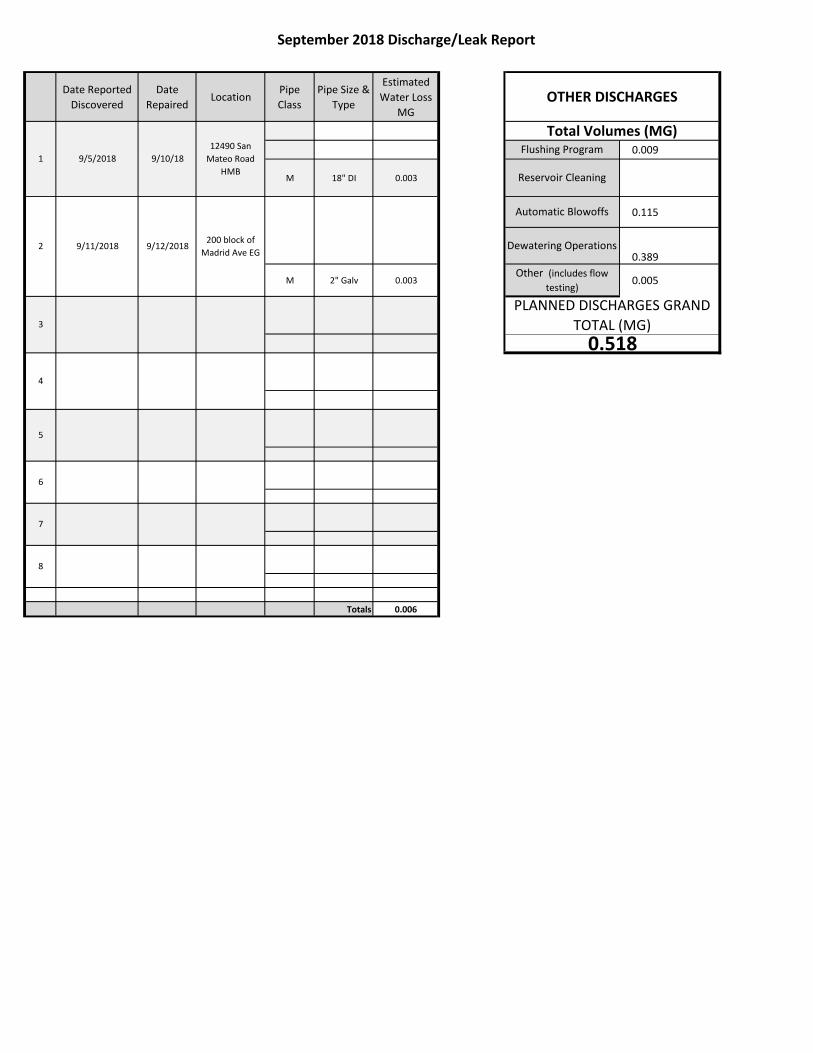
September 2018 Discharge/Leak Report
Date Reported
Discovered
Date
RepairedLocation
Pipe
Class
Pipe Size &
Type
Estimated
Water Loss
MG
0.009
M 18" DI 0.003
0.115
0.389
M 2" Galv 0.003 0.005
Totals 0.006
1 9/5/2018 9/10/18
12490 San
Mateo Road
HMB
2 9/11/2018 9/12/2018200 block of
Madrid Ave EG
3
4
5
7
6
8
PLANNED DISCHARGES GRAND
TOTAL (MG)
0.518
OTHER DISCHARGES
Total Volumes (MG)Flushing Program
Reservoir Cleaning
Automatic Blowoffs
Dewatering Operations
Other (includes flow
testing)
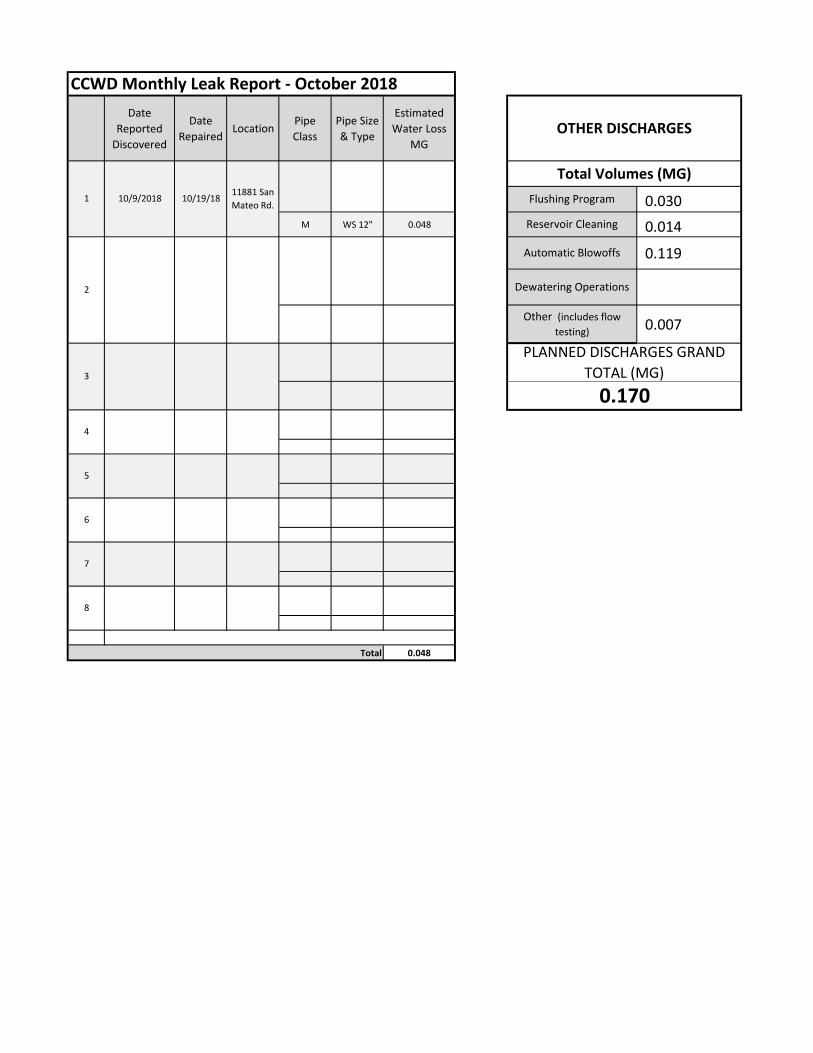
Date
Reported
Discovered
Date
RepairedLocation
Pipe
Class
Pipe Size
& Type
Estimated
Water Loss
MG
0.030
M WS 12" 0.048 0.014
0.119
0.007
Total 0.048
CCWD Monthly Leak Report - October 2018
OTHER DISCHARGES
1 10/9/2018 10/19/1811881 San
Mateo Rd.
Total Volumes (MG)
Flushing Program
Reservoir Cleaning
Automatic Blowoffs
Dewatering Operations
Other (includes flow
testing)
3
2
PLANNED DISCHARGES GRAND
TOTAL (MG)
0.170
4
6
5
8
7
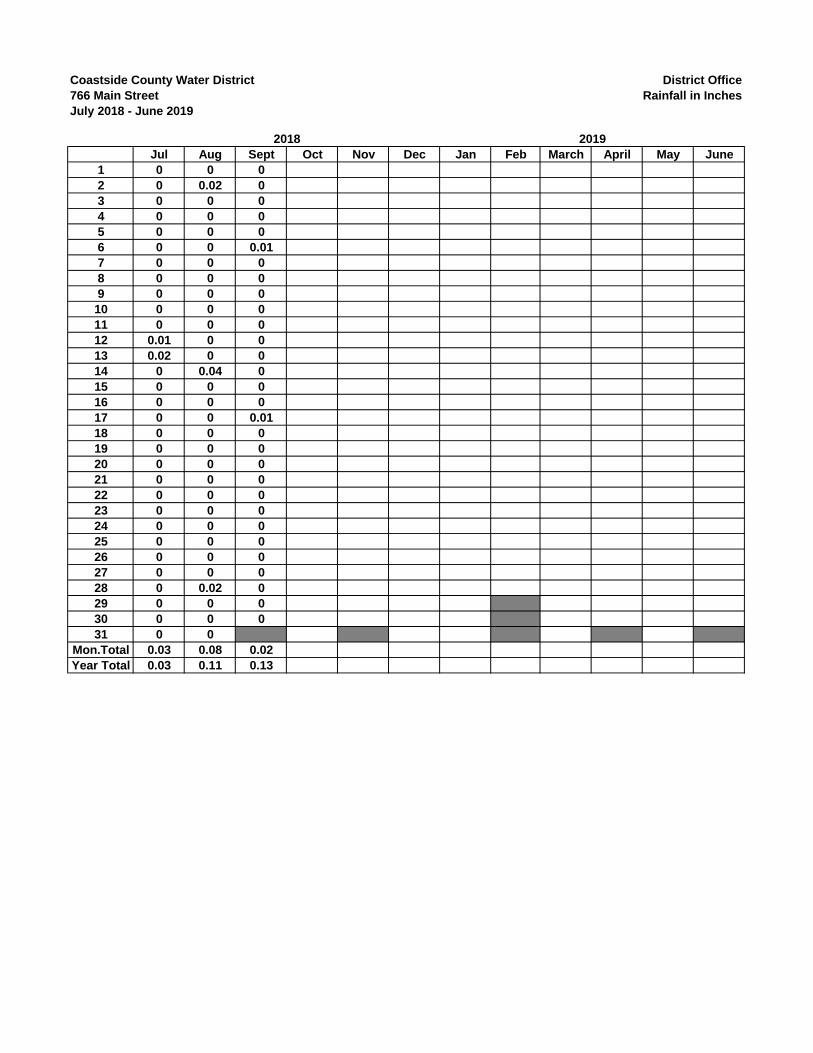
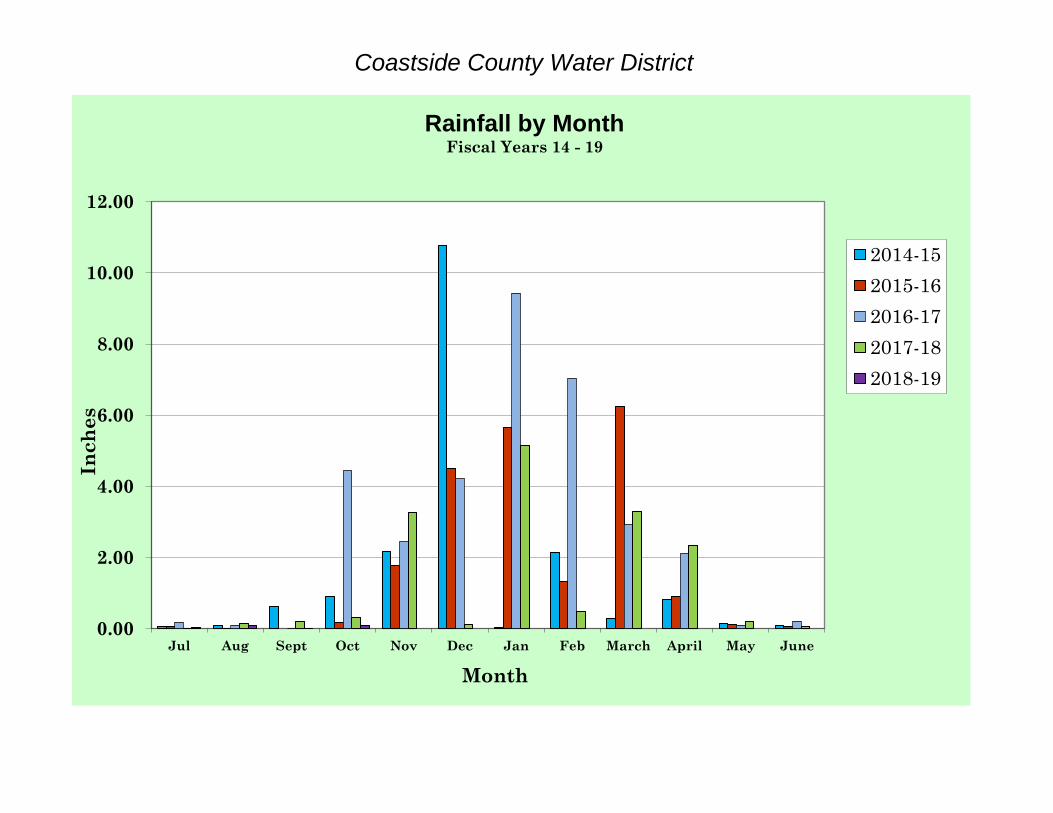
Coastside County Water District District Office766 Main Street Rainfall in InchesJuly 2018 - June 2019
Jul Aug Sept Oct Nov Dec Jan Feb March April May June1 0 0 02 0 0.02 03 0 0 04 0 0 05 0 0 06 0 0 0.017 0 0 08 0 0 09 0 0 010 0 0 011 0 0 012 0.01 0 013 0.02 0 014 0 0.04 015 0 0 016 0 0 017 0 0 0.0118 0 0 019 0 0 020 0 0 021 0 0 022 0 0 023 0 0 024 0 0 025 0 0 026 0 0 027 0 0 028 0 0.02 029 0 0 030 0 0 031 0 0
Mon.Total 0.03 0.08 0.02Year Total 0.03 0.11 0.13
2018 2019

Coastside County Water District
0.00
2.00
4.00
6.00
8.00
10.00
12.00
Jul Aug Sept Oct Nov Dec Jan Feb March April May June
Inch
es
Month
Rainfall by MonthFiscal Years 14 - 19
2014-15
2015-16
2016-17
2017-18
2018-19

0.00
5.00
10.00
15.00
20.00
25.00
30.00
35.00
Jul Aug Sept Oct Nov Dec Jan Feb March April May June
Inch
es
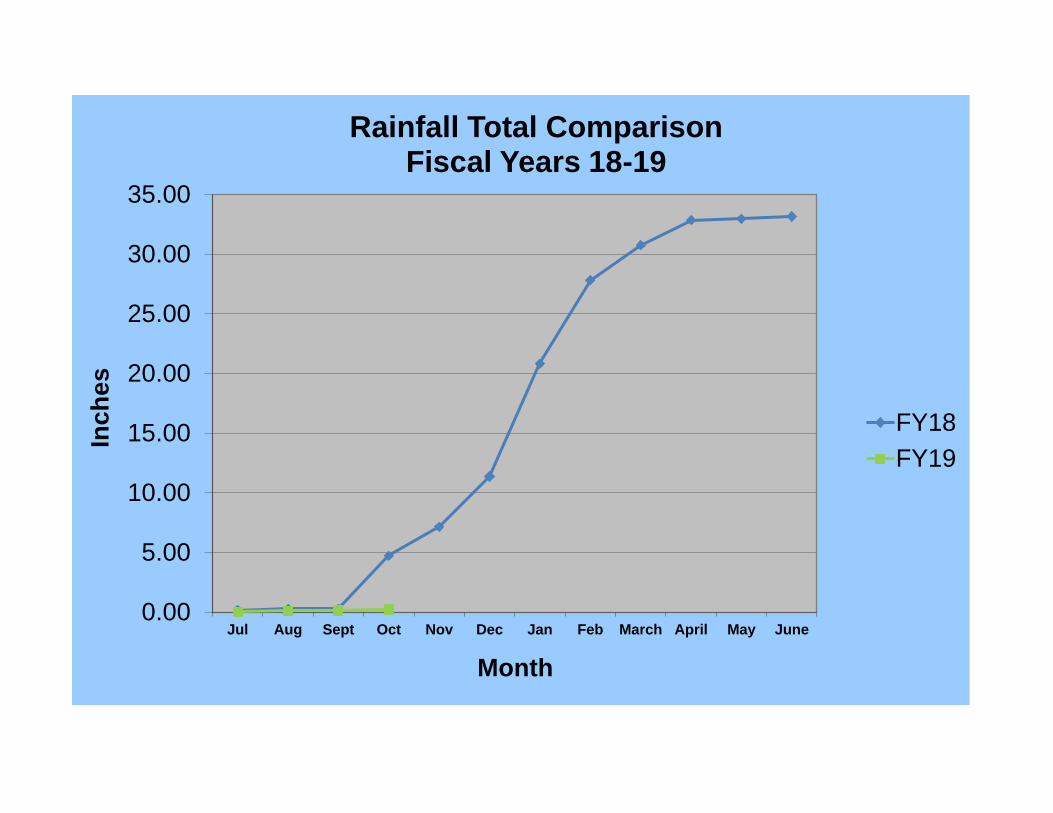
Month
Rainfall Total ComparisonFiscal Years 18-19
FY18FY19

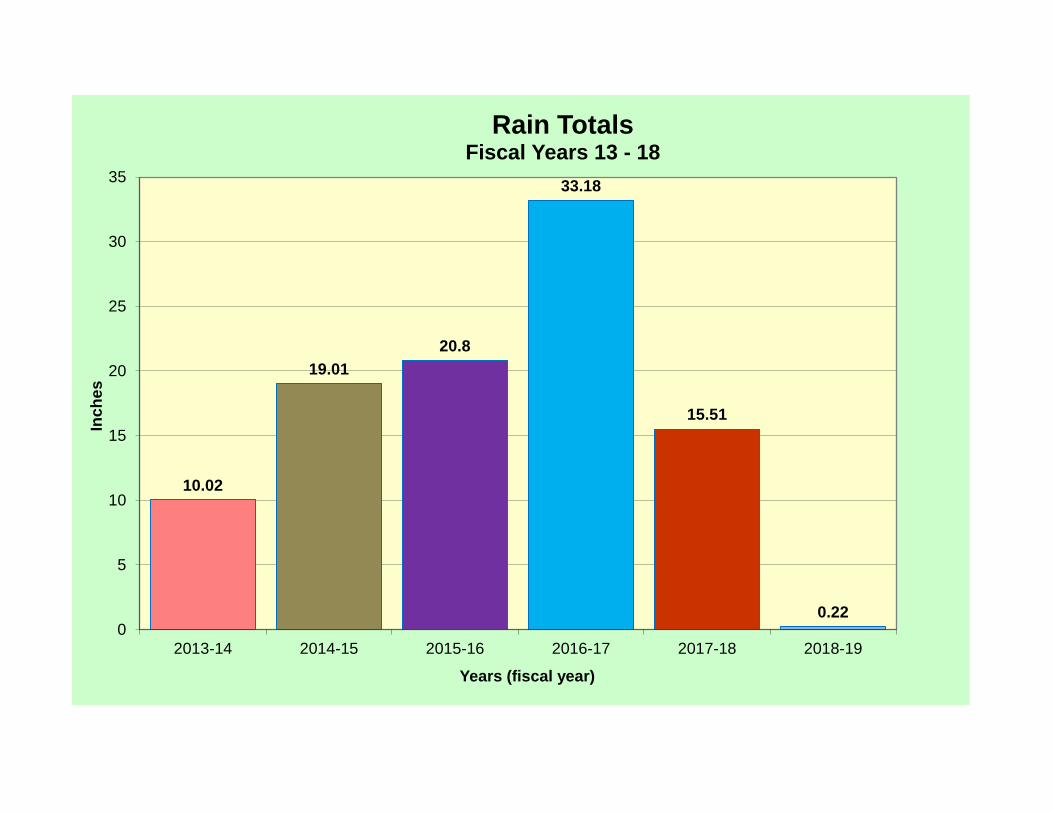
10.02
19.0120.8
33.18
15.51
0.130
5
10
15
20
25
30
35
2013-14 2014-15 2015-16 2016-17 2017-18 2018-19
Inch
es
Years (fiscal year)
Rain TotalsFiscal Years 13 - 18
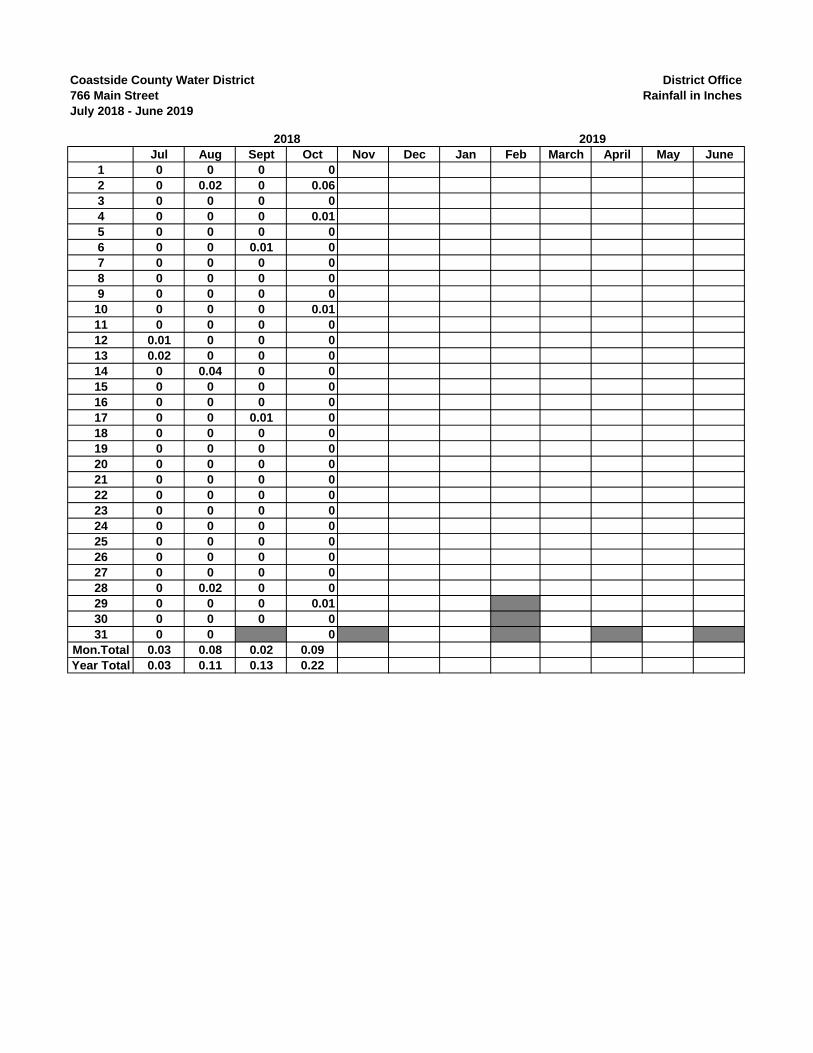
Coastside County Water District District Office766 Main Street Rainfall in InchesJuly 2018 - June 2019
Jul Aug Sept Oct Nov Dec Jan Feb March April May June1 0 0 0 02 0 0.02 0 0.063 0 0 0 04 0 0 0 0.015 0 0 0 06 0 0 0.01 07 0 0 0 08 0 0 0 09 0 0 0 010 0 0 0 0.0111 0 0 0 012 0.01 0 0 013 0.02 0 0 014 0 0.04 0 015 0 0 0 016 0 0 0 017 0 0 0.01 018 0 0 0 019 0 0 0 020 0 0 0 021 0 0 0 022 0 0 0 023 0 0 0 024 0 0 0 025 0 0 0 026 0 0 0 027 0 0 0 028 0 0.02 0 029 0 0 0 0.0130 0 0 0 031 0 0 0
Mon.Total 0.03 0.08 0.02 0.09Year Total 0.03 0.11 0.13 0.22
2018 2019
Coastside County Water District
0.00
2.00
4.00
6.00
8.00
10.00
12.00
Jul Aug Sept Oct Nov Dec Jan Feb March April May June
Inch
es
Month
Rainfall by MonthFiscal Years 14 - 19
2014-15
2015-16
2016-17
2017-18
2018-19
0.00
5.00
10.00
15.00
20.00
25.00
30.00
35.00
Jul Aug Sept Oct Nov Dec Jan Feb March April May June
Inch
es
Month
Rainfall Total ComparisonFiscal Years 18-19
FY18FY19
10.02
19.0120.8
33.18
15.51
0.220
5
10
15
20
25
30
35
2013-14 2014-15 2015-16 2016-17 2017-18 2018-19
Inch
es
Years (fiscal year)
Rain TotalsFiscal Years 13 - 18
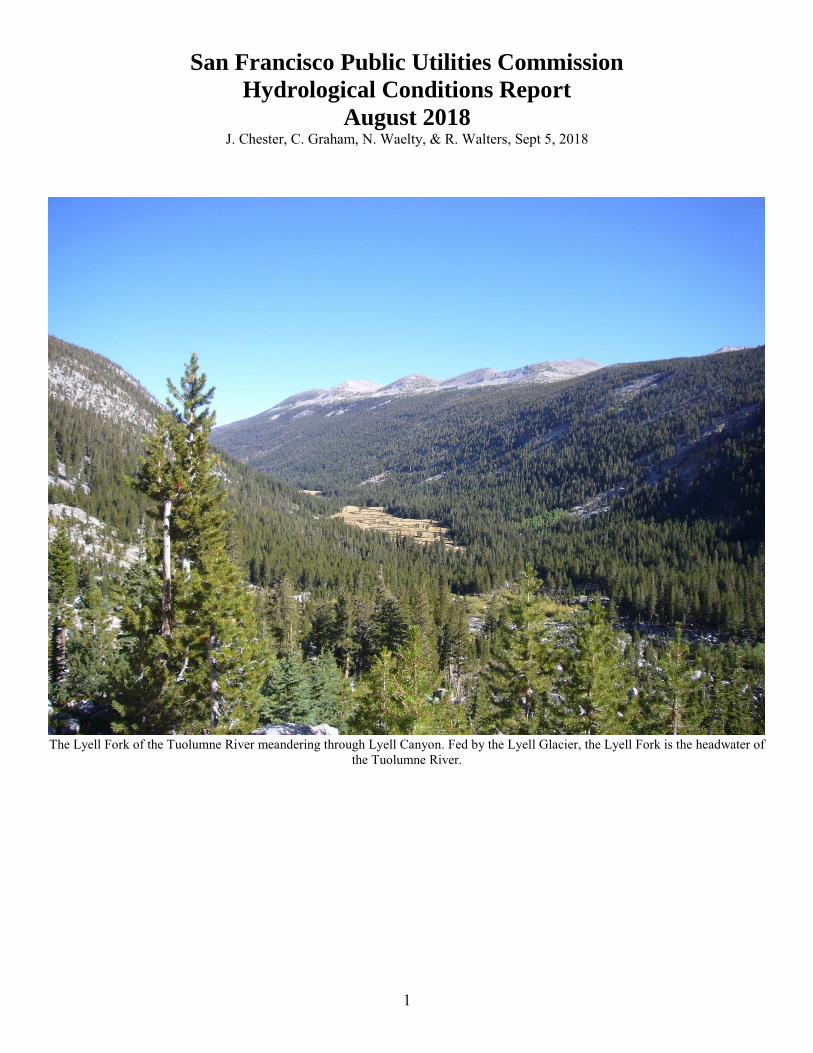
1
San Francisco Public Utilities Commission
Hydrological Conditions Report
August 2018 J. Chester, C. Graham, N. Waelty, & R. Walters, Sept 5, 2018
The Lyell Fork of the Tuolumne River meandering through Lyell Canyon. Fed by the Lyell Glacier, the Lyell Fork is the headwater of
the Tuolumne River.

2
System Storage
Current Tuolumne System and Local Bay Area storage conditions are summarized in Table 1.
Table 1
Current Storage
As of September 1, 2018
Reservoir
Current Storage Maximum Storage Available Capacity Percentage
of Maximum
Storage Acre-Feet
Millions of
Gallons Acre-Feet
Millions of
Gallons Acre-Feet
Millions of
Gallons
Tuolumne System Hetch Hetchy1 315,822
360,360
44,538
88% Cherry2 224,053 268,810 44,757 83% Eleanor3 22,425 27,100 4,675 83% Water Bank 570,000 570,000 0 100% Tuolumne Storage 1,132,300 1,226,270 93,970 92% Local Bay Area Storage
Calaveras5 23,647 7,705 96,824 31,550 73,177 23,845 24% San Antonio 48,149 15,689 50,496 16,454 2,346 765 95% Crystal Springs 54,129 17,638 58,377 19,022 4,247 1,384 93% San Andreas 17,628 5,744 18,996 6,190 1,369 446 93% Pilarcitos 2,511 818 2,995 976 484 158 84% Total Local Storage 146,064 47,595 227,688 74,192 81,623 26,597 64% Total System 1,278,364 1,453,957 175,593 88%
1 Maximum Hetch Hetchy Reservoir storage with drum gates activated. 2 Maximum Cherry Lake storage with flash-boards removed. 3 Maximum Lake Eleanor storage with flash-boards installed.
Figure 1: Monthly system storage for past 12 months in thousand acre-feet (TAF). Color bands show relative contributions to total system storage. Solid black line shows total system storage for the past 12 months. Dashed black line shows total system storage the previous 12 months.
3
Hetch Hetchy System Precipitation Index6
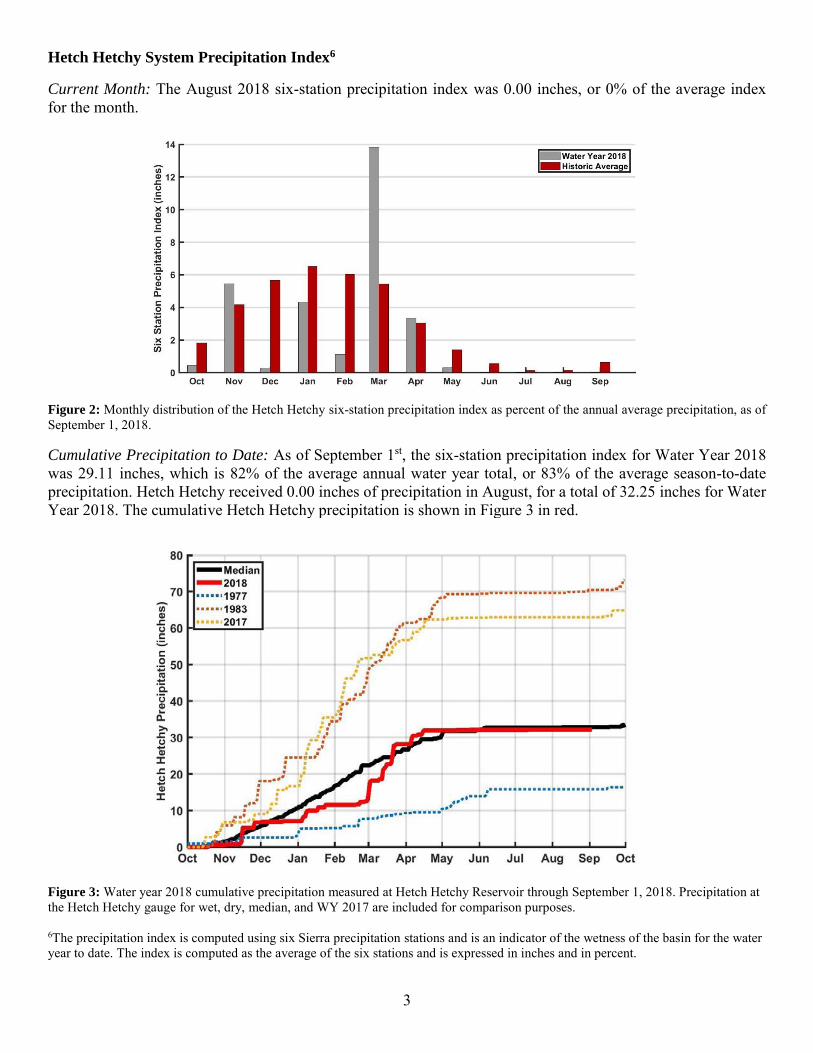
Current Month: The August 2018 six-station precipitation index was 0.00 inches, or 0% of the average index for the month.
Figure 2: Monthly distribution of the Hetch Hetchy six-station precipitation index as percent of the annual average precipitation, as of September 1, 2018.
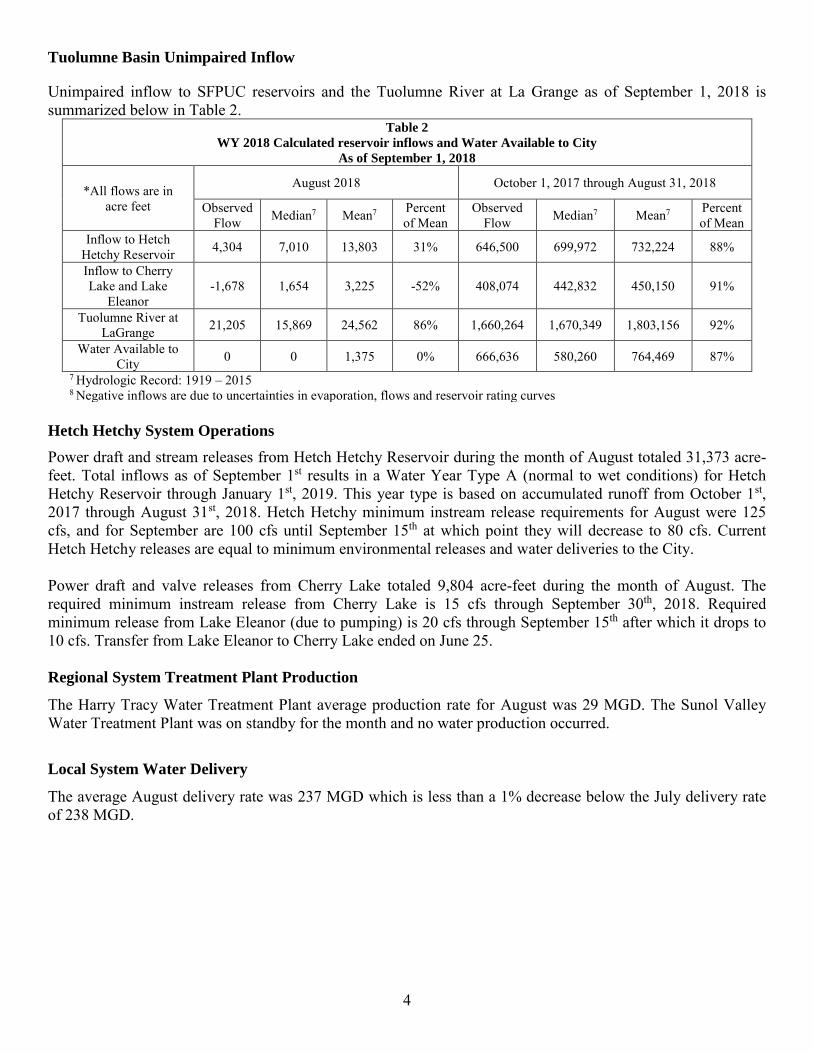
Cumulative Precipitation to Date: As of September 1st, the six-station precipitation index for Water Year 2018 was 29.11 inches, which is 82% of the average annual water year total, or 83% of the average season-to-date precipitation. Hetch Hetchy received 0.00 inches of precipitation in August, for a total of 32.25 inches for Water Year 2018. The cumulative Hetch Hetchy precipitation is shown in Figure 3 in red.
Figure 3: Water year 2018 cumulative precipitation measured at Hetch Hetchy Reservoir through September 1, 2018. Precipitation at the Hetch Hetchy gauge for wet, dry, median, and WY 2017 are included for comparison purposes. 6The precipitation index is computed using six Sierra precipitation stations and is an indicator of the wetness of the basin for the water year to date. The index is computed as the average of the six stations and is expressed in inches and in percent.
4
Tuolumne Basin Unimpaired Inflow
Unimpaired inflow to SFPUC reservoirs and the Tuolumne River at La Grange as of September 1, 2018 is summarized below in Table 2.
Table 2
WY 2018 Calculated reservoir inflows and Water Available to City
As of September 1, 2018
*All flows are in acre feet
August 2018 October 1, 2017 through August 31, 2018
Observed Flow Median7 Mean7 Percent
of Mean Observed
Flow Median7 Mean7 Percent of Mean
Inflow to Hetch Hetchy Reservoir 4,304 7,010 13,803 31% 646,500 699,972 732,224 88%
Inflow to Cherry Lake and Lake
Eleanor -1,678 1,654 3,225 -52% 408,074 442,832 450,150 91%
Tuolumne River at LaGrange 21,205 15,869 24,562 86% 1,660,264 1,670,349 1,803,156 92%
Water Available to City 0 0 1,375 0% 666,636 580,260 764,469 87%
7 Hydrologic Record: 1919 – 2015 8 Negative inflows are due to uncertainties in evaporation, flows and reservoir rating curves
Hetch Hetchy System Operations
Power draft and stream releases from Hetch Hetchy Reservoir during the month of August totaled 31,373 acre-feet. Total inflows as of September 1st results in a Water Year Type A (normal to wet conditions) for Hetch Hetchy Reservoir through January 1st, 2019. This year type is based on accumulated runoff from October 1st, 2017 through August 31st, 2018. Hetch Hetchy minimum instream release requirements for August were 125 cfs, and for September are 100 cfs until September 15th at which point they will decrease to 80 cfs. Current Hetch Hetchy releases are equal to minimum environmental releases and water deliveries to the City. Power draft and valve releases from Cherry Lake totaled 9,804 acre-feet during the month of August. The required minimum instream release from Cherry Lake is 15 cfs through September 30th, 2018. Required minimum release from Lake Eleanor (due to pumping) is 20 cfs through September 15th after which it drops to 10 cfs. Transfer from Lake Eleanor to Cherry Lake ended on June 25. Regional System Treatment Plant Production
The Harry Tracy Water Treatment Plant average production rate for August was 29 MGD. The Sunol Valley Water Treatment Plant was on standby for the month and no water production occurred.
Local System Water Delivery
The average August delivery rate was 237 MGD which is less than a 1% decrease below the July delivery rate of 238 MGD.
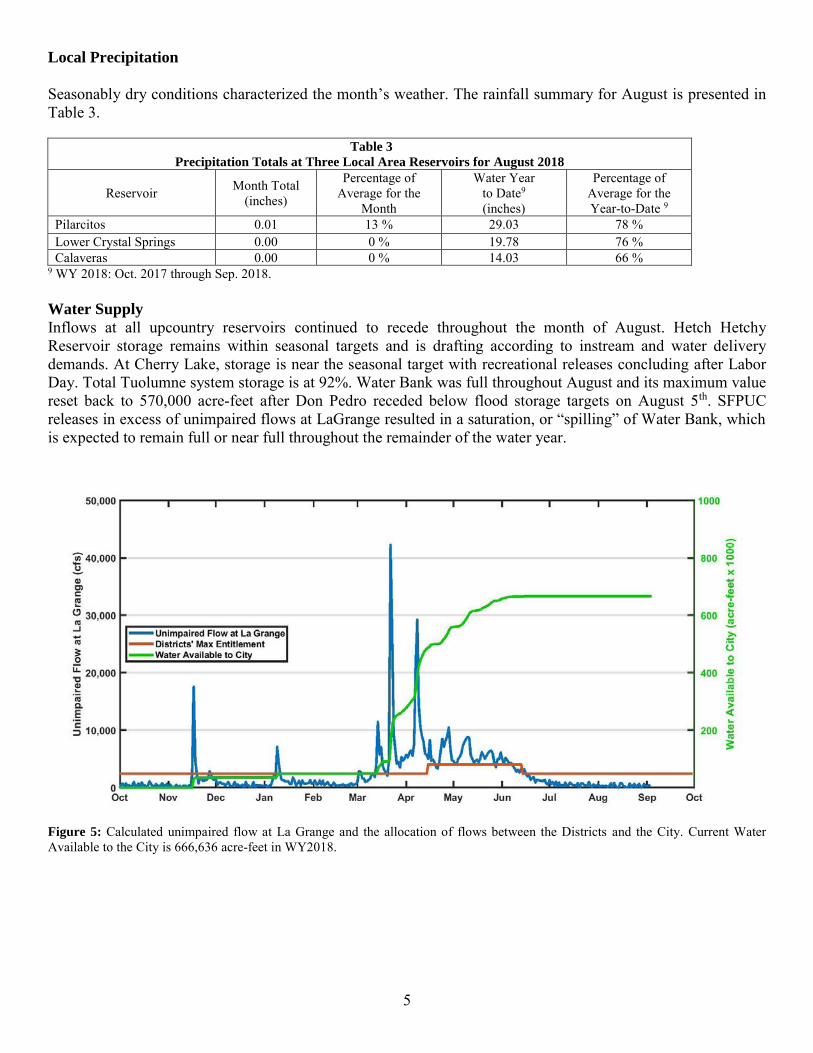
5
Local Precipitation
Seasonably dry conditions characterized the month’s weather. The rainfall summary for August is presented in Table 3.
Table 3
Precipitation Totals at Three Local Area Reservoirs for August 2018
Reservoir Month Total (inches)
Percentage of Average for the
Month
Water Year to Date9
(inches)
Percentage of Average for the Year-to-Date 9
Pilarcitos 0.01 13 % 29.03 78 % Lower Crystal Springs 0.00 0 % 19.78 76 % Calaveras 0.00 0 % 14.03 66 %
9 WY 2018: Oct. 2017 through Sep. 2018.
Water Supply
Inflows at all upcountry reservoirs continued to recede throughout the month of August. Hetch Hetchy Reservoir storage remains within seasonal targets and is drafting according to instream and water delivery demands. At Cherry Lake, storage is near the seasonal target with recreational releases concluding after Labor Day. Total Tuolumne system storage is at 92%. Water Bank was full throughout August and its maximum value reset back to 570,000 acre-feet after Don Pedro receded below flood storage targets on August 5th. SFPUC releases in excess of unimpaired flows at LaGrange resulted in a saturation, or “spilling” of Water Bank, which is expected to remain full or near full throughout the remainder of the water year.
Figure 5: Calculated unimpaired flow at La Grange and the allocation of flows between the Districts and the City. Current Water Available to the City is 666,636 acre-feet in WY2018.
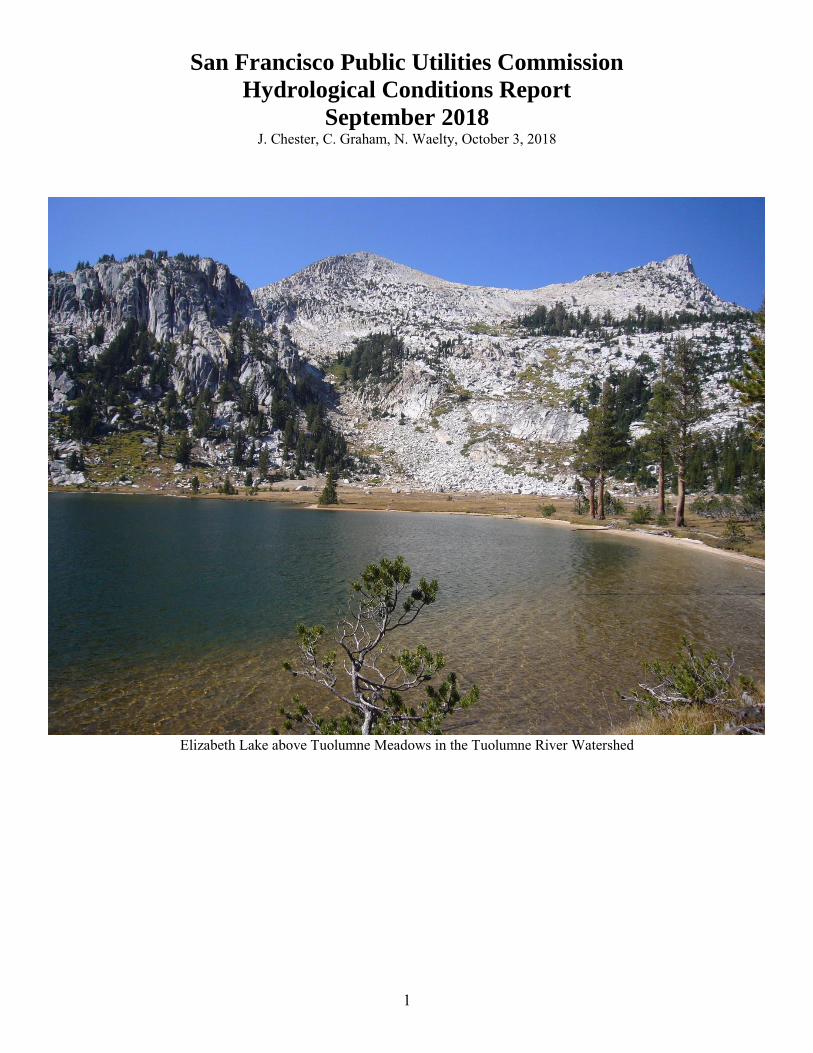
1
San Francisco Public Utilities Commission
Hydrological Conditions Report
September 2018 J. Chester, C. Graham, N. Waelty, October 3, 2018
Elizabeth Lake above Tuolumne Meadows in the Tuolumne River Watershed
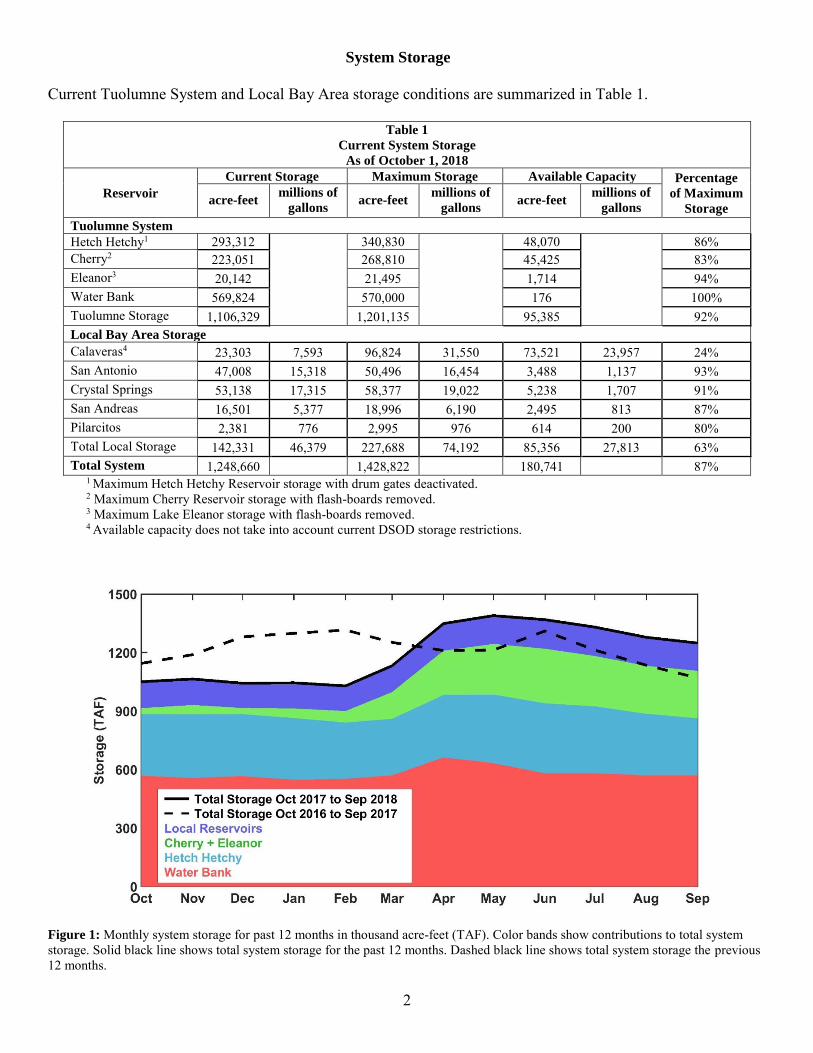
2
System Storage
Current Tuolumne System and Local Bay Area storage conditions are summarized in Table 1.
Table 1
Current System Storage
As of October 1, 2018
Reservoir
Current Storage Maximum Storage Available Capacity Percentage
of Maximum
Storage acre-feet
millions of
gallons acre-feet
millions of
gallons acre-feet
millions of
gallons
Tuolumne System Hetch Hetchy1 293,312
340,830
48,070
86% Cherry2 223,051 268,810 45,425 83% Eleanor3 20,142 21,495 1,714 94% Water Bank 569,824 570,000 176 100% Tuolumne Storage 1,106,329 1,201,135 95,385 92% Local Bay Area Storage
Calaveras4 23,303 7,593 96,824 31,550 73,521 23,957 24% San Antonio 47,008 15,318 50,496 16,454 3,488 1,137 93% Crystal Springs 53,138 17,315 58,377 19,022 5,238 1,707 91% San Andreas 16,501 5,377 18,996 6,190 2,495 813 87% Pilarcitos 2,381 776 2,995 976 614 200 80% Total Local Storage 142,331 46,379 227,688 74,192 85,356 27,813 63% Total System 1,248,660 1,428,822 180,741 87%
1 Maximum Hetch Hetchy Reservoir storage with drum gates deactivated. 2 Maximum Cherry Reservoir storage with flash-boards removed. 3 Maximum Lake Eleanor storage with flash-boards removed. 4 Available capacity does not take into account current DSOD storage restrictions.
Figure 1: Monthly system storage for past 12 months in thousand acre-feet (TAF). Color bands show contributions to total system storage. Solid black line shows total system storage for the past 12 months. Dashed black line shows total system storage the previous 12 months.
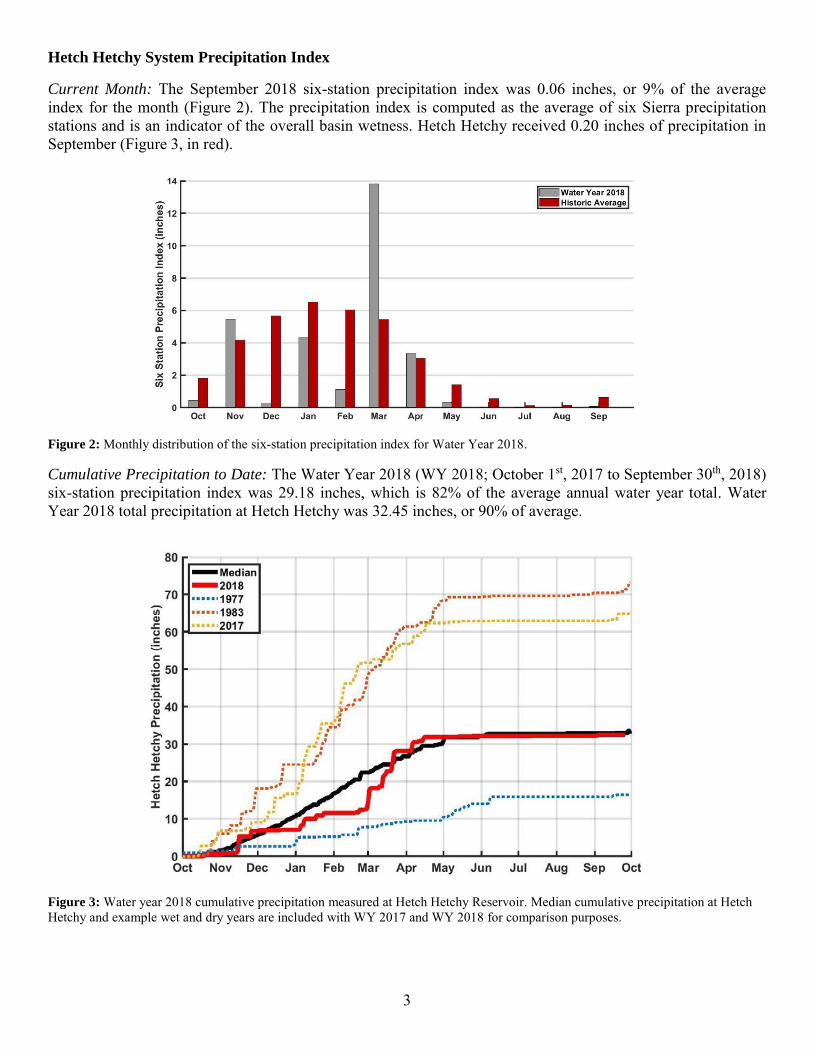
3
Hetch Hetchy System Precipitation Index
Current Month: The September 2018 six-station precipitation index was 0.06 inches, or 9% of the average index for the month (Figure 2). The precipitation index is computed as the average of six Sierra precipitation stations and is an indicator of the overall basin wetness. Hetch Hetchy received 0.20 inches of precipitation in September (Figure 3, in red).
Figure 2: Monthly distribution of the six-station precipitation index for Water Year 2018.
Cumulative Precipitation to Date: The Water Year 2018 (WY 2018; October 1st, 2017 to September 30th, 2018) six-station precipitation index was 29.18 inches, which is 82% of the average annual water year total. Water Year 2018 total precipitation at Hetch Hetchy was 32.45 inches, or 90% of average.
Figure 3: Water year 2018 cumulative precipitation measured at Hetch Hetchy Reservoir. Median cumulative precipitation at Hetch Hetchy and example wet and dry years are included with WY 2017 and WY 2018 for comparison purposes.
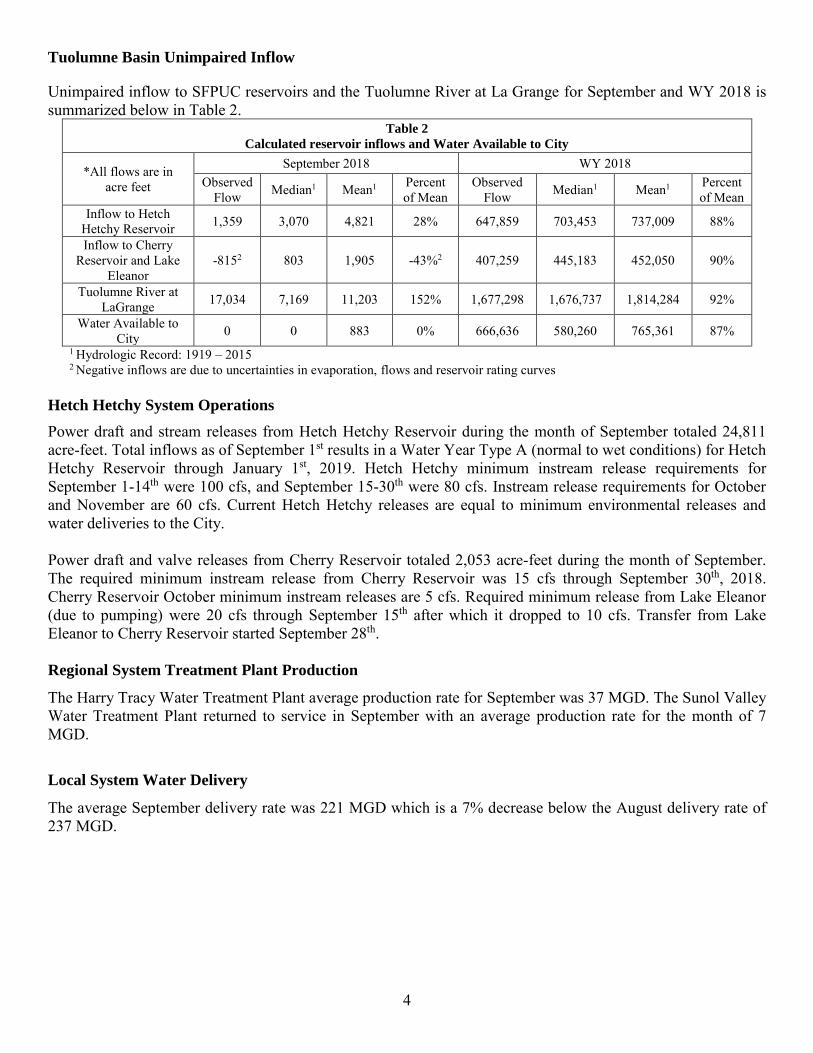
4
Tuolumne Basin Unimpaired Inflow
Unimpaired inflow to SFPUC reservoirs and the Tuolumne River at La Grange for September and WY 2018 is summarized below in Table 2.
Table 2
Calculated reservoir inflows and Water Available to City
*All flows are in acre feet
September 2018 WY 2018 Observed
Flow Median1 Mean1 Percent of Mean
Observed Flow Median1 Mean1 Percent
of Mean Inflow to Hetch
Hetchy Reservoir 1,359 3,070 4,821 28% 647,859 703,453 737,009 88%
Inflow to Cherry Reservoir and Lake
Eleanor -8152 803 1,905 -43%2 407,259 445,183 452,050 90%
Tuolumne River at LaGrange 17,034 7,169 11,203 152% 1,677,298 1,676,737 1,814,284 92%
Water Available to City 0 0 883 0% 666,636 580,260 765,361 87%
1 Hydrologic Record: 1919 – 2015 2 Negative inflows are due to uncertainties in evaporation, flows and reservoir rating curves
Hetch Hetchy System Operations
Power draft and stream releases from Hetch Hetchy Reservoir during the month of September totaled 24,811 acre-feet. Total inflows as of September 1st results in a Water Year Type A (normal to wet conditions) for Hetch Hetchy Reservoir through January 1st, 2019. Hetch Hetchy minimum instream release requirements for September 1-14th were 100 cfs, and September 15-30th were 80 cfs. Instream release requirements for October and November are 60 cfs. Current Hetch Hetchy releases are equal to minimum environmental releases and water deliveries to the City. Power draft and valve releases from Cherry Reservoir totaled 2,053 acre-feet during the month of September. The required minimum instream release from Cherry Reservoir was 15 cfs through September 30th, 2018. Cherry Reservoir October minimum instream releases are 5 cfs. Required minimum release from Lake Eleanor (due to pumping) were 20 cfs through September 15th after which it dropped to 10 cfs. Transfer from Lake Eleanor to Cherry Reservoir started September 28th. Regional System Treatment Plant Production
The Harry Tracy Water Treatment Plant average production rate for September was 37 MGD. The Sunol Valley Water Treatment Plant returned to service in September with an average production rate for the month of 7 MGD.
Local System Water Delivery
The average September delivery rate was 221 MGD which is a 7% decrease below the August delivery rate of 237 MGD.
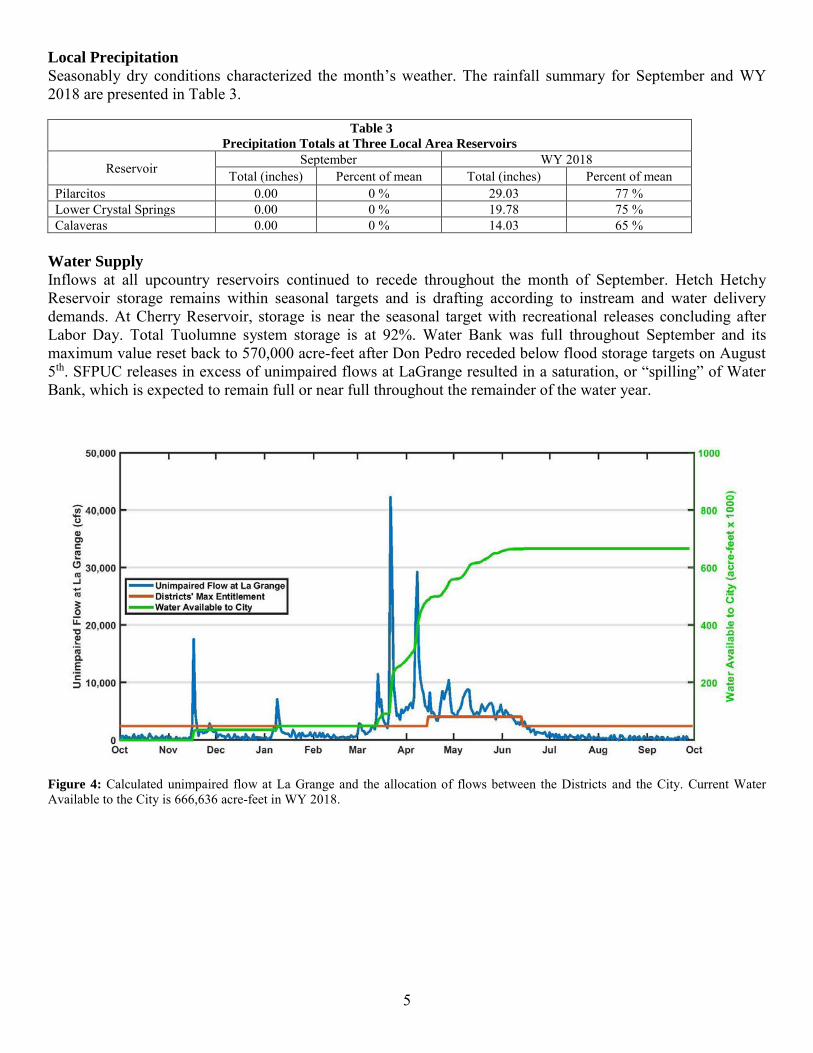
5
Local Precipitation
Seasonably dry conditions characterized the month’s weather. The rainfall summary for September and WY 2018 are presented in Table 3.
Table 3
Precipitation Totals at Three Local Area Reservoirs
Reservoir September WY 2018
Total (inches) Percent of mean Total (inches) Percent of mean Pilarcitos 0.00 0 % 29.03 77 % Lower Crystal Springs 0.00 0 % 19.78 75 % Calaveras 0.00 0 % 14.03 65 %
Water Supply
Inflows at all upcountry reservoirs continued to recede throughout the month of September. Hetch Hetchy Reservoir storage remains within seasonal targets and is drafting according to instream and water delivery demands. At Cherry Reservoir, storage is near the seasonal target with recreational releases concluding after Labor Day. Total Tuolumne system storage is at 92%. Water Bank was full throughout September and its maximum value reset back to 570,000 acre-feet after Don Pedro receded below flood storage targets on August 5th. SFPUC releases in excess of unimpaired flows at LaGrange resulted in a saturation, or “spilling” of Water Bank, which is expected to remain full or near full throughout the remainder of the water year.
Figure 4: Calculated unimpaired flow at La Grange and the allocation of flows between the Districts and the City. Current Water Available to the City is 666,636 acre-feet in WY 2018.
STAFF REPORT To: Coastside County Water District Board of Directors From: Dave Dickson, General Manager Agenda: November 13, 2017 Date: November 5, 2018 Subject: Notice of Completion – 2 Inch Downtown Pipeline Replacement Project Recommendation: That the Board of Directors take the following actions:
(1) Accept the 2 Inch Downtown Pipeline Replacement Project as complete.
(2) Authorize the Notice of Completion to be filed with the County of San Mateo.
(3) Authorize the release of the retention funds when the Notice of Completion has been recorded and returned to the District.
Background Coastside County Water District entered into a contract with Andreini Bros., Inc. on November 17, 2017 for the 2 Inch Downtown Pipeline Replacement Project. The work consisted of approximately 2,720 feet of 6-inch diameter pipelines, 3 new fire hydrants, abandonment of existing pipelines, replacement of 49 customer water service connections, reconnection of 11 customer water service connections, and asphalt concrete repaving. The site of the work is located in Half Moon Bay, California. All work was within the existing street right of way areas. The work was completed on November 2, 2018. The project was constructed according to District specifications. Fiscal Impact: None.
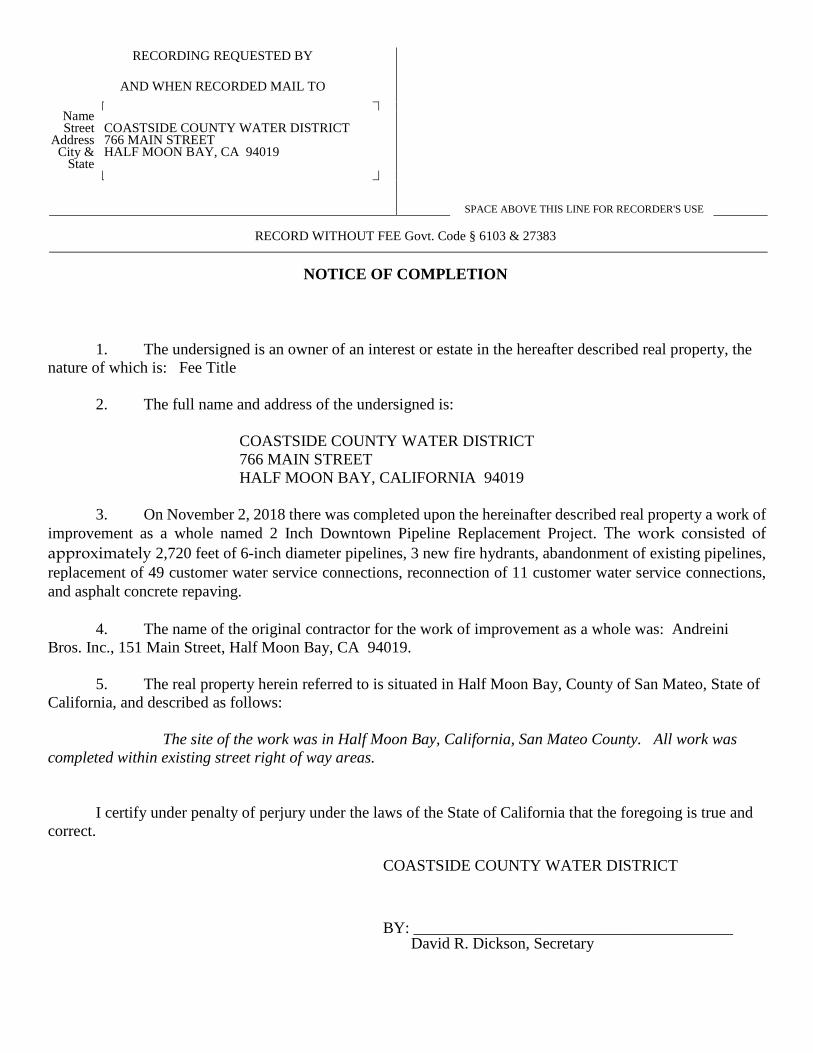
1. The undersigned is an owner of an interest or estate in the hereafter described real property, the nature of which is: Fee Title 2. The full name and address of the undersigned is: COASTSIDE COUNTY WATER DISTRICT 766 MAIN STREET HALF MOON BAY, CALIFORNIA 94019 3. On November 2, 2018 there was completed upon the hereinafter described real property a work of improvement as a whole named 2 Inch Downtown Pipeline Replacement Project. The work consisted of approximately 2,720 feet of 6-inch diameter pipelines, 3 new fire hydrants, abandonment of existing pipelines, replacement of 49 customer water service connections, reconnection of 11 customer water service connections, and asphalt concrete repaving. 4. The name of the original contractor for the work of improvement as a whole was: Andreini Bros. Inc., 151 Main Street, Half Moon Bay, CA 94019.
5. The real property herein referred to is situated in Half Moon Bay, County of San Mateo, State of California, and described as follows: The site of the work was in Half Moon Bay, California, San Mateo County. All work was completed within existing street right of way areas. I certify under penalty of perjury under the laws of the State of California that the foregoing is true and correct. COASTSIDE COUNTY WATER DISTRICT BY: ________________________________________ David R. Dickson, Secretary
RECORDING REQUESTED BY
AND WHEN RECORDED MAIL TO
Name Street
Address City &
State
COASTSIDE COUNTY WATER DISTRICT 766 MAIN STREET HALF MOON BAY, CA 94019
RECORD WITHOUT FEE Govt. Code § 6103 & 27383
NOTICE OF COMPLETION
SPACE ABOVE THIS LINE FOR RECORDER'S USE

VERIFICATION
I, David R. Dickson, declare that I am the Secretary of the Coastside County Water District and am authorized to make this verification for that reason. I have read said Notice of Completion and know the contents thereof to be true and correct.
I declare under penalty of perjury that the foregoing is true and correct.
Executed on November 13, 2018 at Half Moon Bay, California
(Date) (Place where signed)
By: David R. Dickson, Secretary of the District
STAFF REPORT To: Coastside County Water District Board of Directors From: Dave Dickson, General Manager Agenda: November 13, 2018 Date: November 5, 2018 Subject: Notice of Completion – Denniston Reservoir Maintenance Dredging
Project for Year 2018 Recommendation: That the Board of Directors take the following actions:
(1) Accept the Denniston Reservoir Maintenance Dredging Project as complete.
(2) Authorize the Notice of Completion to be filed with the County of San Mateo.
(3) Authorize the release of the retention funds when the Notice of Completion has been recorded and returned to the District.
Background Coastside County Water District entered into a contract with Andreini Bros., Inc. on September 25, 2018 for the Denniston Reservoir Maintenance Dredging Project. The work consisted of dredging Denniston Reservoir of 400 cubic yards around the Denniston Water Treatment Plant intakes. The site of the work is located in the unincorporated community of El Granada, San Mateo County, at 150 Denniston Creek Road. (APN 037-320-140). The work was completed on October 5, 2018 in accordance with District specifications. Fiscal Impact: None.
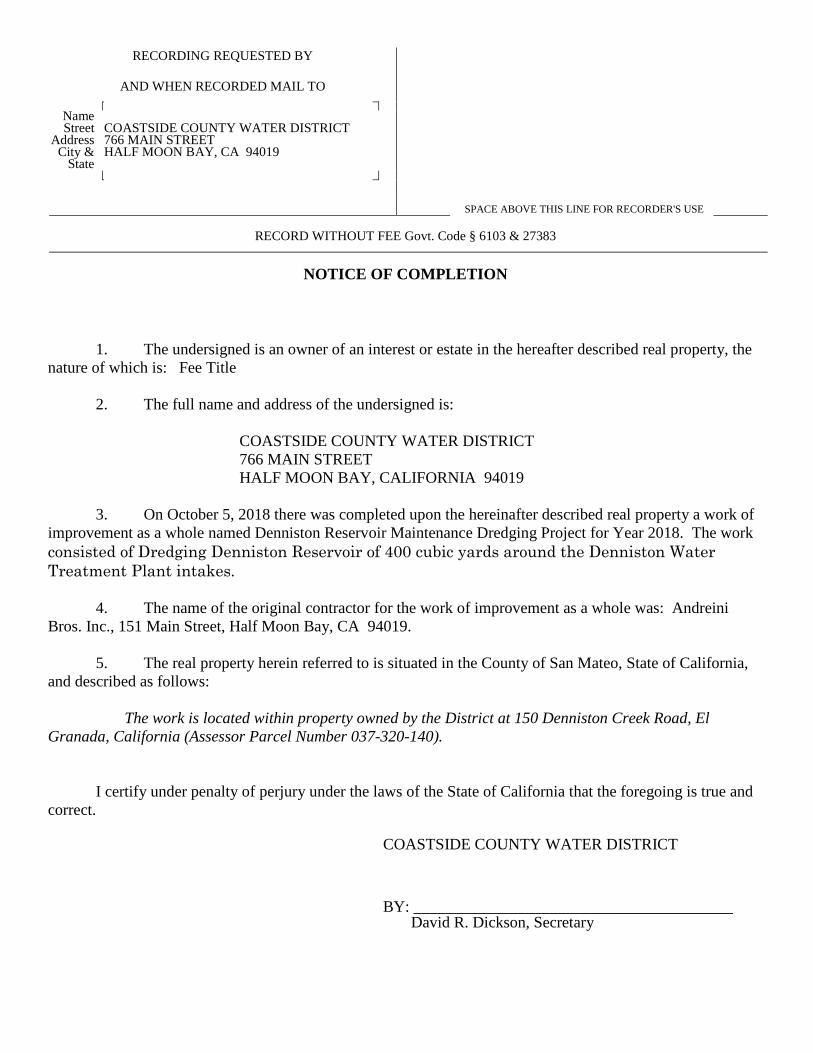
1. The undersigned is an owner of an interest or estate in the hereafter described real property, the nature of which is: Fee Title 2. The full name and address of the undersigned is: COASTSIDE COUNTY WATER DISTRICT 766 MAIN STREET HALF MOON BAY, CALIFORNIA 94019 3. On October 5, 2018 there was completed upon the hereinafter described real property a work of improvement as a whole named Denniston Reservoir Maintenance Dredging Project for Year 2018. The work consisted of Dredging Denniston Reservoir of 400 cubic yards around the Denniston Water Treatment Plant intakes. 4. The name of the original contractor for the work of improvement as a whole was: Andreini Bros. Inc., 151 Main Street, Half Moon Bay, CA 94019.
5. The real property herein referred to is situated in the County of San Mateo, State of California, and described as follows: The work is located within property owned by the District at 150 Denniston Creek Road, El Granada, California (Assessor Parcel Number 037-320-140). I certify under penalty of perjury under the laws of the State of California that the foregoing is true and correct. COASTSIDE COUNTY WATER DISTRICT BY: ________________________________________ David R. Dickson, Secretary
RECORDING REQUESTED BY
AND WHEN RECORDED MAIL TO
Name Street
Address City &
State
COASTSIDE COUNTY WATER DISTRICT 766 MAIN STREET HALF MOON BAY, CA 94019
RECORD WITHOUT FEE Govt. Code § 6103 & 27383
NOTICE OF COMPLETION
SPACE ABOVE THIS LINE FOR RECORDER'S USE
VERIFICATION
I, David R. Dickson, declare that I am the Secretary of the Coastside County Water District and am authorized to make this verification for that reason. I have read said Notice of Completion and know the contents thereof to be true and correct.
I declare under penalty of perjury that the foregoing is true and correct.
Executed on November 13,2018, at Half Moon Bay, California
(Date) (Place where signed)
By: David R. Dickson, Secretary of the District
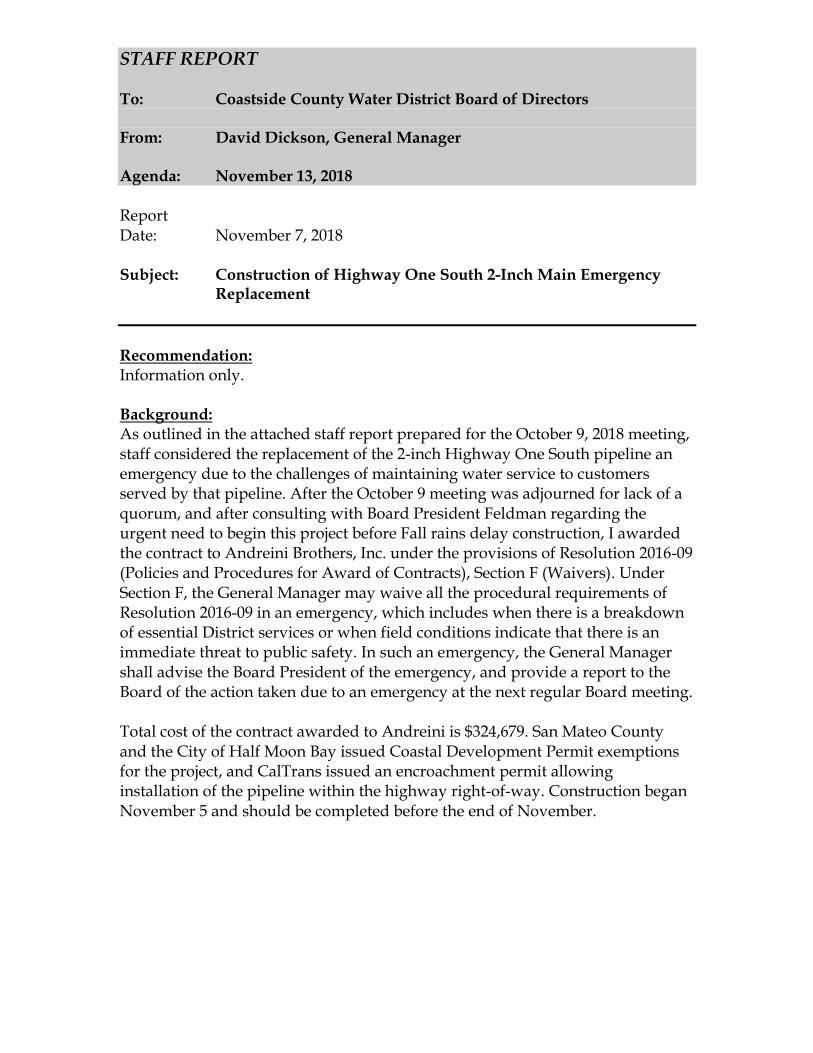
STAFF REPORT To: Coastside County Water District Board of Directors From: David Dickson, General Manager Agenda: November 13, 2018 Report Date: November 7, 2018 Subject: Construction of Highway One South 2-Inch Main Emergency
Replacement
Recommendation: Information only. Background: As outlined in the attached staff report prepared for the October 9, 2018 meeting, staff considered the replacement of the 2-inch Highway One South pipeline an emergency due to the challenges of maintaining water service to customers served by that pipeline. After the October 9 meeting was adjourned for lack of a quorum, and after consulting with Board President Feldman regarding the urgent need to begin this project before Fall rains delay construction, I awarded the contract to Andreini Brothers, Inc. under the provisions of Resolution 2016-09 (Policies and Procedures for Award of Contracts), Section F (Waivers). Under Section F, the General Manager may waive all the procedural requirements of Resolution 2016-09 in an emergency, which includes when there is a breakdown of essential District services or when field conditions indicate that there is an immediate threat to public safety. In such an emergency, the General Manager shall advise the Board President of the emergency, and provide a report to the Board of the action taken due to an emergency at the next regular Board meeting. Total cost of the contract awarded to Andreini is $324,679. San Mateo County and the City of Half Moon Bay issued Coastal Development Permit exemptions for the project, and CalTrans issued an encroachment permit allowing installation of the pipeline within the highway right-of-way. Construction began November 5 and should be completed before the end of November.
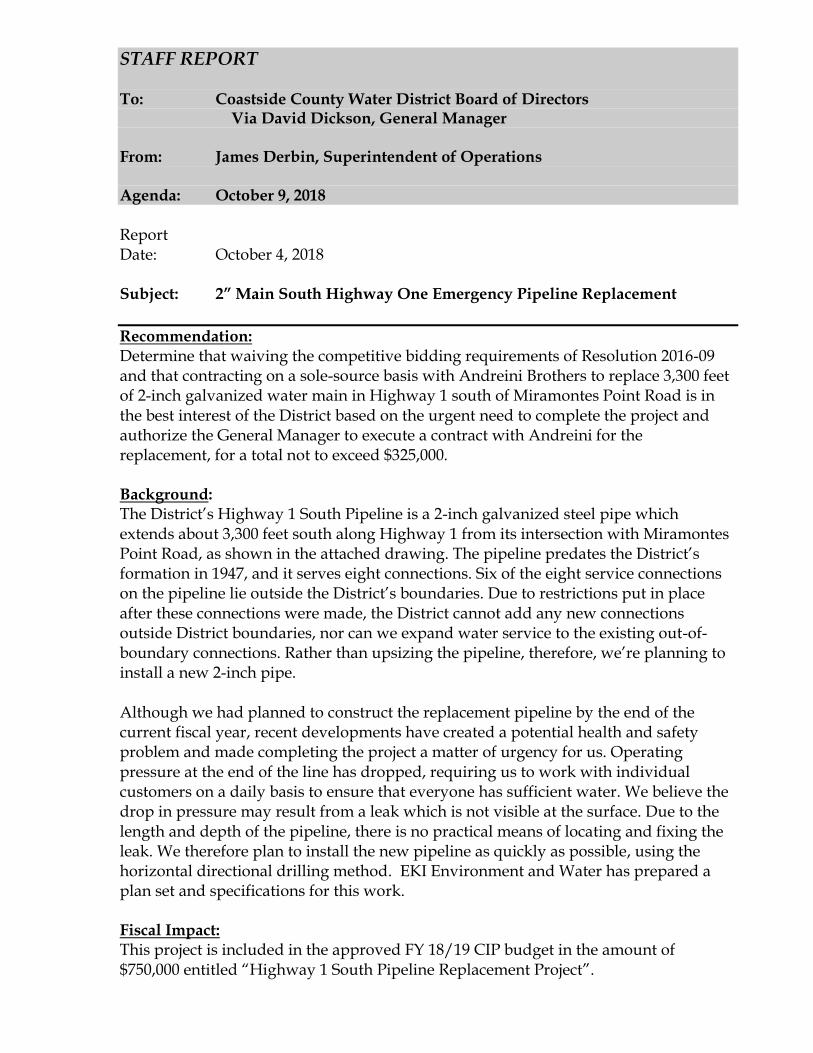
STAFF REPORT To: Coastside County Water District Board of Directors Via David Dickson, General Manager From: James Derbin, Superintendent of Operations Agenda: October 9, 2018 Report Date: October 4, 2018 Subject: 2” Main South Highway One Emergency Pipeline Replacement
Recommendation: Determine that waiving the competitive bidding requirements of Resolution 2016-09 and that contracting on a sole-source basis with Andreini Brothers to replace 3,300 feet of 2-inch galvanized water main in Highway 1 south of Miramontes Point Road is in the best interest of the District based on the urgent need to complete the project and authorize the General Manager to execute a contract with Andreini for the replacement, for a total not to exceed $325,000. Background: The District’s Highway 1 South Pipeline is a 2-inch galvanized steel pipe which extends about 3,300 feet south along Highway 1 from its intersection with Miramontes Point Road, as shown in the attached drawing. The pipeline predates the District’s formation in 1947, and it serves eight connections. Six of the eight service connections on the pipeline lie outside the District’s boundaries. Due to restrictions put in place after these connections were made, the District cannot add any new connections outside District boundaries, nor can we expand water service to the existing out-of-boundary connections. Rather than upsizing the pipeline, therefore, we’re planning to install a new 2-inch pipe. Although we had planned to construct the replacement pipeline by the end of the current fiscal year, recent developments have created a potential health and safety problem and made completing the project a matter of urgency for us. Operating pressure at the end of the line has dropped, requiring us to work with individual customers on a daily basis to ensure that everyone has sufficient water. We believe the drop in pressure may result from a leak which is not visible at the surface. Due to the length and depth of the pipeline, there is no practical means of locating and fixing the leak. We therefore plan to install the new pipeline as quickly as possible, using the horizontal directional drilling method. EKI Environment and Water has prepared a plan set and specifications for this work. Fiscal Impact: This project is included in the approved FY 18/19 CIP budget in the amount of $750,000 entitled “Highway 1 South Pipeline Replacement Project”.
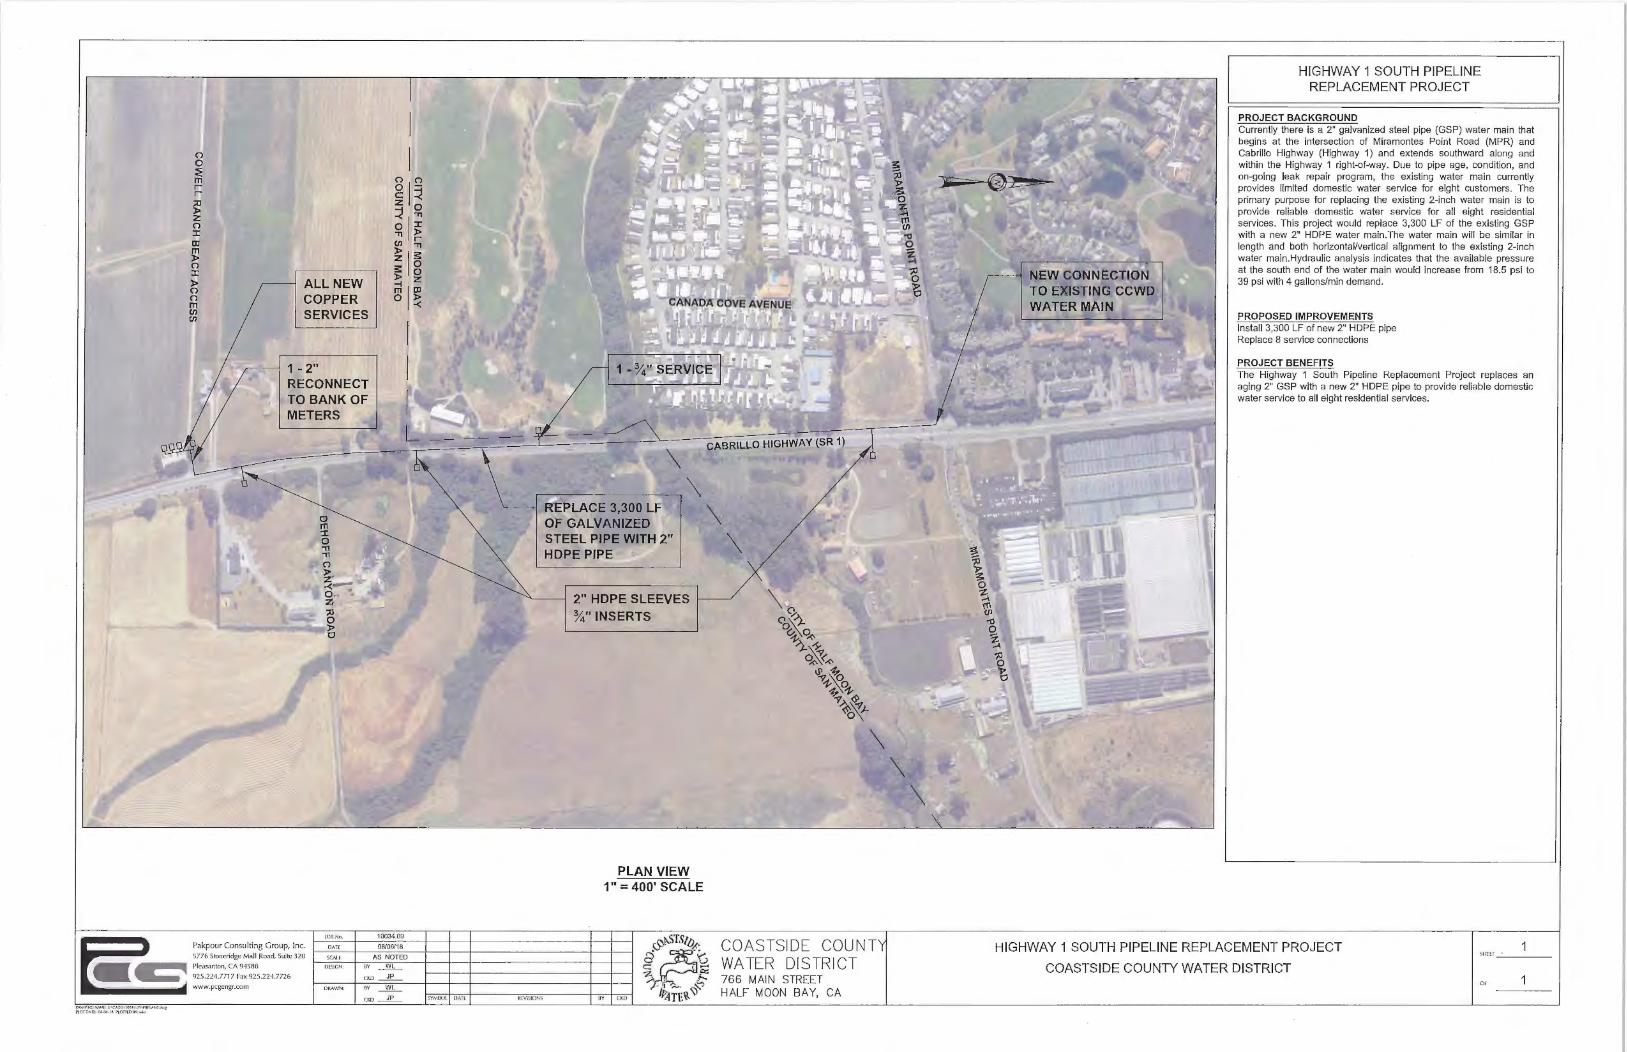
n 0 ~ m r r
~ z n :r m m )> n :r )> n 0 m en en
ALL NEW COPPER SERVICES
1 -2" RECONNECT TO BANK OF METERS
JOB No.
DATE
SCALE
glQ c: ~ z 0
~I,, 0 :r ,, )>
en ~ )> I :I: z 0 :I: 0 ~ z mlm 0 ~
10034.09
08106/1 8
AS NOTED
Pakpour Consul ting Group, Inc. 5776 Stoneridge Ma ll Road, Suite 320
Pleasanton, CA 94588
925.224.7717 Fax 925.224.7726
www.pcgengr.com
DESIGN: BY ~
CKD -1.E'._
DRAWN:
SYMBOL DATE
\ r--=------ \
REVISIONS
R PLACE 3,300 LF OF GALVANIZED STEEL PIPE WITH 2" HOPE PIPE
2" HOPE SLEEVES %"INSERTS
PLAN VIEW 1" = 400' SCALE
BY CKD
CABRILLO HIGHWAY (SR 1)
\ \
\
COASTSIDE COUNT WATER DISTRICT 766 MAIN STREET HALF MOON BAY, CA
\ \
HIGHWAY 1 SOUTH PIPELINE REPLACEMENT PROJECT
PROJECT BACKGROUND Currently there is a 2" galvanized steel pipe (GSP) water main that begins at the intersection of Miramontes Point Road (MPR) and Cabrillo Highway (Highway 1) and extends southward along and within the Highway 1 right-of-way. Due to pipe age, condition , and on-going leak repair program, the existing water main currently provides limited domestic water service for eight customers. The primary purpose for replacing the existing 2-inch water main is to provide reliable domestic water service for all eight residential services. This project would replace 3,300 LF of the existing GSP with a new 2" HDPE water main.The water main will be similar in length and both horizontal/vertical alignment to the existing 2-inch water main.Hydraulic analysis indicates that the available pressure at the south end of the water main would increase from 18.5 psi to 39 psi with 4 gallons/min demand.
PROPOSED IMPROVEMENTS Install 3,300 LF of new 2" HOPE pipe Replace 8 service connections
PROJECT BENEFITS The Highway 1 South Pipeline Replacement Project replaces an aging 2" GSP with a new 2" HDPE pipe to provide reliable domestic water service to all eight residential services.
HIGHWAY 1 SOUTH PIPELINE REPLACEMENT PROJECT
COASTSIDE COUNTY WATER DISTRICT
SHEET ___ _
OF
STAFF REPORT To: Coastside County Water District Board of Directors From: David Dickson, General Manager Agenda: November 13, 2018 Report Date: November 7, 2013 Subject: Agreement with Pakpour Consulting Group to Provide Plans and
Specifications for the Alves Tank Improvements Recommendation: Authorize the General Manager to enter into a Professional Services Agreement with Pakpour Consulting Group, Inc. to prepare plans and specifications for the Alves Tank Improvements at a time-and-materials cost not to exceed $69,886. Background: The District’s 2 million-gallon Alves Tank, constructed in 1970, has never been recoated and requires recoating and repair. In preparation for the project, the District retained Cornerstone Structural Engineering Group (Cornerstone) to perform a seismic evaluation of the tank and to recommend a retrofit strategy which will bring the tank up to current seismic standards. Pakpour Consulting Group (Pakpour) coordinated Cornerstone’s efforts and assisted with development of retrofit options and cost estimates. Cornerstone’s report, included as Attachment A, concludes that “Due to insufficient freeboard, the Alves water tank is anticipated to be severely damaged, with a potential loss of contents and damage to the roof framing and shell during the design level earthquake.” The report identifies several repair/retrofit strategies, with estimated costs ranging from $950,000 to $2.1 million. The least expensive approach, identified in the Cornerstone report as Option 1, reduces seismic stresses caused by earthquake-induced sloshing in the tank by lowering the water level from 23.0 feet to 17.5 feet. At the lower water level, the seismic wave in the tank will not interact with the roof structure. Lowering the water level to 17.5 feet reduces the tank’s capacity from 2 million gallons to about 1.5 million gallons. Based on discussions with Pakpour and Cornerstone, staff has focused on Option 1 as the best approach. Hydraulic modeling performed by West Yost Associates confirmed that, due to Alves Tank’s low elevation relative to other tanks, the tank is not needed to provide water to the distribution system except under extreme conditions that drop system-wide pressure to very low levels. We
STAFF REPORT Agenda: November 13, 2018 Subject: Agreement with Pakpour Consulting Group for Alves Tank Page Two___________________________________________________________________ believe, therefore, that the reduction in storage volume required by Option 1 would be acceptable. In addition, the lower volume mitigates water quality problems resulting from low turnover of the water stored in Alves. At staff’s request, Pakpour has provided a proposal, included as Attachment B, to prepare plans and specifications for the Alves Tank Improvements. The cost for the design is about $70,000 – in line with design costs for previous tank projects. We recommend retaining Pakpour to provide these services. Fiscal Impact: Design cost of $70,000. The approved FY19-FY28 CIP includes $2.1 million in funding for this project in FY19 and FY20.
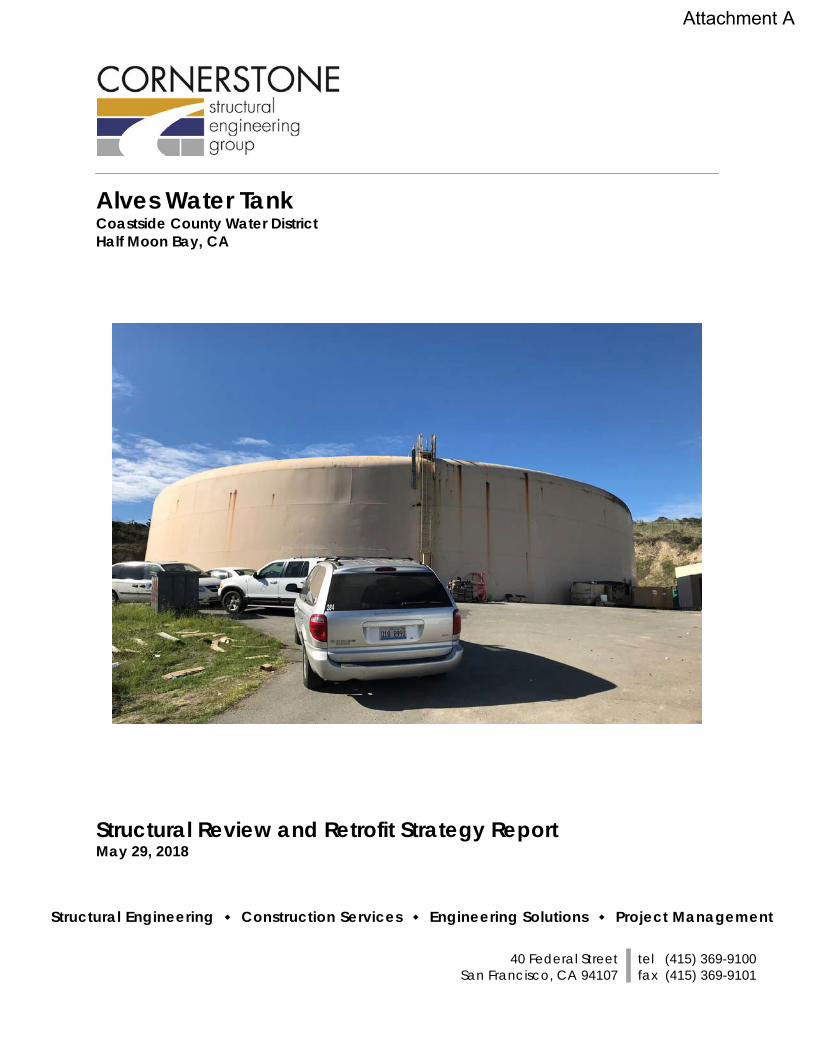
Structural Engineering ٠ Construction Services ٠ Engineering Solutions ٠ Project Management
Alves Water Tank Coastside County Water District Half Moon Bay, CA Structural Review and Retrofit Strategy Report May 29, 2018
40 Federal Street San Francisco, CA 94107
tel (415) 369-9100 fax (415) 369-9101
Attachment A
www.cseg.com
40 Federal Street San Francisco, CA 94107
tel (415) 369-9100 fax (415) 369-9101
May 29, 2018 2018008 Coastside County Water District 766 Main Street Half Moon Bay, CA 94019 Attention: David Dickson Subject: Alves Water Tank Structural Review and Retrofit Strategy Report Dear David: Cornerstone Structural Engineering Group is pleased to present this summary of our structural review and retrofit strategy report. In accordance with our proposal, we have performed a general structural conditional and seismic assessment of the Alves water tank. This report contains an evaluation for the existing 2,000,000 gallon steel water tank located on the Alves Tank site in Half Moon Bay. Originally constructed in approximately 1970, the Alves Tank is approximately 25 feet 6 inches tall by 120 feet in diameter. The structural provisions of the current California Building Code refer to the ASCE 7-10 standard for determination of design loads for structures designed within California. ASCE 7-10 in turn refers to the AWWA D100-11 standard for analysis and design of welded steel water storage tanks. This report uses those criteria to evaluate the seismic performance of the existing steel water tank. In addition, a general conditional assessment of the water tanks is also included. We conducted an initial site visit on June 1, 2017 with subsequent site visit on February 14, 2018. Detailed shop drawing plans by Chicago Bridge & Iron Company and an existing soils report by Lowney-Kaldveer Associates for the Alves Tank were made available and reviewed as part of our investigation. The following report describes the findings of our conditional review and seismic risk assessment to evaluate the performance of the steel water tank when subjected to a current code-level earthquake. Recommendations to address conditional issues and remediate seismic deficiencies are described in the conclusions. Please feel free to give me a call if you have any additional questions. Sincerely, CORNERSTONE STRUCTURAL ENGINEERING GROUP, INC. Thomas L. Swayze, S.E. Principal
Attachment A
1 of 24
Alves Water Tank Structural Assessment
TABLE OF CONTENTS
PART 1: INTRODUCTION ............................................................................................................................ 2
PART 2: SEISMIC PERFORMANCE EVALUATION ....................................................................................... 3
2.1 Methodology .................................................................................................................................... 3 2.2 Seismic Use Group ............................................................................................................................ 4 2.3 Seismic Source .................................................................................................................................. 4
PART 3: WATER TANK EVALUATION .......................................................................................................... 5
3.1 Documentation ................................................................................................................................ 5 3.2 Evaluation Criteria ............................................................................................................................ 5 3.3 Construction ...................................................................................................................................... 6 3.4 Conditional Issues ............................................................................................................................. 8 3.5 Lateral Load System ......................................................................................................................... 8 3.6 Expected Performance ................................................................................................................... 9
PART 4: SUMMARY .................................................................................................................................. 10
4.1 Findings ............................................................................................................................................ 10 4.2 General Recommendations for Conditional Issues .................................................................. 10 4.3 Seismic Recommendations .......................................................................................................... 10 4.4 Painting ............................................................................................................................................ 14 4.5 Cost Estimate .................................................................................................................................. 14 4.6 Summary .......................................................................................................................................... 17
PART 5: APPENDIX ................................................................................................................................... 18
PART 6: RETROFIT SKETCHES .............................................................. ERROR! BOOKMARK NOT DEFINED.
Attachment A
2 of 24
Alves Water Tank Structural Assessment
PART 1: INTRODUCTION
This evaluation represents a general structural conditional and seismic assessment of the existing Alves tank located on Miramontes Point Road in Half Moon Bay, California. The Alves tank is owned, operated, and maintained by Coastside County Water District.
Figure 1: Alves Tank Site Area Photo (Source: Google Maps)
Figure 2: Alves Tank Site Photo
(Source: Google Earth)
Alves Tank Site
N
N
Attachment A
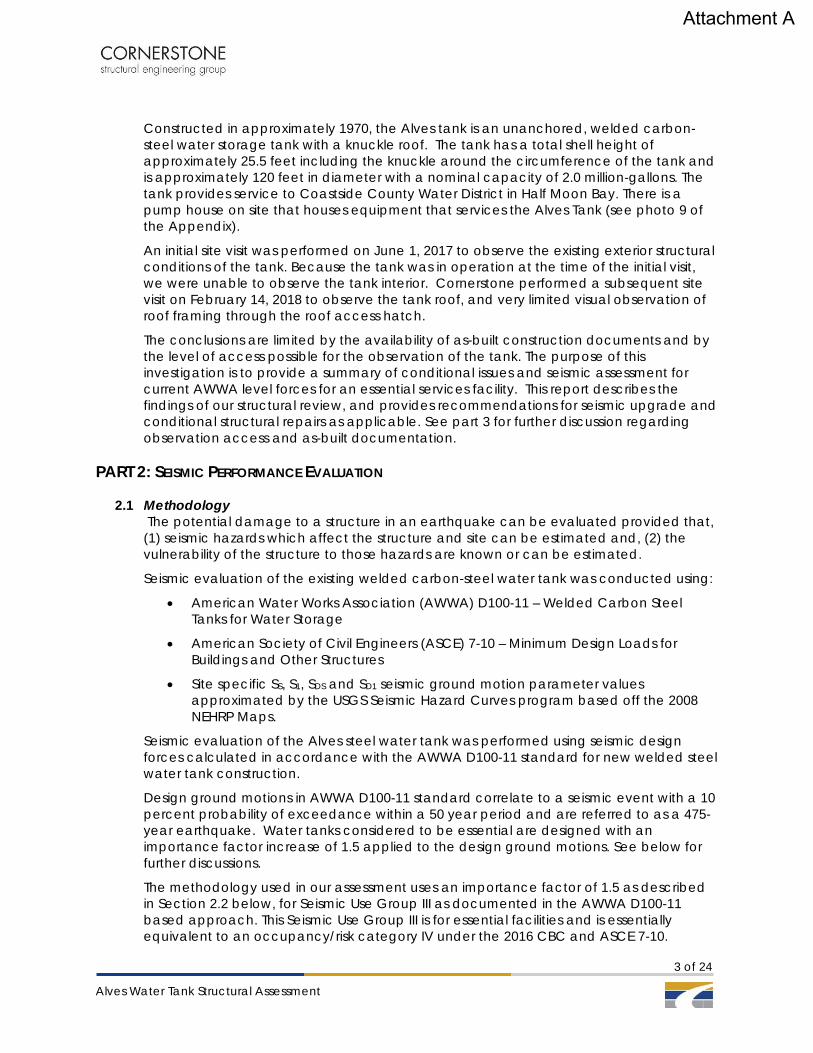
3 of 24
Alves Water Tank Structural Assessment
Constructed in approximately 1970, the Alves tank is an unanchored, welded carbon-steel water storage tank with a knuckle roof. The tank has a total shell height of approximately 25.5 feet including the knuckle around the circumference of the tank and is approximately 120 feet in diameter with a nominal capacity of 2.0 million-gallons. The tank provides service to Coastside County Water District in Half Moon Bay. There is a pump house on site that houses equipment that services the Alves Tank (see photo 9 of the Appendix).
An initial site visit was performed on June 1, 2017 to observe the existing exterior structural conditions of the tank. Because the tank was in operation at the time of the initial visit, we were unable to observe the tank interior. Cornerstone performed a subsequent site visit on February 14, 2018 to observe the tank roof, and very limited visual observation of roof framing through the roof access hatch.
The conclusions are limited by the availability of as-built construction documents and by the level of access possible for the observation of the tank. The purpose of this investigation is to provide a summary of conditional issues and seismic assessment for current AWWA level forces for an essential services facility. This report describes the findings of our structural review, and provides recommendations for seismic upgrade and conditional structural repairs as applicable. See part 3 for further discussion regarding observation access and as-built documentation.
PART 2: SEISMIC PERFORMANCE EVALUATION
2.1 Methodology The potential damage to a structure in an earthquake can be evaluated provided that, (1) seismic hazards which affect the structure and site can be estimated and, (2) the vulnerability of the structure to those hazards are known or can be estimated.
Seismic evaluation of the existing welded carbon-steel water tank was conducted using:
American Water Works Association (AWWA) D100-11 – Welded Carbon Steel Tanks for Water Storage
American Society of Civil Engineers (ASCE) 7-10 – Minimum Design Loads for Buildings and Other Structures
Site specific SS, S1, SDS and SD1 seismic ground motion parameter values approximated by the USGS Seismic Hazard Curves program based off the 2008 NEHRP Maps.
Seismic evaluation of the Alves steel water tank was performed using seismic design forces calculated in accordance with the AWWA D100-11 standard for new welded steel water tank construction.
Design ground motions in AWWA D100-11 standard correlate to a seismic event with a 10 percent probability of exceedance within a 50 year period and are referred to as a 475-year earthquake. Water tanks considered to be essential are designed with an importance factor increase of 1.5 applied to the design ground motions. See below for further discussions.
The methodology used in our assessment uses an importance factor of 1.5 as described in Section 2.2 below, for Seismic Use Group III as documented in the AWWA D100-11 based approach. This Seismic Use Group III is for essential facilities and is essentially equivalent to an occupancy/risk category IV under the 2016 CBC and ASCE 7-10.
Attachment A
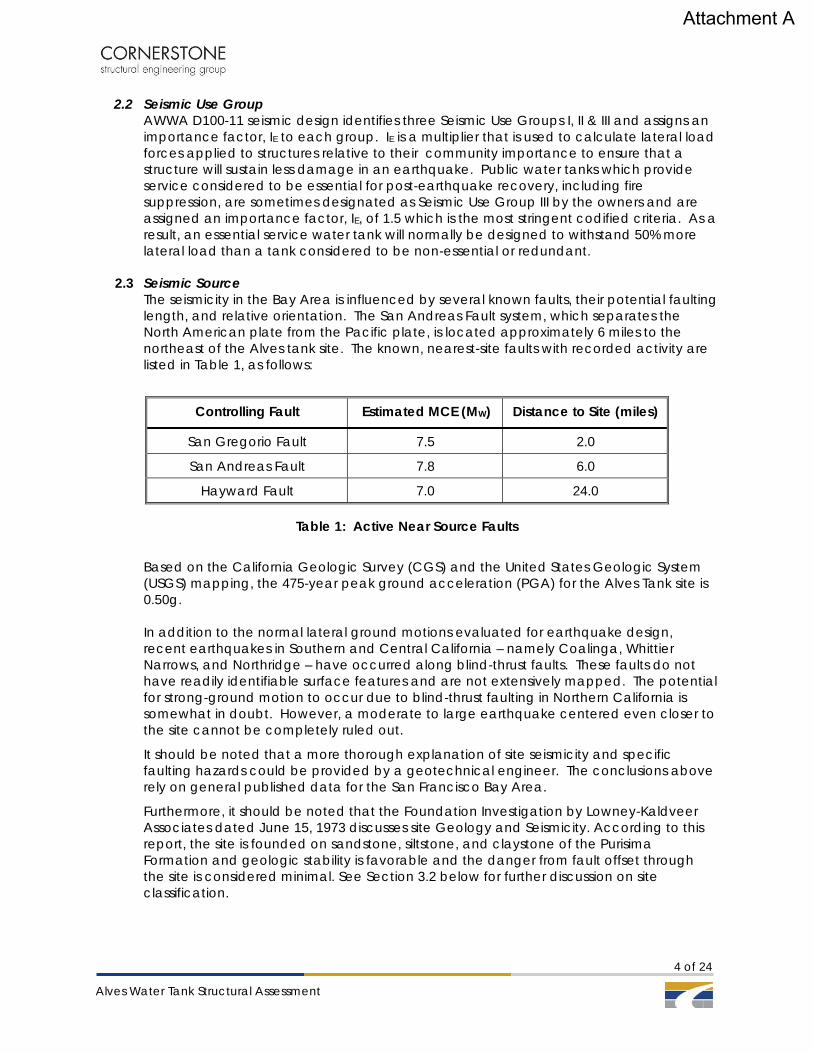
4 of 24
Alves Water Tank Structural Assessment
2.2 Seismic Use Group AWWA D100-11 seismic design identifies three Seismic Use Groups I, II & III and assigns an importance factor, IE to each group. IE is a multiplier that is used to calculate lateral load forces applied to structures relative to their community importance to ensure that a structure will sustain less damage in an earthquake. Public water tanks which provide service considered to be essential for post-earthquake recovery, including fire suppression, are sometimes designated as Seismic Use Group III by the owners and are assigned an importance factor, IE, of 1.5 which is the most stringent codified criteria. As a result, an essential service water tank will normally be designed to withstand 50% more lateral load than a tank considered to be non-essential or redundant.
2.3 Seismic Source The seismicity in the Bay Area is influenced by several known faults, their potential faulting length, and relative orientation. The San Andreas Fault system, which separates the North American plate from the Pacific plate, is located approximately 6 miles to the northeast of the Alves tank site. The known, nearest-site faults with recorded activity are listed in Table 1, as follows:
Table 1: Active Near Source Faults
Based on the California Geologic Survey (CGS) and the United States Geologic System (USGS) mapping, the 475-year peak ground acceleration (PGA) for the Alves Tank site is 0.50g. In addition to the normal lateral ground motions evaluated for earthquake design, recent earthquakes in Southern and Central California – namely Coalinga, Whittier Narrows, and Northridge – have occurred along blind-thrust faults. These faults do not have readily identifiable surface features and are not extensively mapped. The potential for strong-ground motion to occur due to blind-thrust faulting in Northern California is somewhat in doubt. However, a moderate to large earthquake centered even closer to the site cannot be completely ruled out.
It should be noted that a more thorough explanation of site seismicity and specific faulting hazards could be provided by a geotechnical engineer. The conclusions above rely on general published data for the San Francisco Bay Area.
Furthermore, it should be noted that the Foundation Investigation by Lowney-Kaldveer Associates dated June 15, 1973 discusses site Geology and Seismicity. According to this report, the site is founded on sandstone, siltstone, and claystone of the Purisima Formation and geologic stability is favorable and the danger from fault offset through the site is considered minimal. See Section 3.2 below for further discussion on site classification.
Controlling Fault Estimated MCE (MW) Distance to Site (miles)
San Gregorio Fault 7.5 2.0
San Andreas Fault 7.8 6.0
Hayward Fault 7.0 24.0
Attachment A
5 of 24
Alves Water Tank Structural Assessment
PART 3: WATER TANK EVALUATION
3.1 Documentation Plans for the Construction of Alves tank prepared by Tudor Engineering Company
dated July 1973 were made available for evaluation from the District. These drawings indicated the overall dimensions of the tank, site grading, piping plans and foundation information. It should be noted that these plans use the name “Miramontes Storage Tank”. Coastside County Water District has confirmed that the name of the tank is “Alves” and “Miramontes” is the street where the tank is located.
A Foundation Investigation by Lowney-Kaldveer Associates dated June 15, 1973 was made available for evaluation from the District. This investigation includes site information such as soils, groundwater, and seismicity as well as recommendations including grading, drainage and foundations. Information documented in this report appears to be consistent with the Construction Plans noted above.
Steel tank shop drawings by Chicago Bridge & Iron Company dated July 7, 1973 were also made available. These documents include tank shell, roof plate, and base plate thicknesses, overflow information, structural framing information, and structural framing connection details. Supporting calculations were also provided.
An underwater inspection report performed by LiquiVision Technology in January 2008 was also made available. This report provides conditional assessment of the tank interior as well as exterior.
These documents were collectively used to evaluate the existing steel water tank and determine potential retrofits.
3.2 Evaluation Criteria Seismic evaluation of the steel water tank was performed using the AWWA D100-11 standard.
Alves tank is considered to be essential to maintain water service in the event of an earthquake; therefore, it was evaluated using an importance factor, IE of 1.5 (essential service).
Site specific soil classification and seismic parameters were not included in the Foundation Investigation by Lowney-Kaldveer Associates dated June 15, 1973, however description of subsurface conditions and boring logs indicate 3-5 feet of silty clay layer overlaying siltstone with relatively high blow counts. Normally, in the absence of site specific soil classification or seismic parameters, a site classification D is assumed as a default value in seismic assessments.
According to Table 20.3-1 of ASCE 7-10, the blow counts documented in the available geotechnical report correspond to a site class C and based on the USGS Soil Type and Shaking Hazard in the San Francisco Bay Area Map, the Alves tank site is located within a soil type C. Soil type C (soil profile for very dense soil and soft rock) was determined to be reasonable and was used for the Alves tank. USGS soil type C closely relates to site class C for design with the USGS ground motion data and ASCE 7 requirements. Seismic ground motion parameter values, derived from 2008 USGS hazard data in accordance with ASCE 7-10 (w/ March 2013 errata) for Site Class C, are listed in Table 2.
Attachment A
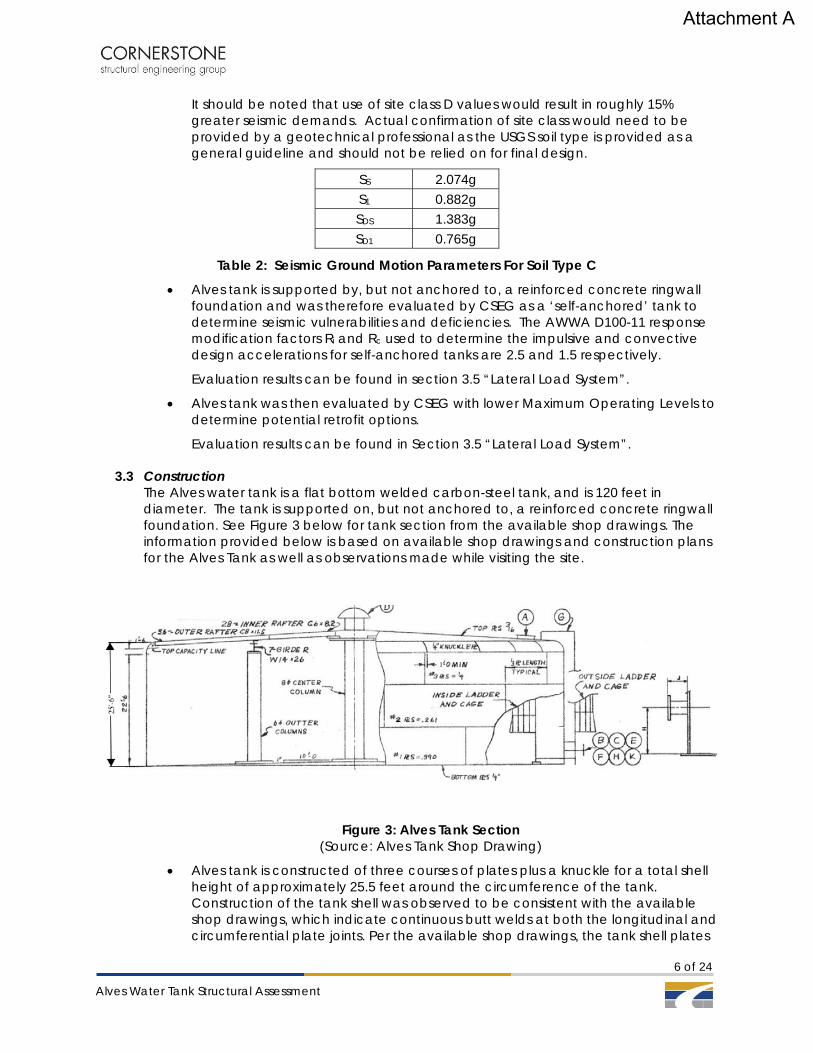
6 of 24
Alves Water Tank Structural Assessment
It should be noted that use of site class D values would result in roughly 15% greater seismic demands. Actual confirmation of site class would need to be provided by a geotechnical professional as the USGS soil type is provided as a general guideline and should not be relied on for final design.
SS 2.074g S1 0.882g SDS 1.383g SD1 0.765g
Table 2: Seismic Ground Motion Parameters For Soil Type C
Alves tank is supported by, but not anchored to, a reinforced concrete ringwall foundation and was therefore evaluated by CSEG as a ‘self-anchored’ tank to determine seismic vulnerabilities and deficiencies. The AWWA D100-11 response modification factors Ri and Rc used to determine the impulsive and convective design accelerations for self-anchored tanks are 2.5 and 1.5 respectively.
Evaluation results can be found in section 3.5 “Lateral Load System”.
Alves tank was then evaluated by CSEG with lower Maximum Operating Levels to determine potential retrofit options.
Evaluation results can be found in Section 3.5 “Lateral Load System”.
3.3 Construction The Alves water tank is a flat bottom welded carbon-steel tank, and is 120 feet in diameter. The tank is supported on, but not anchored to, a reinforced concrete ringwall foundation. See Figure 3 below for tank section from the available shop drawings. The information provided below is based on available shop drawings and construction plans for the Alves Tank as well as observations made while visiting the site.
Figure 3: Alves Tank Section
(Source: Alves Tank Shop Drawing)
Alves tank is constructed of three courses of plates plus a knuckle for a total shell height of approximately 25.5 feet around the circumference of the tank. Construction of the tank shell was observed to be consistent with the available shop drawings, which indicate continuous butt welds at both the longitudinal and circumferential plate joints. Per the available shop drawings, the tank shell plates
Attachment A
7 of 24
Alves Water Tank Structural Assessment
are specified as A131A, whereas the roof and bottom plates are specified as A283C. Course plate thicknesses and ASTM designation based on the shop drawings with corresponding yield strengths are shown in Table 3:
Table 3: As-Built Tank Plate Thicknesses for Alves Tank
Based on available shop drawings, the roof framing of the tank consists of an inner and outer bay of radial C8x and C6x rafters with an intermediate column supported girder ring. The outer bay of C8x11.5 rafters span approximately 30 feet from the tank shell to an intermediate ring of W14x26 girders. The inner bay of C6x8.2 rafters span from the W14x girders to a central 8 inch diameter column. The W14x intermediate girders are supported by 6 inch diameter interior columns spaced approximately 26 feet apart.
There are 1-½ inch by 1-½ inch angle stability braces located around the tank at approximate mid span of each rafter. There are also 3½ inch by 3½ inch angle diagonal braces at various locations throughout the tank. Based on discussions with a tank specialist, these diagonal braces were sometimes used to provide additional stability of rafters, particularly against spiraling or rolling.
The tank bottom plate was observed to extend approximately 2 inches beyond the exterior of the tank shell. The base of the shell is connected to the bottom plate with continuous interior and exterior fillet welds.
There is a 16-inch diameter inlet/outlet pipe supported by reinforcing plates on both sides of the tank shell that exits the tank through the tank shell near the tank bottom.
There is a 10-inch diameter interior overflow pipe that exits the tank through the tank shell near the tank bottom.
There is an approximately 1.5 foot deep by 1 foot wide reinforced concrete ringwall foundation that supports the tank. No anchorage from the tank to the ring walls is shown.
There is one 24-inch diameter access door and one 36-inch access door located on the tank near the bottom.
There is an exterior roof access ladder; however there is no interior ladder access.
There is an approximate 3 foot by 3.5 foot roof access hatch.
There is a 48” diameter mushroom roof vent with screen in the center of the tank roof.
The slope of the tank roof is approximately ¾ inch per 12 inches
The Alves tank site also has a pump house that appears to be a masonry building (likely fully grouted and reinforced) with a flexible wood roof diaphragm (see photo 9 of the
Location Inches ASTM Fy (Ksi) Roof Plate 0.1875 A283C 33.0
Knuckle Plate 0.25 A131A 31.9 Shell Course No. 3 0.25 A131A 31.9 Shell Course No. 2 0.261 A131A 31.9 Shell Course No. 1 0.390 A131A 31.9
Floor Plate 0.25 A283C 33.0
Attachment A
8 of 24
Alves Water Tank Structural Assessment
appendix). A conditional and cursory ASCE 41-13 Tier 1 checklist seismic evaluation for Life Safety was performed on the building to determine any potential seismic deficiencies based on some likely assumptions. See Section 3.5 for findings from this evaluation. As-built plans were not available for the evaluation of the pump house.
3.4 Conditional Issues The tank was in operation during our initial site visit, limiting observation to the exterior of the tank. During a second site visit, roof hatch access of the tank was provided which allowed us to look at the roof framing with a flashlight. Roof framing members near the hatch were visually observed, however measurements could only be taken from the outer bay rafters.
Based on our field visits, the existing tank appears to be in general compliance with the codes and standard construction practices in effect at the time of its construction.
The existing conditions observed during our site visits are as follows:
Corrosion of the bottom plate is evident in various locations along the perimeter of the tank, see photo 1.
Corrosion is evident on the exterior tank shell at various locations around the tank, see photo 2.
Localized areas of minor corrosion are evident on the tank roof, see photo 3.
The caulking along the top of the footing and the tank bottom plate has degraded and is starting to pull away leaving localized gaps between the footing and bottom plate, see photo 4.
Corrosion is evident around the perimeter of the roof vent, see photo 5.
Corrosion is evident on the roof hatch with two small holes visible in the hatch door, see photo 6.
3.5 Lateral Load System Lateral loads for the steel tank structure result primarily from either wind pressure acting upon the exterior tank surface or earthquake induced inertia forces acting on the tank structure and its contents. For our consideration, the seismic forces govern by a significant amount. The lateral-force resisting system consists solely of the cylindrical steel tank shell and floor plate which transfers lateral loads to the base of the tank by a combination of circumferential tension, shear, and vertical tension/compression shell stresses. Tank overturning and sliding forces are resisted with friction by the tank self-weight, including a portion of its contents to resist seismic forces.
Seismic evaluation of the existing tank with no modifications was performed based on a maximum operating water level of 23.0 feet per the direction from the District. The maximum operating level is one foot below the lip of the overflow.
The existing tank has sufficient self-weight to resist seismic sliding and overturning forces due to the design level earthquake load. The Demand to Capacity (D/C) ratio for seismic sliding is approximately 0.4 and for seismic overturning is approximately 0.5.
The tank shell thickness is overstressed in circumferential hoop tension stresses due to seismic loads with a maximum Demand to Capacity (D/C) ratio of approximately 1.35.
Attachment A
9 of 24
Alves Water Tank Structural Assessment
The tank has adequate shell thickness to resist longitudinal compression stresses due to design level earthquake loads with a Demand to Capacity (D/C) ratio of 0.21.
The overturning ratio, “J”, is calculated to be less than 0.785, meaning there is no shell uplift and therefore Alves tank is considered to be considered self-anchored under its own weight.
The height between bottom of the existing roof rafters at their lowest point and the surface of water at maximum capacity is less than 2 feet (this is the existing freeboard). The calculated freeboard height to accommodate earthquake wave sloshing is 8.5 feet for the Alves tank. At a maximum operating level (MOL) of 23.0 feet, wave sloshing due to earthquake forces will cause significant uplift damage to roof plate, knuckle plate, shell and/or roof framing during the design level earthquake considered for essential service facilities.
Findings for the Pump House Building
Based on the ASCE 41 Tier 1 review, the following items are of significance for the performance of buildings when subjected to strong ground motions during an earthquake. With no as-built drawings, the following items cannot be confirmed without destructive removal of finishes and further testing:
Positive Features
Foundations show little to no signs of significant settlement or distress.
Reinforced masonry walls are within allowable shear stress limits (fully grouted assumed).
Negative Features and Unconfirmed Construction Details
Fully grouted CMU walls: Based on similar buildings constructed in this era, the walls are most likely fully grouted (shear capacity assumed this).
Roof-to wall ties: Based on similar buildings constructed in this era, the roof-to-wall ties are likely either inadequate or missing entirely. Lack of positive wall anchor ties would rely only on cross grain bending of wood ledgers, which is an inefficient and code prohibited load mechanism.
Adequate shear transfer from the diaphragm into the shear walls as well as from the wall into the foundation. It is likely that this is moderately deficient.
Roof construction: it is assumed that the roof diaphragm consists of un-blocked plywood sheathing over 2x roof joists, which would be adequate.
3.6 Expected Performance
Due to insufficient freeboard, the Alves water tank is anticipated to be severely damaged, with a potential loss of contents and damage to the roof framing and shell during the design level earthquake. Options for limiting potential damage during an earthquake are discussed in Section 4.3 “Seismic Recommendations”.
The pump house is anticipated to perform below average in comparison to buildings of similar construction when subjected to a design level earthquake due primarily to the assumed inadequate roof-to-wall ties.
Attachment A

10 of 24
Alves Water Tank Structural Assessment
PART 4: SUMMARY
Findings within this report provide a general structural conditional and seismic assessment of the Alves water tank located in Half Moon Bay, California. Alves tank is a flat bottomed, welded steel water tank constructed in approximately 1970. The tank has a total shell height of approximately 25.5 feet and is120 feet in diameter with a nominal capacity of 2.0 million gallons.
4.1 Findings Based on our review, the Alves water tank appears to be in general compliance with the codes and standard construction practices in effect at the time of its construction in 1970. However, the Alves water tank is not expected to resist a design level earthquake determined by the AWWA D100-11 criteria for tanks considered necessary for essential services. The following specific deficiencies are as noted:
Inadequate freeboard height to accommodate earthquake wave sloshing is likely to result in damage to roof plate and/ or roof framing, tank shell, roof framing attachments, and the floor plate at shell to bottom weld and column connections.
Inadequate shell thickness of bottom two courses to resist circumferential hoop tension stresses caused by the seismic event.
4.2 General Recommendations for Conditional Issues The following recommendations are provided to address issues concerning the general conditions outlined in this report:
Areas of localized rust and corrosion upon interior framing members, roof plate, and roof hatch should be cleaned and inspected during scheduled painting and maintenance. If more than 10% of the section is lost, then a repair detail should be developed. Roof hatch door should be replaced.
Areas of localized rust and corrosion on the tank bottom plate should be cut out and patched with new segments of floor plate if corrosion extends inside the tank. Further investigation of the corrosion on the floor slab should be conducted to determine extents.
Caulking along the top of the footing should be repaired/ replaced as necessary to close off localized gaps between the footing and the bottom plate.
4.3 Seismic Recommendations
Water Tank Seismic Recommendations
The following recommendation options are provided to address the seismic deficiency issues related to the water tank as outlined in this report. A variety of water levels have been evaluated to provide the District with potential retrofit options with different water operating levels. A loss of 85,000 gallons in water storage capacity will occur with every foot the water level is lowered:
Option 1: Provide greater freeboard by lowering the maximum operating level 5.5 feet (MOL) elevation to 17.5 feet so that the seismic wave will not interact with the roof framing, therefore strengthening is not required.
o If the Maximum Operating Level (MOL) is lowered from 23.0 feet by 5.5 feet down to 17.5 feet, the calculated freeboard will be greater than the sloshing wave height. This option requires no strengthening of roof framing for seismic wave sloshing. Also, this drop in water level lowers tension stresses at the
Attachment A
11 of 24
Alves Water Tank Structural Assessment
bottom of the tank to within acceptable limits. However, this option significantly diminishes the holding capacity of the tank by approximately 470,000 gallons or approximately 25% less than current capacity.
o This option requires door sheet to be cut and re-installed using the existing shell plate and work related to lowering the overflow cone to the required elevation.
o Anchorage to a concrete ring wall foundation is not required for this option.
o Based on our experience with similar tanks, repair/ replacement of roof rafters may be required following blast cleaning and thorough inspection of section loss due to corrosion.
o In addition to structural related items, it appears that the existing tank is due for a complete recoating to extend service life. The recoating of the tank will require extensive surface preparation.
Option 2: This is an intermediate solution. Provide greater freeboard by lowering the Maximum Operating Level 4 feet (MOL) to 19.0 feet so that the existing shell plates and roof plate are adequate and that the existing roof framing can remain in place and be strengthened.
o If the Maximum Operating Level (MOL) is lowered from 23.0 feet by 4.0 feet down to 19.0 feet, there will be approximately 6 feet of freeboard height provided. At this water level, the calculated wave sloshing height is approximately 8.0 feet. This will require strengthening of the outer bay roof rafters to resist 2.0 feet of hydrostatic upward pressure. This depth was selected for consideration because it is the highest the operating level that can be achieved without replacement or strengthening of the roof plate and because it would not require strengthening of inner bay rafters.
o The outer bay roof rafters will require strengthening of bottom flanges by welding on steel plates and bracing the bottom flange with transverse members (See concept Detail A shown in Sketch 1 of the Appendix). The roof plate can adequately resist these forces if the roof plate is welded to the roof rafters or by potentially installing slider clips that would be connected to the underside of the tank roof and hang underneath flanges of existing rafters. According to the available shop drawings, existing roof plate is welded to transverse angle brace and not each rafter. Conditional evaluation after blast cleaning may warrant full replacement of the outer rafters as a more economical solution.
o The W14x girders will require stability strengthening of bottom flanges by bracing of the bottom flange at mid-span by providing diagonals to outer bay rafter nearest the middle of the girder (See concept Detail B shown in Sketch 2 of the Appendix).
o The columns would need to be retrofitted to provide a greater resistance to uplift (See concept Detail C shown in Sketch 3 of the Appendix). The existing columns are welded to the bottom plate. This could be achieved by temporarily supporting the existing column and modifying the column base.
o Anchorage to a concrete ring wall foundation is not required for this option.
o Based on our experience with similar tanks, strengthening of interior roof rafters may also be required following blast cleaning and thorough inspection of section loss due to corrosion.
Attachment A
12 of 24
Alves Water Tank Structural Assessment
o In addition to structural related items, it appears that the existing tank is due for a complete recoating to extend service life. The recoating of the tank will require extensive surface preparation.
Option 3: Maintain current 23.0 feet water level elevation
o Option 3a: Replace the Tank with a new tank designed to the current AWWA D100-11 code.
If Maximum Operating Level (MOL) is desired to remain at the current 23.0 foot level, then the tank can be completely replaced with a new tank that will meet the required freeboard. The new tank would be taller than the existing.
Existing concrete ring wall foundation may be utilized to support the new tank
The plates for the new tank would be shop primed resulting in less surface preparation work compared to re-coating of the existing tank.
o Option 3b: Maintain current 23.0 feet water level elevation, increase the freeboard and mitigate the tank shell overstress by jacking the existing tank and adding a new lower course shell ring.
If Maximum Operating Level (MOL) is desired to remain at the current 23.0 foot level without replacing the tank or roof structure, the existing tank roof would need to be raised. This could be accomplished by jacking the existing tank up and installing a new first shell course and new columns to increase the freeboard of the tank and also provide adequate tensile stress capacity of the tank shell. The new first course ring would be thicker than existing shell plates and approximately 7.0 feet tall for a total tank height of approximately 32.5 feet. The calculated sloshing wave height is 8.5 feet, which is less than the calculated freeboard of approximately 9 feet; therefore strengthening of the roof would not be required. The increase in tank height will need to be reviewed by the District, Planning, and any other governing agencies.
Anchorage to a concrete ring wall foundation is not required for this option. Existing concrete ring wall foundation may be utilized to support the new bottom course shell of the altered tank.
The Alves tank site appears to be sufficient for the option of jacking the tank shell, with reasonable access around the perimeter of the tank.
Based on our experience with similar tanks, repair/ replacement of roof rafters may be required following blast cleaning and thorough inspection of section loss due to corrosion.
In addition to structural related items, it appears that the existing tank is due for a complete recoating to extend service life. The new bottom course will be shop primed, however the rest of the tank would require surface preparation in the field.
Issues considered that could affect jacking operations include access restrictions, material handling, and construction methods:
Attachment A
13 of 24
Alves Water Tank Structural Assessment
1. The new shell ring could be provided in standard lengths based on the site access available.
2. A jacking system would be temporarily installed around the tank circumference and be sized for the weight of the tank. In addition, each column on the interior of the tank would require a separate jack. Final determination would be made after detailed inspection of the structural configuration if the jacking option is selected.
3. The jacking process could potentially take several weeks, as horizontal welds will need to be applied by hand around the circumference of the tank instead of using an automated weld process normally used in new tank construction.
4. Existing manholes in the bottom shell could be left in place or removed and sealed with cover plates. New manholes would be built into the new bottom course.
o Option 3c: Maintain current 23.0 feet water level elevation, strengthen the roof framing and mitigate the tank shell overstress by installing a new external roof system and shell reinforcing plate at bottom two courses.
If Maximum Operating Level (MOL) is desired to remain at the current 23.0 foot level without replacing or jacking of the existing tank, the roof will need to be strengthened. Various tank manufacturers offer external roof systems that provide significant strength and resistance to wave pressures.
If tank dimensions and water level are left unchanged, strengthening plates would need to be provided around the bottom two shell courses where analysis indicates that shell plates are overstressed due to circumferential hoop tension. Since the tank is overstressed in the bottom two courses and a new bottom course is not being added, it was determined that this alternative is not economical compared to alternatives 3a and 3b.
Pump House Seismic Recommendations
The following recommendations are provided to address the seismic deficiency issues outlined in this report related to the pump house. These recommendations are based on assumptions made regarding the as-built condition of the roof framing. Assumptions should be confirmed with exploratory demolition of finishes and investigation of the roof framing and wall components prior to beginning retrofit work.
Based on our Tier 1 investigation summarized in section 3.5 above, it is likely that the roof-to-wall ties are either missing or are inadequate for the current seismic design codes. Removal and reinstallation of the ceiling will be required to install the new ties. Roof to wall ties will consist of tension tie rods drilled and epoxied through the existing masonry walls with holdown anchors installed on the sides of the roof joists. At locations where walls are parallel to the roof framing tension tie rods shall be installed through blocking in the outer 3 bays of framing with metal straps installed on top of the roof. Enhanced nailing on the roof sheathing will be required at the location of the tie rods. Removal and reinstallation of the roofing and ceiling has been included in the cost estimate as rough order of magnitude costs. Additional work to the roof diaphragm (plywood sheathing, additional nailing) may be required depending on what type of roof sheathing exists on
Attachment A
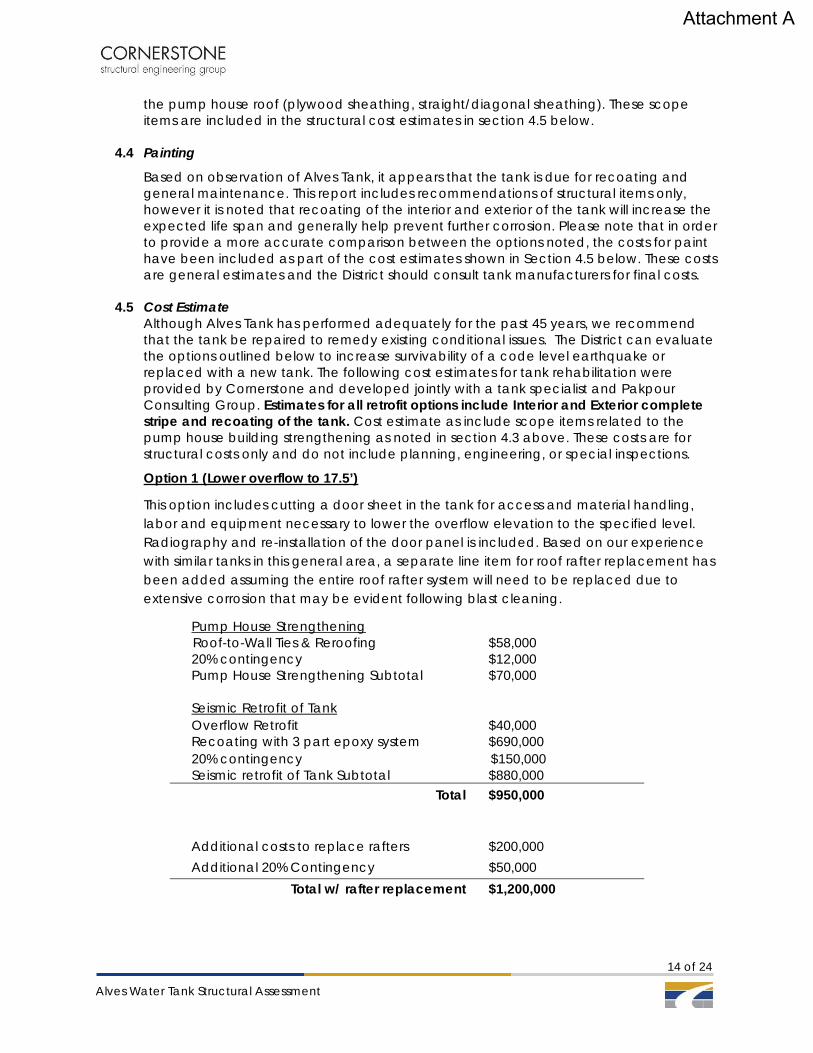
14 of 24
Alves Water Tank Structural Assessment
the pump house roof (plywood sheathing, straight/diagonal sheathing). These scope items are included in the structural cost estimates in section 4.5 below.
4.4 Painting
Based on observation of Alves Tank, it appears that the tank is due for recoating and general maintenance. This report includes recommendations of structural items only, however it is noted that recoating of the interior and exterior of the tank will increase the expected life span and generally help prevent further corrosion. Please note that in order to provide a more accurate comparison between the options noted, the costs for paint have been included as part of the cost estimates shown in Section 4.5 below. These costs are general estimates and the District should consult tank manufacturers for final costs.
4.5 Cost Estimate Although Alves Tank has performed adequately for the past 45 years, we recommend that the tank be repaired to remedy existing conditional issues. The District can evaluate the options outlined below to increase survivability of a code level earthquake or replaced with a new tank. The following cost estimates for tank rehabilitation were provided by Cornerstone and developed jointly with a tank specialist and Pakpour Consulting Group. Estimates for all retrofit options include Interior and Exterior complete stripe and recoating of the tank. Cost estimate as include scope items related to the pump house building strengthening as noted in section 4.3 above. These costs are for structural costs only and do not include planning, engineering, or special inspections.
Option 1 (Lower overflow to 17.5’)
This option includes cutting a door sheet in the tank for access and material handling, labor and equipment necessary to lower the overflow elevation to the specified level. Radiography and re-installation of the door panel is included. Based on our experience with similar tanks in this general area, a separate line item for roof rafter replacement has been added assuming the entire roof rafter system will need to be replaced due to extensive corrosion that may be evident following blast cleaning.
Pump House Strengthening Roof-to-Wall Ties & Reroofing
20% contingency Pump House Strengthening Subtotal Seismic Retrofit of Tank
$58,000 $12,000 $70,000
Overflow Retrofit Recoating with 3 part epoxy system
$40,000 $690,000
20% contingency Seismic retrofit of Tank Subtotal
$150,000 $880,000
Total $950,000
Additional costs to replace rafters $200,000 Additional 20% Contingency $50,000
Total w/ rafter replacement $1,200,000
Attachment A
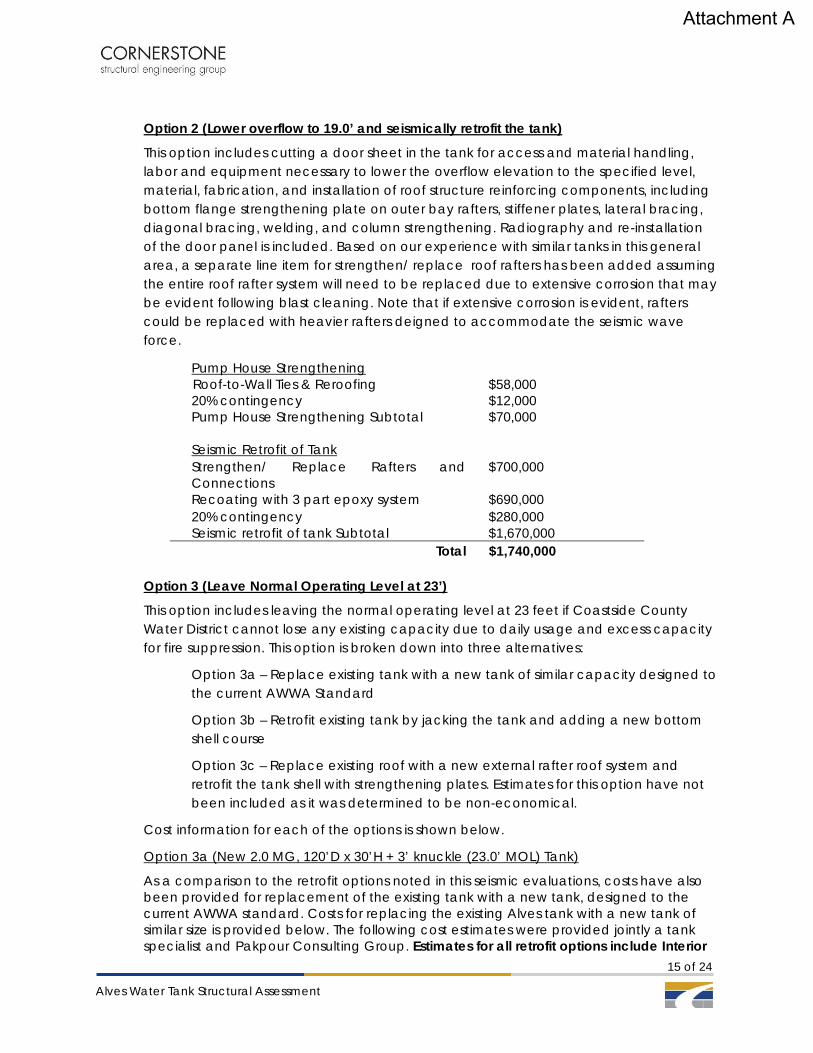
15 of 24
Alves Water Tank Structural Assessment
Option 2 (Lower overflow to 19.0’ and seismically retrofit the tank)
This option includes cutting a door sheet in the tank for access and material handling, labor and equipment necessary to lower the overflow elevation to the specified level, material, fabrication, and installation of roof structure reinforcing components, including bottom flange strengthening plate on outer bay rafters, stiffener plates, lateral bracing, diagonal bracing, welding, and column strengthening. Radiography and re-installation of the door panel is included. Based on our experience with similar tanks in this general area, a separate line item for strengthen/ replace roof rafters has been added assuming the entire roof rafter system will need to be replaced due to extensive corrosion that may be evident following blast cleaning. Note that if extensive corrosion is evident, rafters could be replaced with heavier rafters deigned to accommodate the seismic wave force.
Pump House Strengthening Roof-to-Wall Ties & Reroofing
20% contingency Pump House Strengthening Subtotal Seismic Retrofit of Tank
$58,000 $12,000 $70,000
Strengthen/ Replace Rafters and Connections Recoating with 3 part epoxy system
$700,000 $690,000
20% contingency Seismic retrofit of tank Subtotal
$280,000 $1,670,000
Total $1,740,000
Option 3 (Leave Normal Operating Level at 23’)
This option includes leaving the normal operating level at 23 feet if Coastside County Water District cannot lose any existing capacity due to daily usage and excess capacity for fire suppression. This option is broken down into three alternatives:
Option 3a – Replace existing tank with a new tank of similar capacity designed to the current AWWA Standard
Option 3b – Retrofit existing tank by jacking the tank and adding a new bottom shell course
Option 3c – Replace existing roof with a new external rafter roof system and retrofit the tank shell with strengthening plates. Estimates for this option have not been included as it was determined to be non-economical.
Cost information for each of the options is shown below.
Option 3a (New 2.0 MG, 120’D x 30’H + 3’ knuckle (23.0’ MOL) Tank)
As a comparison to the retrofit options noted in this seismic evaluations, costs have also been provided for replacement of the existing tank with a new tank, designed to the current AWWA standard. Costs for replacing the existing Alves tank with a new tank of similar size is provided below. The following cost estimates were provided jointly a tank specialist and Pakpour Consulting Group. Estimates for all retrofit options include Interior
Attachment A
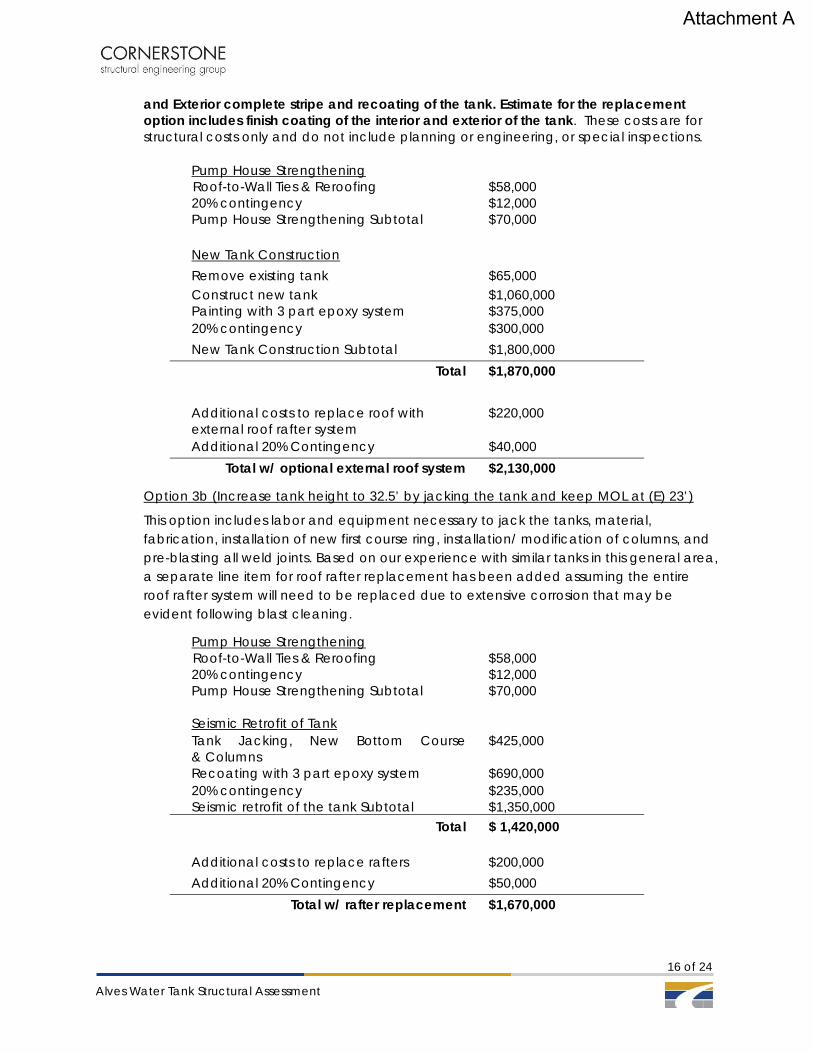
16 of 24
Alves Water Tank Structural Assessment
and Exterior complete stripe and recoating of the tank. Estimate for the replacement option includes finish coating of the interior and exterior of the tank. These costs are for structural costs only and do not include planning or engineering, or special inspections.
Pump House Strengthening
Roof-to-Wall Ties & Reroofing 20% contingency Pump House Strengthening Subtotal
$58,000 $12,000 $70,000
New Tank Construction Remove existing tank $65,000 Construct new tank Painting with 3 part epoxy system
$1,060,000 $375,000
20% contingency $300,000 New Tank Construction Subtotal $1,800,000
Total $1,870,000 Additional costs to replace roof with external roof rafter system
$220,000
Additional 20% Contingency $40,000 Total w/ optional external roof system $2,130,000
Option 3b (Increase tank height to 32.5’ by jacking the tank and keep MOL at (E) 23’)
This option includes labor and equipment necessary to jack the tanks, material, fabrication, installation of new first course ring, installation/ modification of columns, and pre-blasting all weld joints. Based on our experience with similar tanks in this general area, a separate line item for roof rafter replacement has been added assuming the entire roof rafter system will need to be replaced due to extensive corrosion that may be evident following blast cleaning.
Pump House Strengthening Roof-to-Wall Ties & Reroofing
20% contingency Pump House Strengthening Subtotal Seismic Retrofit of Tank
$58,000 $12,000 $70,000
Tank Jacking, New Bottom Course & Columns Recoating with 3 part epoxy system
$425,000 $690,000
20% contingency Seismic retrofit of the tank Subtotal
$235,000 $1,350,000
Total $ 1,420,000
Additional costs to replace rafters $200,000 Additional 20% Contingency $50,000
Total w/ rafter replacement $1,670,000
Attachment A
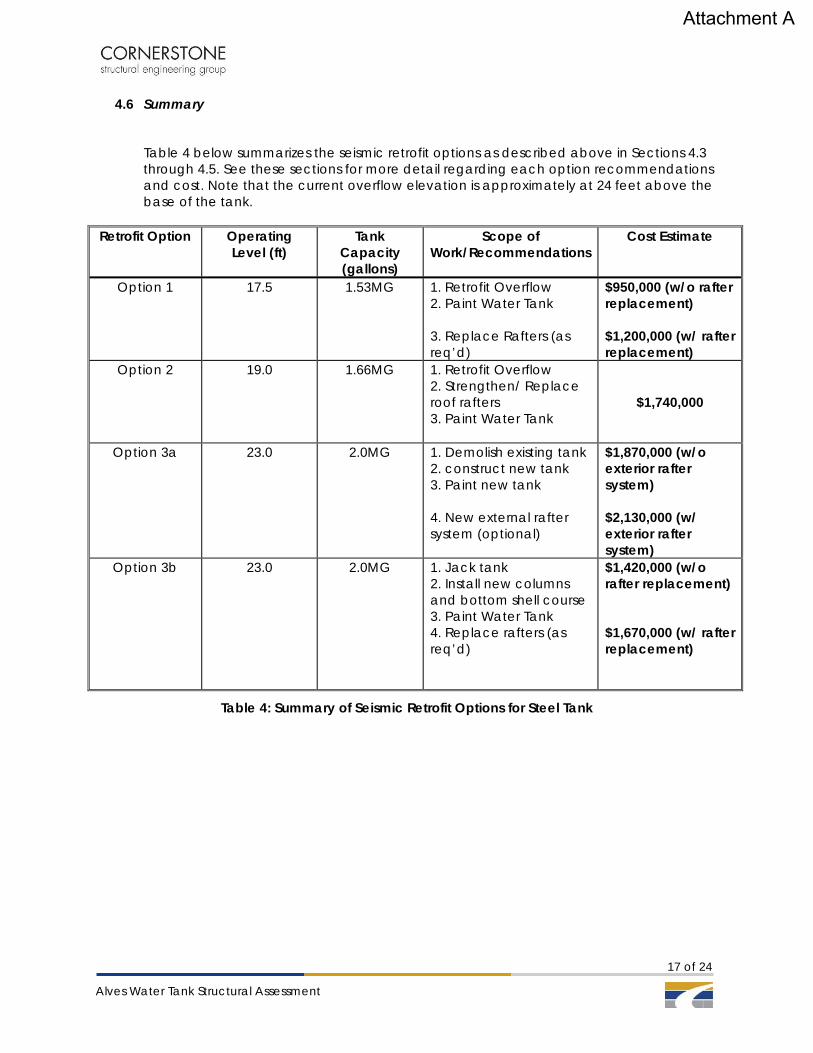
17 of 24
Alves Water Tank Structural Assessment
4.6 Summary
Table 4 below summarizes the seismic retrofit options as described above in Sections 4.3 through 4.5. See these sections for more detail regarding each option recommendations and cost. Note that the current overflow elevation is approximately at 24 feet above the base of the tank.
Retrofit Option Operating
Level (ft) Tank
Capacity (gallons)
Scope of Work/Recommendations
Cost Estimate
Option 1 17.5 1.53MG 1. Retrofit Overflow 2. Paint Water Tank 3. Replace Rafters (as req’d)
$950,000 (w/o rafter replacement) $1,200,000 (w/ rafter replacement)
Option 2 19.0 1.66MG 1. Retrofit Overflow 2. Strengthen/ Replace roof rafters 3. Paint Water Tank
$1,740,000
Option 3a 23.0 2.0MG 1. Demolish existing tank 2. construct new tank 3. Paint new tank 4. New external rafter system (optional)
$1,870,000 (w/o exterior rafter system) $2,130,000 (w/ exterior rafter system)
Option 3b 23.0 2.0MG 1. Jack tank 2. Install new columns and bottom shell course 3. Paint Water Tank 4. Replace rafters (as req’d)
$1,420,000 (w/o rafter replacement) $1,670,000 (w/ rafter replacement)
Table 4: Summary of Seismic Retrofit Options for Steel Tank
Attachment A
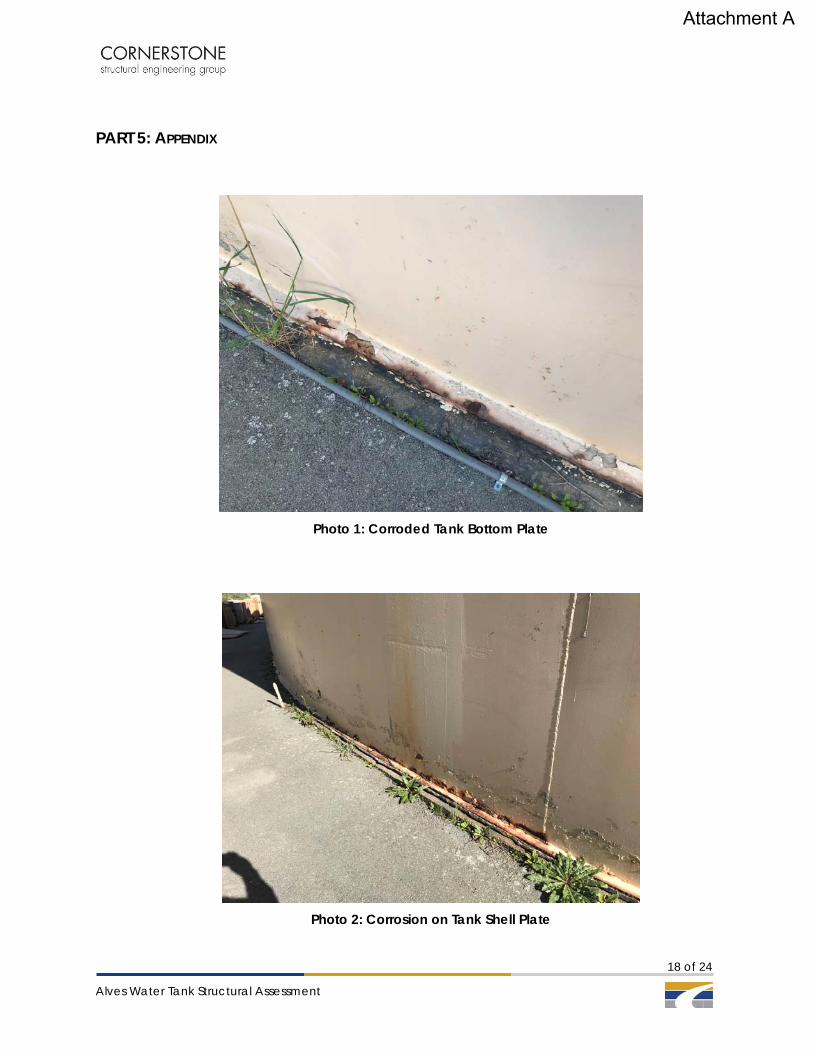
18 of 24
Alves Water Tank Structural Assessment
PART 5: APPENDIX
Photo 1: Corroded Tank Bottom Plate
Photo 2: Corrosion on Tank Shell Plate
Attachment A
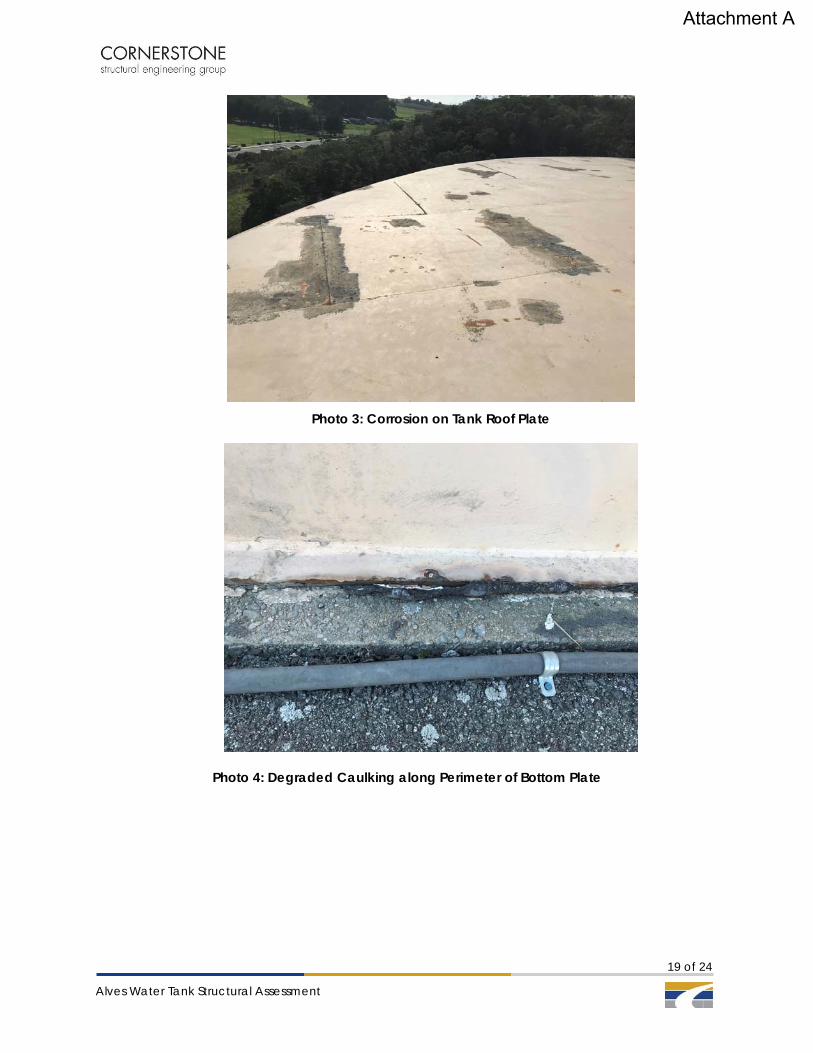
19 of 24
Alves Water Tank Structural Assessment
Photo 3: Corrosion on Tank Roof Plate
Photo 4: Degraded Caulking along Perimeter of Bottom Plate
Attachment A
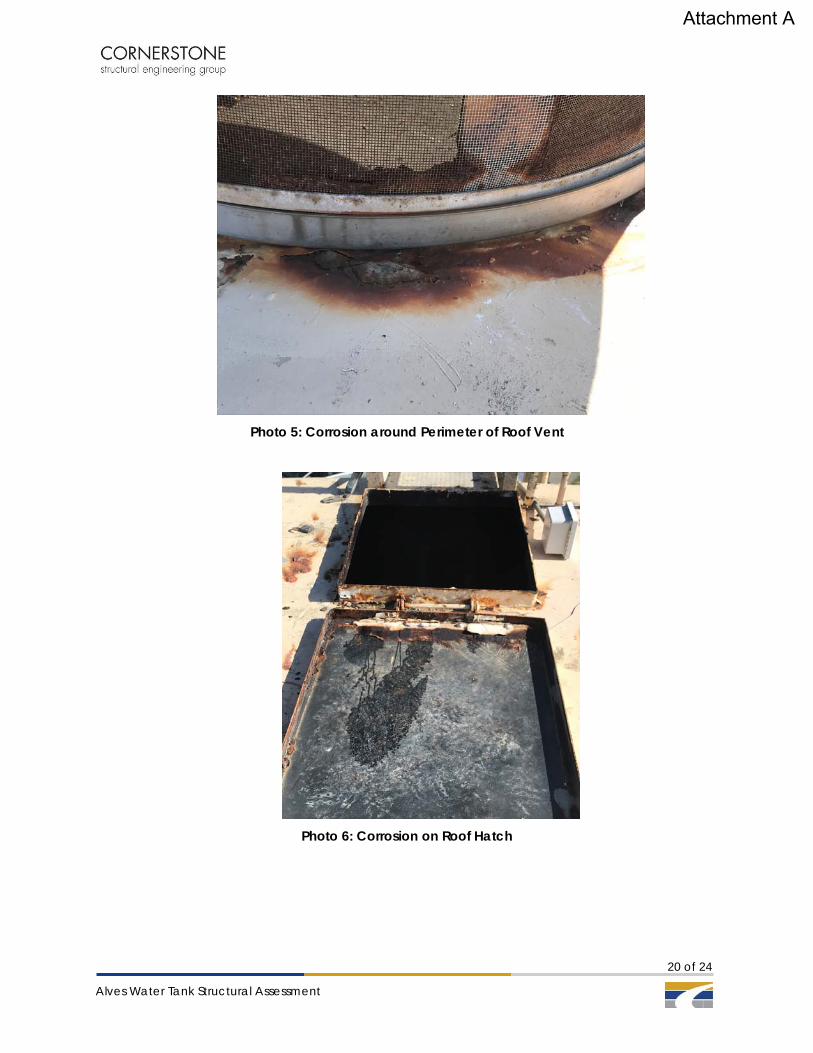
20 of 24
Alves Water Tank Structural Assessment
Photo 5: Corrosion around Perimeter of Roof Vent
Photo 6: Corrosion on Roof Hatch
Attachment A
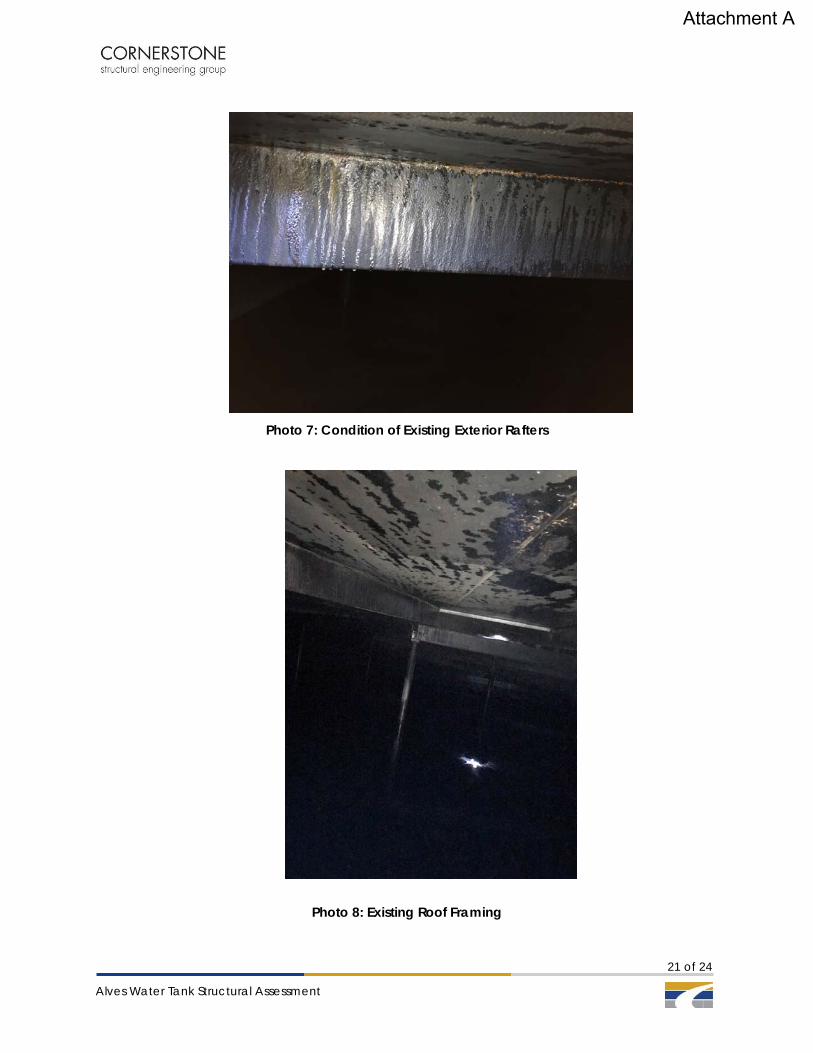
21 of 24
Alves Water Tank Structural Assessment
Photo 7: Condition of Existing Exterior Rafters
Photo 8: Existing Roof Framing
Attachment A
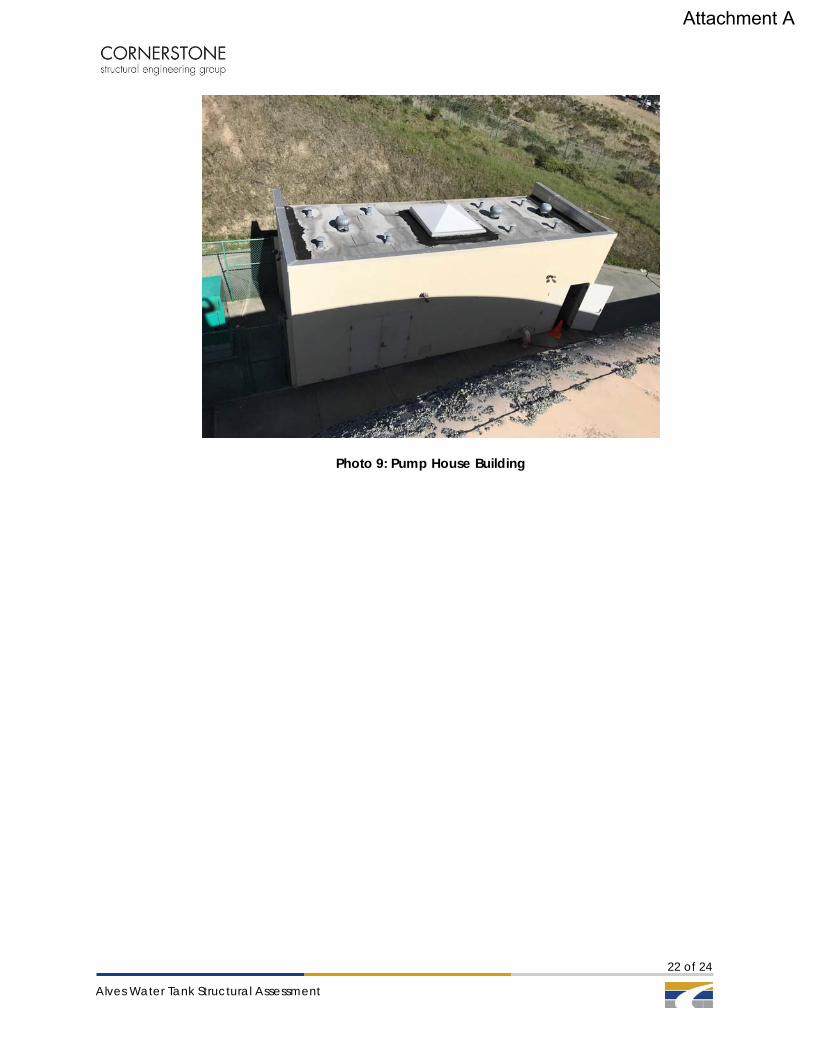
22 of 24
Alves Water Tank Structural Assessment
Photo 9: Pump House Building
Attachment A
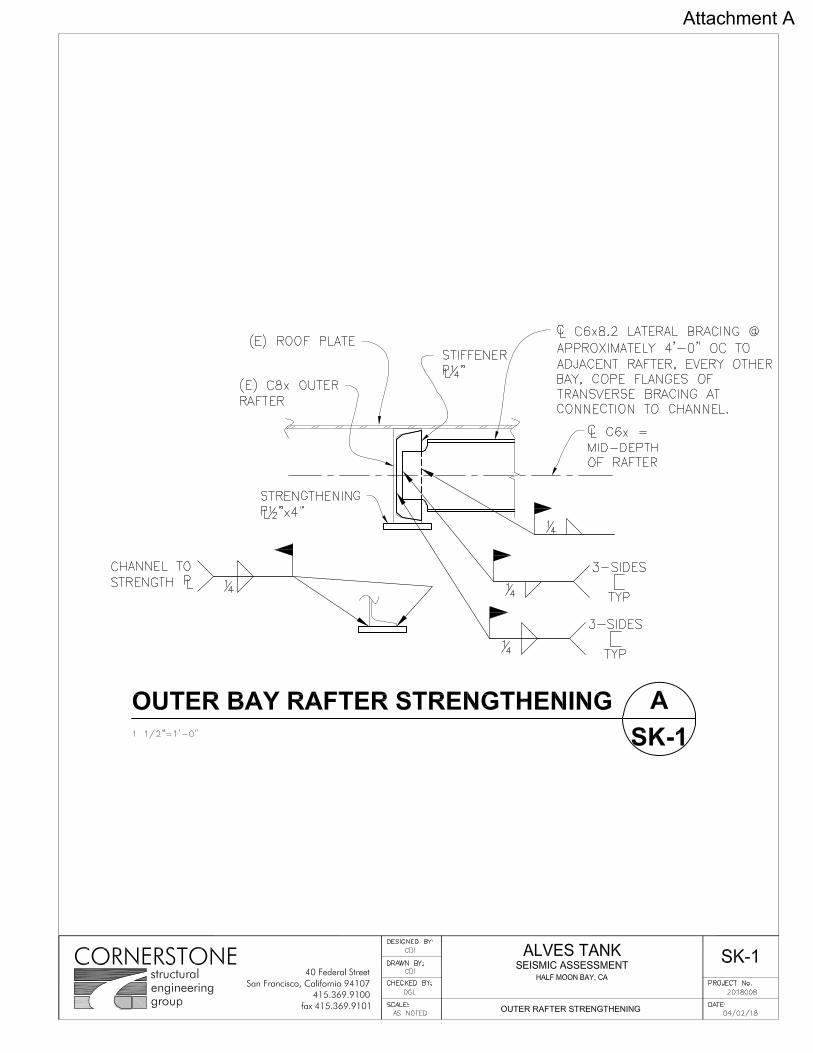
Attachment A
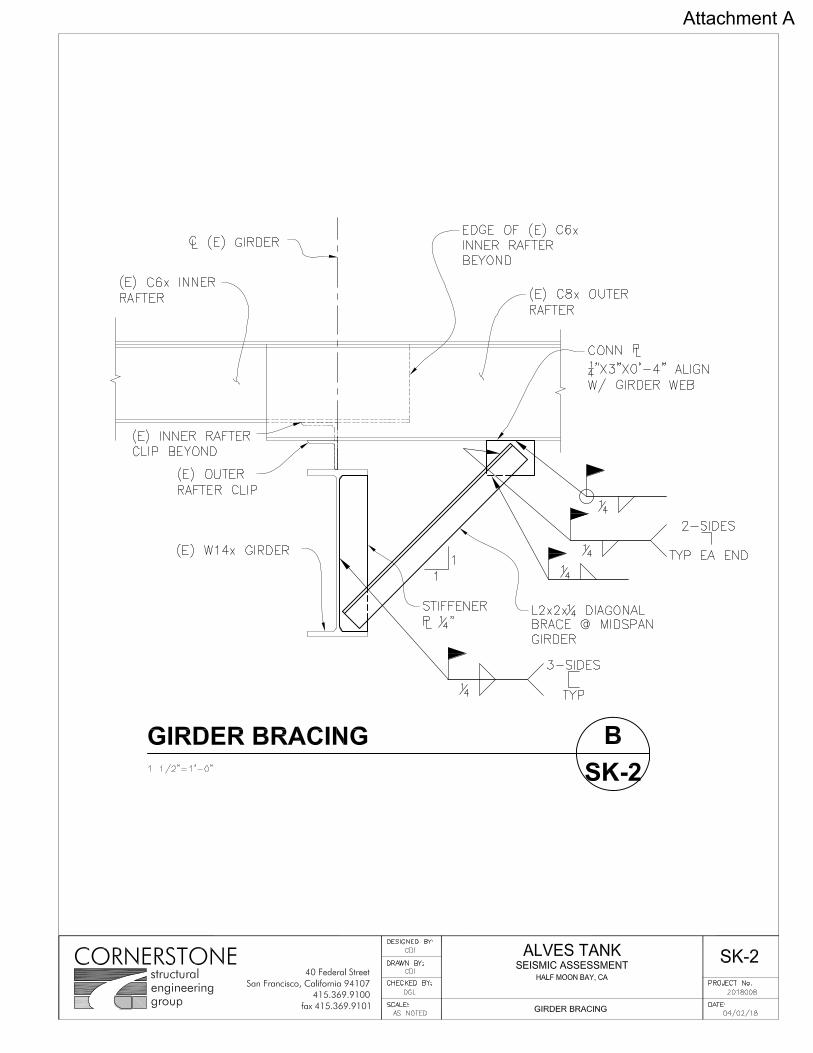
Attachment A
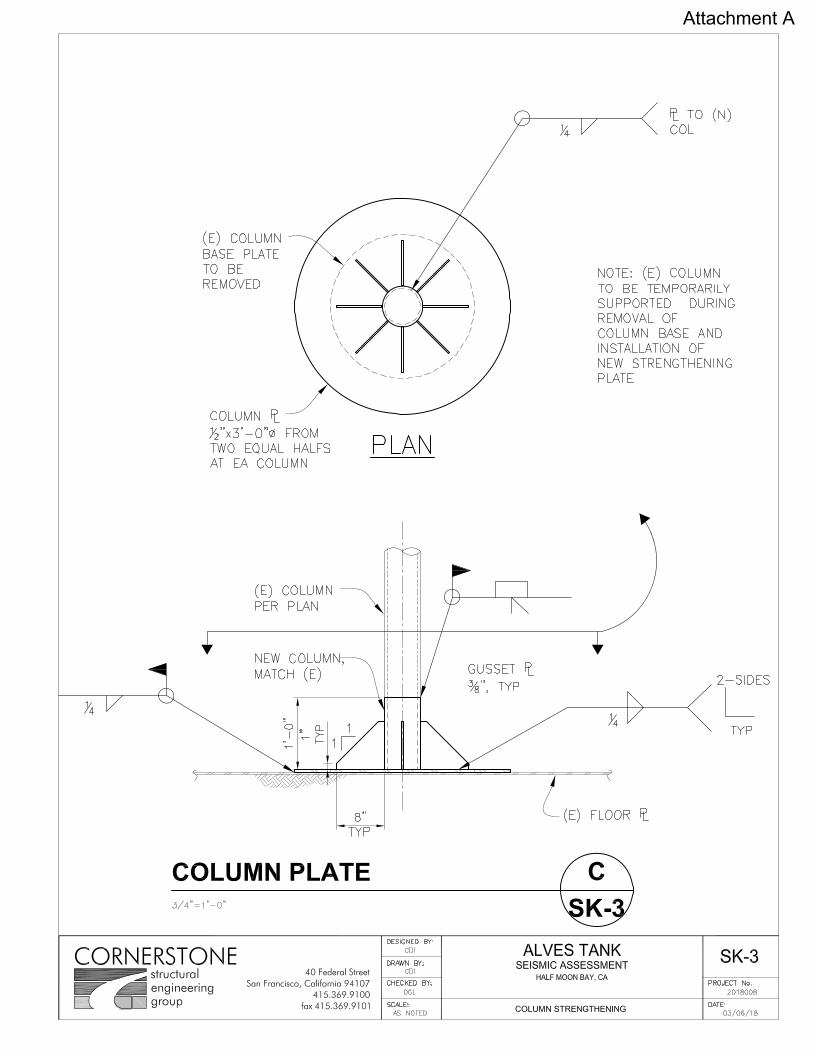
Attachment A
Attachment B
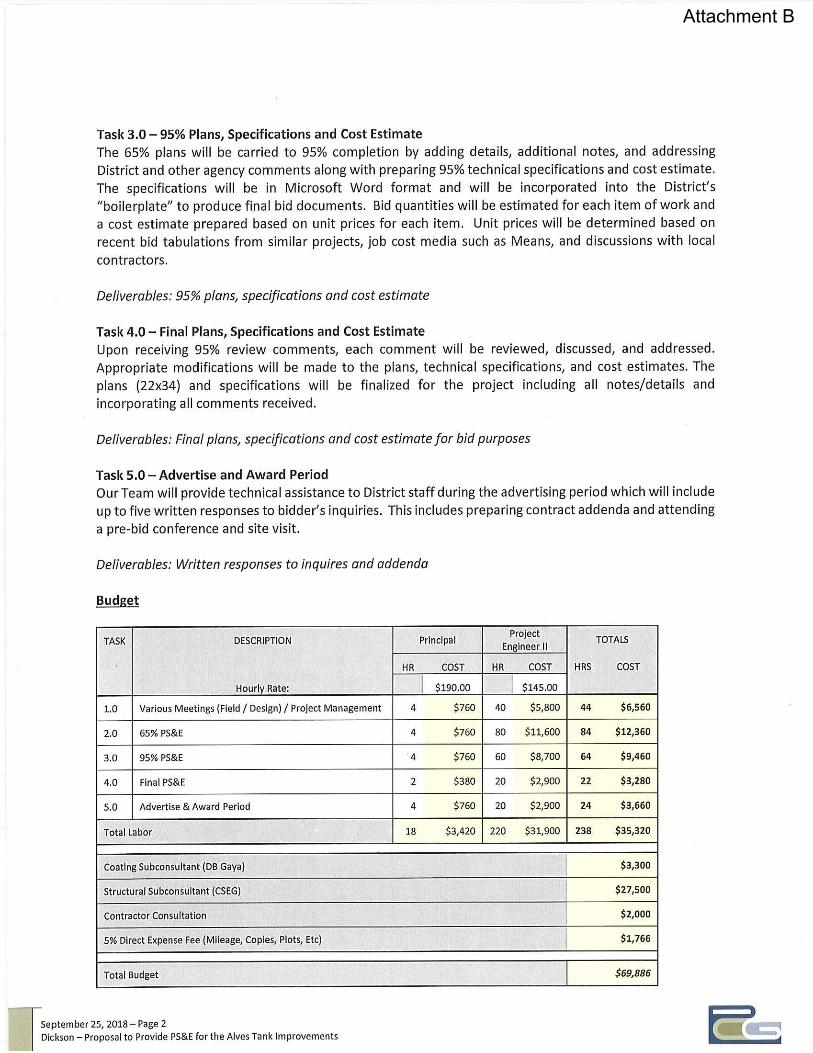
Attachment B
Attachment B
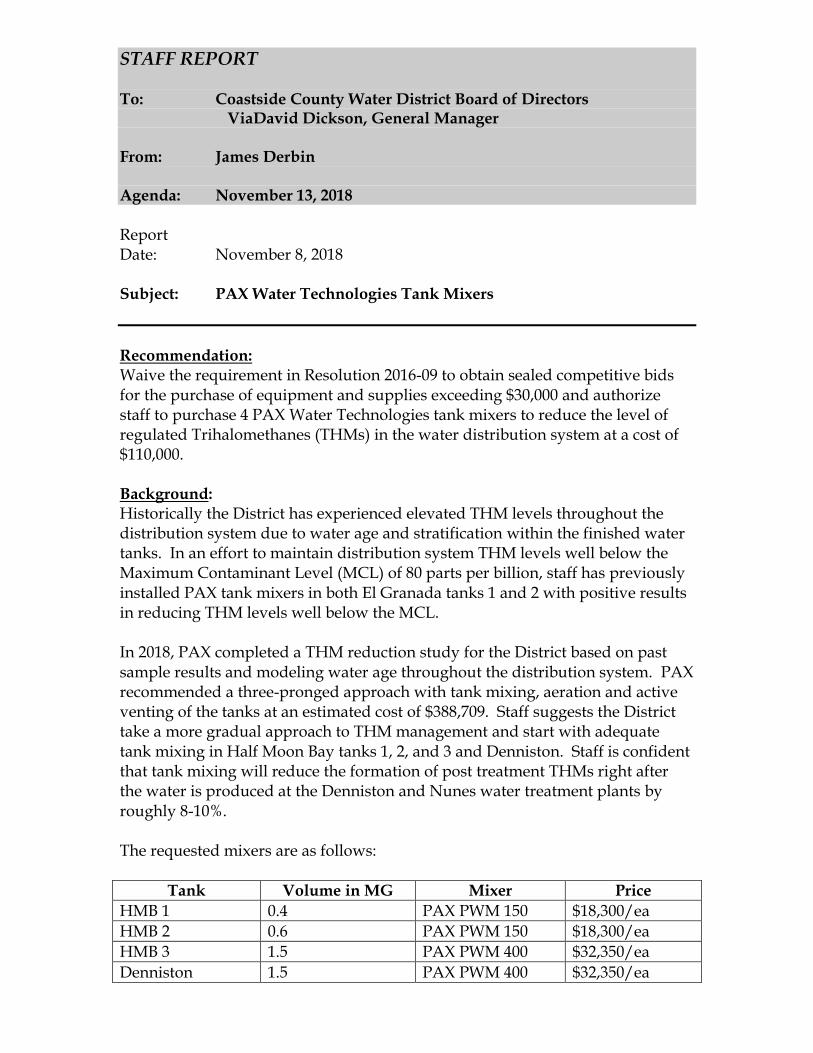
STAFF REPORT To: Coastside County Water District Board of Directors ViaDavid Dickson, General Manager From: James Derbin Agenda: November 13, 2018 Report Date: November 8, 2018 Subject: PAX Water Technologies Tank Mixers
Recommendation: Waive the requirement in Resolution 2016-09 to obtain sealed competitive bids for the purchase of equipment and supplies exceeding $30,000 and authorize staff to purchase 4 PAX Water Technologies tank mixers to reduce the level of regulated Trihalomethanes (THMs) in the water distribution system at a cost of $110,000. Background: Historically the District has experienced elevated THM levels throughout the distribution system due to water age and stratification within the finished water tanks. In an effort to maintain distribution system THM levels well below the Maximum Contaminant Level (MCL) of 80 parts per billion, staff has previously installed PAX tank mixers in both El Granada tanks 1 and 2 with positive results in reducing THM levels well below the MCL. In 2018, PAX completed a THM reduction study for the District based on past sample results and modeling water age throughout the distribution system. PAX recommended a three-pronged approach with tank mixing, aeration and active venting of the tanks at an estimated cost of $388,709. Staff suggests the District take a more gradual approach to THM management and start with adequate tank mixing in Half Moon Bay tanks 1, 2, and 3 and Denniston. Staff is confident that tank mixing will reduce the formation of post treatment THMs right after the water is produced at the Denniston and Nunes water treatment plants by roughly 8-10%. The requested mixers are as follows:
Tank Volume in MG Mixer Price
HMB 1 0.4 PAX PWM 150 $18,300/ea
HMB 2 0.6 PAX PWM 150 $18,300/ea
HMB 3 1.5 PAX PWM 400 $32,350/ea
Denniston 1.5 PAX PWM 400 $32,350/ea
STAFF REPORT Agenda: November 13, 2018 Subject: PAX Water Technologies Mixers Page Two___________________________________________________________________
Total cost of the mixers, including tax and shipping, is approximately $110,000. Staff recommends sole source procurement of the PAX mixers based on our research showing that the proprietary PAX technology provides the most effective tank mixing and THM reduction and on the results achieved with PAX mixers in El Granada Tanks 1 and 2. Fiscal Impact: This project is included in the approved FY 18/19 CIP budget in the amount of $120,000 entitled “Tanks - THM Control”.
STAFF REPORT To: Coastside County Water District Board of Directors From: Mary Rogren, Assistant General Manager Agenda: November 13, 2018 Report Date: November 9, 2018 Subject: Resolution Adopting a Surplus Property Policy for the Coastside
County Water District Recommendation:
Approve Resolution No. 2018-10, A Resolution of the Board of Directors of the Coastside County Water District Adopting the Coastside County Water District Surplus Property Policy. Background: From time to time, the District has surplus equipment, other than real property, that is no longer needed or useable by the District. This policy authorizes the General Manager to dispose of surplus property with a net book value of less than $15,000. The policy also provides for the methods of disposition. District staff and families and Board members are prohibited from receiving surplus property offered for sale or otherwise disposed by the District.
RESOLUTION NO. 2018-10
A RESOLUTION OF THE BOARD OF DIRECTORS OF THE COASTSIDE COUNTY WATER DISTRICT
ADOPTING THE COASTSIDE COUNTY WATER DISTRICT SURPLUS PROPERTY POLICY
WHEREAS, from time to time, the Coastside County Water District has surplus
property, other than real property, and that is no longer needed or useable by the
District; and
WHEREAS, Section 31041 of the California Water Code provides that a county
water district may hold, use, enjoy, lease, or dispose of property within or without the
district necessary to the full exercise of its powers; and
WHEREAS, the Coastside County Water District’s Board of Directors desires to
adopt a Policy for the handling the disposition of surplus property.
NOW THEREFORE BE IT RESOLVED:
By the Coastside County Water District’s Board of Directors, that the Coastside
County Water District’s Surplus Property Policy incorporated herein as Exhibit A is
hereby approved by the Coastside County Water District’s Board of Directors.
PASSED AND ADOPTED THIS ___ day of November 2018, by the following votes:
Ayes:
Noes:
Absent:
__________________________________
Robert C. Feldman, President Board of Directors ATTEST: APPROVED: __________________________ __________________________________ David R. Dickson, General Manager Patrick Miyaki Secretary of the District Attorney
Exhibit A COASTSIDE COUNTY WATER DISTRICT SURPLUS PROPERTY POLICY
Adopted: _________________
Determination of Surplus Property
Sections 31041 of the California Water Code (County Water District Law) authorizes the District to dispose of surplus property. The term "surplus property" shall mean any property, other than real property, that is no longer needed or useable by the District, as determined by the General Manager. The General Manager is authorized to dispose of surplus property with a net book value of less than $15,000. All other determinations of surplus property will be presented to the Board for its review and approval prior to disposition of the property.
Methods of Disposition
The General Manager is responsible for the disposition of District surplus property. The General Manager shall determine which of the following methods of disposition to use:
1. Trade-In – Property declared as surplus may be offered as a trade-in for credit toward the acquisition of new property. All trade-in offers will be submitted for the review and approval of the General Manager.
2. Return to Manufacturer – Surplus property may, when possible, be returned to the manufacturer for buy-back or credit toward the purchase of new property.
3. Sale – The District may offer surplus property for sale. All surplus property is for sale "as-is" and "where-is" with no warranty, guarantee, or representation of any kind, expressed or implied, as to the condition, utility, or usability of the property offered for sale. Appropriate methods of sale are as follows:
a. Public Auction – Surplus property may be sold at public auction. The District may contract with a professional auctioneer.
b. Sealed Bids – Sealed bids may be solicited for the sale of surplus property. Surplus property disposed of in this manner shall be sold to the highest responsive bidder.
c. Negotiated Sale – Surplus property may be sold directly to a purchaser if it is determined that only one known buyer is available or interested in acquiring the property.
d. Selling for Scrap – Surplus property with a minimal fair market value may be sold as scrap.
4. Donation or Disposal – If the District is unable to sell surplus property after using the methods provided in sections 1 through 3, above, or if the cost of locating a buyer exceeds the estimated sale price of surplus property, the property may be donated to a charitable organization, recycled, destroyed, or disposed of as junk.
Proceeds
All sales of surplus property shall be paid to the District by certified check, money order, or in manner agreeable to the General Manager. The General Manager shall be authorized to sign bills of sale and any other documents evidencing the transfer of title to such surplus property by and on behalf of the District.

District Staff and Directors
District staff and families (spouses and children) and Board members are prohibited from receiving surplus property offered for sale or otherwise disposed by the District.

STAFF REPORT To: Coastside County Water District Board of Directors From: Mary Rogren, Assistant General Manager Agenda: November 13, 2018 Report Date: November 9, 2018 Subject: Quarterly Financial Review ________________________________________________________________________ Recommendation: Information Only. Background: The attached Period Budget Analysis summarizes year-to-date revenue and expenses for the first three months of Fiscal Year 2018-2019. Key highlights include: Year-to-date revenue is $301,000 above budget due to higher water sales
(primarily with irrigation and agricultural customers.) Year-to-date expenses are $195,000 over budget, including:
o Water purchased from SFPUC is $377,000 higher than budget, primarily due to our inability to utilize local source water this summer at Denniston.
o Personnel related costs are $79,000 underbudget due to vacancies and the partial service retirement of the General Manager resulting in a reduction of his salary expenses.
o Other savings of $103,000 primarily reflect expense timing as compared to budget.
Year-to-date loan payments are $50,000 under budget due to the refinancing of
the District’s 2006 Series B Bonds that occurred in July, 2018.
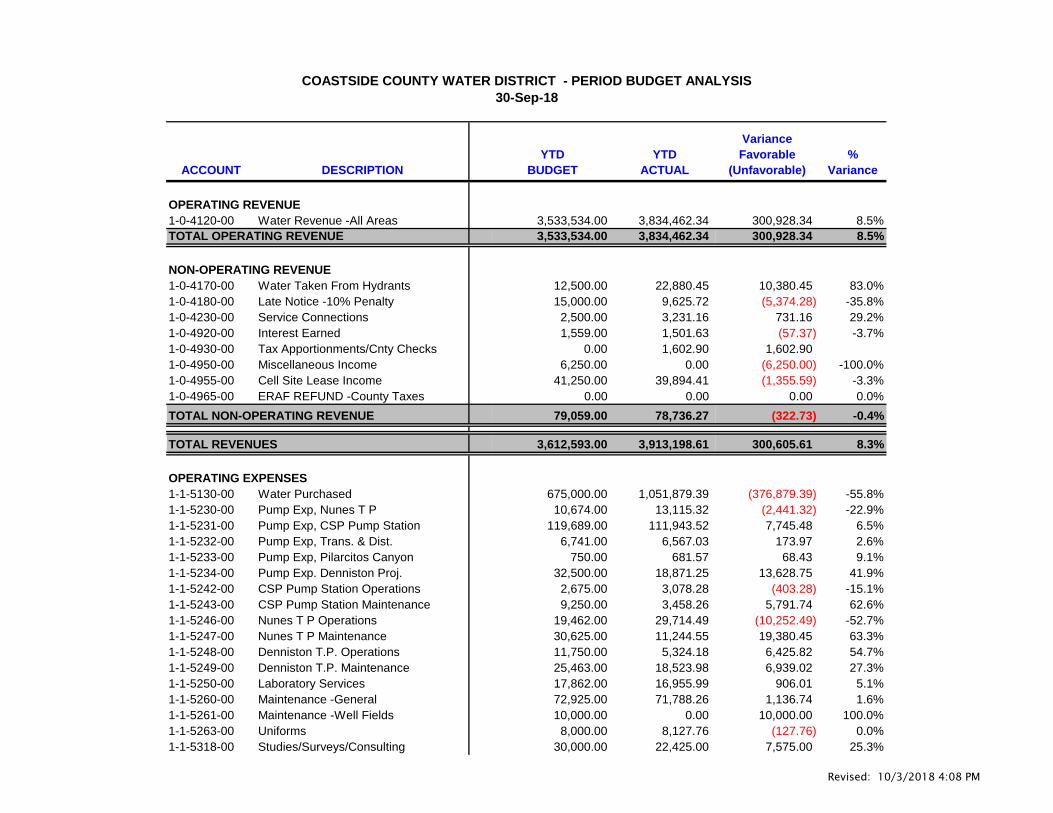
ACCOUNT DESCRIPTIONYTD
BUDGETYTD
ACTUAL
Variance Favorable
(Unfavorable)%
Variance
1-0-4120-00 Water Revenue -All Areas 3,533,534.00 3,834,462.34 300,928.34 8.5%3,533,534.00 3,834,462.34 300,928.34 8.5%
1-0-4170-00 Water Taken From Hydrants 12,500.00 22,880.45 10,380.45 83.0%1-0-4180-00 Late Notice -10% Penalty 15,000.00 9,625.72 (5,374.28) -35.8%1-0-4230-00 Service Connections 2,500.00 3,231.16 731.16 29.2%1-0-4920-00 Interest Earned 1,559.00 1,501.63 (57.37) -3.7%1-0-4930-00 Tax Apportionments/Cnty Checks 0.00 1,602.90 1,602.901-0-4950-00 Miscellaneous Income 6,250.00 0.00 (6,250.00) -100.0%1-0-4955-00 Cell Site Lease Income 41,250.00 39,894.41 (1,355.59) -3.3%1-0-4965-00 ERAF REFUND -County Taxes 0.00 0.00 0.00 0.0%
79,059.00 78,736.27 (322.73) -0.4%
3,612,593.00 3,913,198.61 300,605.61 8.3%
1-1-5130-00 Water Purchased 675,000.00 1,051,879.39 (376,879.39) -55.8%1-1-5230-00 Pump Exp, Nunes T P 10,674.00 13,115.32 (2,441.32) -22.9%1-1-5231-00 Pump Exp, CSP Pump Station 119,689.00 111,943.52 7,745.48 6.5%1-1-5232-00 Pump Exp, Trans. & Dist. 6,741.00 6,567.03 173.97 2.6%1-1-5233-00 Pump Exp, Pilarcitos Canyon 750.00 681.57 68.43 9.1%1-1-5234-00 Pump Exp. Denniston Proj. 32,500.00 18,871.25 13,628.75 41.9%1-1-5242-00 CSP Pump Station Operations 2,675.00 3,078.28 (403.28) -15.1%1-1-5243-00 CSP Pump Station Maintenance 9,250.00 3,458.26 5,791.74 62.6%1-1-5246-00 Nunes T P Operations 19,462.00 29,714.49 (10,252.49) -52.7%1-1-5247-00 Nunes T P Maintenance 30,625.00 11,244.55 19,380.45 63.3%1-1-5248-00 Denniston T.P. Operations 11,750.00 5,324.18 6,425.82 54.7%1-1-5249-00 Denniston T.P. Maintenance 25,463.00 18,523.98 6,939.02 27.3%1-1-5250-00 Laboratory Services 17,862.00 16,955.99 906.01 5.1%1-1-5260-00 Maintenance -General 72,925.00 71,788.26 1,136.74 1.6%1-1-5261-00 Maintenance -Well Fields 10,000.00 0.00 10,000.00 100.0%1-1-5263-00 Uniforms 8,000.00 8,127.76 (127.76) 0.0%1-1-5318-00 Studies/Surveys/Consulting 30,000.00 22,425.00 7,575.00 25.3%
OPERATING EXPENSES
TOTAL REVENUES
COASTSIDE COUNTY WATER DISTRICT - PERIOD BUDGET ANALYSIS30-Sep-18
OPERATING REVENUE
NON-OPERATING REVENUE
TOTAL NON-OPERATING REVENUE
TOTAL OPERATING REVENUE
Revised: 10/3/2018 4:08 PM
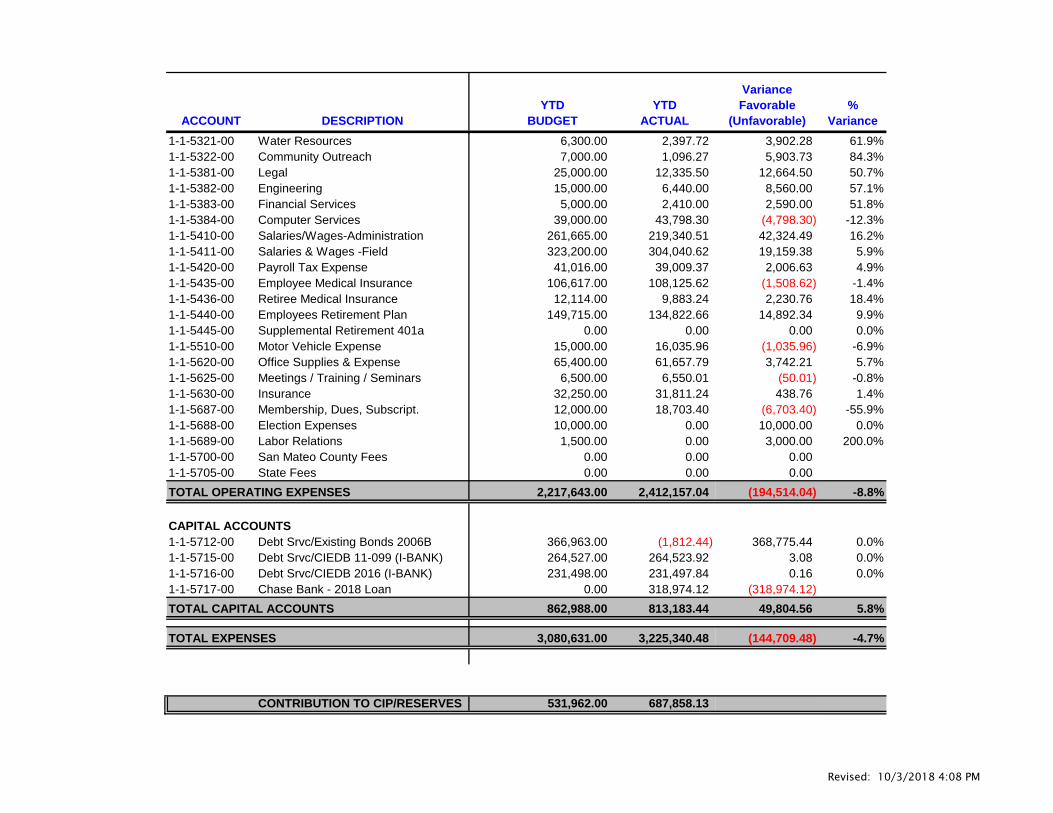
ACCOUNT DESCRIPTIONYTD
BUDGETYTD
ACTUAL
Variance Favorable
(Unfavorable)%
Variance1-1-5321-00 Water Resources 6,300.00 2,397.72 3,902.28 61.9%1-1-5322-00 Community Outreach 7,000.00 1,096.27 5,903.73 84.3%1-1-5381-00 Legal 25,000.00 12,335.50 12,664.50 50.7%1-1-5382-00 Engineering 15,000.00 6,440.00 8,560.00 57.1%1-1-5383-00 Financial Services 5,000.00 2,410.00 2,590.00 51.8%1-1-5384-00 Computer Services 39,000.00 43,798.30 (4,798.30) -12.3%1-1-5410-00 Salaries/Wages-Administration 261,665.00 219,340.51 42,324.49 16.2%1-1-5411-00 Salaries & Wages -Field 323,200.00 304,040.62 19,159.38 5.9%1-1-5420-00 Payroll Tax Expense 41,016.00 39,009.37 2,006.63 4.9%1-1-5435-00 Employee Medical Insurance 106,617.00 108,125.62 (1,508.62) -1.4%1-1-5436-00 Retiree Medical Insurance 12,114.00 9,883.24 2,230.76 18.4%1-1-5440-00 Employees Retirement Plan 149,715.00 134,822.66 14,892.34 9.9%1-1-5445-00 Supplemental Retirement 401a 0.00 0.00 0.00 0.0%1-1-5510-00 Motor Vehicle Expense 15,000.00 16,035.96 (1,035.96) -6.9%1-1-5620-00 Office Supplies & Expense 65,400.00 61,657.79 3,742.21 5.7%1-1-5625-00 Meetings / Training / Seminars 6,500.00 6,550.01 (50.01) -0.8%1-1-5630-00 Insurance 32,250.00 31,811.24 438.76 1.4%1-1-5687-00 Membership, Dues, Subscript. 12,000.00 18,703.40 (6,703.40) -55.9%1-1-5688-00 Election Expenses 10,000.00 0.00 10,000.00 0.0%1-1-5689-00 Labor Relations 1,500.00 0.00 3,000.00 200.0%1-1-5700-00 San Mateo County Fees 0.00 0.00 0.001-1-5705-00 State Fees 0.00 0.00 0.00
2,217,643.00 2,412,157.04 (194,514.04) -8.8%
CAPITAL ACCOUNTS1-1-5712-00 Debt Srvc/Existing Bonds 2006B 366,963.00 (1,812.44) 368,775.44 0.0%1-1-5715-00 Debt Srvc/CIEDB 11-099 (I-BANK) 264,527.00 264,523.92 3.08 0.0%1-1-5716-00 Debt Srvc/CIEDB 2016 (I-BANK) 231,498.00 231,497.84 0.16 0.0%1-1-5717-00 Chase Bank - 2018 Loan 0.00 318,974.12 (318,974.12)
862,988.00 813,183.44 49,804.56 5.8%
3,080,631.00 3,225,340.48 (144,709.48) -4.7%
CONTRIBUTION TO CIP/RESERVES 531,962.00 687,858.13
TOTAL OPERATING EXPENSES
TOTAL CAPITAL ACCOUNTS
TOTAL EXPENSES
Revised: 10/3/2018 4:08 PM

STAFF REPORT
To: Coastside County Water District Board of Directors
From: Mary Rogren, Assistant General Manager
Agenda: November 13, 2018
Report Date: November 9, 2018
Subject: Assistant General Manager’s Report
Recommendation: none
Background:
WaterSmart Update
During the month of October, the District officially launched the WaterSmart web portal to all customers District-wide. Our launch included:
October 1: Our District website was updated to include links to sign-upfor WaterSmart.
October 5: A post card introducing WaterSmart was mailed to allDistrict’s customers (see attached.)
October 10: An ad was placed in the Half Moon Bay Review introducingWaterSmart.
October 13 – Pumpkin Festival: WaterSmart signage and materials wereprominently displayed at the District’s table
November 5: A follow-up Constant Contact e-mail was sent out to ourcustomers.
WaterSmart has been very well-received by our customers. As of this writing, we have 430+ customers who have signed up to date. In addition, District Staff continues to contact many of our customers with possible leaks as a courtesy (averaging 70 customers per month; 600+ total contacts since March 2018.)

Coastside County Water District | 766 Main Street | Half Moon Bay, CA 94019 | [650] 726-4405
Coastside County Water District is excited to
introduce customers to WaterSmart, an
innovative web portal where you can access
detailed information about your water use.
It’s part of the District’s commitment to
provide customers with tools to better
manage water use and to prevent high water
bills caused by irrigation and leaks.
Customers no longer need to wait for a billing statement to see how much water they have used.
Coastside County Water District recentlypartnered with WaterSmart Software to offer customers access to a free web portal.
View hourly and daily water usage.
Set up high usage alerts.
Compare your water usage withsimilar sized homes in yourneighborhood.
To register for the free web portal, go to theWaterSmart sign up page. Make sure you haveyour water account number and email address.
https://coastsidewater.watersmart.com
To learn more about the District’s advanced metering program and to access a link to the WaterSmart web portal registration page, you can go to the District’s website.
http://www.coastsidewater.org/watersmart.html
Email your questions to [email protected]
Presorted First Class
Mail U.S. Postage
PAID Permit No. 1
Coastside County Water District 766 Main Street Half Moon Bay, CA 94019
Coastside County Water District | 766 Main Street | Half Moon Bay, CA 94019 | [650] 726-4405
Coastside County Water District is excited to
introduce customers to WaterSmart, an
innovative web portal where you can access
detailed information about your water use.
It’s part of the District’s commitment to
provide customers with tools to better
manage water use and to prevent high water
bills caused by irrigation and leaks.
Customers no longer need to wait for a billingstatement to see how much water they haveused.
Coastside County Water District recently partnered with WaterSmart Software to offercustomers access to a free web portal.
View hourly and daily water usage.
Set up high usage alerts.
Compare your water usage withsimilar sized homes in your neighborhood.
To register for the free web portal, go to theWaterSmart sign up page. Make sure you have your water account number and email address.
https://coastsidewater.watersmart.com
To learn more about the District’s advanced metering program and to access a link to the WaterSmart web portal registration page, you can go to the District’s website.
http://www.coastsidewater.org/watersmart.html
Email your questions to [email protected]
Presorted First Class
Mail U.S. Postage
PAID Permit No. 1
Coastside County Water District766 Main StreetHalf Moon Bay, CA 94019
Half Moon Bay, CA94019

Coastside County Water District | 766 Main Street | Half Moon Bay, CA 94019 | [650] 726-4405
Coastside County Water District is excited to
introduce customers to WaterSmart, an
innovative web portal where you can access
detailed information about your water use.
It’s part of the District’s commitment to
provide customers with tools to better
manage water use and to prevent high water
bills caused by irrigation and leaks.
Customers no longer need to wait for a billingstatement to see how much water they haveused.
Coastside County Water District recently partnered with WaterSmart Software to offer customers access to a free web portal.
View hourly and daily water usage.
Set up high usage alerts.
Compare your water usage with similar sized homes in your neighborhood.
To register for the free web portal, go to the WaterSmart sign up page. Make sure you have your water account number and email address.
https://coastsidewater.watersmart.com To learn more about the District’s advanced metering program and to access a link to the WaterSmart web portal registration page, you can go to the District’s website.
http://www.coastsidewater.org/watersmart.html
Email your questions to [email protected]
PresortedFirst Class
MailU.S. Postage
PAIDPermit No. 1
Coastside County Water District766 Main StreetHalf Moon Bay, CA 94019
Coastside County Water District
View hourly reads (laptop or desktopcomputer only)
View daily water usage Set-up high usage alerts Compare your water usage with similar
sized homes in your neighborhood Learn how much water is used when you
irrigate
Questions? [email protected]
WATERSMART IS HERE!
Customers have been asking about a tool like this and Coastside County Water District was listening.
Introducing WaterSmart an innovative web portal where you can access information about your water use.
The District has partnered with WaterSmart Software to offer customers access to a free web portal. To register, you need your water account number and email address. If you haven't received a direct link from the District, you will also need your billing zip code
Click here to learn more
Click here to register
!WaterSmart disponible en espanol!
Para registrarse en el portal web gratuito, vaya a la pagina de registro de WaterSmart. Asegurate de tener su numero de cuenta de agua y direccion de correo electronico.
https://coastsidewater.watersmart.com
Constant Contact e-mail 11.5.2018
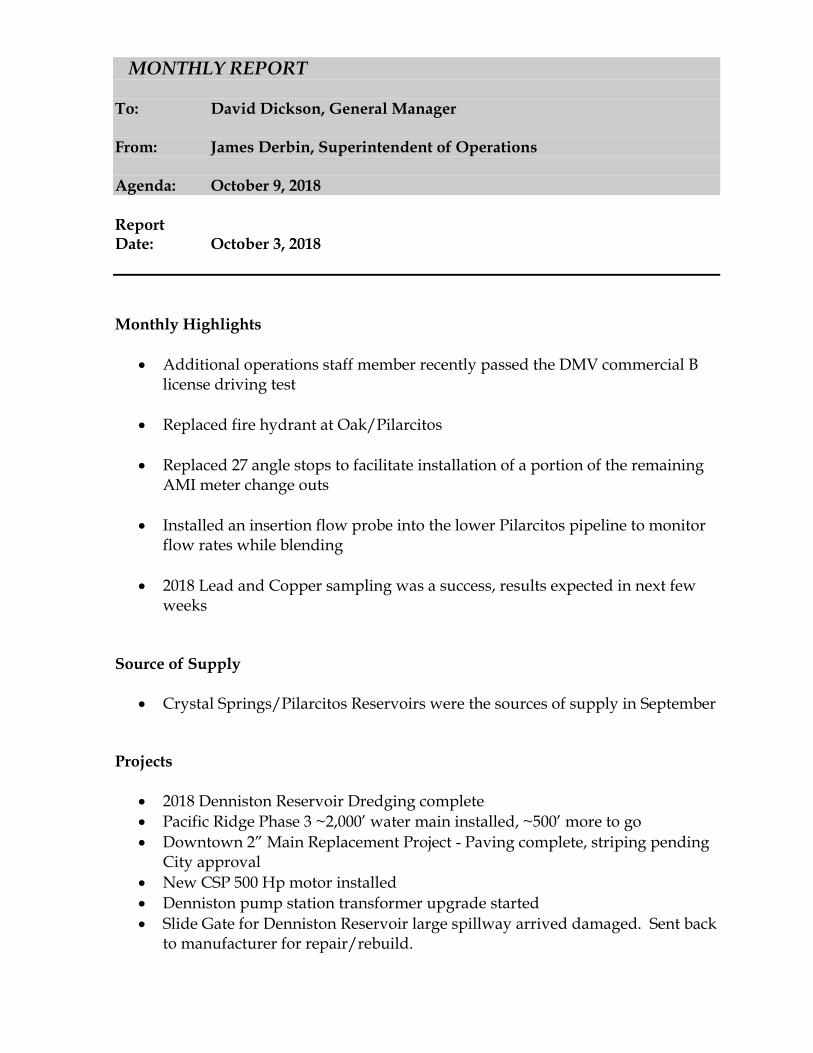
MONTHLY REPORT To: David Dickson, General Manager From: James Derbin, Superintendent of Operations Agenda: October 9, 2018 Report Date: October 3, 2018
Monthly Highlights
• Additional operations staff member recently passed the DMV commercial B license driving test
• Replaced fire hydrant at Oak/Pilarcitos
• Replaced 27 angle stops to facilitate installation of a portion of the remaining AMI meter change outs
• Installed an insertion flow probe into the lower Pilarcitos pipeline to monitor flow rates while blending
• 2018 Lead and Copper sampling was a success, results expected in next few weeks
Source of Supply
• Crystal Springs/Pilarcitos Reservoirs were the sources of supply in September Projects
• 2018 Denniston Reservoir Dredging complete
• Pacific Ridge Phase 3 ~2,000’ water main installed, ~500’ more to go
• Downtown 2” Main Replacement Project - Paving complete, striping pending City approval
• New CSP 500 Hp motor installed
• Denniston pump station transformer upgrade started
• Slide Gate for Denniston Reservoir large spillway arrived damaged. Sent back to manufacturer for repair/rebuild.
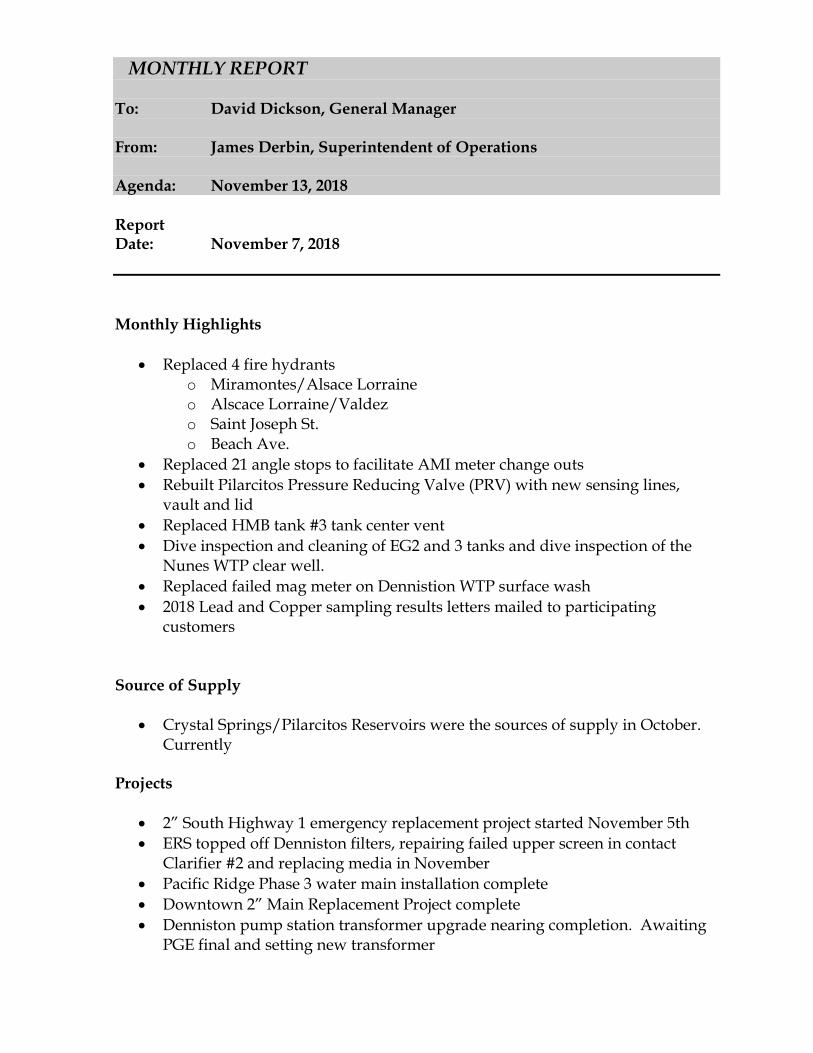
MONTHLY REPORT To: David Dickson, General Manager From: James Derbin, Superintendent of Operations Agenda: November 13, 2018 Report Date: November 7, 2018
Monthly Highlights
• Replaced 4 fire hydrants o Miramontes/Alsace Lorraine o Alscace Lorraine/Valdez o Saint Joseph St. o Beach Ave.
• Replaced 21 angle stops to facilitate AMI meter change outs
• Rebuilt Pilarcitos Pressure Reducing Valve (PRV) with new sensing lines, vault and lid
• Replaced HMB tank #3 tank center vent
• Dive inspection and cleaning of EG2 and 3 tanks and dive inspection of the Nunes WTP clear well.
• Replaced failed mag meter on Dennistion WTP surface wash
• 2018 Lead and Copper sampling results letters mailed to participating customers
Source of Supply
• Crystal Springs/Pilarcitos Reservoirs were the sources of supply in October. Currently
Projects
• 2” South Highway 1 emergency replacement project started November 5th
• ERS topped off Denniston filters, repairing failed upper screen in contact Clarifier #2 and replacing media in November
• Pacific Ridge Phase 3 water main installation complete
• Downtown 2” Main Replacement Project complete
• Denniston pump station transformer upgrade nearing completion. Awaiting PGE final and setting new transformer

• Slide gate for Denniston Reservoir large spillway arrived damaged last month. Unit sent back to manufacturer for repair and returned. Contractor will install in November.
• El Granada 2” project out to bid
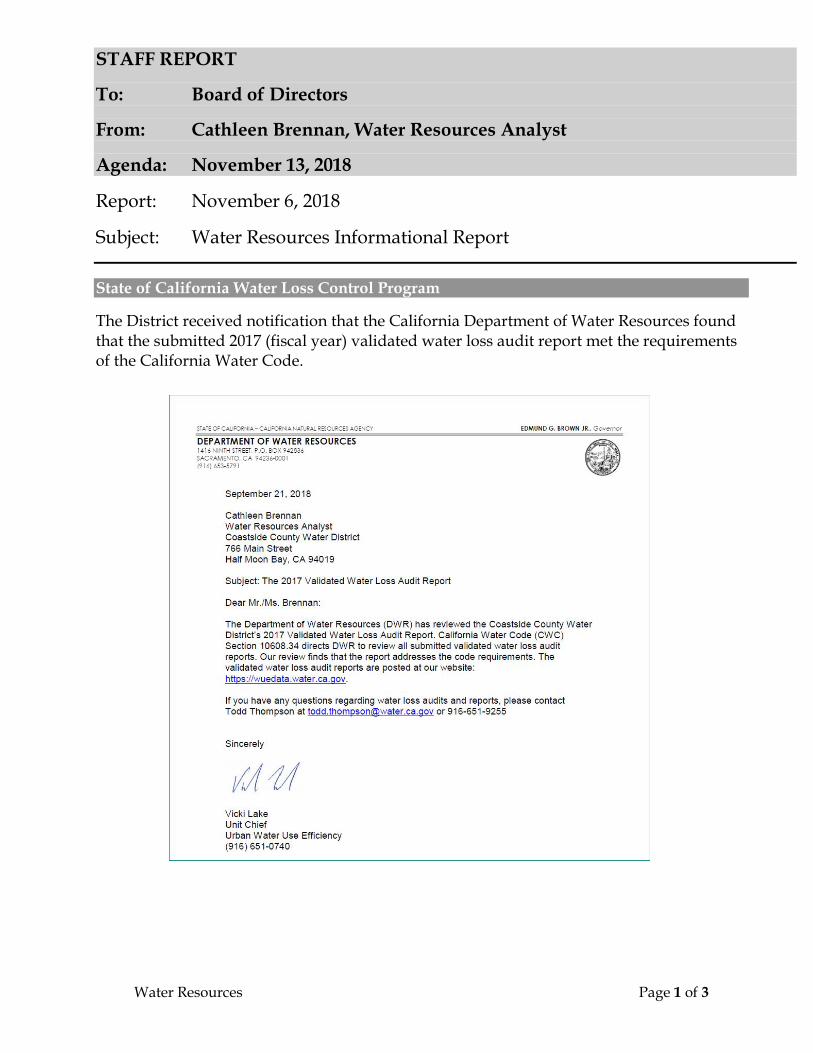
Water Resources Page 1 of 3
STAFF REPORT
To: Board of Directors
From: Cathleen Brennan, Water Resources Analyst
Agenda: November 13, 2018
Report: November 6, 2018
Subject: Water Resources Informational Report State of California Water Loss Control Program
The District received notification that the California Department of Water Resources found that the submitted 2017 (fiscal year) validated water loss audit report met the requirements of the California Water Code.
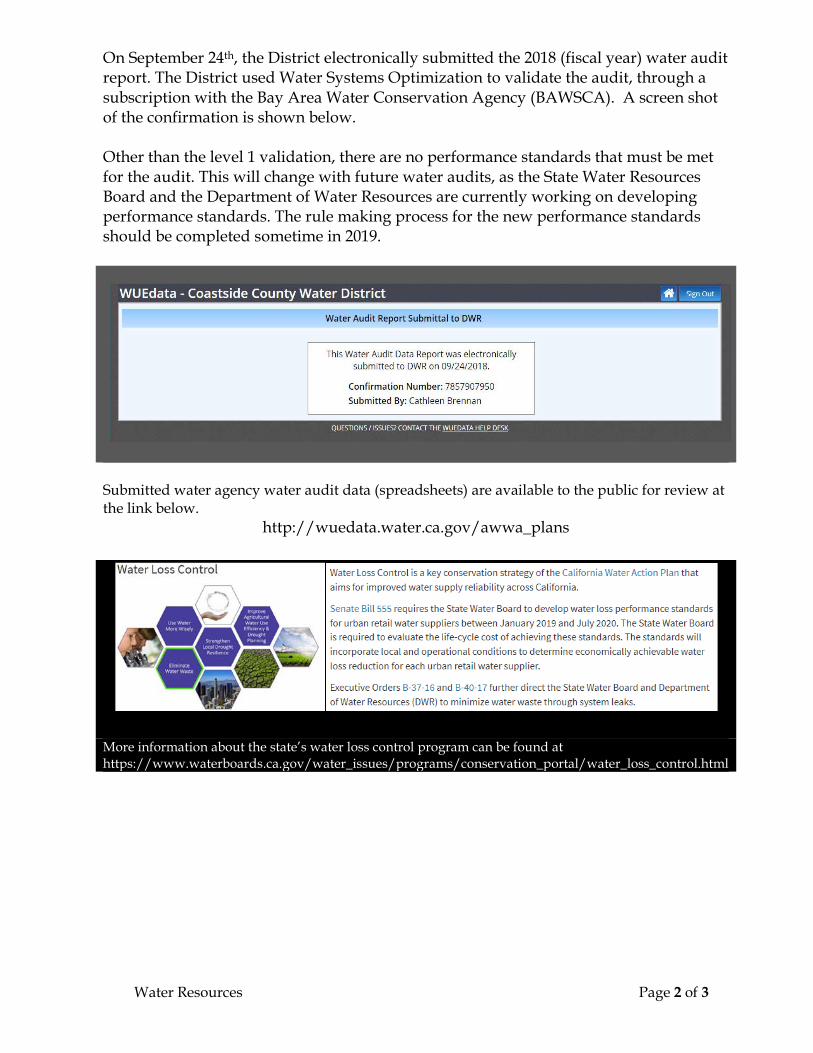
Water Resources Page 2 of 3
On September 24th, the District electronically submitted the 2018 (fiscal year) water audit report. The District used Water Systems Optimization to validate the audit, through a subscription with the Bay Area Water Conservation Agency (BAWSCA). A screen shot of the confirmation is shown below. Other than the level 1 validation, there are no performance standards that must be met for the audit. This will change with future water audits, as the State Water Resources Board and the Department of Water Resources are currently working on developing performance standards. The rule making process for the new performance standards should be completed sometime in 2019.
Submitted water agency water audit data (spreadsheets) are available to the public for review at the link below.
http://wuedata.water.ca.gov/awwa_plans
More information about the state’s water loss control program can be found at https://www.waterboards.ca.gov/water_issues/programs/conservation_portal/water_loss_control.html
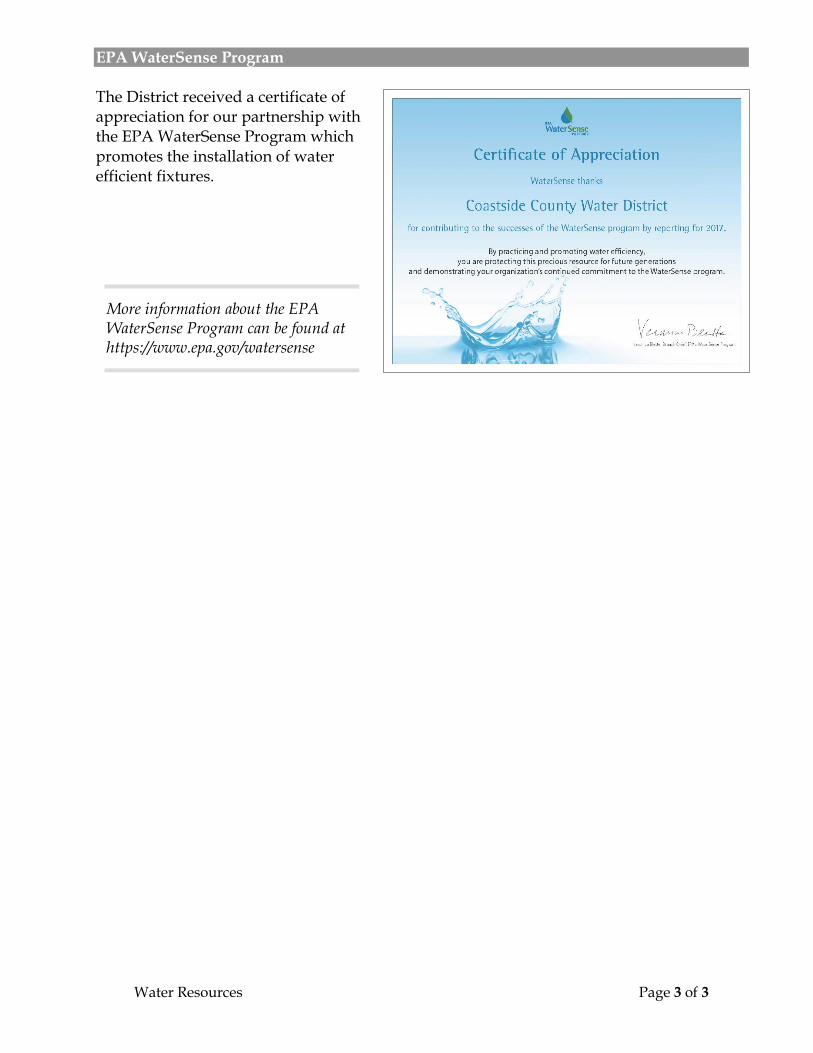
Water Resources Page 3 of 3
EPA WaterSense Program The District received a certificate of appreciation for our partnership with the EPA WaterSense Program which promotes the installation of water efficient fixtures.
More information about the EPA WaterSense Program can be found at https://www.epa.gov/watersense