coastal morphology change in response to bulkhead removal
TRANSCRIPT

Coastal morphology change in response to bulkhead removal at Edgewater Beach, South Puget Sound
February 2018 Publication 18-06-002

Publication and Contact Information This document is available on the Department of Ecology’s website at: https://fortress.wa.gov/ecy/publications/summarypages/1806002.html
For more information contact:
Heather Weiner, MS Coastal Geomatics Scientist [email protected]
George Kaminsky, PhD, PE Coastal Engineer [email protected]
Coastal Monitoring & Analysis Program Shorelands and Environmental Assistance Program P.O. Box 47600 Olympia, WA 98504-7600 Phone: 360-407-6600
Washington State Department of Ecology — www.ecology.wa.gov
• Headquarters, Olympia 360-407-6000 • Northwest Regional Office, Bellevue 425-649-7000 • Southwest Regional Office, Olympia 360-407-6300 • Central Regional Office, Union Gap 509-575-2490 • Eastern Regional Office, Spokane 509-329-3400
Recommended citation:
Weiner, H.M., and Kaminsky, G.M., 2018. Coastal morphology change in response to bulkhead removal at Edgewater Beach, South Puget Sound. Shorelands and Environmental Assistance Program, Washington State Department of Ecology, Olympia, WA. Publication #18-06-002. https://fortress.wa.gov/ecy/publications/summarypages/1806002.html
To request ADA accommodation, including materials in a format for the visually impaired, call Ecology at 360-407-6600 or visit https://ecology.wa.gov/accessibility. People with impaired hearing may call Washington Relay Service at 711. People with speech disability may call TTY at 877-833-6341.

Coastal morphology change in response to bulkhead removal
at Edgewater Beach, South Puget Sound
Prepared for: South Puget Sound Salmon Enhancement Group
Olympia, Washington
Prepared by: Heather M. Weiner, MS and George M. Kaminsky, PhD, PE
Coastal Monitoring & Analysis Program Washington State Department of Ecology
Olympia, Washington

This page is purposely left blank

Publication 18-06-002 iii February 2018
Table of Contents Page
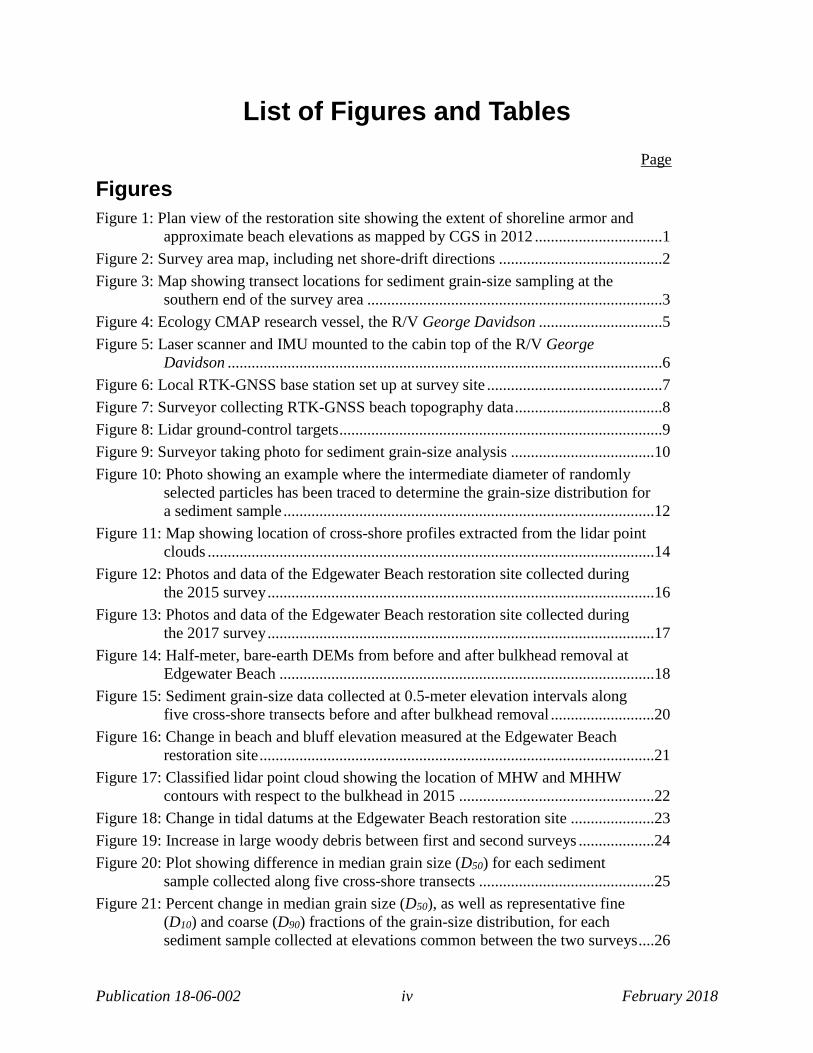
List of Figures and Tables.................................................................................................. iv
Acknowledgements ........................................................................................................... vii Executive Summary ........................................................................................................... ix
Introduction ..........................................................................................................................1
Vessel and Equipment..........................................................................................................5
Methodology ........................................................................................................................7 Data collection ...............................................................................................................7
Geodetic control .......................................................................................................7 Boat-based lidar .......................................................................................................7 Ground-based GNSS ................................................................................................8 Sediment grain size ..................................................................................................9
Data processing ............................................................................................................10 Geodetic control .....................................................................................................10 Boat-based lidar .....................................................................................................10 Ground-based GNSS ..............................................................................................11 Digital elevation model ..........................................................................................11 Sediment grain size ................................................................................................11
Data analysis ................................................................................................................12 Morphological change ...........................................................................................12 Sediment grain size ................................................................................................13
Results ................................................................................................................................15 Lidar positioning ..........................................................................................................15 Point-cloud classification .............................................................................................15 Digital elevation models ..............................................................................................18 Sediment grain size ......................................................................................................19 Restoration site changes ...............................................................................................21
Morphological change ...........................................................................................21 Habitat linkages .....................................................................................................23
Reach-scale coastal profile change ..............................................................................27 Drift cell-scale overview ..............................................................................................36
Conclusions ........................................................................................................................41
References ..........................................................................................................................45
Deliverables .......................................................................................................................47
Appendices .........................................................................................................................49 Appendix A. Cross-shore profiles ................................................................................49 Appendix B. Sediment grain-size sample photographs ...............................................67
Publication 18-06-002 iv February 2018
List of Figures and Tables Page
Figures Figure 1: Plan view of the restoration site showing the extent of shoreline armor and
approximate beach elevations as mapped by CGS in 2012 ................................1 Figure 2: Survey area map, including net shore-drift directions .........................................2 Figure 3: Map showing transect locations for sediment grain-size sampling at the
southern end of the survey area ..........................................................................3 Figure 4: Ecology CMAP research vessel, the R/V George Davidson ...............................5 Figure 5: Laser scanner and IMU mounted to the cabin top of the R/V George
Davidson .............................................................................................................6 Figure 6: Local RTK-GNSS base station set up at survey site ............................................7 Figure 7: Surveyor collecting RTK-GNSS beach topography data .....................................8 Figure 8: Lidar ground-control targets .................................................................................9 Figure 9: Surveyor taking photo for sediment grain-size analysis ....................................10 Figure 10: Photo showing an example where the intermediate diameter of randomly
selected particles has been traced to determine the grain-size distribution for a sediment sample .............................................................................................12
Figure 11: Map showing location of cross-shore profiles extracted from the lidar point clouds ................................................................................................................14
Figure 12: Photos and data of the Edgewater Beach restoration site collected during the 2015 survey .................................................................................................16
Figure 13: Photos and data of the Edgewater Beach restoration site collected during the 2017 survey .................................................................................................17
Figure 14: Half-meter, bare-earth DEMs from before and after bulkhead removal at Edgewater Beach ..............................................................................................18
Figure 15: Sediment grain-size data collected at 0.5-meter elevation intervals along five cross-shore transects before and after bulkhead removal ..........................20
Figure 16: Change in beach and bluff elevation measured at the Edgewater Beach restoration site ...................................................................................................21
Figure 17: Classified lidar point cloud showing the location of MHW and MHHW contours with respect to the bulkhead in 2015 .................................................22
Figure 18: Change in tidal datums at the Edgewater Beach restoration site .....................23 Figure 19: Increase in large woody debris between first and second surveys ...................24 Figure 20: Plot showing difference in median grain size (D50) for each sediment
sample collected along five cross-shore transects ............................................25 Figure 21: Percent change in median grain size (D50), as well as representative fine
(D10) and coarse (D90) fractions of the grain-size distribution, for each sediment sample collected at elevations common between the two surveys ....26

List of Figures and Tables
Publication 18-06-002 v February 2018
Figure 22: Three-dimensional view of cross-shore profiles at the Edgewater Beach restoration site overlain on the corresponding classified lidar point cloud for 2015 and 2017 ...................................................................................................28
Figure 23: Three-dimensional view of cross-shore profile change at the Edgewater Beach restoration site overlain on the 2015 classified lidar point cloud ..........29
Figure 24: Close-up view of the bluff toe for cross-shore profiles at the Edgewater Beach restoration site overlain on the 2017 classified lidar point cloud ..........30
Figure 25: Cross-section of lidar point cloud along Transect 1.00 at south end of survey site .........................................................................................................31
Figure 26: Cross-section of lidar point cloud along Transect 1.18 at south end of survey site .........................................................................................................32
Figure 27: Cross-section of lidar point cloud along Transect 2.10 at the restoration site .33 Figure 28: Cross-section of lidar point cloud along Transect 2.11 at the restoration site .33 Figure 29: Cross-section of lidar point cloud along Transect 5.00 north of the
restoration site ...................................................................................................34 Figure 30: Change in beach elevation measured between the first and second survey;
zoomed-in views of change at the stream outlet, intertidal sand bars, and Hunter Point ......................................................................................................38
Figure 31: Stream outlet changes south of Rignall ............................................................39 Figure 32: Intertidal sand-bar migration south of Rignall .................................................39 Figure 33: Preliminary, first-order sediment budget for the Edgewater Beach drift cell
based on observed morphology changes between the September 2015 and June 2017 surveys .............................................................................................40
Figure 34: Cross-section of lidar point cloud along Transect 1.00 ....................................50 Figure 35: Cross-section of lidar point cloud along Transect 1.03 ....................................51 Figure 36: Cross-section of lidar point cloud along Transect 1.07 ....................................52 Figure 37: Cross-section of lidar point cloud along Transect 1.09 ....................................53 Figure 38: Cross-section of lidar point cloud along Transect 1.18 ....................................54 Figure 39: Cross-section of lidar point cloud along Transect 2.00 ....................................55 Figure 40: Cross-section of lidar point cloud along Transect 2.04 ....................................56 Figure 41: Cross-section of lidar point cloud along Transect 2.06 ....................................57 Figure 42: Cross-section of lidar point cloud along Transect 2.10 ....................................58 Figure 43: Cross-section of lidar point cloud along Transect 2.11 ....................................59 Figure 44: Cross-section of lidar point cloud along Transect 3.00 ....................................60 Figure 45: Cross-section of lidar point cloud along Transect 3.01 ....................................61 Figure 46: Cross-section of lidar point cloud along Transect 3.02 ....................................62 Figure 47: Cross-section of lidar point cloud along Transect 4.00 ....................................63 Figure 48: Cross-section of lidar point cloud along Transect 4.04 ....................................64 Figure 49: Cross-section of lidar point cloud along Transect 4.06 ....................................65 Figure 50: Cross-section of lidar point cloud along Transect 5.00 ....................................66

Coastal morphology change in response to bulkhead removal at Edgewater Beach
Publication 18-06-002 vi February 2018
Figure 51: Sediment grain-size photos collected along Transect 1 on Sept. 24, 2015 ......68 Figure 52: Sediment grain-size photos collected along Transect 2 on Sept. 24, 2015 ......69 Figure 53: Sediment grain-size photos collected along Transect 3 on Sept. 24, 2015 ......70 Figure 54: Sediment grain-size photos collected along Transect 4 on Sept. 24, 2015 ......71 Figure 55: Sediment grain-size photos collected along Transect 5 on Sept. 24, 2015 ......72 Figure 56: Sediment grain-size photos collected along Transect 1 on June 22, 2017 .......73 Figure 57: Sediment grain-size photos collected along Transect 2 on June 22, 2017 .......74 Figure 58: Sediment grain-size photos collected along Transect 3 on June 22, 2017 .......75 Figure 59: Sediment grain-size photos collected along Transect 4 on June 22, 2017 .......76 Figure 60: Sediment grain-size photos collected along Transect 5 on June 22, 2017 .......77
Tables Table 1: Coordinates for RTK-GNSS base station used during surveys ...........................10 Table 2: Color scheme used for sediment grain-size classes .............................................19 Table 3: Morphometric parameters extracted from cross-shore profiles ...........................35 Table 4: Tidal datums relative to NAVD88 and MLLW at the Edgewater Beach
restoration site ...................................................................................................49

Publication 18-06-002 vii February 2018
Acknowledgements The initial survey for this research was completed as part of Ecology’s “Mapping Bluffs and Beaches to Quantify Sediment Supply” Project #13-1556, funded by the Washington State Department of Fish & Wildlife’s Estuary and Salmon Restoration Program (ESRP). The second survey was funded by the South Puget Sound Salmon Enhancement Group (SPSSEG) under ESRP Project #14-2306, “Bulkhead Removal Planning”. The authors of this report would like to thank members of Ecology’s Coastal Monitoring & Analysis Program for assistance with field data collection as well as data processing, analysis, and the creation of graphics used in this report: Diana McCandless, Hannah Drummond, Amanda Hacking, and Michelle Gostic. We would also like to thank Connie Patnode for property access to set up geodetic control during both surveys and the many property owners who allowed beach access.

This page is purposely left blank

Publication 18-06-002 ix February 2018
Executive Summary This report describes changes in coastal morphology resulting from the removal of approximately 800 ft of shoreline armor from the base of a historic feeder bluff at Edgewater Beach, located on the west shore of Eld Inlet in South Puget Sound near Olympia, Washington. The armor, consisting primarily of a 700 ft-long bulkhead and two short sections of rock revetment, was removed in fall 2016 as part of a shoreline restoration project led by the South Puget Sound Salmon Enhancement Group to restore nearshore processes and habitat. The Washington State Department of Ecology Coastal Monitoring & Analysis Program (CMAP) performed boat-based lidar surveys of the restoration site and the associated drift cell before and after removal of the shoreline armor to generate topographic digital elevation models of the coast and measure the morphological change between the surveys. Boat-based lidar surveys were conducted in September 2015, about a year before removal of the shoreline armor, and June 2017, about eight months following removal. Data collection resulted in high-resolution, three-dimensional surface topography along 5 km of shoreline encompassing the Edgewater Beach restoration project site. Significant changes were observed at the restoration site with an increase in cross-shore area and effective beach width by the landward migration of MHHW and the seaward migration of MTL and MLW. About 1,405 m3 (1,838 yd3) of sediment was supplied from the base of the bluff behind the bulkhead. No significant bluff retreat was otherwise detected at the time of the second survey. The bluff material provided to the upper beach was sorted and distributed by coastal processes over time, leaving a residual deposit of 785 m3 (1,027 yd3) of mostly fine gravel on the upper beach and sand across the mid to lower beach at the restoration site and immediately downdrift (north of the site). A remaining 620 m3 (811 yd3) of sediment was transported to the nearshore or to points northward along the drift cell. The amount of large woody debris on the beach at the restoration site increased by 81%, primarily through the increase of fallen trees from the lower bluff as a direct consequence of armor removal, and to a lesser extent, natural recruitment due to lower bluff erosion and slope adjustment to form a natural toe near MHHW. Unarmored shoreline to the north and south of the site suggest an equilibrium bluff toe approximately 23-45 cm (0.75-1.5 ft) above MHHW, indicating that some modest adjustment of the bluff toe may continue at the project site in the future. The restoration of sediment supply from this reach of historic feeder bluff along the updrift end of the drift cell provides the basis for nearshore ecosystem enhancement within the drift cell. The observed increases in upper beach width, large woody debris, and the concentration of very fine to fine gravel along the upper beach indicate an improvement in beach habitat and the potential for greater surf smelt spawning and shorebird foraging. A preliminary sediment budget developed from the measured morphology changes suggests the restoration project represents 65% of the net sediment accumulation of the drift cell downdrift of the project site. Northward sediment transport resulted in the deposition of 169 m3/yr (221 yd3/yr) of sediment in the Rignall area, and an influx of 381 m3/yr (498 yd3/yr) of sediment measured at Hunter Point, where the beach increased in elevation by an average of 12 cm (0.4 ft). Additional surveys are required to refine the sediment budget and determine the regional and long-term physical and ecological effects of the restoration project.

This page is purposely left blank
Publication 18-06-002 1 February 2018
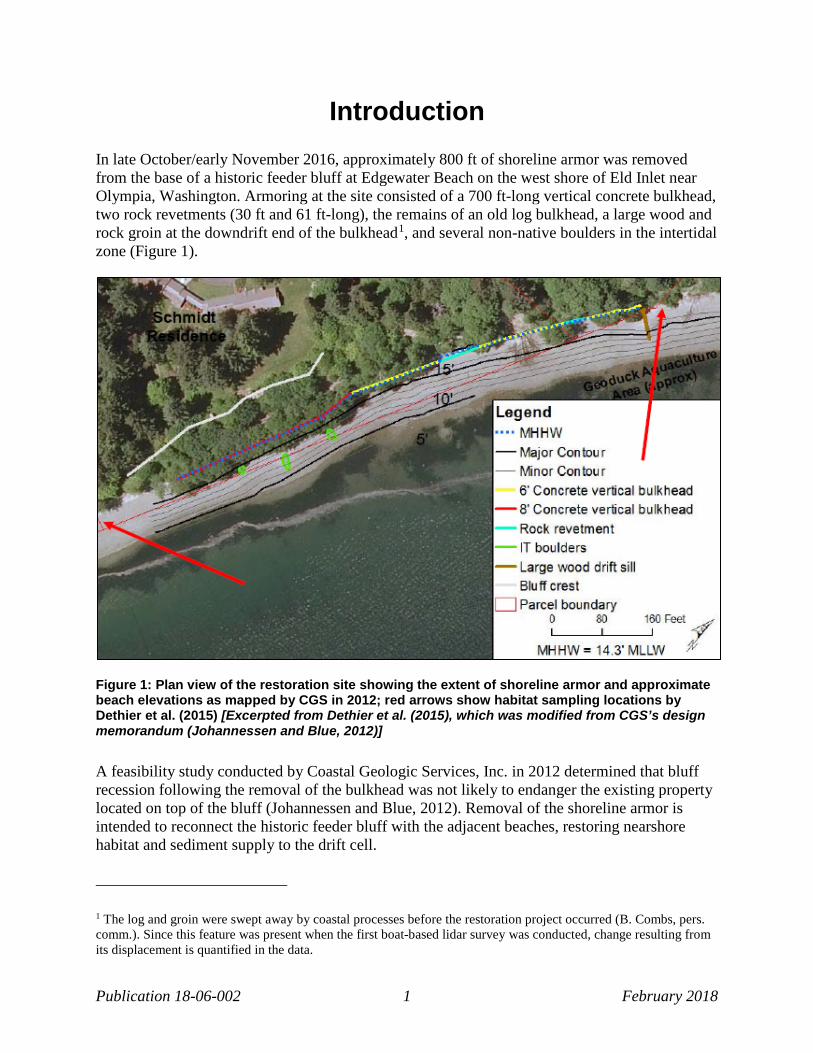
Introduction In late October/early November 2016, approximately 800 ft of shoreline armor was removed from the base of a historic feeder bluff at Edgewater Beach on the west shore of Eld Inlet near Olympia, Washington. Armoring at the site consisted of a 700 ft-long vertical concrete bulkhead, two rock revetments (30 ft and 61 ft-long), the remains of an old log bulkhead, a large wood and rock groin at the downdrift end of the bulkhead1, and several non-native boulders in the intertidal zone (Figure 1).
Figure 1: Plan view of the restoration site showing the extent of shoreline armor and approximate beach elevations as mapped by CGS in 2012; red arrows show habitat sampling locations by Dethier et al. (2015) [Excerpted from Dethier et al. (2015), which was modified from CGS’s design memorandum (Johannessen and Blue, 2012)]
A feasibility study conducted by Coastal Geologic Services, Inc. in 2012 determined that bluff recession following the removal of the bulkhead was not likely to endanger the existing property located on top of the bluff (Johannessen and Blue, 2012). Removal of the shoreline armor is intended to reconnect the historic feeder bluff with the adjacent beaches, restoring nearshore habitat and sediment supply to the drift cell.
1 The log and groin were swept away by coastal processes before the restoration project occurred (B. Combs, pers. comm.). Since this feature was present when the first boat-based lidar survey was conducted, change resulting from its displacement is quantified in the data.

Coastal morphology change in response to bulkhead removal at Edgewater Beach
Publication 18-06-002 2 February 2018
To document changes resulting from the removal of the shoreline armor, there are several research groups monitoring various biological and geomorphic aspects of the beach and nearshore environment. The Washington State Department of Ecology Coastal Monitoring & Analysis Program (CMAP) was contracted to collect high-resolution boat-based lidar data before and after the bulkhead was removed to measure coastal morphological changes. Data were collected on September 24, 2015, a year before the bulkhead was removed, and again on June 22, 2017, almost eight months after removal.
Lidar data were collected for the entire drift cell plus the two adjacent short drift cells on either side, totaling 5 km of shoreline. As mapped by Schwartz et al. (1991), the restoration site at Edgewater Beach is located near the south end of net shore-drift cell TH-8-5, which has a northward sediment-transport direction, while the adjacent drift cells, TH-8-6 to the north and TH-8-4 to the south, have an opposite transport direction (Figure 2).
Figure 2: Survey area map, including net shore-drift directions

Introduction
Publication 18-06-002 3 February 2018
In addition to mapping coastal morphology, CMAP also collected sediment grain-size data along five transects at the south end of the Edgewater Beach drift cell (Figure 3). Changes in beach sediments can provide insight to sediment supply and transport processes as well as characterize potential habitat for species that require specific sediment grain sizes.
Figure 3: Map showing transect locations for sediment grain-size sampling at the southern end of the survey area

This page is purposely left blank

Publication 18-06-002 5 February 2018
Vessel and Equipment Boat-based lidar data were collected using an Optech ILRIS HD-ER laser scanner with motion compensation deployed from Ecology’s research vessel, the R/V George Davidson, a 28-ft aluminum, twin-hull landing craft (Figure 4). The laser scanner has a maximum range of up to 1,800 m and a repetition rate of 10,000 Hz. The raw positional accuracy of the scanner is specified to be 0.7 cm at a distance of 100 m, where it has a beam diameter of 1.9 cm. The laser has a narrow beam divergence of 0.15 mrad, which corresponds to an increase of only 1.5 cm in diameter per 100-m distance. The wavelength of the laser is absorbed by water, which allows for a distinct waterline where wave swash is not present; however, returns on wet beaches are sparse.
Figure 4: Ecology CMAP research vessel, the R/V George Davidson
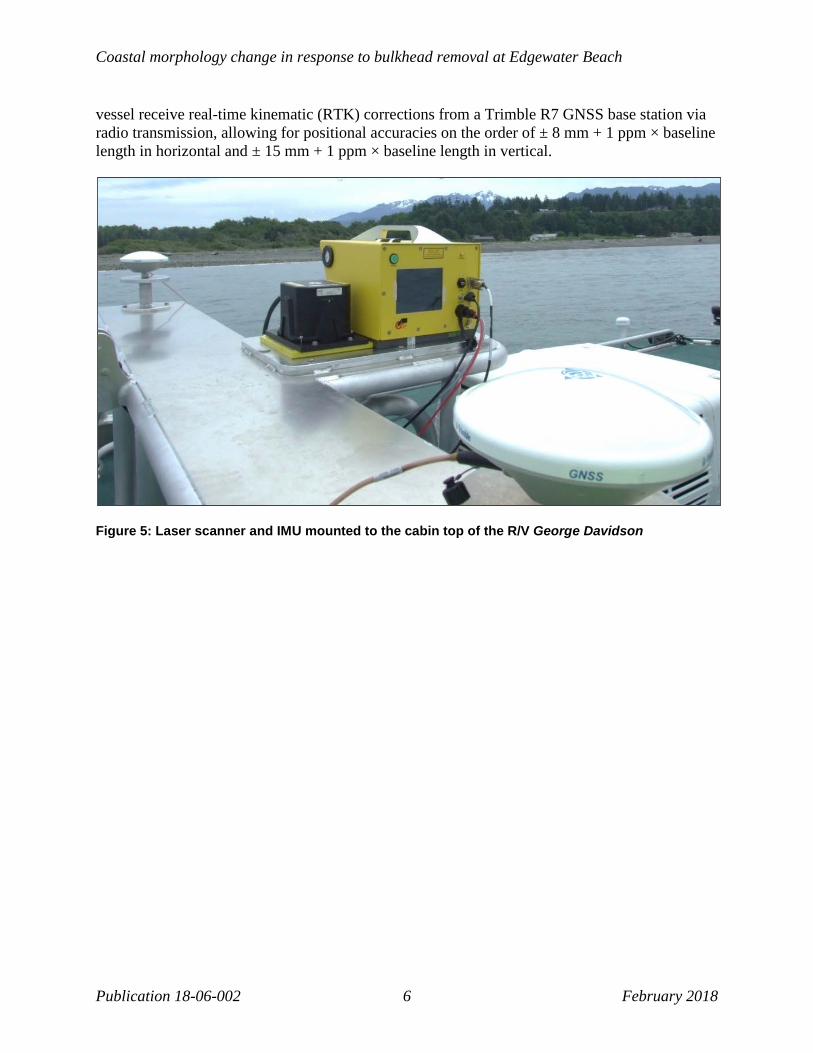
The laser scanner is coupled with a GNSS-aided inertial navigation system, the Applanix Position and Orientation System for Marine Vessels (POS MV 320 V5 RTK), used for georeferencing and motion compensation to obtain accurate positioning of the lidar data. The inertial measurement unit (IMU) is mounted immediately adjacent to the laser scanner while two Global Navigation Satellite System (GNSS) antennas are mounted on either side of the cabin top with a separation distance of 6 ft (Figure 5). With these components, the POS MV can resolve the vessel’s motion (roll, pitch, and heading) to an accuracy of < 0.02°. Real-time heave measurements are accurate to approximately 5 cm, which can be improved to 2 cm after post-processing. Trimble R8-3 and R10 receivers are used by surveyors on land and mounted to backpacks to collect additional beach topography data on foot. These rovers and the POS MV system on the
Coastal morphology change in response to bulkhead removal at Edgewater Beach
Publication 18-06-002 6 February 2018
vessel receive real-time kinematic (RTK) corrections from a Trimble R7 GNSS base station via radio transmission, allowing for positional accuracies on the order of ± 8 mm + 1 ppm × baseline length in horizontal and ± 15 mm + 1 ppm × baseline length in vertical.
Figure 5: Laser scanner and IMU mounted to the cabin top of the R/V George Davidson
Publication 18-06-002 7 February 2018
Methodology
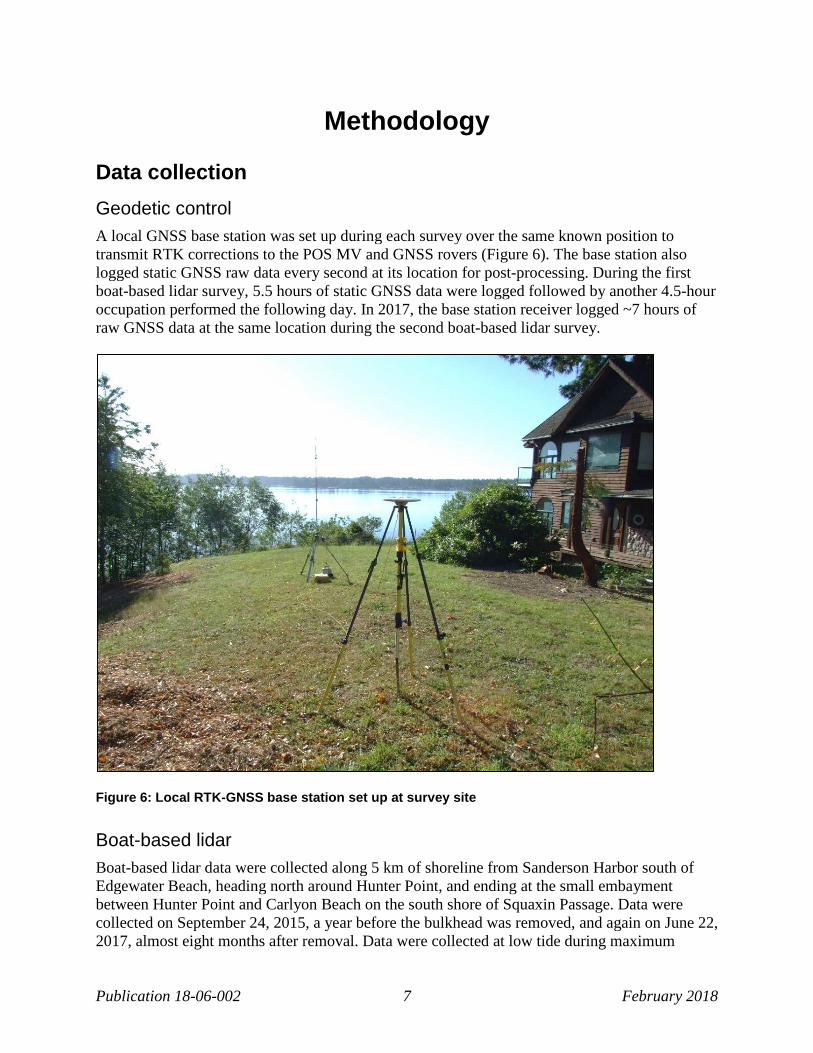
Data collection Geodetic control A local GNSS base station was set up during each survey over the same known position to transmit RTK corrections to the POS MV and GNSS rovers (Figure 6). The base station also logged static GNSS raw data every second at its location for post-processing. During the first boat-based lidar survey, 5.5 hours of static GNSS data were logged followed by another 4.5-hour occupation performed the following day. In 2017, the base station receiver logged ~7 hours of raw GNSS data at the same location during the second boat-based lidar survey.
Figure 6: Local RTK-GNSS base station set up at survey site
Boat-based lidar Boat-based lidar data were collected along 5 km of shoreline from Sanderson Harbor south of Edgewater Beach, heading north around Hunter Point, and ending at the small embayment between Hunter Point and Carlyon Beach on the south shore of Squaxin Passage. Data were collected on September 24, 2015, a year before the bulkhead was removed, and again on June 22, 2017, almost eight months after removal. Data were collected at low tide during maximum
Coastal morphology change in response to bulkhead removal at Edgewater Beach
Publication 18-06-002 8 February 2018
exposure of the beach; however, multiple passes of select areas, such as the Edgewater Beach restoration site, were made at a higher tide to achieve greater data density and higher resolution on the upper beach. During lidar data acquisition, the vessel slowly moved alongshore at a speed of ~1 kt while the laser continuously scanned in a vertical line pattern. The angular interval between laser pulses was set at 0.09°, which equates to a vertical point spacing of 1.6 cm at distance of 100 m. An object’s range was determined using the last returned laser pulse. Data from the laser scanner and IMU were integrated in Quality Positioning Services (QPS) QINSy hydrographic software (v8.16.1), which was also used for navigation. Position and orientation data from the IMU were logged at 10 Hz for post-processing. High-resolution digital photographs of the shoreline were taken from the vessel simultaneously to document the landscape.
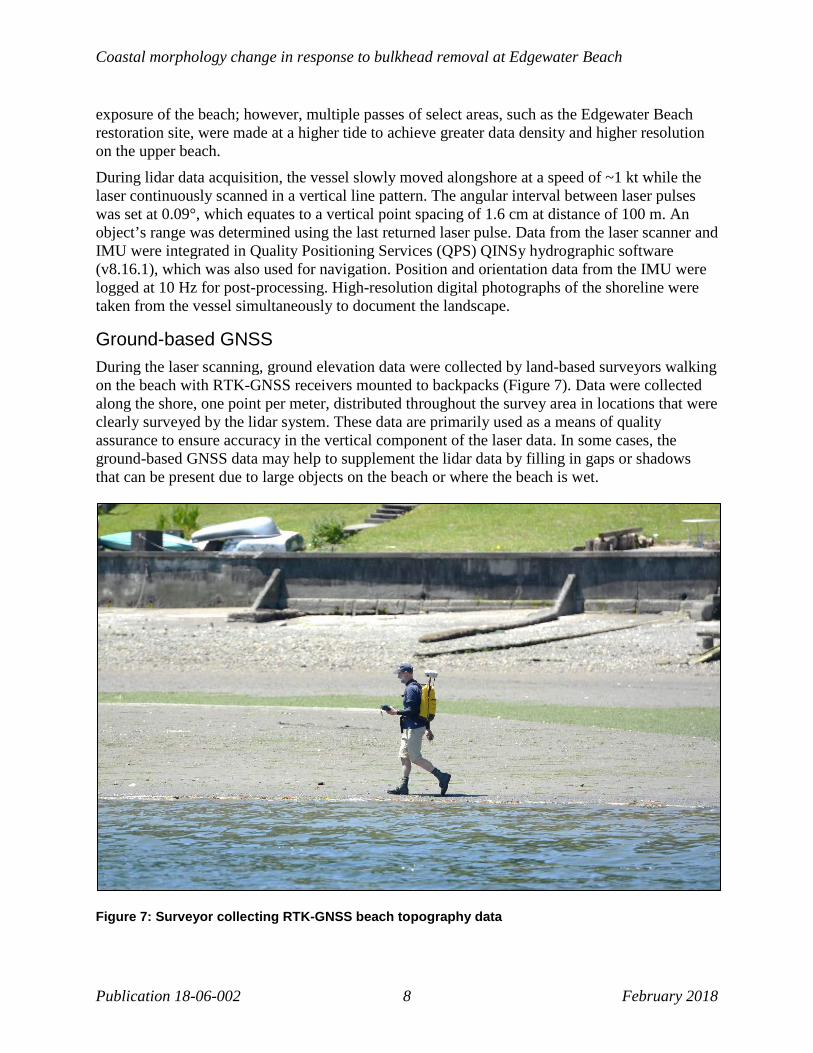
Ground-based GNSS During the laser scanning, ground elevation data were collected by land-based surveyors walking on the beach with RTK-GNSS receivers mounted to backpacks (Figure 7). Data were collected along the shore, one point per meter, distributed throughout the survey area in locations that were clearly surveyed by the lidar system. These data are primarily used as a means of quality assurance to ensure accuracy in the vertical component of the laser data. In some cases, the ground-based GNSS data may help to supplement the lidar data by filling in gaps or shadows that can be present due to large objects on the beach or where the beach is wet.
Figure 7: Surveyor collecting RTK-GNSS beach topography data
Methodology
Publication 18-06-002 9 February 2018
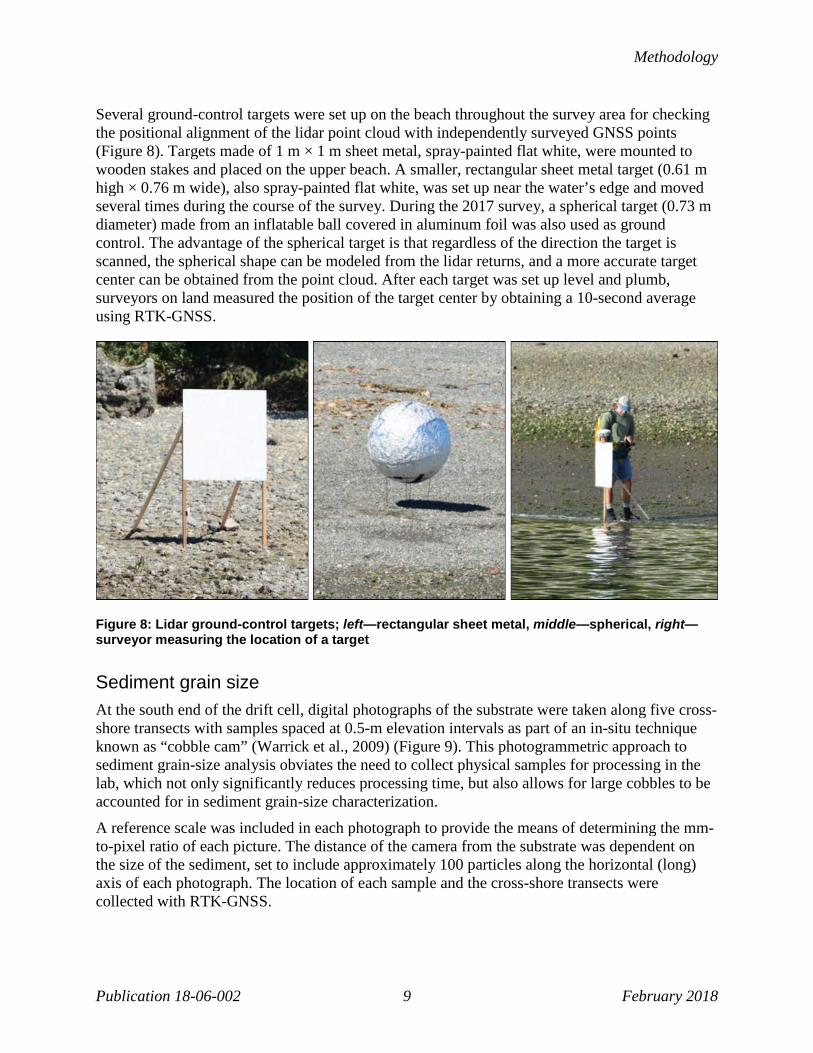
Several ground-control targets were set up on the beach throughout the survey area for checking the positional alignment of the lidar point cloud with independently surveyed GNSS points (Figure 8). Targets made of 1 m × 1 m sheet metal, spray-painted flat white, were mounted to wooden stakes and placed on the upper beach. A smaller, rectangular sheet metal target (0.61 m high × 0.76 m wide), also spray-painted flat white, was set up near the water’s edge and moved several times during the course of the survey. During the 2017 survey, a spherical target (0.73 m diameter) made from an inflatable ball covered in aluminum foil was also used as ground control. The advantage of the spherical target is that regardless of the direction the target is scanned, the spherical shape can be modeled from the lidar returns, and a more accurate target center can be obtained from the point cloud. After each target was set up level and plumb, surveyors on land measured the position of the target center by obtaining a 10-second average using RTK-GNSS.
Figure 8: Lidar ground-control targets; left—rectangular sheet metal, middle—spherical, right—surveyor measuring the location of a target
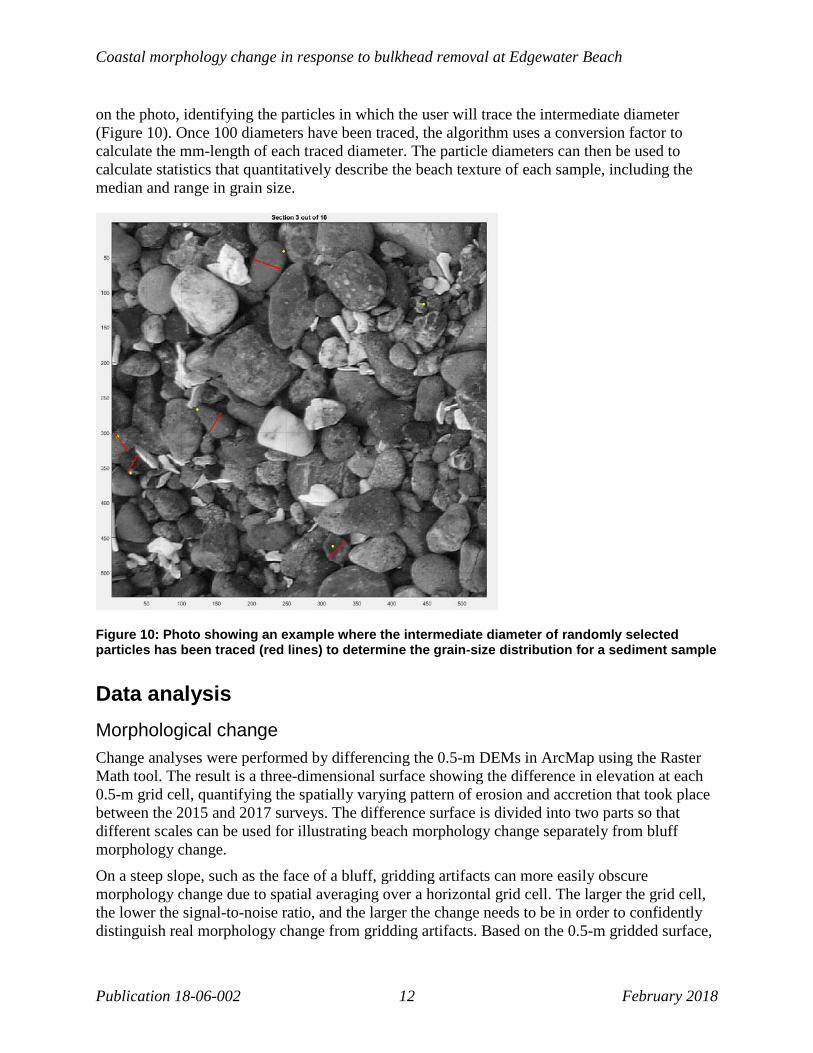
Sediment grain size At the south end of the drift cell, digital photographs of the substrate were taken along five cross-shore transects with samples spaced at 0.5-m elevation intervals as part of an in-situ technique known as “cobble cam” (Warrick et al., 2009) (Figure 9). This photogrammetric approach to sediment grain-size analysis obviates the need to collect physical samples for processing in the lab, which not only significantly reduces processing time, but also allows for large cobbles to be accounted for in sediment grain-size characterization. A reference scale was included in each photograph to provide the means of determining the mm-to-pixel ratio of each picture. The distance of the camera from the substrate was dependent on the size of the sediment, set to include approximately 100 particles along the horizontal (long) axis of each photograph. The location of each sample and the cross-shore transects were collected with RTK-GNSS.

Coastal morphology change in response to bulkhead removal at Edgewater Beach
Publication 18-06-002 10 February 2018
Figure 9: Surveyor taking photo for sediment grain-size analysis
Data processing Geodetic control An accurate position for the location of the base station was determined in the office by processing the static GNSS data logged during the first boat-based lidar survey and the following day through the National Geodetic Survey’s Online Positioning User Service (OPUS; accessible at: https://www.ngs.noaa.gov/OPUS/) and computing the average of the two solutions (Table 1). These coordinates were used during post-processing of the boat-based lidar and ground-based GNSS data for both the first and second surveys to ensure all data are identically georeferenced.
Table 1: Coordinates for RTK-GNSS base station used during surveys
NAD83 (2011) Ellips Ht (m)
WA State Plane North Elev (m, NAVD88) Latitude Longitude Easting (m) Northing (m)
47° 9' 9.15282" 122° 55' 51.01776" 1.004 315682.898 205051.231 22.891
The GNSS data logged by the base station receiver during the second survey were processed through OPUS to compare the solution with the established coordinates. The values varied by 1.9 cm in Easting, 2.4 cm in Northing, and only 0.7 cm in elevation. Small variations in the coordinates are expected as more data is collected over the same point and will ultimately converge onto a well-established set of coordinates. This does, however, show that the reference point has not significantly moved between the two surveys.
Boat-based lidar Data logged by the base station during the survey, along with the final coordinates from OPUS, were used to post-process the vessel’s position in Applanix POSPac Mobile Mapping Suite

Methodology
Publication 18-06-002 11 February 2018
software (POSPac MMS v8.0) using Applanix IN-Fusion Single Base Station Processing to correct for RTK dropouts experienced in the field and establish accurate vessel positioning. The resultant Smoothed Best Estimate of Trajectory (SBET) file was applied to the lidar data in Qimera v1.5 to adjust the point-cloud position. An initial cleaning of the post-processed point cloud was performed in Qloud v2.3 to remove high-fliers, reflections, and other noise due to sun glare or debris on the water surface. Final cleaning and point-cloud classification was completed in the QPS 3D Editor (available in both Qimera v1.5 and Fledermaus v7.7) by examining cross-sections of the point cloud in three dimensions to remove all vegetation, buildings, large woody debris, and to define a clear waterline, resulting in a “bare-earth” surface. Backshore protection structures (i.e., armoring) were left in the point cloud as a contiguous part of the ground surface. Data upland of the bluff crest were rejected. Digital photos taken during the survey, along with aerial imagery from Google Earth and oblique shoreline photos from the Washington Coastal Atlas, were used when needed to interpret and classify the lidar point cloud. Photomosaics for select areas were made by stitching overlapping photos taken from the boat together using Autopano Giga Pro v3.0. Point-cloud data from individual passes along the shoreline were compared to one another in MATLAB and adjusted for agreement. Areas of the point cloud on the beach with low standard deviation, a relatively uniform slope, and gravel-sized or finer texture were extracted for comparison with the ground-based GNSS data.
Ground-based GNSS GNSS data collected on the beach and at each laser target were processed in Trimble Business Center v3.70 using the final coordinates computed for the base station location. Data points between surveyors within a 30-cm radius were compared in MATLAB, and each surveyor’s data were adjusted for vertical agreement based on the average of individual comparisons to produce the final XYZ coordinates for the GNSS data. The final GNSS data were compared to surrounding lidar points within a 30-cm radius to determine an average vertical offset between the two datasets. For the 2017 survey, an offset was calculated for each pass made by the vessel since certain sections of the beach were scanned multiple times at different tide levels. The lidar point cloud was adjusted vertically (+Z) to match the GNSS data.
Digital elevation model The clean, adjusted lidar point cloud for the ground surface and GNSS beach topography data from each survey were combined in Qimera and gridded using the average elevation within a 0.5-m grid cell. “Bare-earth” digital elevation models (DEMs) with 0.5-m resolution of the beach and bluff (where visible through the vegetation) were created in ArcGIS v10.2 by interpolating the gridded data using a Triangulated Irregular Network (TIN). Elevation contours were subsequently extracted from the DEMs and smoothed using a 10-m tolerance.
Sediment grain size Sediment grain-size photos were processed using a MATLAB-based point-count algorithm developed by Ian Miller of Washington Sea Grant. First, a mm-to-pixel ratio is established using the reference scale in the photograph. Next, the point-count algorithm randomly places 100 dots
Coastal morphology change in response to bulkhead removal at Edgewater Beach
Publication 18-06-002 12 February 2018
on the photo, identifying the particles in which the user will trace the intermediate diameter (Figure 10). Once 100 diameters have been traced, the algorithm uses a conversion factor to calculate the mm-length of each traced diameter. The particle diameters can then be used to calculate statistics that quantitatively describe the beach texture of each sample, including the median and range in grain size.
Figure 10: Photo showing an example where the intermediate diameter of randomly selected particles has been traced (red lines) to determine the grain-size distribution for a sediment sample
Data analysis Morphological change Change analyses were performed by differencing the 0.5-m DEMs in ArcMap using the Raster Math tool. The result is a three-dimensional surface showing the difference in elevation at each 0.5-m grid cell, quantifying the spatially varying pattern of erosion and accretion that took place between the 2015 and 2017 surveys. The difference surface is divided into two parts so that different scales can be used for illustrating beach morphology change separately from bluff morphology change. On a steep slope, such as the face of a bluff, gridding artifacts can more easily obscure morphology change due to spatial averaging over a horizontal grid cell. The larger the grid cell, the lower the signal-to-noise ratio, and the larger the change needs to be in order to confidently distinguish real morphology change from gridding artifacts. Based on the 0.5-m gridded surface,

Methodology
Publication 18-06-002 13 February 2018
changes on the bluff less than approximately ± 0.75 m are attributed to noise or artifacts from the gridding process; in contrast, changes on the beach less than ± 10 cm are considered noise. The breakline between the beach and bluff or upland was determined using the seaward-most break in slope of 20°, which corresponds well to the toe of the bluff or shoreline armor. To decrease the artifacts in the difference surface, the bare-earth surface could be gridded at a higher resolution (e.g., 10 or 20 cm). However, on a densely vegetated bluff, the ground surface is partially masked by returns from the vegetation, which lowers the data density on the bluff so a finer resolution grid is not always the best option. For the highest resolution morphology change on a steep surface, the volume-change calculations could be performed in horizontal space rather than vertical, requiring a transformation of the vertical axis. However, because the post-project survey was not performed immediately upon completion of the project and there are no records of the actual volume of material removed from the site during the project, there is little advantage to obtaining a higher resolution volumetric calculation of the bluff change. Transformation of the vertical axis is implemented herein only for two-dimensional cross-shore profiles extracted from the lidar point cloud to illustrate the resolution of volume change calculations that are possible. Two-dimensional cross-shore profiles were extracted from the lidar point cloud in MATLAB at approximately 20-m intervals between the sediment grain-size transects to examine the change before and after bulkhead removal (Figure 11). To generate the profiles, the point cloud was first transformed in space to a line 60° from horizontal. Transforming the two-dimensional space allows for multiple elevation values to be chosen for the same cross-shore distance in order to properly plot vertical features, like bulkheads, as well as over-steepened or overhanging bluffs. Points along the profile were then calculated at 0.125-m intervals along the angled transformation axis from an average of the lidar points within a 0.25 × 1 m window, resulting in a true cross-shore point spacing of 6.25 cm on a horizontal surface (cosine of 60°) and 11 cm on a vertical surface (sine of 60°).
Sediment grain size The grain-size distribution for each sample was determined by arranging the particle diameters in order of ascending size. The median grain size (the diameter that splits a grain-size distribution in half; D50), was determined for each sediment sample. The D10 and D90 diameters, which are commonly used to represent the range of grain sizes present in a given sample and identify the diameter at which 10% or 90% of a sample’s particles are finer than, were also determined. The percent change in these D-values for samples collected at the same elevations during both the 2015 and 2017 surveys are used to detect significant changes in beach texture along a transect.

Coastal morphology change in response to bulkhead removal at Edgewater Beach
Publication 18-06-002 14 February 2018
Figure 11: Map showing location of cross-shore profiles extracted from the lidar point clouds; featured profiles shown in yellow are included in this report

Publication 18-06-002 15 February 2018
Results
Lidar positioning For the seven ground-control targets measured during the 2015 survey, the average of the absolute value of the differences between the lidar point cloud and GNSS-surveyed points was 15.2 ± 5.4 cm in the horizontal (9.2 cm in Easting and 11.0 cm in Northing) and 15.8 ± 3.2 cm in the vertical, with the lidar data being lower. The vertical difference between the subset of lidar point cloud for the beach only and GNSS beach topography data was 13.4 ± 5.5 cm (N = 5,055). Because the beach topography data includes a much larger sample size distributed throughout the survey area compared to the targets, the offset between these data and the lidar was used to shift the lidar point cloud higher by 13 cm. After the adjustment, the whole point cloud showed good vertical agreement with the GNSS data, with an average offset of 0.5 ± 6.0 cm (N = 8,457). In 2017, the average of the absolute value of the differences between the lidar point cloud and GNSS-surveyed points for the seven ground-control targets plus a large, steel mooring ball present on the beach (1.48-m diameter) was 5.0 ± 6.3 cm in the horizontal (2.7 cm in Easting and 3.9 cm in Northing) and 17.5 ± 2.0 cm in the vertical, again with the lidar data being lower. The horizontal positioning improved during this survey (5 vs. 15 cm difference with the targets), which is likely due to a better boresight calibration2 applied to the 2017 survey. The vertical difference between the lidar point cloud from each individual pass and the GNSS beach topography data ranged between 12.6 ± 4.1 cm (N = 2,749) and 21.1 ± 3.5 cm (N = 189). The data from each pass were adjusted independently by the corresponding offset, tightening the spread of the lidar point cloud over the survey area (overall standard deviation of 4.4 vs. 4.9 cm). After the adjustment, the point cloud showed good vertical agreement with the GNSS data, with an average offset of 0.3 ± 4.4 cm (N = 9,334).
Point-cloud classification Detailed classification of the 2015 and 2017 lidar point clouds was performed for the Edgewater Beach restoration site. Features in the point cloud were identified and classified into four main groups: ground, vegetation, large woody debris, and armoring (Figure 12 and Figure 13). With the point cloud classified, different groups of points can be turned on or off to examine and quantify various morphological and ecological aspects of the shoreline. As seen in Panel C of the above-mentioned figures, the vegetation can be turned off, revealing the surface of the bluff underneath (provided there were enough returns on the ground surface through the vegetation). Points classified as ground and shoreline armoring (Panel D) are used to create the final bare-earth DEM.
2 A boresight calibration aims to correct for misalignments between the laser scanner and IMU by solving for the angular offsets between the two systems. Incorrect angular offsets could result in less accurate positioning of the laser returns, which can vary with range or heading.

Coastal morphology change in response to bulkhead removal at Edgewater Beach
Publication 18-06-002 16 February 2018
Figu
re 1
2: P
hoto
s an
d da
ta o
f the
Edg
ewat
er B
each
rest
orat
ion
site
col
lect
ed d
urin
g th
e 20
15 s
urve
y; (A
) sho
relin
e pa
nora
ma,
(B)
clas
sifie
d po
int c
loud
, (C
) cla
ssifi
ed p
oint
clo
ud w
ith v
eget
atio
n an
d w
oody
deb
ris re
mov
ed, (
D) g
roun
d po
ints
col
ored
by
elev
atio
n

Results
Publication 18-06-002 17 February 2018
Figu
re 1
3: P
hoto
s an
d da
ta o
f the
Edg
ewat
er B
each
rest
orat
ion
site
col
lect
ed d
urin
g th
e 20
17 s
urve
y; (A
) sho
relin
e pa
nora
ma,
(B)
clas
sifie
d po
int c
loud
, (C
) cla
ssifi
ed p
oint
clo
ud w
ith v
eget
atio
n an
d w
oody
deb
ris re
mov
ed, (
D) g
roun
d po
ints
col
ored
by
elev
atio
n
Coastal morphology change in response to bulkhead removal at Edgewater Beach
Publication 18-06-002 18 February 2018
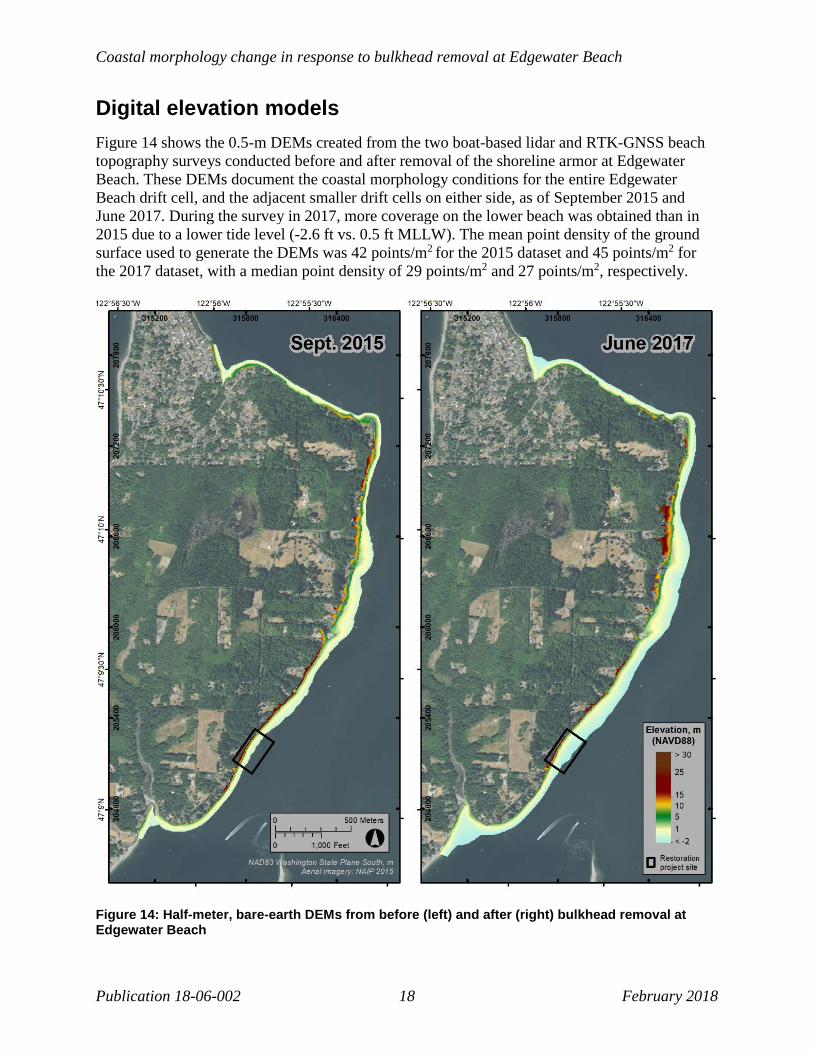
Digital elevation models Figure 14 shows the 0.5-m DEMs created from the two boat-based lidar and RTK-GNSS beach topography surveys conducted before and after removal of the shoreline armor at Edgewater Beach. These DEMs document the coastal morphology conditions for the entire Edgewater Beach drift cell, and the adjacent smaller drift cells on either side, as of September 2015 and June 2017. During the survey in 2017, more coverage on the lower beach was obtained than in 2015 due to a lower tide level (-2.6 ft vs. 0.5 ft MLLW). The mean point density of the ground surface used to generate the DEMs was 42 points/m2 for the 2015 dataset and 45 points/m2 for the 2017 dataset, with a median point density of 29 points/m2 and 27 points/m2, respectively.
Figure 14: Half-meter, bare-earth DEMs from before (left) and after (right) bulkhead removal at Edgewater Beach

Results
Publication 18-06-002 19 February 2018
Sediment grain size In 2015, during the first survey, sediment grain-size photos were collected at 5-8 locations along each transect. During the survey in 2017, samples were collected at 8-12 locations per transect since the tide was lower and more of the lower beach was exposed. Sediments ranged in size between 0.13 and 164 mm, corresponding to fine sand and cobble using the Wentworth classification scheme (Table 2). Sediments ~0.1 mm or smaller (very fine sand, silt, clay, and colloidal material) were not detectable with the photogrammetric method applied.
Table 2: Color scheme used for sediment grain-size classes (after Wentworth, 1962 and Krumbein and Sloss, 1963)
Size range φ scale
Aggregate name Other names
(metric) (approx. inches) (Wentworth Class) > 256 mm > 10.1 in < −8 Boulder 64–256 mm 2.5–10.1 in −6 to −8 Cobble 32–64 mm 1.26–2.5 in −5 to −6 Very coarse gravel Pebble 16–32 mm 0.63–1.26 in −4 to −5 Coarse gravel Pebble 8–16 mm 0.31–0.63 in −3 to −4 Medium gravel Pebble 4–8 mm 0.157–0.31 in −2 to −3 Fine gravel Pebble 2–4 mm 0.079–0.157 in −1 to −2 Very fine gravel Granule 1–2 mm 0.039–0.079 in 0 to −1 Very coarse sand 0.5–1 mm 0.020–0.039 in 1 to 0 Coarse sand 0.25-0.5 mm 0.010–0.020 in 2 to 1 Medium sand 125–250 µm 0.0049–0.010 in 3 to 2 Fine sand 62.5–125 µm 0.0025–0.0049 in 4 to 3 Very fine sand 3.90625–62.5 µm 0.00015–0.0025 in 8 to 4 Silt Mud < 3.90625 µm < 0.00015 in > 8 Clay Mud < 1 µm < 0.000039 in >10 Colloid Mud
Figure 15 shows the grain-size class associated with the median grain size (D50) of each sediment sample collected at the five cross-shore transects before and after the shoreline armor was removed. In general, sediments found lower than about -0.5 m NAVD88 elevation on the beach profile are typically sand (2 mm or less), while coarser sediments are found on the mid to upper beach. See Table 4 in Appendix A for tidal datum conversions between NAVD88 and MLLW. Transects 1 and 2 located south of the restoration site by 590 and 95 m, respectively, exhibited the coarsest sediments overall, with medium to very coarse gravel making up most of the samples between 1-2.5 m elevation. In 2015, Transect 5 (220 m north of the restoration site) had the finest sediments overall, with an average D50 of 1.7 mm (very coarse sand). In 2017, the transect with the smallest average median grain size was Transect 3, located at the bulkhead removal site (average D50 of 2.8 mm or very fine gravel).

Coastal morphology change in response to bulkhead removal at Edgewater Beach
Publication 18-06-002 20 February 2018
Figure 15: Sediment grain-size data collected at 0.5-meter elevation intervals along five cross-shore transects before and after bulkhead removal
Results
Publication 18-06-002 21 February 2018
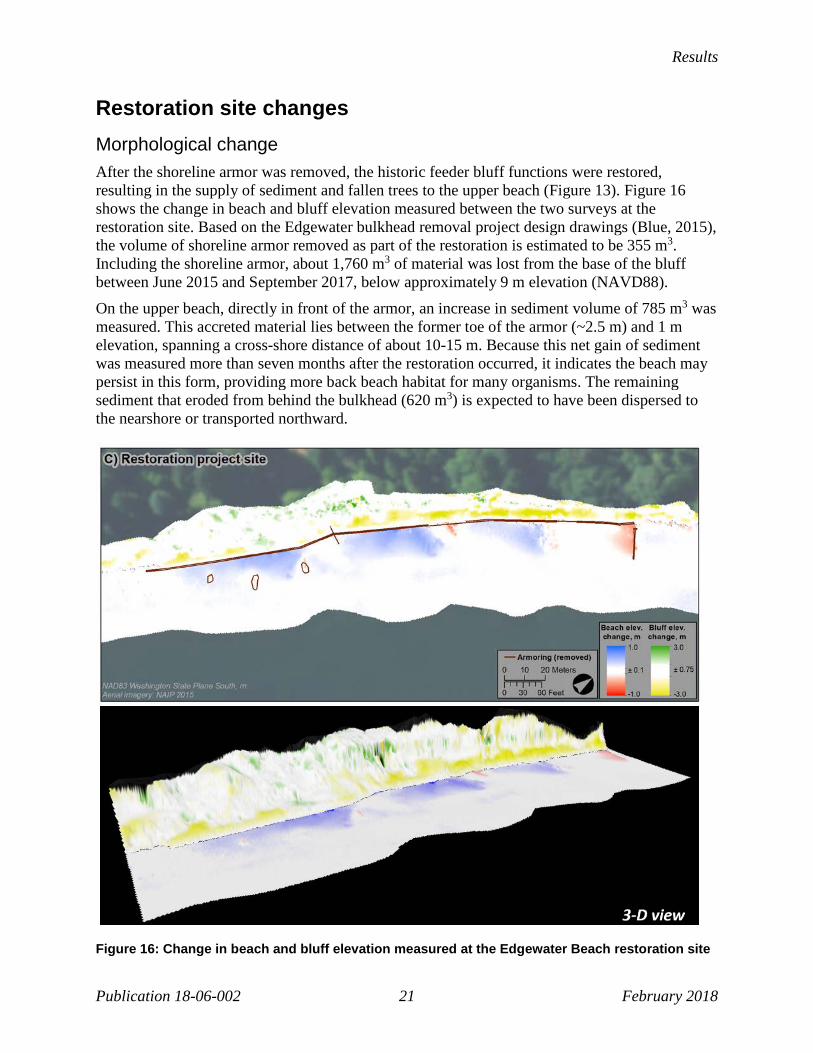
Restoration site changes Morphological change After the shoreline armor was removed, the historic feeder bluff functions were restored, resulting in the supply of sediment and fallen trees to the upper beach (Figure 13). Figure 16 shows the change in beach and bluff elevation measured between the two surveys at the restoration site. Based on the Edgewater bulkhead removal project design drawings (Blue, 2015), the volume of shoreline armor removed as part of the restoration is estimated to be 355 m3. Including the shoreline armor, about 1,760 m3 of material was lost from the base of the bluff between June 2015 and September 2017, below approximately 9 m elevation (NAVD88). On the upper beach, directly in front of the armor, an increase in sediment volume of 785 m3 was measured. This accreted material lies between the former toe of the armor (~2.5 m) and 1 m elevation, spanning a cross-shore distance of about 10-15 m. Because this net gain of sediment was measured more than seven months after the restoration occurred, it indicates the beach may persist in this form, providing more back beach habitat for many organisms. The remaining sediment that eroded from behind the bulkhead (620 m3) is expected to have been dispersed to the nearshore or transported northward.
Figure 16: Change in beach and bluff elevation measured at the Edgewater Beach restoration site

Coastal morphology change in response to bulkhead removal at Edgewater Beach
Publication 18-06-002 22 February 2018
A loss of beach sediment was measured immediately adjacent to the prior position of the large wood sill (log) that was realigned with the shore on the downdrift end of the restoration site (Figure 16). The eroded volume (54 m3 within an area of 215 m2 on the updrift side of the log) was likely distributed northward as the beach naturally regraded after the log was realigned. Before the shoreline armor was removed, the mean higher high water (MHHW; 3.15 m NAVD88) and mean high water (MHW; 2.86 m NAVD88) contours were along the face of the bulkhead (Figure 17). An average high tide would hit about 0.31 m (1.0 ft) up from the toe of the bulkhead, while the average of the highest tides would hit 0.60 m (~2.0 ft) up the bulkhead face.
Figure 17: Classified lidar point cloud showing the location of MHW and MHHW contours with respect to the bulkhead in 2015
After removal of the bulkhead, the MHHW contour moved landward at the restoration site by up to 3 m (9.8 ft) (Figure 18). The mean tide line (MTL; 1.28 m NAVD88) moved seaward by up to 4 m (13.1 ft) due to the increased sediment volume on the upper beach. The mean low water (MLW; -0.29 m NAVD88) contour moved seaward by about 1 m. More detailed cross-shore changes are presented in the reach-scale coastal profile change section. See Table 4 in Appendix A for tidal datum conversions between NAVD88 and MLLW.

Results
Publication 18-06-002 23 February 2018
Figure 18: Change in tidal datums at the Edgewater Beach restoration site
Habitat linkages Changes in large woody debris Large woody debris and associated terrestrial wrack are an important part of the beach ecosystem as they provide habitat for invertebrates that are a food source for fish and birds. Sediment deposition is generally enhanced locally by large woody debris, particularly along the updrift side of large wood, and among debris that dissipates wave energy on the upper beach. Large woody debris has been shown to increase the abundance and diversity of invertebrates that are important to juvenile salmon and the food web (Dethier et al., 2016; Sobocinski et al., 2010; Toft et al., 2007). The area of the beach covered by large woody debris almost doubled after removal of the bulkhead: there was an 81% increase between the first and second survey (Figure 19). Much of
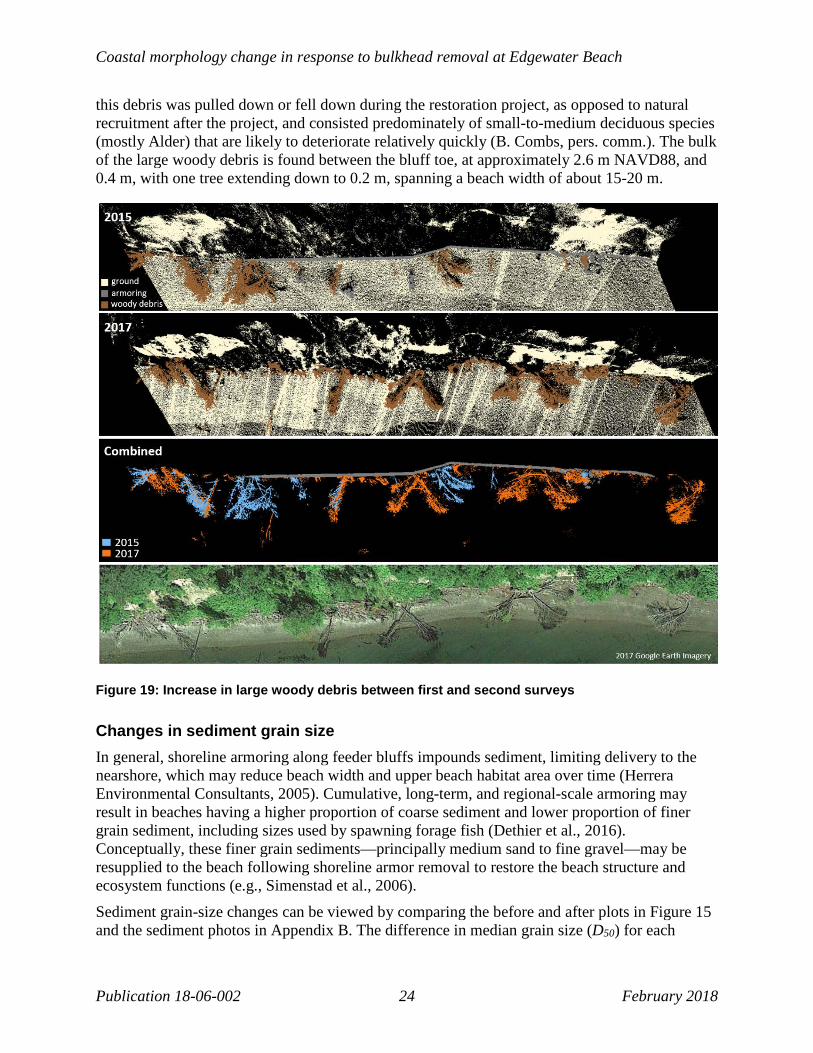
Coastal morphology change in response to bulkhead removal at Edgewater Beach
Publication 18-06-002 24 February 2018
this debris was pulled down or fell down during the restoration project, as opposed to natural recruitment after the project, and consisted predominately of small-to-medium deciduous species (mostly Alder) that are likely to deteriorate relatively quickly (B. Combs, pers. comm.). The bulk of the large woody debris is found between the bluff toe, at approximately 2.6 m NAVD88, and 0.4 m, with one tree extending down to 0.2 m, spanning a beach width of about 15-20 m.
Figure 19: Increase in large woody debris between first and second surveys
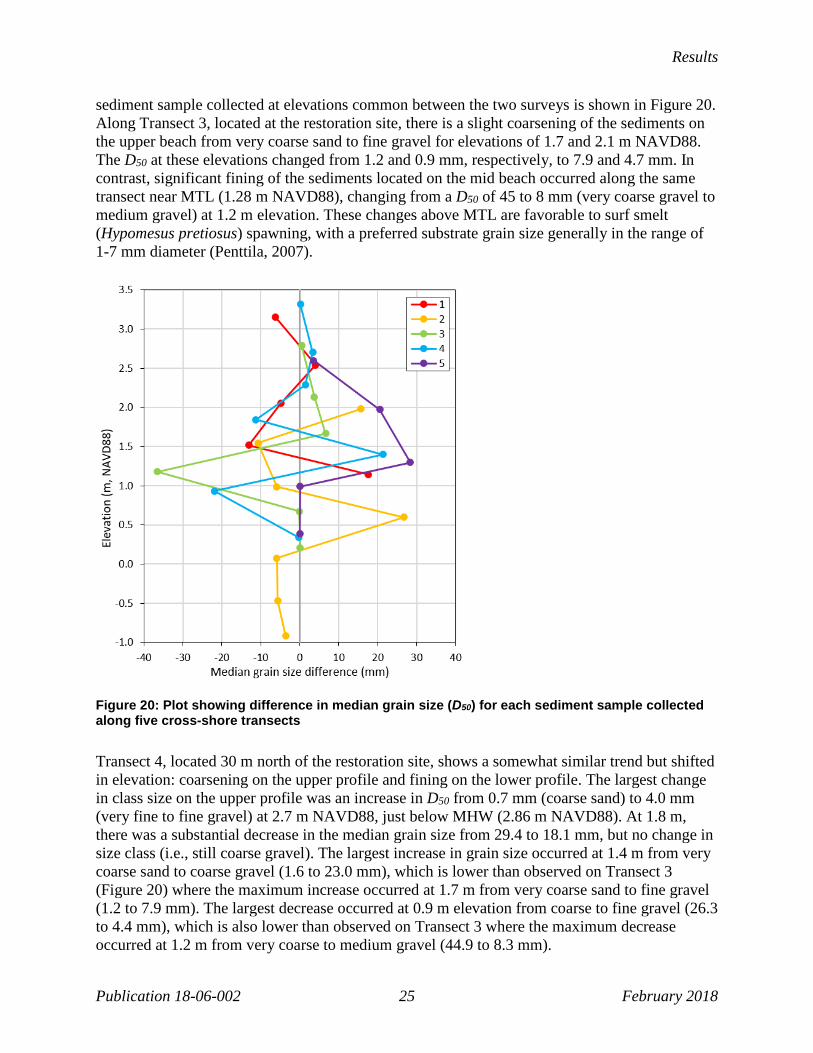
Changes in sediment grain size In general, shoreline armoring along feeder bluffs impounds sediment, limiting delivery to the nearshore, which may reduce beach width and upper beach habitat area over time (Herrera Environmental Consultants, 2005). Cumulative, long-term, and regional-scale armoring may result in beaches having a higher proportion of coarse sediment and lower proportion of finer grain sediment, including sizes used by spawning forage fish (Dethier et al., 2016). Conceptually, these finer grain sediments—principally medium sand to fine gravel—may be resupplied to the beach following shoreline armor removal to restore the beach structure and ecosystem functions (e.g., Simenstad et al., 2006). Sediment grain-size changes can be viewed by comparing the before and after plots in Figure 15 and the sediment photos in Appendix B. The difference in median grain size (D50) for each
Results
Publication 18-06-002 25 February 2018
sediment sample collected at elevations common between the two surveys is shown in Figure 20. Along Transect 3, located at the restoration site, there is a slight coarsening of the sediments on the upper beach from very coarse sand to fine gravel for elevations of 1.7 and 2.1 m NAVD88. The D50 at these elevations changed from 1.2 and 0.9 mm, respectively, to 7.9 and 4.7 mm. In contrast, significant fining of the sediments located on the mid beach occurred along the same transect near MTL (1.28 m NAVD88), changing from a D50 of 45 to 8 mm (very coarse gravel to medium gravel) at 1.2 m elevation. These changes above MTL are favorable to surf smelt (Hypomesus pretiosus) spawning, with a preferred substrate grain size generally in the range of 1-7 mm diameter (Penttila, 2007).
Figure 20: Plot showing difference in median grain size (D50) for each sediment sample collected along five cross-shore transects
Transect 4, located 30 m north of the restoration site, shows a somewhat similar trend but shifted in elevation: coarsening on the upper profile and fining on the lower profile. The largest change in class size on the upper profile was an increase in D50 from 0.7 mm (coarse sand) to 4.0 mm (very fine to fine gravel) at 2.7 m NAVD88, just below MHW (2.86 m NAVD88). At 1.8 m, there was a substantial decrease in the median grain size from 29.4 to 18.1 mm, but no change in size class (i.e., still coarse gravel). The largest increase in grain size occurred at 1.4 m from very coarse sand to coarse gravel (1.6 to 23.0 mm), which is lower than observed on Transect 3 (Figure 20) where the maximum increase occurred at 1.7 m from very coarse sand to fine gravel (1.2 to 7.9 mm). The largest decrease occurred at 0.9 m elevation from coarse to fine gravel (26.3 to 4.4 mm), which is also lower than observed on Transect 3 where the maximum decrease occurred at 1.2 m from very coarse to medium gravel (44.9 to 8.3 mm).

Coastal morphology change in response to bulkhead removal at Edgewater Beach
Publication 18-06-002 26 February 2018
Figure 21: Percent change in median grain size (D50), as well as representative fine (D10) and coarse (D90) fractions of the grain-size distribution, for each sediment sample collected at elevations common between the two surveys
Results
Publication 18-06-002 27 February 2018
Further north at Transect 5, an overall coarsening of the median grain size was observed along most of the transect between 1.0 to 2.6 m elevation (Figure 20), with the maximum change in D50 occurring at 1.3 m from 3.0 to 31.4 mm (very fine to almost very coarse gravel). Figure 21 shows the percent change in sediment grain size along each transect, spatially, with respect to the beach and bluff elevation change. In addition to the median grain size (D50), the 10th and 90th percentiles are also shown to illustrate the fine (D10) and coarse (D90) fractions of the grain-size distributions. In the figure, yellow indicates no change in grain size within ± 10% between the first and second surveys; orange through red signify fining; and shades of green show coarsening. At the bulkhead removal site (Transect 3), the fine, median, and coarse values all show a similar pattern: coarsening on the upper beach (1.7-2.8 m, except for D90 at 2.1 that shows a fining of the coarse fraction); fining on the mid beach (0.7-1.2 m); and slight coarsening of the fine and medium sand fractions at the lowest common sample elevation (0.2 m). At Transect 4, located 30 m north of the restoration site, the fine and median grain-size diameters shows a similar pattern to Transect 3, with fining of sediments extending lower on the profile (0.3-0.9 m). These cross-shore trends suggest that sand and finer material is being moved from the upper to lower beach face, coarsening the upper beach and burying larger sediments found lower on the profile in 2015. The coarsening of the upper beach at Transect 4 at 2.3 and 2.7 m elevations still provides suitable surf smelt spawning substrate with median grain sizes of 5.5 and 4.0 mm, respectively. Similarly, the upper beach at Transect 5 has a median grain size of 5.3 mm at 2.6 m, while the beach at 1.3 and 2 m elevations became significantly coarser.
Reach-scale coastal profile change Figure 22 shows a three-dimensional, oblique view of the two-dimensional cross-shore profiles at the restoration site overlaid on the classified ground surface lidar point cloud from which they were extracted. Large woody debris and thick vegetation fronting the bluff face can result in gaps in the ground surface of the point cloud. Nevertheless, in nearly all cases, boat-based lidar obtains ground elevation measurements at a density and resolution that is either infeasible or inefficient to collect using other survey methods, and it provides the ability to extract cross-shore profile data at any location. To visualize the context for the profile change between the two surveys, both the 2015 and 2017 profile data are shown on the 2015 lidar point cloud in Figure 23. As was shown in the three-dimensional difference surface (Figure 16), the lower beach and bluff face generally agree between the two datasets, and the areas with the highest change occurs across the lower bluff and upper beach where the bulkhead was removed. Figure 24 shows the change between the two-dimensional profiles focused on the lower bluff and upper beach within the context of the 2017 three-dimensional point cloud for selected profiles at the restoration site. Together, Figure 23 and Figure 24 illustrate the density of elevation measurements and the ability to detect profile change between September 2015 and June 2017 associated with armor removal in November 2016.

Coastal morphology change in response to bulkhead removal at Edgewater Beach
Publication 18-06-002 28 February 2018
Figu
re 2
2: T
hree
-dim
ensi
onal
vie
w o
f cro
ss-s
hore
pro
files
at t
he E
dgew
ater
Bea
ch re
stor
atio
n si
te o
verla
in o
n th
e co
rres
pond
ing
clas
sifie
d lid
ar p
oint
clo
ud fo
r 201
5 (le
ft) a
nd 2
017
(rig
ht)
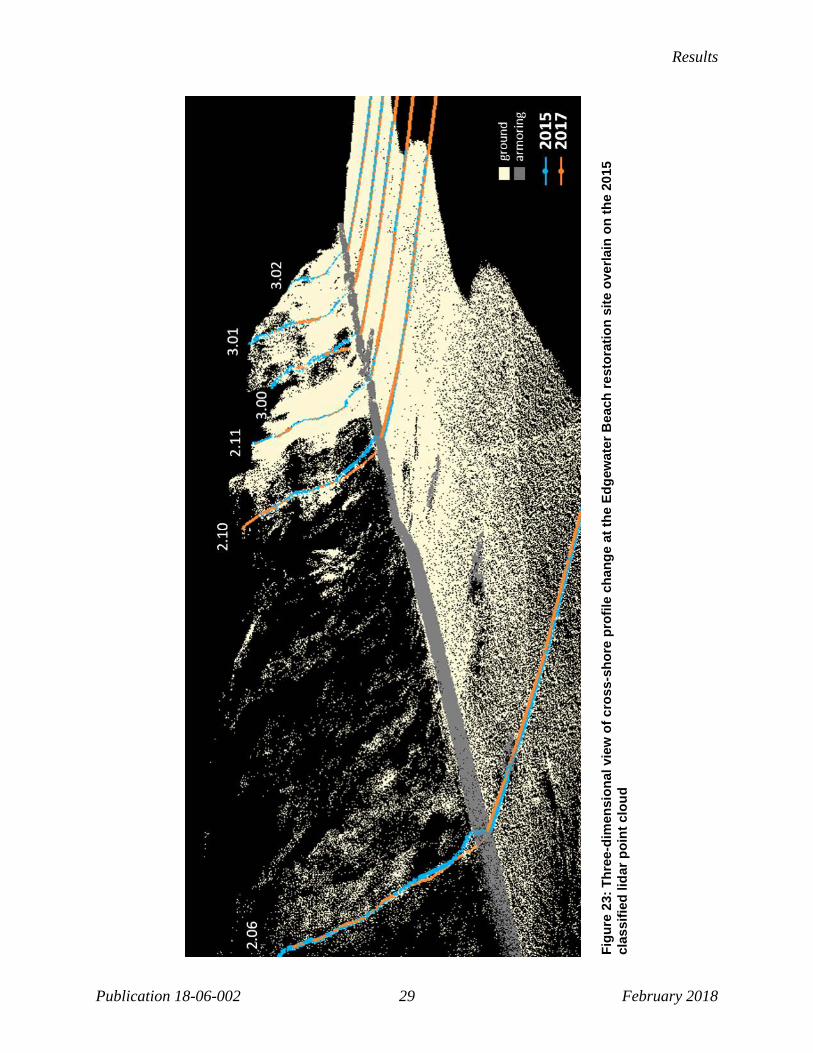
Results
Publication 18-06-002 29 February 2018
Figu
re 2
3: T
hree
-dim
ensi
onal
vie
w o
f cro
ss-s
hore
pro
file
chan
ge a
t the
Edg
ewat
er B
each
rest
orat
ion
site
ove
rlain
on
the
2015
cl
assi
fied
lidar
poi
nt c
loud

Coastal morphology change in response to bulkhead removal at Edgewater Beach
Publication 18-06-002 30 February 2018
Figure 24: Close-up view of the bluff toe for cross-shore profiles at the Edgewater Beach restoration site overlain on the 2017 classified lidar point cloud

Results
Publication 18-06-002 31 February 2018
Figure 25 through Figure 29 show example two-dimensional profile plots of the data extracted from the point cloud before and after removal of the shoreline armor. Transects 1.00 and 1.18, south of the restoration site, show little to no morphology change between the two surveys. The profiles illustrate the repeatability of the measurements and ability to resolve relatively small changes as well as the details of features in the landscape. For example, Figure 25 clearly shows the bluff toe elevation at Transect 1.00 is 0.3 m (~1 ft) above MHHW. Here, the slope of the beach is 6.4% between MHHW and MTL.
Figure 25: Cross-section of lidar point cloud along Transect 1.00 at south end of survey site
Transect 1.18, in Figure 26, shows a coastal profile at a bulkhead typical of the reach to the south of the restoration site, with the top and toe of the bulkhead located at 4.0 m (13.1 ft) and 2.5 m (8.2 ft), respectively, and their position relative to select tidal datums; for example, the toe of the bulkhead is 0.7 m (2.3 ft) below MHHW. Here, the slope of the beach is 8.8% between the toe of the bulkhead and MTL, when averaged across both years, slightly steeper than that of Transect 1.00.

Coastal morphology change in response to bulkhead removal at Edgewater Beach
Publication 18-06-002 32 February 2018
Figure 26: Cross-section of lidar point cloud along Transect 1.18 at south end of survey site
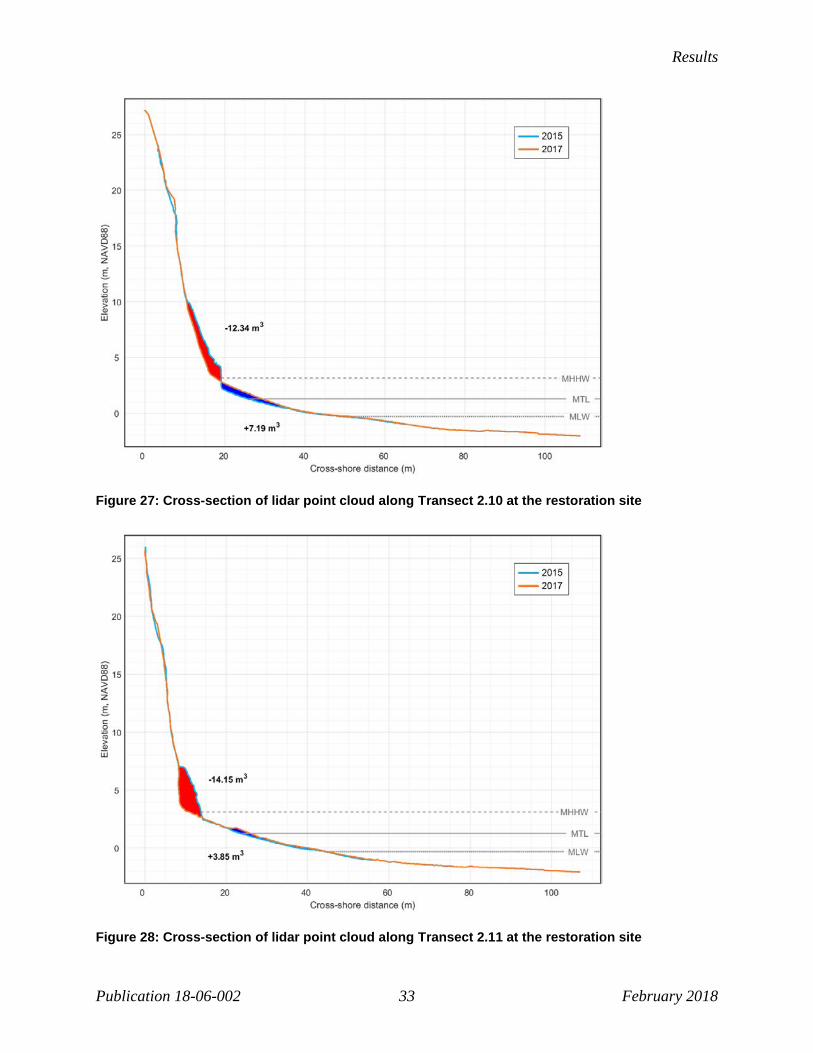
Figure 27 illustrates the cross-shore change in the bluff and beach in response to bulkhead removal at Transect 2.10, located roughly in the center of the restoration site. The lower bluff that was behind the bulkhead eroded by 2.7 m (8.9 ft), resulting in a loss of 12.34 m3 (16.1 yd3) of material across the profile (based on the profile being 1-m wide in the alongshore direction), including the bulkhead. The estimated volume of the armor at the profile is 0.9 m3 (1.2 yd3), suggesting the volume of bluff sediment supplied to the beach was 11.44 m3 (15.0 yd3). The upper beach face retained a portion of the sediment eroded from the lower bluff (+7.19 m3; 9.4 yd3), resulting in about a 60 cm (~2 ft) increase in beach elevation and a 4.9 m (16.1 ft) increase in beach width above MTL, increasing from 6.6 m (21.7 ft) in 2015 to 11.5 m (37.7 ft) in 2017. The toe elevation translated vertically from 79 cm (2.6 ft) below MHHW at the bulkhead in 2015 to 34 cm (1.1 ft) above MHHW at the bluff in 2017, and moved landward by 2.7 m, while the beach slope above MTL has remained consistently at about 10%, the steepest beach slope observed across all profiles examined. Figure 28 shows the cross-section of Transect 2.11 across armor rock that was removed at the restoration site. Here, 14.15 m3 (18.5 yd3) of material, including an estimated 3.5 m3 (4.6 yd3) of rockery wall (revetment), was lost from lower bluff. Sediment deposition of 3.85 m3 (5.0 yd3) was measured on the upper beach between 0.3-1.8 m NAVD88 in 2017. The beach width at this transect increased by 5.8 m (19 ft), from 9.2 m (30.2 ft) in 2015 to 15.0 m (49.2 ft) in 2017 after removal of the shoreline armor. The toe elevation translated vertically from 63 cm (2.1 ft) below MHHW at the bulkhead in 2015 to 85 cm (2.8 ft) above MHHW at the bluff in 2017, moving landward by 5.7 m. The beach slope flattened slightly from 8.5% to 7.9% due to accumulation of sediment near the MTL, with negligible change of the upper beach between the two surveys.
Results
Publication 18-06-002 33 February 2018
Figure 27: Cross-section of lidar point cloud along Transect 2.10 at the restoration site
Figure 28: Cross-section of lidar point cloud along Transect 2.11 at the restoration site
Coastal morphology change in response to bulkhead removal at Edgewater Beach
Publication 18-06-002 34 February 2018
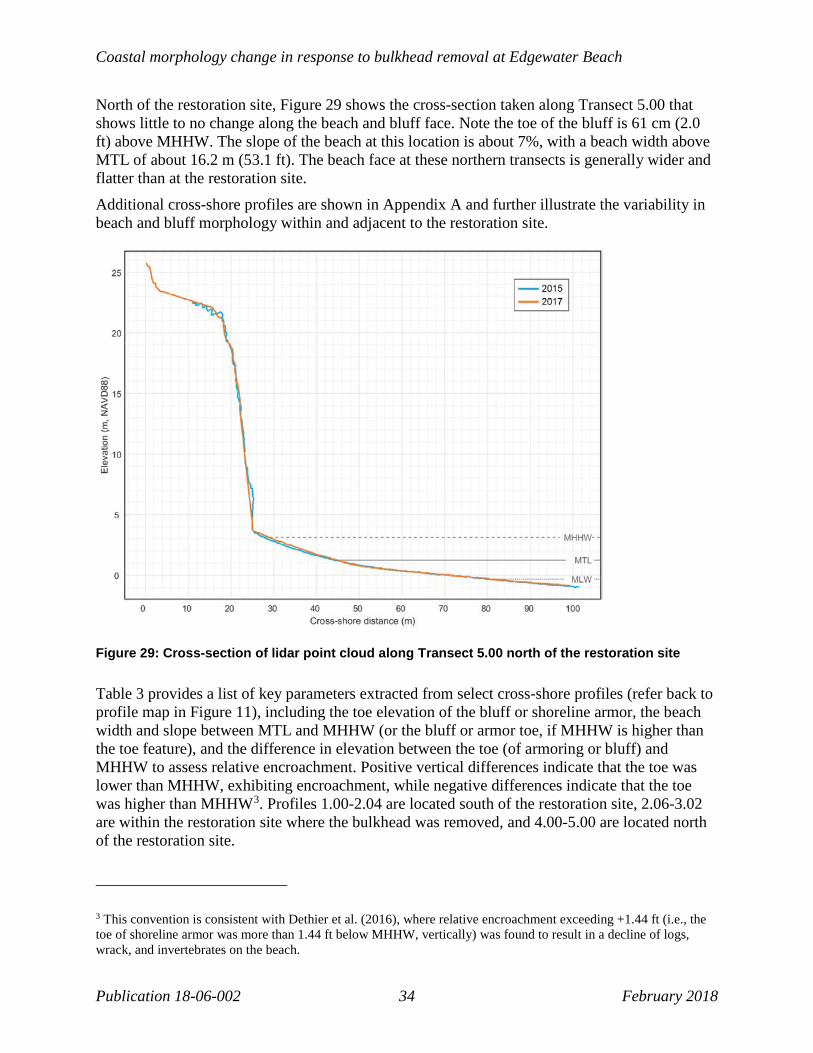
North of the restoration site, Figure 29 shows the cross-section taken along Transect 5.00 that shows little to no change along the beach and bluff face. Note the toe of the bluff is 61 cm (2.0 ft) above MHHW. The slope of the beach at this location is about 7%, with a beach width above MTL of about 16.2 m (53.1 ft). The beach face at these northern transects is generally wider and flatter than at the restoration site. Additional cross-shore profiles are shown in Appendix A and further illustrate the variability in beach and bluff morphology within and adjacent to the restoration site.
Figure 29: Cross-section of lidar point cloud along Transect 5.00 north of the restoration site
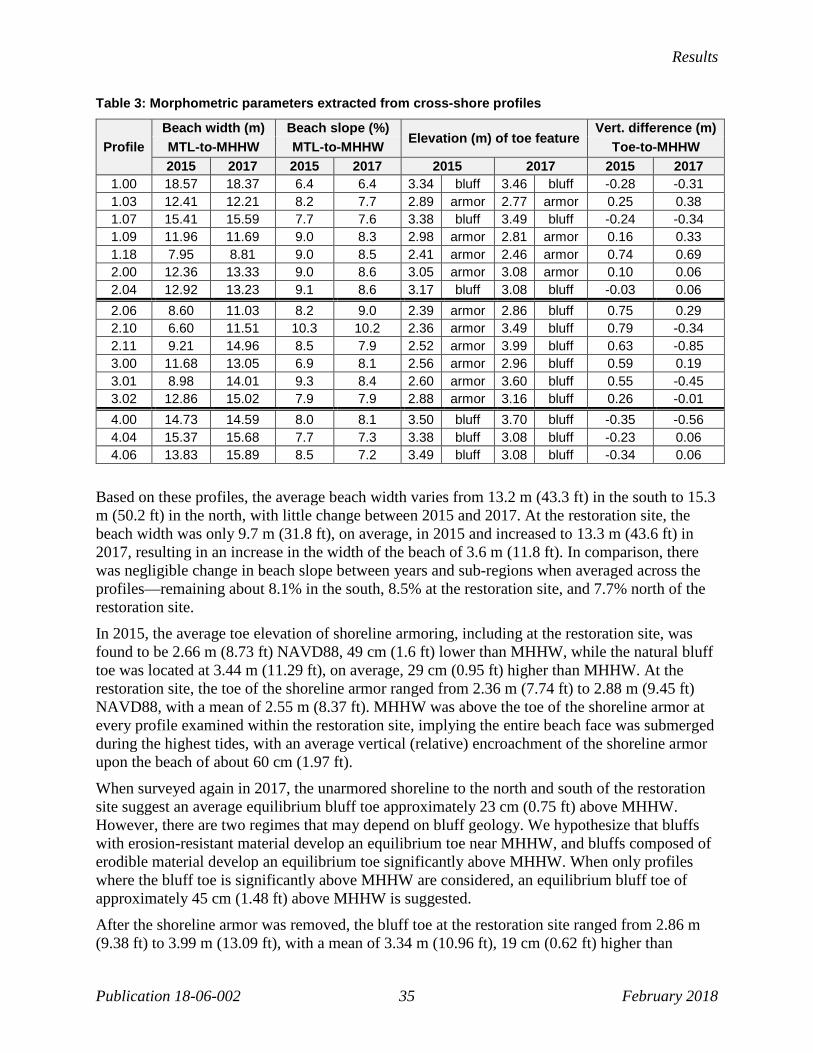
Table 3 provides a list of key parameters extracted from select cross-shore profiles (refer back to profile map in Figure 11), including the toe elevation of the bluff or shoreline armor, the beach width and slope between MTL and MHHW (or the bluff or armor toe, if MHHW is higher than the toe feature), and the difference in elevation between the toe (of armoring or bluff) and MHHW to assess relative encroachment. Positive vertical differences indicate that the toe was lower than MHHW, exhibiting encroachment, while negative differences indicate that the toe was higher than MHHW3. Profiles 1.00-2.04 are located south of the restoration site, 2.06-3.02 are within the restoration site where the bulkhead was removed, and 4.00-5.00 are located north of the restoration site.
3 This convention is consistent with Dethier et al. (2016), where relative encroachment exceeding +1.44 ft (i.e., the toe of shoreline armor was more than 1.44 ft below MHHW, vertically) was found to result in a decline of logs, wrack, and invertebrates on the beach.
Results
Publication 18-06-002 35 February 2018
Table 3: Morphometric parameters extracted from cross-shore profiles
Profile Beach width (m) Beach slope (%)
Elevation (m) of toe feature Vert. difference (m)
MTL-to-MHHW MTL-to-MHHW Toe-to-MHHW 2015 2017 2015 2017 2015 2017 2015 2017
1.00 18.57 18.37 6.4 6.4 3.34 bluff 3.46 bluff -0.28 -0.31 1.03 12.41 12.21 8.2 7.7 2.89 armor 2.77 armor 0.25 0.38 1.07 15.41 15.59 7.7 7.6 3.38 bluff 3.49 bluff -0.24 -0.34 1.09 11.96 11.69 9.0 8.3 2.98 armor 2.81 armor 0.16 0.33 1.18 7.95 8.81 9.0 8.5 2.41 armor 2.46 armor 0.74 0.69 2.00 12.36 13.33 9.0 8.6 3.05 armor 3.08 armor 0.10 0.06 2.04 12.92 13.23 9.1 8.6 3.17 bluff 3.08 bluff -0.03 0.06 2.06 8.60 11.03 8.2 9.0 2.39 armor 2.86 bluff 0.75 0.29 2.10 6.60 11.51 10.3 10.2 2.36 armor 3.49 bluff 0.79 -0.34 2.11 9.21 14.96 8.5 7.9 2.52 armor 3.99 bluff 0.63 -0.85 3.00 11.68 13.05 6.9 8.1 2.56 armor 2.96 bluff 0.59 0.19 3.01 8.98 14.01 9.3 8.4 2.60 armor 3.60 bluff 0.55 -0.45 3.02 12.86 15.02 7.9 7.9 2.88 armor 3.16 bluff 0.26 -0.01 4.00 14.73 14.59 8.0 8.1 3.50 bluff 3.70 bluff -0.35 -0.56 4.04 15.37 15.68 7.7 7.3 3.38 bluff 3.08 bluff -0.23 0.06 4.06 13.83 15.89 8.5 7.2 3.49 bluff 3.08 bluff -0.34 0.06
Based on these profiles, the average beach width varies from 13.2 m (43.3 ft) in the south to 15.3 m (50.2 ft) in the north, with little change between 2015 and 2017. At the restoration site, the beach width was only 9.7 m (31.8 ft), on average, in 2015 and increased to 13.3 m (43.6 ft) in 2017, resulting in an increase in the width of the beach of 3.6 m (11.8 ft). In comparison, there was negligible change in beach slope between years and sub-regions when averaged across the profiles—remaining about 8.1% in the south, 8.5% at the restoration site, and 7.7% north of the restoration site. In 2015, the average toe elevation of shoreline armoring, including at the restoration site, was found to be 2.66 m (8.73 ft) NAVD88, 49 cm (1.6 ft) lower than MHHW, while the natural bluff toe was located at 3.44 m (11.29 ft), on average, 29 cm (0.95 ft) higher than MHHW. At the restoration site, the toe of the shoreline armor ranged from 2.36 m (7.74 ft) to 2.88 m (9.45 ft) NAVD88, with a mean of 2.55 m (8.37 ft). MHHW was above the toe of the shoreline armor at every profile examined within the restoration site, implying the entire beach face was submerged during the highest tides, with an average vertical (relative) encroachment of the shoreline armor upon the beach of about 60 cm (1.97 ft). When surveyed again in 2017, the unarmored shoreline to the north and south of the restoration site suggest an average equilibrium bluff toe approximately 23 cm (0.75 ft) above MHHW. However, there are two regimes that may depend on bluff geology. We hypothesize that bluffs with erosion-resistant material develop an equilibrium toe near MHHW, and bluffs composed of erodible material develop an equilibrium toe significantly above MHHW. When only profiles where the bluff toe is significantly above MHHW are considered, an equilibrium bluff toe of approximately 45 cm (1.48 ft) above MHHW is suggested. After the shoreline armor was removed, the bluff toe at the restoration site ranged from 2.86 m (9.38 ft) to 3.99 m (13.09 ft), with a mean of 3.34 m (10.96 ft), 19 cm (0.62 ft) higher than

Coastal morphology change in response to bulkhead removal at Edgewater Beach
Publication 18-06-002 36 February 2018
MHHW. For most of the profiles within the restoration site, the bluff toe was higher than MHHW in 2017, suggesting the bluff toe has approached an equilibrium position. However, the bluff toe was found to be lower than MHHW on Transect 2.06 and 3.00 by 29 cm (0.95 ft) and 19 cm (0.62 ft), respectively, and roughly equal to MHHW at Transect 3.02, suggesting more bluff erosion may be likely in these areas, depending on the erosion resistance of the bluff geology.
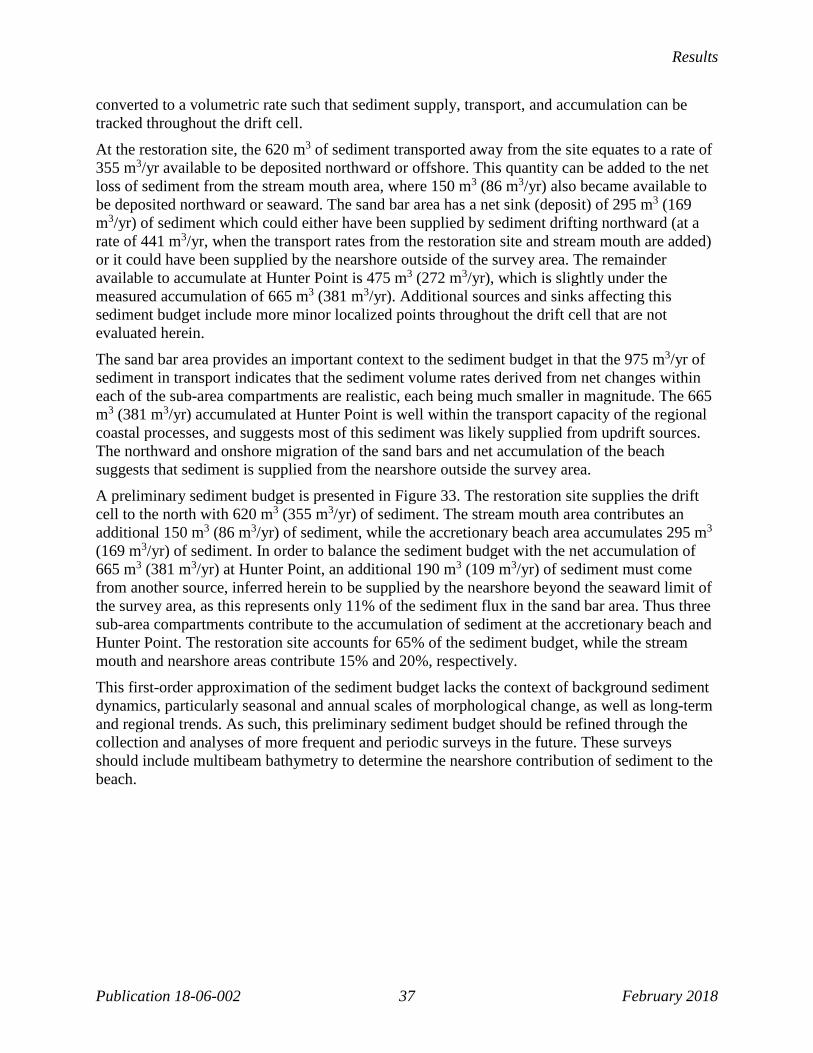
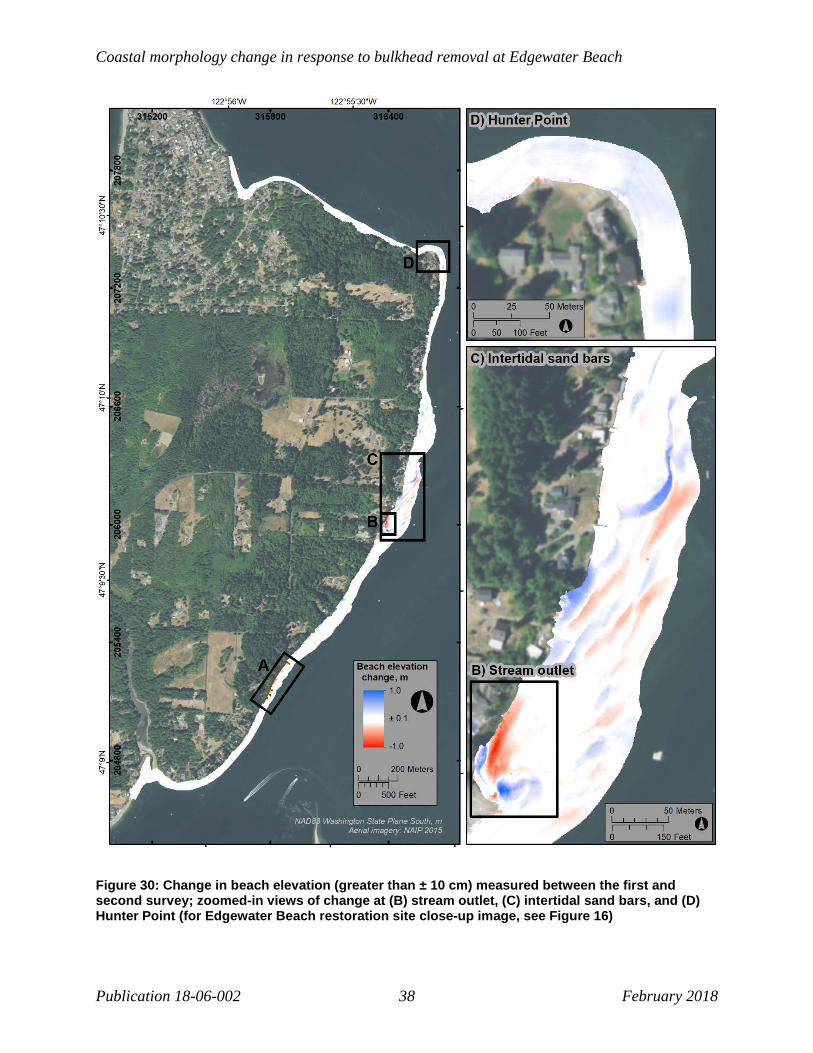
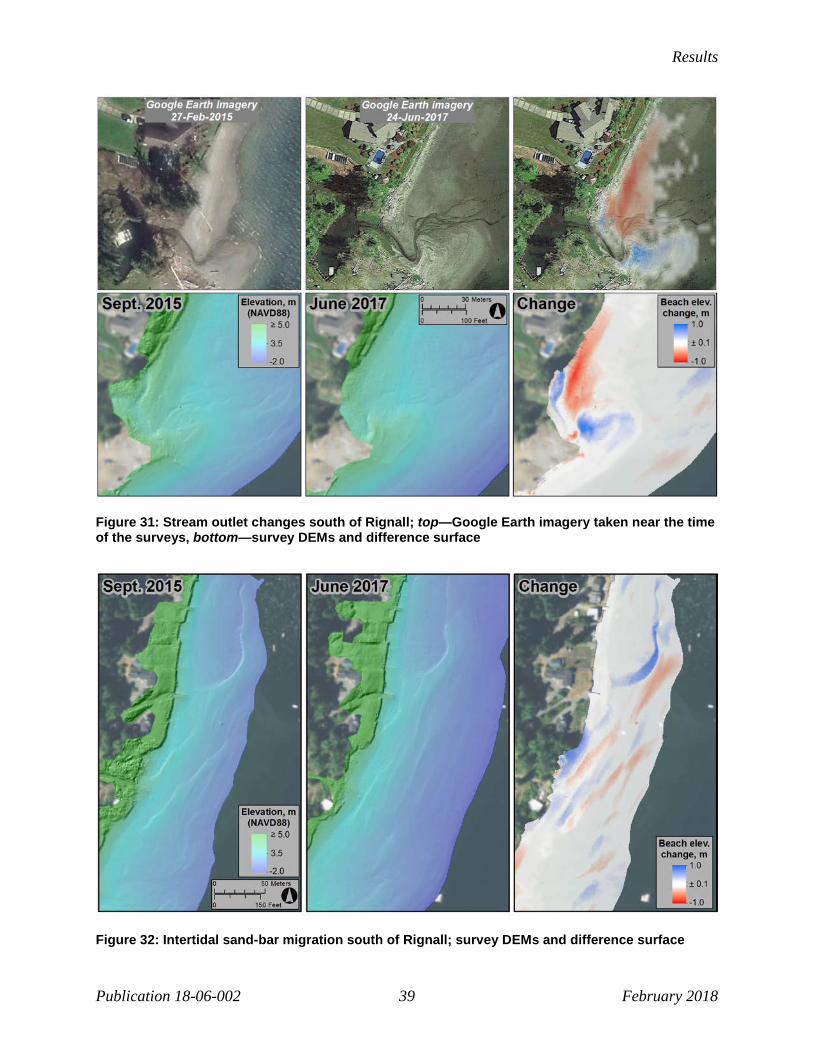
Drift cell-scale overview Because of the extent of the boat-based lidar surveys, the morphological changes observed at the restoration site can be put in context of the TH-8-5 (Edgewater Beach) drift cell. As discussed above, the lower bluff at the restoration site lost 1,760 m3 of material, of which an estimated 355 m3 was shoreline armor that was physically removed from the site. Therefore, approximately 1,405 m3 of sediment was supplied by the bluff to the beach. However, at the time of the second survey, only 785 m3 (56%) of this sediment remained on the beach, leaving 620 m3 that must have been dispersed to the nearshore or transported northward. In comparison, relatively small morphological changes along the drift cell were observed outside of the restoration site. Figure 30 shows the difference in beach elevation measured between the first and second surveys, almost two years apart. Changes associated with the movement of a stream outlet south of the community of Rignall were observed, including accretion of the bar in front of the mouth (+293 m3), filling in of a trough along the base of the upland (+89 m3), and erosion of the upper beach (−532 m3) (Figure 30B). These changes resulted in an average elevation loss of 0.4 m and a change in the outflow position of the channel on the lee side of the bar. Figure 31 shows aerial photos of how this area changed between 2015 and 2017, as well as where the changes occurred based on the difference in beach elevation measured from the two boat-based lidar surveys. In the center of the drift cell along a wide, accretionary beach near the community of Rignall, bands of erosion and accretion indicate migration of shallow intertidal sand bars (Figure 30C). The sand bars were observed to have migrated onshore by about 8-10 m (26-33 ft) to the northwest, with bar crests filling in landward troughs and leeward troughs developing in the area of the prior crests (Figure 32). The orientation of the bands confirms the net northward direction of sediment transport within the drift cell. The volume of accretion in this area closely equals the volume of erosion (1,845 vs. 1,550 m3) for a net gain in sediment of 295 m3. The migration volumes, which average to about 1,700 m3 of sediment in motion, provide an indication of the sediment transport capacity along the coast and can be expressed in terms of volume per unit time (975 m3/yr). The net gain of sediment indicates an influx of sediment into the area from the south or offshore. A net gain in beach elevation was measured at Hunter Point, about 2.3 km north of the Edgewater Beach restoration site (Figure 30D). At this location, the elevation of the beach in 2017 was about 12 ± 7 cm (0.4 ± 0.2 ft) higher than in 2015, on average, resulting in approximately 665 m3 of accumulated volume across the beach face. With only two surveys that did not include nearshore bathymetry, not all of the sources and sinks of sediment along the drift cell can be identified; however, a rough order of magnitude sediment budget can be estimated to assess the potential morphologic effect of the restoration project to the drift cell. As noted above, the observed changes in volume between the two surveys can be
Results
Publication 18-06-002 37 February 2018
converted to a volumetric rate such that sediment supply, transport, and accumulation can be tracked throughout the drift cell. At the restoration site, the 620 m3 of sediment transported away from the site equates to a rate of 355 m3/yr available to be deposited northward or offshore. This quantity can be added to the net loss of sediment from the stream mouth area, where 150 m3 (86 m3/yr) also became available to be deposited northward or seaward. The sand bar area has a net sink (deposit) of 295 m3 (169 m3/yr) of sediment which could either have been supplied by sediment drifting northward (at a rate of 441 m3/yr, when the transport rates from the restoration site and stream mouth are added) or it could have been supplied by the nearshore outside of the survey area. The remainder available to accumulate at Hunter Point is 475 m3 (272 m3/yr), which is slightly under the measured accumulation of 665 m3 (381 m3/yr). Additional sources and sinks affecting this sediment budget include more minor localized points throughout the drift cell that are not evaluated herein. The sand bar area provides an important context to the sediment budget in that the 975 m3/yr of sediment in transport indicates that the sediment volume rates derived from net changes within each of the sub-area compartments are realistic, each being much smaller in magnitude. The 665 m3 (381 m3/yr) accumulated at Hunter Point is well within the transport capacity of the regional coastal processes, and suggests most of this sediment was likely supplied from updrift sources. The northward and onshore migration of the sand bars and net accumulation of the beach suggests that sediment is supplied from the nearshore outside the survey area. A preliminary sediment budget is presented in Figure 33. The restoration site supplies the drift cell to the north with 620 m3 (355 m3/yr) of sediment. The stream mouth area contributes an additional 150 m3 (86 m3/yr) of sediment, while the accretionary beach area accumulates 295 m3 (169 m3/yr) of sediment. In order to balance the sediment budget with the net accumulation of 665 m3 (381 m3/yr) at Hunter Point, an additional 190 m3 (109 m3/yr) of sediment must come from another source, inferred herein to be supplied by the nearshore beyond the seaward limit of the survey area, as this represents only 11% of the sediment flux in the sand bar area. Thus three sub-area compartments contribute to the accumulation of sediment at the accretionary beach and Hunter Point. The restoration site accounts for 65% of the sediment budget, while the stream mouth and nearshore areas contribute 15% and 20%, respectively. This first-order approximation of the sediment budget lacks the context of background sediment dynamics, particularly seasonal and annual scales of morphological change, as well as long-term and regional trends. As such, this preliminary sediment budget should be refined through the collection and analyses of more frequent and periodic surveys in the future. These surveys should include multibeam bathymetry to determine the nearshore contribution of sediment to the beach.
Coastal morphology change in response to bulkhead removal at Edgewater Beach
Publication 18-06-002 38 February 2018
Figure 30: Change in beach elevation (greater than ± 10 cm) measured between the first and second survey; zoomed-in views of change at (B) stream outlet, (C) intertidal sand bars, and (D) Hunter Point (for Edgewater Beach restoration site close-up image, see Figure 16)
Results
Publication 18-06-002 39 February 2018
Figure 31: Stream outlet changes south of Rignall; top—Google Earth imagery taken near the time of the surveys, bottom—survey DEMs and difference surface
Figure 32: Intertidal sand-bar migration south of Rignall; survey DEMs and difference surface

Coastal morphology change in response to bulkhead removal at Edgewater Beach
Publication 18-06-002 40 February 2018
Figure 33: Preliminary, first-order sediment budget for the Edgewater Beach drift cell based on observed morphology changes between the September 2015 and June 2017 surveys
Publication 18-06-002 41 February 2018
Conclusions Two 5 km-long boat-based topographic lidar surveys were performed before and after the removal of ~800 ft of shoreline armor at Edgewater Beach. Lidar surveys were complemented with ground-based GNSS topographic surveys and cobble cam grain-size sampling. Lidar point clouds were processed and classified to generate DEMs that allow for three-dimensional surface differencing and analyses of changes in shoreline contours and sediment volumes. Two-dimensional coastal profiles were extracted from the ground-classified point cloud to analyze cross-shore changes across the bluff and beach. Important features, such as the top and toe of a bulkhead and its position relative to tidal datums, can be precisely detected. Using this information, relative encroachment of shoreline armoring is accurately assessed. Agreement between surveys at static structures, such as bulkheads, illustrate the repeatability of the method and accuracy of the data. The lidar dataset provides detailed, georeferenced documentation of the coastal landscape with extensive possibilities for extracting ecological and geomorphological information, including quantification of large woody debris, overhanging vegetation, beach wrack, elevation of the bluff crest, bluff toe, beach slope, beach width, bluff slope, the elevation, extent, and encroachment of shoreline armoring, extraction of cross-shore profiles, and so on. Moreover, because the regional shoreline beyond the immediate restoration site has been comprehensively surveyed at discrete points in time, it provides the flexibility to examine the data in the future for other purposes with different metrics than those intended at the time of the survey. Analyses of the data reveal that:
1. When surveyed in 2015, the bulkhead that was removed at Edgewater Beach had encroached upon the upper beach, with the toe of the bulkhead located about 60 cm (2 ft) below MHHW. After removal, MHHW migrated landward, while the MTL and MLW contours migrated seaward, effectively increasing beach width, particularly on the upper beach above MHW, by an average of 3.6 m (11.8 ft). There was a negligible change in beach slope following removal of the shoreline armor, remaining about 8.5% between MHHW and MTL—similar to, though slightly steeper than, the beach slope characterized for the adjacent shoreline (8.1% to the south and 7.7% to the north, when averaged across sub-region and years).
2. After removal of the shoreline armor at Edgewater Beach, the unarmored shoreline to the north and south of the restoration site suggest an equilibrium bluff toe approximately 23-45 cm (0.75-1.48 ft) above MHHW, indicating that some modest adjustment of the bluff toe may continue at the project site in the future where the average bluff toe elevation is only 19 cm higher than MHHW. Erosion of the toe will likely occur in locations where the bluff toe is equal to or lower than MHHW, depending on the bluff geology and local conditions.
3. Following bulkhead removal, the area of the beach covered by large woody debris increased by 81%, primarily attributed to armor removal rather than natural recruitment. Large woody debris and associated wrack are an important part of the beach ecosystem as they provide habitat for invertebrates that are a food source for fish and birds. Sediment deposition is generally enhanced locally by large woody debris, particularly along the updrift side of large wood, and among debris that dissipates wave energy on the upper beach.

Coastal morphology change in response to bulkhead removal at Edgewater Beach
Publication 18-06-002 42 February 2018
4. Sediment grain-size data at the restoration site show beach substrate changes that are favorable to surf smelt spawning: an increase from very coarse sand to fine gravel across the upper beach, and a decrease from very coarse gravel to medium gravel near MTL. A similar change occurred 30 m (~100 ft) north of the restoration site, with an increase from coarse sand to very fine to fine gravel near MHW. In general, the restoration of bluff sediment supply to the beach appears to have enhanced the supply of sand and fine gravel, with sand and finer material being gradually transported from the upper to lower beach face, enabling accumulation of very fine and fine gravel on the upper beach and the partially covering of sand on larger gravel sediments found lower on the profile in 2015. In contrast, samples collected outside the area of direct influence of the restoration site show a coarsening of the medium to coarse gravel substrate across the mid beach.
5. With the volume of shoreline armor removed at the restoration site estimated to be about 355 m3 (464 yd3), volume change measurements show that 1,405 m3 (1,838 yd3) of sediment eroded from the base of the bluff below approximately 9 m (29.5 ft) elevation (NAVD88), while the upper beach directly in front of that armor accreted by 785 m3 (1,027 yd3). This upper beach deposit lies between the former toe of the armoring, 2.55 m (8.37 ft) and 1 m (3.3 ft) NAVD 88, spanning a cross-shore distance of about 10-15 m (33-49 ft). About 620 m3 (811 yd3) of sediment was dispersed from the site, likely moving northward and seaward of the restoration site.
6. Comparatively little beach change was observed along most of the 5-km length of shoreline outside of the restoration site, except for: 1) the stream mouth at the south end of the Rignall area that eroded along the upper beach; 2) the Rignall area, where bands of erosion and accretion follow the northward and onshore migration of shallow intertidal sand bars; and 3) Hunter Point, where the beach face aggraded about 12 cm (0.4 ft) vertically with the deposition of approximately 665 m3 (870 yd3) of sediment. Other, more localized, changes are also observed in the difference surface but are beyond the scope of this report to examine in more detail.
7. The development of a preliminary sediment budget confirms the importance of the historic feeder bluff to beach sediment supply at the drift-cell scale. In this case, the feeder bluff restoration accounted for 65% of the accumulated sediment along the downdrift portion of the drift cell. In other words, without that supply, the net accumulation of the drift cell would have been 65% less. Additional surveys are required to develop a more robust sediment budget, and a better understanding of shoreline change trends and variability of the Edgewater drift cell.
Although much has been documented from only a pre- and post-project survey, future monitoring is recommended to improve our understanding of the temporal and spatial effects of the restoration project. This project developed a preliminary sediment budget that lacks the context of background sediment dynamics, seasonal and annual variability, and regional or longer term trends. At present, there is a dearth of quantitative knowledge about how shoreline armor removal along feeder bluffs restores sediment supply to beaches and the extent to which this enhances the physical structure and ecological function of adjacent beaches. The project site is somewhat unique in that the shoreline armor was removed from the base of a densely vegetated bluff that offers immediate enhancement of overhanging vegetation as well as the contribution of large woody debris, leaf litter, and other organic and inorganic debris.

Conclusions
Publication 18-06-002 43 February 2018
Because of this, there is the opportunity to evaluate and compare the habitat and ecological functions at the restoration site to adjacent sites with encroaching shoreline armor. The effects of both shoreline armoring and removal can therefore be more fully investigated and quantitatively documented. The comprehensive physical inventory and measurements of the beach state and morphology change obtained in this project should be integrated with existing and future ecological surveys and biological measurements to explore cause-and-effect relationships among the data. As such, this represents a relatively rare opportunity to determine nearshore ecosystem response to armor removal from a more integrated perspective. We recommend a collaborative interdisciplinary study that will contribute to the scientific basis for decision-making and actions intended for nearshore ecosystem protection and restoration. We anticipate study outcomes would lead to monitoring protocols for improved assessment of shoreline armoring impacts and restoration projects and increase the likelihood of implementing similar projects along other feeder bluffs throughout Puget Sound.

This page is purposely left blank

Publication 18-06-002 45 February 2018
References Blue, A.C., 2015. Edgewater Bulkhead Removal Project Plans. Coastal Geologic Services, 4
sheets. Dethier, M., J. Toft, and J.R. Cordell, 2015. Synopsis and results from pre-construction sampling
at Edgewater Beach, 10 pp. Dethier, M.N., W.W. Raymond, A.N. McBride, J.D. Toft, J.F. Cordell, A.S. Ogston, S.M.
Heerhartz, and H.D. Berry, 2016. Multiscale impacts of armoring on Salish Sea shorelines: Evidence for cumulative and threshold effects. Estuarine, Coastal and Shelf Science, 175: 106-117.
Johannessen, J. and A. Blue, 2012. Bulkhead removal, feasibility, and conceptual beach enhancement assessment at Schmidt Residence, Thurston County, WA. Coastal Geologic Services, 11 pp.
Krumbein, W.C. and L.L. Sloss, 1963. Stratigraphy and sedimentation, 2nd edition, Freeman, San Francisco, 660 pp.
Penttila, D., 2007. Marine Forage Fishes in Puget Sound. Puget Sound Nearshore Partnership Report No. 2007-03. Published by Seattle District, U.W. Army Corps of Engineers, Seattle, Washington.
Schwartz, M.L., B.D. Harp, B.E. Taggart, and M. Chrzastowski, 1991. Net shore-drift in Washington State. Shorelands and Coastal Zone Management Program, Washington Department of Ecology, Olympia, WA.
Simenstad, C.A., Logsdon, M., Fresh, K., Shipman, H., Dethier, M., and J. Newton, 2006. Conceptual model for assessing restoration of Puget Sound nearshore ecosystems: Seattle, WA, Puget Sound Nearshore Partnership, Technical Report 2006-03.
Sobocinski, K.L., Cordell, J.R., and C.A. Simenstad, 2010. Effects of shoreline modifications on supratidal macroinvertebrate fauna on Puget Sound, Washington beaches, Estuaries and Coasts, 33: 699-711.
Toft, J.D., Cordell, J.R., Simenstad, C.A., and L.A. Stamatiou, 2007. Fish distribution, abundance, and behavior along city shoreline types in Puget Sound, North American Journal of Fisheries Management, 27: 465-480.
Warrick, J.A., D.M. Rubin, P. Ruggiero, J. Harney, A.E. Draut, and D. Buscombe, 2009. Cobble Cam: Grain-size measurements of sand to boulder from digital photographs and autocorrelation analyses. Earth Surface Processes and Landforms, 34 (13): 1811-1821.
Wentworth, C.K., 1922. A scale of grade and class terms for clastic sediments. Journal of Geology, 30: 377-392.

This page is purposely left blank
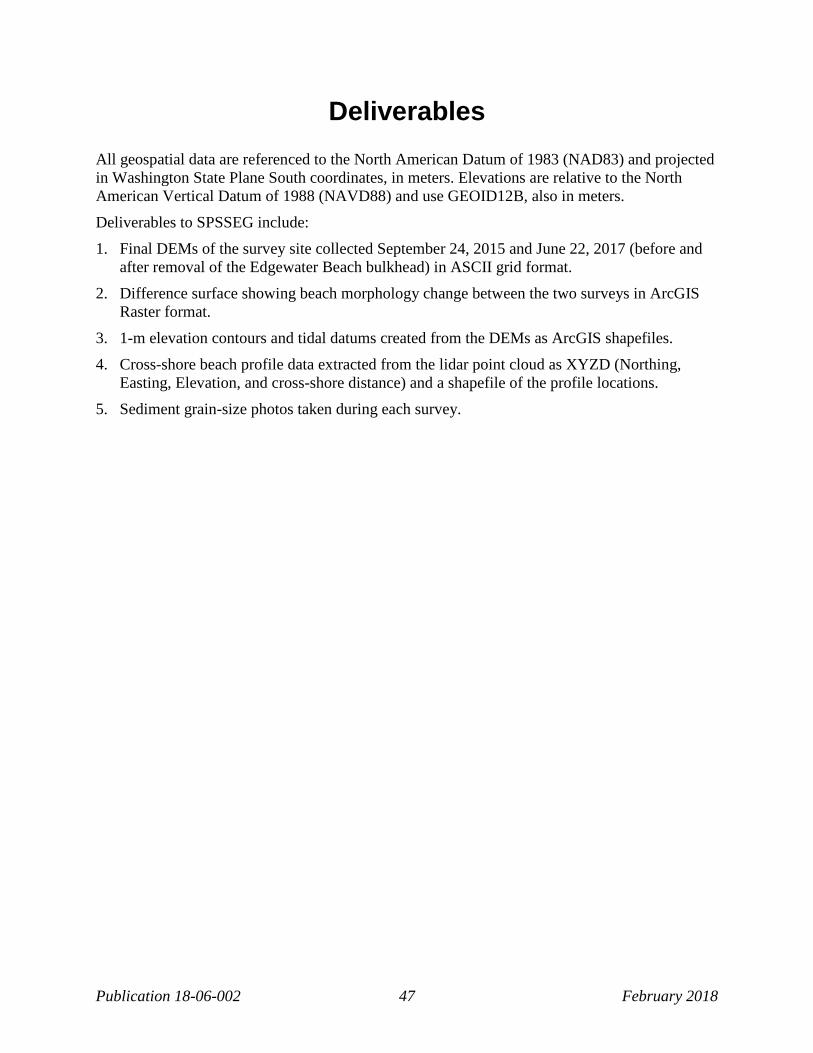
Publication 18-06-002 47 February 2018
Deliverables All geospatial data are referenced to the North American Datum of 1983 (NAD83) and projected in Washington State Plane South coordinates, in meters. Elevations are relative to the North American Vertical Datum of 1988 (NAVD88) and use GEOID12B, also in meters. Deliverables to SPSSEG include: 1. Final DEMs of the survey site collected September 24, 2015 and June 22, 2017 (before and
after removal of the Edgewater Beach bulkhead) in ASCII grid format. 2. Difference surface showing beach morphology change between the two surveys in ArcGIS
Raster format. 3. 1-m elevation contours and tidal datums created from the DEMs as ArcGIS shapefiles. 4. Cross-shore beach profile data extracted from the lidar point cloud as XYZD (Northing,
Easting, Elevation, and cross-shore distance) and a shapefile of the profile locations. 5. Sediment grain-size photos taken during each survey.

This page is purposely left blank

Publication 18-06-002 49 February 2018
Appendices
Appendix A. Cross-shore profiles Two-dimensional cross-shore profiles were extracted from the lidar point cloud to analyze changes across the beach and bluff at the Edgewater Beach restoration project site and to the south and north of the site (refer back to Figure 11 for map of profile locations). Profiles are shown in meters relative to NAVD88 (-1.22 m MLLW). The MHHW, MTL, and MLW datums are shown on the plots for reference. Table 4 gives a list of tidal datums relative to NAVD88 and MLLW, in both meters and feet, at the bulkhead removal site (obtained using NOAA’s Online Vertical Datum Transformation Tool accessible at https://vdatum.noaa.gov/).
Table 4: Tidal datums relative to NAVD88 and MLLW at the Edgewater Beach restoration site
Datum Abbrev. NAVD88 MLLW
meters feet meters feet Mean Higher High Water MHHW 3.146 10.323 4.369 14.335 Mean High Water MHW 2.856 9.372 4.079 13.383 Mean Tide Level MTL 1.283 4.213 2.507 8.224 North American Vertical Datum NAVD88 0.000 0.000 1.223 4.012 Mean Low Water MLW -0.289 -0.946 0.934 3.066 Mean Lower Low Water MLLW -1.223 -4.012 0.000 0.000
On select profile plots, the volume change between the 2015 and 2017 profile data is quantified (as the 2-D area × 1-m alongshore width) and shown as either erosion (red) or deposition (blue) in cubic meters.

Coastal morphology change in response to bulkhead removal at Edgewater Beach
Publication 18-06-002 50 February 2018
Figu
re 3
4: C
ross
-sec
tion
of li
dar p
oint
clo
ud a
long
Tra
nsec
t 1.0
0

Appendix A
Publication 18-06-002 51 February 2018
Figu
re 3
5: C
ross
-sec
tion
of li
dar p
oint
clo
ud a
long
Tra
nsec
t 1.0
3

Coastal morphology change in response to bulkhead removal at Edgewater Beach
Publication 18-06-002 52 February 2018
Figu
re 3
6: C
ross
-sec
tion
of li
dar p
oint
clo
ud a
long
Tra
nsec
t 1.0
7
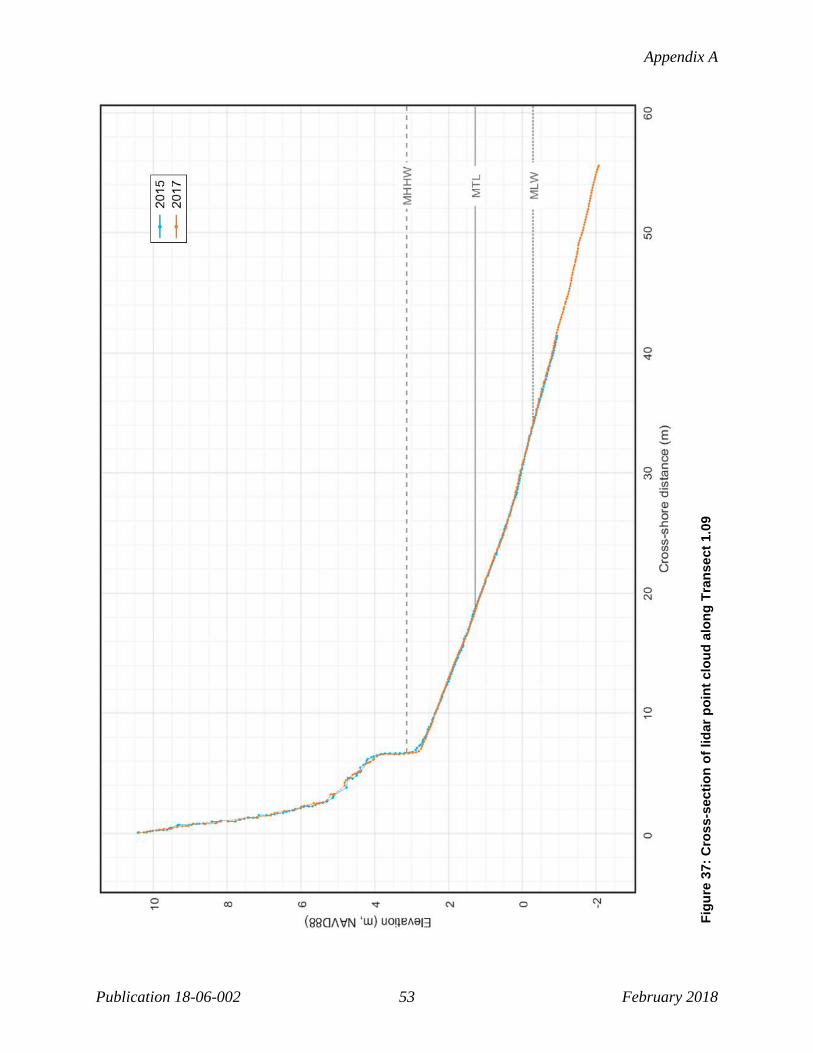
Appendix A
Publication 18-06-002 53 February 2018
Figu
re 3
7: C
ross
-sec
tion
of li
dar p
oint
clo
ud a
long
Tra
nsec
t 1.0
9

Coastal morphology change in response to bulkhead removal at Edgewater Beach
Publication 18-06-002 54 February 2018
Figu
re 3
8: C
ross
-sec
tion
of li
dar p
oint
clo
ud a
long
Tra
nsec
t 1.1
8

Appendix A
Publication 18-06-002 55 February 2018
Figu
re 3
9: C
ross
-sec
tion
of li
dar p
oint
clo
ud a
long
Tra
nsec
t 2.0
0
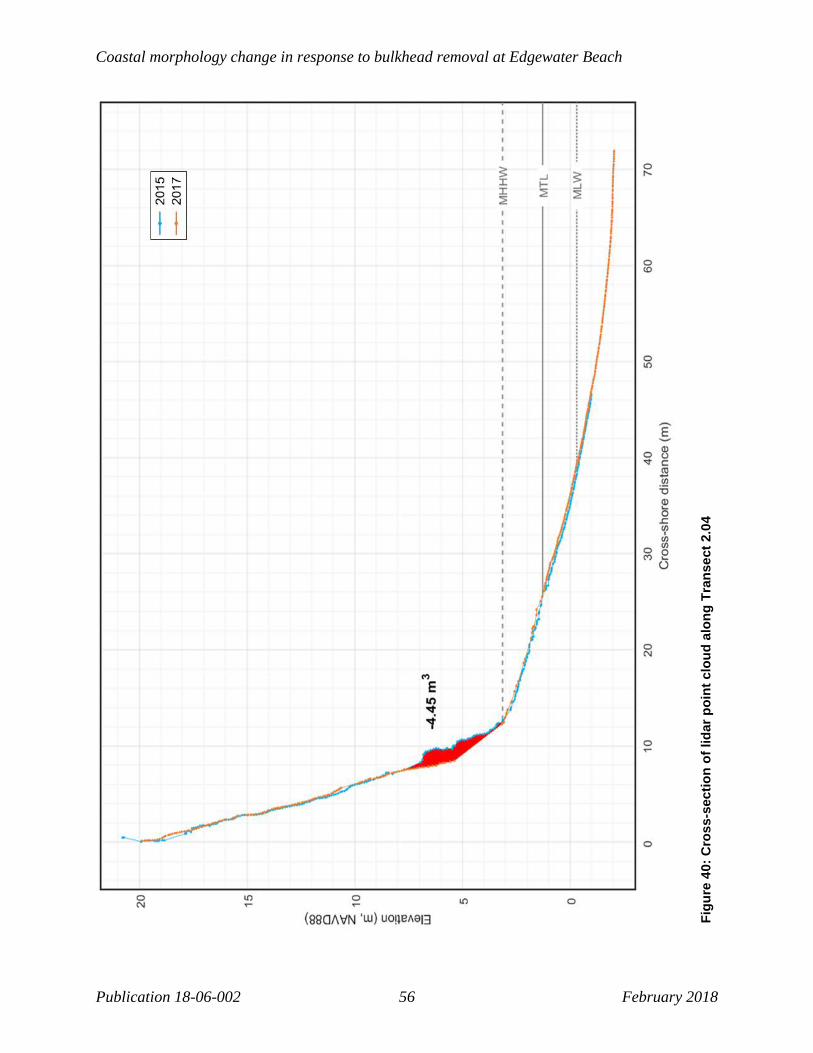
Coastal morphology change in response to bulkhead removal at Edgewater Beach
Publication 18-06-002 56 February 2018
Figu
re 4
0: C
ross
-sec
tion
of li
dar p
oint
clo
ud a
long
Tra
nsec
t 2.0
4

Appendix A
Publication 18-06-002 57 February 2018
Figu
re 4
1: C
ross
-sec
tion
of li
dar p
oint
clo
ud a
long
Tra
nsec
t 2.0
6

Coastal morphology change in response to bulkhead removal at Edgewater Beach
Publication 18-06-002 58 February 2018
Figu
re 4
2: C
ross
-sec
tion
of li
dar p
oint
clo
ud a
long
Tra
nsec
t 2.1
0
Appendix A
Publication 18-06-002 59 February 2018
Figu
re 4
3: C
ross
-sec
tion
of li
dar p
oint
clo
ud a
long
Tra
nsec
t 2.1
1

Coastal morphology change in response to bulkhead removal at Edgewater Beach
Publication 18-06-002 60 February 2018
Figu
re 4
4: C
ross
-sec
tion
of li
dar p
oint
clo
ud a
long
Tra
nsec
t 3.0
0
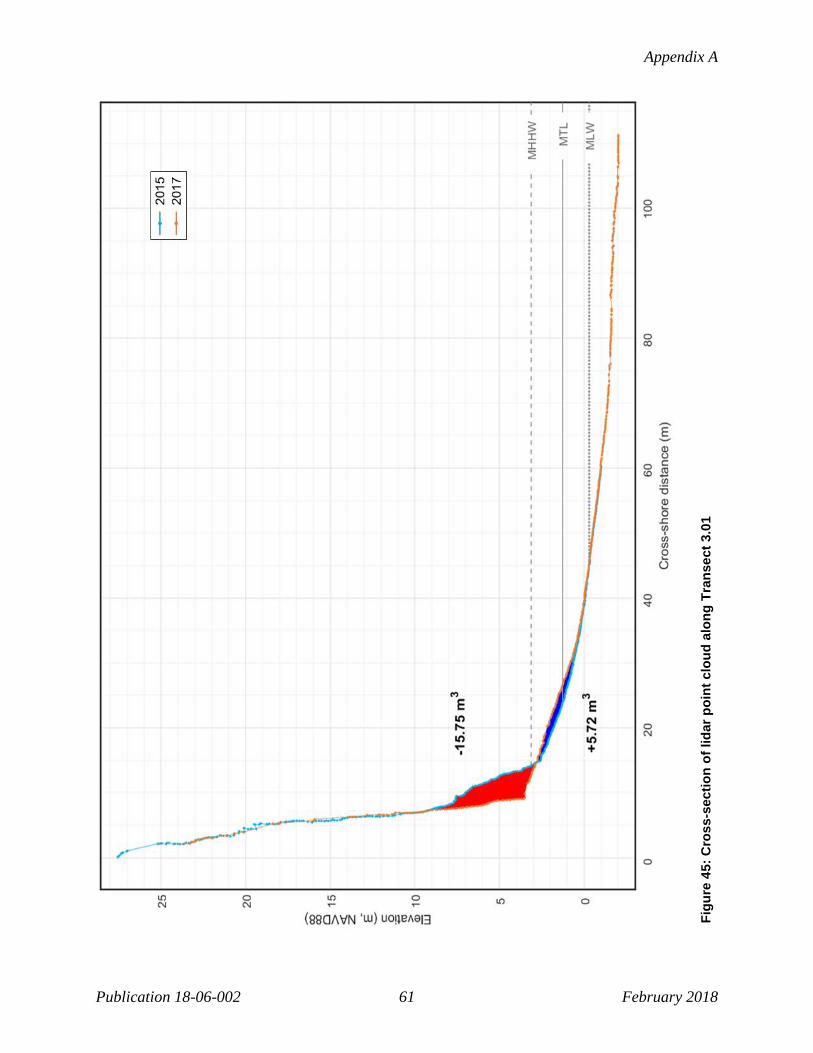
Appendix A
Publication 18-06-002 61 February 2018
Figu
re 4
5: C
ross
-sec
tion
of li
dar p
oint
clo
ud a
long
Tra
nsec
t 3.0
1

Coastal morphology change in response to bulkhead removal at Edgewater Beach
Publication 18-06-002 62 February 2018
Figu
re 4
6: C
ross
-sec
tion
of li
dar p
oint
clo
ud a
long
Tra
nsec
t 3.0
2
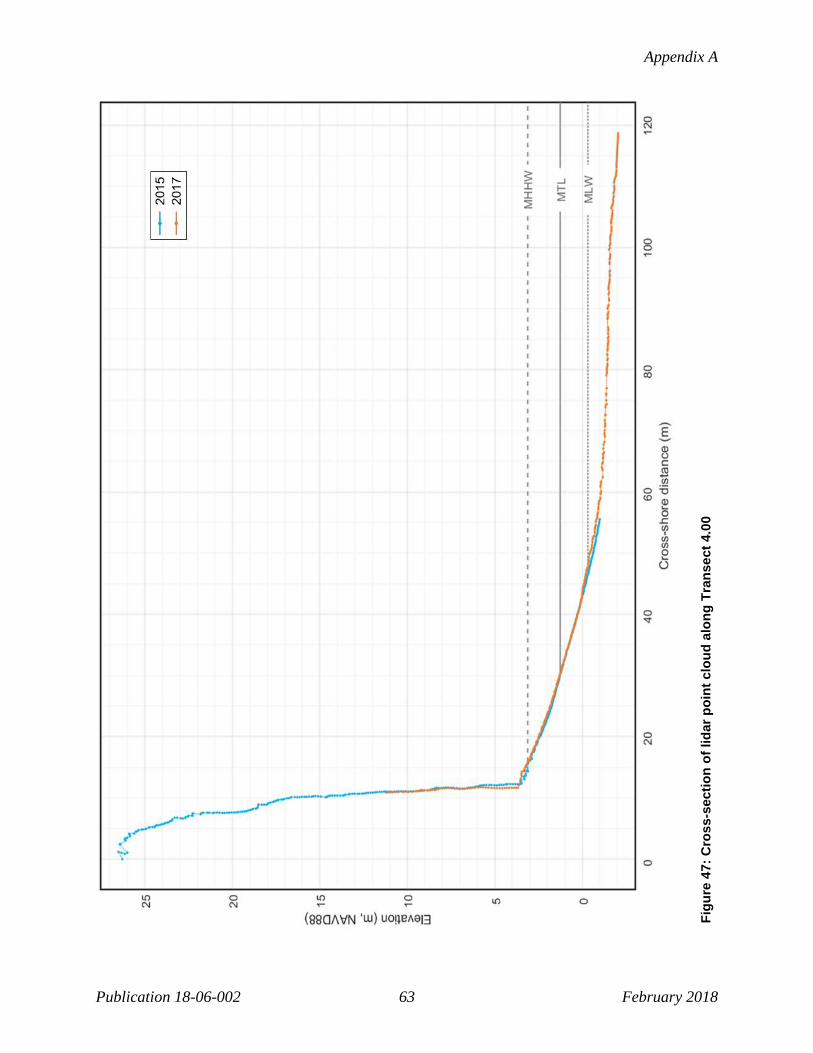
Appendix A
Publication 18-06-002 63 February 2018
Figu
re 4
7: C
ross
-sec
tion
of li
dar p
oint
clo
ud a
long
Tra
nsec
t 4.0
0

Coastal morphology change in response to bulkhead removal at Edgewater Beach
Publication 18-06-002 64 February 2018
Figu
re 4
8: C
ross
-sec
tion
of li
dar p
oint
clo
ud a
long
Tra
nsec
t 4.0
4

Appendix A
Publication 18-06-002 65 February 2018
Figu
re 4
9: C
ross
-sec
tion
of li
dar p
oint
clo
ud a
long
Tra
nsec
t 4.0
6

Coastal morphology change in response to bulkhead removal at Edgewater Beach
Publication 18-06-002 66 February 2018
Figu
re 5
0: C
ross
-sec
tion
of li
dar p
oint
clo
ud a
long
Tra
nsec
t 5.0
0
Publication 18-06-002 67 February 2018
Appendix B. Sediment grain-size sample photographs Digital photographs were taken of the beach surface substrate and analyzed using a photogrammetric technique whereby individual sediment grains are digitally measured from the photograph. A reference scale was included in each photograph to provide the means of determining the mm-to-pixel ratio of each picture. Samples were collected at 0.5-m elevation intervals along five cross-shore transects located at the south end of the Edgewater Beach drift cell (refer back to Figure 3 for sediment grain-size transect map). This appendix contains the sets of photos collected at each transect before and after removal of approximately 800 ft of shoreline armor at Edgewater Beach in fall 2016. Photos were collected on September 24, 2015, a year before the bulkhead was removed, and again on June 22, 2017, almost eight months after removal, at the same elevations along each transect. In the upper left corner of each photo is the elevation (Z) corresponding to where the sample was collected and the median grain-size diameter (D50) calculated from the sediment grain-size distribution of the sample. Note that the elevations written on the chalkboard in the field are preliminary and do not include final coordinates for the reference station in 2015. Furthermore, the transect numbers written on the chalkboard in 2015 are incorrect, as the transects were later renumbered from south to north.

Coastal morphology change in response to bulkhead removal at Edgewater Beach
Publication 18-06-002 68 February 2018
Figure 51: Sediment grain-size photos collected along Transect 1 on September 24, 2015

Appendix B
Publication 18-06-002 69 February 2018
Figure 52: Sediment grain-size photos collected along Transect 2 on September 24, 2015

Coastal morphology change in response to bulkhead removal at Edgewater Beach
Publication 18-06-002 70 February 2018
Figure 53: Sediment grain-size photos collected along Transect 3 on September 24, 2015

Appendix B
Publication 18-06-002 71 February 2018
Figure 54: Sediment grain-size photos collected along Transect 4 on September 24, 2015

Coastal morphology change in response to bulkhead removal at Edgewater Beach
Publication 18-06-002 72 February 2018
Figure 55: Sediment grain-size photos collected along Transect 5 on September 24, 2015
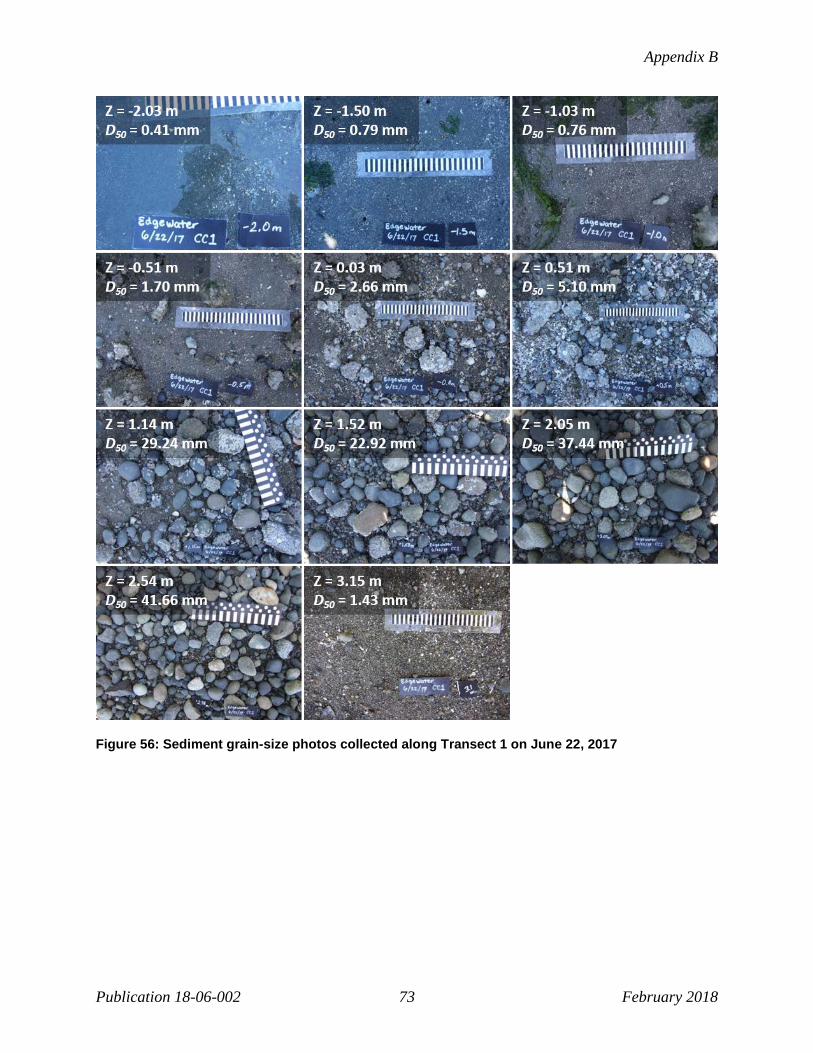
Appendix B
Publication 18-06-002 73 February 2018
Figure 56: Sediment grain-size photos collected along Transect 1 on June 22, 2017
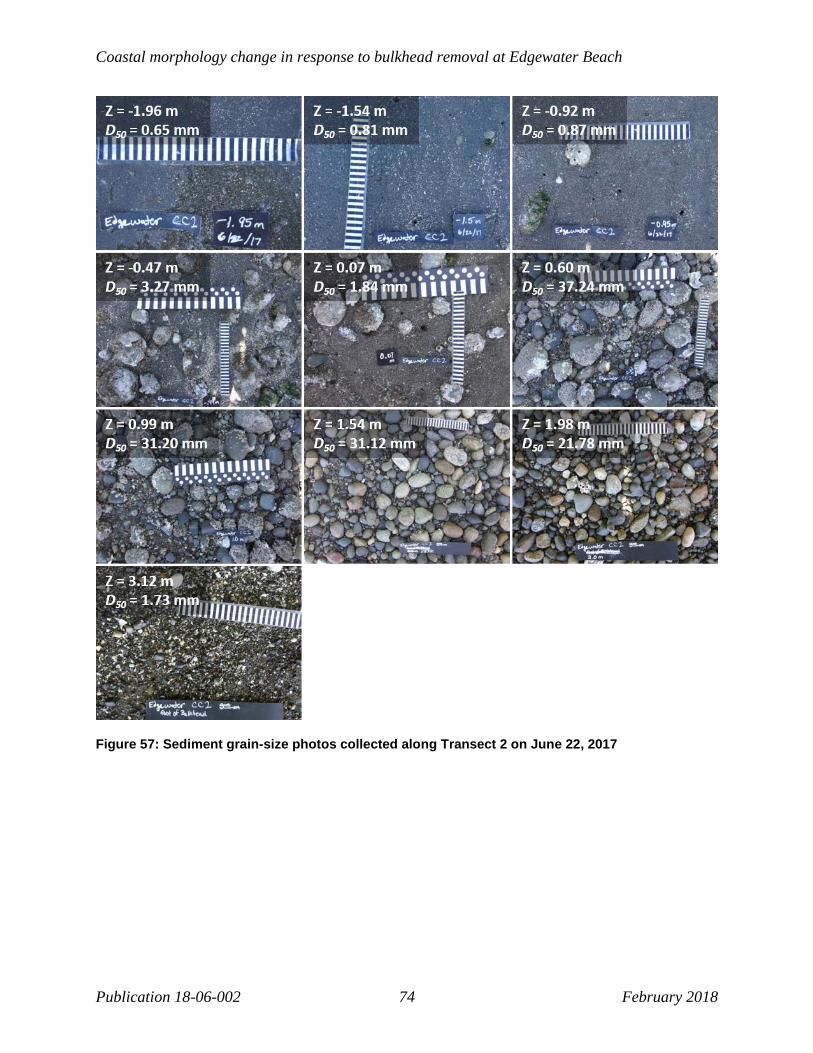
Coastal morphology change in response to bulkhead removal at Edgewater Beach
Publication 18-06-002 74 February 2018
Figure 57: Sediment grain-size photos collected along Transect 2 on June 22, 2017
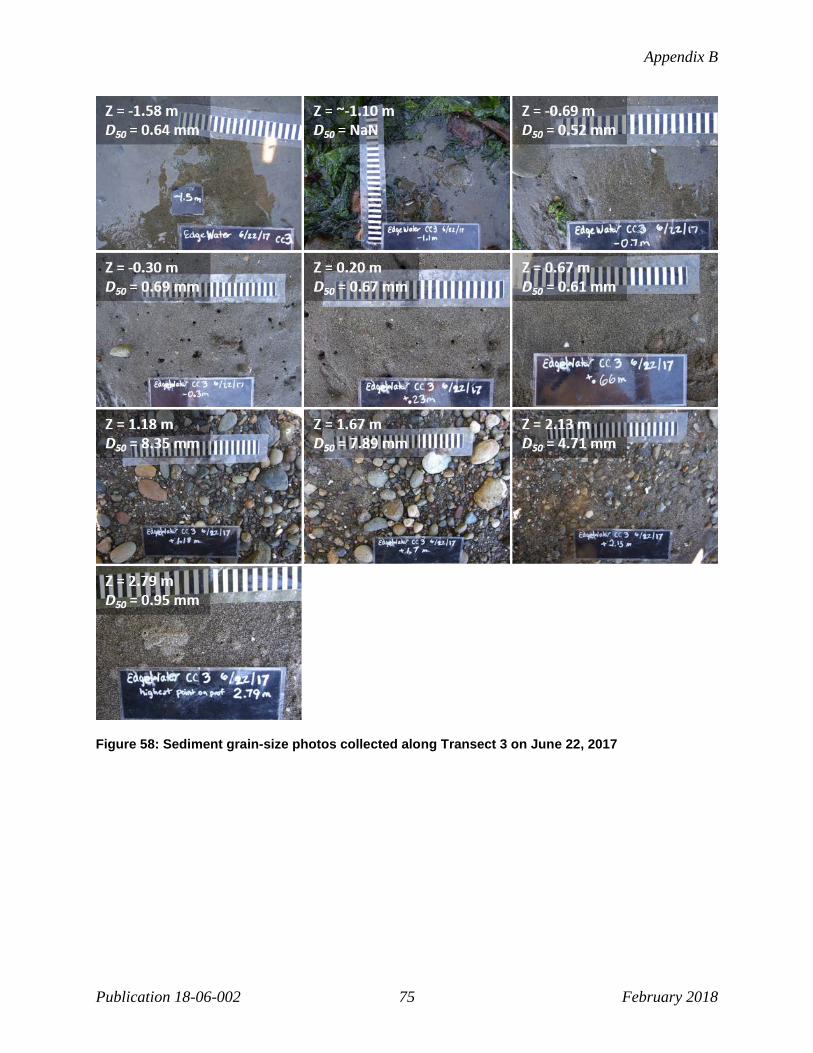
Appendix B
Publication 18-06-002 75 February 2018
Figure 58: Sediment grain-size photos collected along Transect 3 on June 22, 2017
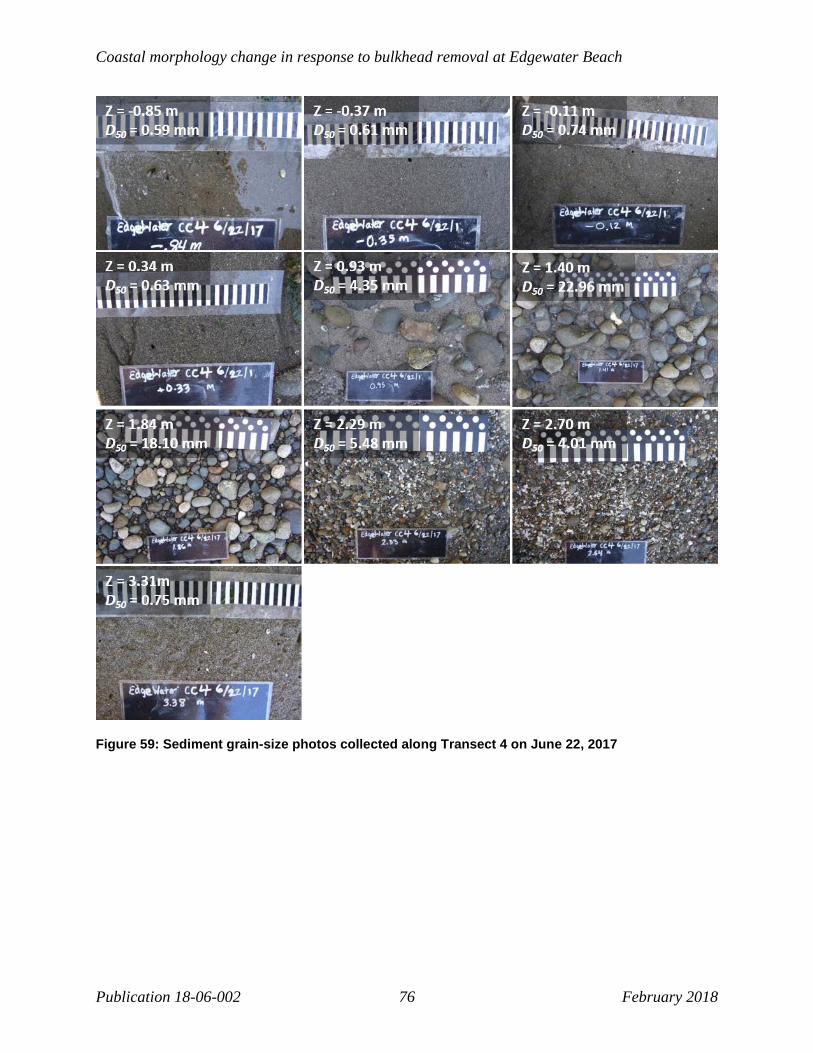
Coastal morphology change in response to bulkhead removal at Edgewater Beach
Publication 18-06-002 76 February 2018
Figure 59: Sediment grain-size photos collected along Transect 4 on June 22, 2017

Appendix B
Publication 18-06-002 77 February 2018
Figure 60: Sediment grain-size photos collected along Transect 5 on June 22, 2017