co enhanced oil recovery in the illinois basin · co 2 enhanced oil recovery in the illinois basin...
TRANSCRIPT

CO2 Enhanced Oil Recovery in the Illinois Basin
Scott M. Frailey, Ph.D., P.E.Illinois State Geological Survey
Indiana Center for Coal Technology
April 5, 2012Bloomington, Indiana
Midwest GeologicalSequestration Consortium
www.sequestration.org

Acknowledgements The Midwest Geological Sequestration Consortium is funded by the
U.S. Department of Energy through the National Energy Technology Laboratory (NETL) via the Regional Carbon Sequestration Partnership Program (contract number DE-FC26-05NT42588),
The Illinois Department of Commerce and Economic Opportunity, Office of Coal Development through the Illinois Clean Coal Institute (cost share agreement), and
The Commonwealth of Kentucky, through the Kentucky Consortium for Carbon Storage (KYCCS) at the University of Kentucky, Lexington.
The Midwest Geological Sequestration Consortium (MGSC) is a collaboration led by the geological surveys of Illinois, Indiana, and Kentucky
Gallagher Drilling, Inc and Petco, Inc. field operation partners
CO2 EOR Basics

Oil Reservoirs: General CO2 EOR At specific pressure and temperature, CO2
is a solvent to crude oil Core labs use CO2 as low temperature solvent
Displacement conditions in an oil reservoir Miscible Immiscible

General Oil Recovery: Microscopic Displacement
Oil
WaterMatrix
Pore Throat
Pore Throat
Pore Body
Oil Residual Oil
Water
CO2CO2
Scale: Microns
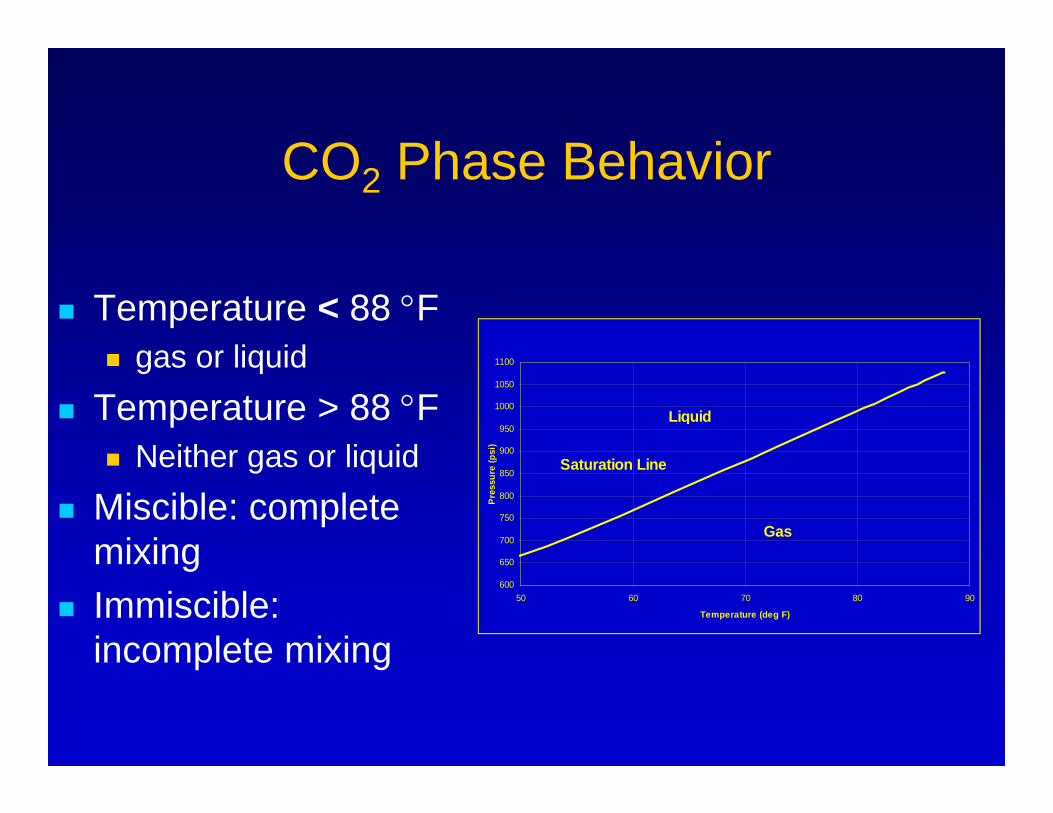
CO2 Phase Behavior
Temperature < 88 F gas or liquid
Temperature > 88 F Neither gas or liquid
Miscible: complete mixing
Immiscible: incomplete mixing
600
650
700
750
800
850
900
950
1000
1050
1100
50 60 70 80 90
Temperature (deg F)
Pres
sure
(psi
)
Liquid
Gas
Saturation Line
Midwest Geologic Sequestration Consortium
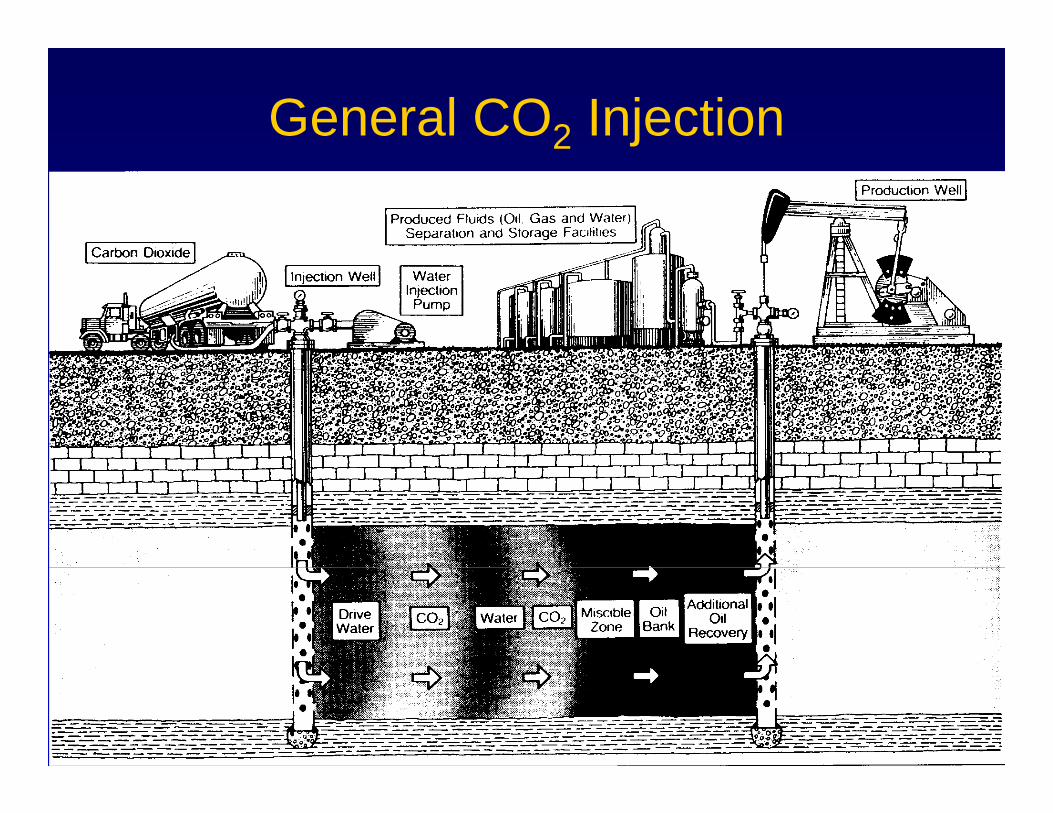
General CO2 Injection
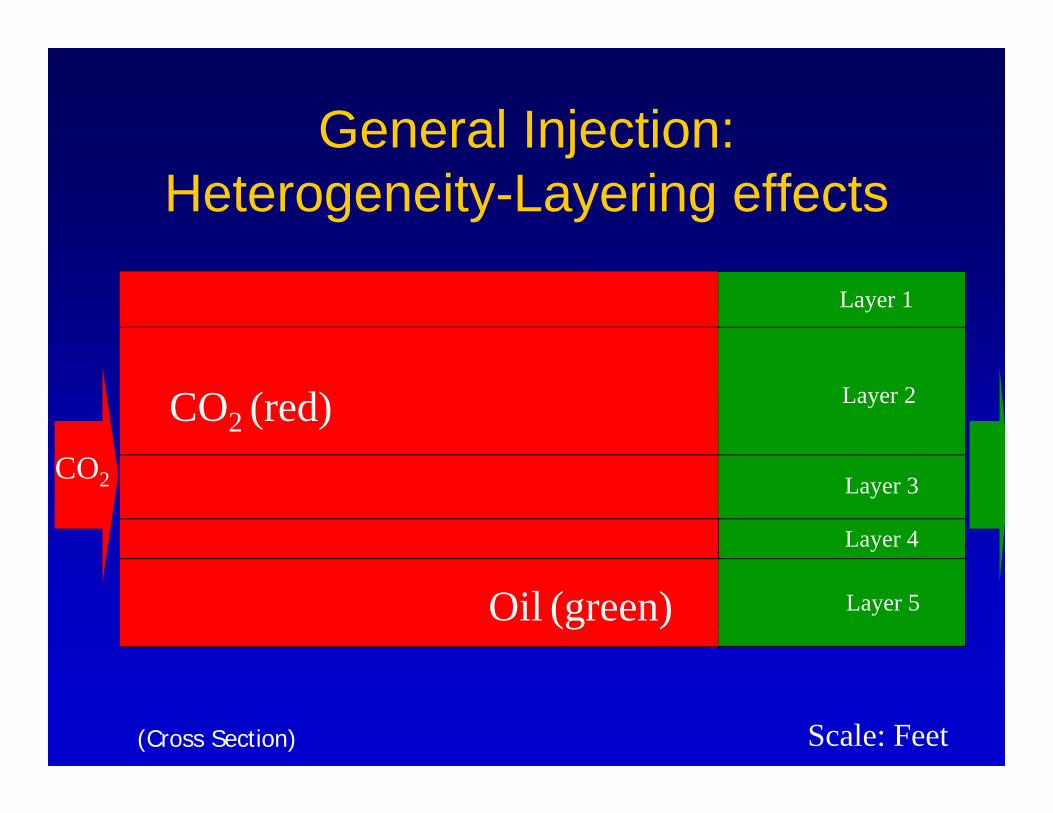
General Injection: Heterogeneity-Layering effects
Layer 1
Layer 2
Layer 3
Layer 4
Layer 5
CO2 (red)
Oil (green)
Scale: Feet
CO2
(Cross Section)
Midwest Geologic Sequestration Consortium
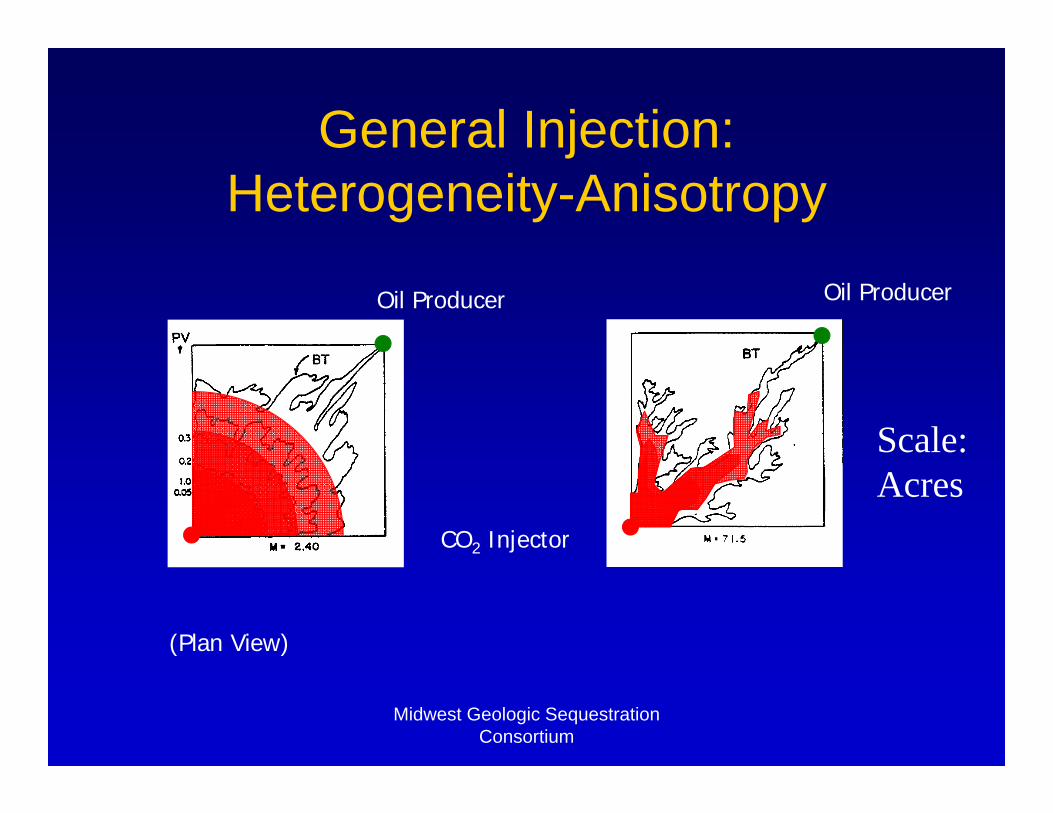
General Injection: Heterogeneity-Anisotropy
Scale: Acres
Oil Producer Oil Producer
CO2 Injector
(Plan View)

Illinois Basin Oilfields
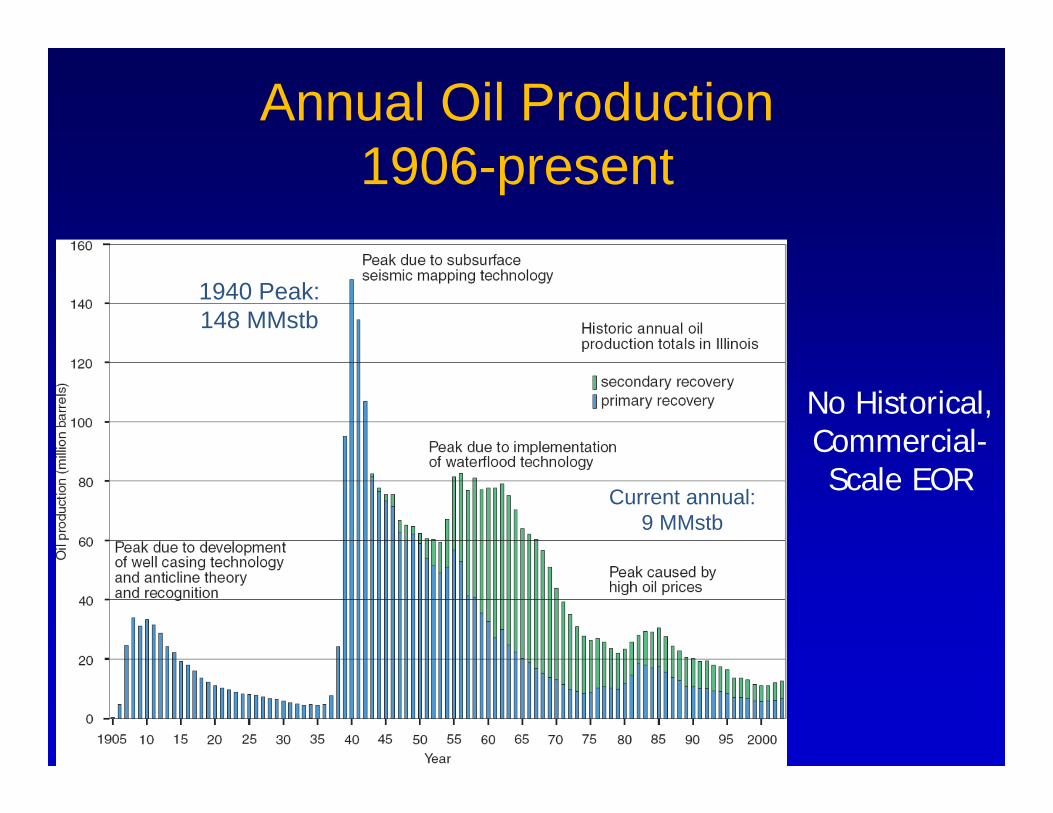
Annual Oil Production 1906-present
1940 Peak: 148 MMstb
No Historical, Commercial-Scale EORCurrent annual:
9 MMstb

.
Stratigraphic Column, Paleozoic Era
Red square – shale resource plays
• Pennsylvanian to Ordovician productive zones
• Over 50 producing horizons -3 prolific
• Reservoirs - porous sandstone and limestone
• Relative shallow• Highly
compartmentalized .Black dot size - relative oil production from each zone

Illinois Basin Oilfields
Oil Production 4.2 BstbOOIP 14.1 Bstb
Illinois
Indiana
Kentucky
0 30 6015Miles
Illinois Basin Oil FieldsOOIP bbls per field
greater than 750,000,000
100,000,000 - 750,000,000
50,000,000 - 10,000,0000
25,000,000 - 50,000,000
less than 25,000,000
Annual Oil Production 9 MMstb19 fields greater than 100 MMstb
OOIP MMstb
Number of Fields
>750 4
100-750 15
50-100 24
25-50 38
<25 >1000

Illinois Basin CO2 EOR Assessment

CO2 EOR Assessment Methodology
Volumetric estimate of original oil in place OOIP CO2 EOR oil recovery (% OOIP)
Reservoir simulation for recovery and storage factors based on Illinois Basin geologic formations (Cypress, Aux
Vases, St. Genevieve) Miscibility type: miscible and immiscible

Deterministic Modeling
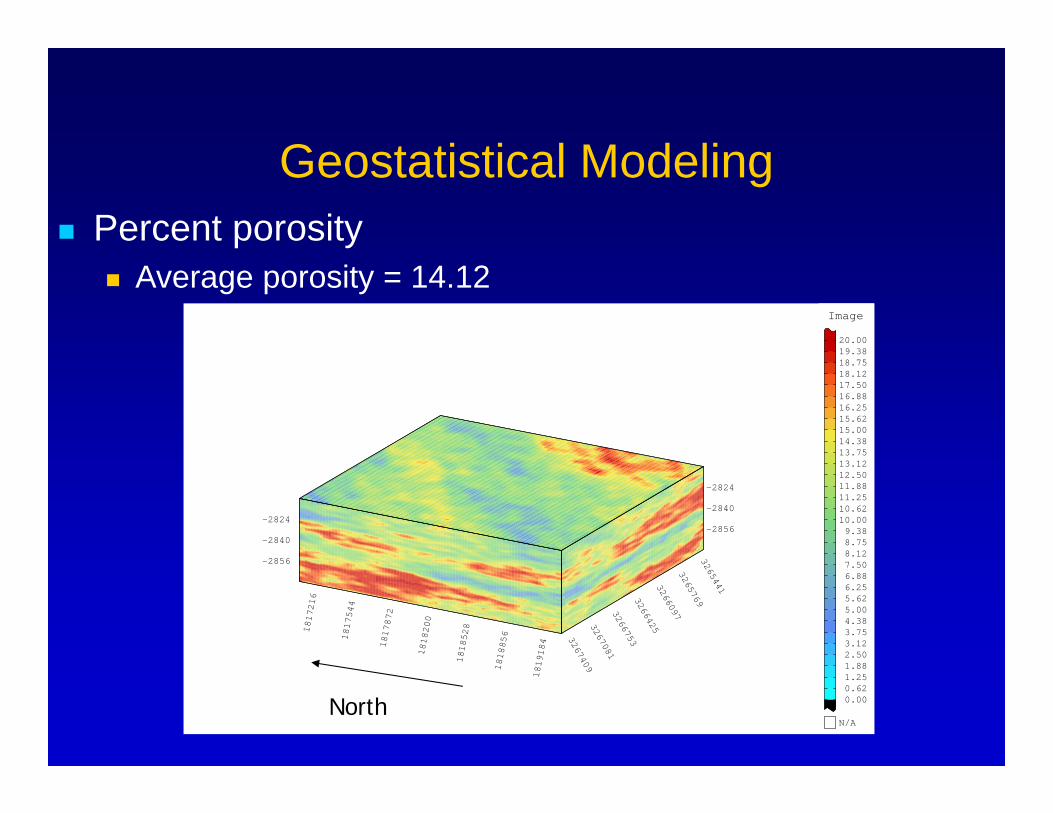
Geostatistical Modeling
-2856
-2840
-2824 -2856
-2840
-2824
3265441
3265769
3266097
3266425
3266753
3267081
3267409
1817216
1817544
1817872
1818200
1818528
1818856
1819184
Image
N/A
20.0019.3818.7518.1217.5016.8816.2515.6215.0014.3813.7513.1212.5011.8811.2510.6210.00 9.38 8.75 8.12 7.50 6.88 6.25 5.62 5.00 4.38 3.75 3.12 2.50 1.88 1.25 0.62 0.00
Percent porosity Average porosity = 14.12
North

Reservoir Modeling
01/40 05/67 10/94 02/22 07/4910
20
30
40
50
60
70
OIL
REC
OVE
RY
(PER
CEN
T)
Dale_CO2_CC OREC
OREC ROOT Dale_CO2_CC OREC ROOT Dale_CO2_CB OREC ROOT Dale_CO2_DAAA OREC ROOT Dale_CO2_DAAB
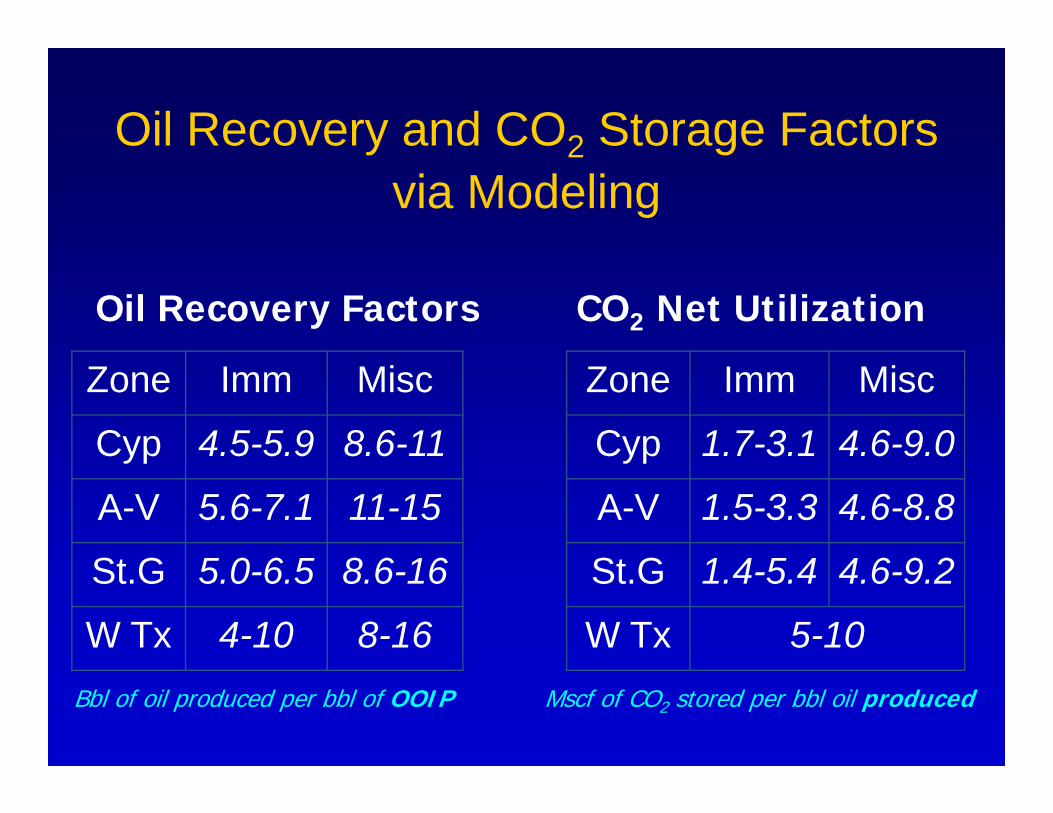
Oil Recovery and CO2 Storage Factors via Modeling
Zone Imm Misc
Cyp 1.7-3.1 4.6-9.0
A-V 1.5-3.3 4.6-8.8
St.G 1.4-5.4 4.6-9.2
W Tx 5-10
CO2 Net Utilization
Zone Imm Misc
Cyp 4.5-5.9 8.6-11
A-V 5.6-7.1 11-15
St.G 5.0-6.5 8.6-16
W Tx 4-10 8-16
Oil Recovery Factors
Bbl of oil produced per bbl of OOIP Mscf of CO2 stored per bbl oil produced
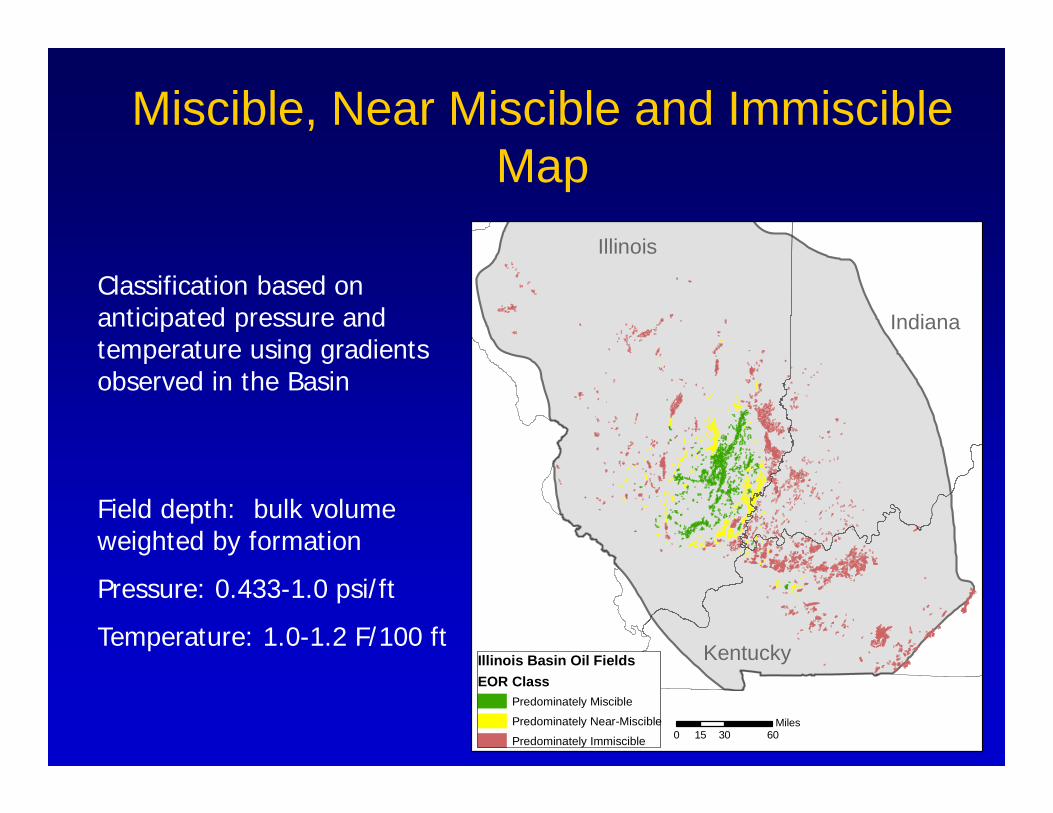
Miscible, Near Miscible and Immiscible Map
Field depth: bulk volume weighted by formation
Pressure: 0.433-1.0 psi/ft
Temperature: 1.0-1.2 F/100 ft
Classification based on anticipated pressure and temperature using gradients observed in the Basin
Illinois
Indiana
Kentucky
0 30 6015Miles
Illinois Basin Oil FieldsEOR Class
Predominately Miscible
Predominately Near-Miscible
Predominately Immiscible

GIS Analysis: OOIP &
Miscibility Map
Illinois
Indiana
Kentucky
0 30 6015Miles
Illinois Basin Oil FieldsOOIP bbls per field
greater than 750,000,000
100,000,000 - 750,000,000
50,000,000 - 10,000,0000
25,000,000 - 50,000,000
less than 25,000,000
EOR ClassPredominately Miscible
Predominately Near-Miscible
Miscibility Condition
OOIPBstb
Miscible 2.1-2.5Near 3.5-4.1
Immiscible 6.4-7.5

CO2 EOR and CO2 SV Maps(Distribution)
Illinois
Indiana
Kentucky
Illinois Basin Oil FieldsOOIP bbls per field
greater than 750,000,000
100,000,000 - 750,000,000
50,000,000 - 10,000,0000
25,000,000 - 50,000,000
less than 25,000,000
EOR ClassPredominately Miscible
predominately Near-Miscible 0 10 205Miles
Condition CO2Mtonne
EORBstb
Miscible 58-180 0.24-0.38Near 53-153 0.28-0.40
Immiscible 29-110 0.34-0.49Total 140-440 0.86-1.3
Maps and tables for EOR and CSV based on geologic and reservoir modeling
MGSC CO2 EOR Pilots

EOR: CO2 Sequestration Pilots
Field demonstrations: DOE Regional Sequestration Partnership Program S/EOR I: huff n puff S/EOR II: inverted 5-spot, liquid S/EOR III: area flood, gas S/ECBM: injector with monitoring wells
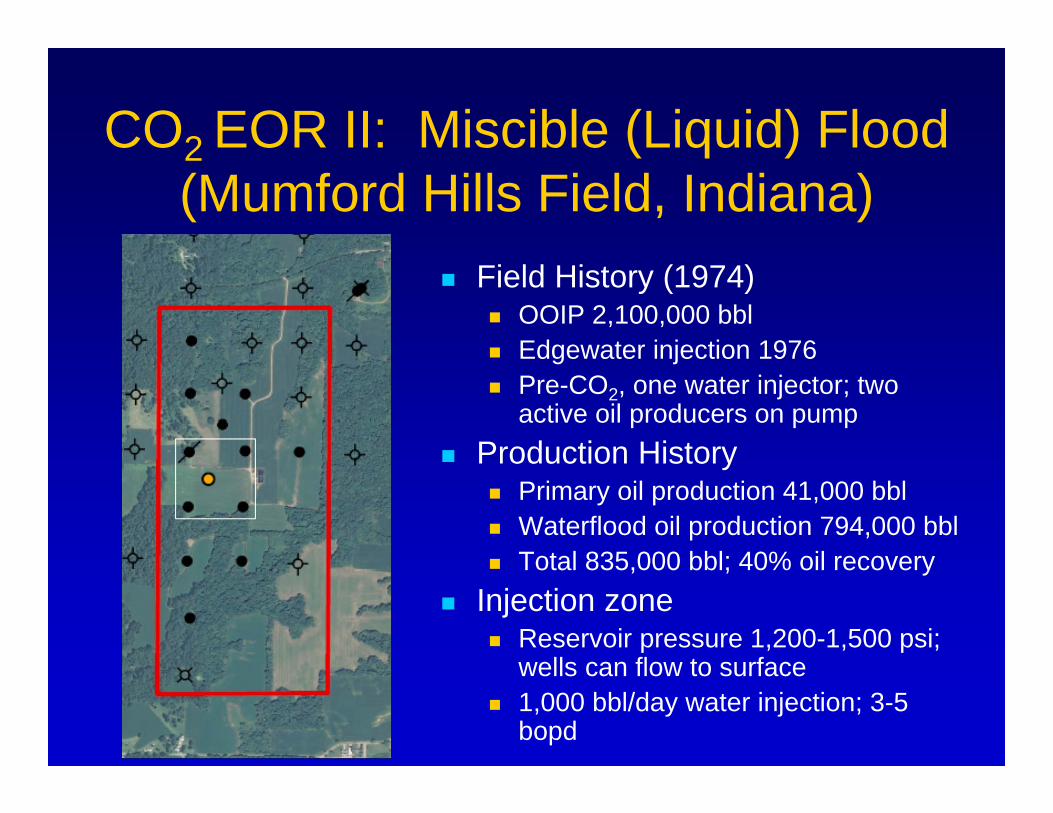
CO2 EOR II: Miscible (Liquid) Flood(Mumford Hills Field, Indiana)
Field History (1974) OOIP 2,100,000 bbl Edgewater injection 1976 Pre-CO2, one water injector; two
active oil producers on pump Production History
Primary oil production 41,000 bbl Waterflood oil production 794,000 bbl Total 835,000 bbl; 40% oil recovery
Injection zone Reservoir pressure 1,200-1,500 psi;
wells can flow to surface 1,000 bbl/day water injection; 3-5
bopd

Isopach Map 2 foot
contour interval
EOR II: Geology
Depth 1,900 ft Small structure w/
stratigraphic pinchout
Channel sand; 10-40 ft thick 20 ft oil column Small bottom aquifer
Porosity 19% Perm 155 md
Good communication
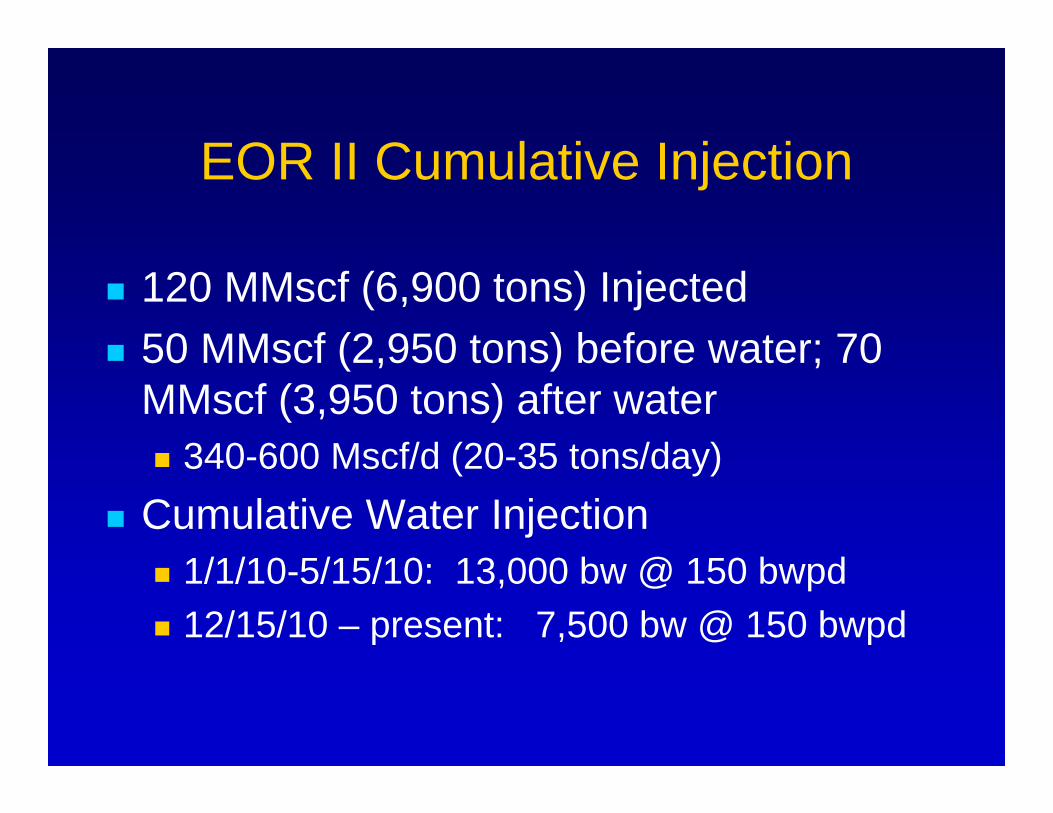
EOR II Cumulative Injection
120 MMscf (6,900 tons) Injected 50 MMscf (2,950 tons) before water; 70
MMscf (3,950 tons) after water 340-600 Mscf/d (20-35 tons/day)
Cumulative Water Injection 1/1/10-5/15/10: 13,000 bw @ 150 bwpd 12/15/10 – present: 7,500 bw @ 150 bwpd

Oil Production Related to Pilot & CO2
0.0
5.0
10.0
15.0
20.0
25.0
30.0
35.0
09/0
3/09
09/1
7/09
10/0
1/09
10/1
5/09
10/2
9/09
11/1
2/09
11/2
6/09
12/1
0/09
12/2
4/09
01/0
7/10
01/2
1/10
02/0
4/10
02/1
8/10
03/0
4/10
03/1
8/10
04/0
1/10
04/1
5/10
04/2
9/10
05/1
3/10
05/2
7/10
06/1
0/10
06/2
4/10
07/0
8/10
07/2
2/10
08/0
5/10
08/1
9/10
09/0
2/10
09/1
6/10
Time
Oil
Prod
uctio
n (s
Oil_bblBaseline Project oil production 2,700 stb
CO2 oil recovery 2,100 stb
Model Projections20 yr Fullfield: 140-190 Mstb 18-20 % OOIP
600 scf/stb (net)

CO2 EOR III: Immiscible Flood(Sugar Creek Field, Kentucky)
Field History (1963) OOIP 2,410,000 bbl Waterflood 1993
Oil Production History Primary 475,000 bbl Waterflood 314,000 bbl Total 793,000 bbl 33% oil recovery
Water injection low reservoir pressure, not
depleted (500-600 psi) 100 bbl/day water injection;
36-42 bopd

Isopach Map 1 foot
contour interval
EOR III Geology
Depth: 1,900 ft Modest structure Lenticular sands
5-10 ft thick Poor to good
communication Porosity 15 %;
perm 15 md

EOR III Cumulative Injection
125 MMscf (7,300 tons) injected (5/26/10) 425 – 515 Mscf/d (25-30 tons/day)
Produced approximately 20% of injected CO2; predominantly from two wells
25,000 bbl water injected 6/7/10-9/30/10 100-150 bwpd

CO2 EOR Estimates
Model Projections
20 yr Fullfield:
113-174 Mstb
2.8-5.5% OOIP
0.88-1.2 Mscf/stb (net)
Pilot: 2.7-3.2 Mstb
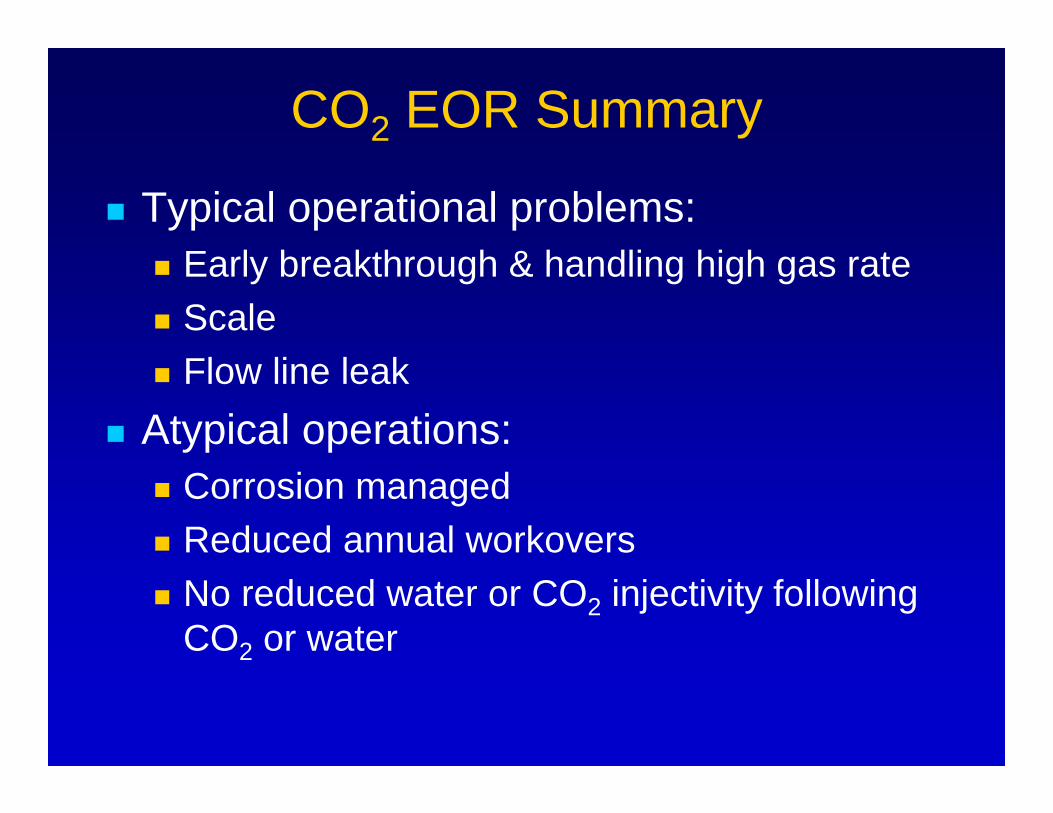
CO2 EOR Summary
Typical operational problems: Early breakthrough & handling high gas rate Scale Flow line leak
Atypical operations: Corrosion managed Reduced annual workovers No reduced water or CO2 injectivity following
CO2 or water

Illinois Basin CO2 EOR: Challenges to Commercial
Deployment
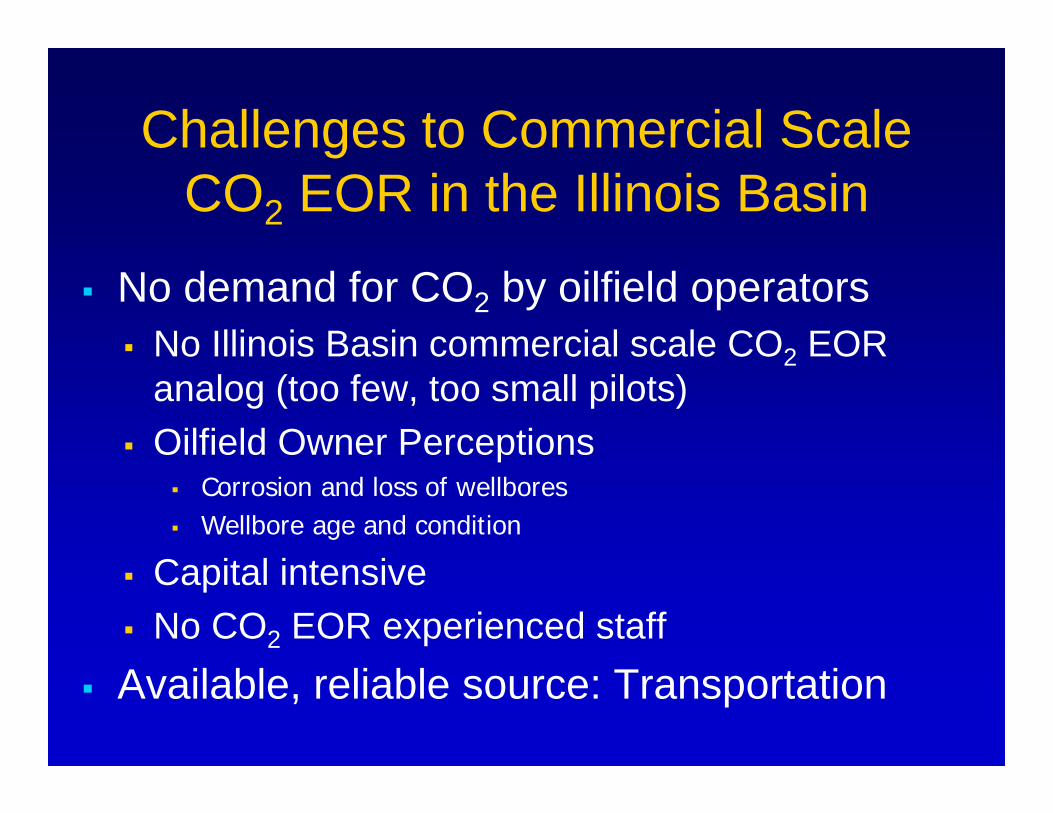
Challenges to Commercial Scale CO2 EOR in the Illinois Basin
No demand for CO2 by oilfield operators No Illinois Basin commercial scale CO2 EOR
analog (too few, too small pilots) Oilfield Owner Perceptions
Corrosion and loss of wellbores Wellbore age and condition
Capital intensive No CO2 EOR experienced staff
Available, reliable source: Transportation

Challenges to Commercial Scale CO2 EOR in the Illinois Basin
Existing Illinois Basin Oilfield operator Large-scale demonstration project
CO2 EOR operators (outside of ILB) Increase familiarity with Illinois Basin
CO2 source and pipeline

CO2 Enhanced Oil Recovery in the Illinois Basin
Scott M. Frailey, Ph.D., P.E.Illinois State Geological Survey
Indiana Center for Coal Technology
April 5, 2012Bloomington, Indiana
Midwest GeologicalSequestration Consortium
www.sequestration.org