manufacturing fired bricks with class f fly ash from illinois basin coals
TRANSCRIPT

COMBUSTION BYPRODUCTS RECYCLING CONSORTIUM Project Number: 02-CBRC-M12
MANUFACTURING FIRED BRICKS WITH CLASS F FLY ASH FROM ILLINOIS BASIN COALS
Final Report September 1, 2004 – August 31, 2006
By
Dr. Mei-In (Melissa) Chou1, 2 (Principal Investigator)
Dr. Sheng-Fu (Joseph) Chou1 (Co-Principal Investigator) Mr. Vinod Patel1 (Technical Assistant)
Mr. Michael D. Pickering1 (Academic Assistant) Dr. Joseph W. Stucki2 (Academic Collaborator)
Illinois State Geological Survey1 University of Illinois Urbana-Champaign
Dept. of Natural Resources and Environmental Sciences2 615 E. Peabody Dr. Champaign IL 61820

i
TABLE OF CONTENTS
DISCLAIMER ……………………………………………………………………..... iii
ACKNOWLEDGEMENTS ..……………………………………………………...... iii
ABSTRACT ………………………………………………………………………….. iv
LIST OF GRAPHICAL MATERIALS ...………………………………………...... v
List of Tables …………………………………………………………………… v
List of Figures …………………………………………………………………... v
INTRODUCTION AND BACKGROUND ...……………………………………..... 1
EXECUTIVE SUMMARY ………………………………………………………….. 2
EXPERIMENTAL .…………………………………………………………………. 5
Sample Acquisition (Task 1) …………………………………………………… 5
Characterization of Raw Materials, Intermediates, and Final
Products (Task 2) ……………………………………...……………………. 5
Producing Bench-scale Commercial-size Green Bricks and
Conducting Preliminary In-plant Firing Evaluations (Task 3) ………….. 6
Commercial-scale Production (Task 4) ………………………..……………….. 7
Economic Assessment (Task 5) ………………………………………………...... 7
Environmental Feasibility Study (Task 6) ……………………………………... 8
Public Outreach (Task 7) ……………………………………………………….. 8
Quarterly and Final Reports (Task 8) ………………………………………….. 8
RESULTS AND DISCUSSION …………………………………………………….. 9
Raw Material and Characterization ………………………………………….. 9
Table 1 ...………………………………………………………………………. 10
Figure 1 ……………………………………………………………………….. 11
Figure 2 ……………………………………………………………….............. 12
Figure 3 ……………………………………………………………………….. 13
Figure 4 ……………………………………………………………………….. 13
Brick Production and Product Characterization – Paving Brick ……………. 14
Commercial specification for paving brick …………………………………… 14
Table 2 …………………………………………………………………….. 15

ii
Bench-scale production and product characterization ……………………….. 15
Figure 5 …….……………………………………………………………… 15
Figure 6 ……………………………………………………………………. 16
Table 3 ……………………………………………………………………... 16
Table 4 ……………………………………………………………………... 17
Commercial-scale production and product characterization ...………………. 17
Table 5 ...…………………………………………………………………. 18
Figure 7 ……………………………………………………………………. 19
Brick Production and Product Characterization – Building Brick ...………… 19
Commercial specification for building brick ………………………………….. 19
Table 6 ……………………………………………………………………... 20
Bench/Commercial-scale production ………………………………………….. 20
Figure 8 ……………………………………………………………………. 21
Figure 9 …………………………………………………………………….. 22
Table 7 …………………………………………………………………….. 22
Economic Assessment …………………………………………………………….. 23
Commercial Market for Brick ………………………………………………….. 25
Environmental Feasibility Study ...……………………………………………… 25
Table 8 ...………………………………………………………………………. 26
CONCLUSION ...……………………………………………………………………. 27
REFERENCES ...……………………………………………………………………. 27
PUBLICATIONS RESULTING FROM THIS PROGRAM ...…………………… 29

iii
DISCLAIMER
This report was prepared as an account of work sponsored by an agency of the United
States Government. Neither the United States Government nor any agency thereof, nor
any of their employees, makes any warranty, express or implied, or assumes any legal
liability or responsibility for the accuracy, completeness, or usefulness of any
information, apparatus, product, or process disclosed, or represents that its use would not
infringe privately owned rights. Reference herein to any specific commercial product,
process, or service by trade name, trademark, manufacturer, or otherwise does not
necessarily constitute or imply its endorsement, recommendation, or favoring by the
United States Government or any agency thereof. The views and opinions of authors
expressed herein do not necessarily state or reflect those of the United States Government
or any agency thereof.
ACKNOWLEDGEMENTS
Support for this project provided in part by the U.S. Department of Energy, National
Energy Technology Laboratory, through its Cooperative Agreement (No.
DE-FC26-998FT40028) with the West Virginia University Research Corporation,
Combustion Byproducts Recycling Consortium (CBRC). The cooperation and in-kind
contributions provided by the Colonial Brick Company, Cinergy PSI, and the Indiana
Geological Survey are valued and appreciated. Special thanks to Dr. Paul Chugh of the
CBRC Midwestern Region Director for reviewing this report.

iv
ABSTRACT
The purpose of this project was to determine if Class F fly ash produced by one of the
power generation stations of the Cinergy PSI is a viable raw material for brick production
at a nearby brick plant. This power generation station is located in Indiana near the
Illinois border, and burns Illinois Basin coals from both Illinois and Indiana.
A technical feasibility assessment was conducted for this process, which uses fly ash as a
substitute for part of the clay and shale used in making conventional bricks.
Commercial-scale production demonstrations, which included extrusion and firing
evaluations, have produced a total of about 4,000 commercial-size paving bricks and
8,000 commercial-size three-hole building bricks for evaluation. The paving bricks
contained 20% by volume of fly ash, and the building bricks contained 20%, 30%, or
40% by volume (about 37% by weight) of fly ash. These final products have met or
exceeded ASTM standard specifications for pedestrian and lightweight traffic paving
bricks and for building bricks of a severe weather grade. An economic evaluation
indicated that it would be economically feasible for the brick plant to use the fly ash as a
raw material in commercial brick production. Also, the environmental feasibility study
showed that, similar to the regular commercial brick, the fly ash containing bricks are
environmentally safe construction products.
This project was successfully completed, and the results indicated that the fly ash tested
is a viable raw material for brick production at the nearby brick plant. The amount of fly
ash that can be consumed will depend on the brick plant’s production rate and the amount
of ash that can be successfully incorporated into the brick body. If bricks with 40 wt% of
ash can be produced, and if a brick plant produces sixteen million bricks per year at five
pounds per brick, about 14,000 tons of fly ash could be consumed by that plant each year.

v
LIST OF GRAPHICAL MATERIALS
List of Tables
Table 1: Metal oxides composition (wt%) of fly ash, shale and
clay samples used in fired brick making ………………………………………… 10
Table 2: ASTM C 902 specifications for pedestrian and light traffic
paving brick ……………………………………………………………………… 15
Table 3: Engineering properties of mold-pressed paving bricks without clay ……... 16
Table 4: Engineering properties of mold-pressed paving bricks with clay ………… 17
Table 5: Engineering properties of paving bricks with 20 vol%
of fly ash from two commercial-scale production runs ………………………….. 18
Table 6: ASTM C 62 specifications for building brick ……………..………………. 20
Table 7: Engineering properties of building bricks from commercial-scale
test runs …………………………………………………………………………… 22
Table 8: Elemental concentrations in simulated acid rain extracts of
fired bricks agitated with acidified water for 24 hours ………………………….. 26
List of Figures
Figure 1: (A) The typical profile (TGA-first derivative curve) for
CBC shale; (B) CPSIC ponded fly ash; (C) and CBC clay samples
while heated under nitrogen atmosphere ………………………………………… 11
Figure 2: SEM images of CBC shale (upper) and CPSIC ponded fly
ash (lower) samples at 6000x ……………………………………………………. 12
Figure 3: Particle size distribution of CPSIC ponded fly ash ……………………….. 13
Figure 4: Particle size distribution of the standard shale/clay mix
used by the brick plant …………………………………………………………… 13
Figure 5: Mold-pressed paving bricks containing 10, 20, and 30
vol% fly ash, balanced with shale and clay, before firing (A) and
after firing (B) ……………………………………………………………………. 15

vi
Figure 6: Mold-pressed paving bricks containing 40 and 50 vol%
fly ash, balanced with shale and clay, before firing (A) and after firing
and then splitting into half (B) …………………………………………………… 16
Figure 7: Run II - 2000 paving bricks containing 20 vol% CPSIC fly ash ………….. 19
Figure 8: Scale-up extrusion at the brick plant produced three-hole green building bricks
(700 bricks per car)…………………………………………………………….…… 21
Figure 9: Four batches of fired building bricks produced from scale-up
production test runs with fly ash inputs at 0, 20, 30, and 40 % by volume ……… 22

1
INTRODUCTION AND BACKGROUND
For the past five years, researchers at the Illinois State Geological Survey
(ISGS)/University of Illinois (UIUC) have been working with brick manufacturers to
develop high quality, marketable brick products that use high-volumes of Class F fly ash
generated from burning Illinois coals (Chou et al. 2000, 2001, & 2002). In this fired
brick-making process fly ash is substituted for part of the clay and shale, the two main
ingredients of conventional bricks. Test bricks produced in previous project years using
Illinois fly ash have met or exceeded commercial specifications. The process developed
has now been commercially accepted and a joint venture by a major Illinois brick
company and an utility company has been established to build a new brick plant in
Illinois which will produce fly ash containing bricks.
The Illinois Basin covers most of Illinois and a part of southern Indiana and western
Kentucky. Current coal production is about 33.8, 37.1, and 25.4 million tons in Illinois,
Indiana, and western Kentucky respectively (U.S. DOE, 2001). From burning these
bituminous coals, it is estimated that more than six million tons of fly ash (Class F) are
produced each year, and it is currently either being ponded or landfilled (Personal
communication between the PI of this investigation and Mr. H. Lewis, Cinergy PSI, 2003
and 2006). This Class F fly ash could be used for fired brick production rather than
further contributing to a solid waste disposal issue. However, until the brick industry
gains more confidence in using fly ash as a raw material in brick production, evaluation
and testing will be needed on a case-by-case basis. The purpose of this project was to
determine if Class F fly ash produced by Cinergy PSI’s Cayuga Power Generation
Station (CPSIC) is a viable raw material for brick production at Colonial Brick Company
(CBC), a brick plant in Indiana near the Illinois border. CBC is located less than five
miles from CPSIC, which burns Illinois Basin coal from both Illinois and Indiana.

2
EXECUTIVE SUMMARY
More than six million tons of Class F fly ash is generated each year from the combustion
of the Illinois Basin coal at a rate of roughly one hundred million tons annually.
Currently, there are no high volume users of this fly ash for cement related construction
products. Most of the fly ash that has been produced was ponded or landfilled, and is
readily available for the testing in fired brick applications. Nevertheless, until the brick
industry gains more confidence in using fly ash as a raw material for their brick
production, evaluation and testing will be needed on a case-by-case basis.
This project was supported in part by the United States Department of Energy, National
Energy Technology Laboratory, and the West Virginia University Research Corporation,
Combustion Byproducts Recycling Consortium, as well as the utility and brick industries.
The purpose of this project was to determine if Class F fly ash produced by one of the
power generation stations of the Cinergy PSI, which burns Illinois Basin coals from both
Illinois and Indiana, is a viable raw material for brick production at a brick plant located
less than five miles from the power station. The objectives of this project were to
conduct the technical, economic, and environmental feasibility assessments of using the
fly ash in commercial brick production. The project also facilitated communication
between brick producers and utilities, which focused on the use of fly ash in commercial
brick production. It also facilitated continued public outreach promoting the benefits of
producing brick products containing fly ash.
Eight Tasks have been conducted to meet the project objectives.
Task 1: Acquire fly ash, clay, and shale samples
Task 2: Conduct chemical, physical, and engineering properties characterizations
Task 3: Conduct bench-scale production and produce commercial-size green bricks for
preliminary in-plant firing evaluations
Task 4: Conduct up to four commercial-scale production test runs and optimize process
parameters, as needed

3
Task 5: Conduct economic assessment and evaluate the critical economic factors in
using fly ash as a raw material for brick making
Task 6: Conduct environmental feasibility study
Task 7: Conduct public outreach
Task 8: Prepare quarterly and final reports
More than 80 commercial-size green bricks were produced by a bench-scale mold
pressed method. These bricks were produced with formulations containing various
amounts of fly ash, shale and clay materials for preliminary firing evaluation. Firing was
conducted using either the ISGS bench-scale kiln or as part of a commercial firing at
CBC. From these preliminary in-plant firing evaluations, it was determined which
formulations would be best suited for commercial-scale production test runs. Six
commercial-scale production test runs have been conducted; two for making paving
bricks and four for making building bricks. Each run produced 2,000 bricks for
commercial evaluation. Paving bricks containing 20 vol% of fly ash and building bricks
containing 20%, 30%, or 40 vol% (about 37 wt%) of fly ash were successfully produced
with a production yield of greater than 95%, an acceptable yield for commercialization.
The final products met the brick plant’s in-house specifications for marketability and
have met or exceeded ASTM standard specifications for pedestrian and lightweight
traffic paving bricks and for building bricks of a severe weather grade.
An economic evaluation of utilizing fly ash in fired brick production at the participating
brick plant was conducted and the results were optimistic. Fly ash has similar chemical
and physical properties to clay and shale and can therefore be integrated into the brick
plant’s production process without capital costs for new equipment. Thus, the major
factors considered during economic evaluation were the cost of obtaining raw materials
and the production costs. When taking into account the utility company’s contribution of
half the cost of shipping due to their own savings as a result of not needing new holding
ponds for their fly ash, and the cost savings from mining and processing the conventional
raw materials, the total annual savings for the brick plant producing 12 million bricks
containing 40 wt% of fly ash could be as much as $58,280.

4
Although fly ash and other brick-making raw materials are not currently regulated by the
U.S. EPA, there were preliminary concerns that utilizing fly ash, a product of coal
combustion, in fired brick production may present environmental problems due to
leaching of trace metals such as mercury. Therefore, a leaching study on fired bricks
from commercial-scale production with and without fly ash was conducted according to
US EPA Method 1320, and the concentrations of twenty elements in the simulated acid-
rain extracts of these samples were examined, including As, Ba, Cd, Cr, Ni, Pb, Ca, B,
and Hg. The amounts of these elements in the extracts from both the fly ash containing
brick samples and the commercial brick samples without fly ash have values well below
the EPA’s regulatory thresholds set for other solid waste materials. The results indicated
that, similar to the regular commercial bricks, the fly ash containing bricks are
environmentally safe construction products
This project was completed successfully, and the results indicated that the fly ash tested
is a viable raw material for brick production at the nearby brick plant. The amount of fly
ash that can be consumed will depend on the brick plant’s production rate and the amount
of ash that can be successfully incorporated into the brick body. At a brick plant’s
current production rate of sixteen million bricks per year (five pounds per brick), utilizing
40 wt% of fly ash per brick would result in an annual consumption of approximately
14,000 tons of fly ash.
The number of bricks produced in the U.S. has steadily increased each year. In 2001,
nationwide production was estimated at 8.3 billion SBE (standard brick equivalents). By
the year 2003, it had increased to 8.6 billion. In 2004, the production reached 9.3 billion,
which would weigh 23.25 million tons at five pounds per brick. When looking at these
statistics, it is evident that the brick market and demand for bricks are strong. Successful
commercial use of bricks containing fly ash could provide an example for a growing and
profitable market for Illinois Basin coal ashes, encourage electric companies to continue
to use Illinois Basin coals, and develop new sources of raw materials for fired brick
manufacturing.

5
EXPERIMENTAL
Sample Acquisition (Task 1)
Fly ash was used as a substitute for part of CBC’s clay and shale, which are the main
ingredients used in making regular bricks. Two shipments of ponded fly ash from the
CPSIC were made. Fly ash sample from the first 20-ton lot (Ash II) shipment was used
for bench-scale and commercial-scale production tests for making paving bricks as
outlined in Task 4. Once this was completed, a 40-ton lot of ponded fly ash sample (Ash
III) was acquired and used in four commercial-scale test runs in which three-hole
building bricks were made, as outlined in Task 4. The shale-clay mix used in these tests
is a standard formulation that CBC uses in mix design. Bucket-size samples of fly ash
from the CPSIC, and clay and shale samples from CBC were acquired for
characterization in Task 2. These samples were also used in the bench-scale production
of commercial-size test bricks, as outlined in Task 3.
Characterization of Raw Materials, Intermediates, and Final Products (Task 2)
The raw material analyses included, but were not limited to, particle shape and size
characterizations, thermo-evolution properties, and chemical compositions. The
chemical analyses included major, minor, and trace elements (including mercury), and
loss on ignition (LOI). In addition, fired bricks from the commercial-scale production
were pulverized for use in simulated acid rain extraction. The extracts from this
experiment were chemically analyzed for an environmental feasibility study in Task 6.
The analyses were conducted at the ISGS analytical laboratory, the UIUC laboratory, the
Waste Management Research Center laboratory, and the ALS Chemex commercial
laboratory. These laboratories are equipped with inductively coupled plasma (ICP), an
atomic emission spectrometer (AES) for analyzing 30 elements, an X-ray fluorescence
spectrometer (XRF) for analysis of metal oxides, a thermogravimetric analyzer (TGA), a

6
scanning electronic microscope (SEM) for particle image analysis, and a cold vapor
atomic absorption spectrometer (AA) for mercury analysis.
The bench-scale and commercial scale-up test bricks were analyzed for their color,
physical appearance, and marketability based on the participating brick company’s own
specifications. In addition, the engineering properties (including water absorption and
compressive strength) of these test bricks were also determined based on the ASTM
standard test methods for the purpose of making comparisons to the brick company’s
standard bricks (made without fly ash). The commercial specifications utilized for the
bench-scale and commercial scale-up test brick evaluations were ASTM C 902 for paving
bricks and ASTM C 62 for building bricks.
Producing Bench-scale Commercial-size Green Bricks and Conducting Preliminary
In-plant Firing Evaluations (Task 3)
In order to prepare for the commercial-scale production demonstration, the ash samples
collected in Task 1 were blended with the clay/shale from CBC to produce small batches
of commercial-size green bricks at the ISGS bench-scale facility. These mold-pressed
commercial-size green bricks were either fired at the ISGS bench-scale facility or as part
of a commercial firing at CBC for physical and engineering properties evaluations.
To determine the maximum amount of fly ash that could successfully be incorporated
into the brick body while maintaining the engineering properties of the brick company’s
standard bricks without fly ash, a total of forty commercial-size green paving bricks
containing CPSIC fly ash at 10, 20, 30, 40, and 50 vol% were made. The first set of
paving bricks made with fly ash was blended with shale only, and another set of bricks
made with fly ash inputs at the same level was blended with a mix of clay and shale.
Firing of these two sets of paving bricks was conducted first at the ISGS bench scale
facility and then as a part of commercial firing at CBC. The commercial firing facility
was used in order to best simulate the firing conditions of the future scale-up runs.

7
Similarly, a total of more than 40 commercial-size three-hole green building bricks with
various combinations of fly ash, shale, and clay were produced by a mold pressed method
at the ISGS bench scale facility. These green building bricks with fly ash at levels of up
to 60 % by volume (or about 56% by weight) were fired first at the ISGS bench scale
facility and then as a part of commercial firing at CBC. The results were evaluated to
determine the best candidates for scale-up production test runs. The formulations
selected for the scale-up run were those that could maximize the amount of fly ash
substitution while maintaining a level of quality similar to CBC’s standard bricks.
Commercial-scale Production (Task 4)
The existing in-plant extrusion parameters were used and standardized to extrude bricks
containing the maximum possible content of CPSIC’s ponded fly ash. The formulations
that were best for commercial-scale test runs using the existing in-plant parameters for
making both the paving and building brick were determined based on the results of these
bench-scale runs. There were two paving brick and four building brick commercial-scale
production test runs conducted, each producing 2,000 bricks. The final products from
each test run were analyzed according to ASTM commercial specifications. In addition,
the production yield from each run was determined to ensure that the process could be
established at the commercial facility.
Economic Assessment (Task 5)
An economic evaluation of fly ash brick production was conducted to include current
plant parameters and the current transportation costs associated with shipping fly ash.
Since fly ash is a byproduct generated from coal combustion, and most of it is ponded or
disposed of in landfills, the major cost for obtaining the fly ash raw material is the
transportation cost. Shipping and production cost incentives also must be evaluated on a
case-by-case basis. However, no new major equipment is needed to retrofit existing
machinery. The brick company has its own existing market and market penetration
strategy, and the ash containing brick products will not compete with the current market

8
for regular bricks. Furthermore, a survey was conducted on the nationwide brick
production rate as well as the sales figures in the East North Central America (Illinois,
Indiana, Michigan, and Wisconsin) region.
Environmental Feasibility Study (Task 6)
The environmental impacts of using Illinois Basin coal fly ash for producing fired bricks
were assessed with methods previously developed. A leaching study was conducted on
the final products using U.S. EPA Method 1320 (1986). The concentrations of twenty
elements in the extracts of these samples were examined, including concentrations of As,
Ba, Cd, Cr, Ni, Pb, Ca, B, and Hg. Analysis of the elemental composition of the leachates
generated from the simulated acid-rain extractions was performed using an inductively
coupled plasma (ICP), an atomic emission spectrometer (AES), and/or an atomic
absorption spectrometer (AA). A cold vapor atomic absorption spectrometer was used
for mercury analysis.
Public Outreach (Task 7)
The PI has entertained questions and initiated group discussions on the benefits of using
fly ash in fired brick formulations, and has attended and presented project results to
various interested organizations, such as the World of Coal Ash Conference held April
11-15, 2005, in Lexington, Kentucky (Chou et al 2005a) and the International Congress
on Ash Utilization Conference held December 4-7, 2005 in New Delhi, India (Chou et al
2005b).
Quarterly and Final Reports (Task 8)
Quarterly progress reports were prepared and submitted to the funding agency on time.
Conclusions drawn from interpreting the data developed during the project were
presented in those progress and final reports.

9
RESULTS AND DISCUSSION
Raw Material and Characterization
The fly ash samples, as well as the clay, shale, and clay/shale mix raw materials acquired
were analyzed for their chemical and physical properties. The clay/shale mix used is a
standard formulation that the brick company uses. The resulting data, such as volatility
(LOI content), soluble salt content (mainly CaO value), particle size, microstructure, and
thermo-evolution characteristics, are useful for pre-screening the raw materials to help
eliminate potential problems inherent in fired-brick making such as bloating, scum
formation, and poor production yield.
The chemical composition of the raw materials was determined and presented as metal
oxide composition and the amount of unburned carbon was measured as the loss on
ignition (LOI) value. The chemical data (Table 1) indicated that the fly ash samples
contain three major oxides (SiO2, Al2O3, and Fe2O3) in an amount similar to that of the
conventional clay, shale and clay/shale mix materials. From our previous fly ash brick
studies, the CaO content provides a general guide for selecting samples to avoid salt
scum deposition on the surface of the bricks after firing. In general, CaO values of up to
6% are manageable in brick making to avoid scum deposition. As indicated in Table 1,
the CaO values for the shale and clay samples (less than 1%) are relatively lower than
those of the ash samples (between 1.2% to 3%); however, the relatively higher values for
the CaO content of these ash samples was not a concern for scum formation.

10
Sample ID SiO2 Al2O3 Fe2O3 TiO2 MnO MgO CaO Na2O K2O P2O5 LOI
Ash II 59.13 26.32 5.04 0.85 0.05 1.38 1.06 0.60 3.52 0.09 1.16Ash II
(duplicate*) 54.78 24.36 5.48 1.22 0.06 1.04 3.00 1.11 2.75 0.23 4.95
Ash III 54.27 23.90 11.62 1.27 0.02 1.10 1.23 0.78 2.8 0.18 1.70Ash III
(duplicate*) 54.47 23.52 12.35 1.26 0.03 1.09 1.20 0.73 2.88 0.20 1.8
Shale/Clay Mix 59.64 18.29 6.49 1.10 0.12 1.91 0.61 0.85 3.08 0.16 7.46
Shale 60.15 17.88 6.67 1.07 0.10 1.96 0.70 0.94 3.09 0.16 6.93Shale
(duplicate*) 59.58 18.07 6.81 1.07 0.10 1.68 0.71 0.94 2.84 0.18 7.62
Clay 58.21 20.85 5.48 1.17 0.08 1.31 0.7 0.46 2.36 0.12 9.06
The LOI value indicates that the amount of volatile matter that would be released during
firing. Table 1 shows that the LOI values for the fly ash samples were much lower (up to
4.95%) than that for the clay and shale samples (9.06 and 7.62 wt% respectively) used by
the brick manufacturer. This is due in part to the fact that fly ash is a byproduct from
coal combustion, so the material had already been through a high temperature heating
process where most weakly bonded and highly volatile organic materials had either been
burned off or were converted to tightly bonded organic materials. Overall, the CaO and
LOI content of the ash material were acceptable for making fired bricks.
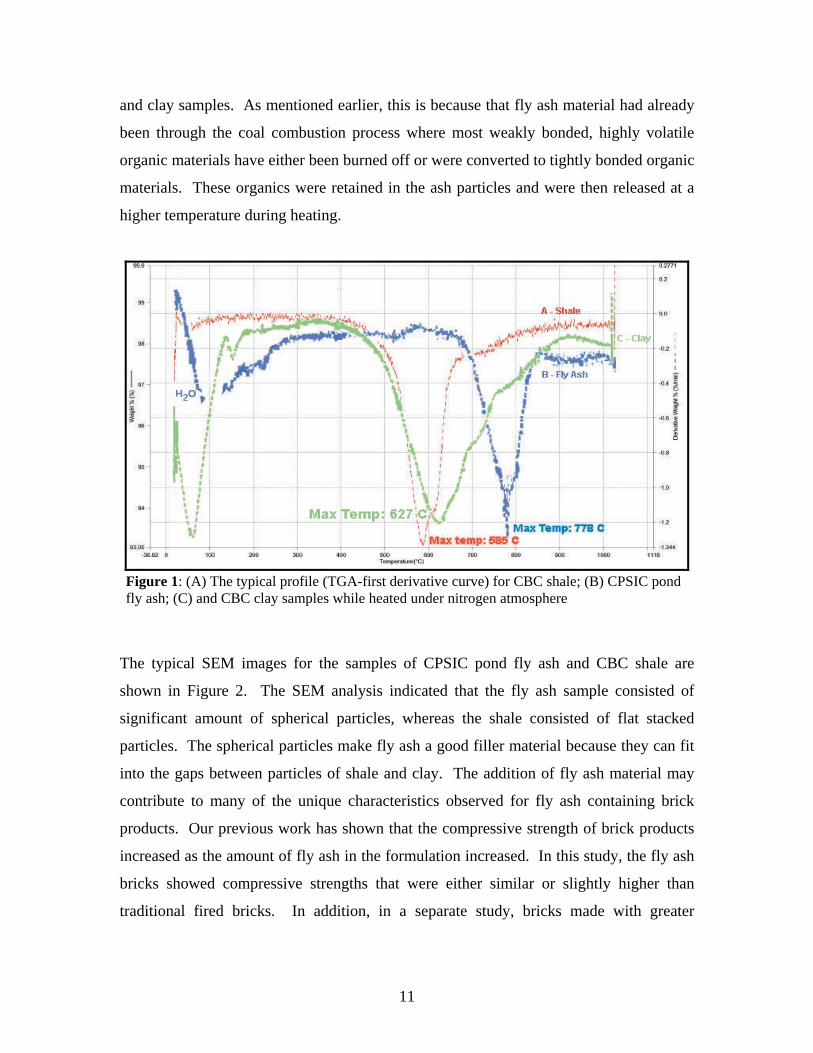
Thermogravimetric analysis (TGA) was conducted on the raw materials to determine the
amount of weight loss from each sample at various temperatures. The samples were
heated from 25°C to 1030°C at 30°C per minute under a nitrogen atmosphere. A typical
TGA-first derivative curve for shale (A) fly ash (B) and clay (C) is shown in Figure 1.
The results indicated that the temperature for maximum weight loss of the CBC shale
sample occurred around 585 °C, whereas, the temperature for the maximum weight loss
of the CBC clay sample was around 627°C, and the maximum weight loss for the CPSIC
pond fly ash sample occurred around 778°C. It was expected that the maximum weight
loss for the ash samples occurred at a relatively higher temperature than that of the shale
Ash II = the 20-ton lot CPSIC pond fly ash sample; duplicate* = duplicated sampling of the sample indicated; Ash III = the 40-ton lot CPSIC pond fly ash sample.
Table 1: Metal oxide compositions (wt%) in fly ash, shale and clay samples.
11
and clay samples. As mentioned earlier, this is because that fly ash material had already
been through the coal combustion process where most weakly bonded, highly volatile
organic materials have either been burned off or were converted to tightly bonded organic
materials. These organics were retained in the ash particles and were then released at a
higher temperature during heating.
The typical SEM images for the samples of CPSIC pond fly ash and CBC shale are
shown in Figure 2. The SEM analysis indicated that the fly ash sample consisted of
significant amount of spherical particles, whereas the shale consisted of flat stacked
particles. The spherical particles make fly ash a good filler material because they can fit
into the gaps between particles of shale and clay. The addition of fly ash material may
contribute to many of the unique characteristics observed for fly ash containing brick
products. Our previous work has shown that the compressive strength of brick products
increased as the amount of fly ash in the formulation increased. In this study, the fly ash
bricks showed compressive strengths that were either similar or slightly higher than
traditional fired bricks. In addition, in a separate study, bricks made with greater
Figure 1: (A) The typical profile (TGA-first derivative curve) for CBC shale; (B) CPSIC pond fly ash; (C) and CBC clay samples while heated under nitrogen atmosphere

12
amounts of fly ash had a lower thermal conductivity, which is indicative of better heat
insulation.
The particle size distribution patterns of the CPSIC pond fly ash sample and CBC
standard feed material (shale/clay mix sample) are shown in Figure 3 and Figure 4
respectively. The fly ash sample (Figure 3) shows ranges in size from 1 to 200 microns,
with a majority smaller than 30 microns. A similar size distribution pattern was observed
for the shale/clay mix after being ground at the brick plant (Figure 4). The fly ash
sample is fine enough to be used in fired brick making without undergoing additional
Figure 2: SEM images of CBC shale (upper) and CPSIC ponded fly ash (lower) samples at 6000x

13
processing which represents a distinct economic advantage of utilizing fly ash in the
brick formulation.
The X-ray diffraction (XRD) analysis determined the mineralogical properties of the fly
ash, shale and clay samples. The ashes, as expected, are a mixture of crystalline and
amorphous materials. The crystalline components include quartz that escaped melting
and minerals such as mullite and hematite/magnetite that formed at high temperature
during coal combustion. The shale sample contained refractory and generally larger
CBC shale/clay mix
CPSIC pond fly ash
Figure 3: Particle size distribution of CPSIC fly ash
Figure 4: Particle size distribution of the standard shale/clay mix used by the brick plant

14
particles (kaolinite and quartz) that maintain the shape of the body during firing, and the
shale and clay samples also contained enough lower melting point minerals (feldspars,
chlorite, and Fe-rich illite) to melt and form a steel-hard body, which has a very low
water absorption.
Brick Production and Products Characterization – Paving Brick
Commercial specification for paving brick
The CBC plant is currently producing paving bricks containing no fly ash. In addition to
the ASTM C902 specification, the CBC plant has its own in-plant method to monitor the
quality of their commercial paving bricks.
As shown in Table 2, ASTM C902 specifies that paving bricks used for pedestrian and
light traffic should have a minimum compressive strength of 7,000 psi for Grade SX
(severe weather) for an individual brick or 8,000 psi for an average of five bricks. The
maximum cold water absorption allowed is 11 wt% for an individual brick or 8 wt% for
an average of five bricks. The maximum saturation coefficient (ratio of cold to boiling
water absorption) must be equal to or less than 0.80 for an individual brick, or 0.78 for an
average of five bricks. The abrasion resistance index is defined as the ratio of the cold
water absorption to the compressive strength in percent. The maximum abrasion index
allowed is 0.11 for Type I brick that is exposed to extensive abrasion, such as on
driveways or at the entrance to a public building. The maximum abrasion allowed for
Type II brick is 0.25, for brick exposed to intermediate abrasion, such as residential
walkways. The maximum abrasion index allowed for Type III is 0.50. This type of brick
is subject to low abrasion and is used in floors in single-family homes.

15
Minimum Compressive Strength, psi
Maximum 24-h Cold Water Absorption, %
Maximum Saturation Coefficient* ASTM C902
Class Designation 5 Brick
Average Individual
Brick 5 Brick Average
Individual Brick
5 Brick Average
Individual Brick
Class SX 8,000 7,000 8 11 0.78 0.80
Class MX 3,000 2,500 14 17 no limit no limit
Class NX 3,000 2,500 no limit no limit no limit no limit
Maximum Abrasion Resistance Index**
0.11 (Type I) 0.25 (Type II) 0.50 (Type III)
Bench-scale production and product characterization
The firing of the two sets of green paving bricks conducted at the ISGS bench scale kiln
was successful. Another set of the same green paving bricks, which was fired as a part of
commercial firing at CBC commercial kiln, was also successful. These preliminary in-
plant firing tests produced high-quality, attractive, and strong paving bricks, as shown in
Figures 5 and 6.
Table 2: ASTM C 902 specifications for pedestrian and light traffic paving brick
Figure 5: Mold-pressed paving bricks containing 10, 20, and 30 vol% fly ash, balanced with shale and clay, before firing (A) and after firing (B)
(A) (B)
*The saturation coefficient is the ratio of absorption after 24 hour submersion in cold water to absorption after 5 hour submersion in boiling water; **The abrasion resistance index is the ratio of the cold water absorption to the compressive strength in percent.

16
Water absorption tests were conducted on these mold-pressed fired bricks including cold
and boiling water absorption measurements. A saturation coefficient was calculated in
order to track batch to batch consistency. The results for the first set of paving bricks
with fly ash inputs of 10 to 50 vol% blended with shale only are shown in Table 3. The
results for another set of paving bricks made with fly ash inputs at the same level but
blended with a mix of clay and shale are shown in Table 4.
Brick
composition, vol%
CPSIC 10 CBCS 90
CPSIC 20 CBCS 80
CPSIC 30 CBCS 70
CPSIC 40 CBCS 60
CPSIC 50 CBCS 50
Firing facility ISGS CBC ISGS CBC ISGS CBC ISGS CBC ISGS CBC
Cold water 24 hr soak, % 8.84 4.66 8.47 6.61 9.37 8.36 9.85 8.20 10.05 8.84
Boiling water 5 hr soak, % 11.38 6.72 11.20 9.44 12.44 11.57 13.35 11.86 13.70 12.64
Saturation coefficient 0.78 0.69 0.76 0.70 0.75 0.72 0.74 0.69 0.73 0.70
A general trend was observed for the water absorption capacity of these mold-pressed
bricks in which those with a greater fly ash input tended to absorb more water. However,
Figure 6: Mold-pressed paving bricks containing 40 and 50 vol% fly ash, balanced with shale and clay, before firing (A) and after firing and then splitting in half (B)
(A) (B)
CPSIC = Cinergy Ponded Fly Ash; CBCS = CBC Shale; CBCC = CBC Clay
Table 3: Engineering properties of mold-pressed paving bricks without clay

17
the cold water and boiling water absorption capacities increased proportionally so the
saturation coefficient remained nearly constant for each case. The maximum firing
temperature for the ISGS kiln and the commercial kin at the CBC was similar, ranging
between 1922°F and 1950°F. All of the mold-pressed test bricks met the ASTM
commercial specification for water absorption. The compressive strength of the mold-
pressed paving bricks was also measured, and the results ranged from 7230 psi to 16030
psi.
Brick
composition, vol%
CPSIC 10 CBCS 76.67 CBCC 13.33
CPSIC 20 CBCS 66.67 CBC 13.33
CPSIC 30 CBCS 56.67 CBC 13.33
CPSIC 40 CBCS 46.67 CBC 13.33
CPSIC 50 CBCS 36.67 CBC 13.33
Firing facility CBC ISGS CBC ISGS CBC ISGS CBC ISGS CBC
Cold water 24 hr soak, % 5.67 6.80 5.33 7.25 7.04 8.15 6.59 8.77 8.15
Boiling water 5 hr soak, % 8.21 9.33 7.72 10.15 9.96 11.51 10.10 12.62 12.04
Saturation coefficient 0.69 0.73 0.69 0.71 0.71 0.71 0.65 0.69 0.68
Commercial-scale production and product characterization
Based on the results of the bench-scale paving brick evaluation, two commercial-scale
production test runs, including extrusion and firing of 2,000 bricks per run, were
conducted at CBC’s commercial facility. Run I produced paving bricks with raw
materials containing 20 vol% (about 14 wt%) of the CPSIC fly ash balanced with 80
vol% of CBC shale. The extrusion and firing processes produced bricks with a 75%
yield. Run II was then conducted with 20 vol% of the CPSIC fly ash balanced with a 3:1
mix of CBC’s shale and clay.
Run I: 20 vol% CiPFA; 80 vol% CBCS
Run II: 20 vol% CiPFA; 60 vol% CBCS; 20 vol% CBCC
CPSIC = Cinergy Ponded Fly Ash; CBCS = CBC Shale; CBCC = CBC Clay
Table 4: Engineering properties of mold-pressed paving bricks with clay

18
The engineering properties of the final products from the two commercial-scale
production test runs (Run I and Run II) are compared in Table 5. Although the water
absorption data and the compressive strength of the paving bricks from Run I have met or
exceeded ASTM C 902 specifications, the extremely low water absorption capacity of the
Run I bricks indicated that these bricks (Run I firing) had experienced an over heated
heating cycle. Also, the production yield of Run I would be too low to be accepted for
commercialization. The results from Run II indicated that an inclusion of a low level of
clay material (20 vol%) in the raw mix containing fly ash improved the extruding ability
of the mixed raw materials and reduced cracking and chipping of the bricks, thereby
significantly increasing the production yield, from 75% to 100%. A photo of the high-
quality, attractive, and strong paving bricks from the second commercial-scale
production, Run II, is shown in Figure 7.
Run-I without clay added
Run-II with clay added
Cold water, wt% (Class SX < 8 wt%) 1.75 6.81
Boiling water, wt% 2.55 9.65
Max
. wat
er
abso
rptio
n
Saturation coefficient* (Class SX < 0.78) 0.69 0.71
Fired compressive strength, psi (Class SX >8,000 psi) 29,910 23,540
Suction rate, g (wt. gain/ minute) 2.50 20.8 Scum No No
Modulus of Rupture, psi ( >1,000 psi) 1737 1959
Abrasion Resistance Index (Type I < 0.11) 0.006 0.029
ASTM C902 Classification Class SX, Type I Class SX, Type I
Production Yield 75% 100%
Table 5: Engineering properties of paving bricks with 20 vol% of fly ash from two commercial-scale production runs
ASTM C902 - Standard specifications for Pedestrian and Light Traffic Paving Brick; Run I: 20 vol% fly ash and 80 vol% shale; Run II: 20 vol% fly ash, 60 vol% shale, and 20 vol% clay

19
Brick Production and Product Characterization – Building Brick
Commercial specification for building brick
The CBC plant is currently producing building bricks containing no fly ash. In addition to
the ASTM C62 specification, the CBC plant has its own in-plant method to monitor the
quality of their commercial building bricks. ASTM C62 (Table 6) specifies that building
bricks must have a minimum compressive strength of 2,500 psi for Grade SW (severe
weather) for an individual brick or an average of 3,000 psi for five bricks measured. If
the cold water absorption less than 8 wt%, then the boiling water absorption test and
saturation coefficient specifications are waived. Otherwise, the maximum boiling water
absorption allowed is 20% for an individual brick or an average of 17% for five bricks.
The maximum saturation coefficient must be equal to or less than 0.80 for an individual
brick, or an average of 0.78 for an average of five bricks.
Figure 7: Run II: 2000 paving bricks containing 20 vol% CPSIC fly ash

20
Maximum 24-h Cold Water Absorption, 8 %* Minimum Compressive
Strength, psi Maximum 5-h Boiling Water Absorption, %
Maximum Saturation Coefficient**
ASTM C 62 Class
Designation 5 Bricks Average
Individual Brick
5 Bricks Average
Individual Brick
5 Bricks Average
Individual Brick
Class SW 3,000 2,500 17 20 0.78 0.80
Class MW 2,500 2,200 22 25 0.88 0.90
Class NW 1,500 1,250 no limit no limit no limit no limit
Bench/Commercial-scale production
During bench-scale tests, the mold-pressed three-hole building bricks with fly ash at
levels of up to 60 % by volume (or about 56% by weight) were fired as part of the
commercial firing at CBC, and these preliminary in-plant firings were successful.
Based on the results of the bench-scale building brick evaluation and to determine which
formulations could be the most readily adaptable to commercial production while still
using a significant amount of fly ash, many discussions between the ISGS and the
industry partners were conducted. It was concluded that four runs would be conducted
with fly ash levels of 0, 20, 30, and 40 vol%. The run with 0 vol% fly ash was used as a
control run to mimic the standard production formulations for the brick plant. Each of
the runs with fly ash included a constant level of 10 vol% clay which helped to improve
the yield of the final products. An increased fly ash inputs from 20, 30, and 40 vol%
were chosen for the building brick test runs because the amount of fly ash used in the
paving brick test runs was deemed the minimum workable level. The building brick test
Table 6: ASTM C 62 specifications for building brick
*If the cold water absorption does not exceed 8 wt%, then the boiling water absorption, and saturation coefficient specifications are waived; ** the saturation coefficient is the ratio of absorption by 24 hour submersion in cold water to the absorption after 5 hour submersion in boiling water.

21
runs would determine whether additional fly ash inputs would be suitable for producing
high quality final products.
Each scale-up extrusion run (one such run shown in Figure 8) produced about 2000
building bricks, and a total of about 8000 three-hole building bricks were produced for
engineering evaluations. The strong and attractive bricks were produced with a
commercially acceptable yield of greater than 95% (Figure 9). Formulations for each of
the four runs are as follows (where CiPFA, CBCS, and CBCC refer to Ponded Fly Ash,
Colonial Brick Company Shale, and Colonial Brick Company Clay, respectively).
Run E1: 0 vol% CiPFA; 85.71 vol% CBCS; 14.29 vol% CBCC
Run E2: 20 vol% CiPFA; 70 vol% CBCS; 10 vol% CBCC
Run E3: 30 vol% CiPFA; 60 vol% CBCS; 10 vol% CBCC
Run E4: 40 vol% CiPFA; 50 vol% CBCS; 10 vol% CBCC
Figure 8: Scale-up extrusion at the brick plant produced three-hole green building bricks (700 bricks per car)

22
Table 7 shows the results of the engineering property tests which include water
absorption, compressive strength, and suction rate. Since the cold water absorption for
all four batch samples did not exceed 8 wt%, the boiling water absorption, and saturation
coefficient specifications were not necessary. The results show that these building bricks
far exceed ASTM building brick specifications and are marketable for the severe weather
grade.
Brick Sample ID E1 E2 E3 E4
Cold water 24 hr soak, % (< 8 wt%) 3.75 4.00 3.93 4.05
Boiling water 5 hr, % (5.30) (6.06) (5.89) (4.30) Max. water absorption
Saturation coefficient (0.71) (0.66) (0.67) (0.94)
Fired compressive strength, psi (Severe weather grade > 3000 psi) 16905 16410 16476 20980
Suction, gm wt gain/minute 5.02 5.62 4.91 2.92
Scum No No No No
E1 E2 E3 E4
Figure 9: Four batches of fired building bricks produced from scale-up production test runs with fly ash inputs at 0% (E1), 20% (E2), 30% (E3), and 40% (E4) by volume
Table 7: Engineering properties of building bricks from commercial-scale test runs
E1, E2, E3, and E4 refer to the brick samples from Run E1, Run E2, Run E3, and Run E4 respectively. The data indicated in the parentheses are not needed because all the cold water absorption data were less than 8%.

23
The building bricks produced with 20 and 30 vol% of fly ash are comparable to the
standard bricks with respect to their compressive strength data. The results from our
previous laboratory studies with extruded bar-size test bricks indicated that the test bricks
with a greater amount of fly ash have a greater fired compressive strength. The
commercial-scale extruded test bricks appeared to have a similar trend as shown by the
bricks with 40 vol% of fly ash having the greatest compressive strength. The bricks were
also produced with a commercially acceptable yield of greater than 95% which means
that building bricks with up to 40 vol% of fly ash would be acceptable for future
commercial production. Once a supply of fly ash is secured, CBC will consider
beginning the producing of fly ash containing bricks thereby extending the life of their
clay and shale reserves.
Economic Assessment
The economic feasibility of producing fired bricks with fly ash at CBC is an important
factor to consider in the commercialization. The ISGS/UIUC process developed for
making fired bricks with coal fly ash uses fly ash as a substitute for part of conventional
raw materials, clay and shale. Since the process can be adopted by using conventional
machinery at the CBC facility, the additional capital cost investment will not be
necessary. Therefore, the major factors to be considered during economic assessment are
the cost of obtaining raw materials and the production costs. The CBC plant has a
production capacity of sixteen million bricks per year. This cost analysis was conducted,
for a conservative measure, using a production rate of twelve million bricks per year.
Based on producing bricks with 40 wt% of fly ash and at 4.25 pounds for each brick, the
production rate of twelve million bricks per year would translate to an annual fly ash
consumption rate of 10,200 tons for the brick plant.
Fly ash is a byproduct of coal combustion, and it is readily available throughout the year.
Also, the producer is eager to give it away at little to no cost. The main cost in obtaining
the fly ash would be in transporting the fly ash from the power station to the brick plant.
24
Transportation cost – A trucking company was contacted to provide a quotation with a
higher rate for shipping fly ash from the CPSIC to CBC. Since the distance between the
two locations is less than 5 miles, the trucking company would charge a rate of $65 per
hour rather than charging by the mile. If the dump truck can carry 25 tons of fly ash and
requires two hours of handling time, the overall transportation cost would be $5.20/ton
(Note that a lower rate of $3.50/ton was provided in an estimate by another company).
The annual cost for transporting 10,200 tons of fly ash, at $5.20/ton, from the CPSIC to
CBC would be $53,040.
Mining cost – If the brick plant were to produce 12 million regular bricks per year, the
annual mining cost would be $143,000. Substituting the conventional raw material by
using 40 wt% of fly ash can reduce the annual consumption of clay and shale material,
thus reducing their mining cost to $85,000 per year, which is a saving of $57,000 per
year.
Therefore, the total estimated annual saving in obtaining the raw material without any
contribution from the utility company would be $4160. However, since the power
company would be saving money because their cost in placing their fly ash in landfills
and holding ponds would be reduced or minimized, they may be willing to help with the
cost of shipping. If the utility company were to contribute half of the shipping cost
($26,520/year), the brick plant would have their saving increased from $4160 to $30,680
per year in obtaining their raw material.
Processing raw material – Fly ash is a fine material which does not require additional
processing, unlike shale and clay which need crushing and extensive grinding. Thus,
using fly ash as a substitute raw material has an additional benefit of reducing processing
costs. Based on the brick plant’s yearly processing cost to process their clay and shale
for brick making, and if fly ash could be used at a rate of 40 wt%, savings from the raw
material processing would be $27,600 per year.
25
In summary, the overall estimated annual cost saving for the brick plant producing 12
million bricks containing 40 wt% of fly ash could be as much as $58,280.
Commercial Market for Brick
According to the Brick Industry Association, the number of bricks produced in the U.S.,
measured as standard brick equivalents (SBE) has steadily increased each year. In 2001,
nationwide production was estimated at 8.3 billion SBE. By the year 2003, it had
increased to 8.6 billion. In 2004, it reached 9.3 billion, which translates into 23.25 million
tons (a standard brick weighs about five pounds). The production in the East North
Central America region (Illinois, Indiana, Michigan, and Wisconsin) was estimated at
290.6 million SBE in 2003, and reached 342.6 million SBE in 2004 (U.S. Census Bureau,
Economic and Statistics Administration, U.S. Department of Commerce).
Environmental Feasibility Study
Although fly ash and other brick-making raw materials are not currently regulated by the
U.S. EPA, the leaching characteristics of fired bricks with and without fly ash were
examined according to US EPA Method 1320. The concentrations of twenty elements
found in the extracts of the samples, including As, Ba, Cd, Cr, Hg, Ni, Pb, Ca, and B, are
shown in Table 8. The regulatory thresholds for the elements set by the US EPA for acid
extractions from other solid wastes are listed in Table 8 as well. The data indicated that
the amounts of these elements in the simulated acid-rain extracts from both the fly ash
containing brick samples (E2, E3, E4) and the commercial brick samples (E1) have
values well below the EPA’s regulatory thresholds set for other solid waste materials.
The results of this study indicate that similar to the regular commercial bricks, the fly ash
containing bricks are environmentally safe construction products.

26
Elemental concentrations in extracts (solid : liquid = 1 : 20) (mg/L)
Samples Al As B Ba Ca Cd Co Cr Cu Fe
Blank 1 0.05 <0.004 <0.01 0.03 0.11 <0.004 <0.002 <0.001 0.0044 <0.04
Blank 2 0.03 <0.004 <0.01 <0.02 <0.10 <0.004 <0.002 <0.001 0.0044 <0.04
E1 0.05 <0.004 0.05 0.15 10.20 <0.004 <0.002 <0.001 <0.004 <0.04
E2 0.52 0.011 0.05 0.10 16.00 <0.004 <0.002 <0.001 <0.004 <0.04
E3 0.16 0.004 0.07 0.13 14.20 <0.004 <0.002 <0.001 <0.004 <0.04
E4 0.21 0.019 0.10 0.12 10.70 <0.004 <0.002 <0.001 <0.004 <0.04
EPA limit - 5.00 - 100 - 1.00 - 5.00 - -
Elemental concentrations in extracts (solid : liquid = 1 : 20) (mg/L) Samples
K Li Mg Mn Na Ni Pb S Se Sr Zn Hg
Blank 1 <0.20 0.092 0.02 0.003 0.19 <0.003 <0.01 8.7 <0.002 <0.04 0.021 0.000009
Blank 2 <0.20 0.101 <0.02 <0.002 <0.10 <0.003 <0.01 8.9 <0.002 <0.04 0.015 0.000005
E1 6.90 <0.04 2.50 0.129 3.21 0.005 <0.01 9.9 <0.002 0.13 0.012 <0.000002
E2 6.30 <0.04 1.70 0.030 2.10 0.004 <0.01 19.8 <0.002 <0.04 0.007 <0.000002
E3 6.70 <0.04 2.29 0.042 2.61 0.0041 <0.01 20.4 0.002 0.07 0.011 <0.000002
E4 6.60 <0.04 2.15 0.023 1.93 0.006 <0.01 11.1 <0.002 <0.04 0.013 <0.000002 EPA limit - - - - - 5.00 5.00 - 1.00 - - 0.2
Table 8: Elemental concentrations in simulated acid rain extracts of fired bricks agitated with acidified water for 24 hours
E1, E2, E3, and E4 refer to the extracts from building bricks containing 0%, 20%, 30%, and 40% by volume of fly ash respectively; Blanks 1 and 2 are blank values for the acid rain water before extraction
Table 8 (continued)

27
CONCLUSION
Paving bricks with 20 vol% of fly ash and building bricks with up to 40 vol% (about 37
wt%) of fly ash were successfully produced in commercial-scale production test runs.
All of the final products met the brick plant’s in-house specifications for marketability
and far exceeded the ASTM commercial specifications for the severe weather grade. The
results showed that the participating brick company can incorporate the fly ash into their
commercial production without acquiring additional machinery, while concurrently
reducing plant operation costs. Also, similar to the regular commercial bricks, the fly ash
containing bricks are environmentally safe construction products.
REFERENCES
American Society for Testing and Materials, Annual book of ASTM standards:
ASTM C 62 Standard Specification for Building Brick (Solid Masonry Units Made
from Clay or Shale); ASTM C 67 Standard Test Methods for Sampling and Testing
Brick and Structural Clay Tile; ASTM C 902 Standard Specification for Pedestrian
and Light Traffic Paving Brick.
Chou, M.-I., V. Patel, S.-F. J. Chou, J. Laird, and K.K. Ho, 2000, Brick Manufacture
with Fly Ash from Illinois Coal, Phase I, IDCCA 99-1/2.1B.5, Illinois Clean Coal
Institute Contract, Carterville, Illinois.
Chou, M.-I., V. Patel, S.-F. Chou, J. Laird, and K.K. Ho, 2001, Manufacturing
Commercial Brick with Fly Ash from Illinois Coals, Phase II, IDCCA 00-1/3.1B.7,
Illinois Clean Coal Institute Contract, Carterville, Illinois.
Chou, M.-I., S.-F. Chou, V. Patel, J.Stucki, and F. Botha, 2002, Commercialization of
Fired Brick with Fly Ash from Illinois Coals, Phase III, IDCCA 01-1/3.1B.3 Illinois
Clean Coal Institute Contract, Carterville, Illinois.

28
Chou, M.-I., S.-F. Chou, V. Patel, J.Stucki, and F. Botha, 2003, Commercialization of
Fired Brick with Fly Ash from Illinois Coals, Phase IV, IDCCA 01-1/3.1B.3 Illinois
Clean Coal Institute Contract, Carterville, Illinois.
Chou, M.-I. M., S.-F. J. Chou, V. Patel, H.S. Lewis, J.P. Kimlinger, M.M. Bryant, and F.
Botha, 2005a, Commercialization of Fired Paving Bricks with Class F Fly Ash from
Illinois Basin Coals, Paper in post-printings and poster presentation to the World of
Coal Ash Conference, April 11-15, 2005, Lexington, Kentucky.
Chou, M.-I. M., S.-F. J. Chou, V. Patel, and J.W. Stucki, 2005b, Commercial Production
of Fired Bricks with Illinois Basin Class F Fly Ash, Proceedings and paper presented
at the International Congress on Fly Ash Utilization Conference held December 4-7,
2005, in New Delhi, India.
Lewis, H., 2003 and 2006, Personal communications between the Cinergy Corp. ash
manager and the PI of this investigation.
U.S. Census Bureau, 2004. Current Industrial Reports, Clay Construction Products,
Summary, 2004. Economics and Statistics Administration, U.S. Department of
Commerce.
U.S. DOE, 2001. Energy Information Administration, U.S. Dept. of Energy, U.S. Coal
Supply and Demand: 2001Review, www.eia.doe.gov/cneaf/coal/page/special/
feature.html
U. S. EPA, 1980, U.S. Environmental Protection Agency. Fed. Regist. 1980, No. 45, 98
(33063-33285), and Multiple extraction procedure for solid waste-Method 1320

29
PUBLICATIONS RESULTING FROM THIS PROGRAM
Chou, M.-I.M., Chou, S.-F.J., Pickering, M.D. and Stucki, J.W., 2006, An
environmental Feasibility Assessment of Fired Bricks Containing Fly Ash, Paper
completed for Preprints and oral presentation at Division of Fuel Chemistry, 232nd
ACS National Meeting San Francisco, CA, Sept. 10-14, 2006
Chou, M.-I.M., Chou, S.-F.J., Patel, V., and Stucki, J.W., 2005, Commercial Production
of Fired Bricks with Illinois Basin Class F Fly Ash, Proceedings and oral presentation
at the International Congress on Fly Ash Utilization Conference held December 4-7,
2005, in New Delhi, India.
Chou, M.-I.M., Chou, S.-F.J., Patel, V., Lewis, Kimlinger, J.P., Bryant, M.M., and Botha,
F., 2005, Commercialization of Fired Paving Bricks with Class F Fly Ash from
Illinois Basin coals, Post-printings and poster at the World of Coal Ash Conference,
April 11-15, 2005, Lexington, Kentucky.