co 2 measurements on the pirata network nathalie lefèvre, ird locean antoine guillot, dt insu brest...
TRANSCRIPT
CO2 MEASUREMENTS ON THE PIRATA
NETWORK
Nathalie Lefèvre, IRD LOCEAN
Antoine Guillot, DT INSU Brest
Laurence Beaumont, Théo Danguy, DT INSU
CARBOOCEAN, annual meeting, Gran Canaria, 4-8 December 2006
Scientific objectives
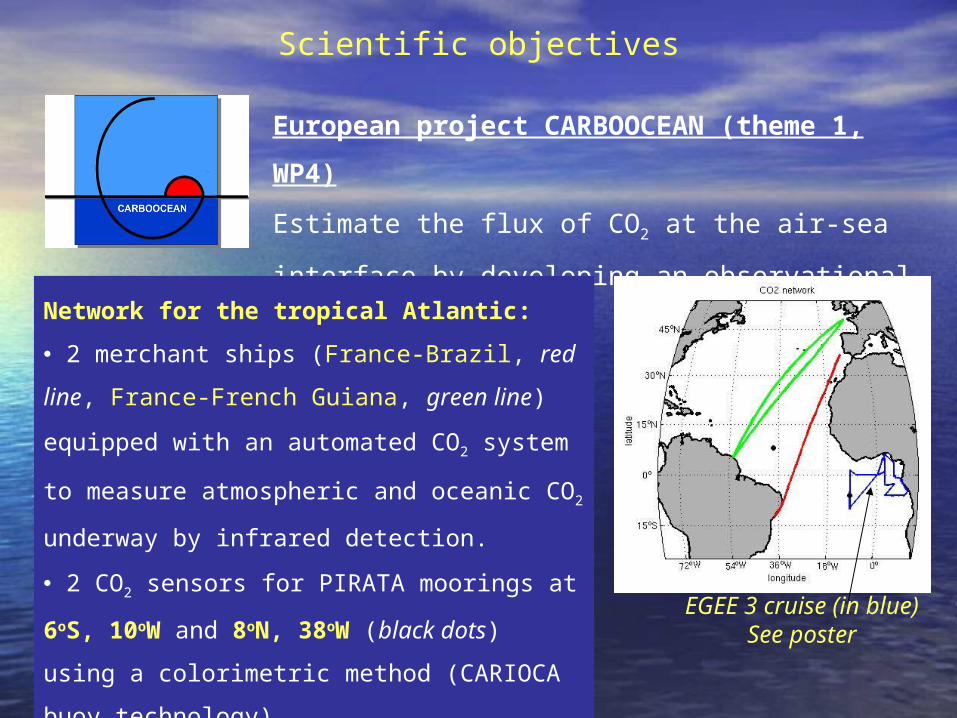
European project CARBOOCEAN (theme 1, WP4)
Estimate the flux of CO2 at the air-sea interface by
developing an observational network for CO2
Network for the tropical Atlantic:
2 merchant ships (France-Brazil, red line, France-
French Guiana, green line) equipped with an
automated CO2 system to measure atmospheric
and oceanic CO2 underway by infrared detection.
2 CO2 sensors for PIRATA moorings at 6oS,
10oW and 8oN, 38oW (black dots) using a
colorimetric method (CARIOCA buoy technology).EGEE 3 cruise (in blue)
See poster

Choice of the PIRATA moorings for installing CO2 sensors
SeaWiFs, Septembre 2003Impact of the Amazon outflow on the
CO2 distribution during the retroflection
of the North Brazil Current (NBC)
Advection far East in the North
Equatorial Counter-Current (NECC)
CO2 sensors on PIRATA moorings:
6oS, 10oW: CO2 time-series in the SEC
8oN, 38oW: CO2 time-series in the NECC
10W40W
10S

Installation of the first CO2 sensor on the PIRATA
mooring at 6oS, 10oW during the EGEE 3 cruise (June 2006)
Box with electronics
Argos antenna
CO2 sensor and oxygen optode
CO2 sensors built at DT INSU (Antoine Guillot, Théo Danguy, Laurence Beaumont)

Comparison IR-CARIOCA
27
27.05
27.1
27.15
27.2
27.25
27.3
27.35
27.4
27.45
27.5
158.2 158.3 158.4 158.5 158.6
Day
SS
T
376
377
378
379
380
381
382
383
384
385
386
fCO
2 (m
atm
)
SSTSST IRfCO2fCO2 IR

Data of the CO2 sensor since the 7th of June 2006
SST decrease due to the upwelling (June-September) CO2 increase
Hourly
measurements
of CO2, SST
and O2 sent by
ARGOS
fCO2 = -19.54 * SST + 895.84 r2 = -0.88

Correlation between fCO2 and SST and SSS
Detrended and normalized hourly fCO2, sea surface temperature and sea surface
salinity (interpolated from PIRATA daily records) as a function of time (in days).
Data from 8 June to 7 October 2006.
Colder and fresher seawater associated with higher CO2 concentrations

Oxygen measurements using the Aanderaa optode
Optode3835
Pipe connection(20 cm)
Too large amplitude for O2 diurnal cycle (~20 mmol/ kg) after 3 months

Diurnal cycle consistent with biological activity
Dissolved inorganic carbon (DIC)
calculated using TA=f(S) and fCO2
Decrease of DIC during the day
(photosynthesis)
Increase of DIC during the night
(convection & respiration)
14-21 Sep. 2006

DIC and fCO2 variability after the upwelling
season
Example for 17-23 November 2006
2063
2063.5
2064
2064.5
2065
2065.5
2066
2066.5
2067
2067.5
2068
321 322 323 324 325 326 327 328
Time (days)
DIC
24.5
24.6
24.7
24.8
24.9
25
25.1
SS
T
DICSST
424
426
428
430
432
434
436
438
440
442
321 322 323 324 325 326 327 328
Time (days)fC
O2
24.5
24.6
24.7
24.8
24.9
25
25.1
fCO2SST
Diurnal cycle detected on both DIC and fCO2

Conclusions
Very encouraging results: CO2 data since June
Source of CO2 from 1.19 (June) to 6.82 m.mol.m-2.d-1 (September)
fCO2
SST

Plan for 2007
CO2 sensor to be installed at 8oN, 38oW during the PIRATA
Brazil cruise in 2007
Replace the sensor (lifetime of 1 year) during EGEE 5 (June
2007) to continue the time-series (the existing one is sent for
calibration, and for renewal of the dye at the DT INSU while a
spare one is installed).

