cnh market guide - qtxasset.com
TRANSCRIPT
rbs.com/mib
CNH Market Guide
Vol. 2

How did the offshore renminbi (CNH) market come to wield such influence on the onshore foreign exchange (FX) market?
Since May 2012, USD/CNY trading onshore has consistently pulled away from the People’s Bank of China (PBOC) daily fixing rate towards
the direction of the offshore deliverable USD/CNH.
How did the CNH bond market turn from a seller’s market to a buyer’s market recently? As investors’ expectations switch from FX to bond
gains, issuers have aligned coupons to onshore yields. Higher yields in turn have boosted investors’ appetite for longer tenors. The market
now offers bonds up to 20-year maturity.
A confluence of factors – FX and monetary policy reforms, market deregulation, private sector initiatives, and
global politico-economic events – brought about a spectacular transformation of the CNH market in its first five years.
How will the next five years look?The next phase will be a steeper climb as China attempts to globalise
its offshore CNH franchise before it can reach the final goal of becoming a world reserve currency.
This guide is a sequel to the CNH Market Guide – A precursor to internationalisation of the Chinese renminbi, which was first published
in March 2011. It addresses the various facets of a market that still stands the chance of becoming the world’s next reserve currency,
with a focus on the FX, interest rate and bond markets.
This guide provides a review of the developments in the first five years of the CNY internationalisation. It contains details of regulations,
products types, market depth and market participants. It also contains analysis of how reforms have influenced market
trends that have led to the convergence between the onshore and offshore FX, interest rate and bond markets.

Content
The Roadmap 2
The first five years 3
Market size 3
Market liquidity 6
Market depth 7
PBOC’s CNY swap lines 8
Onshore market access 10
Offshore-onshore market convergence 13
The next five years 14
Becoming fully convertible 14
Internationalising the CNY 15
FX Market 17
Evolution of the market 17
Spot 19
Forwards 20
Cross currency swaps 21
Options and futures 21
Interest Rate Market 22
Evolution of the market 22
Money market 24
Interest rate swaps 24
Sovereign benchmark curve 25
Repo market 25
Bond Market 26
Evolution of the market 26
Issuer Base 29
Types of issuers 29
Motivations and objectives 33
Issuance outlook 35
Investor base 36
Types of investors 36
Investor outlook 38
Documentation requirements 39
Listing practice 40
Reg S is the current norm 40
More rated issuers coming to the market 41
Governing law 41
Repatriation rules 42
MOFCOM vs SAFE routes 42
Other RMB schemes 44
Market Trends 44
Globalising the Franchise 46
Building on Asia’s strengths 46
Global vs regional hubs 49
Singapore as second CNY clearing centre 49
Hong Kong-London partnership 50
Self-service centres in Taipei, Tokyo, Sydney 50
Shanghai as the ultimate global CNY pricing centre 50
Multilateral platforms 51
Appendix A 52
Chronology of Regulatory Changes and Events 51
Appendix B 54
Cross-border Payments on Current Account 54
Appendix C 56
List of Abbreviations 56
Appendix D 57
List of Government Agencies 57

The RoadmapFive years after embarking on internationalising the Chinese Yuan (CNY), it is clear that the Chinese government now has a full roadmap for realising it plans. Deliverable CNY is now commonly referred to as CNH.
The first CNH bond was issued in Hong Kong, receiving mixed responses from market participants. Some saw this as an experiment by the Chinese government to gauge market acceptance of the CNY. A common area of concern was the huge price premium of the so-called “dim sum” bonds on onshore bonds. At that time, yields were benchmarked against the USD/CNY non-deliverable forward (NDF) market.
The NDF curve reflected market expectations for the CNY, which was very strong then. The curve translated into CNY interest rate levels that were well below both the USD and onshore CNY interest rates. Proving sceptics wrong, the Chinese government has opened up the market at a rapid pace in a sequence resembling a roadmap (see Figure 1):
• 2007-2008:MadeCNYdeliverable Launched CNH bonds; signed swap lines with selected central banks
• 2007-2010:ExpandedCNHliquiditypool Launched trade settlement scheme; liberalised bond issuance rules; launched
CNH interbank market
• 2011:Loopedbacktoonshore Launched CNH equities; CNY inward investment flows allowed
• 2012:Goglobal Partnering Hong Kong and London; setting up second CNY clearing centre in
Singapore; setting up dedicated lines for other key markets
Figure1:RoadmaptointernationalisationoftheRMB
Source: RBS
2003-2006Laying the ground in HK
2007-2008MakingCNYpartially deliverable
2007-2010Expanding offshore CNYliquiditypool
2011Forming a circular loop back onshore
2012Going global
• BringingCNYtoHKresidents
• FloatingtheCNY
• IntroducingCNY– denominated investment assets (bonds issued by policy banks)
• SigningCNYswap lines with strategically-targeted central banks
• LaunchingCNYtrade settlement scheme
• LiberalisingCNHbond issuance rules
•Makingitwholesale– setting up CNH interbank market
• IntroducingCNY–denominated equity IPO
• Allowing outward FDI
• Launching Renminbi QFII
• Allowing inward FDI
• PromotingLondonas global offshore RMB centre
• PromotingCNYasreserve currency to cash-rich central banks
• SettingsecondCNYclearing centre in Singapore
2
Growing liquidity pool, deepening the markets, expanding the geographical reach
The first five years
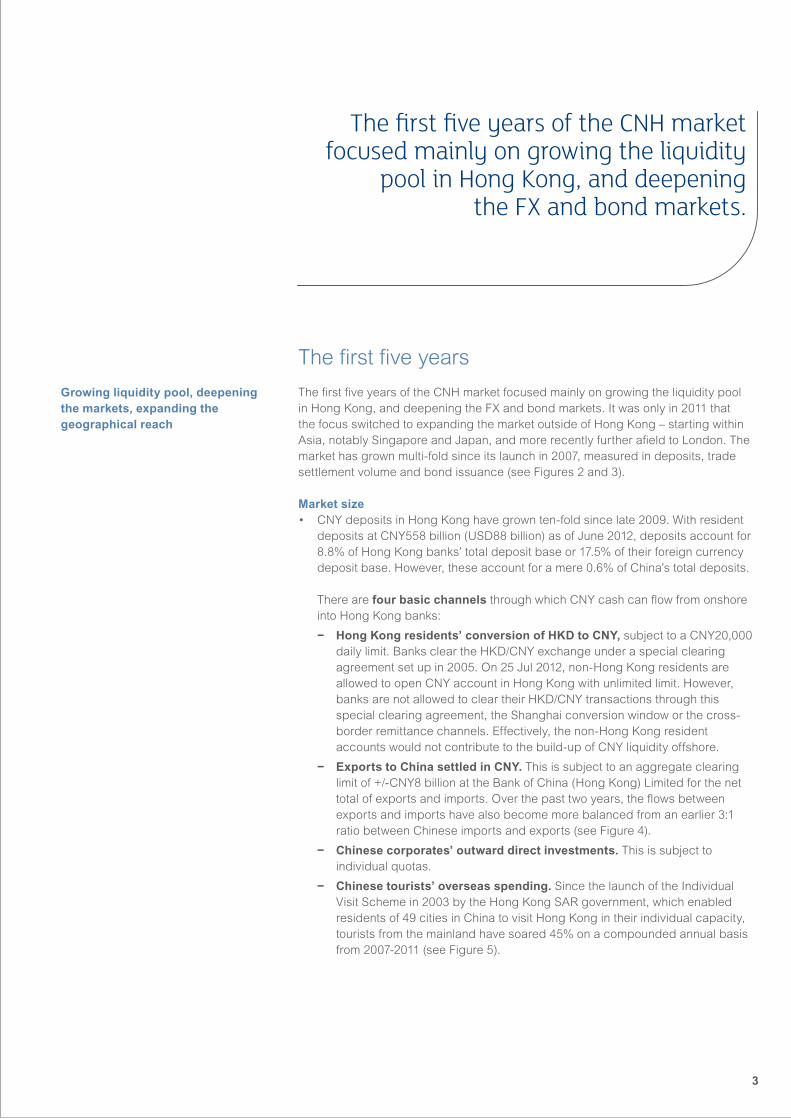
The first five years of the CNH market focused mainly on growing the liquidity pool in Hong Kong, and deepening the FX and bond markets. It was only in 2011 that the focus switched to expanding the market outside of Hong Kong – starting within Asia, notably Singapore and Japan, and more recently further afield to London. The market has grown multi-fold since its launch in 2007, measured in deposits, trade settlement volume and bond issuance (see Figures 2 and 3).
Market size• CNYdepositsinHongKonghavegrownten-foldsincelate2009.Withresident
deposits at CNY558 billion (USD88 billion) as of June 2012, deposits account for 8.8% of Hong Kong banks’ total deposit base or 17.5% of their foreign currency deposit base. However, these account for a mere 0.6% of China’s total deposits.
There are four basic channels through which CNY cash can flow from onshore into Hong Kong banks:
− HongKongresidents’conversionofHKDtoCNY, subject to a CNY20,000 daily limit. Banks clear the HKD/CNY exchange under a special clearing agreement set up in 2005. On 25 Jul 2012, non-Hong Kong residents are allowed to open CNY account in Hong Kong with unlimited limit. However, banks are not allowed to clear their HKD/CNY transactions through this special clearing agreement, the Shanghai conversion window or the cross-border remittance channels. Effectively, the non-Hong Kong resident accounts would not contribute to the build-up of CNY liquidity offshore.
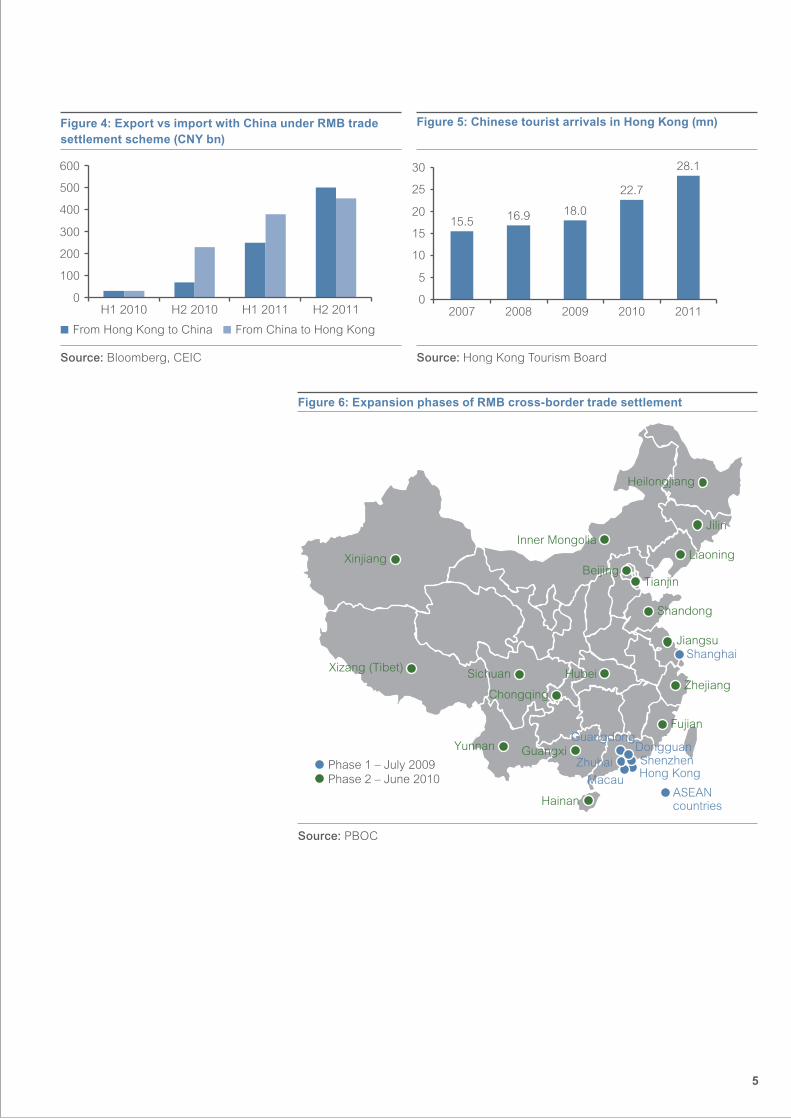
− ExportstoChinasettledinCNY. This is subject to an aggregate clearing limit of +/-CNY8 billion at the Bank of China (Hong Kong) Limited for the net total of exports and imports. Over the past two years, the flows between exports and imports have also become more balanced from an earlier 3:1 ratio between Chinese imports and exports (see Figure 4).
− Chinesecorporates’outwarddirectinvestments. This is subject to individual quotas.
− Chinesetourists’overseasspending. Since the launch of the Individual Visit Scheme in 2003 by the Hong Kong SAR government, which enabled residents of 49 cities in China to visit Hong Kong in their individual capacity, tourists from the mainland have soared 45% on a compounded annual basis from 2007-2011 (see Figure 5).
The first five years of the CNH market focused mainly on growing the liquidity
pool in Hong Kong, and deepening the FX and bond markets.
3
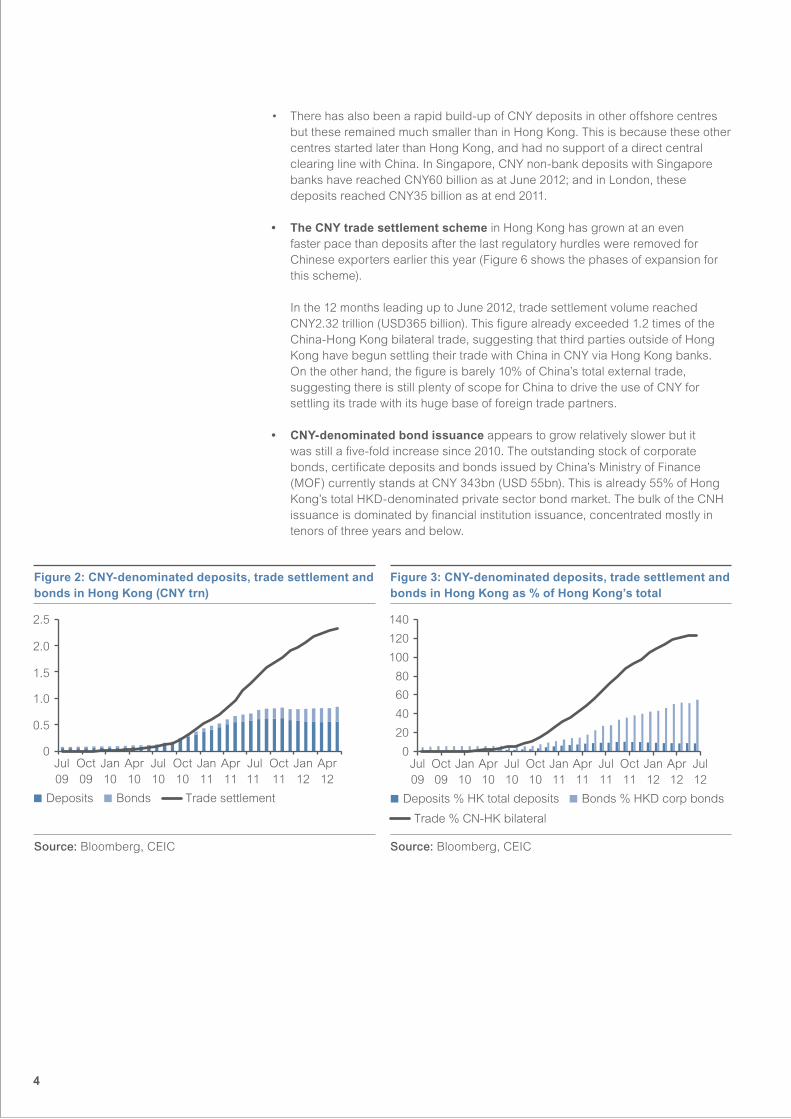
Figure2:CNY-denominateddeposits,tradesettlementandbondsinHongKong(CNYtrn)
Figure3:CNY-denominateddeposits,tradesettlementandbonds in Hong Kong as % of Hong Kong’s total
Source: Bloomberg, CEIC Source: Bloomberg, CEIC
• Therehasalsobeenarapidbuild-upofCNYdepositsinotheroffshorecentresbut these remained much smaller than in Hong Kong. This is because these other centres started later than Hong Kong, and had no support of a direct central clearing line with China. In Singapore, CNY non-bank deposits with Singapore banks have reached CNY60 billion as at June 2012; and in London, these deposits reached CNY35 billion as at end 2011.
• TheCNYtradesettlementscheme in Hong Kong has grown at an even faster pace than deposits after the last regulatory hurdles were removed for Chinese exporters earlier this year (Figure 6 shows the phases of expansion for this scheme).
In the 12 months leading up to June 2012, trade settlement volume reached CNY2.32 trillion (USD365 billion). This figure already exceeded 1.2 times of the China-Hong Kong bilateral trade, suggesting that third parties outside of Hong Kong have begun settling their trade with China in CNY via Hong Kong banks.
On the other hand, the figure is barely 10% of China’s total external trade, suggesting there is still plenty of scope for China to drive the use of CNY for settling its trade with its huge base of foreign trade partners.
• CNY-denominatedbondissuance appears to grow relatively slower but it was still a five-fold increase since 2010. The outstanding stock of corporate bonds, certificate deposits and bonds issued by China’s Ministry of Finance (MOF) currently stands at CNY 343bn (USD 55bn). This is already 55% of Hong Kong’s total HKD-denominated private sector bond market. The bulk of the CNH issuance is dominated by financial institution issuance, concentrated mostly in tenors of three years and below.
Jul09
Oct09
Jan10
Apr10
Jul10
Oct10
Jan11
Jan12
Apr11
Jul11
Oct11
0
0.5
1.0
1.5
2.0
2.5
Apr12
Bonds Trade settlementDeposits
Jul09
Oct09
Jan10
Apr10
Jul10
Oct10
Jan11
Jan12
Apr11
Jul11
Jul12
Oct11
Apr12
Bonds % HKD corp bondsDeposits % HK total deposits
Trade % CN-HK bilateral
0
20
40
60
80
100
120
140
4
Phase 1 – July 2009 Phase 2 – June 2010
Guangdong
Hong Kong
Shanghai
ShenzhenZhuhaiDongguan
BeijingTianjin
Inner MongoliaLiaoning
Jiangsu
Zhejiang
Fujian
Shandong
Hubei
Guangxi
Hainan
Chongqing
Sichuan
Yunnan
Jilin
Heilongjiang
Xizang (Tibet)
Xinjiang
MacauASEAN countries
Source: PBOC
Figure4:ExportvsimportwithChinaunderRMBtradesettlementscheme(CNYbn)
Figure5:ChinesetouristarrivalsinHongKong(mn)
Source: Bloomberg, CEIC Source: Hong Kong Tourism Board
Figure6:ExpansionphasesofRMBcross-bordertradesettlement
0
100
200
300
400
500
600
H1 2010 H1 2011 H2 2011H2 2010
From Hong Kong to China From China to Hong Kong
15.5 16.9 18.0
22.7
28.1
0
5
10
15
20
25
30
2007 2008 2009 2010 2011
5

Liquidity strained by opening of investment avenues back into China
Market liquidityTo a large extent, the liquidity situation of the CNH market is demand-driven. The demand for CNY liquidity is in turn driven by the relative strength of the CNY against USD and other foreign currencies. The measure of the offshore CNY liquidity pool should be the same as the measure of monetary aggregates. The broad liquidity pool should thus comprise of both non-bank deposits and bonds. As such, the drop in deposits in Hong Kong banks from December 2011 to May 2012 did not reflect a shrinking CNH liquidity pool in Hong Kong as bond issuance continued to rise (see Figures 2 and 3 again). Still, the pace of liquidity growth has slowed since fourth quarter 2011. There are three factors behind this:
1. An increase in CNY trade settlement volume for importing Chinese goods since the lifting of restrictions on Chinese exporters to settle in CNY
2. An increase in Hong Kong settlement banks’ investments into the onshore bond market as more of them get special quotas from PBOC to do so
3. An outflow of non-Hong Kong resident CNY deposits to other offshore centres begin to compete for these deposits
In response to the third point above, the Hong Kong Monetary Authority (HKMA) has liberalised previously punitive rules on Hong Kong banks’ risk limits for CNH from the beginning of 2012. More recently, the HKMA also allowed non-residents to set up CNY deposit accounts in Hong Kong with no daily conversion limits. See Figure 7 for a list of rule changes by the HKMA since the start of 2012.
Figure7:HKMAregulatorychangestoimproveRMBliquidity
Allow non-residents to convert unlimited daily amount of RMB
• AIs*canofferRMBservicestonon-HongKongresidentpersonalcustomers,andcurrencyconversionisnotsubjecttocorresponding limits for Hong Kong residents (25 Jul 2012)
Replace RMB limit with RMB liquidity ratio to include more RMB liquid assets
• AIsarerequiredtomaintainaRMBliquidityatnolessthan25%computedonthesamebasisasstatutoryliquidityratio.• ThisupdateincreasesflexibilityfortheinclusionofmoreRMBliquidassets,andaccuracyofmatchingRMBliquidassets
and short-term liabilities (14 June 2012)
Introduce a facility to provide RMB liquidity to AIs participating in HK RMB business
• ThefacilityusesthecurrencyswaparrangementbetweentheHKMAandthePeople’sBankofChina.• Thisfacilityincreasesshort-termRMBliquidity,reducespotentialmarketdisruptionsandincreasesmarketconfidence(14
June 2012)• ToenableAIstobetterassesstheirRMBneeds,theHKMAmovedbackthetimebywhichAIsmaysubmittheirrequests
for funds from 10am to 1.30pm (25 Jul 2012)
Replace RMB Net Open Position (NOP) standard with AIs’ self-determined mechanism
• The20%standardRMBNOPisreplacedbyamechanismwherebyAIsareallowedtosetuptheirowninternalRMBNOPinconsultation with the HKMA. AIs should consider the nature and scale of their RMB business.
• ThismeasurecouldfurtherincreaseRMBliquidityandrecogniseAIs’effectiveRMBexchangeandliquiditymanagementpractices (22 May 2012)
Require AIs to ascertain the genuineness of underlying cross-border merchandise trade transactions
• Thisincludesknow-your-customer(KYC)processes,duediligenceprocedures.andreviewingsupportingdocumentsfromclients ( 2 April 2012)
*AuthorisedInstitutionsorbanksinHongKong.Source: HKMA, Bloomberg
6

Market depthThe launch of the interbank market in October 2010 provided a huge boost to trading volumes of FX spot and forward market. The introduction of the FX option market which followed then gradually led to the innovation of structured products. Figure 8 shows the types of FX and rates products, the maturity range and turnover volume for each product type.
USD/CNH spot and forward daily turnover is now USD5-6 billion, broadly on par with the USD/CNY NDF market which started to see some slight slowdown in trading volume since 2011.
The USD/CNY cross currency swap curve is available up to a 10-year tenor but it is only liquid up to a three-year tenor at the moment. USD/CNH options are also available up to a two-year tenor.
In the bond market, the maturity has stretched to a 20-year tenor by a Chinese policy bank in July 2012. In early 2012, a 15-year tenor was tapped by two Chinese policy banks and China’s MOF with their respective inaugural 15-year issues. The most traded part of the curve remains in three-year tenor and below.
CNH FX trading volume now on par with NDF market
Figure8:RangeofCNHfinancialproducts
Product Tenors Turnover Remarks
Spot T+2 value spot USD1-2bn
Forward O/N - 12m, 18m, 24m
USD2-3bn
CCS 6m – 5y USD300mn
FX Options 1m – 2y USD70-120mn Illiquid relative to other FX productsBetter liquidity in shorter tenors
FX Futures 1m – 1y n.a. To begin trading from 17 September
Money Market O/N to 1y CNY2-4 bn
Repo n.a. n.a. Tripartite platform operated by Euroclear, J.P. Morgan and HKMA
CDs/Notes 3m to 3y n.a
Equities n.a. n.a. First and only IPO in April 2011
Structured Products
Up to 3y n.a.
Bonds Up to 15y for sovereign; up to 20y for FIs/corporates
CNY50mn
Mutual Funds n.a. n.a.
Source: RBS
7

The biggest use of the swap lines so far is from foreign central banks diversifyingreservesintoCNY
PBOC’sCNYswaplinesSince signing the first CNY swap line in December 2008, the PBOC has signed a total of 20 such lines with foreign central banks. Four of these lines have been renewed before expiry in 2012 while another three have expired. All the lines cover a three-year period. The four renewed lines had the quotas increased by at least double from the original amounts for a three-year extension.
These swap lines serve multiple purposes which evolved with the expansion of the CNH market.
• Standbycreditfacility:WhenthefirstlinewasofferedtotheBankofKorea(BOK), the purpose was to provide a standby credit facility for the BOK with no conditions attached, unlike the facilities offered by the IMF, multilateral agencies or the Fed during the height of the Lehman crisis.
• CNYtradesettlementscheme: The lines that came after the CNY trade settlement scheme was expanded in 2009 were aimed at promoting the use of CNY in bilateral trade and investments between China and these countries.
• CNYasreservecurrency: A year later in August 2010, the PBOC started allowing recipient central banks to partially activate these swap lines for them to obtain CNY to invest in China’s domestic bond market. This move was designed to promote the holding of CNY in the foreign reserves of other central banks. Since then, several central banks have partially converted their CNY swap lines into investment quotas from the PBOC. Otherwise, these swap lines have never been activated to support any credit event.
The total sum of the current 16 CNY swap lines comes to CNY1.67 trillion (USD265 billion). Figure 9 shows the list of recipient central banks and the size of their respective lines and each country’s market share of China’s total trade.
• Relativetoexternaltrade: The total bilateral trade of the 16 recipient countries with China account for 37% of China’s total external trade. The swap quota given to each central bank is not proportionate to the country’s relative market share of China’s trade. This proved the point that these lines are designed to more than just promote the CNY trade settlement scheme.
The introduction of the FX option market which followed then gradually led to the
innovation of structured products.
8
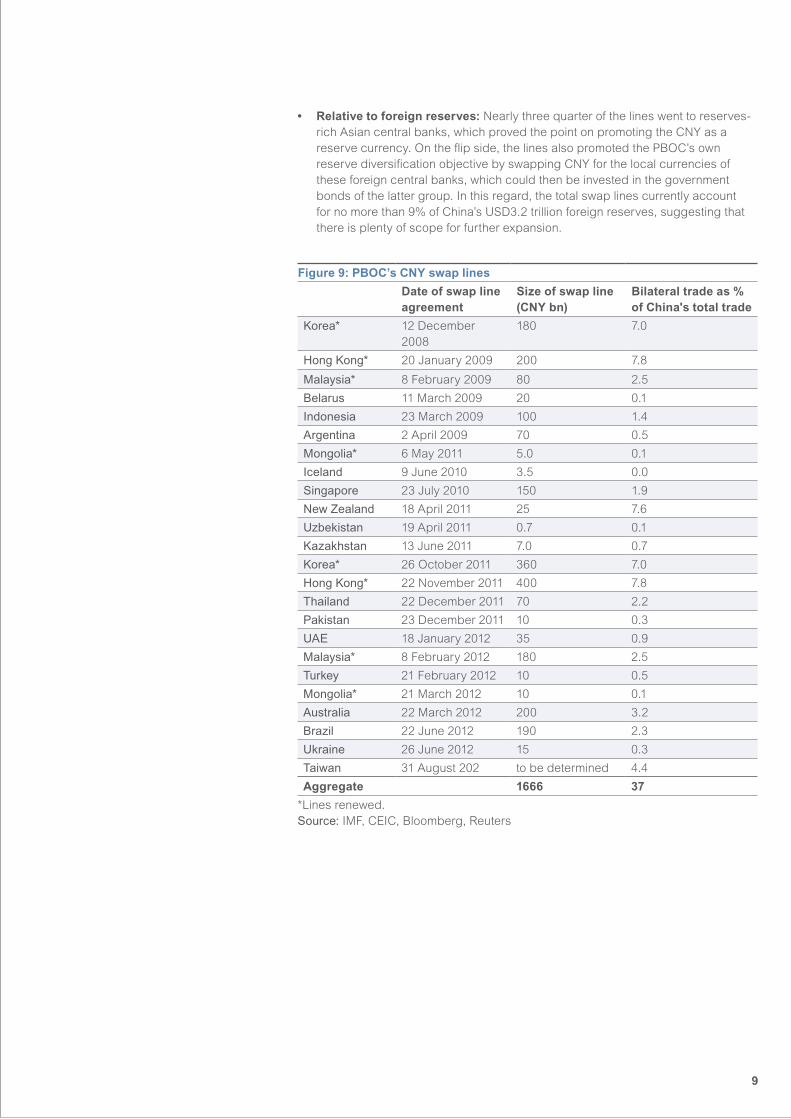
Figure9:PBOC’sCNYswaplines
Date of swap line agreement
Size of swap line (CNYbn)
Bilateral trade as % of China's total trade
Korea* 12 December 2008
180 7.0
Hong Kong* 20 January 2009 200 7.8
Malaysia* 8 February 2009 80 2.5
Belarus 11 March 2009 20 0.1
Indonesia 23 March 2009 100 1.4
Argentina 2 April 2009 70 0.5
Mongolia* 6 May 2011 5.0 0.1
Iceland 9 June 2010 3.5 0.0
Singapore 23 July 2010 150 1.9
New Zealand 18 April 2011 25 7.6
Uzbekistan 19 April 2011 0.7 0.1
Kazakhstan 13 June 2011 7.0 0.7
Korea* 26 October 2011 360 7.0
Hong Kong* 22 November 2011 400 7.8
Thailand 22 December 2011 70 2.2
Pakistan 23 December 2011 10 0.3
UAE 18 January 2012 35 0.9
Malaysia* 8 February 2012 180 2.5
Turkey 21 February 2012 10 0.5
Mongolia* 21 March 2012 10 0.1
Australia 22 March 2012 200 3.2
Brazil 22 June 2012 190 2.3
Ukraine 26 June 2012 15 0.3
Taiwan 31 August 202 to be determined 4.4
Aggregate 1666 37
*Linesrenewed.Source: IMF, CEIC, Bloomberg, Reuters
• Relativetoforeignreserves: Nearly three quarter of the lines went to reserves-rich Asian central banks, which proved the point on promoting the CNY as a reserve currency. On the flip side, the lines also promoted the PBOC’s own reserve diversification objective by swapping CNY for the local currencies of these foreign central banks, which could then be invested in the government bonds of the latter group. In this regard, the total swap lines currently account for no more than 9% of China’s USD3.2 trillion foreign reserves, suggesting that there is plenty of scope for further expansion.
9

Onshore market accessUltimately, the CNH market should be seen as a conduit into the onshore market. Otherwise, the market would never take off, proving the sceptics right – that the experiment at making the CNY partially deliverable/ convertible would end nowhere. And the sceptics were proven wrong so far.
The rapid deregulation of cross-border trade and investments has now made the CNY fully convertible on current accounts. The bulk of the capital account is partially convertible, guarded by quotas and/or application procedures. Figure 10 distinguishes the currency denomination – USD/ foreign currency, offshore deliverable CNH or onshore CNY – in which the different current and capital account itemsareallowedtobesettled.Webrieflydescribedthembelow.
Oncurrentaccounts(moredetailscanbefoundintheAppendix):
• Merchandisegoods: All goods trades can be settled using the onshore CNY exchange rate. Chinese exporters also have the choice to exchange their foreign currency export proceeds in the offshore CNH market before repatriating funds. However, Chinese importers can only use the onshore exchange rate for making payments to offshore counterparties.
• Services,interestincomeandtransfers: Transactions settled in CNY can only be dealt using the offshore CNH exchange rate. This implies that to settle CNY-denominated payments, onshore Chinese entities must remit foreign currency offshore to exchange into CNH for the payments.
Oncapitalaccounts:
• Foreigndirectinvestments: CNY funding is allowed both ways. Inward direct investments are funded through the offshore CNH market, while outward direct investments are funded through the onshore CNY market.
• Portfolioinvestments: CNY funding is allowed only one way, by foreign investors through the Renminbi Qualified Foreign Institutional Investor (RQFII) scheme which was introduced in August 2011. This is a counterpart of the QFII scheme and mini QFII scheme which allowed foreign portfolio investments to enter China in foreign currency denomination. The difference between the regular QFII and mini QFII is that the latter is open specifically for onshore fund managers to directly tap retail investors overseas. The reverse scheme – Qualified Domestic Institutional Investors (QDII), which allows onshore institutions to invest overseas – does not have the equivalent CNY counterpart.
• Loans,tradefinanceanddeposits: Onshore corporations were permitted in June 2010 to borrow CNH from the offshore market for longer-term trade finance and project financing. They are only allowed to extend trade credit in CNY terms for periods of 90 days or less.
• Specialaccess: This pipeline is open to central banks, sovereign wealth funds and CNY trade settlement banks in Hong Kong to invest directly in the onshore interbank bond market. All the quotas are set by the PBOC on a case-by-case basis. In the central banks’ case, the quotas are activated from the CNY swap lines offered by the PBOC and hence, only the central banks which have signed such lines are eligible. As at end 2011, a total CNY255 billion of such quotas has been allocated through this pipeline, of which CNY185 billion went to the first two groups, including CNY65 billion to Japan alone.
Current account fully open/ convertible, capital account still partially convertible
10

Figure10:LevelofopennessofChina’sborders
Current Account Capital Account
Offshore Onshore Offshore Onshore
*Long-term(LT)tradecreditreferstoabove90dterm.Short-termrefersto90dtermand below. Source: RBS
Goods
Foreign Direct
Investment
Portfolio Investment
Loans, LT Trade Credit*
Short-term TradeCredit*
Foreign currency deposits
Trade settlement
banks, foreign CBs,SWFs
Services, Interest Income, Transfers
Goods
Overseas Direct
Investment
Portfolio Investment
Loans, LT Trade Credit*
Short-term TradeCredit*
Foreign currency deposits
PBOC
Services, Interest Income, Transfers
USD
(QFII, min QFII)
(QDII)
(RQFII)
(foreign debt quota)
(foreign debt quota)
(foreign debt quota)
(CNY swap line & special quotas)
CNH
CNY
11
Recent deregulation on investments favoured domestic bonds
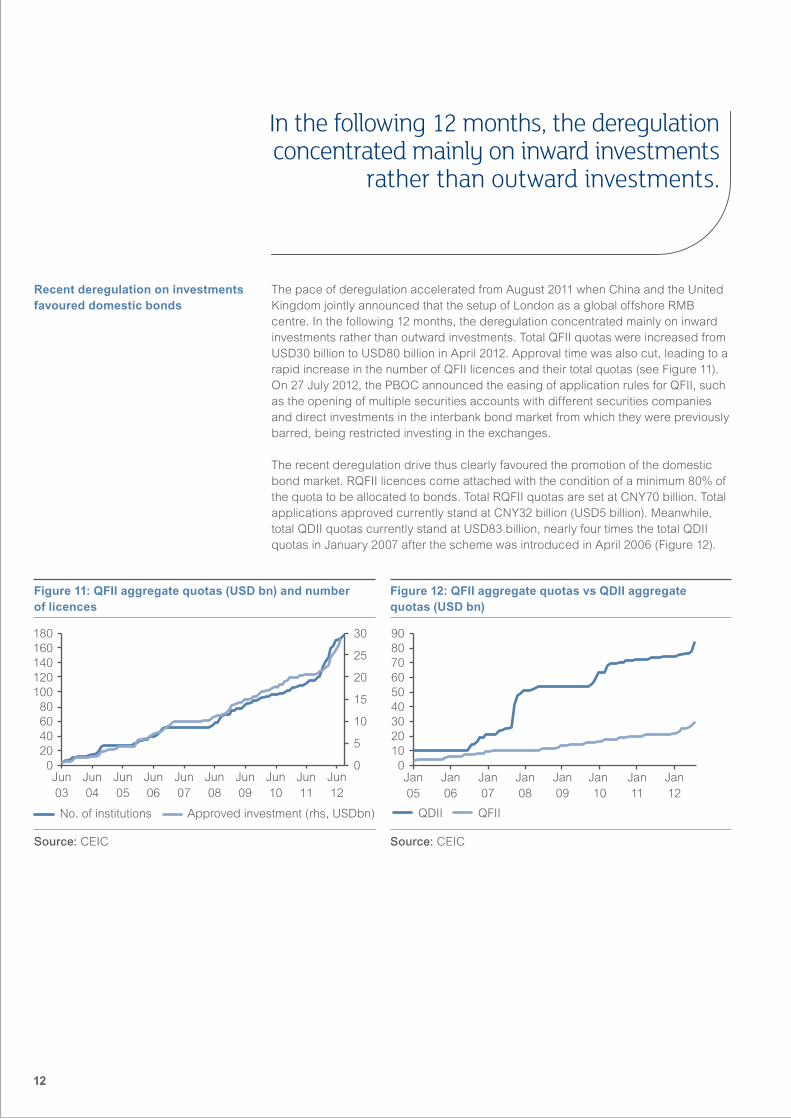
The pace of deregulation accelerated from August 2011 when China and the United Kingdom jointly announced that the setup of London as a global offshore RMB centre. In the following 12 months, the deregulation concentrated mainly on inward investments rather than outward investments. Total QFII quotas were increased from USD30 billion to USD80 billion in April 2012. Approval time was also cut, leading to a rapid increase in the number of QFII licences and their total quotas (see Figure 11). On 27 July 2012, the PBOC announced the easing of application rules for QFII, such as the opening of multiple securities accounts with different securities companies and direct investments in the interbank bond market from which they were previously barred, being restricted investing in the exchanges.
The recent deregulation drive thus clearly favoured the promotion of the domestic bond market. RQFII licences come attached with the condition of a minimum 80% of the quota to be allocated to bonds. Total RQFII quotas are set at CNY70 billion. Total applications approved currently stand at CNY32 billion (USD5 billion). Meanwhile, total QDII quotas currently stand at USD83 billion, nearly four times the total QDII quotas in January 2007 after the scheme was introduced in April 2006 (Figure 12).
In the following 12 months, the deregulation concentrated mainly on inward investments
rather than outward investments.
Figure11:QFIIaggregatequotas(USDbn)andnumber of licences
Figure12:QFIIaggregatequotasvsQDIIaggregate quotas(USDbn)
Source: CEIC Source: CEIC
0102030405060708090
Jan05
Jan06
Jan07
Jan08
Jan09
Jan 10
Jan11
Jan12
QDII QFII
0
5
10
15
20
25
30
020406080
100120140160180
Jun03
Jun04
Jun05
Jun06
Jun07
Jun08
Jun09
Jun10
Jun11
Jun12
No. of institutions Approved investment (rhs, USDbn)
12
Following are the key regulatory changes affecting onshore market access made since August 2011 (a full history and details of regulatory changes can be found in the Appendix):
• August2011 – The PBOC launched Renminbi QFII and pilot scheme for foreign banks to tap CNH to recapitalise mainland operations. Onshore non-FIs/ corporates were allowed to issue CNH bonds subject to quotas.
• December2011 – The Chinese government launched the RMB Qualified Foreign Institutional Investors (RQFII) scheme on a trial basis for foreign investors to enter the onshore market. An initial target of CNY20 billion was set for the quotas to be awarded under the scheme. A minimum 80% floor was set for the funds to be invested in bonds.
• January2011 – Ten investment firms in Hong Kong were granted RQFII licences to invest in China’s securities market with a total CNY10.7 billion of quotas. The firms planned to develop RMB wealth management products onshore.
• April2012 – China announced the expansion of USD50 billion investment quota to both the Qualified Foreign Institutional Investors (QFII) and the Renminbi QFII (RQFII) pilot programmes. This brought the total quota to USD80 billion from USD30 billion for the QFII, and to CNY70 billion from CNY20 billion for RQFII. It will also allow the pilot institutions to use the quota in issuing RMB A-share ETF product, to invest in the A-share index shares and list them in the Hong Kong Exchange (HKEx).
• July2012 – China and Singapore jointly announced that a second offshore CNY clearing centre will be set up in Singapore, to be operated by the full branch of a Chinese bank in Singapore. This agreement is part of a China-Singapore Free Trade Agreement (FTA) signed on 6 July 2012.
• July2012 – China released new rules for foreign investors, lowering minimum qualification requirement and simplifying the approval process for applicants under the Qualified Foreign Institutional Investor (QFII) programme. The changes allowed QFIIs to invest in China’s interbank bond market. The new rules also allowed foreign private equity investment entities to apply for QFII licenses
Offshore-onshore market convergence The wave of rapid regulatory changes from late 2011 paved the way for the convergence between the offshore and onshore markets. In the initial one to two years of its existence until late 2011, the USD/CNH FX market was directionally driven by USD/CNY NDF to the extent that some market participants started mulling over the idea of introducing a NDF version of the CNH market.
Since late 2011, the pull of forces has reversed. The NDF market is now driven by the CNH market such that it behaves like a semi-deliverable market with the forward curve tilting upwards to reflect the positive interest rate premium of CNY interest rates over USD rates. Since April 2012, just prior to the PBOC expanding the intra-day trading band, the onshore USD/CNY market has also started to follow the offshore USD/CNH market, deviating from the direction set by the PBOC every morning through its fixing (Figure 13).
WiththeconvergenceintheFXmarkets,thebondmarketsonshoreandoffshorealsobegan to converge. The yield discount of the offshore issues to the onshore issues is now found mainly in the shorter-dated bonds of three-year tenor and below and has compressed to no more than 50 basis points (see Figure 14). The pressure for the yield convergence is also coming from the subtle shift in FX policy direction by the PBOC – from a strong and stable CNY to a weaker and more volatile CNY. Investors’ expectations on returns from the CNH bond market have thus shifted from FX gains to yield and/or bond gains.
Key deregulations on investments in the past year
Offshore CNH FX has become leader for NDF and even onshore CNYFXmarket
13

Figure13:OffshoreUSD/CNHspotvsonshore USD/CNYspot
Figure14:OffshoreChinaMOF3ybondvsonshore MOF 3y bond (%)
Source: Bloomberg Source: Bloomberg
The next five years
Becoming fully convertible Taking a very long perspective, the CNY is just two steps short of becoming fully convertible and three steps away from becoming an international currency. The steps are:
1. Allow all capital account items to be settled freely in CNY both ways – inwards and outward of China
2. Lift all quotas and streamline application and approval processes
3. Increase the use of CNY for international trade and investments
This is a simplification as the last giant step involves multiple facets. The qualifications of an international currency are much broader than this one-line description (see next section). Logically, one would expect China to make the CNY fully convertible before embarking on the ultimate goal of internationalising the CNY. But China has put the proverbial horse before the cart by creating an offshore CNY market to promote the use of the CNY in international trade and investments before the currency is fully convertible.
China’s actions seem to suggest some degree of time consideration to achieve the goal of internationalising the CNY. The government appears to have its sight for the CNY to be included in the IMF’s Special Drawing Rights (SDR) basket by the end of 2015 when the IMF reviews its basket. The current global climate favours the CNY as both the USD and EUR are under pressure and global investors are looking for an alternative reserve currency. In working towards this goal, the Shanghai municipal government released a blueprint in March 2012, setting a goal of making Shanghai the global pricing centre for both onshore and offshore CNY financial products by 2015, and a global financial centre by 2020.
Partial convertibility at best leads to partial internationalisation
Inclusion in IMF SDR basket will be a strong endorsement
Jun11
Sep11
Nov11
Jan12
Mar12
May12
Jul12
0
1
2
3
4
5
050100150200250300350400
Spread (rhs,bp) CNY 3y bmkCNH 3y bmk
Aug10
Oct10
Jun11
Aug11
Oct11
Dec11
Feb12
Apr12
Jun12
Aug12
Dec10
Feb11
Apr11
Offsh-onsh (% onsh fix, rhs)
Offshore spotOnshore spot
6.2
6.3
6.4
6.5
6.6
6.7
6.8
6.9
-2.5-2.0-1.5-1.0-0.500.51.01.52.02.53.0
14
BIS’s seven criteria to qualify as an international currency
In the next few years, we can thus expect to see more of the following:
• Expansionofthetradesettlementscheme: Trade in goods and services is the smoothest or most consistent way to grow the global CNY liquidity pool, considering especially China’s status as one of the world’s largest trade partner.
• Settingupofmoredirectclearinglines: This will be targeted at strategic trade partners. Jointly with China, Singapore has announced that it will set up an offshore CNY clearing centre, while Taiwan and Japan are believed to be in negotiations with China for their own dedicated clearing lines.
• Jointventureswithinternationalfinancialcentres: London was announced as the global offshore CNY centre and this is in partnership with Hong Kong. Getting the second CNY clearing line will make Singapore a regional satellite centre. Getting Hong Kong to partner with London may thus be China’s assurance to Hong Kong that it retains the lead as the main offshore CNH centre above Singapore and London. In the background, Shanghai is preparing to become the global pricing centre for all CNY financial products onshore and offshore by 2015, as spelt out in its blueprint which names Hong Kong as a partner in achieving this goal. Can Shanghai achieve this goal without the CNY becoming fully convertible?
InternationalisingtheCNYThere are many shades of the definition of an international currency. A short definition is a currency that is widely held as a reserve currency. The US dollar and the euro fit this definition as they currently account for 62.2% and 24.9% of world foreign reserves (see Figure 15). By far the most concise definition of an international currency are the following seven criteria1:
1. Freelytraded: Removal of all restrictions on trading the currency
2. Internationaltradeinvoicing: Ability for both foreign and domestic firms to invoice trades in the currency
3. Readilyaccessible: Ability of domestic and foreign institutions to hold currency in amounts they deem fit
4. Usedforsecuritisationbyprivatesector: Both domestic and foreign institutions are able to issue marketable securities in the currency
5. Usedforsecuritisationbymultilateralagencies: International financial institutionssuchastheWorldBankareabletoissuedebtinstrumentsinthecountry’s market and use the currency in their financial operations
6. Reservecurrency: Currency may be included in currency baskets of other countries
7. Internationalconfidence in the issuing country
1 Peter Kenen, Princeton University, “Currency internationalisation: an overview”, BIS Papers No. 61, December 2011
15

Based on the above criteria, only the USD and the EUR are fit to be called an international currency while none of the other G7 currencies could. The key criterion which most currencies are unable to fulfil is that on international trade invoicing.
The CNY currently falls short of more than half the criteria above. The CNY currently ranks 15th as a payments currency globally with a market share of 0.45%. To be part of the top five payments currencies, the CNY market share has to reach at least 2%. EUR and USD’s market shares are 43% and 31% respectively. Hence, the ultimate goal to become an international reserve currency is still a giant step away.
The USD took about 30 years to achieve the status of an international currency – fromtheendoftheWorldWarIIinthemid-1940stotheearly1970s.ThecollapseoftheBrettonWoodsAgreementsawcentralbanksaroundtheworldswitchfromholding gold reserves to holding USD as their reserve currency. In 1975 when OPEC accepted USD as the sole pricing and settlement currency for oil, this propelled the USD to become the currency denomination for all other major commodities, sealing its status as a world reserve currency.
TheEURwasintroducedin1999.Withthecombinedstrengthofits12foundingmembers, its share of world reserves was set at 18% from the start. As the Euro zone expanded, its share of world reserves has grown, reaching about 28% by third quarter 2009. The EUR’s ascent as an international currency was also bolstered during this period by the bursting of the dot.com bubble and the September 11 terrorist attacks on the US which shook international confidence in the US economy and the dollar.
The last chapter of this guide discusses the chances for China achieving the international currency status for the CNY. The conclusion is that current efforts to globalising the offshore CNH market franchise will lead at best to partial internationalisation without full convertibility.
CNYcurrentlyranksas15th most used payments currency globally
USDtook30yearstobeacceptedas international currency through economics and politics
EURtooklessthan10yearsthrougheconomic union
Figure15:Distributionofworldforeignreserves(%)
Source: IMF
55
60
65
70
75
0
5
10
15
20
25
30
I II III1999 2000 2001 2002 2003 2004 2005 2006 2007 2008 2009 2010 2011 2012
EUR GBP JPY Other USD (RHS)
IV I II III IV I II III IV I II III IV I II III IV I II III IV I II III IV I II III IV I II III IV I II III IV I II III IV I II III IV I II III IV I
16

Evolution of the market
The CNH FX market officially came into existence in July 2010 when the PBOC and the HKMA signed a Supplementary Memorandum of Cooperation that allows Hong Kong banks to directly settle CNY trades among each other. This led to the creation of the CNH interbank market. In its brief history, the market evolved from one that is purely driven by regulations to one that is increasingly driven by flows from foreign multinational corporations (MNCs) and Chinese corporations.
There were major regulatory changes by both the PBOC and HKMA to directly deepen the FX market.
• Expandingthecentralclearingline: The CNH FX market had a rather turbulent first two years, caused primarily by the tight cap imposed on the Bank of China (Hong Kong) Limited for centrally clearing any long/short CNY positions offshore. Also, the build-up of liquidity through the trade channel was not fast enough to cope with a rapidly growing demand from bond investors.
The central clearing limit was breached twice – the first time on 28 October 2010 from the short side and the second time on 23 September 2011 from the long side. Both times caused huge dislocations between the CNH and onshore markets. In the first episode, the HKMA stepped in to assure the market that it was standing by to activate its CNY swap line with PBOC. In the second episode, the PBOC eventually had to temporarily double the quota. A second central clearing line is on the way to be set up in Singapore, as announced in July 2012.
• IntroducingadailyUSD/CNHspotfixing: The introduction of a daily USD/CNH spot fixing at 11.15am by the Hong Kong Treasury Markets Association (TMA) in June 2011 was an important turning point. This was a boost to the FX derivative and option markets as the fixing provides transparency and also a pricing source for switching to USD settlement in the event of any market disruption that renders the CNH non-deliverable. This was formalised in October 2011 by a working group of banks and the International Swaps and Derivatives Association (ISDA) to include a standard fall-back clause for CNH FX OTC products. However, other products including CNH bonds have yet to standardise the choice of FX fixing and/ or the adoption of a market disruption clause.
• IncreasingHongKongbanks’risklimits: In January 2012, the HKMA increased banks’ CNY net open positions from the 10% cap imposed since July 2011 to 20%. In May 2012, the cap was lifted. Banks’ statutory liquidity requirement on CNY deposits was also liberalised twice, in February and June 2012.
• Wideningtheonshoreintra-daytradingband: In April 2012, the PBOC widened the intra-day trading band on USD/CNY spot from +/-0.5% to +/-1% and lifted the short-selling ban on USD by onshore banks. This easing of FX rules onshore further deepened the offshore market as it broadened the scope for Chinese companies to arbitrage between the two markets.
FX MarketCNH FX market is now driven by corporate flows
17

Other deregulation steps which indirectly helped boost the FX market trading volume included those which opened up the inward investment routes into China, and the lifting of restrictions for Chinese exporters to settle in CNY.
On 27 April 2012, the HKMA extended the real time gross settlement (RTGS) system by an additional five hours to close at 11.30pm. The aim is to facilitate the settling of trades as a step to help deepen the market in London. However, the extended RTGS hours may have limited use as banks are still unable to access their fiduciary accounts at the PBOC Shenzhen branch whose hours have not been extended. The fiduciary account channel was set up in early 2011 after the first breach on the central clearing cap in October 2011 so as to reduce banks’ counterparty risks with the sole central clearing bank, BOC (Hong Kong) Limited. Clearly, banks would favour the PBOC counterparty risk to the BOC risk.
Figure16:TypesofFXmarketsintheoffshoredeliverable,offshorenon-deliverableforwardandonshore deliverable markets
Offshore CNH Offshore NDF OnshoreCNY
Fx Spot
Tenors T+2 value spot n.a. T+2 value spot
Daily volume (USD bn) 1-2 n.a. 20
Ticket size (USD mn) 5-15 n.a. 10-20
Bloomberg/ Reuters CNH TMAF/ CNHFIX= n.a. CNY/ CNY=CFXS
FX forward
Tenors O/N - 12m, 18m, 24m T/N - 12m O/N - 12m, 24m, 36m
Daily volume (USD bn) 2-3 4-5 10
Ticket size (USD mn) 10-20 10-50 10-20
Bloomberg/ Reuters CNH+1M/ CNH1MOR= CCN+1M/ CNY1MNDFOR= CCO+1M / CNY1MOR=
Cross currency swap
Tenors 6m - 5y 1y - 5y 1y - 5y
Daily volume (USD mn) 50-100 20-50 inactive
Ticket size (USD mn) 10-20 10-20 inactive
Bloomberg/ Reuters CGUSSW2/CNHUSCS=TRHK CCSWN2/CNUSNDS2Y= CGYSSW2/CNUSCS
FX option
Tenors O/N-2y O/N-3y O/N-2y
Daily volume (USD mn) 70-300 250-300 Illiquid
Ticket size (USD mn) 10-20 50 n.a.
Bloomberg/ Reuters USDCNHV1Y / CNH1Y0=BRKR USDCNYV1Y/CNY1YO=W USDCNYOV1Y / CNY1YO=CN
FX futures
Tenors 1m-1y (to start on 17 Sep 2012) 1m-1y (CNYUSD)1m-3y (USDCNY)
n.a.
Daily volume n.a. Illiquid n.a.
Ticket size (USD mn) n.a. 0.1mn per contract n.a.
Bloomberg/ Reuters n.a. n.a. n.a.
Source: Bloomberg, RBS
18

OffshoreCNHandonshoreCNYspotrates have converged although the two fixings continue to diverge
DeliverableCNY/JPYcrossnowquoted in Tokyo; expect more crosses to follow
Figure17:USD/CNHfixingvsPBOCUSD/CNYfixingandPBOC intra-day band
Figure18:USD/CNHspotvsUSD/CNYspotandPBOCintra-day band
Source: Bloomberg Source: Bloomberg
Spot
• Marketvsfixings
Spot market liquidity has picked up significantly since its inception. Daily volumes for CNH spot are now about USD2 billion, more than a ten-fold increase from inception. In comparison, the onshore CNY daily trading volume is about USD10 billion. The average transaction size is around USD10 million (see Figure 16).
The direction of USD/CNH is ultimately set by the PBOC’s FX policy through its daily fixing. However, there are still long stretches of deviations from the onshore market for which the comparison can be made in terms of two spot fixings and the real-time trading.
Prior to the recent deregulations which allowed more two-way flow of funds for trade and investments, the deviations between USD/CNH and the onshore market were in both the fixings and real-time trading (Figure 17). Since May 2012, the deviations in the fixings on both sides continue to deviate. However, real-time spot trading of the two markets has converged (Figure 18). This has come about with the onshore real-time spot rate converging to the offshore deliverable CNH rate rather than its own onshore fixing set by the PBOC. In other words, the CNH market has taken the lead over the onshore market.
One can say that the PBOC’s widening of the intra-day trading band in April 2012 from +/-0.5% to +/-1% marked the turning point for market convergence between offshore and onshore. At about the time of the PBOC’s move, the country’s top leaders and the PBOC governor issued statements on allowing the CNY to be more freely trading so as to see more two-way fluctuations on the basis that the currency is fair-valued and the country’s exports have come under pressure. This seems like a subtle message for a switch from a strong FX policy to a neutral or even slightly weak FX policy. The PBOC’s fixing for USD/CNY has risen by 0.8% since the band widening. The offshore USD/CNH fixing has risen by 1.1% during the same period.
On 1 June 2012, the Tokyo interbank market started directly quoting the deliverable CNY/JPY cross rate with the PBOC endorsement. As upcoming offshore CNY centres, we believe that London and Singapore will launch more of the deliverable CNY crosses, starting with crosses against their own respective local currency units.
Jun11
Aug11
Oct11
Dec11
Feb12
Apr12
Jun12
Aug12
6.2
6.3
6.3
6.4
6.4
6.5
6.5
6.6
Intra-day band CNY spot CNH spot
Jun11
Aug11
Oct11
Dec11
Feb12
Apr12
Jun12
Aug12
6.2
6.3
6.3
6.4
6.4
6.5
6.5
6.6
Intra-day band CNY fix CNH fix
19

Figure19:USD/CNH12mnoutrightvsUSD/CNYNDF12moutrightandonshoreUSD/CNY12mnoutright
Figure20:Implied12mnCNYappreciationbyUSD/CNHforwardvsUSD/CNYNDFandonshoreUSD/CNYforward
Source: Bloomberg Source: Bloomberg
Forwards
The daily volume for CNH FX swaps and forwards is estimated at USD3 billion. Tenors are available up to three years, with liquid better in one year and below. CNY NDF daily transaction volume is estimated at USD6.5 billion. Combining spot and forwards, the deliverable CNH FX market is now broadly on par with the NDF market. Onshore, the daily volume of CNY FX swaps and deliverable forwards is estimated at USD10 billion. Combined with spot trading, the total trading volume of the onshore FX market is about USD20 billion (see Figure 19).
There is increasing pressure for the onshore market to trade in line with the offshore deliverable market and away from the onshore fixing. Given this, we expect market participants to increasingly migrate to the deliverable CNH market from the NDF market which takes an onshore fixing. In fact, the behaviour of the USD/CNY NDF market has long stopped behaving like a normal NDF market, behaving more like adeliverablemarket.WellbeforethePBOC’ssubtleshifttoaweakerFXpolicy,the NDF curve has moved upwards steeply. It was dragged up by the steepening pressure from the deliverable USD/CNH forward curve (see Figure 20). As a typical NDF market reflects market expectation for the strength or weakness of the currency to USD, USD/CNY NDF had been inverted to reflect market expectation of a strong CNY before the deliverable CNH market became deep and active.
Combining spot and forwards, the CNH FX market is broadly on par with the NDF market
Market participants are increasingly migrating from NDF to deliverable CNH forwards
Jan11
Mar11
May11
Jul11
Sep11
Nov11
Jan12
Mar12
May12
Jul12
6.206.256.306.356.406.456.506.556.60
CNH 1y NDF 1y CNY 1y
Jan11
Mar11
May11
Jul11
Sep11
Nov11
Jan12
Mar12
May12
Jul12
-3
-2
-1
0
1
2
3
4
CNH 1y NDF 1y CNY 1y
20

Cross currency swaps
Cross currency swaps are offered by major interbank players with tenors from six months to five years, although liquidity is poor above three years. The daily turnover is reasonably big at around USD50-100 million, with an average ticket size of USD10-20 million. Liquidity has been gradually improving as market participants increasingly switch from ND-CCS to the deliverable CCS for hedging trade and investments. For trade, transactions are mainly confined to tenors one-year and below.
On the investment channel, the flows currently tend to come from investors paying CNY CCS rather than issuers receiving CNY CCS. However, as the CNY CCS basis becomes less negative (see Figure 21) and the market gets deeper, USD-based issuers might be increasingly attracted to come to the CNH bond market to raise funds and swap them into USD.
Options and futures
Still in a relatively nascent stage of development, the CNH options market is growing at a brisk pace. The first OTC RMB option was traded in November 2010. The liquidity has since picked up, averaging around USD70 -120 million, reaching USD300 million on busier days. Tenors of up to 12 months are fairly liquid (see Figure 22). Two year options are not as liquid but not uncommon.
On 22 August 2012, the Hong Kong Exchanges and Clearing Limited announced that it will introduce the first deliverable CNY currency futures on 17 September 2012. The USD/CNH contract would be the first deliverable CNY currency future. The final settlement price will be based on the spot USD/CNH fixing published by the Treasury Markets Association at 11.15 am. The first batch of contract months that will become available are October 2012, November 2012, December 2012, January 2013, March 2013, June 2013 and September 2013.
Figure21:1yCNHCCSvsCNYND-CCSandonshore CNYCCS
Figure22:3mUSD/CNHvolvsUSD/CNYNDFvol(%)
Source: Bloomberg Source: Bloomberg
Futures to be available from September 2012
CNH options now trade up to 2-years
Jan10
Apr10
Jul10
Oct10
Jan11
Apr11
Jul11
Oct11
Jan12
Apr12
Jul12
1y CNH CCS 1y CNY ND-CCS 1y CNY CCS
-4-3
-2-10
1234
0123456789
Mar11
May11
Jul11
Sep11
Nov11
Jan12
Mar12
May12
Jul12
CNY NDF vol CNY vol
21

Evolution of the market
Until the end of 2011, the CNH interest rate market comprised only a thinly traded deposit market and a vibrant bond market (see Figure 23). Since January 2012, Hong Kong banks have started to activate a money market by providing a daily fixing on a CNY Hibor curve.
There are three reasons which remain today as to why Hong Kong banks struggled to activate an interest rate swap curve in the CNH market:
• Lackofapolicyinterestratetarget: The PBOC’s interest rate policy targets are Chinese banks’ commercial deposit and lending rates. Hence, the onshore money market of repo and Shibor are driven entirely by liquidity factors, including the PBOC’s open market operations (bills, repos and reverse repos), required reserve ratio (RRR) moves and FX fund moves. Given the vastly different liquidity condition in the CNH market from the onshore market, the onshore Shibor is thus highly inappropriate for setting the CNH interest rate swap market.
• LackofaccesstoonshoreShibor: As the CNH IRS is a deliverable market – similar to the FX market, market makers for the IRS curve would require access to the short-end fixing to be able to manage their interest rate risks. However, there is no access to the onshore Shibor market.
• Onshoremarketishighlyspeculative: There are several different IRS markets onshore, the most heavily traded being that fixed on the seven-day repo rate with a daily turnover of CNY3-4 billion. The Shibor-fixed market is the second most traded market with daily volume barely half of the former. Other IRS curves have fixings on the PBOC’s one-year lending and one-year deposit rates, These are used by corporate borrowers on a case-by-case basis. Until recently, the onshore seven-day-fixed and Shibor-fixed IRS market is highly speculative as both borrowers and investors do not use the market for hedging interest rate risks. More recently, corporate bond issuers have begun using the IRS curve to do hedging.
For all the above points, it is clear that the offshore market cannot use the onshore money market to start an offshore interest rate swap market. This was the reason why Hong Kong banks have come together to start an interbank CNY Hibor curve in January this year. Meanwhile, the PBOC has started managing interest rate policy changes.
• OMObecomestwo-waywithregularreverserepos: Firstly, the PBOC has replaced the use of RRR tool with reverse repurchase operations, regularising the reverse repos in the twice-weekly open market operations (OMO) since the beginning of June 2012. Previously, the OMO comprised only repos and the central bank bill auctions while reverse repos were conducted on a discretionary and bilateral basis with banks in need of liquidity.
Interest Rate MarketStarting a money market, IRS still non-existent
PBOC monetary policy overhaul underway
22

• Subtlyderegulatingcommerciallendinganddepositrates: Secondly, the PBOC has started to use the interest rate tool more frequently, cutting the policy targets on banks’ commercial lending and deposit rates twice on 7 June and 5 July 2012 (see Figure 24). These cuts were accompanied by a softening of the hard corridor by allowing banks to give discounts to their lending rates below the policy targets and premiums to their deposits rates above the policy targets. In the last move, the discount on lending rates is allowed up to 30% while the premium on deposit rates is allowed up to 10%.
The second move clearly reduced banks’ protected interest rate profit margin. Whileintendingtomakebanksmorecompetitive,itispossiblethatthePBOCis also looking at changing its interest rate policy targets.
Specifically, we believe the central bank might introduce a repo and reverse repo corridor target as its interest rate policy and move away from targeting banks’ commercial lending and deposit rates. The country’s top leaders and the central bank governor have openly talked about interest rate reforms at about the same time they have spoken about FX reforms. Hence, a regime shift could be underway which will switch the PBOC’s monetary policy from an active quantity-based approach using the RRR tool to a price-based approach using market interest rate tools. If so, this would create a more policy-driven and deeper Shibor market onshore from one that is currently liquidity-driven and often speculative.
Possible switch in interest rate targets coming up
Figure23:Typesofinterestratesmarketsintheoffshoredeliverable,offshorenon-deliverableforwardandonshoredeliverable markets
Offshore CNH NDF OnshoreCNY
Interbank borrowing
Tenors O/N, T/N, term deposits (to 1y) n.a. O/N, T/N, term deposits to 1y
Daily volume CNY2-4bn n.a. CNY500-800 bn
Ticket size CNY50-500 mn n.a. CNY300 mn
Bloomberg/ Reuters CGDR1 / CNHIBOR n.a. CCDR1 / SHIBOR
Interest rate swaps
Tenors inactive 1y-10y 1y-10y
Daily volume inactive CNY1-2bn. CNY3-4 bn
Ticket size inactive CNY50-300 mn CNY100-300 mn
Bloomberg/ Reuters CGSW1/CNHIRS=BRKR CCSWNI1/CNNDIRS= CCSWO1/CNYIRS7R=CNorCNYIRS3S-CN
MOF bonds
Tenors 2y, 3y, 5y, 10y, 15y n.a. 1y, 3y, 5y, 7y, 10y, 20y (longest 50y, not benchmark)
Daily volume CNY50-200 mn n.a. CNY300 bn
Ticket size CNY5-10 mn n.a. n.a.
Bloomberg/ Reuters n.a. n.a. GCNY2YR / CN2YT=RR
Source: Bloomberg, RBS
23

Figure24:PBOCone-yeardeposit-lendingratepolicycorridor, seven-day repo rate and 3m Shibor rate
Figure25:3mCNHHiborvsCNHFXimpliedrate,CNHdeposit rate and onshore Shibor (%)
Source: Bloomberg Source: Bloomberg
Money market
The daily transaction volume of CNH deposits and loans is estimated to be CNY2-3 billion. For overnight (O/N) and tomorrow-next (T/N) deposits, the size per transaction is around CNY100 million-1 billion while the size for term deposits is usually smaller around CNY50-200 million (See Figure 23).
On 3 January 2012, Hong Kong TMA announced it would establish a CNH Hibor curve by getting three banks to commit to publishing their interbank offered rates at 11am daily. Based on their customer flows, the rates from the three banks were initially wide apart from each other. More members were added subsequently. The number of contributing banks stands at 13 as of August 2012.
Although the rates posted by banks have become less disperse, the curve remains illiquid and is hardly traded. From overnight to three months, the rates are fixed at about the same levels as the rates implied from the USD/CNH FX forward curve (see Figure 25). For the longer tenors, the rates vary according to the fixing and banks’ funding requirements.
Interest rate swaps
As said above, the CNH interest rate swap market practically does not exist at all. The rates posted by Hong Kong banks basically are taken from the onshore market and there seems to be a tacit agreement among interbank market players not to trade the curve.
The best alternative is to create a new IRS curve using the CNY Hibor as fixing once the latter becomes more tradable. An IRS curve would help to deepen the CNH bond market, especially for secondary trading of the bonds, by allowing issuers and investors to hedge their interest rates.
Jan11
Mar11
May11
Jul11
Sep11
Nov11
Jan12
Mar12
May12
Jul12
CNH Hibor CNH FX implied CNH depo
Shibor
-2-1012345678
0123456789
10
Jan07
Jul07
Jan08
Jul08
Jan09
Jul09
Jan10
Jul10
Jan11
Jul11
Jan12
Jul12
1y deposit-lendingrate corridor
7d repo 3m Shibor
24

Sovereign benchmark curve
Only the Chinese government can set the sovereign CNH bond benchmark curve as the CNY is the sovereign currency of China. China’s MOF launched its first bond issuance in September 2009 in tenors of two-years, three-years and five-years, with tranches for retail and institutional investors. Since then, it has issued three more batches of bonds, with roughly six to nine-month frequency in December 2010, August 2011 and most recently in June 2012. In the last issuance, the MOF extended the duration of the sovereign benchmark curve from 10 years to 15 years.
Similar to the CNH corporate bond market, the MOF’s bonds in the offshore CNH market used to command significant coupon discounts over the onshore bonds. In fact, the yield discounts were wider than those issued by regular Chinese bank issuers. These premiums have since evaporated as investors’ expectations have switched from FX gains to bond gains (see Figures 26 and 27).
Repo market
One of the initiatives which emerged from the Hong Kong-London RMB Forum was a tripartite repo arrangement jointly set up by the HKMA central money market unit, Euroclear and J.P. Morgan in late June 2012. The system is designed to facilitate CNH repurchase transactions involving a wider choice of international securities through the Euroclear and J.P. Morgan platform. It can be a start to a full repo market for CNH bonds which would help to boost the extension of bank lending using the limited pool of CNH liquidity. The system also helps to reduce the settlement risks among banks.
Figure26:OffshoreMOFbenchmarkcurvevsonshorebenchmark curve as at 1 Sep 2012 (%)
Figure27:3yMOFoffshoreCNHbondvsonshorebond(%)
Source: Bloomberg Source: Bloomberg
00.51.01.52.02.53.03.54.0
2011 2012 2013 2014 2015 2016 2017 2018 2019 2020 2021
CNH governmentbenchmark
Onshore governmentbenchmark
Jun11
Sep11
Nov11
Jan12
Mar12
May12
Jul12
Spread (rhs,bp) CNY 3y bmkCNH 3y bmk
0
1
2
3
4
5
050100150200250300350400
25

Evolution of the market
There are broadly three phases of development in the CNH bond market over the past five years: 2007-2009 – a sellers’ market; 2010-2011 – the Big Bang paving way forglobalissuersandinvestors;and2012–abuyers’market.Webrieflydocumentbelow the important milestones in each phase.
The expansion outside of Hong Kong took off from 2010 after the central banks, investors and corporations increasingly showed support for CNY trade settlement and investment. It became a case of supply creating its own demand – the issuance of CNH bonds by global MNCs attracted global investors outside of Hong Kong and Asia.Webrieflydocumenttheimportantmilestonesinthesethreephases.
• 2007-2009:Sellers’market
In January 2007, the PBOC and the National Development and Reform Commission (NDRC) jointly announced that the country’s banks would start to issue CNY-denominated bonds outside of the mainland, specifically in Hong Kong. In June 2007, China Development Bank (a state-owned policy bank) became the first issuer, followed by other state-owned commercial banks. In the beginning, these issuances were primarily targeted to absorb the excess offshore RMB in circulation in Hong Kong and route them back into China.
The playing field was confined largely to the Hong Kong marketplace. Motivated by FX gains rather than yields, Hong Kong-based investors facing a weak USD currency peg and low USD interest rates were willing to accept yields as much as 250-300 basis points below the yields of bonds issued by the same banks onshore. This made the market very much in favour of sellers or issuers. The trade-off was that the maturity of the bonds was mostly capped at a three-year tenor because of the investors’ motivation for FX rather than yield gains.
In September 2009, China’s MOF issued its first offshore bonds in three tranches for both retail and institutional investors. This further spurred issuance from bank issuers, which had by then broadened to China-incorporated foreign banks’ subsidiaries, namely HSBC Bank (China) Company Limited and Bank of East Asia (China) Limited as the first two non-Chinese bank issuers. The MOF bonds also extended the CNH bond curve from three to five years, setting a sovereign benchmark.
This period also marked a critical phase of the RMB internationalisation process, which involved two important developments. First was the signing of bilateral CNY swap lines between the PBOC and the central banks from China’s strategic trade partners. These lines were designed to promote confidence in the use of CNY for trade settlement. Another critical development was the launch of the CNY trade settlement scheme on a pilot basis in July 2009 for selected Chinese coastal cities with Hong Kong and ASEAN member countries. Although the limitation of the scheme did not help much to boost CNY liquidity or deposits in Hong Kong (not fast enough to cope with the increasing demand for the CNH bonds), it signalled Chinese government’s efforts to facilitate the RMB internationalisation process by developing the offshore RMB bond market.
Bond Market
Jun2007–firstCNHbondissued by CDB
Dec2008–firstCNYswaplinesignedwith Korea
Jul2009–CNYtradesettlementpilotscheme launched
26

• 2010-2011:BigBang–issuersandinvestorsgoglobal
This period was marked by rapid liberalisation steps by China, paving way for Hong Kong to aggressively promote the market to global issuers, drawing in global investors. The first step came in February 2010 with the HKMA announcing that all forms of CNH fundraising by any Hong Kong or non-Chinese entities are allowed without prior approval in the Special Administrative Region (SAR) if the proceeds are not to be repatriated into China. In the latter event, repatriation would require the Chinese regulators’ approval. This was followed by the signing of a Memorandum of Cooperation between PBOC and HKMA in July 2010 that allows the Hong Kong banks to set up an interbank market for CNH FX and interest rates.
Hopewell was the first non-Chinese corporate issuer in July 2010. This was followed by the McDonald’s issue in August 2010 which became the first MNC issue. The McDonald’s issue set the precedent for MNCs with substantial business in China to look at the CNH market as an alternative funding source for their Chinese operations.
By this time, the market had grown four-fold since its launch in 2007 to CNY41 billion at the end of 2010. The demand for CNY liquidity to invest in the bond market became so great that it breached the central clearing quota managed by Bank of China (Hong Kong) Limited in October 2010. This activated the HKMA to announce that it would tap the CNY swap line facility from PBOC to ease the market pressure (see FX section).
The October 2010 episode prompted the Hong Kong TMA to start its own USD/CNH daily spot fixing at 11am in June 2011. This indicated China’s commitment to allow market forces to play a greater role in determining CNH exchange rate, without being pressured by the PBOC’s onshore daily fixing for the CNY. In addition to improving the stability of the CNH FX market, it reduces the FX spot basis risk for CNH-denominated products and in turn, provided more comfort for bond investors.
InSeptember2011,China’sVicePremierWangQishanvisitedLondontopromoteLondon as a global offshore RMB centre. Preceding that visit, in August 2011, Chinese corporates which had been kept out of the CNH bond market were allowed to tap the market. The PBOC launched the RMB QFII scheme and a pilot scheme to allow foreign banks to use CNH funds for recapitalising their Chinese operations.
In 2011, the market reached CNY225 billion, which was nearly a 23-fold increase since end 2007.
Despite the market opening up, the supply and demand imbalance remained in this phase. The low yields on CNH bonds reflected strong investor demand and showed that investors’ investment decisions were motivated by FX gains rather than returnfromyields.WiththeshiftinRMBappreciationexpectations,wehaveseenthat investment in RMB bonds has come under greater scrutiny and requires more rigorous credit analysis.
February2010–allformsofCNHfundraising allowed in Hong Kong
July2010–CNHinterbankmarketlaunched
October2010–firstsupranationalissue by ADB, also first 10-year issue and first bond traded on the Hong Kong Stock Exchange
December2010–firstnon-AsianEMissuer, VTB Bank
June2011–HKTMAstarteddaily11amfixingforUSD/CNH
September2011–ChineseVicePremier visited London to promote London as a RMB centre
27

• 2012:buyers’market
The concerns on China’s growth and the subtle shift in the PBOC’s FX policy stance from the beginning of this year combined to turn this market from a sellers’ market to a buyers’ market. The yield premium has now almost completely closed up. Considering that onshore and offshore CNY bond markets have their inherent risks, the question now is whether there should be any yield differentials between the two markets.
For the onshore market, the basic issue is market access and the risk of capital controls. For the offshore market, the issue is currency convertibility. Until the CNY becomes fully convertible, there is still a chance, however remote, that China decides to backtrack to a full non-convertibility status. In a way, the risks onshore and offshore are in fact not dissimilar, stemming from the FX angle.
Moreover, the CNH DF market has priced in the shift in RMB appreciation expectations, and has moved the basis swaps in favour of foreign issuers who would issue CNH bonds and swap the proceeds into other major currencies like USD. These market developments have provided favourable arbitrage opportunities for issuers who do not have imminent needs in RMB.
Despite market pressure, issuance volume continues to go up and investors’ interests remain sturdy as issuers were willing to adjust to higher yields. To a large extent, this was aided by further market reforms and liberalisation of rules. In January 2012, the HK TMA launched CNY Hibor fixing. In January and February 2012, the HKMA consecutively eased Hong Kong banks’ risk limits and statutory liquidity requirements (SLR) on their CNY exposure. Onshore, reforms took the form of a widening of the USD/CNY intra-day trading band in April 2012, and two rounds of rate cuts in June and July 2012 which came with a softening of the corridor on banks’ interest rate margin. The rate cuts in particular helped to further tighten the yield premiums of the onshore bonds to the offshore CNH market.
Two other developments also surfaced in parallel. In February 2012, the Shanghai municipal government released a blueprint, setting a 2015 target for the city to become the global pricing centre for all CNY-denominated financial products onshore and offshore. In April 2012, the City of London followed up on the Chinese Vice Premier’s visit in September 2011 to London by launching a London-Hong Kong forum on the global offshore RMB market. These are very subtle manoeuvres going on here which we will discuss in a later chapter.
WhileShanghaihasitslong-termambitiontobecomethecountry’skeyfinancialcentre, including taking over the current role of Hong Kong as the main offshore RMB pricing centre, Hong Kong has been given the chance to tap on the global financial centre strengths of London to advance its RMB business in the interim. How the future of the two cities pan out would be something to watch out for.
Meanwhile, in the pipeline, a second central clearing line will be set up in Singapore, to be operated by a Singapore branch of a Chinese bank. Tokyo and Taipei are also separately discussing their own respective direct clearing lines into China. All these clearing lines would bypass Hong Kong, which as we said in the last chapter, has now become a more mature market in our opinion.
Euro crisis and subtle shift in PBOC’s FX policy
January2012–HKTMAlaunchedCNYHibor fixing
January2012–HKMAeasedbanks’CNYopenrisklimits
February2012–HKMAeasedbanks’SLRforCNYdeposits
February2012–Shanghaisets2015targettobeglobalCNYpricingcentre for both onshore and offshore markets
April2012–PBOCwidenedonshoreUSD/CNYintra-daytradingband
April2012–CityofLondonlaunchedLondon-Hong Kong forum
JuneandJuly2012–PBOCcutinterest rates twice and softened policy rate corridor
28

At this point, we see the market has evolved from a seller’s market, where investors continuously seek returns on FX appreciation, to a buyer’s market, where investors would treat CNH bonds as a credit product and begin to evaluate the credit-worthiness of the bond and not only the FX gains. The imbalance between demand and supply has improved but not quite yet to demand-supply equilibrium, as shown by the narrowing of the offshore/onshore premiums/discounts. The biggest uncertainty now is the PBOC’s FX policy direction as investors adjust their expectations from chasing FX gains to chasing yield or bond gains.
Issuer Base
The CNH market has experienced an exponential growth since 2010. As of August 2012, total new issues (including CDs) in 2012 amounted to CNY199 billion. Issue volume for financial institutions (FIs) grew at a CAGR of 155% from 2010 to August 2012 while the issue volume for corporates increased at a CAGR of 54% in the same period.
In its early stages of development, CNH issuance was dominated by Chinese government (Ministry of Finance), Quasi-government (policy banks) and China/ Hong Kong FIs. Since the landmark reforms in July 2010, which paved the way for offshore entities to issue CNH bonds in Hong Kong, the issuer base has expanded greatly in terms of issuer type, credit quality, geography, sector and tenor.
Types of issuersCNH bond issuers consist of state-owned enterprises, MNCs, Hong Kong branches of Chinese and foreign banks, and onshore banks direct issuance banks. The CNH market is still dominated by Chinese FIs (both policy banks and commercial banks), which accounts for 70% of total market share as of August 2012. China/Hong Kong corporates represents the second largest category of issuers (apart from MOF issuance), accounting for 8% of total market share as of August 2012.
From 2010 to August 2012, non-Chinese issuers accounted for over 14% of total CNH issue volume, of which corporates made up 50% of the issuer base and FIs took up 47% of the market share.
Chinese FI are the leading issuers in the CNH market; foreign FIs and corporates gained market share since the opening of CNH bond market to offshoreentitiesinJuly2010
Figure28:Issuancebyissuertype(CNYbn)
Source: Bloomberg; includes both bonds and CDs issuance
Shift in investors’ expectations from FX gains to yield or bond gains
Chinese Corp Chinese FI Foreign Corp Foreign FI China MOF
10 10 1641
199191
0
50
100
150
200
250
2007 2008 2009 2010 2011 2012
29

Figure29:Increasingparticipationbynon-Chineseissuer(CNYbn)
Source: Bloomberg; includes both bonds and CDs issuance but excludes China MOF issuance
Figure30:IssuancebyChineseissuers(CNYbn)
Figure31:Issuancebynon-Chineseissuers(CNYbn)
Source: Bloomberg; includes both bonds and CDs issuance
Source: Bloomberg; includes both bonds and CDs issuance
Non Chinese Chinese
2007 2008 2009 2010 2011 20120
40
80
120
160
200
Corp FI China MOF
0
30
60
90
120
150
180
2007 2008 2009 2010 2011 2012
Corp FI Supranationals
0
5
10
15
20
25
2010 2011 2012
30

Figure33:Issuancebycountry(2011)
The geographical composition of the issuer base has also changed over time. Since the first MNC issuance by McDonald’s in August 2010, we have seen a growth in issuance by non-Chinese companies, notably Europe, North America and other parts of Asia. In particular, CNH bond issuance by European issuers increased from a share of only 1% in 2010 to 7% and 6% in 2011 and August 2012 YTD respectively.
Wehavealsoseenanissuertestingthenewmarketwithalternativeissuingstructure,namely Khazanah Nasional, as the first issuer to sell an Islamic bond in the offshore RMB market. The success of this transaction demonstrates the readiness of the market to accept innovation.
In addition, Korean frequent issuers have also accessed the market leveraging on the window in the swap market.
Figure32:Issuancebycountry(2010)
Figure34:Issuancebycountry(2012)
Source: Bloomberg; includes both bonds and CDs issuance but excludes China MOF issuance
Source: Bloomberg; includes both bonds and CDs issuance but excludes China MOF issuance
Source: Bloomberg; includes both bonds and CDs issuance but excludes China MOF issuance
88%
1% 4% 4% 3%
HK/China Europe
Korea US
Southeast Asia Japan
Supranationals Others
HK/China Europe
Korea US
Southeast Asia Japan
Supranationals Others
88%
6% 3%
1% 1% 1%
0.4%
HK/China Europe
Korea US
Southeast Asia Japan
Supranationals Others
83%
7% 2% 2%
3% 1% 0.4%
1%
31

In terms of tenor, the majority of the issuances are concentrated in the shorter end of the curve – three years or less where issuers enjoyed the deepest investor pool. Traditionally, investors’ involvement was driven by an anticipation of RMB appreciation and investors tended to have a directional view in the shorter maturities. As the market evolves further where there are new entrants to the market, issuers were successful in closing transactions with longer maturities. The most notable was when China Development Bank raised CNY1.5 billion for the first 15-year CNH offering in January 2012 where insurance companies supported the transaction. China Development Bank did another CNY1 billion 20-year trade in July 2012.
Figure35:Issuancebytenor
Figure37:Issuancebyissuesize
Figure36:Issuancebytenor
Figure38:Issuancebyissuesize
Source: Bloomberg; includes both FI and Corp bonds and CDs issuance but excludes China MOF issuance
Source: Bloomberg; includes both FI and Corp bonds and CDs issuance but excludes China MOF issuance
Source: Bloomberg; includes only Corp bonds
Source: Bloomberg; includes only Corp bonds
Size-wise, 33% of CNH issuance has an issue size of CNY500 million-1 billion, reflecting investors’ preference for liquidity. As of to date, the record of the largest single issue volume is kept by the China Development Bank (CNY5 billion issue) intheFIspace,andtheNewWorldChinaLand’sCNY4.3billionissueinthecorporates space.
61%
6% 0.4% 2%
<=2 yrs 3yrs
5yrs 7yrs
7-15yrs >15yrs
31%
0.2%
75%
7% 1% 2%
14%
0.7%
<=500m >500m - <=1bn
>1bn - <=1.5bn >1.5bn - <=2bn
>2bn - <=3bn >3bn
33%
2.9%
18%
29%
<=500m >500m - <=1bn
>1bn - <=1.5bn >1.5bn - <=2bn
>2bn - <=3bn >3bn
8%
9%
19%
17% 1%
<=2 yrs 3yrs
5yrs 7yrs
10yrs
63%
0.1%
32

Motivations and objectives
Chinese corporates and banksWeseethefollowingincentivesforChinesecorporates/banksenteringtheCNHbond market:
1. BankcreditenvironmentinChinaremainstight
As discussed in the earlier sections on FX and interest rates, in our view, the recent PBOC cuts in both the benchmark lending and deposit rates were moves to liberalise interest rates rather than to ease policy. Credit environment remains tight and unsecured term funding is not readily available.
New loans extended by Chinese banks in July 2012 fell to the lowest level since September 2011. Chinese banks lent nearly CNY540 billion worth of new loans, considerably lower than that of the previous six months. Although this can be partly explained by the weaker overall macro economic situation in China, policy control over lending was still underplayed. For example, there are still considerable policy measures against lending to real estate developers in China.
On the contrary, Chinese banks’ overseas subsidiaries in Hong Kong or branches continue to remain active in supporting their clients’ overseas activities. These Chinese lenders constitute an important source of CNH investment pool servicing their clients’ overseas ambition.
CNH market is an important option for Chinese companies given the tight bank credit environment in China
Figure39:China’snewloangrowthinJulyreachedlowestin2012(CNYbn)
Source: PBOC, Bloomberg
738 711
1,011
682793
920
540
15% -4%
42%
-33%
16% 16%
-41%
0
200
400
600
800
1,000
1,200
1,400
01-12 02-12 03-12 04-12 05-12 06-12 07-12
New loans by Chinese banks New loan growth by Chinese banks
33

2. Previousandongoingdevelopmentoftheoffshorebondmarketassupported by the Chinese and Hong Kong governments
In light of the Chinese government’s initiative to internationalise RMB, a realistic strategy would be to open the RMB bond market to international investors as soon as the offshore bond market becomes mature.
In 2012, Chinese and Hong Kong regulators have taken numerous policy initiatives to promote the depth and breadth of the CNH market. As a result, the CNH market has developed substantially with a wide range of products:
• HKMAboostedRMBliquidityandexpandedtheassetsrangewhichcanbecomputed in RMB liquidity, enabling RMB deposits in Hong Kong to increase and boost the diversification of issuers of CNH bonds
• ChinesegovernmentexpandedQFIIandRMBQFIIquotasandsimplifiedtheapproval process, promoting more RMB backflow channels
• Chinesegovernmentliberalisedtradesettlementswhichsignificantlyexpandedthe RMB deposit base in Hong Kong to buy CNH bonds
• AllowingoffshoreRMBloans(bybankinginstitutionsoperatedinQianhai)
• FurtherdevelopmentofoffshoreRMBproductsandExchange-tradedFunds(ETFs) listed in both China and Hong Kong
• Encouragetwo-waymovementsofRMBtosupportRMBinternationalisation
WehaveseenmoreRMBinflowsintoandoutflowsfromChinathroughHongKong,anddiversifiedoffshoreRMBfinancialproductswiththesepolicies.Weanticipatethe pool of RMB to expand further and enhance demand for offshore RMB products.
3. ExpandingChineseborrowers’overseasactivitiesandtheiruseofRMB
Chinese companies have expanded overseas and we continue to see growth here. These overseas activities would need to be funded by borrowing offshore. Given the restrictions mentioned earlier, we expect to see more offshore funding through the issuance of bonds in the offshore market.
Some of these companies may find the offshore RMB bond market a forum for their fundraising.
Multinational corporations / overseas subsidiaries of Chinese companies
For MNCs that have investments and operating subsidiaries in China, the primary channel for funding working capital is bank lending unless their onshore establishment is large enough to access the domestic bond market.
Bank borrowing, however, has certain restrictions which makes borrowing cost high and maturity short term. The recent PBOC rates cut reduced the burden somewhat, however, bank credit conditions continue to remain tight. Therefore, the offshore RMB bond market offers term RMB funding at competitive rates.
WhentheauthorsvisitedpotentialissuersinEuropeandNorthAmerica,therewasno shortage of interest in this market. The challenge for these companies to issue, which hinders the growth of MNC issuance volume, is the limitation of channels fortheCNHtoflowbackintotheirChinaoperationsasCNY.Wewilldiscusstherepatriation rules in later sections.
For MNCs or overseas subsidiaries of Chinese companies, the CNH market is an important funding channel for their onshore companies in addition to bank lending
34

Apart from repatriation matters, there are also two other opportunities for MNCs to consider a potential issuance:
• Visibility: For many issuers, the offshore RMB market is the only platform for them to gain access to the growing influence of the RMB currency as the domestic capital market is currently closed to foreign issuers.
• Arbitrage: The development of the cross currency swap market (although for the shorter end of the curve) provides opportunities for issuers to raise CNH and swap into major currencies if there is no intention to move the bond proceeds to onshore.
Issuance outlookBased on the above-mentioned incentives, we expect the composition of CNH issuer base to continue to evolve over time.
• Continuedstrongsupplyfromonshorefinancialinstitutionsandcorporates
WeexpectChinawillcontinuetousetheoffshoreplatformasameanstopromotethe development of the offshore RMB market. This strategic initiative enhances opportunities for Chinese policy banks, commercial banks and SOEs to issue CNH bonds outside China. Hence we expect Chinese policy banks will continue to use the CNH market as a stable wholesale funding source in addition to the onshore market, and overseas subsidiaries and branches of Chinese commercial banks will usethismarkettomeetthedemandofCNYloansoutsideChina.Wealsoexpectmore onshore companies to issue CNH bonds, following the cases of Baosteel and China Datang, that have been granted approvals by the NDRC to issue CNH bonds in Hong Kong.
• Increasingissuancebynon-Chineseissuers
MNCs with a significant presence in China will increasingly be using this market, especially when repatriation process has proved to be more accommodative than before. Moreover, the latest development where PBOC has widened the fluctuation band of CNY (from 0.5% to 1.0%) has helped to support the development of the swap market. As the liquidity of the swap market improves, we expect to see more international issuers who do not have natural needs in CNH tapping the CNH market, as they could potentially achieve more competitive pricing compared to direct USD funding.
• LongermaturitiesforCNHbonds
As the CNH market develops, investors are more receptive to longer tenor issuance. This is evident by the recent China Development Bank’s 20-year offering, which has received strong support from Taiwanese life insurance companies who look for long-dated CNH assets to match their portfolio of liabilities.
FI issuers will continue to dominate while we expect to see more diversified names from corporates; longer maturities and larger issue sizes
35

Investor base
Types of investorsThe investor community in the CNH bond market has evolved rapidly since its inception a few years ago. There is diversification in the composition of the investor base both by investor type and by investor geography. In the beginning, the pool of CNH liquidity resided predominantly with commercial banks as retail CNH deposits.
As the CNH market evolves over time, the composition of the investor base has become more diversified – fund managers, insurance companies, private banks and central banks have started to participate in larger proportion than they did a year ago.
In the beginning when there was a strong RMB appreciation play, hedge funds participated in the appreciation story. As the market changed, where there is now an equal balance between the appreciation and depreciation story, we have seen a reduced involvement of hedge funds in this market.
Geographically, we have also seen wider investor participation. In the beginning, HongKong-basedinvestorswerethemaindriversofthisproduct.Wehaveseenstrong interest from Singapore-based investors who took up significant portion of the order book of any single transaction. In the region, we have seen secondary market activities involving investors from Southeast Asia. And the latest interests came from the Taiwanese insurance companies who have contributed significant investor demand for long-dated CNH bonds.
Outside of Asia, we have seen interest from European investors. Lanxess’s three-year bonds were allocated 44% to European investors while 25% of Veolia’s five-year bonds was sold to European investors. Obviously, the issuers in the examples above are well-known European blue-chip borrowers and European investors are very familiar with their credit stories which made the investment decision more straightforward. Nevertheless, we have seen European interest in some pure-Asian play too.
As the RMB appreciation story fades away, the CNH bond market has evolved from a “currency” play to a “credit” play. Depending on the credit story, the yield demanded by investors would reflect the underlying risk and the tenor of the bonds on offer, leading investor composition to vary. The following charts show the investor composition of some recent transactions in four categories of issuers namely, MNCs, SOEs, commercial banks and policy banks.
The composition of investor base has been more diversified over time
36
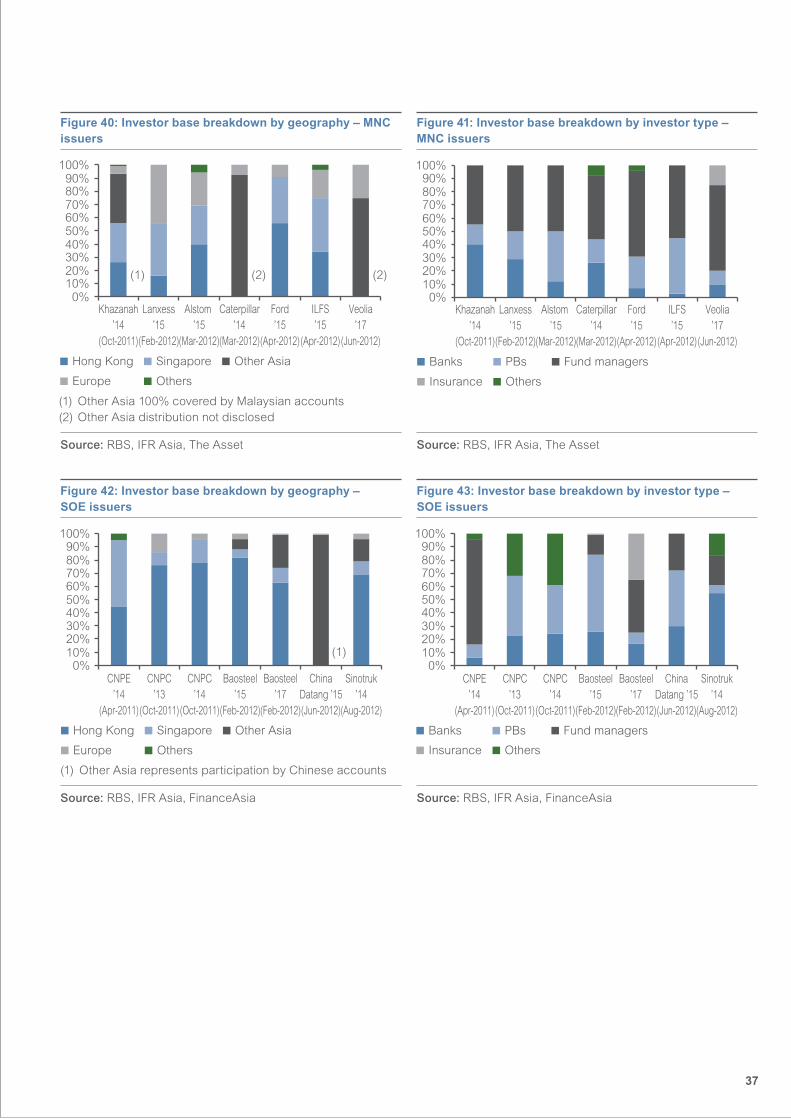
Figure42:Investorbasebreakdownbygeography– SOE issuers
Figure43:Investorbasebreakdownbyinvestortype–SOE issuers
0%10%20%30%40%50%60%70%80%90%
100%
CNPE’14
(Apr-2011)
CNPC’13
(Oct-2011)
CNPC’14
(Oct-2011)
Baosteel’15
(Feb-2012)
Baosteel’17
(Feb-2012)
ChinaDatang ’15(Jun-2012)
Sinotruk’14
(Aug-2012)
Banks PBs Fund managers
Insurance Others
(1) Other Asia represents participation by Chinese accounts
Figure40:Investorbasebreakdownbygeography–MNCissuers
Figure41:Investorbasebreakdownbyinvestortype–MNC issuers
Source: RBS, IFR Asia, The Asset Source: RBS, IFR Asia, The Asset
Source: RBS, IFR Asia, FinanceAsia Source: RBS, IFR Asia, FinanceAsia
(1) (2) (2)
Hong Kong Singapore
Europe Others
Other Asia
0%10%20%30%40%50%60%70%80%90%
100%
Khazanah’14
(Oct-2011)
Lanxess’15
(Feb-2012)
Alstom ’15
(Mar-2012)
Caterpillar’14
(Mar-2012)
Ford’15
(Apr-2012)
ILFS’15
(Apr-2012)
Veolia’17
(Jun-2012)
(1) Other Asia 100% covered by Malaysian accounts(2) Other Asia distribution not disclosed
Banks PBs Fund managers
Insurance Others
Khazanah’14
(Oct-2011)
Lanxess’15
(Feb-2012)
Alstom ’15
(Mar-2012)
Caterpillar’14
(Mar-2012)
Ford’15
(Apr-2012)
ILFS’15
(Apr-2012)
Veolia’17
(Jun-2012)
0%10%20%30%40%50%60%70%80%90%
100%
Hong Kong Singapore Other Asia
Europe Others
CNPE’14
(Apr-2011)
CNPC’13
(Oct-2011)
CNPC’14
(Oct-2011)
Baosteel’15
(Feb-2012)
Baosteel’17
(Feb-2012)
ChinaDatang ’15(Jun-2012)
Sinotruk’14
(Aug-2012)
0%10%20%30%40%50%60%70%80%90%
100%
(1)
37
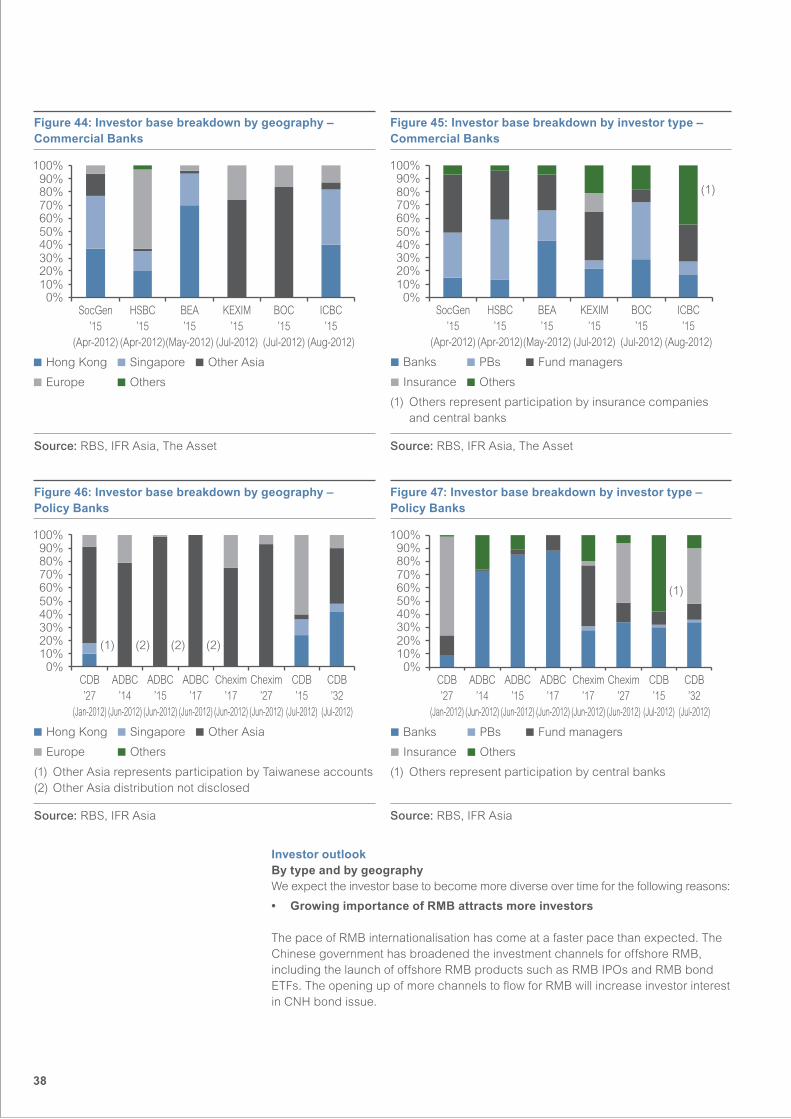
Hong Kong Singapore
Europe Others
Other Asia
CDB’27
(Jan-2012)
ADBC’14
(Jun-2012)
ADBC’15
(Jun-2012)
ADBC’17
(Jun-2012)
Chexim’17
(Jun-2012)
Chexim’27
(Jun-2012)
CDB’15
(Jul-2012)
CDB’32
(Jul-2012)
0%10%20%30%40%50%60%70%80%90%
100%
(1) (2) (2) (2)
Figure46:Investorbasebreakdownbygeography– Policy Banks
Figure47:Investorbasebreakdownbyinvestortype–Policy Banks
Source: RBS, IFR Asia Source: RBS, IFR Asia
(1) Other Asia represents participation by Taiwanese accounts(2) Other Asia distribution not disclosed
(1) Others represent participation by central banks
Investor outlookBy type and by geographyWeexpecttheinvestorbasetobecomemorediverseovertimeforthefollowingreasons:
• GrowingimportanceofRMBattractsmoreinvestors
The pace of RMB internationalisation has come at a faster pace than expected. The Chinese government has broadened the investment channels for offshore RMB, including the launch of offshore RMB products such as RMB IPOs and RMB bond ETFs. The opening up of more channels to flow for RMB will increase investor interest in CNH bond issue.
Figure44:Investorbasebreakdownbygeography–Commercial Banks
Figure45:Investorbasebreakdownbyinvestortype–Commercial Banks
Source: RBS, IFR Asia, The Asset Source: RBS, IFR Asia, The Asset
(1) Others represent participation by insurance companies and central banks
Hong Kong Singapore
Europe Others
Other Asia
SocGen’15
(Apr-2012)
HSBC’15
(Apr-2012)
BEA’15
(May-2012)
KEXIM’15
(Jul-2012)
BOC’15
(Jul-2012)
ICBC’15
(Aug-2012)
0%10%20%30%40%50%60%70%80%90%
100%
SocGen’15
(Apr-2012)
HSBC’15
(Apr-2012)
BEA’15
(May-2012)
KEXIM’15
(Jul-2012)
BOC’15
(Jul-2012)
ICBC’15
(Aug-2012)
0%10%20%30%40%50%60%70%80%90%
100%
Banks PBs
Insurance Others
Fund managers
(1)
0%10%20%30%40%50%60%70%80%90%
100%
CDB’27
(Jan-2012)
ADBC’14
(Jun-2012)
ADBC’15
(Jun-2012)
ADBC’17
(Jun-2012)
Chexim’17
(Jun-2012)
Chexim’27
(Jun-2012)
CDB’15
(Jul-2012)
CDB’32
(Jul-2012)
Banks PBs
Insurance Others
Fund managers
(1)
38

Weexpecttoseeanexpansionoftheseschemes,consideringtheChinesegovernment’s objectives to internationalise RMB in the future. Moreover, as RMB become more internationalised, global fund managers are expected to set up more RMB funds to tap the growth opportunities in China.
• OpeningupofadditionaloffshoreRMBcentres
WithpolicysupportfromtheChinesegovernmentandtheimportanceoftrade,Europe is becoming a significant growth area for the RMB business. The push to make London as the European centre for RMB would further enhance the development of the European liquidity for RMB.
In the Asia time zone, Singapore’s position is further enhanced by its ability to settle offshore RMB trade outside of Hong Kong. As interest continues to grow from other Southeast Asian countries, Singapore’s role for pooling demand from its neighbours will continue.
• Increasingparticipationfromcentralbanks
In recent CNH deals, we have seen an increase in central banks participations. Export-Import Bank of China’s CNH bonds received anchor interests from central bank accounts, while 17% of Sinotruk’s bond was sold to central banks accounts. Moreover, for the first time ever, China’s MOF has set aside a central bank tranche for central banks of countries that have no quota to invest directly in China’s onshore bond market.
WithRMBbecomingmoreinternationalised,weexpectcentralbankstoholdmoreRMB funds for trade settlement and potentially as part of their reserve currencies. Going forward, we expect to see more participation from central banks.
Documentation requirements
In the CNH market, Eurobond-style documentation is well accepted by the investors. For frequent issuers that have MTN programmes in place, it is also common for them to issue through these programmes.
In the early stage of market development, investors were keen to look at a variety of credits and paid less attention on structures and covenants. Most recently, covenants requirements have become more common and customary for unrated and high yield issuers.
39

Listing practice
Reg S is the current normMost of the CNH bonds are not listed, although some of them choose to be listed in Hong Kong, Singapore and Luxembourg for example (see Figure 48 below). For existing listed entities, the listing norms should be simpler – they should be allowed an abridged version of disclosure. For issuers that have their MTN programmes listed, they simply list their bonds accordingly. Hong Kong and Singapore exchanges are the most popular listing venues as the listing process in these exchanges is easy and straight forward.
RegSisthecurrentnorm.IncreasingpenetrationintoUSmarketcreatesneed for 144a deals
Generally speaking, investors are not fixed on listing venue although listing is preferred by certain investors. In terms of secondary market, being listed or not does not affect the liquidity of the bonds, as CNH bonds are traded primarily Over-The-Counter (OTC) in the secondary market. In many situations, the purpose of listing a CNH bond is to enhance the marketability of the bond, as some institutional investors are restricted to investing only in listed securities.
Given the general acceptance of eurobond documentation by the market, Reg S format is the current norm. Reg S limits US investors’ participation in the primary market. Based on our discussions with some US investors, there is a growing interest from them to invest in CNH bonds. However, we have not seen any issuance done through the 144A format. To date, there was only one CNH deal that came with a SEC registration format – America Movil’s CNY1 billion three-year bond. The deal attractedenoughUSonshoreinvestorstotakeup26%ofthedeal.Withgrowinginterest from US investors, we expect to see more deals structured to cater for their demand in the future.
Figure48:Issuancebylistingvenue Figure49:Issuancebylistingvenue
Source: Bloomberg; includes both FI and Corp bonds and CDs issuance but excludes China MOF issuance
Source: Bloomberg; includes Corp bond and CDs issuance but excludes China MOF issuance
89%
4% 3%
1%
Not Listed Hong Kong
Singapore Luxembourg
Frankfurt London
Others
2% 0% 1%
Not Listed Hong Kong
Singapore Luxembourg
Frankfurt London
Others
38%
21%
4% 2% 2%
25%
8%
40

Figure50:Issuancebyrating Figure51:Issuancebyrating
Source: Bloomberg; includes both FI and Corp bonds and CDs issuance but excludes China MOF issuance
Source: Bloomberg; includes Corp bond and CDs issuance but excludes China MOF issuance
More rated issuers coming to the marketIn the early days of the market development, investors primarily focused on the potential FX gains when investing in a CNH product. Investors paid less attention to the underlying credit quality of a bond and in fact were prepared to do all their own credit work. As the RMB appreciation story shifted, investors have begun to pay attention to the credit quality and hence have developed a preference for rated issuers. From statistics, over 50% of the corporate issuers were unrated.
In addition, investors have also developed a preference for the need of covenants for weaker credits or unrated issuers. Maintenance/bank-style covenants were used in most recent transaction for this category of issuers and high yield covenants are less common.
Governing law
The common documentation practice for CNH transactions follows the eurobond process. For most CNH bond issues, Hong Kong or English laws are generally acceptable by investors. Based on our statistical analysis, 43% of corporate issuers used Hong Kong law, followed by 38% who used English law.
AAA AA
A BBB
B NR
79%
1% 1% 7% 7%
5%
A AA
BB BBB
NR
8% 1%
11%
29%
51%
41

Figure52:Issuancebygoverninglaw Figure53:Issuancebygoverninglaw
Source: Bloomberg; includes both FI and Corp bonds and CDs issuance but excludes China MOF issuance
Source: Bloomberg; includes Corp bond and CDs issuance but excludes China MOF issuance
Repatriation rules
MOFCOM vs SAFE routes UseofproceedsandapprovalprocessThe Chinese regulators do not regulate the issuance of CNH bonds by foreign companies. In other words, no pre-approval is needed for the issuance of CNH bonds by offshore institutions. Typically, the use of proceeds as stated in the offering document is kept general.
Since October 2011, PBOC ceased to become the primary regulator to approve repatriation of CNH proceeds. Regardless of the issuers’ nationality of incorporation, the State Administration of Foreign Exchange (SAFE) and Ministry of Finance (MOFCOM) have become the gatekeepers to accept CNH repatriation applications. CNH repatriation generally takes two routes – equity injection and shareholder’s loan.
Under the current regulatory regime, the shareholder’s loan arrangement is regulated by SAFE and there is a prerequisite for the onshore entity in China to have sufficient, unused foreign debt quota. The onshore subsidiary receiving the shareholder’s loan would need to register with local SAFE where the use of proceeds would be discussed.
Based on the existing rules, SAFE would treat repatriation of CNH loan proceeds just like any foreign debt in other currencies such as EUR or USD.
Under existing SAFE regime, long-term loans (one year or shorter), no matter in which currency (ie, in RMB or other foreign currencies like USD or EUR), would consume permanently into the debt headroom. For short-term loans (less than one year) in foreign currencies, the foreign debt quota can be revived once the debt is fully repaid. However, RMB cross border loans, regardless of what loan tenor, the debt quota is utilised once it is drawn down and cannot be revived.
This move is viewed as a means to discourage short-term speculation on RMB. It is worth noting that the rules governing the repatriation of proceeds in RMB are not dissimilar to those governing the repatriation of proceeds in other currencies such as EUR or USD.
Regardless of the issuers’ identity, MOFCOM and SAFE are the gatekeepers for CNH repatriation, by way of equity injection and shareholder’s loan
English Hong Kong
Germany New York
French
83%
14% 2%
1% 0.2%
English Hong Kong
Germany
French
New York
38%
2%
43%
8%
9%
42

MOFCOM is the primary gatekeeper on approving equity-related foreign direct investment (FDI). Under RMB FDI regime, MOFCOM will treat RMB as a preferred currency for FDI. The approval for RMB FDI shall be granted by MOFCOM at the local level, but for the investments involving special industries like micro-finance and leasing or industries under tight control by the government like iron and steel or investments exceeding a certain amount (ie, CNY300 million) must still be approved by MOFCOM at the head office level.
A brief overview of current regulations on CNH bond repatriation is illustrated in the tables below.
Figure54:CNHrepatriationintoonshore
By equity injection By foreign debt / shareholder’s loan By trade settlement
Route • Throughestablishmentofaforeign invested enterprise (FIE) or acquisition of equity in an existing onshore company
• ThroughloansgrantedtoanonshoreFIEbyitsshareholder(s), group affiliate(s) or an offshore financial institution
• Settlementofimport and export of good and services
Approving entities
•MOFCOM • SAFE •Nopre-approvalneeded
Approval process
•MOFCOMisprimarygatekeeperfor approving RMB funds by equity and by debt; the approval for RMB FDI shall be granted by MOFCOM at the local level, but the investments involving special industries (eg microfinance and leasing) or exceeding a specified amount (ie, CNY300 mn) must still be approved by MOFCOM at the head office level
• RegistrationoffundswithPBOC– FIEs receiving RMB investment should register with PBOC local branch and open RMB capital accounts with a settlement bank for remitting the upfront fees and capital contribution under RMB FDI
• Cross-borderforeigndebtarrangementisprocessed by local SAFE where the onshore entity is incorporated
• Pre-requisitefortheonshoreentitytohavesufficient foreign debt quota for incremental borrowings from its overseas parent
• Foreigndebtquotaispre-determinedand calculated as the gap between total investment and registered capital. Actual amount of funds to be raised is the unused foreign debt quota, free from any outstanding foreign debt
• CrossborderRMBloans,regardlessoftheir terms, consume permanently into the headroom, ie, the headroom will not be restated even after the debt has been repaid
• PBOCalongwithother competent authorities announce that all parts of China are opened for RMB settlement for cross border trades
Use of repatriated proceeds
• FundsrepatriatedintoChinaunderRMBFDImustnotbeinvestedinsecuritiesandfinancial derivatives (unless approved as a strategic investor of listed company), wealth management products, real estate (other than for own use) or extend entrustment loans
• Notapplicable
Approval timeframe
• 3-6months* • 4-8weeks* • Notapplicable
*Approvalprocessdependsonthesufficiencyofforeigndebtquotasoftheonshoreentity,aswellastheindustryornatureofinvestment the proceeds would be used for.
43

Other RMB schemesRMBFDIandRQFIIAs announced by Chinese Vice Premier Li Keqiang during his visit to Hong Kong in August 2011, the Chinese government has created more channels for CNH funds to flow back into China. The RMB FDI channel is one such channel which allowed foreign enterprises to use CNH for foreign direct investment. This has opened a new door for RMB lending as customers may now also borrow RMB funds for investment in China. The implementation of RQFII also provided more channels for institutions to invest its CNH deposits in China. Going forward, we would expect the continued development of CNH usage channels will allow for easier repatriation of funds back into China.
Market Trends
Since August 2011, CNH bond yields have been on an upward trend, shrinking their differences with onshore bond yields. MOF’s sovereign bonds in the offshore market trade at a slight discount in yields to the onshore issues. The discount currently is much less than what it was a year ago (see Figure 55). The surge in yields of CNH bonds reflects the investors’ reassessment of RMB appreciation prospect, greater emphasis from investors on issuers’ credit quality and the growing supply of new CNHbonds.WehavealsoseenanincreaseinaverageyieldsofChinesebanks’CNH CDs (see Figure 56).
Increased channels for funds to be moved to China and elsewhere will allow for easier CNH repatriation
Figure55:HistoricaltrendsonoffshoreCGBbondsvsonshore CGB bonds (%)
Figure56:TrendsonCDissuanceyieldsforChinaConstruction Bank HK (%)
Source: Bloomberg Source: RBS
0
1
2
3
4
5
’12 ’13 ’14 ’15 ’16 ’17 ’18 ’19 ’20
Offshore CGB Curve Onshore CGB Curve
Offshore CGB Curve (Aug11)
Onshore CGB Curve (Aug11)
CCB 1-yearCD yield
CCB 2-yearCD yield
CCB 3-yearCD yield
0.5
1.0
1.5
2.0
2.5
3.0
3.5
Jun11
Aug11
Oct11
Dec11
Feb12
Apr12
Jun12
Aug12
44

Figure57:CNHbondyields(3-year)perratingcategory(%)
Source: Bloomberg
According to our analysis, yields for three-year CNH bonds across the rating spectrum have widened by an average of 1.5- 2.0% since January 2011 (see Figure 57), partly due to the softening of the RMB appreciation. In the onshore market, concerns over China’s economic slowdown have driven down the onshore bond yields. These factors have caused the price premium of the CNH bonds and onshore bonds to converge.
Figure58:OffshoreCDBbondsvsonshoreCDBbonds(%)
Source: Bloomberg, RBS
The offshore CNH bond market has now emerged as another platform for RMB funding for Chinese FIs and corporates. The onshore market, albeit allowing greater market access than before, still has certain regulatory restrictions that continue to make the offshore market attractive in the short term. The figure below illustrates the onshore and offshore yield curves of CDB. There exists a larger price premium of the CNH bonds to onshore bonds at the shorter end of the curve than the longer end of the curve. However, we expect the spread between the offshore and onshore bond yields to further narrow, considering the possibility that the CNY will become fully convertible in the longer term.
A
Trendline[A 3y)]
BB
Trendline[BB (3y)]
BBB
Trendline[NR 3y)]
NR
Trendline[BBB 3y)]
0123456789
10
Sep10
Jan11
Mar11
May11
Jul11
Sep11
Nov11
Jan12
Mar12
May12
Jul12
Nov10
Onshore CDB Yield Curve Offshore CDB Yield Curve
2.5
3.0
3.5
4.0
4.5
5.0
'15 '16 '17 '18 '19 '20 '21 '22 '23 '24 '25 '26 '27 '28 '29 '30 '31 '32
45

China employs a two-prong approach in globalising the franchise of the offshore deliverable CNH market: using Asia as a launch pad at the private sector level; and engaging G7 countries, BRICS partners (Brazil, Russia, India and South Africa) andmultilateralagenciesbilaterallyandonmultilateralplatforms.Wediscussbothapproaches below.
Building on Asia’s strengths
Asia’s strengths come through trade and savings which together amassed for the region a huge stockpile of foreign reserves. The Fed’s quantitative easing has further enriched the region’s reserves positions in more recent years. Hence, not only for the reason of geographical proximity, Asia is the natural starting point for China to promote the use of the CNY as a trade settlement currency and for reserves diversification. Amid its strong trade growth, the region has seen a gradual increase in intra-regional trade in the past one to two decades after China switched to an export-growth model in the early 1990s.
• OftheUSD10.5trillionstockofworldforeignreserves, USD6.5 trillion (62% of world total) are held by central banks in Asia within which China holds nearly at USD3.24 trillion (31% of world total). China’s reserves have grown more than 10 times in the past 10 years. Over the same period, reserves for the rest of the region excluding Japan have grown by more than 6.5 times (see Figure 59).
• China’sshareofworldtradehasrisenfrom3.5%atthestartofthismillenniumto10.5%. During the same period, US’s share of world trade has dwindled down from 15% to 10.7% (see Figure 60). China has been the primary force behind Asia’s increasing intra-regional trade dependency.
• MorethanaquarterofChina’sexternaltradeiswithAsiaex-Japan, well above its trade with EU (14%), Japan (12%) and the US (8%). Vice versa, the region’s dependence on China is also significant at 21% (see Figures 61 and 62).
• Asia’stradewithChinahasdoubled in the past 10 years at the expense of US and Japan as Asian manufacturers relocate their production bases to China which provides a vast labour pool and domestic consumer market.
Globalising the Franchise
A two-prong approach
46

Figure59:Breakdownofworldforeignreserves(%)
Figure61:BreakdownofChina’stotaltrade(%)
Figure60:Marketshareofworldtrade-ChinavsUS,EUandJapan(%)
Figure62:BreakdownofAsia9’s(exJapan,China)totaltrade (%)
Source: Bloomberg
Source: CEIC
Source: IMF
Source: CEIC
As Asian countries’ reserves have grown well above comfortable levels, the need to seek greater reverses diversification has grown. After going through a string of banking and sovereign crises in the developed markets, Asian countries turn inwards in the same way that their trade has become more intra-regional. Consequently, although the CNY does not qualify as a reserve currency because it lacks full convertibility as defined by the International Monetary Fund (IMF), many central banks have started to diversify reserves into the CNY. Vice versa, China has also diversified into many other Asian regional currencies.
100
China Japan Rest of Asia World ex Asia
0102030405060708090
0303040405050606070708080909101011111212
US EU JP CN
02468
1012141618
Jan 00 Jan 02 Jan 04 Jan 06 Jan 08 Jan 10 Jan 12
05
1015202530354045
Asia ex Japan Japan US EU
June 2012 2005 1993 May 2012 2005 1993
0
5
10
15
20
25
China Japan US UK+Ger
47

Figure63:AsiavsotherEMregionalbondmarkets,splitbylocalandforeigncurrency(USDtrn,%split)
Source: BIS, RBS
• HoldingCNYinexcessreserves: Malaysia was the first central bank to openly announce that it was adding CNY to its FX reserves in 2010. Since then, several central banks such as Korea, Thailand, Chile, Saudi Arabia, and Nigeria have all diversified or expressed interest in diversifying their reserves into CNY. In December 2011, China signed a pact with Japan to promote the use of their currencies for bilateral trade and investment flows which came with a CNY65 billion investment quota for the latter to invest in China’s domestic bond market.
• Likewise,Chinahasalsodiversifieditsreservesintotheregionalcurrencies: For instance, China’s purchases of Korea’s domestic bonds grew six-folds in the past 2.5 years, increasing its market share of the KTB market from virtually nothing to 3.1%.
Asia’sdeepeningbondmarkets. Enabling this push towards intra-regional reverses diversification is the rapid deepening of the region’s bond markets which have grown by more than six-fold in the past decade. This is at a much faster rate than that in other emerging markets regions (see Figure 63). Amid this growth, there was a greater push by Asian issuers towards their own currency denominations, away from hard currency denominations, notably USD. 92% of Asia’s bond markets is now denominated in local currency versus 81% in Latin America and only 50% in EasternEurope,MiddleEastandAfrica.Withintheregion,itisinterestingtonotethatthe country with the highest proportion of local currency bond issuance is China by as much as 25 times over its hard currency bond issuance (see Figure 64). A key reason for the shift from hard currency to local currency bond issuance in Asia is the governments’ conscious efforts to diversify from external borrowing in the aftermath of the 1997/98 Asian FX devaluation crisis.
Local currency Foreign currency
88%
92%
64%
80%
51% 51% 72% 47%0
1
2
3
4
5
6
7
2000 2011Asia
2000 2011Latin America
2000 2011Eastern Europe
2000 2011Mideast & Africa
48

Figure64:Asiancountries’bondmarkets,splitbylocalandforeigncurrencydenominations (% of GDP)
Source: BIS, CEIC
Global vs regional hubs
Understanding the region’s strengths is not good enough. China is clearly not waiting for things to take its natural course. Having given Hong Kong a good five year head start, China is turning now to other strategic regional partners as well as further afield toLondontolaunchitsnextphaseofCNYinternationalisation.Webelieveeveryinternational partner has been selected strategically to perform different roles in the CNY internationalisation game plan, as we will explain below.
SingaporeassecondCNYclearingcentreIn July 2012, China and Singapore jointly announced that the world’s second CNY central clearing line will be operated out of Singapore. This was the cornerstone of a Free Trade Agreement (FTA) that the two countries had signed. The bank running the centre will be a Singapore branch of a Chinese bank, which will be granted a full banking licence by the Monetary Authority of Singapore. Prior to the announcement, in May 2012, the MAS has said that full banking licences from then on would only be granted in future to banks from countries which have FTA with Singapore.
Given Singapore’s strong role as a regional trade partner – Singapore’s contribution of intra-Asia trade is by far the highest at 27%, China is fully aware that the CNY clearing line will be utilised by not only Singapore but by Singapore’s trade partners. This is a great way for China to promote the use of CNY with “third country” trade partners, that is countries which might not directly trade with China. If so, Singapore will pose strong competition on Hong Kong for the offshore CNY business. The only other condition is that Singapore’s CNY clearing quota has to be large enough.
Foreign currency Local Currency
0%
20%
40%
60%
80%
100%
120%
2000 2011 2000 2011 2000 2011 2000 2011 2000 2011 2000 2011 2000 2011 2000 2011 2000 2011 2000 2011
China SouthKorea
India Taiwan Malaysia Thailand Singapore Indonesia Hong KongSAR
Philippines
49

Hong Kong-London partnershipFully aware of the competition that Singapore may pose on Hong Kong, China has engaged London to partner Hong Kong in promoting the CNY business globally and outside of Asia. To quote the UK Chancellor of the Exchequer, George Osborne, on 14 June 2012, “London is not in competition with Hong Kong, it is a complement – providingaWesternhubforRMBbusiness”.
By the end of 2011, the volume of RMB deposits in London had already reached CNY109 billion, of which CNY35 billion are non-bank customer deposits. London currently accounts for 26% of the global offshore CNY FX spot market.
Self-service centres in Taipei, Tokyo, SydneyThen there are what we believe will be more self-service centres in Taipei, Tokyo, and Sydney where negotiations are underway. The justifications are on various grounds:
• AllthreecountrieshaverelativeimportancetoChinaastradepartners
• ItisrelativelymoredifficulttogetthesestrategictradepartnerstoconsiderCNYas trade settlement currency (Japan and Taiwan)
• Timezonedifferences(SydneycapturestheclosinghoursoftheAmericaswhichcan probably be considered the last frontier for the CNY internationalisation).
On 31 August 2012, Taiwan and China announced the signing of a CNY swap agreement which will come with a direct CNY clearing line to be operated by a Chinese bank in Taipei. Unlike other CNY swap lines which act mainly as standby facilities or provide investment quotas for the recipient central banks, Taiwan’s CNY swap line will be a “live” one to support CNY clearing with China. In other words, the CNY swap quota will be used directly as the clearing quota. Because of their closed domestic market, Taiwanese banks currently cannot take delivery of CNH from Hong Kong. Hence, it was necessary for China to provide a direct clearing line for Taiwan.
ShanghaiastheultimateglobalCNYpricingcentreIn a blueprint unveiled in February 2012, Shanghai has set 2015 as its goal to become the global pricing centre for all CNY financial products offshore and onshore. By 2020, the city aims to become an international financial centre. Hong Kong is named as Shanghai’s twin city in building its financial hub. Shanghai’s advantage is its direct access to the PBOC while Hong Kong has the international financial network. If the CNY is not fully convertible by 2015, Shanghai can set up an offshore financial centre that serves both onshore and offshore market participants.After Shanghai becomes the global CNY pricing centre, Hong Kong’s role in the twin-city concept may evolve into one serving China for the non-CNY market activities. By that time, Shanghai may find London a more strategic partner to continue globalising its CNY franchise business.
50

If inclusion into the SDR basket entails greater financial contributions to the IMF, China has willingly done so
• Theblueprintalsorevealstheintentiontoembarkonpolicyreforms. It sets two specific targets on FX and interest rate fixing for the global CNY markets:
− On FX, to get the offshore market to adopt the mid-pricing fixed by the PBOC every morning
− On interest rates, to make Shibor the benchmark for CNY-denominated fixed income papers globally
This explains the recent operational changes in the PBOC’s exchange rate and monetary policy management (see sections on FX Market and Interest Rate Market).
Multilateral platforms
Webelieve2015wasselectedasthisinterimgoalbecausetheIMFisduetoreviewits Special Drawing Rights (SDR) basket composition at the end of that year. If the CNY gets included in the SDR, it would be hugely boost its odds to becoming a world reserve currency.
There are costs for entering the global arena which China has willingly played its part. In June 2012, China pledged USD43 billion to help the IMF double its lending capacity which has been grossly depleted by the European sovereign crisis.
Becoming an international aid donor would also serve China some good as it can gradually get recipient countries to accept aid in CNY denominations. In this regard, being a SDR component currency will help encourage recipient countries to accept CNY aid.
51

Appendix A
Date 2007
January Chinese FIs allowed to issue CNH bonds in Hong Kong by PBOC
8 June Details of issuing CHN bonds by Chinese FIs were announced by PBOC and NDRC
25 June China Development Bank (a Chinese policy bank) issued first CNH bond
12 September Bank of China, the first issuer of Chinese commercial bank
2008
8 December Corporates with substantial business in China were allowed to issue CNH bonds in Hong Kong by State Council
2009
25, 29 June HSBC and Bank of East Asia (PRC-incorporated foreign banks) issued CNH bonds
6 July PRC commenced a pilot scheme for CNY cross border trade settlement in 5 Chinese cities with Hong Kong, Macau and ASEAN nations
28 September China’s Ministry of Finance issued CNH bonds (first sovereign issuer)
2010
11 February Issuer restrictions fully lifted to abide by Hong Kong regulations. China’s approval is only needed if proceeds would be remitted into the country
22 June Trade settlement scheme was expanded to allow settlement with all nations and eligible firms were selected from 20 instead of 5 provinces in China
19 July Limits on Hong Kong-based corporates converting CNY lifted; types of CNY investment products fully liberalised, including CDs, CNY loans; CNY central clearing system set up
6 July CITIC Bank International (first issuer of CNH certificate of deposits)
7 July Hopewell Highway (first non-Chinese, non-FI issuer)
19 August McDonald's (first multinational corporation issuer )
1 October PBOC expanded CNY clearing centres, allowing foreign banks to clear CNY with any Chinese-incorporated banks
18 October Asian Development Bank (supranational, longest-dated CNH bond and also first CNH issue traded on the Hong Kong Stock Exchange)
30 November First tendering of China MOF’s sovereign bonds through the Central Money Markets Unit
9 December Galaxy Entertainment (first high yield CNH bond issuer)
10 December VTB Bank (a government-owned Russian bank, first non-Asia emerging market issuer)
2011
30 January PBOC launched pilot programme to allow qualified domestic firms to use CNY for outward/overseas direct investments (without foreign currency conversion)
27 June HK Treasury Markets Association launched USD/CNH daily spot fixing to provide a reference rate for pricing of CNH products
17 August Chinese-incorporated non-FIs allowed to issue CNH bonds; Issuance of sovereign bonds on a regular basis in Hong Kong; Extending the RMB trade settlement scheme to nationwide in China
12 October MOFCOM and PBOC issued new circulars governing the remittance of offshore RMB into mainland China for FDI purposes
24 November Baosteel (first direct issue by a Chinese corporate)
Chronology of Regulatory Changes and Events
52

Date 2011
16 December RQFII launched on a trial basis, allowing Hong Kong investment firms to invest offshore RMB funds in onshore securities market with a CNY20 billion quota, subject to a condition that minimum 80% of the quota to be allocated to bonds
2012
3 January HK TMA launched daily fixing on CNH Hibor
11 January NDRC granted approval for 10 domestic banks to issue CNH bonds with a combined CNY25bn quota
17 January HKMA increased limit for CNH net open position from not exceeding 10% to not exceeding 20% of a bank’s total RMB assets and liabilities
13 January China Development Bank (first issuer to offer the longest tenor CNH bond – 15-year; also the first issuer to adopt dual issuance channels (CMU and bookbuilding)
1 February America Movil (first Latin America issuer, first SEC Reg CNH issue sold to onshore US investors)
9 February HKMA relaxed rules on inclusion of RMB liquid assets in the calculation of statutory liquidity ratio. The revised regulation is expected by the market to increase exposure on RMB assets
14, 21 March Ford (first MNC high yield issuer) and HNA Group issued CNH bonds (first CNH bond with onshore parent guarantee since change in regulation)
4 April China announced the expansion of investment quota to both the QFII and RQFII (USD80bn from USD30bn for QFII and CNY70bn from CNY20bn for RQFII)
13 April ILFS Transportation (first CNH issue from India structured with India EXIM guarantee)
14 April PBOC widened USD/CNY onshore intra-day trading band from +/-0.5% to +/-1.0%
25 April NDRC has approved 4 state-owned enterprises to issue CNY18.5bn of CNH bonds in HK:
The companies are China Minmetals, Guangdong Nuclear Power, Huaneng Power, Datang Power (second batch of non-financial companies allowed to issue CNH bonds, following Baosteel China)
2 May NDRC issued a Circular which sets forth a formal approval process for onshore non-financial corporates to issue RMB bonds in HK
1 June Tokyo interbank market started directly quoting the CNY/JPY cross rate
14 June HKMA announced new arrangements for providing RMB liquidity: Authorised Institutions in Hong Kong were allowed to use RMB liquidity ratio to replace the existing RMB risk limit; and a one-week term RMB funding facility were available to them from the HKMA (with eligible collaterals) to ease short-term RMB liquidity needs. These expanded the asset range which can be computed in RMB liquidity
21 June Veolia issued CNH bond (longest maturity and largest size achieved by a BBB+ non-Asian issuer in the CNH market; first corporate CNH bond to be listed in the Euronext Paris)
29 June RMB ETF allowed to be listed in both mainland China and Hong Kong
6 July Second offshore CNY clearing centre to be located in Singapore
14 July PBOC issued circular clarifying the details of RMB FDI, which supplements the rules released by MOFCOM and PBOC in October 2011
25 July HKMA allowed non-Hong Kong residents to open CNY deposit accounts in Hong Kong with no daily conversion limits
26 July China Development Bank issued the longest dated tenor CNH offering – 20-year
27 July CSRC issued rules to lower the track record and assets under management requirements for QFII applicants and allows QFIIs to open multiple securities accounts with different securities companies as long as the total number of accounts corresponds to the special RMB account approved by SAFE (while previously a QFII could only open one securities account with one securities company). QFII license holders were also allowed to invest directly in the onshore interbank bond market and private placement bonds issued by small and medium-sized enterprises and hold up to a 30-percent stake in a listed company, up from the previous 20% stake cap.
22 August HKEx announced that it will introduce the first deliverable CNY currency futures on 17 September
Source: Bloomberg, NDRC, PBOC, HKMA
53

Cross-border Payments on Current Account
The tables below set out the main regulatory considerations relevant to a corporate entity trading with mainland Chinese companies or through its own China-resident operating entity. The information is by no means exhaustive and should be viewed merely as an introductory overview, which can be followed up with more detailed discussions as appropriate.
Offshore to Mainland China
Payment Type Payment Currency Regulatory Considerations
Payment for goods Foreign currency Payment to exporters permitted
Payment must go through a transit account
Exporter to provide documentary evidence of trade transaction
RMB Payment to exporters permitted
Exporter to provide documentary evidence of trade transaction
If exporter elects to receive funds into an offshore RMB account, separate reporting to the PBOC is required
Offshore participant banks also need to take approaches to monitor the trade background
Payment for services
Foreign Currency Payment to service providers permitted
Service provider to provide documentary evidence of service transaction
RMB Payment to service providers permitted
Service provider to provide documentary evidence of service transaction
Inter-company loans (Resident borrowing from a non-resident shareholder)
Foreign Currency Loans to a FIE (Foreign Invested Enterprise) must be registered with SAFE
Maximum borrowing amount permitted is calculated as Total Investment less Registered Capital where:
Total Investment = total capital of borrower including working capital
Registered Capital = capital subscribed and registered with MOFCOM
Maximum permitted gearing (RC/TI) is: 70% if RC ≤ USD 3m; 50% if 3m > RC ≤ 10m, 40% if 10m > RC ≤ 30m; 33% if RC > 30m
RMB Permitted, but requires prior registration with SAFE
PBOC approval is no longer required
Maximum permitted gearing same as for foreign currency loans
Capital infusion Foreign currency The amount of a FIE’s registered capital and any subsequent increases must be approved by MOFCOM (can take months)
SAFE processes equity injections based on MOFCOM’s approvals
RMB MOFCOM approval required
PBOC governs account management (application made via domestic settlement bank) and SAFE filing procedures must also be followed
Appendix B
54

Mainland to Offshore
Payment Type Payment Currency Regulatory Considerations
Payment for goods Foreign currency Payments from importers permitted
Importer to provide documentary evidence of trade transaction
RMB Payments from importer permitted
Importer to provide documentary evidence of trade transaction
Payment for services
Foreign currency Payments from service recipients permitted
Service recipient to provide documentary evidence of service transaction
RMB Payments from service recipients permitted
Service recipient to provide documentary evidence of service transaction
Dividends/profit repatriation
Foreign currency Permitted, subject to sufficient retained earnings/reserves and fully paid up capital
Supporting documentation required
Withholdingtaxapplicablewithpotentialforreductionundertaxtreaties
RMB Permitted, subject to sufficient retained earnings/reserves and fully paid up capital
Supporting documentation required. The amount payable should also be governed by the quota in SAFE FDI system and the actual payments to be filed through FDI system
Withholdingtaxapplicablewithpotentialforreductionundertaxtreaties
Inter-company management fees, service fees, royalties
Foreign currency Transfer pricing arrangements will be monitored by Tax Bureau
Tax certificate generally required for most payments under service agreements (not only inter-company related fees)
SAFE approval is delegated to designated FX banks. Supporting documentation required
RMB Transfer pricing arrangements will be monitored by Tax Bureau
Tax certificate generally required for most payments under service agreements (not only inter-company related fees)
SAFE approval is delegated to designated FX banks. Supporting documentation required
Inter-company loans (Resident lending to a non-resident)
Foreign currency Restricted and subject to SAFE approval
RMB Restricted and subject to SAFE approval
55

List of Abbreviations
Abbreviation Full name
AIs Authorised Institutions
ASEAN Association of Southeast Asian Nations
BOC (HK) Ltd Bank of China (Hong Kong) Limited
CAGR Compound Annual Growth rate
CCS Cross Currency Swap
CD Certificate of Deposit
CGB CNH Government Bonds
CNH CNY Deliverable
CNY Chinese Yuan
Corp Corporates
DF Deliverable Forward
EM Emerging Market
ETF Exchange-traded Fund
FDI Foreign Direct Investment
FI Financial Institution
FIE Foreign Invested Enterprise
FTA Free Trade Agreement
FX Foreign Exchange
Libor London Interbank Offered Rate
Hibor Hong Kong Interbank Offered Rate
IPO Initial Public Offering
IRS Interest Rate Swap
KYC Know-Your-Customer
MNC Multinational Corporation
ND Non-deliverable
NDF Non-deliverable Forward
NDS Non-deliverable Swap
NOP Net Open Position
O/N Overnight
OMO Open Market Operations
RMB Renminbi
RRR Required Reserve Ratio
RTGS Real Time Gross Settlement
SDR Special Drawing Rights
Shibor Shanghai Interbank Offered Rate
SOE State-owned Enterprises
SLR Statutory Liquidity Ratio
T/N Tomorrow-next
YTD Year-To-Date
Appendix C
56

Appendix DList of Government Agencies
Abbreviation Full name
BIS Bank for International Settlementswww.bis.org/
BOK Bank of Koreawww.bok.or.kr/eng/index.jsp
CMU Central Moneymarkets Unitwww.cmu.org.hk
CSRC China Securities Regulatory Commissionwww.csrc.gov.cn/pub/csrc_en/
Fed Federal Reservewww.federalreserve.gov/
HKEX Hong Kong Exchanges and Clearing Limitedwww.hkex.com.hk/
HKMA Hong Kong Monetary Authoritywww.hkma.gov.hk/
HKSAR Hong Kong Special Administrative Regionwww.gov.hk/en/
HKTMA Hong Kong Treasury Markets Associationwww.tma.org.hk/
IMF International Monetary Fundwww.imf.org/
ISDA International Swaps and Derivatives Associationwww.isda.org/
MAS Monetary Authority of Singaporewww.mas.gov.sg
MOF Ministry of Financewww.mof.gov.tw/engweb/
MOFCOM Ministry of Commerceenglish.mofcom.gov.cn
NDRC National Development and Reform Commissionen.ndrc.gov.cn/
OPEC Organisation of the Petroleum Exporting Countrieswww.opec.org
PBOC People’s Bank of Chinawww.pbc.gov.cn/publish/english/963/index.html
PRC People’s Republic of Chinaenglish.gov.cn/
QFII Qualified Foreign Institutional Investorswww.csrc.gov.cn/pub/csrc_en/affairs/
SAFE State Administration of Foreign Exchangewww.safe.gov.cn
57

This material has been prepared by The Royal Bank of Scotland plc and/or The Royal Bank of Scotland N.V. (together “RBS”). It has been prepared for and provided to the recipient (the “Recipient”) for information purposes only. This material should not be distributed, directly or indirectly, in any jurisdiction in which the distribution of these materials would be prohibited. This material is not intended as an offer or the solicitation of an offer to buy or sell any securities.
This material may or may not lead to transactions being entered into between RBS and the Recipient. Unless and until both RBS and the Recipient agree to, and sign formal written contracts, it is not intended that either RBS or the Recipient are, or will be, bound by any of the proposed terms and conditions. This material is confidential and is intended for use only by the Recipient and its professional advisers and remains the property of RBS. It should not be reproduced, redistributed, passed on to any other person or published, in whole or in part, for any purpose without the consent of RBS and must be returned on request to RBS and any copies thereof destroyed. Nothing in this document should be construed as legal, tax, accounting or investment advice or as an offer by RBS to purchase securities from or sell securities to the Recipient, or to underwrite securities of the Recipient, or to extend any credit or like facilities to the Recipient, or to conduct any such activity on behalf of the Recipient. RBS makes no representations or warranties with respect to the material, and disclaims all liability for any use the Recipient or its advisers make of the contents of the material.
Whilsttheinformationinthismaterialisbelievedtobereliable,ithasnotbeenindependentlyverifiedbyus.Wemakenorepresentationor warranty (express or implied) of any nature, nor do we accept any responsibility or liability of any kind, with respect to the accuracy or completeness of the information in this material. The Recipient of this document should make its own independent evaluation of any transaction and of the relevance and adequacy of the information in this material and should make such other investigations as it deems necessary to determine whether to participate in any transaction. This shall not, however, restrict, exclude, or limit any duty or liability to a person under any applicable laws or regulations of any jurisdiction which may not lawfully be disclaimed.
Any views or opinions expressed in the material (including statements or forecasts) constitute the judgement of RBS as of the date indicated and are subject to change without notice. RBS does not undertake to update this document. The Recipient should not rely on any representations or undertakings inconsistent with the above paragraphs. This material is prepared for general circulation by RBS and does not have regard to the specific investment objectives, financial situation and the particular needs of any particular recipient. Past performance is not indicative of future results. Products and services are available only in those jurisdictions where they may be legally offered. Changes may be made to products and services at any time without prior notice to you.
RBS and its affiliates, connected companies, employees or clients may have an interest in the securities or other financial instruments or their related derivatives of the type (“Instruments”) described in the material. This may include dealing, trading, holding, acting as market-makers in such Instruments and may include providing general banking, investment banking, credit and other financial services to any company or issuer of securities or financial instruments referred to herein. RBS may also have acted as a manager or co-manager of a public offering of such Instruments, and may also have an investment banking relationship with any companies mentioned in this material.
The Royal Bank of Scotland plc and The Royal Bank of Scotland N.V. are authorised agents of each other in certain jurisdictions.
© 2011 The Royal Bank of Scotland plc. All rights, save as expressly granted, are reserved. The DAISY Device logo, RBS, [BUILDING TOMORROW][1]andTHEROYALBANKOFSCOTLANDaretrademarksofTheRoyalBankofScotlandGroupplc.Thiscommunicationisforthe use of intended recipients only and the contents may not be reproduced, redistributed, or copied in whole or in part for any purpose without The Royal Bank of Scotland plc’s prior express consent.
Trading Strategy
WoonKhienChia+65 6518 [email protected]
Chiranjiv Sawhney+65 6518 [email protected]
Debt Capital Markets
Augusto King+852 3961 [email protected]
Zoie Teng+852 3961 [email protected]