cmi: an information-theoretic contrast measure for ... · cmi: an information-theoretic contrast...
TRANSCRIPT
CMI: An Information-Theoretic Contrast Measurefor Enhancing Subspace Cluster and Outlier Detection
Hoang Vu Nguyen◦ Emmanuel Muller◦• Jilles Vreeken• Fabian Keller◦ Klemens Bohm◦
◦ Karlsruhe Institute of Technology, Germany • University of Antwerp, Belgium{hoang.nguyen, emmanuel.mueller, fabian.keller, klemens.boehm}@kit.edu {emmanuel.mueller, jilles.vreeken}@ua.ac.be
Abstract
In many real world applications data is collectedin multi-dimensional spaces, with the knowledgehidden in subspaces (i.e., subsets of the dimen-sions). It is an open research issue to selectmeaningful subspaces without any prior knowl-edge about such hidden patterns. Standard ap-proaches, such as pairwise correlation measures,or statistical approaches based on entropy, donot solve this problem; due to their restrictivepairwise analysis and loss of information in dis-cretization they are bound to miss subspaces withpotential clusters and outliers.In this work1, we focus on finding subspaces withstrong mutual dependency in the selected dimen-sion set. Chosen subspaces should provide a highdiscrepancy between clusters and outliers and en-hance detection of these patterns. To measurethis, we propose a novel contrast score that quan-tifies mutual correlations in subspaces by con-sidering their cumulative distributions—withouthaving to discretize the data. In our experiments,we show that these high contrast subspaces pro-vide enhanced quality in cluster and outlier de-tection for both synthetic and real world data.
1 IntroductionClustering and outlier detection are two key data miningtasks. They are widely used, such as in bioinformatics, fordetecting functionally dependent genes, in marketing, forcustomer segmentation, in health surveillance, for anomalydetection, and so on. For these techniques to work well,some kind of dependency between the objects in a givendata space is required, i.e., high similarity between clus-tered objects and high deviation between outliers and theresidual data distribution.
Obviously, detecting clusters and outliers in uniformlyrandom distributed spaces, e.g., considering a data spacewith independent dimensions, does not make sense at all.With more and more dimensions such effects tend to hinderdata mining tasks, which is widely known as the “curse ofdimensionality” [Beyer et al., 1999]. Not just a fringe theo-retical case, we observe this effect in practice, for example,in gene expression analysis where each gene is describedwith very many expression values under different medical
1This work has been published in Proc. SIAM InternationalConference on Data Mining (SDM 2013) [Nguyen et al., 2013]
treatments. In general, we observe a loss of contrast be-tween clusters and outliers in the full space (all given di-mensions) of the data, while the meaningful knowledge ishidden in subspaces (i.e., subsets of the dimensions) thatshow a high dependency between the selected dimensions.
Recently, more attention has been placed on subspaceclustering [Agrawal et al., 1998; Aggarwal et al., 1999; Se-queira and Zaki, 2004; Muller et al., 2009a] and subspaceoutlier detection [Aggarwal and Yu, 2001; Kriegel et al.,2009; Muller et al., 2011]. Both of these paradigms detecta set of relevant dimensions for each individual cluster oroultier. Hence, they are able to detect meaningful patternseven if only few dimensions are relevant for the individualpattern. However, they all face a common problem in theselection of subspaces. Each of the techniques re-inventsa very specific subspace selection scheme according to theunderlying cluster or outlier model. Only few techniqueshave focused on general solutions to the problem of sub-space search designed for clustering [Cheng et al., 1999;Baumgartner et al., 2004] or outlier mining [Ye et al., 2009;Keller et al., 2012]. In this work, we follow this generalidea of subspace search. We aim at a further generalizationfor the selection of relevant subspaces.
More specifically, we aim at selecting high contrast sub-spaces that potentially provide high contrast between clus-tered and outlying objects. Due to its generality this prob-lem statement poses several open questions. First, it is un-clear how to measure the contrast of a given set of dimen-sions. Solutions based on correlation analysis and entropymeasures seem promising but show major drawbacks w.r.t.pairwise analysis, discretization, and the empty space prob-lem, as we will explain later. Second, one requires robuststatistics to capture the mutual dependence of dimensions.Existing solutions performing a pairwise analysis miss im-portant higher-order dependencies that can only be iden-tified when multiple dimensions are considered together.Finally, a subspace selection has to be performed in an ef-ficient manner in order to scale with the increasing numberof dimensions, i.e., an exponential search space.
We tackle all three of these challenges by our contrastmeasure. It is independent of any cluster or outlier modeland purely based on the statistical dependence of data ob-served in a multi-dimensional subspace. Furthermore, itis directly applicable to continuous data and does not fallprey to the information loss by previous discretization tech-niques. It is designed to capture mutual dependencies, andthus, quantifies the subspace deviation from the conditionof uncorrelated and independent dimensions: “The largerthe deviation from the mutual independence assumption,the higher the contrast of a subspace.” Hence, we instan-tiate our measure based on the analysis of cumulative dis-
tributions in different subspaces. Cumulative distributionshave the advantage that they can be computed directly onempirical data. Furthermore, we propose a scalable pro-cessing scheme to select high contrast subspaces. Due tothe exponential search space we rely on an approximativesolution based on beam search.
Overall, our contributions are as follows: (a) a set of ab-stract quality criteria for subspace search based on contrastanalysis, (b) our multi-variate contrast measure based oncumulative distributions for continuous data, (c) a scalablesubspace search method applying our contrast measure forsubspace selection, and (d) quality enhancement for bothsubspace clustering and subspace outlier mining as a resultof high contrast.
2 Related WorkPairwise measures and space transformations. First,we discuss approaches that assess dependencies betweendimensions. Spearman correlation and modern vari-ants [Reshef et al., 2011] are aimed at pairwise correla-tions. However, higher order interactions (i.e., mutual de-pendence) among several dimensions can be missed. Simi-larly, dimensionality reduction techniques [Lee and Verley-sen, 2007], including PCA, are not aware of locally clus-tered projections; they only measure the (non-)linear de-pendence between dimensions, meaning that they considerone (global) projection, and may hence miss interesting lo-cal projections containing subspace clusters and outliers.Our method, on the other hand, is not limited to a pairwiseassessment and provides multiple projections for clusteringand outlier mining. It can cope with mutual dependenciesin arbitrary subspace projections.Feature selection. Next, we consider methods for unsuper-vised feature selection. Recent methods [Dy and Brodley,2004; Law et al., 2004] perform iteratively a partitioningand feature selection. They first partition the data (e.g.,by EM clustering), and then they evaluate feature subsetsbased on the obtained clusters. Another approach [Rothand Lange, 2003] aims at different feature subsets for dif-ferent clusters. However, it focuses on disjoint clusters anddoes neither allow overlapping clusters nor outliers. Ourmethod is more general and is aware of outliers and over-lap of clusters. In general, feature selection differs fromour approach in major aspects. Current feature selectionmethods are specifically bound to clustering. In contrast,our method is more general and suitable for both clusterand outlier mining in multiple subspaces. Most approaches[Dy and Brodley, 2004; Law et al., 2004] select a singleprojection of the data space, which uncovers some certaincluster structure in the data. These methods are limited toone subspace, while we mine multiple possibly overlappingsubspaces. Yet keeping only one subspace may miss localprojections containing different subspace clusters [Mulleret al., 2009b].Subspace search. We now discuss methods for selectingrelevant subspaces. They avoid the limitations of the aboveparadigms, and focus on multiple projections with arbitrarydimensionality. Existing methods, however, rely on dis-cretization of continuous dimensions [Cheng et al., 1999;Ye et al., 2009] or only work with binary data [Zhang et al.,2008] and/or discrete data [Chanda et al., 2010].
ENCLUS [Cheng et al., 1999] and PODM [Ye et al.,2009] detect subspaces with low entropy and high interest,discretizing continuous dimensions into equi-width bins inorder to compute the entropy measure. By requiring dis-
cretization, these methods have unintuitive parameters, andare hence inherently susceptible to knowledge loss and tothe curse of dimensionality. To some extent, these limi-tations have been tackled by HiCS [Keller et al., 2012],which works directly on continuous data. It quantifies thedifferences between the marginal and conditional distribu-tion in a random dimension of the considered subspace; byits random nature it may hence miss relevant subspaces.Further, it is exposed to the curse of dimensionality w.r.t.conditional distributions in high dimensional spaces.
Our method, on the other hand, can reliably score con-trast, regardless of subspace dimensionality. Furthermore,for each subspace we aim to find that permutation of di-mensions that yields optimal contrast.Cluster and outlier detection in subspaces. Specificmethods for clustering and outlier detection have been pro-posed. However, they do not provide a general notion ofsubspace selection. They select subspaces very specificallyto the underlying cluster [Agrawal et al., 1998; Aggarwalet al., 1999; Sequeira and Zaki, 2004; Muller et al., 2009a]or outlier [Aggarwal and Yu, 2001; Kriegel et al., 2009;Muller et al., 2011] definitions. In contrast to all these solu-tions, our goal is to design a contrast measure that is appli-cable to subspace selection for different mining paradigms.We show its instantiations to clustering and outlier detec-tion and evaluate its quality.
3 Basic Notions for Contrast AssessmentGiven a database DB of size N and dimensionality D, wewant to measure the contrast of any lower dimensional sub-space S with dimensionality 1 ≤ d ≤ D. Our assess-ment is based on the full space of all dimensions givenby F = {X1, . . . , XD}. Each dimension i is associatedwith a random variable Xi that has a continuous value do-main dom(Xi) = R. We use the notion of density dis-tribution pXi
(xi) for the projected database on dimensioni. We write pXi
(xi) as p(xi) when the context is clear.Any non-empty subset S ∈ P(F ) is called a subspaceof DB. The dimensionality of S is denoted as dim(S).W.l.o.g., {X1, . . . , Xd} is used as representative for any d-dimensional subspace S in our analysis.
3.1 Contrast Assessment.As our general notion of a contrast measure we have thefollowing formalization:
Definition 1 Contrast Measure of Subspaces:
C : P(F ) \ {∅} → R
In general, the contrast score C(S) quantifies the differ-ence of S w.r.t. the baseline of d independent and randomlydistributed dimensions. In the following we provide differ-ent instantiation of this contrast measure and discuss formalproperties of the instantiations. Let us first formalize the in-dependence baseline. For d random variables X1, . . . , Xd,there are two types of independence we are interested in.
Definition 2 Mutual Independence:X1, . . . , Xd are mutually independent iff
p(x1, . . . , xd) = p(x1) · · · p(xd)
Definition 3 m-wise Independence:X1, . . . , Xd are m-wise independent with m ≤ d iff anysubset {Xi1 , . . . , Xim} ⊆ {X1, . . . , Xd} is mutually inde-pendent.
Please note that pairwise independence is modeled as aspecial case of m-wise independence when m = 2. How-ever, pairwise analysis misses important higher-order de-pendencies that can only be identified when multiple di-mensions are considered altogether. Therefore, we focuson higher-order dependencies and their contrast assess-ment. A subspace is referred to as uncorrelated if its di-mensions are mutually independent. Our goal is to designa contrast measure C that quantifies as closely as possi-ble the deviation of subspaces from uncorrelated ones. Inother words, for a d-dimensional subspace S with dimen-sions {X1, . . . , Xd}, its contrast depends on the differencebetween two functions: p(x1, . . . , xd) and p(x1) · · · p(xd).
C (S ) ∼ diff (p(x1 , . . . , xd), p(x1 ) · · · p(xd))
Contrast of one-dimensional subspaces is undefined. Thus,we restrict the contrast measure C to two- or higher-dimensional subspaces. In the following, we propose threeproperties for a meaningful contrast assessment based onthe idea “deviating from uncorrelated subspaces”:Property 1 (Discriminative contrast scores): For subspacesS1 and S2 such that dim(S1) = dim(S2), if S1 is morecorrelated than S2 then C(S1) > C(S2).Property 2 (Zero contrast score): C(S) = 0 if and only ifthe dimensions of S are mutually independent.Property 3 (Awareness of m-wise independence): If thedimensions of S are m-wise independent but not mutuallyindependent then C(S) is small but not zero. This is be-cause m-wise independence does not guarantee mutual in-dependence.
Furthermore, C should be directly applicable to contin-uous data, i.e., we do not require discretization to obtainthe probability mass functions. Since discretization causesknowledge loss, this property is mandatory.
3.2 Discussion of Properties.Looking at existing techniques, ENCLUS [Cheng et al.,1999] instantiates the diff function by the well-knowntotal correlation
∑di=1H(Xi) − H(X1, . . . , Xd) where
X1, . . . , Xd are discretized versions of the original di-mensions. PODM [Ye et al., 2009] also discretizes dataand instantiates the diff function as
∑1
p(x1,...,xd)where
p(x1, . . . , xd) 6= 0. The instantiation of HiCS [Keller etal., 2012] is done by averaging over multiple random runsof the form diff (p(xi), p(xi |{x1 , . . . , xd} \ {xi})) whereXi is picked randomly.
None of these techniques fulfills all properties men-tioned. Considering Property 1, the measure of ENCLUSis unreliable because of the knowledge loss caused by datadiscretization. Further, the use of the joint probability massfunction p(x1, · · · , xd) also is problematic. In particular,H(X1, . . . , Xd) = −
∑p(x1, . . . , xd) log p(x1, . . . , xd)
with p(x1, . . . , xd) measured by the relative number ofpoints in the respective hypercube. For increasing d,most hypercubes are empty and the non-empty ones mostlikely contain only one data point each [Aggarwal andYu, 2001; Lee and Verleysen, 2007]. Taking into accountthat limx→0 x log x = 0, H(X1, . . . , Xd) approaches−∑N
i=11N log 1
N = logN . Hence, when d is large enoughand all Xi have a similar distribution (e.g., uniformlydense), any d-dimensional subspaces S1 and S2 have verysimilar contrast: C(S1) ≈ C(S2). In other words, the mea-sure of ENCLUS produces indifferent contrasts for highdimensional subspaces. Thus, it fails to satisfy Property 1,
i.e., the most basic property. PODM relying on data dis-cretization and the joint probability p(x1, . . . , xd) suffersthe same issue. As for HiCS, the random choice of Xi
causes potential loss of contrast as some attribute may notbe tested against the remaining ones. In addition, HiCSuses conditional probability distributions with (d− 1) con-ditions and exposes itself to the same problem of emptyspace.
Considering Properties 2 and 3, since ENCLUS workswith discretized data that causes loss of knowledge, itonly satisfies these properties with a proper grid resolu-tion. Such a resolution is data-dependent. PODM missesboth Properties 2 and 3 since its measure just relies on thejoint probability, i.e., it does not measure dependency. Azero contrast assigned by HiCS does not imply uncorre-lated spaces since there is no guarantee that all dimensionsare assessed against the others at least once. Thus, HiCSdoes not meet Property 2. Furthermore, HiCS does not aimat m-wise independence and thus does not address Prop-erty 3.
4 MethodologyIn order to address all three properties, we first introducea novel notion of mutual information, called CumulativeMutual Information (CMI ), which is instantiated based ona new notion of entropy, called Cumulative Entropy (CE ).We then verify that CMI addresses Properties 1 to 3. SinceCMI is dependent on the order of subspace dimensions, wethen devise an approach to select a dimension permutationthat approximates the optimal CMI value for a given sub-space. Due to space limitation, all proofs for the followingtheorems will be provided as an extended version of thispaper.
4.1 Cumulative mutual information.Given continuous random variables X1, . . . , Xd, their cu-mulative mutual information CMI (X1, . . . , Xd) is definedas:
d∑i=2
diff (p(xi), p(xi|x1, . . . , xi−1))
Intuitively, CMI (X1, . . . , Xd) measures the mutual infor-mation of X1, . . . , Xd by aggregating the difference be-tween p(xi) and p(xi|x1, . . . , xi−1) for 2 ≤ i ≤ d.Loosely speaking, it is the sum of the contrasts of sub-spaces (X1, X2), . . . , (X1, . . . , Xi), . . . , (X1, . . . , Xd) ifwe consider diff (p(xi), p(xi|x1, . . . , xi−1)) to be the con-trast of the subspace (X1, . . . , Xi). The reason for us-ing lower-dimensional subspace projections is to avoid theempty space phenomenon. Since probability functions arenot available at hand and can only be roughly estimated,e.g. by discretization, we aim at a direct solution us-ing cumulative distributions as difference of two functionsdiff (p(xi), p(xi|x1, . . . , xi−1)). We instantiate CMI bymeans of CE and conditional CE that are based on cu-mulative distributions. We demonstrate in Section 5 howthese allow efficient contrast calculation without discretiz-ing data. Their definitions are given below:
Definition 4 The cumulative entropy for a continuousrandom variable X , denoted hCE (X), is defined as:
hCE (X) = −∫dom(X)
P (X ≤ x) logP (X ≤ x)dx
Our notion of cumulative entropy is based on [Crescenzoand Longobardi, 2009]. However, it is more general since
X 1
X2
(a) Subspace S1
0
0.2
0.4
0.6
0.8
1
CDFConditional CDF
X2
Prob
ability
(b) CDF and conditional CDF of S1
0
0.1
0.2
0.3
0.4
0.5
0.6(‐CDF log CDF)
(‐CCDF log CCDF)
X2
Value
(c) −CDF logCDF and−CCDF logCCDF of S1
X 3
X4
(d) Subspace S2
X40
0.2
0.4
0.6
0.8
1
CDF
Conditional CDFProb
ability
(e) CDF and conditional CDF of S2
X4
Value
0
0.1
0.2
0.3
0.4
0.5
0.6
(‐CDF log CDF)
(‐CCDF log CCDF)
(f) −CDF logCDF and−CCDF logCCDF of S2
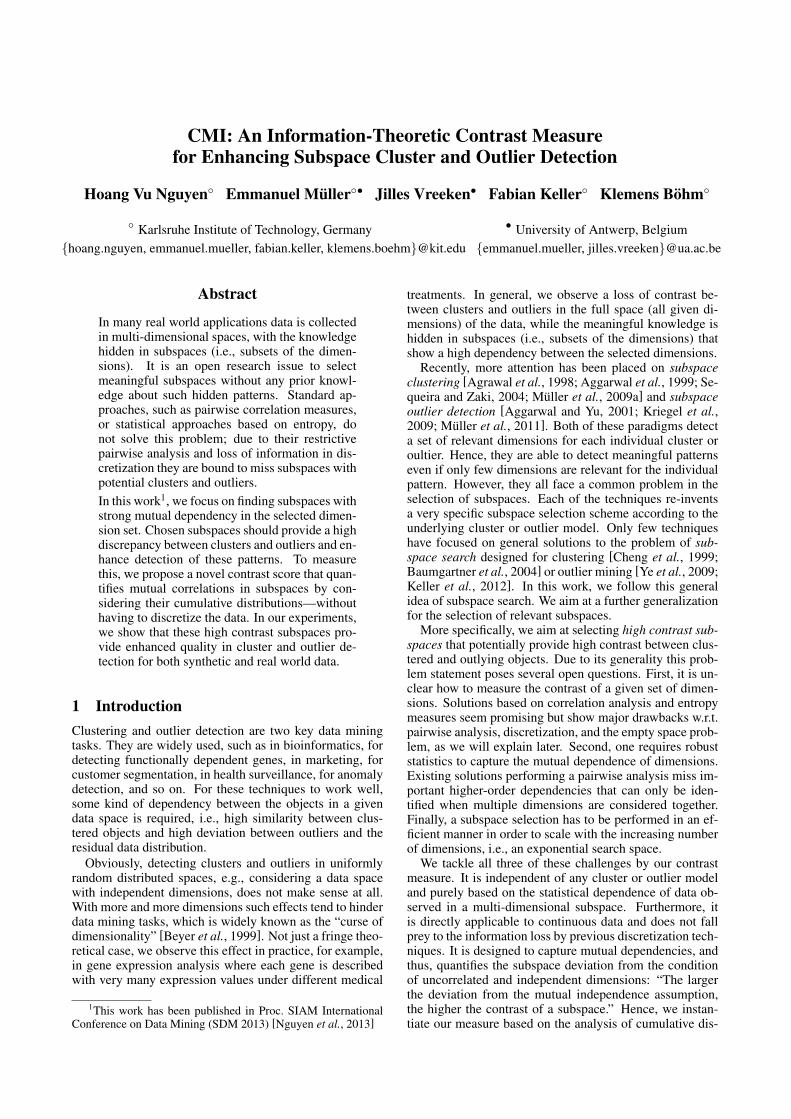
Figure 1: Example of low and high contrast subspaces with different CMI s
it is not restricted to non-negative random variables. Fur-thermore, we extend the notion of CE to conditional cumu-lative entropy and prove that it maintains some importantproperties of traditional conditional entropy as follows:
Definition 5 The conditional CE of any continuousrandom variable X knowing that some random vectorV ∈ RB (with B being a positive integer) takes the valuev is defined as:
hCE (X|v) = −∫dom(X)
P (X ≤ x|v) logP (X ≤ x|v)dx
The CE of X conditioned by V is:
EV [hCE (X|V )] =
∫dom(V )
hCE (X|v)p(v)dv
Just like the usual conditional entropy, we denoteEV [hCE (X|V )] as hCE (X|V ) for notational convenience.The conditional CE has two important properties given bythe following theorems:
Theorem 1 EV [hCE (X|V )] ≥ 0 with equality iff thereexists a function f : dom(V ) → dom(X) such that X =f(V ).
Theorem 2 EV [hCE (X|V )] ≤ hCE (X) with equality iffX is independent of V .
Under CE , diff (p(x), p(x| . . .)) is set to hCE (X) −hCE (X| . . .). Therefore, CMI (X1, . . . , Xd) becomes:
d∑i=2
hCE (Xi)−d∑
i=2
hCE (Xi|X1, . . . , Xi−1)
where hCE (Xi|X1, . . . , Xi−1) is hCE (Xi|V ) with V =(X1, . . . , Xi−1) being a random vector in dom(X1)×· · ·×dom(Xi−1).
Regarding the three properties, similar to traditional mu-tual information, the more correlated X1, . . . , Xd are, thesmaller the conditional CE s are, i.e., the larger is CMI .
Thus CMI is able to capture subspace correlation (Prop-erty 1). To illustrate this property, we use the toy exam-ple in Figure 1. It depicts the scatter plots, CDF plots,and plots of the function −P (X ≤ x) logP (X ≤ x),namely −CDF logCDF , of two subspaces S1 and S2
(CCDF means conditional CDF). The blue lines stand forthe marginal distribution of the corresponding dimension.The red lines feature the conditional distribution of one di-mension obtained by selecting a range of the remainingdimension (gray strips). One can see that S2 has highercontrast than S1 and hence, CMI (X3, X4)selected range =4.344 > CMI (X1, X2)selected range = 0.113. Further,even when high-order conditional CE s may be impactedby the curse of dimensionality, CMI still yields distin-guishable contrast for high dimensional subspaces due toits member low-order conditional CE s. If X1, . . . , Xd
are m-wise independent, then CMI (X1, . . . , Xd) is low ashCE (Xi)−hCE (Xi| . . .) vanishes for i ≤ m (Property 3).However, we have proved that CMI = 0 iff X1, . . . , Xd
are mutually independent (Property 2).
Theorem 3 CMI (X1, . . . , Xd) ≥ 0 with equality iffX1, . . . , Xd are mutually independent.
4.2 Choice of permutation.CMI can be used as our contrast measure. However, CMIchanges with dimension permutations. In order to make ourcontrast measure permutation-independent we investigate aheuristic search of the maximal contrast.
Our goal is to find a permutation that maximizes thecontrast of a given subspace S = {X1, . . . , Xd}. SinceCMI is permutation variant, there are d! possible casesin total. Together with the exponential number of sub-spaces, a brute-force approach is impractical. We there-fore apply a heuristic to obtain a permutation that approx-imates the optimal one. In particular, we first pick a pairof dimensions Xa and Xb (1 ≤ a 6= b ≤ d) such thathCE (Xb) − hCE (Xb|Xa) is maximal among the possiblepairs. We then continue selecting the next dimension Xc
(c 6= a and c 6= b) such that hCE (Xc)− hCE (Xc|Xa, Xb)is maximal among the remaining dimensions. Likewise,at each step, assuming I = {Xp1 , . . . , Xpk
} is the set ofdimensions already picked and R = {Xr1 , . . . , Xrd−k
} isthe set of remaining ones, we select the dimensionXri ∈ Rsuch that hCE (Xri) − hCE (Xri |I) is maximal. The pro-cess goes on until no dimension is left. Denoting the per-mutation obtained by our strategy as πopt, the contrast of Sis defined as CMI (πopt(X1, . . . , Xd)).
5 Algorithmic ApproachFor a D-dimensional data set, there are 2D − 1 candidatesubspaces to examine. The exponential number of sub-spaces makes a brute-force search impractical. A scalablesubspace exploration framework is required. Moreover, thecontrast measure must also permit efficient computation. Inthis section, we first introduce an approximate yet scalablelevelwise subspace search framework. We then proceed todiscuss how to compute our measure efficiently.
5.1 Scalable subspace exploration.Our aim is to mine high contrast subspaces upon whichsubspace clustering and outlier detection techniques are ap-plied. To tackle the exponential search space, we target ata processing scheme that trades off accuracy for efficiency.More specifically, we rely on the intuition that a high con-trast high dimensional subspace likely has its high contrastreflected in its lower-dimensional projections. In the fieldof subspace clustering, there is an analogous observation:Subspace clusters tend to have their data points clusteredin all of their lower-dimensional projections [Agrawal etal., 1998; Muller et al., 2009b]. One can then apply a lev-elwise scheme to mine subspaces of contrast larger thana pre-specified value. However, to facilitate parameteriza-tion of our method, we avoid imposing direct thresholds oncontrast scores produced by CMI .
Instead, we design a beam search strategy to obtain ef-ficiency. Starting with two-dimensional subspaces, in eachstep we use top M subspaces of high contrast to generatenew candidates in a levelwise manner. A newly generatedcandidate is only considered if all of its child subspaceshave high contrast. First, this permits tractable time com-plexity. Second, interaction among different subspace di-mensionality is taken into account and selected subspacesare ensured to have high contrast. Third, we avoid redun-dancy, if T ⊆ S and S has higher contrast than T . In thiscase, T is excluded from the final result.
5.2 Efficient contrast computation.To compute CMI , we need to compute CE and conditionalCE .
Let X1 ≤ . . . ≤ Xn be i.i.d. random samples of thecontinuous random variable X . Then hCE(X) can be cal-culated as follows:
hCE(X) = −n−1∑i=1
(Xi+1 −Xi)i
nlog
i
n
In contrast to this straightforward computation, it is not assimple to calculate the conditional CE in an accurate andefficient way. In the following, we first point out that dueto limited data, sticking to the exact formula of conditionalCE may lead to inaccurate results. We then propose a strat-egy to resolve this while ensuring that data discretization isnot required.
First, w.l.o.g., consider the space [−1/2, 1/2]dcontaining N limited data points. The d di-mensions are X1, . . . , Xd. Our goal is to com-pute hCE(X1|X2, . . . , Xd) using limited availabledata. From Definition 5: hCE(X1|X2, . . . , Xd) =∫ 1/2
−1/2 · · ·∫ 1/2
−1/2 h(X1|x2, . . . , xd)p(x2, . . . , xd)dx2 · · · dxd.Further:
hCE(X1|x2, . . . , xd) = limε→0+ hCE(X1|x2 − ε ≤X2 ≤ x2 + ε, . . . , xd − ε ≤ Xd ≤ xd + ε)
Taking into account that the total number of data pointsN is limited, the expected number of points contained inthe hypercube [x2 − ε, x2 + ε] × · · · × [xd − ε, xd + ε],which is N(2ε)d−1, approaches 0 as ε→ 0+. For high di-mensional spaces, the problem is exacerbated as one facesthe empty space phenomenon. With empty hypercubes (oreven hypercubes of one data point), hCE(X1|x2, . . . , xd)vanishes. Hence, hCE(X1|X2, . . . , Xd) becomes 0. Wethus encounter a paradox: For commonly used density esti-mation, e.g. by hypercubes [Cheng et al., 1999], one mightend up with an inaccurate result with the exact formula ofconditional CE. To alleviate this problem, we must ensureto have enough points for meaningful calculation. There-fore, we propose data summarization by clustering.
Clustering summarizes the data by means of clusters.Since the number of clusters is generally much less thanthe original data size, we may have more data points ineach cluster. Hence, the issue of limited data is miti-gated. Assuming that a clustering algorithm is used onDB projected to {X2, . . . , Xd} resulting in k clusters{C1, . . . , Ck} (the support of Ci is |Ci|), we propose toestimate hCE(X1|X2, . . . , Xd) by:
k∑i=1
|Ci|N
hCE(X1|Ci)
If k is kept small enough, we will have enough points for ameaningful computation of hCE(X1|Ci) regardless of thedimensionality d. As our cluster-based approach does notrely on any specific cluster notion, it can be instantiated byany method. To ensure efficient computation of the contrastmeasure, we use the one-pass k-means clustering strategyintroduced in [Ordonez and Omiecinski, 2004]. We obtaink clusters summarizing the data. For the parameter k, ifit is set too high, we may end up with high runtime andnot enough data in each cluster for a reliable estimation ofconditional CE . If it is instead set to 1, i.e., no clusteringat all, hCE(X1| · · · ) becomes hCE(X1), i.e., there is a lossof information. In all of our experiments, we set k = 10.Using clustering, one can verify that the conditional CE isless than or equal to its respective unconditional one.
6 ExperimentsWe compare CMI , to three subspace search methods: EN-CLUS [Cheng et al., 1999], HiCS [Keller et al., 2012], andPODM [Ye et al., 2009]. As further baselines we includerandom selection (FB) [Lazarevic and Kumar, 2005], PCA[Lee and Verleysen, 2007], and pairwise correlation (PW)[Reshef et al., 2011]. For CMI we use M = 400 andk = 10, unless stated otherwise. In order to assist com-parability and future research in this area, we provide ouralgorithm, all datasets, parameters and further material onour website.2
2http://www.ipd.kit.edu/˜muellere/CMI/
0
0.2
0.4
0.6
0.8
1
0 2 4 6 8 10
(max ‐min) / m
ax
Subspace dimensionality
CMI
HiCS
ENCLUS
PODM
(a) Contrast score vs. dimensionality
0
0.2
0.4
0.6
0.8
1
0 20 40 60 80 100 120
AUC
Number of dimensions
CMI HiCS ENCLUSPODM LOF FBPW PCA
(b) AUC vs. dimensionality
Figure 2: Subspace quality w.r.t. dimensionality
We evaluate how mining of high contrast subspaces im-proves the result quality of outlier detection and clusteringtechniques. Therefore, LOF [Breunig et al., 2000] and DB-SCAN [Ester et al., 1996], two well-established methods,are used on top of the tested approaches. For fair compari-son, we use the same parameter settings for both LOF andDBSCAN.
To ensure succinct sets of subspaces that allow for post-analysis, only the best 100 subspaces of each techniqueare utilized for clustering and outlier detection. Out-lier detection results are assessed by the Area Under theROC Curve (AUC) as in [Lazarevic and Kumar, 2005;Keller et al., 2012; Muller et al., 2011]. Clustering resultsare evaluated by means of F1, Accuracy, and E4SC as in[Muller et al., 2009b; Gunnemann et al., 2011].
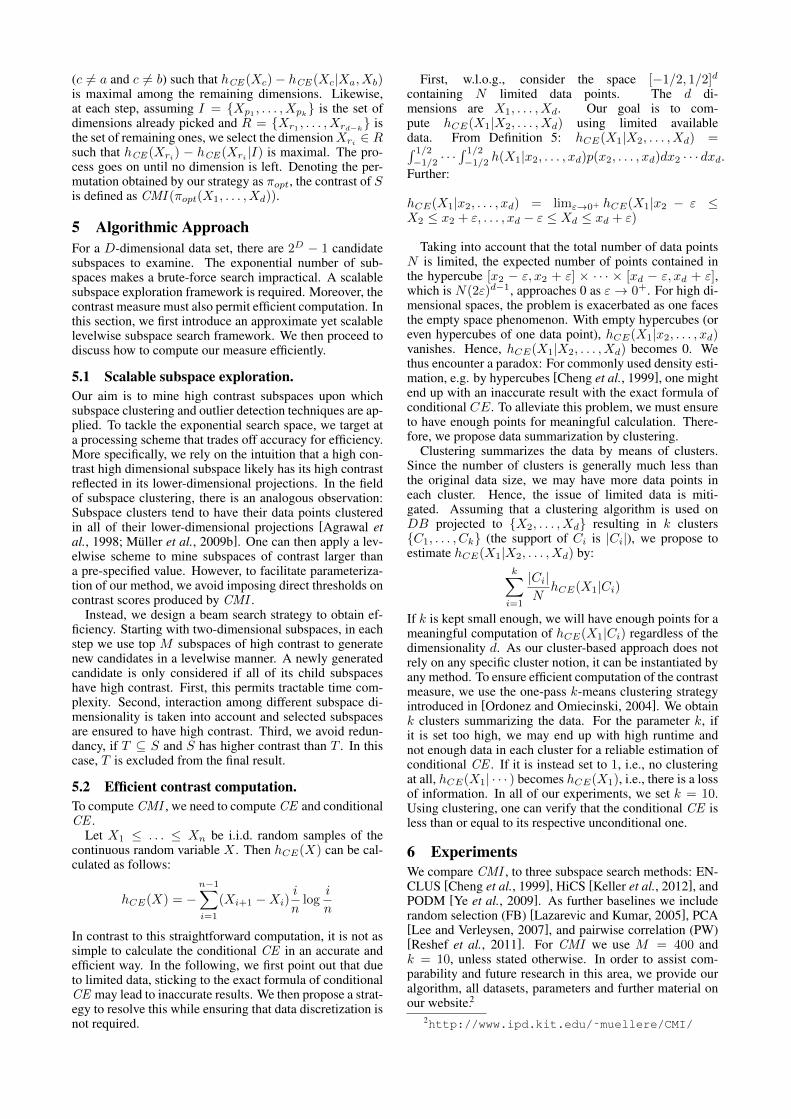
6.1 Impact of dimensionality.To illustrate that CMI is robust w.r.t. increasing dimen-sionality of subspaces, we evaluate it on a synthetic dataset of 20 dimensions and 5120 data points, generated ac-cording to [Muller et al., 2011]. Please note that in thisexperiment, we perform an exhaustive search without anypruning. Because of the large total number of subspaces(220 − 1), we only experiment up to d = 10 to avoid ex-cessive runtime. We record maxAd−minAd
maxAdwhere Ad is
the set of contrast scores of all d-dimensional subspaces.For 2 ≤ d ≤ 10, minAd ≈ 0 (as there are uncorrelatedd-dimensional subspaces) and maxAd 6= 0 (as there are
CMI HiCS Enclus Podm DBScan FB
20 dimensionsF1 0.96 0.96 0.72 0.75 0.65 0.67Acc. 0.98 0.96 0.75 0.82 0.67 0.68E4SC 0.92 0.75 0.42 0.36 0.19 0.27
40 dimensionsF1 0.93 0.88 0.65 0.72 0.54 0.61Acc. 0.93 0.74 0.68 0.76 0.61 0.66E4SC 0.89 0.73 0.27 0.34 0.21 0.23
80 dimensionsF1 0.94 0.83 0.62 0.68 0.57 0.61Acc. 0.95 0.74 0.66 0.81 0.62 0.69E4SC 0.86 0.57 0.22 0.34 0.24 0.25
120 dimensionsF1 0.94 0.86 0.52 0.61 0.55 0.63Acc. 0.94 0.72 0.68 0.71 0.58 0.62E4SC 0.87 0.64 0.18 0.23 0.21 0.19
Table 1: Clustering results on synthetic data sets
correlated d-dimensional subspaces with clusters and out-liers). Hence, ideally maxAd−minAd
maxAd= 1 for 2 ≤ d ≤ 10.
The results, plotted in Figure 2(a), show that HiCS, EN-CLUS, and PODM do not scale well with higher dimen-sionality. In contrast, CMI is more robust to dimensional-ity and yields discriminative contrast scores even for highdimensional subspaces.
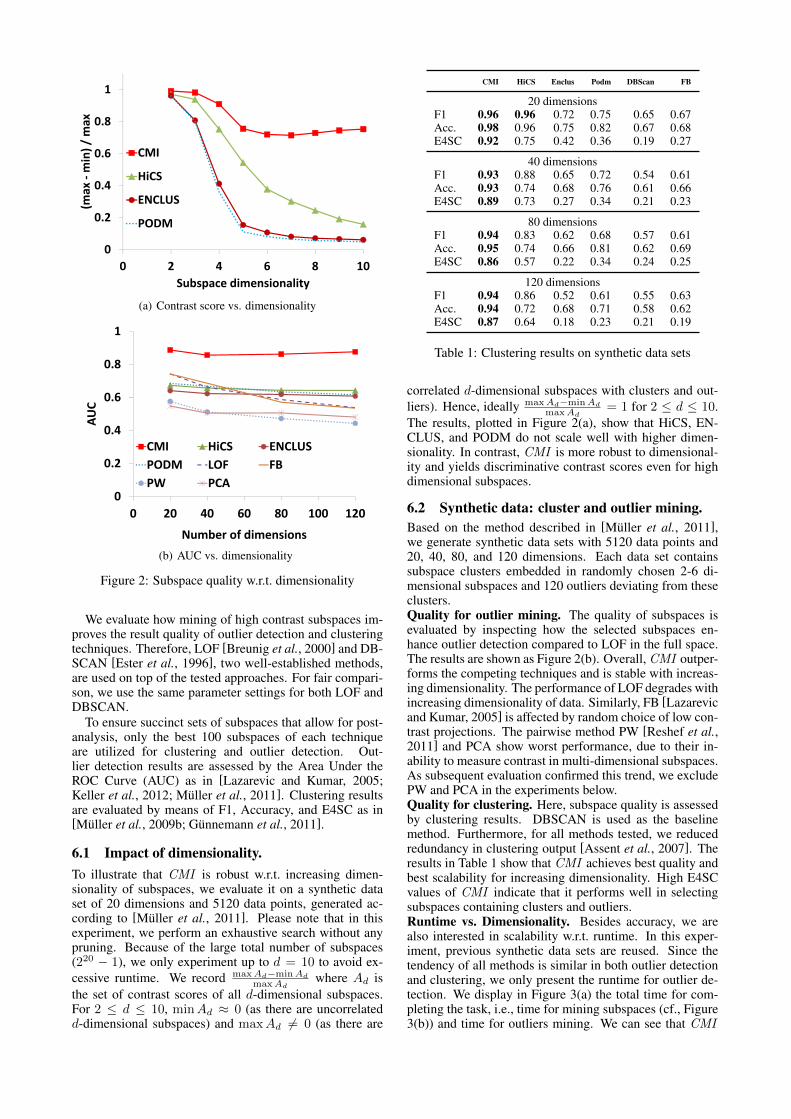
6.2 Synthetic data: cluster and outlier mining.Based on the method described in [Muller et al., 2011],we generate synthetic data sets with 5120 data points and20, 40, 80, and 120 dimensions. Each data set containssubspace clusters embedded in randomly chosen 2-6 di-mensional subspaces and 120 outliers deviating from theseclusters.Quality for outlier mining. The quality of subspaces isevaluated by inspecting how the selected subspaces en-hance outlier detection compared to LOF in the full space.The results are shown as Figure 2(b). Overall, CMI outper-forms the competing techniques and is stable with increas-ing dimensionality. The performance of LOF degrades withincreasing dimensionality of data. Similarly, FB [Lazarevicand Kumar, 2005] is affected by random choice of low con-trast projections. The pairwise method PW [Reshef et al.,2011] and PCA show worst performance, due to their in-ability to measure contrast in multi-dimensional subspaces.As subsequent evaluation confirmed this trend, we excludePW and PCA in the experiments below.Quality for clustering. Here, subspace quality is assessedby clustering results. DBSCAN is used as the baselinemethod. Furthermore, for all methods tested, we reducedredundancy in clustering output [Assent et al., 2007]. Theresults in Table 1 show that CMI achieves best quality andbest scalability for increasing dimensionality. High E4SCvalues of CMI indicate that it performs well in selectingsubspaces containing clusters and outliers.Runtime vs. Dimensionality. Besides accuracy, we arealso interested in scalability w.r.t. runtime. In this exper-iment, previous synthetic data sets are reused. Since thetendency of all methods is similar in both outlier detectionand clustering, we only present the runtime for outlier de-tection. We display in Figure 3(a) the total time for com-pleting the task, i.e., time for mining subspaces (cf., Figure3(b)) and time for outliers mining. We can see that CMI
scales better than our competitors.Although FB does not spend much time for mining high
contrast subspaces, it clearly suffers from high overall run-times. This is due to high dimensional subspaces that havelow contrast, and hence, induce the costly detection ofmany false alarms. ENCLUS and PODM also scale badlyas their contrast measures are inefficient in terms of timecomplexity. Since CMI prunes low contrast subspaces bet-ter than HiCS, it can avoid exploring many high dimen-sional subspaces. In conclusion, CMI is faster than alltested approaches and yields higher accuracy.
0
1000
2000
3000
4000
5000
0 20 40 60 80 100 120
Runtim
e (sec.)
Number of dimensions
CMI HiCS ENCLUS
PODM FB
(a) total runtime
0
1000
2000
3000
4000
5000
0 20 40 60 80 100 120
Runtim
e (sec.)
Number of dimensions
CMI HiCSENCLUS PODM
(b) subspace search only
Figure 3: Runtime w.r.t. dimensionality
6.3 Evaluation on real world data.All real world databases used in our experiments are fromthe UCI Machine Learning Repository [Frank and Asun-cion, 2010] and have been used as benchmarks in recentpublications [Lazarevic and Kumar, 2005; Muller et al.,2009a; Muller et al., 2009b; Keller et al., 2012].Quality for outlier mining. We evaluate the performanceof all subspace search methods with outlier detection onreal world data. We perform experiments on 9 benchmarkdatasets, using the minority class as ground truth for theoutlier evaluation. In some of these data sets (e.g., Pendig-its) all classes have identical support and we down-sampleone class to 10% of its original size, which is a commonlyused procedure in outlier evaluation [Lazarevic and Kumar,2005; Keller et al., 2012; Muller et al., 2011]. The results
Dataset CMI HiCS Enclus Podm LOF FB
Thyroid 0.96 0.95 0.94 0.91 0.86 0.93WBCD 0.95 0.94 0.94 0.87 0.87 0.87Diabetes 0.73 0.72 0.71 0.69 0.71 0.72Glass 0.82 0.80 0.80 0.78 0.77 0.78Ion 0.83 0.82 0.82 0.78 0.78 0.79Pendigits 0.98 0.95 0.94 0.86 0.94 0.93Segment 0.94 0.84 0.88 0.89 0.76 0.86Lympho 0.95 0.86 0.67 0.67 0.95 0.95Madelon 0.60 0.59 0.51 0.56 0.59 0.59
Table 2: Outlier mining: AUC on real world data
in Table 2 show that CMI achieves the best AUC in all datasets. In addition, we show the runtimes in Table 3. Over-all, our method provides the best quality enhancement forLOF.
Dataset CMI HiCS Enclus Podm FB
Thyroid 17.33 27.54 49.32 48.11 53.60WBCD 16.42 17.11 33.63 34.55 24.49Diabetes 1.74 1.80 4.74 4.63 5.56Glass 0.24 0.24 0.27 0.26 0.27Ion 6.01 6.19 7.31 7.19 8.07Pendigits 1368.23 1616.96 2153.09 2094.36 1854.56Segment 101.23 107.99 225.46 218.34 150.80Lympho 4.10 6.08 6.37 5.79 5.31Madelon 23.45 25.82 315.22 304.57 232.48
Table 3: Runtime (in seconds) for outlier detection
Quality for clustering. As we show in Table 4, CMI pro-vides also the best quality improvement w.r.t. clustering. Itoutperforms traditional full space DBSCAN and existingsubspace search methods that fail to identify clusters dueto scattered subspace projections. In contrast to the com-peting approaches, we achieve a clear quality enhancementfor both subspace clustering and subspace outlier detection.
CMI HiCS Enclus Podm DBScan FB
Wisconsin Breast CancerF1 0.79 0.75 0.44 0.40 0.73 0.60Acc. 0.77 0.72 0.69 0.67 0.71 0.69E4SC 0.76 0.70 0.53 0.49 0.67 0.59
ShapeF1 0.82 0.77 0.76 0.74 0.55 0.76Acc. 0.84 0.78 0.66 0.69 0.34 0.41E4SC 0.71 0.64 0.58 0.63 0.38 0.44
PendigitsF1 0.73 0.55 0.50 0.51 0.52 0.63Acc. 0.81 0.75 0.66 0.64 0.68 0.77E4SC 0.68 0.54 0.56 0.55 0.52 0.53
DiabetesF1 0.71 0.53 0.25 0.15 0.52 0.58Acc. 0.76 0.66 0.67 0.63 0.68 0.70E4SC 0.65 0.34 0.11 0.07 0.52 0.52
GlassF1 0.59 0.37 0.26 0.29 0.32 0.42Acc. 0.68 0.54 0.52 0.55 0.32 0.44E4SC 0.52 0.40 0.35 0.38 0.24 0.28
Table 4: Clustering: Quality on real world data
7 ConclusionsWe proposed CMI , a new contrast measure for multi-dimensional data. It is based on cumulative entropy of sub-spaces and does not require data discretization. Further-more, it is not restricted to pairwise analysis, captures mu-tual dependency among dimensions, and scales well withincreasing subspace dimensionality. Overall, it is more ac-curate and more efficient than previous subspace searchmethods. Experiments on various real world databasesshow that CMI provides improvement for both cluster andoutlier detection.
AcknowledgmentsThis work is supported by the German Research Founda-tion (DFG) within GRK 1194, by the YIG program of KITas part of the German Excellence Initiative. And by twoPost-Doctoral Fellowships of the Research Foundation –Flanders (FWO).
References[Aggarwal and Yu, 2001] Charu C. Aggarwal and
Philip S. Yu. Outlier detection for high dimensionaldata. In SIGMOD, 2001.
[Aggarwal et al., 1999] Charu C. Aggarwal, Cecilia Mag-dalena Procopiuc, Joel L. Wolf, Philip S. Yu, andJong Soo Park. Fast algorithms for projected clustering.In SIGMOD, 1999.
[Agrawal et al., 1998] Rakesh Agrawal, Johannes Gehrke,Dimitrios Gunopulos, and Prabhakar Raghavan. Auto-matic subspace clustering of high dimensional data fordata mining applications. In SIGMOD, 1998.
[Assent et al., 2007] Ira Assent, Ralph Krieger, EmmanuelMuller, and Thomas Seidl. DUSC: Dimensionality un-biased subspace clustering. In ICDM, 2007.
[Baumgartner et al., 2004] Christian Baumgartner, Clau-dia Plant, Karin Kailing, Hans-Peter Kriegel, andPeer Kroger. Subspace selection for clustering high-dimensional data. In ICDM, 2004.
[Beyer et al., 1999] Kevin S. Beyer, Jonathan Goldstein,Raghu Ramakrishnan, and Uri Shaft. When is “nearestneighbor” meaningful? In ICDT, 1999.
[Breunig et al., 2000] Markus M. Breunig, Hans-PeterKriegel, and Jorg Sander Raymond T. Ng. LOF: Identi-fying density-based local outliers. In SIGMOD, 2000.
[Chanda et al., 2010] Pritam Chanda, Jianmei Yang,Aidong Zhang, and Murali Ramanathan. On miningstatistically significant attribute association information.In SDM, 2010.
[Cheng et al., 1999] Chun Hung Cheng, Ada Wai-CheeFu, and Yi Zhang. Entropy-based subspace clusteringfor mining numerical data. In KDD, 1999.
[Crescenzo and Longobardi, 2009] Antonio Di Crescenzoand Maria Longobardi. On cumulative entropies. J.Statist. Plann. Inference, 139, 2009.
[Dy and Brodley, 2004] Jennifer G. Dy and Carla E. Brod-ley. Feature selection for unsupervised learning. JMLR,5, 2004.
[Ester et al., 1996] Martin Ester, Hans-Peter Kriegel, JorgSander, and Xiaowei Xu. A density-based algorithmfor discovering clusters in large spatial databases withnoise. In KDD, 1996.
[Frank and Asuncion, 2010] A. Frank and A. Asun-cion. UCI machine learning repository[http://archive.ics.uci.edu/ml], 2010.
[Gunnemann et al., 2011] Stephan Gunnemann, InesFarber, Emmanuel Muller, Ira Assent, and ThomasSeidl. External evaluation measures for subspaceclustering. In CIKM, 2011.
[Keller et al., 2012] Fabian Keller, Emmanuel Muller, andKlemens Bohm. HiCS: High contrast subspaces fordensity-based outlier ranking. In ICDE, 2012.
[Kriegel et al., 2009] Hans-Peter Kriegel, Erich Schubert,Arthur Zimek, and Peer Kroger. Outlier detection inaxis-parallel subspaces of high dimensional data. InPAKDD, 2009.
[Law et al., 2004] Martin H. C. Law, Mario A. T.Figueiredo, and Anil K. Jain. Simultaneous featureselection and clustering using mixture models. IEEETrans. Pattern Anal. Mach. Intell., 26(9), 2004.
[Lazarevic and Kumar, 2005] Aleksandar Lazarevic andVipin Kumar. Feature bagging for outlier detection. InKDD, 2005.
[Lee and Verleysen, 2007] J Lee and M Verleysen. Non-linear Dimensionality Reduction. Springer, New York,2007.
[Muller et al., 2009a] Emmanuel Muller, Ira Assent,Stephan Gunnemann, Ralph Krieger, and ThomasSeidl. Relevant subspace clustering: Mining the mostinteresting non-redundant concepts in high dimensionaldata. In ICDM, 2009.
[Muller et al., 2009b] Emmanuel Muller, StephanGunnemann, Ira Assent, and Thomas Seidl. Eval-uating clustering in subspace projections of highdimensional data. PVLDB, 2(1), 2009.
[Muller et al., 2011] Emmanuel Muller, Matthias Schiffer,and Thomas Seidl. Statistical selection of relevant sub-space projections for outlier ranking. In ICDE, 2011.
[Nguyen et al., 2013] Hoang Vu Nguyen, EmmanuelMuller, Jilles Vreeken, Fabian Keller, and KlemensBohm. CMI: An information-theoretic contrast measurefor enhancing subspace cluster and outlier detection. InSDM, 2013.
[Ordonez and Omiecinski, 2004] Carlos Ordonez and Ed-ward Omiecinski. Efficient disk-based K-means cluster-ing for relational databases. IEEE Trans. Knowl. DataEng., 16(8), 2004.
[Reshef et al., 2011] David N. Reshef, Yakir A. Reshef,Hilary K. Finucane, Sharon R. Grossman, GileanMcVean, Peter J. Turnbaugh, Eric S. Lander, MichaelMitzenmacher, and Pardis C. Sabeti. Detecting novel as-sociations in large data sets. Science, 334(6062), 2011.
[Roth and Lange, 2003] Volker Roth and Tilman Lange.Feature selection in clustering problems. In NIPS, 2003.
[Sequeira and Zaki, 2004] Karlton Sequeira and Mo-hammed Javeed Zaki. SCHISM: A new approach forinteresting subspace mining. In ICDM, 2004.
[Ye et al., 2009] Mao Ye, Xue Li, and Maria E. Orlowska.Projected outlier detection in high-dimensional mixed-attributes data set. Expert Syst. Appl., 36(3), 2009.
[Zhang et al., 2008] Xiang Zhang, Feng Pan, Wei Wang,and Andrew B. Nobel. Mining non-redundant high ordercorrelations in binary data. PVLDB, 1(1), 2008.