closing the loop in 2019 - euler hermes · 1995-1996 (president bill clinton): december 5, 1995, to...
TRANSCRIPT

© Copyright Allianz
Economic Research Department
Global Economic Outlook
Q4 2018
CLOSING THE LOOP IN 2019
© Copyright Allianz
GLOBAL GROWTH: WEATHERING RISKS
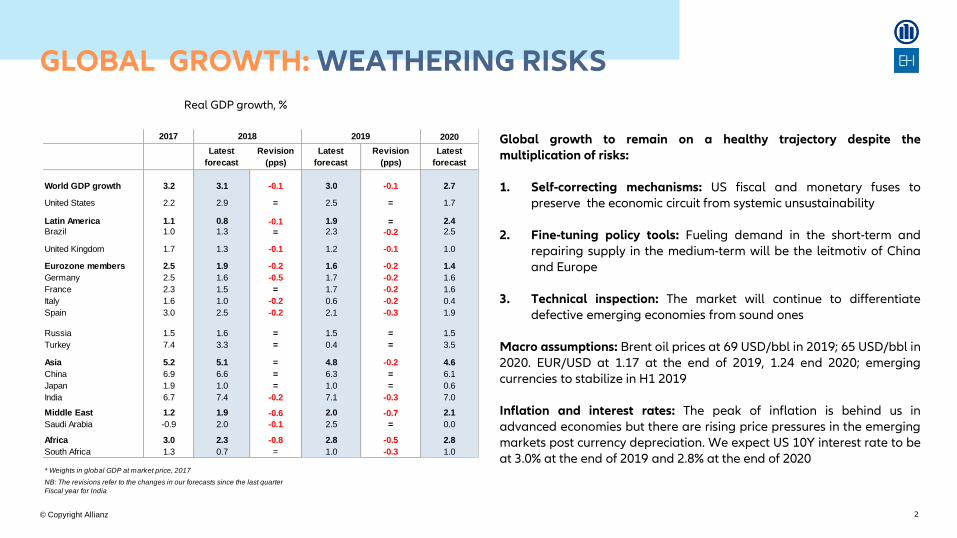
Global growth to remain on a healthy trajectory despite the multiplication of risks:
1. Self-correcting mechanisms: US fiscal and monetary fuses to
preserve the economic circuit from systemic unsustainability
2. Fine-tuning policy tools: Fueling demand in the short-term and repairing supply in the medium-term will be the leitmotiv of China and Europe
3. Technical inspection: The market will continue to differentiate defective emerging economies from sound ones
Macro assumptions: Brent oil prices at 69 USD/bbl in 2019; 65 USD/bbl in 2020. EUR/USD at 1.17 at the end of 2019, 1.24 end 2020; emerging currencies to stabilize in H1 2019 Inflation and interest rates: The peak of inflation is behind us in advanced economies but there are rising price pressures in the emerging markets post currency depreciation. We expect US 10Y interest rate to be at 3.0% at the end of 2019 and 2.8% at the end of 2020
Real GDP growth, %
2
2020
Latest
forecast
Revision
(pps)
Latest
forecast
Revision
(pps)
Latest
forecast
World GDP growth 3.2 3.1 -0.1 3.0 -0.1 2.7
United States 2.2 2.9 = 2.5 = 1.7
Latin America 1.1 0.8 -0.1 1.9 = 2.4
Brazil 1.0 1.3 = 2.3 -0.2 2.5
United Kingdom 1.7 1.3 -0.1 1.2 -0.1 1.0
Eurozone members 2.5 1.9 -0.2 1.6 -0.2 1.4
Germany 2.5 1.6 -0.5 1.7 -0.2 1.6
France 2.3 1.5 = 1.7 -0.2 1.6
Italy 1.6 1.0 -0.2 0.6 -0.2 0.4
Spain 3.0 2.5 -0.2 2.1 -0.3 1.9
Russia 1.5 1.6 = 1.5 = 1.5
Turkey 7.4 3.3 = 0.4 = 3.5
Asia 5.2 5.1 = 4.8 -0.2 4.6
China 6.9 6.6 = 6.3 = 6.1
Japan 1.9 1.0 = 1.0 = 0.6
India 6.7 7.4 -0.2 7.1 -0.3 7.0
Middle East 1.2 1.9 -0.6 2.0 -0.7 2.1
Saudi Arabia -0.9 2.0 -0.1 2.5 = 0.0
Africa 3.0 2.3 -0.8 2.8 -0.5 2.8
South Africa 1.3 0.7 = 1.0 -0.3 1.0
* Weights in global GDP at market price, 2017
NB: The revisions refer to the changes in our forecasts since the last quarter
Fiscal year for India
2017 2018 2019

© Copyright Allianz 17-Dec-18 File name | department | author
3
Low impact, medium probability
•No-deal Brexit
Moderate impact, medium probability
•Escalating US-China trade tensions
•US corporate debt crisis
•Monetary policy mistake (boom/bust)
•Full-fledged EM crisis
•Populist win EU elections
High impact, low probability
•Global trade war
•Italexit/EZ debt crisis 2.0
•Capital markets freeze in China
•US systemic debt crisis
Pro
ba
bil
ity
Imp
act
The political and economic risk landscape remains crowded with potential recession triggers. Uncertainty is unlikely to escalate further, but expect it to linger. Visible impact could still increase as the negative effect kicks in with a lag
Hig
h
Lo
w
Hig
h
Lo
w
GLOBAL RISKS: MULTIPLE PERTURBATIONS IN 2019-20
The multiplication of uncertainty sources has contributed, beside the normalization of monetary policies in developed markets, to a significant tightening of world credit conditions, pointing toward a deceleration of growth
-80
-60
-40
-20
0
20
40
60
80
07 08 09 10 11 12 13 14 15 16 17 18
EM United Kingdom
China Japan
United States Euro Area
FCI
Tightening
Easing
World monetary and financial conditions (level)
3
Sources: IHS Global Insight. Allianz Research
© Copyright Allianz
Sources: IHS Global Insight. Allianz Research
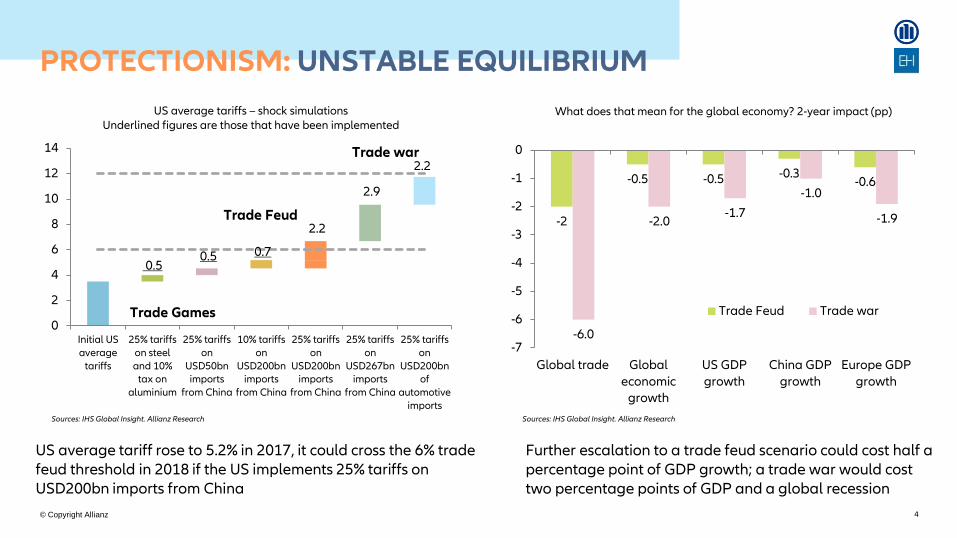
US average tariffs – shock simulations Underlined figures are those that have been implemented
US average tariff rose to 5.2% in 2017, it could cross the 6% trade feud threshold in 2018 if the US implements 25% tariffs on USD200bn imports from China
0.5 0.5 0.7
2.2
2.9
2.2
0
2
4
6
8
10
12
14
Initial USaverage
tariffs
25% tariffson steeland 10%
tax onaluminium
25% tariffson
USD50bnimports
from China
10% tariffson
USD200bnimports
from China
25% tariffson
USD200bnimports
from China
25% tariffson
USD267bnimports
from China
25% tariffson
USD200bnof
automotiveimports
Trade Feud
Trade Games
Trade war
-2
-0.5 -0.5 -0.3 -0.6
-6.0
-2.0 -1.7
-1.0
-1.9
-7
-6
-5
-4
-3
-2
-1
0
Global trade Global
economicgrowth
US GDP
growth
China GDP
growth
Europe GDP
growth
Trade Feud Trade war
What does that mean for the global economy? 2-year impact (pp)
Further escalation to a trade feud scenario could cost half a percentage point of GDP growth; a trade war would cost two percentage points of GDP and a global recession
Sources: IHS Global Insight. Allianz Research
PROTECTIONISM: UNSTABLE EQUILIBRIUM
4

© Copyright Allianz
Global trade in goods and services
Sources: IHS, Datastream, Allianz Research Source: Euler Hermes
Additional import needs by country in 2019 (Goods & Services, in USD bn)
3.6% 3.8%2.8% 2.1%
4.8% 3.8% 3.6%2.8%
2.1%
-10.2%
-1.6%
9.4%
7.2%6.3%
-15%
-10%
-5%
0%
5%
10%
15%
13 14 15 16 17 18f 19f
Volume Price Value
FDI inward stock vs. trade in goods and Services (growth average over 2014-2017)
Source: Euler Hermes
Global trade growth to slow in line with global demand
The US, the Eurozone and increasingly also China will act as a key driver for trade growth in the short-run
China
Indonesia
Philippines
Malaysia
Vietnam
Bangladesh
Poland
Romania
Russia
Brazil Colombia
Mexico
Morocco
Cambodia
India
Pakistan
Nigeria
Thailand
Côte d'Ivoire
Chile
United States
Argentina
Canada
France
Germany
Japan
Turkey
United Kingdom
-2%
0%
2%
4%
6%
8%
10%
12%
14%
16%
-5% 0% 5% 10% 15% 20%
Tra
de o
f g
oo
ds a
nd
se
rvic
es
FDI inward stock
Trade diversion has already started and could disrupt supply chains. Asian pivot stands to benefit the most
GLOBAL TRADE: LOOKING FOR A NEW EQUILIBRIUM
5

© Copyright Allianz 6
GLOBAL INSOLVENCIES: ON THE UPSIDE Insolvency Heat Map 2019
EH Global and Regional Insolvency Indices (yearly changes in %)
Sources: National statistics, Euler Hermes, Allianz Research Sources: IHS Global Insight. Allianz Research
We expect our Global Insolvency Index to keep on increasing in 2019 (+6% after +10% in 2018). We expect 2 out of 3 countries to post an increase in insolvencies, and 1 out of 2 countries to register in 2019 more insolvencies than over the 2003-2007 period

© Copyright Allianz
01
FISCAL AND MONETARY FUSES
TO PRESERVE THE US FROM
DEBT UNSUSTAINABILITY

© Copyright Allianz
US labor markets and household consumption
Sources: IHS Global Insight. Allianz Research Sources: IHS Global Insight. Allianz Research Sources: IHS Global Insight. Allianz Research
US economic circuit signals end of the cycle US investment and exports (%, y/y)
The fed funds rate looks set to rise above the US nation’s saving rate from Q4 2019 onwards. In these territories, the probability of a recession becomes non negligible
0.0
0.2
0.4
0.6
0.8
1.0
-5
0
5
10
15
80 83 86 89 92 95 98 01 04 07 10 13 16 19
US GDP (%, y/y, LHS) US nation saving rate (%, LHS)
Fed Funds Target rate (%, LHS) Recessions (0 or 1, RHS)
-30
-20
-10
0
10
20
30
-30
-20
-10
0
10
20
30
00 01 02 03 04 05 06 07 08 09 10 11 12 13 14 15 16 17 18 19 20
Total investment YoY Fixed non residential investment YoY
IT investment YoY Residential investment YoY
Exports
Investment is showing signs of weakening amid higher interest rates, less supportive external conditions and deteriorating corporate credit quality
3
4
5
6
7
8
9
10-4
-2
0
2
4
6
00 01 02 03 04 05 06 07 08 09 10 11 12 13 14 15 16 17 18
Consumption (%, y/y, LHS)
Unemployment rate (%, inverse order, RHS)
Solid employment growth provides a strong boost to household confidence and stronger consumption
US ECONOMY: GROWTH ENGINE IS ROARING BUT…
8

© Copyright Allianz
The share of high yield bonds has been flat since 2015 at around one third (below the 2009 peak of 45%). But the share of the lowest invest grade level (BBB) has reached a record high of 35% in Q2 2018
Sources: IHS Global Insight. Allianz Research Sources: IHS Global Insight. Allianz Research
Debt of US economic sectors (as % of GDP) US non financial debt (% of GDP) US net issuance of risky business debt (leveraged loans and high yield or unrated bonds, USD bn)
Sources: Fed, Allianz Research
0
50
100
150
200
250
300
350
400
70 72 75 78 81 84 87 89 92 95 98 01 04 06 09 12 15 18
Financial sector Household US Treasury Non financial business
Looking at total US debt aggregated across all sectors, the deleveraging mode is still on, suggesting that the systemic risk is not implicated for now
0
20
40
60
80
100
120
140
0
20
40
60
80
100
120
140
70 73 76 79 82 85 88 91 94 97 00 03 06 09 12 15 18
Business Debt US Treasury Debt
Household Debt Financial
median
Deviations from the long-term growth trend of debt is traditionally a good indicator for the nature of an upcoming crisis. Today, public debt and corporate debt are at risk
-40
-30
-20
-10
0
10
20
30
40
50
60
70
20
06
20
07
20
08
20
09
20
11
20
11
20
12
20
13
20
14
20
15
20
16
20
18
US DEBT: LOCALIZING THE MALFUNCTIONS
9

© Copyright Allianz
Sources: IHS Global Insight. Allianz Research
US CPI (%, y/y) History of US government shutdowns
Sources: Wikipedia , Allianz Research
Circuit breaker #1: The Fed will hike interest rates twice in 2019 as inflation remains stuck above 2%
Circuit breaker #2: A government shutdown is possible in Q4 2019. It will trigger a significant tightening of monetary and financial conditions
2013 (President Barack Obama): Oct. 1 to Oct. 17 - 16 days 1995-1996 (President Bill Clinton): December 5, 1995, to January 6, 1996, - 21 days 1995 (President Bill Clinton): Nov. 13 to 19 - 5 days 1990 (President George H.W. Bush): October 5 to 9 - 3 days 1987 (President Ronald Reagan): December 18 to December 20 - 1 day 1986 (President Ronald Reagan): October 16 to October 18 - 1 day 1984 (President Ronald Reagan): October 3 to October 5 - 1 day 1984 (President Ronald Reagan): September 30 to October 3 - 2 days 1983 (President Ronald Reagan): November 10 to November 14 - 3 days 1982 (President Ronald Reagan): December 17 to December 21 - 3 days 1982 (President Ronald Reagan): September 30 to October 2 - 1 day 1981 (President Ronald Reagan): November 20 to November 23 - 2 days 1979 (President Jimmy Carter): September 30 to October 12 - 11 days 1978 (President Jimmy Carter): September 30 to October 18 18 days 1977 (President Jimmy Carter): November 30 to December 9 - 8 days 1977 (President Jimmy Carter): October 31 to November 9 - 8 days 1977 (President Jimmy Carter): September 30 to October 13 - 12 days 1976 (President Gerald Ford): September 30 to October 11 - 10 days
-200
0
200
400
600
800
1000
-200
0
200
400
600
800
1000
99 00 01 02 03 04 05 06 07 08 09 10 11 12 13 14 15 16 17 18 19
Net issuance
Gross issuance
Bond refinancing needs
Nonfinancial companies’ debt issuance in the US
Record high refinancing needs will make tightening credit conditions painful for US non-financial companies
Sources: IHS , Allianz Research
US POLICY: FUSES AGAINST FURTHER DEBT INFLATING
10

© Copyright Allianz
Sources: Fed. Allianz Research
Corporate bond mutual fund and loan mutual fund assets (USD bn)
A rush to redeem shares of mutual funds could exacerbate losses of relatively illiquid types of assets. Negative wealth effects will hurt consumption prospects
0
500
1000
1500
2000
2500
02 04 05 07 09 10 12 14 15 17
Bank loan mutual funds
High-yield corporate bond mutual funds
Investment-grade corporate bond mutual funds
GDP growth
A technical recession is possible as early as 1H20. US growth slowdown will start in 2019 amid diluting impact of the fiscal stimulus and tightening credit conditions
Sources: Fed. Allianz Research
US SCENARIO: A MORE ABRUPT ADJUSTMENT IN 2020
11

© Copyright Allianz
02
EUROZONE AND CHINA: FUELING
DEMAND IN THE SHORT-TERM
AND REPAIRING SUPPLY OVER
THE MEDIUM-TERM
© Copyright Allianz
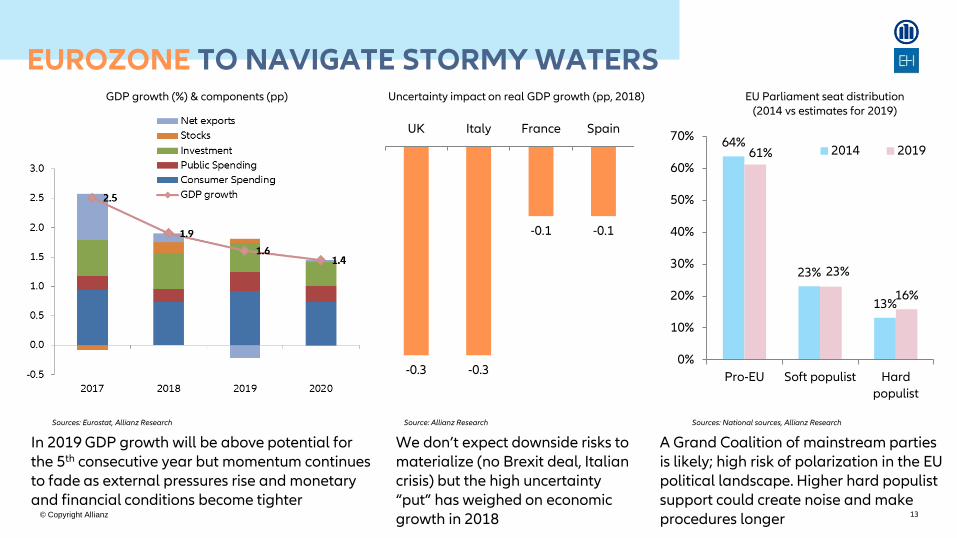
A Grand Coalition of mainstream parties is likely; high risk of polarization in the EU political landscape. Higher hard populist support could create noise and make procedures longer
EUROZONE TO NAVIGATE STORMY WATERS GDP growth (%) & components (pp)
Sources: Eurostat, Allianz Research
-0.3 -0.3
-0.1 -0.1
UK Italy France Spain
Uncertainty impact on real GDP growth (pp, 2018)
Source: Allianz Research
In 2019 GDP growth will be above potential for the 5th consecutive year but momentum continues to fade as external pressures rise and monetary and financial conditions become tighter
64%
23%
13%
61%
23%
16%
0%
10%
20%
30%
40%
50%
60%
70%
Pro-EU Soft populist Hard
populist
2014 2019
EU Parliament seat distribution (2014 vs estimates for 2019)
Sources: National sources, Allianz Research
We don’t expect downside risks to materialize (no Brexit deal, Italian crisis) but the high uncertainty “put” has weighed on economic growth in 2018 13

© Copyright Allianz 14
EUROZONE CORPORATES: STILL RESILIENT…
France: Business creations
France: Creative destruction in the making. Corporate creations increased by +11% in 2018 and should continue to the upward trend. At the same time, business insolvencies rose by +2.2% from the May trough to October
Sources: IHS Global Insight, Allianz Research
40000
45000
50000
55000
60000
65000
07 08 09 10 11 12 13 14 15 16 17 18
54275insolvencies at end-
October 2018
-
100,000
200,000
300,000
400,000
500,000
600,000
700,000
800,000
08 09 10 11 12 13 14 15 16 17 18
France: Business insolvencies
-2.0%
-1.5%
-1.0%
-0.5%
0.0%
0.5%
1.0%
1.5%
2.0%
10 11 12 13 14 15 16 17 18
Unit Labor Cost
Investment in equipment
Investment in construction
Spain: Unit labor costs (ULC) and investment growth (%, y/y)
Spain: Resilience partly explained by corporate dynamism. Historically high profit shares (>43% of GVA) and subdued ULC growth allows companies to invest. Reforms such as giving priority to company-level wage agreements (2012) controlled the wage increases despite employment gains
Sources: IHS, Allianz Research

© Copyright Allianz
Cost of funds and balance sheet constraints
Q2 2018 Q3 2018
Eurozone -3 3
Germany 0 0
Spain -10 0
France 0 0
Italy -10 10
Netherlands 0 0
Note: The net percentages for the questions relating to contributing factors are defined as the difference between the percentage of banks reporting that the given factor contributed to a tightening and the percentage reporting that it contributed to an easing
Belgium
Ireland
Greece
Netherlands
Germany
France
Portugal
Italy Spain
UK
Finland
0%
10%
20%
30%
40%
50%
60%
70%
80%
0% 30% 60% 90% 120% 150% 180% 210%
No
n-f
ina
nci
al c
orp
oa
tio
ns'
ma
rgin
s, %
of
valu
e a
dd
ed
Non-financial corporates' debt, % of GDP
-100
0
100
200
300
400
500
0
50
100
150
200
250
300
350
400
450
00 02 04 06 08 10 12 14 16 18
IG corporate spread (lhs)
OAT-Bund spread (rhs)
BTP-Bund spread (rhs)
Corporate debt vs profitability ECB Bank Lending Survey Corporate vs sovereign spreads (bp)
Sources: BIS, Eurostat, Allianz Research
Sources: ECB, Allianz Research Sources: Bloomberg, Allianz Research
The Eurozone investment cycle has been boosted by credit growth. Tighter financial conditions will make banks more risk adverse while market conditions could remain volatile as the ECB starts to normalize monetary policy
EUROZONE CORPORATES: …BUT FEWER BUFFERS
15

© Copyright Allianz
In times of past-the-peak economic growth and waning liquidity, we expect fiscal policy to step up its game to address lingering political discontent – at least in Eurozone countries where fiscal room for maneuver allows for it
Reinvestment policy
16
Fiscal balance (% of GDP) Spreads between 10-yr govt bonds over German Bunds
ECB QE stock and flows (EURbn)
Sources: IHS Global Insight. Allianz Research Sources: IHS Global Insight. Allianz Research Sources: IHS Global Insight. Allianz Research
The ultra-expansive monetary policy has served as a buffer in times of elevated political uncertainty, drowning out market concerns while supporting risk appetite
As the ECB takes a first step towards normalizing its policy by ending monthly QE net purchases come Jan 2019, market discipline will start to return. But the re-investment of maturing principal until at least early 2021 will act as a safety-net
-6
-5
-4
-3
-2
-1
0
1
2
201
5
201
6
201
7
201
8
201
9
202
0
202
1
202
2
Italy
Germany
France
Spain
Eurozone
EUROZONE: POLICY-MIX TO TAME UNCERTAINTY
© Copyright Allianz
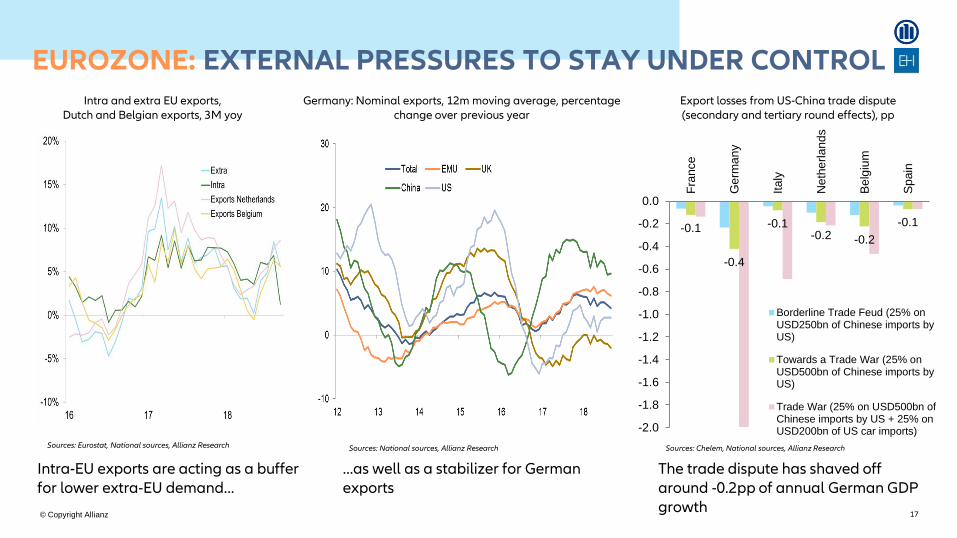
The trade dispute has shaved off around -0.2pp of annual German GDP growth
17
Intra and extra EU exports, Dutch and Belgian exports, 3M yoy
Germany: Nominal exports, 12m moving average, percentage change over previous year
…as well as a stabilizer for German exports
-0.1
-0.4
-0.1-0.2 -0.2
-0.1
-2.0
-1.8
-1.6
-1.4
-1.2
-1.0
-0.8
-0.6
-0.4
-0.2
0.0
Fra
nce
Germ
an
y
Italy
Neth
erl
and
s
Be
lgiu
m
Sp
ain
Borderline Trade Feud (25% onUSD250bn of Chinese imports byUS)
Towards a Trade War (25% onUSD500bn of Chinese imports byUS)
Trade War (25% on USD500bn ofChinese imports by US + 25% onUSD200bn of US car imports)
Intra-EU exports are acting as a buffer for lower extra-EU demand…
Export losses from US-China trade dispute (secondary and tertiary round effects), pp
Sources: Eurostat, National sources, Allianz Research Sources: National sources, Allianz Research Sources: Chelem, National sources, Allianz Research
EUROZONE: EXTERNAL PRESSURES TO STAY UNDER CONTROL

© Copyright Allianz
Households Saving (% Disposable income)
Sources: IMF, Allianz Research
Household debt vs. credit to households
10%
15%
20%
25%
30%
30%
35%
40%
45%
50%
55%
60%
14 15 16 17 18
Households debt (% GDP, left)
Credit to households (y/y, right)
8.9 8.4
9.0 8.7 8.5
2.62.0
1.62.0
2.5
6.3 6.5
7.5
6.76.0
0
1
2
3
4
5
6
7
8
9
10
15 16 17 18f 19f
Nominal per capita disposable incomeInflationReal Disposable income
38.5
38.0
37.1
35.5 35.5 35.1
34.6
32
33
34
35
36
37
38
39
13 14 15 16 17 18f 19f
Income growth
Driver #1: Strong credit growth Driver #2: Positive income growth Driver #3: Declining savings rate
Sources: IMF, Allianz Research Sources: IMF, Allianz Research
CHINA: BETTING (BOLDLY) ON HOUSEHOLDS
18

© Copyright Allianz
-40
-20
0
20
40
60
80
100
120
14 15 16 17 18
Bank domestic claims On Government
On private sector On Other NBFI
19
Banks’ domestic claims by agents Financial sector indicators
N.B: loan to deposit and NPL ratios figures stop end Q3 2018, shadow banking flows take into account trust, entrusted loans and undiscounted bank acceptances over October 2017-Septmber 2018, Non-financial corporations debt is based on BIS figures which end Q1 2018. Sources: WIND, IHS, BIS, Allianz Research
2017 Last
Loan to deposit ratio 70.6 73.6
Bank NPL ratio 1.7 1.9
Urban banks 1.5 1.7
Rural banks 3.2 4.2
SOE 1.5 1.5
Shadow Banking Flow s (% GDP) 4.3 -1.9
Non-Financial corporations debt (%
GDP)
160.3 164.1
Credit to private sector increase gradually (+12.6% y/y in October from a low 11% in June)
Overall credit growth is stable. By segments, the private sector is the one benefitting from current monetary easing
Prudence is justified by the fact that the financial system is still under stress and room for maneuver is increasingly limited
Sources: IHS, Allianz Research
CHINA: PRIORITIZING BETTER CAPITAL ALLOCATION

© Copyright Allianz 17-Dec-18 20
Bold figures indicate where we are end Q4. 10% on USD200bn imports and 25% on USD50bn imports from China have been enacted. RMB depreciated by -10% since March Sources: IHS, Allianz Research
10% tariff on USD imports from China
Cost 25% tariff on USD imports from China
Cost RMB
depreciation Cost
Absorption
50 5 50 12.5 -2% -10
100 10 100 25.0 -4% -20
150 15 150 37.5 -6% -30
200 20 200 50.0 -8% -40
250 25 250 62.5 -10% -50
300 30 300 75.0 -12% -60
350 35 350 87.5 -14% -70
400 40 400 100.0 -16% -80
450 45 450 112.5 -18% -90
500 50 500 125.0 -20% -100
How much RMB depreciation is required to make up for the US tariff shock?
A static approach (USD bn)
Nominal investment (YTD, y/y)
0
5
10
15
20
25
30
35
40
14 15 16 17 18
Total
State Holding Enterprises
Private investment
Infrastructure spending
• Infrastructure spending up +3.7% YTD YY in Jan-Oct (after +3.3%)
• SOE investment up +1.8% (after +1.2%)
A 10% RMB depreciation would help absorb a cost increase of USD 50 bn. More should be expected if the US raises tariffs further
Fiscal stimulus is bearing fruit: Infrastructure and SOE investment are starting to pick up
Sources: IHS, Allianz Research
CHINA: FINE-TUNING SHOCK ABSORBERS

© Copyright Allianz
CHINA: OPENING UP WISELY
Tariff cut: China’s tariff cuts help support import growth and absorb higher inputs cost due to oil prices and RMB depreciation
Partnerships: Accelerating partnerships helps diversify trade opportunities. The Belt and Road Initiative is the core strategy for now. Watch out for partnership in Asia (RCEP) and Europe
-25
-20
-15
-10
-5
0
5
10
15
20
25
-10
-5
0
5
10
14 15 16 17 18
Producer prices (y/y, left)
USD denominated imports (3mma y/y,right)
USD denominated imports and producer prices
16%
18%
20%
22%
24%
26%
28%
30%
32%
34%
36%
05 06 07 08 09 10 11 12 13 14 15 16 17 18
United States
OBOR countries
Share of US and BRI exports in total USD denominated exports
Reforms: Business-friendly reforms will be important to attract much-needed investment. Investor protection and insolvency resolution remain key problems
0 20 40 60 80 100
Starting a business
Getting electricity
Trading across borders
Registering property
Enforcing contract
Total score
Paying taxes
Construction permits
Getting credit
Protec. minority investors
Resolving insolvency
2019
2018
Ease of doing business - score and subcomponents (100 = best)
Sources: IHS, Allianz Research Sources: IHS, Allianz Research Sources: WB, Allianz Research
Best sub-components
To improve
21

© Copyright Allianz
03
EMERGING ECONOMIES :
TECHNICAL INSPECTION BY THE
MARKET TO CONTINUE

© Copyright Allianz
In a scenario where US growth decelerates progressively, US monetary policy tightening would ease with Emerging Markets standing to benefit
Foreign reserve adequacy: FX reserves in % of liquidity potential needs
Sources: IHS Global Insight, Allianz Research
Growth differentials between Advanced Economies and Emerging Markets vs. exchange rates
Sources: IHS Global Insight, Allianz Research
Capital flows to Emerging Markets (excl. China and Russia), USD bn
Capital flows to Emerging Markets to prove fickle, but attractiveness to remain and reignite capital inflows in periods of lower risk-aversion
Sources: IHS Global Insight, Allianz Research
-40
-20
0
20
40
60
80
100
12 13 14 15 16 17 18
Long-term average
0%
50%
100%
150%
200%
250%
In case of adverse shocks, several Emerging Markets may face liquidity crises, adversely impacting the entire EM asset class
80
85
90
95
100
105
110
115
120
125
130
0
1
2
3
4
5
6
7
03 05 07 09 11 13 15 17 19 21
Growth differential (left)
Exchange rate (right)
Appreciation
%
EMERGING MARKETS: RESILIENCE AMID VOLATILITY
23

© Copyright Allianz
7.16.6
6.36.0
5.3
4.6
3.6
7.06.4
6.15.7
5.0
4.1
3.2
0
1
2
3
4
5
6
7
8
India Vietnam China Philippines Indonesia Malaysia Thailand
18 19 20
Emerging Economies: High tides for high flyers • Emerging Markets in the region will continue to grow above
global growth on average benefitting from (i) resilient growth in China, (ii) trade diversion as corporates look for cheap alternative hubs of production (Vietnam, India, Indonesia and Philippines, e.g.) and (iii) supportive fiscal policy (Thailand). Yet tightening of monetary conditions and weaker global demand will lead to a growth deceleration
• Main risks stem from continued pressures on the currency of markets with twin deficits (India, Indonesia and Philippines), overheating risks (Vietnam and Philippines) and the outcome of elections in India, Indonesia and Thailand
Advanced Economies: Adjusting to slower global demand • Economic growth is set to slow to in line with slower global trade
especially for trade related economies (South Korea, Singapore, Hong Kong and Taiwan)
• Policymakers will use fiscal leeway's to support economic growth next year. Apart from Japan, public finances are generally sound in all markets
• High households debt (e.g. in Australia, South Korea, New Zealand), tighter global financing conditions and trade uncertainties (with a large potential impact on Singapore, Taiwan and Hong Kong) are the big ticket items that corporates and the private sector should keep in mind for 2019
GDP growth (%) GDP growth (%)
ASIA-PACIFIC: KEEPING THE SYSTEM RUNNING
2.5 2.5 2.4 2.4
2.0
1.0
2.01.9
1.71.6
1.4
0.6
0.0
0.5
1.0
1.5
2.0
2.5
3.0
3.5
Australia Korea (South) Singapore Hong Kong Taiwan Japan
18 19 20
24
© Copyright Allianz 25
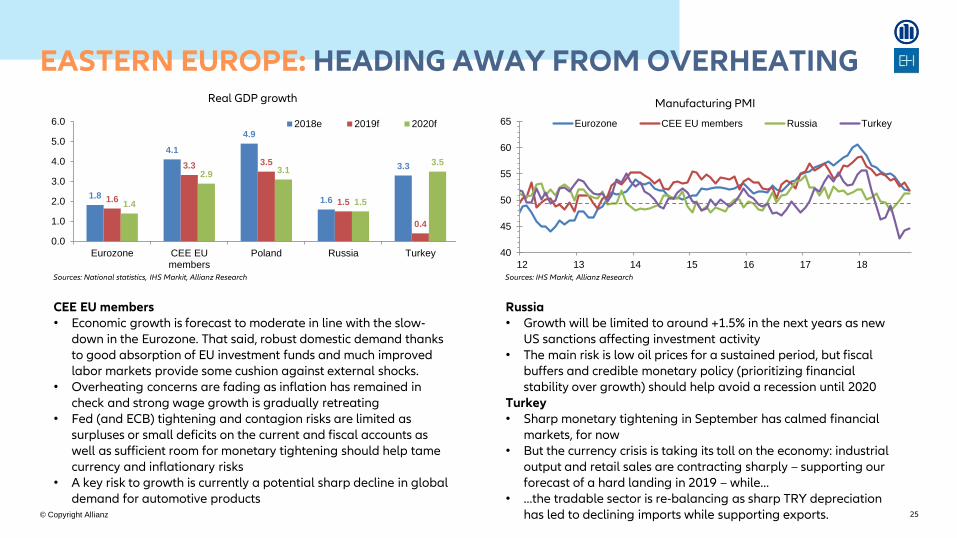
CEE EU members • Economic growth is forecast to moderate in line with the slow-
down in the Eurozone. That said, robust domestic demand thanks to good absorption of EU investment funds and much improved labor markets provide some cushion against external shocks.
• Overheating concerns are fading as inflation has remained in check and strong wage growth is gradually retreating
• Fed (and ECB) tightening and contagion risks are limited as surpluses or small deficits on the current and fiscal accounts as well as sufficient room for monetary tightening should help tame currency and inflationary risks
• A key risk to growth is currently a potential sharp decline in global demand for automotive products
Sources: National statistics, IHS Markit, Allianz Research
Russia • Growth will be limited to around +1.5% in the next years as new
US sanctions affecting investment activity • The main risk is low oil prices for a sustained period, but fiscal
buffers and credible monetary policy (prioritizing financial stability over growth) should help avoid a recession until 2020
Turkey • Sharp monetary tightening in September has calmed financial
markets, for now • But the currency crisis is taking its toll on the economy: industrial
output and retail sales are contracting sharply – supporting our forecast of a hard landing in 2019 – while…
• …the tradable sector is re-balancing as sharp TRY depreciation has led to declining imports while supporting exports.
40
45
50
55
60
65
12 13 14 15 16 17 18
Eurozone CEE EU members Russia Turkey
Manufacturing PMI
Sources: IHS Markit, Allianz Research
1.8
4.1
4.9
1.6
3.3
1.6
3.3 3.5
1.5
0.4
1.4
2.9 3.1
1.5
3.5
0.0
1.0
2.0
3.0
4.0
5.0
6.0
Eurozone CEE EUmembers
Poland Russia Turkey
2018e 2019f 2020f
EASTERN EUROPE: HEADING AWAY FROM OVERHEATING Real GDP growth

© Copyright Allianz
LATAM : POLICY RISK & END OF MONETARY EASING
26
Latin America’s activity decelerated (+1.5%, excluding Venezuela) in 2018 as Argentina sank into recession. Going forward we expect a gradual acceleration to +2% in 2019, +2.4% in 2020. Recovery still slow, and late cycle dynamics will exacerbate divergence. Two stories:
1. Financial conditions will be less favorable for corporates as monetary policy gradually shifts to tightening mode
2. B.A.M’s future contingent on policy risk: Brazil, instability of policy platform + pension reform outlook challenging; Mexico: policy choices contradicting pro-business stance; Argentina: severe austerity could fuel social discontent, mind elections in October 2019
Country risk and economic growth Latin America vulnerability scorecard: not all in the same boat
Policy rates in inflation-targeting economies
Sources: IHS, IMF, Euler Hermes, Allianz Research
Sources: IHS, IMF, Euler Hermes, Allianz Research
Sources: IHS, Euler Hermes, Allianz Research
2%
4%
6%
8%
10%
12%
14%
11 12 13 14 15 16 17 18 19
Brazil
Chile
Colombia
Mexico
Peru
Forecast
2018 2020
20182019 2020
20182019 2020
2018 2020
20182019 2020
20182019 2020
20182019 2020
20182019 2020
20182019 2020
A1
B3
D4
Brazil
Venezuela
Argentina
Chile
BB1 Peru
BB2 Mexico
BB2Uruguay
-3.0%
2.0%
2.6% 2.6%
2.3%1.3%
3.8%3.0%
3.1% 3.0%
2.5%3.0%
2.3%1.7%
-18%-5%
C4
2018 2019
Low risk
Medium risk
Sensitive risk
High risk
2020
2.0%
2.5%
-2.0%
2.0 %
-2%
2018 2019 2020
2018 2019 2020
2018 2019 20202018 2019 2020
2018 2019 2020
2018 2019 2020
2018 2019 2020
Data as of Q4 2018
2018 2019 2020
EcuadorC3
1.1%0.7%
1.3%
ColombiaBB1
2.7%
3.5%
2.5%
2019 forecasts Argentina Brazil Mexico Colombia Chile
External
vulnerabilites and
debt rollover risk
Current account
balance-1.49% -0.8% -1.9% -2.7% -0.7%
External debt (% GDP) 27% 14% 36% 31% 45%
% of foreign-
denominated debt
(2017)
51% 18% 25% 27% 40%
Reserve adequacy (Aug
18)Adequate High Adequate Adequate Low
Cycle
management
Real interest rate (Aug
18, policy rate - CPI
inflation)
11.3% 2.0% 3.1% 1.0% -0.2%
Real GDP growth -2.0% 2.3% 2.0% 3.0% 3.0%
Fiscal riskFiscal deficit -2.6% -6.7% -2.5% -2.1% -0.9%
Public debt 80% 88% 54% 48% 25%
Policy uncertainty
risk
Probability of policy
mistakesModerate High High Low Low
© Copyright Allianz 27
Real GDP growth
Sources: National statistics, IHS Markit, Allianz Research
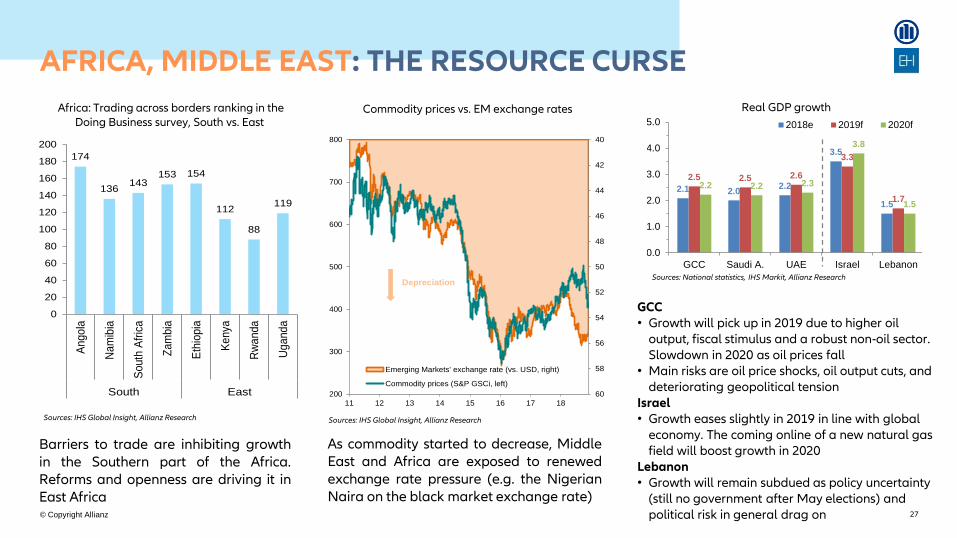
GCC • Growth will pick up in 2019 due to higher oil
output, fiscal stimulus and a robust non-oil sector. Slowdown in 2020 as oil prices fall
• Main risks are oil price shocks, oil output cuts, and deteriorating geopolitical tension
Israel • Growth eases slightly in 2019 in line with global
economy. The coming online of a new natural gas field will boost growth in 2020
Lebanon • Growth will remain subdued as policy uncertainty
(still no government after May elections) and political risk in general drag on
2.1 2.02.2
3.5
1.5
2.5 2.5 2.6
3.3
1.7
2.2 2.2 2.3
3.8
1.5
0.0
1.0
2.0
3.0
4.0
5.0
GCC Saudi A. UAE Israel Lebanon
2018e 2019f 2020f
As commodity started to decrease, Middle East and Africa are exposed to renewed exchange rate pressure (e.g. the Nigerian Naira on the black market exchange rate)
Sources: IHS Global Insight, Allianz Research
Africa: Trading across borders ranking in the Doing Business survey, South vs. East
Barriers to trade are inhibiting growth in the Southern part of the Africa. Reforms and openness are driving it in East Africa
Sources: IHS Global Insight, Allianz Research
174
136143
153 154
112
88
119
0
20
40
60
80
100
120
140
160
180
200
Ango
la
Na
mib
ia
South
Afr
ica
Zam
bia
Eth
iopia
Kenya
Rw
anda
Ug
and
a
South East
40
42
44
46
48
50
52
54
56
58
60200
300
400
500
600
700
800
11 12 13 14 15 16 17 18
Emerging Markets' exchange rate (vs. USD, right)
Commodity prices (S&P GSCi, left)
Depreciation
AFRICA, MIDDLE EAST: THE RESOURCE CURSE
Commodity prices vs. EM exchange rates

© Copyright Allianz
THANK YOU!
Ph
oto
by
raw
pix
el.c
om
on
Un
spla
sh
Economic research Department
Q4 2018