closing conference of the bis cca research network€¦ · · 2016-08-23closing conference of the...
TRANSCRIPT

Closing conference of the BIS CCA Research Network
Mexico CityThursday 18 and Friday 19 August 2016

Volatility Risk Premium of Commodities Currencies
Assessing the Predictive Ability
Jose Renato Haas Ornelas and Roberto Baltieri MauadResearch Department

3
Disclaimer
The views expressed in this
work are those of the authors
and do not necessarily reflect
those of the Banco Central do
Brasil or its members.

4
Main Idea
Can volatility risk premium of the commodities currencies predict
commodities and other assets returns?
Volatility Risk Premium: difference between an implied volatility and a realized volatility

5
What we did since last year
• We included a new block of dependent variables (bonds)
• Conducted a “differential analysis”, using the VoRP of CC – non CC as a regressor
• Performed a pseudo-out-of-sample assessment of our predictorsagainst a random walk
• Focus on one-week ATM volatilities (monthly model-freevolatilities moved to the appendix)

6
Motivation
• On equity markets, Variance Risk Premium (VRP) can predict future equity returns (Bollerslev et al, 2009) – Intuition: when risk aversion sentiment increases (decreases),
equity prices are quickly discounted, resulting in high (low) futures returns.
• Commodities Currencies VRP also predict well future currency and other assets returns
• Chen et al (2010): the so-called commodities currencies returns are able to predict many commodities– Intuition: exchange rates are more forward-looking than
commodities prices

7
Intuition and Results
• Our results: High Volatility Risk Premium (VRP) from commodities currencies leads to positive future returns for most commodities
– Results extended for other asset classes
• Intuition: when risk aversion sentiment increases, the market quickly discounts the risky asset (commodity), and later this discount is accrued, leading to positive returns

8
Commodities and risk aversion
• Commodities are treated as risky asset in this case:
– Financialization of commodity markets
– The BCB itself has been trading commodities withinternational reserves
• Risk aversion sentiment:
– We do not use an emerging market VoRP on equity index dueto data unavailability
9
Literature
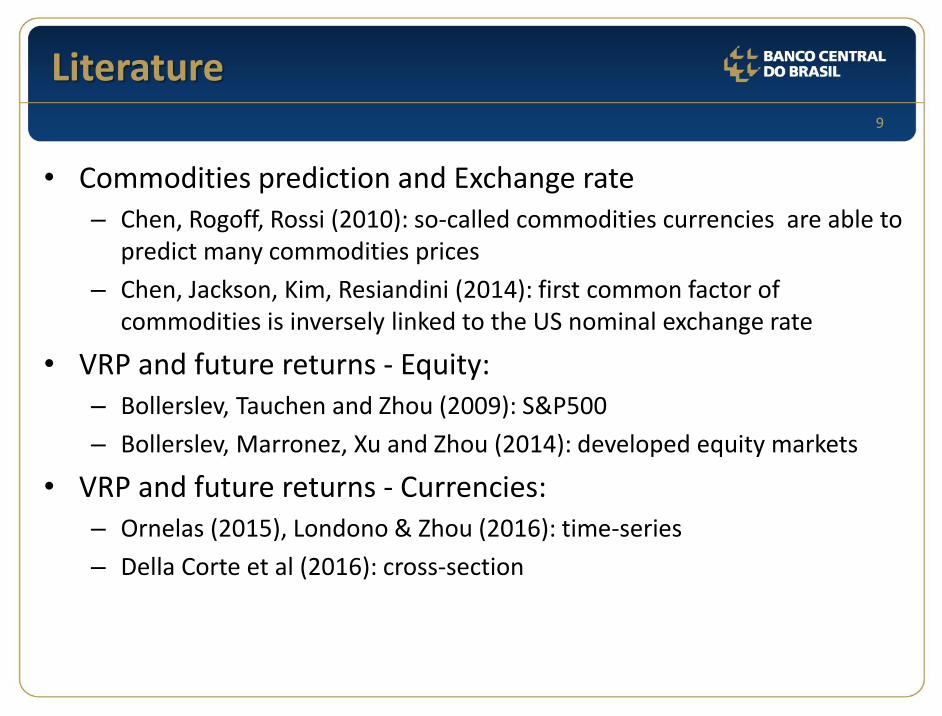
• Commodities prediction and Exchange rate– Chen, Rogoff, Rossi (2010): so-called commodities currencies are able to
predict many commodities prices
– Chen, Jackson, Kim, Resiandini (2014): first common factor of commodities is inversely linked to the US nominal exchange rate
• VRP and future returns - Equity:– Bollerslev, Tauchen and Zhou (2009): S&P500
– Bollerslev, Marronez, Xu and Zhou (2014): developed equity markets
• VRP and future returns - Currencies:– Ornelas (2015), Londono & Zhou (2016): time-series
– Della Corte et al (2016): cross-section
10
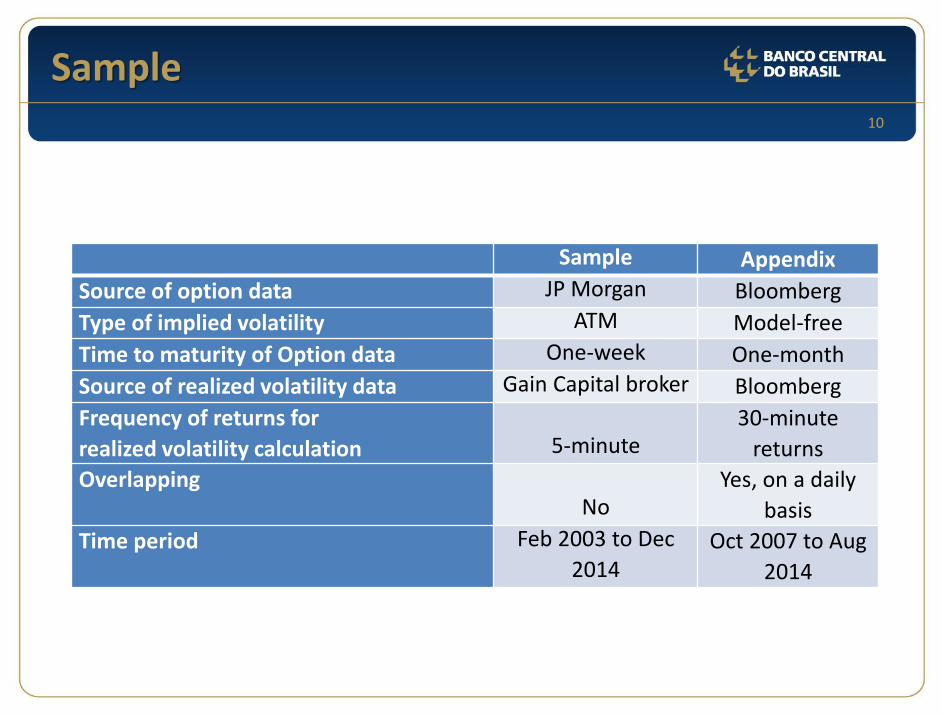
Sample
Sample Appendix
Source of option data JP Morgan Bloomberg
Type of implied volatility ATM Model-free
Time to maturity of Option data One-week One-month
Source of realized volatility data Gain Capital broker Bloomberg
Frequency of returns for
realized volatility calculation 5-minute 30-minute
returns
OverlappingNo
Yes, on a daily
basis
Time period Feb 2003 to Dec
2014Oct 2007 to Aug
2014
11
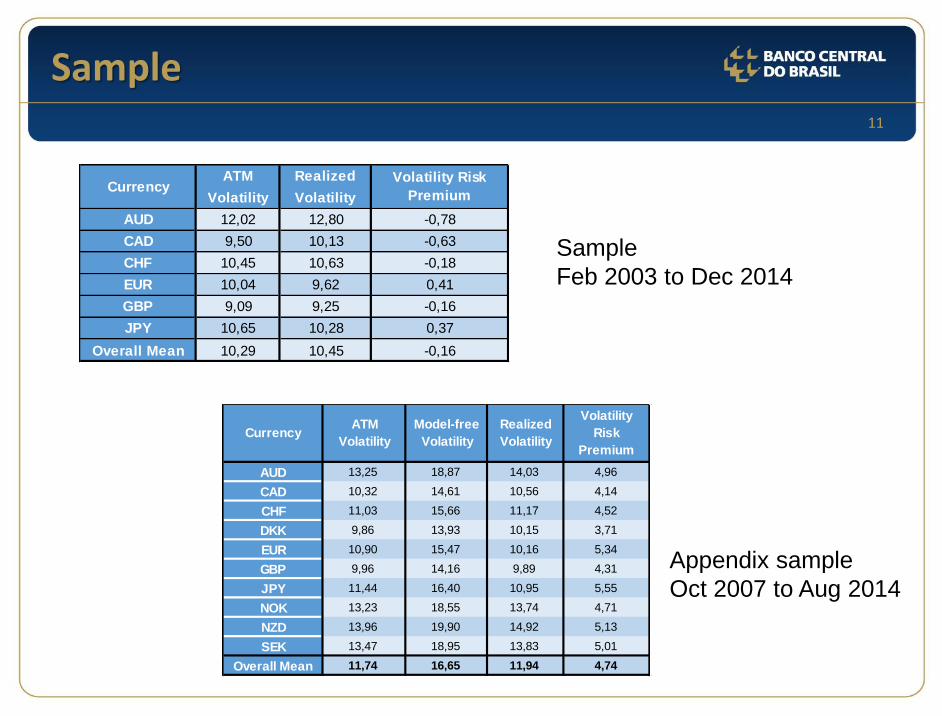
Sample
Sample
Feb 2003 to Dec 2014
Appendix sample
Oct 2007 to Aug 2014
ATM Realized
Volatility Volatility
AUD 12,02 12,80 -0,78
CAD 9,50 10,13 -0,63
CHF 10,45 10,63 -0,18
EUR 10,04 9,62 0,41
GBP 9,09 9,25 -0,16
JPY 10,65 10,28 0,37
Overall Mean 10,29 10,45 -0,16
CurrencyVolatility Risk
Premium
AUD 13,25 18,87 14,03 4,96
CAD 10,32 14,61 10,56 4,14
CHF 11,03 15,66 11,17 4,52
DKK 9,86 13,93 10,15 3,71
EUR 10,90 15,47 10,16 5,34
GBP 9,96 14,16 9,89 4,31
JPY 11,44 16,40 10,95 5,55
NOK 13,23 18,55 13,74 4,71
NZD 13,96 19,90 14,92 5,13
SEK 13,47 18,95 13,83 5,01
Overall Mean 11,74 16,65 11,94 4,74
Volatility
Risk
Premium
CurrencyATM
Volatility
Model-free
Volatility
Realized
Volatility

12
Volatility Calculation
• Tick-by-tick quotes provided by Gain Capital on their website
• Calculation of 5-minute log returns
• Realized volatility calculated based on 5-minutes returns each week
• Data consists of 12 years of non-overlapping weekly volatilities (Feb. 2003 to Dec. 2014)
• Implied volatility: OTC exchange rate options (from JP Morgan’s data query application)

13
VRP Calculation
• The traditional way: current (date t) implied volatility and past realized volatility (t - ∆𝑡 to t)
Implied
or Risk-neutral
Realized or
physical
• Another approach: implied volatility and realized volatility for the same period of the forecast.
Implied
or Risk-neutralRealized or
physical
𝑉𝑅𝑃𝑏𝑎𝑐𝑘 = 𝐸ℚ 𝜎𝑡,𝑡+∆𝑡 − 𝐸ℙ 𝜎𝑡,𝑡+∆𝑡 = 𝐸ℚ 𝜎𝑡,𝑡+∆𝑡 − 𝜎𝑡−∆𝑡,𝑡
𝑉𝑅𝑃𝑓𝑤𝑑 = 𝐸ℚ 𝜎𝑡−∆𝑡,𝑡 − 𝐸ℙ 𝜎𝑡−∆𝑡,𝑡 = 𝐸ℚ 𝜎𝑡−∆𝑡,𝑡 − 𝜎𝑡−∆𝑡,𝑡
14
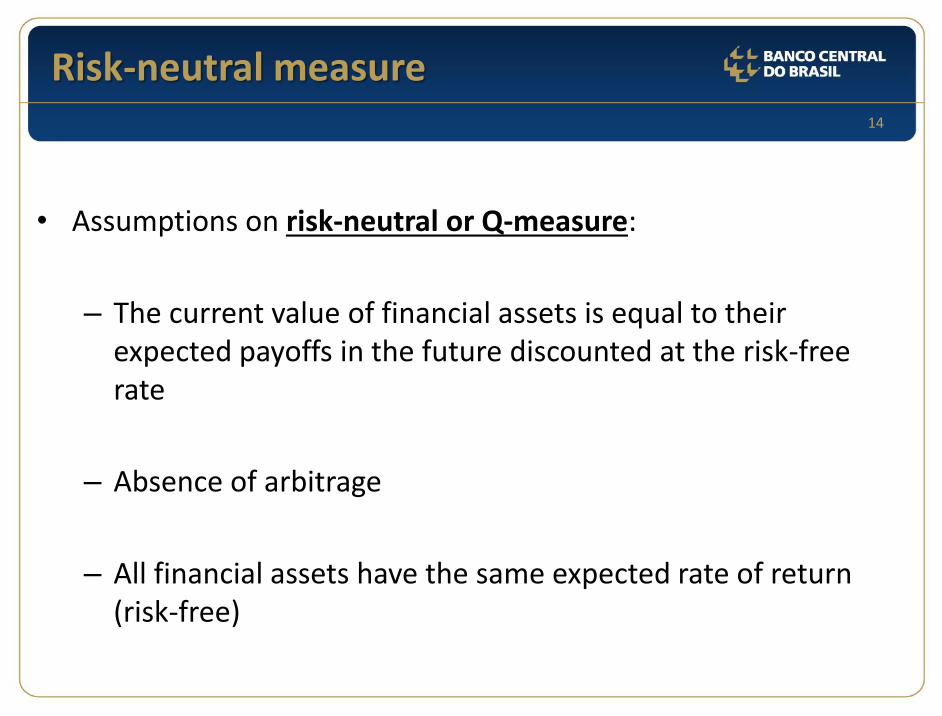
Risk-neutral measure
• Assumptions on risk-neutral or Q-measure:
– The current value of financial assets is equal to their expected payoffs in the future discounted at the risk-free rate
– Absence of arbitrage
– All financial assets have the same expected rate of return (risk-free)
15
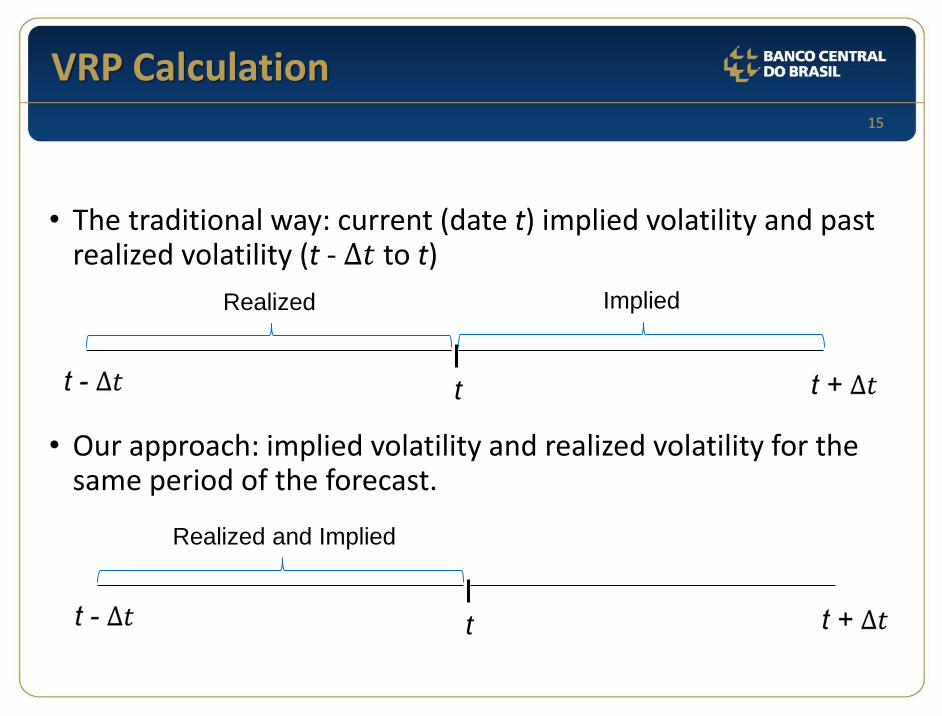
VRP Calculation
• The traditional way: current (date t) implied volatility and past realized volatility (t - ∆𝑡 to t)
• Our approach: implied volatility and realized volatility for the same period of the forecast.
Realized Implied
t
Realized and Implied
t

16
VRP Calculation
• Forecast error:
Implied
or Risk-
neutral
Realized
or
physical
Ideally
𝑉𝑅𝑃 = 𝐸ℚ 𝜎𝑡,𝑡+∆𝑡 − 𝐸ℙ 𝜎𝑡,𝑡+∆𝑡
𝑒𝑡−∆𝑡,𝑡 = 𝐸ℙ 𝜎𝑡−∆𝑡,𝑡 − 𝜎𝑡−∆𝑡,𝑡
𝑒𝑡,𝑡+∆𝑡 = 𝐸ℙ 𝜎𝑡,𝑡+∆𝑡 − 𝜎𝑡,𝑡+∆𝑡 − 𝜎𝑡−∆𝑡,𝑡 − 𝜎𝑡−∆𝑡,𝑡
𝑉𝑅𝑃𝑓𝑤𝑑 = 𝐸ℚ 𝜎𝑡−∆𝑡,𝑡 − 𝜎𝑡−∆𝑡,𝑡 − 𝑒𝑡−∆𝑡,𝑡
∆𝜎𝑡−∆𝑡,𝑡+∆𝑡
𝑉𝑅𝑃𝑏𝑎𝑐𝑘 = 𝐸ℚ 𝜎𝑡,𝑡+∆𝑡 − 𝜎𝑡−∆𝑡,𝑡−∆𝜎𝑡−∆𝑡,𝑡+∆𝑡 − 𝑒𝑡,𝑡+∆𝑡
17
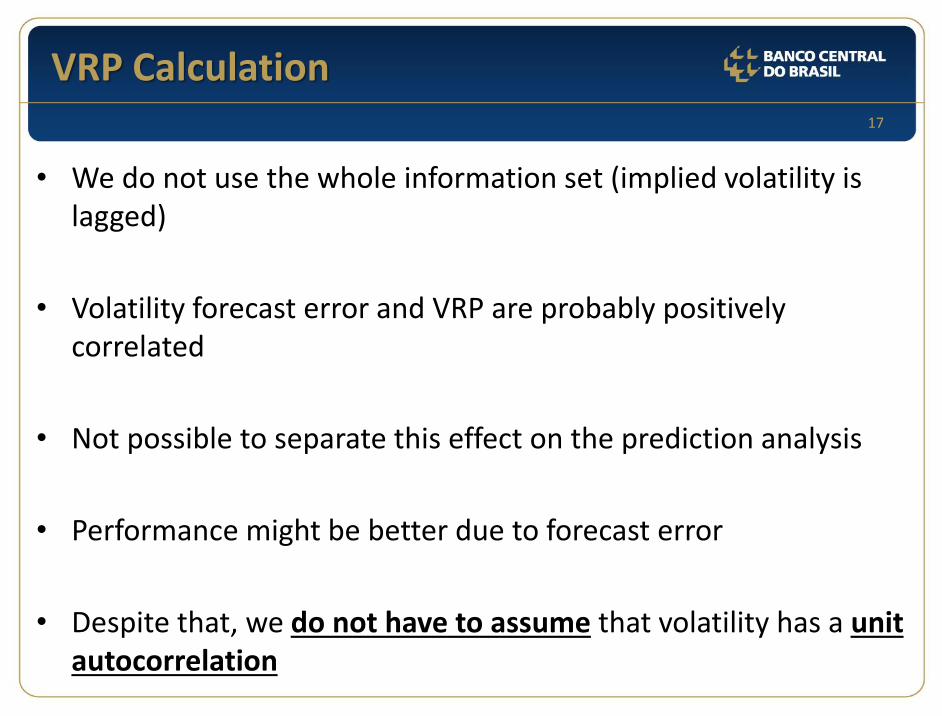
VRP Calculation
• We do not use the whole information set (implied volatility is lagged)
• Volatility forecast error and VRP are probably positively correlated
• Not possible to separate this effect on the prediction analysis
• Performance might be better due to forecast error
• Despite that, we do not have to assume that volatility has a unit autocorrelation

18
Results – Baseline Regressions
𝑅𝑡 = 𝛼 + 𝛽1𝑅𝑡−1 + 𝛽2𝑉𝑅𝑃𝑡−1 + 𝜀𝑡
Commodities and Currencies
CCnon
CCCC
non
CCCC
non
CCCC
non
CCCC
non
CCCC
non
CC
Broa d Spot 14,5 8,8 22,3 22,6 4,03*** 2,02** 6,06*** 1,55 5,5% 1,3% 4,6% 1,1%
Ene rgy 14,8 8,7 24,8 20,3 2,44** 1,35 3,76*** 0,99 2,2% 0,5% 2,2% 0,4%
Agric ulture 13,5 9,2 19,8 25,4 3,51*** 1,82* 4,46*** 1,51 3,5% 1,1% 2,7% 1,1%
Indust Me ta ls 18,8 15,4 28,7 41,0 3,87*** 2,28** 5,17*** 1,81* 5,1% 2,1% 4,3% 1,9%
Pre c . Me ta ls 11,4 2,7 12,8 2,8 3,39*** 0,53 2,58*** 0,18 2,3% 0,1% 1,0% 0,0%
Crude Oil 20,4 9,4 34,9 12,6 2,62*** 1,11 3,61*** 0,45 3,6% 0,7% 3,7% 0,4%
Dolla r Inde x -4,5 -2,5 -6,9 -9,2 -3 ,36*** -1,05 -9 ,93*** -1,27 2,6% 0,5% 2,2% 0,9%
EM Curre nc y Inde x (JPM) 10,6 9,5 17,1 26,4 5,78*** 3,53*** 11,58*** 3,05*** 15,9% 7,9% 14,5% 7,9%
La ta m FX Inde x 11,9 11,5 20,6 33,1 4,27*** 3,11*** 9,28*** 2,49** 15,1% 8,7% 15,6% 9,1%
Asia FX Inde x 2,9 2,4 4,4 7,4 4,54*** 2,10** 7,04*** 1,98** 7,0% 3,2% 5,8% 3,7%
Panel B - Currencies
Panel A - Commodities
Dependent Variables
Coefficients HH t-stats Adjusted R2
VoRP VaRP VoRP VaRP VoRP VaRP
• Strong significance for CC VoRP in this specification

19
Results – Baseline Regressions
𝑅𝑡 = 𝛼 + 𝛽1𝑅𝑡−1 + 𝛽2𝑉𝑅𝑃𝑡−1 + 𝜀𝑡
Equities and Bonds
CCnon
CCCC
non
CCCC
non
CCCC
non
CCCC
non
CCCC
non
CC
MSCI World 23,2 18,7 41,8 51,6 3,60*** 2,60*** 7,04*** 1,91* 14,7% 6,0% 16,5% 5,8%
MSCI EM 31,3 25,9 51,8 70,0 5,41*** 3,36*** 10,17*** 2,71*** 15,7% 6,7% 15,0% 6,2%
Russe ll 2 0 0 0 18,7 14,9 33,5 37,0 3,08*** 2,02** 5,08*** 1,41 6,0% 2,5% 6,7% 2,0%
MSCI Ene rgy 30,4 22,4 52,7 62,1 3,69*** 2,74*** 6,28*** 2,02** 13,6% 4,8% 14,2% 4,7%
SP5 0 0 19,4 15,2 36,1 40,1 3,07*** 2,34** 5,50*** 1,63 11,0% 4,5% 13,2% 4,1%
10 - ye a r T- Bond - US -0,3 -0,8 -0,3 -2,4 -1,35 -1,85* -1,20 -2 ,14** 0,5% 1,2% 0,4% 1,4%
10 - ye a r T- Bond - Ge rma ny -0,2 -0,6 -0,2 -1,7 -1,48 -1,97** -1,05 -2 ,07** 1,2% 1,7% 1,0% 1,9%
10 - ye a r T- Bond - Ja pa n -0,1 -0,3 -0,2 -0,7 -1,91* -2,37** -3,38*** -2,29** 0,5% 0,9% 0,4% 0,8%
10 - ye a r T- Bond - Austra lia -0,3 -0,8 -0,6 -2,7 -1,43 -1,81* -2,31** -2,06** 1,4% 2,1% 1,4% 2,5%
10 - ye a r T- Bond - Ca na da -0,0 -0,4 -0,0 -1,3 -0,23 -1,44 -0,10 -1,79* 0,3% 0,8% 0,3% 0,9%
US Corpora te Spre a ds (A) -0,7 -0,5 -1,4 -1,5 -2 ,55** -2,10** -6,43*** -1,82* 15,6% 11,8% 19,4% 12,4%
US Corpora te Spre a ds (BBB) -0,4 -0,4 -1,0 -1,3 -2 ,14** -2,36** -9,54*** -3,37*** 9,8% 8,9% 11,5% 9,5%
Panel D - Bonds
Adjusted R2
VoRP VaRP VoRP VaRP VoRP VaRPDependent Variables
Panel C - Equities
Coefficients HH t-stats
• For bonds, dependent variable is ∆𝑦
20
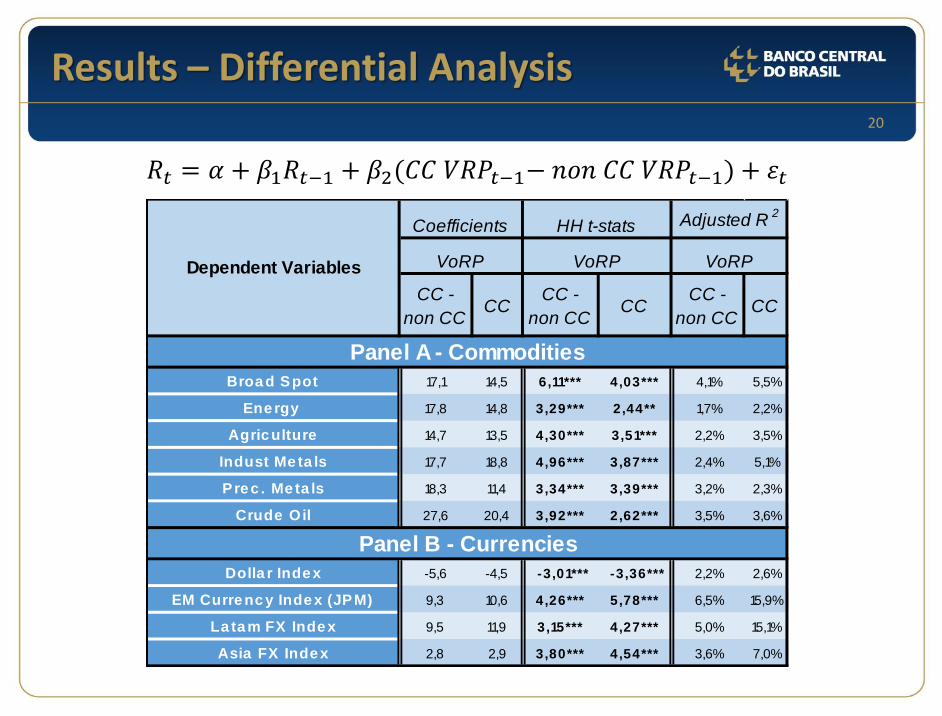
Results – Differential Analysis
𝑅𝑡 = 𝛼 + 𝛽1𝑅𝑡−1 + 𝛽2(𝐶𝐶 𝑉𝑅𝑃𝑡−1− 𝑛𝑜𝑛 𝐶𝐶 𝑉𝑅𝑃𝑡−1) + 𝜀𝑡
CC -
non CCCC
CC -
non CCCC
CC -
non CCCC
Broa d Spot 17,1 14,5 6,11*** 4,03*** 4,1% 5,5%
Ene rgy 17,8 14,8 3,29*** 2,44** 1,7% 2,2%
Agric ulture 14,7 13,5 4,30*** 3,51*** 2,2% 3,5%
Indust Me ta ls 17,7 18,8 4,96*** 3,87*** 2,4% 5,1%
Pre c . Me ta ls 18,3 11,4 3,34*** 3,39*** 3,2% 2,3%
Crude Oil 27,6 20,4 3,92*** 2,62*** 3,5% 3,6%
Dolla r Inde x -5,6 -4,5 -3 ,01*** -3,36*** 2,2% 2,6%
EM Curre nc y Inde x (JPM) 9,3 10,6 4,26*** 5,78*** 6,5% 15,9%
La ta m FX Inde x 9,5 11,9 3,15*** 4,27*** 5,0% 15,1%
Asia FX Inde x 2,8 2,9 3,80*** 4,54*** 3,6% 7,0%
Adjusted R2
VoRP VoRP VoRP
Panel B - Currencies
Panel A - Commodities
Dependent Variables
Coefficients HH t-stats

21
Results – Long Term Returns
𝐿𝑇𝑅𝑡,𝑡+𝑛 = 𝛼 + 𝛽1𝑉𝑜𝑅𝑃𝑡−1 + 𝜀𝑡
1 week 2 weeks 3 weeks 5 weeks 10 weeks 15 weeks 20 weeks
Broad Spot 14,2*** 8,1*** 7,3*** 4,5* 3,9* 2,4 2,0
Energy 14,4** 8,8*** 7,6** 5,0 5,0* 4,0 3,7*
Agriculture 13,7*** 7,3*** 6,0** 3,2 3,1* 1,0 0,8
Indust Metals 19,2*** 11,4*** 10,8*** 7,4** 5,9** 4,3** 3,5*
Prec. Metals 11,5*** 4,9* 5,5*** 3,1** 1,8*** 0,6 -0,6
Crude Oil 20,2*** 13,0*** 8,9* 6,2 5,6 4,6 4,4
Dollar Index -4,6*** -1,8** -2,3*** -1,9*** -0,7 -0,3 -0,3
EM Currency Index (JPM) 10,6*** 5,0*** 4,3*** 2,6*** 1,7** 1,2** 1,0*
Latam FX Index 12,0*** 4,9*** 4,4*** 2,9** 2,2** 1,5** 1,2
Asia FX Index 3,1*** 1,5*** 1,6*** 1,0*** 0,6** 0,4** 0,4*
Dependent VariableCoefficients of Commodities Currencies Volatility Risk Premium
Panel A - Commodities
Panel B - Currencies
• Significance up to almost ten weeks
22
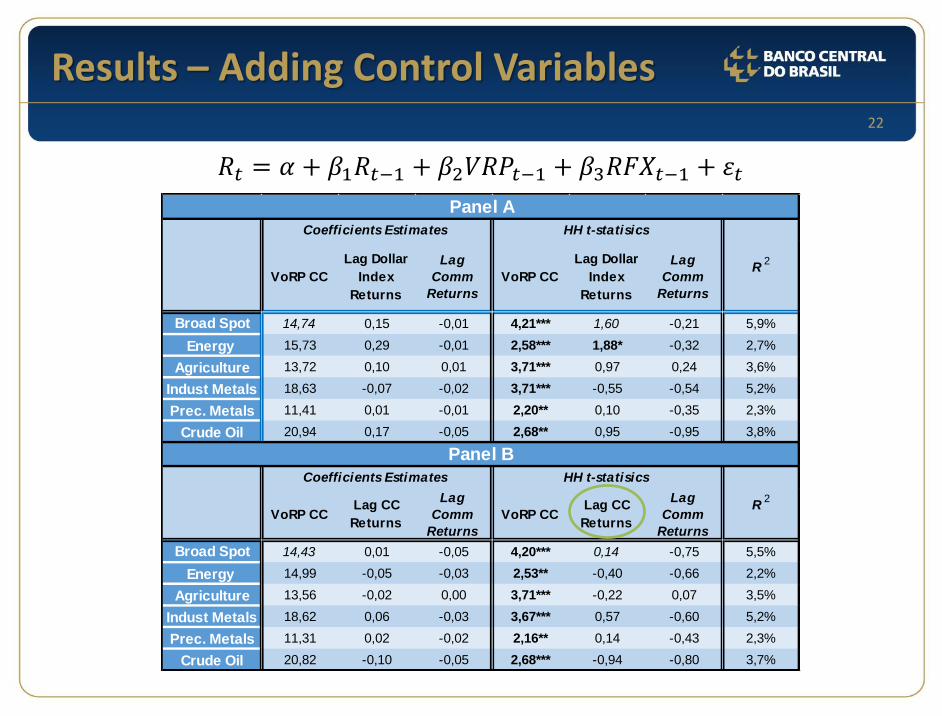
Results – Adding Control Variables
𝑅𝑡 = 𝛼 + 𝛽1𝑅𝑡−1 + 𝛽2𝑉𝑅𝑃𝑡−1 + 𝛽3𝑅𝐹𝑋𝑡−1 + 𝜀𝑡
VoRP CC
Lag Dollar
Index
Returns
Lag
Comm
Returns
VoRP CC
Lag Dollar
Index
Returns
Lag
Comm
Returns
Broad Spot 14,74 0,15 -0,01 4,21*** 1,60 -0,21 5,9%
Energy 15,73 0,29 -0,01 2,58*** 1,88* -0,32 2,7%
Agriculture 13,72 0,10 0,01 3,71*** 0,97 0,24 3,6%
Indust Metals 18,63 -0,07 -0,02 3,71*** -0,55 -0,54 5,2%
Prec. Metals 11,41 0,01 -0,01 2,20** 0,10 -0,35 2,3%
Crude Oil 20,94 0,17 -0,05 2,68** 0,95 -0,95 3,8%
VoRP CCLag CC
Returns
Lag
Comm
Returns
VoRP CCLag CC
Returns
Lag
Comm
Returns
Broad Spot 14,43 0,01 -0,05 4,20*** 0,14 -0,75 5,5%
Energy 14,99 -0,05 -0,03 2,53** -0,40 -0,66 2,2%
Agriculture 13,56 -0,02 0,00 3,71*** -0,22 0,07 3,5%
Indust Metals 18,62 0,06 -0,03 3,67*** 0,57 -0,60 5,2%
Prec. Metals 11,31 0,02 -0,02 2,16** 0,14 -0,43 2,3%
Crude Oil 20,82 -0,10 -0,05 2,68*** -0,94 -0,80 3,7%
Coefficients Estimates HH t-statisics
R2
Panel A
Coefficients Estimates HH t-statisics
R2
Panel B
23
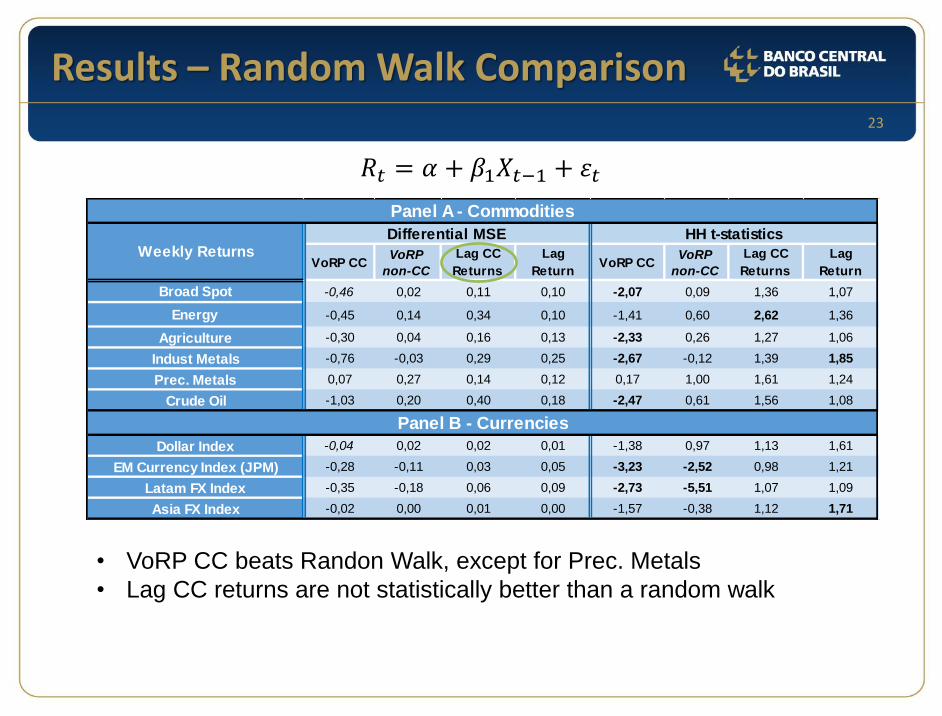
Results – Random Walk Comparison
𝑅𝑡 = 𝛼 + 𝛽1𝑋𝑡−1 + 𝜀𝑡
VoRP CCVoRP
non-CC
Lag CC
Returns
Lag
ReturnVoRP CC
VoRP
non-CC
Lag CC
Returns
Lag
Return
Broad Spot -0,46 0,02 0,11 0,10 -2,07 0,09 1,36 1,07
Energy -0,45 0,14 0,34 0,10 -1,41 0,60 2,62 1,36
Agriculture -0,30 0,04 0,16 0,13 -2,33 0,26 1,27 1,06
Indust Metals -0,76 -0,03 0,29 0,25 -2,67 -0,12 1,39 1,85
Prec. Metals 0,07 0,27 0,14 0,12 0,17 1,00 1,61 1,24
Crude Oil -1,03 0,20 0,40 0,18 -2,47 0,61 1,56 1,08
Dollar Index -0,04 0,02 0,02 0,01 -1,38 0,97 1,13 1,61
EM Currency Index (JPM) -0,28 -0,11 0,03 0,05 -3,23 -2,52 0,98 1,21
Latam FX Index -0,35 -0,18 0,06 0,09 -2,73 -5,51 1,07 1,09
Asia FX Index -0,02 0,00 0,01 0,00 -1,57 -0,38 1,12 1,71
Panel A - Commodities
Weekly ReturnsDifferential MSE HH t-statistics
Panel B - Currencies
• VoRP CC beats Randon Walk, except for Prec. Metals
• Lag CC returns are not statistically better than a random walk
24
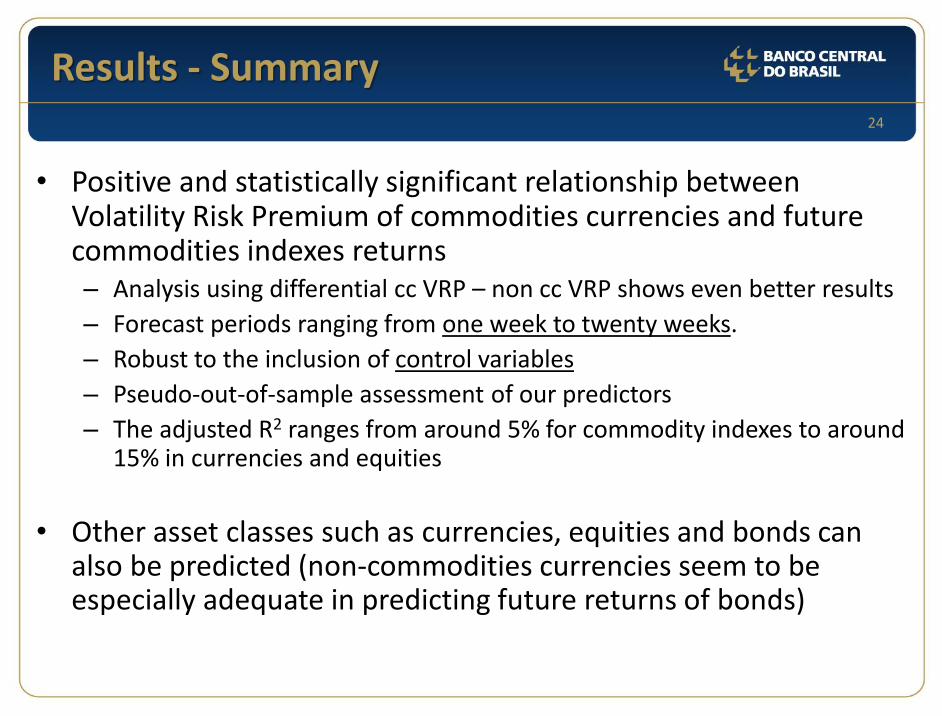
Results - Summary
• Positive and statistically significant relationship between Volatility Risk Premium of commodities currencies and future commodities indexes returns– Analysis using differential cc VRP – non cc VRP shows even better results
– Forecast periods ranging from one week to twenty weeks.
– Robust to the inclusion of control variables
– Pseudo-out-of-sample assessment of our predictors
– The adjusted R2 ranges from around 5% for commodity indexes to around 15% in currencies and equities
• Other asset classes such as currencies, equities and bonds can also be predicted (non-commodities currencies seem to be especially adequate in predicting future returns of bonds)

25
Appendix

26
Comparison – Realized and Implied
Realized ImpliedImplied
with lagRealized Implied
Implied
with lagRealized Implied
Implied
with lag
Broad Spot -4,02 -1,68 -1,63 -2,12 -0,96 -0,92 2,4% 0,4% 0,4%
Energy -5,75 -3,75 -3,54 -2,56 -1,69 -1,56 1,9% 0,8% 0,7%
Agriculture -2,55 -0,23 -0,23 -1,20 -0,11 -0,11 0,8% 0,1% 0,1%
Indust Me ta ls -6,31 -3,20 -3,30 -2,39 -1,21 -1,24 3,2% 0,8% 0,8%
Prec . Me ta ls -1,19 0,93 0,90 -0,66 0,44 0,42 0,1% 0,1% 0,1%
Crude Oil -9,24 -6,39 -6,30 -2,73 -1,80 -1,75 4,1% 1,9% 1,8%
Panel A - Commodities
Dependent Variables
Coefficients HH t-stats Adjusted R2
• Testing realized and implied volatility separately
• Realized volatility shows more significance than implied volatility
• High significance might be explained by the short window (one week)
27
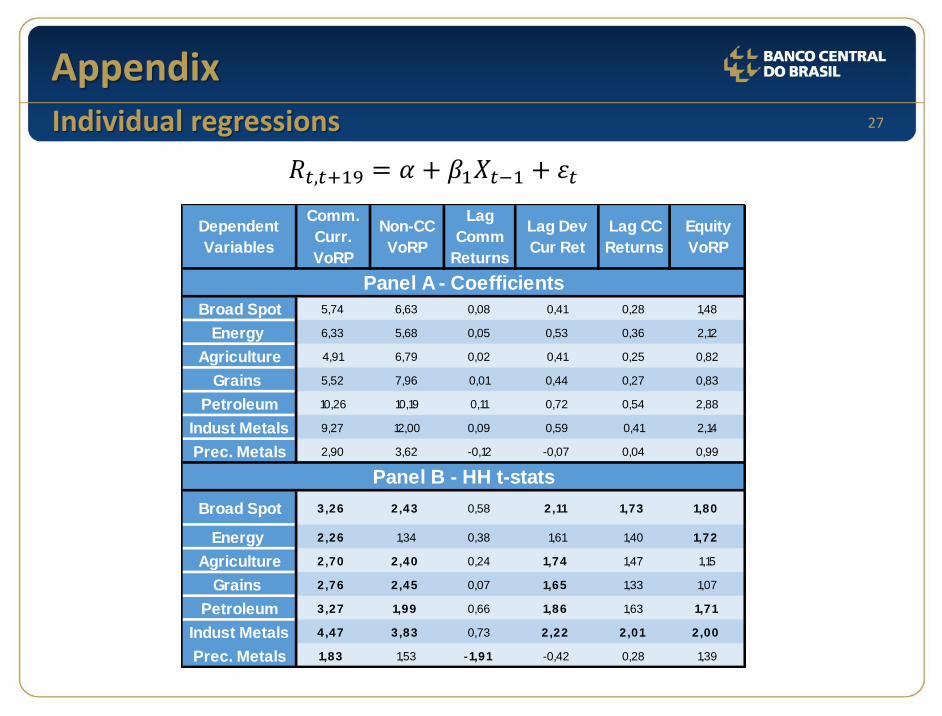
Appendix
𝑅𝑡,𝑡+19 = 𝛼 + 𝛽1𝑋𝑡−1 + 𝜀𝑡
Individual regressions
Dependent
Variables
Comm.
Curr.
VoRP
Non-CC
VoRP
Lag
Comm
Returns
Lag Dev
Cur Ret
Lag CC
Returns
Equity
VoRP
Broad Spot 5,74 6,63 0,08 0,41 0,28 1,48
Energy 6,33 5,68 0,05 0,53 0,36 2,12
Agriculture 4,91 6,79 0,02 0,41 0,25 0,82
Grains 5,52 7,96 0,01 0,44 0,27 0,83
Petroleum 10,26 10,19 0,11 0,72 0,54 2,88
Indust Metals 9,27 12,00 0,09 0,59 0,41 2,14
Prec. Metals 2,90 3,62 -0,12 -0,07 0,04 0,99
Broad Spot 3,26 2,43 0,58 2,11 1,73 1,80
Energy 2,26 1,34 0,38 1,61 1,40 1,72
Agriculture 2,70 2,40 0,24 1,74 1,47 1,15
Grains 2,76 2,45 0,07 1,65 1,33 1,07
Petroleum 3,27 1,99 0,66 1,86 1,63 1,71
Indust Metals 4,47 3,83 0,73 2,22 2,01 2,00
Prec. Metals 1,83 1,53 -1,91 -0,42 0,28 1,39
Panel B - HH t-stats
Panel A - Coefficients
28
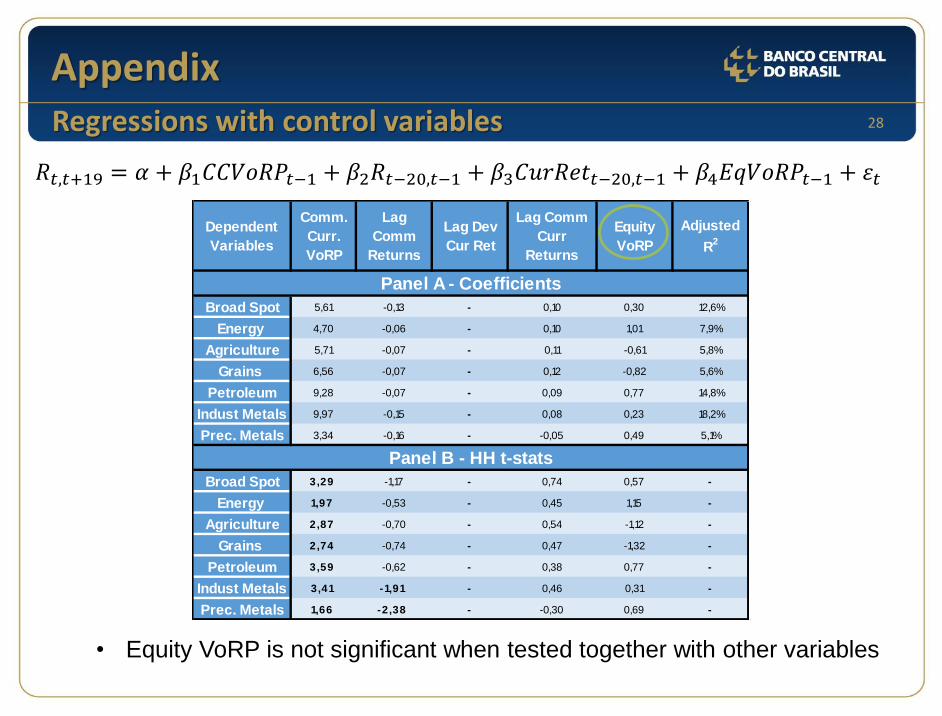
Appendix
𝑅𝑡,𝑡+19 = 𝛼 + 𝛽1𝐶𝐶𝑉𝑜𝑅𝑃𝑡−1 + 𝛽2𝑅𝑡−20,𝑡−1 + 𝛽3𝐶𝑢𝑟𝑅𝑒𝑡𝑡−20,𝑡−1 + 𝛽4𝐸𝑞𝑉𝑜𝑅𝑃𝑡−1 + 𝜀𝑡
Regressions with control variables
Broad Spot 5,61 -0,13 - 0,10 0,30 12,6%
Energy 4,70 -0,06 - 0,10 1,01 7,9%
Agriculture 5,71 -0,07 - 0,11 -0,61 5,8%
Grains 6,56 -0,07 - 0,12 -0,82 5,6%
Petroleum 9,28 -0,07 - 0,09 0,77 14,8%
Indust Metals 9,97 -0,15 - 0,08 0,23 18,2%
Prec. Metals 3,34 -0,16 - -0,05 0,49 5,1%
Broad Spot 3,29 -1,17 - 0,74 0,57 -
Energy 1,97 -0,53 - 0,45 1,15 -
Agriculture 2,87 -0,70 - 0,54 -1,12 -
Grains 2,74 -0,74 - 0,47 -1,32 -
Petroleum 3,59 -0,62 - 0,38 0,77 -
Indust Metals 3,41 -1,91 - 0,46 0,31 -
Prec. Metals 1,66 -2,38 - -0,30 0,69 -
Comm.
Curr.
VoRP
Lag
Comm
Returns
Lag Dev
Cur Ret
Lag Comm
Curr
Returns
Equity
VoRP
Panel A - Coefficients
Dependent
Variables
Panel B - HH t-stats
Adjusted
R2
• Equity VoRP is not significant when tested together with other variables