cloetta - investor road show april 2016
TRANSCRIPT

Roadshow April 2016
Title
Arial, Bold, 40 pt, red
Text/Bullets, Level 1-5
Arial, Regular, 20 pt, grey
Subtitle
Arial, Bold, 40 pt, grey
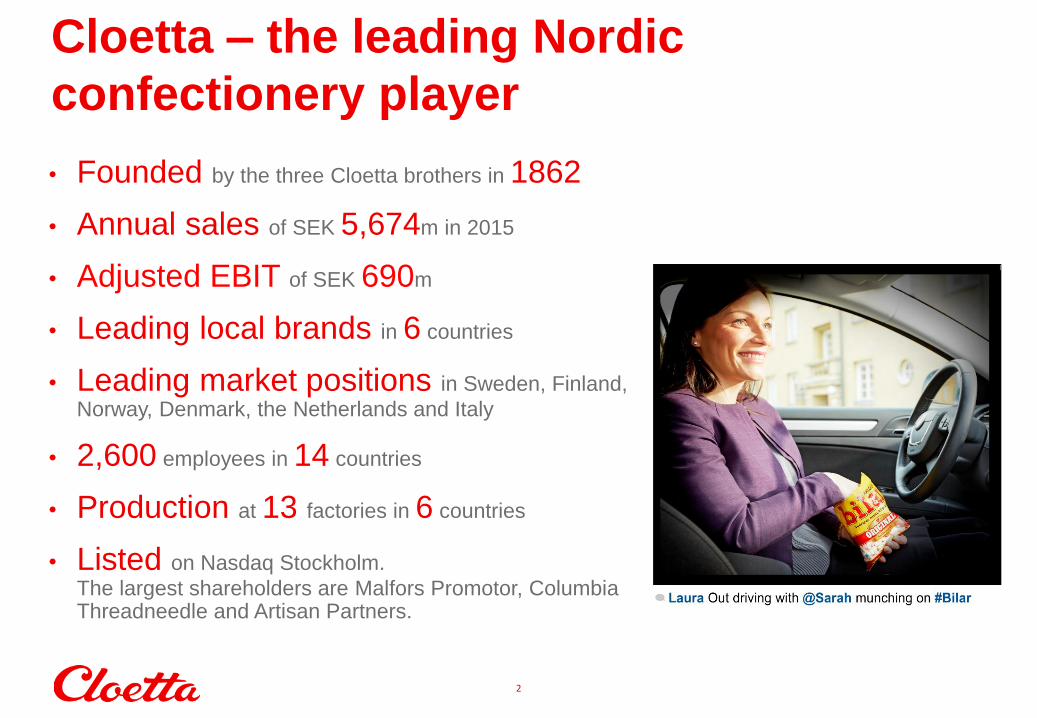
Cloetta – the leading Nordic
confectionery player
• Founded by the three Cloetta brothers in 1862
• Annual sales of SEK 5,674m in 2015
• Adjusted EBIT of SEK 690m
• Leading local brands in 6 countries
• Leading market positions in Sweden, Finland,
Norway, Denmark, the Netherlands and Italy
• 2,600 employees in 14 countries
• Production at 13 factories in 6 countries
• Listed on Nasdaq Stockholm.
The largest shareholders are Malfors Promotor, Columbia Threadneedle and Artisan Partners.
2

Title
Arial, Bold, 40 pt, red
Text/Bullets, Level 1-5
Arial, Regular, 20 pt, grey
Subtitle
Arial, Bold, 40 pt, grey
Cloetta is all about
Munchy Moments
To bring a smile to your
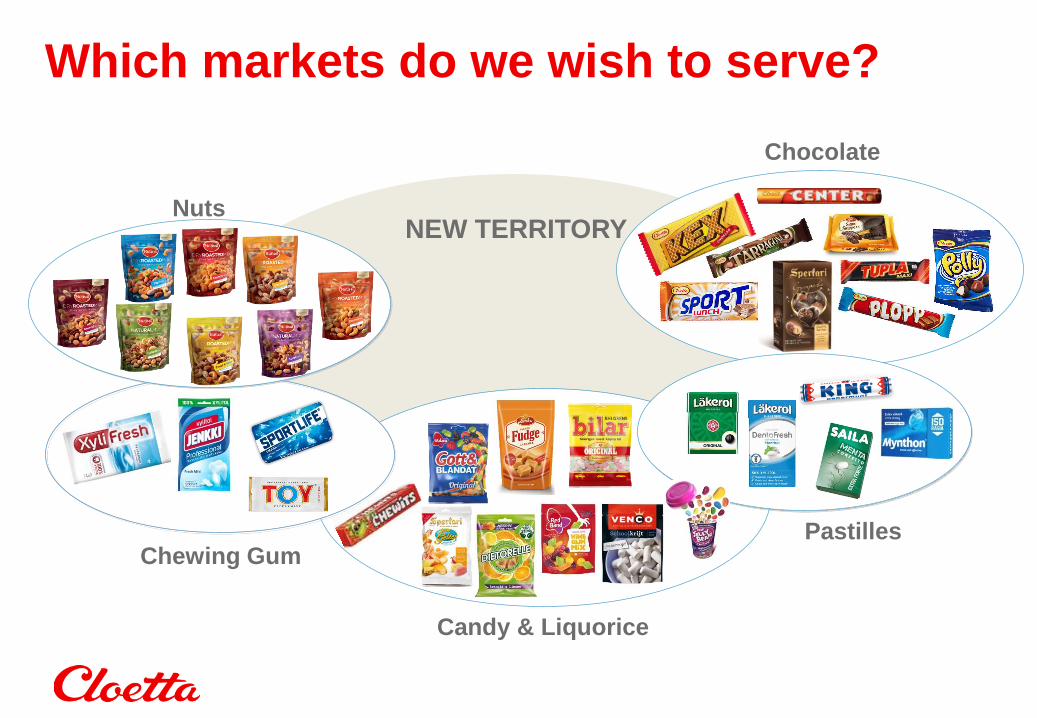
Nuts NEW TERRITORY
Which markets do we wish to serve?
Candy & Liquorice
Chewing Gum Pastilles
Chocolate

Title
Arial, Bold, 40 pt, red
Text/Bullets, Level 1-5
Arial, Regular, 20 pt, grey
Subtitle
Arial, Bold, 40 pt, grey
Photo: Joakim Folke and
www.fotoakuten.se
Munchy Moments is our territory!
Title
Arial, Bold, 40 pt, red
Text/Bullets, Level 1-5
Arial, Regular, 20 pt, grey
Subtitle
Arial, Bold, 40 pt, grey
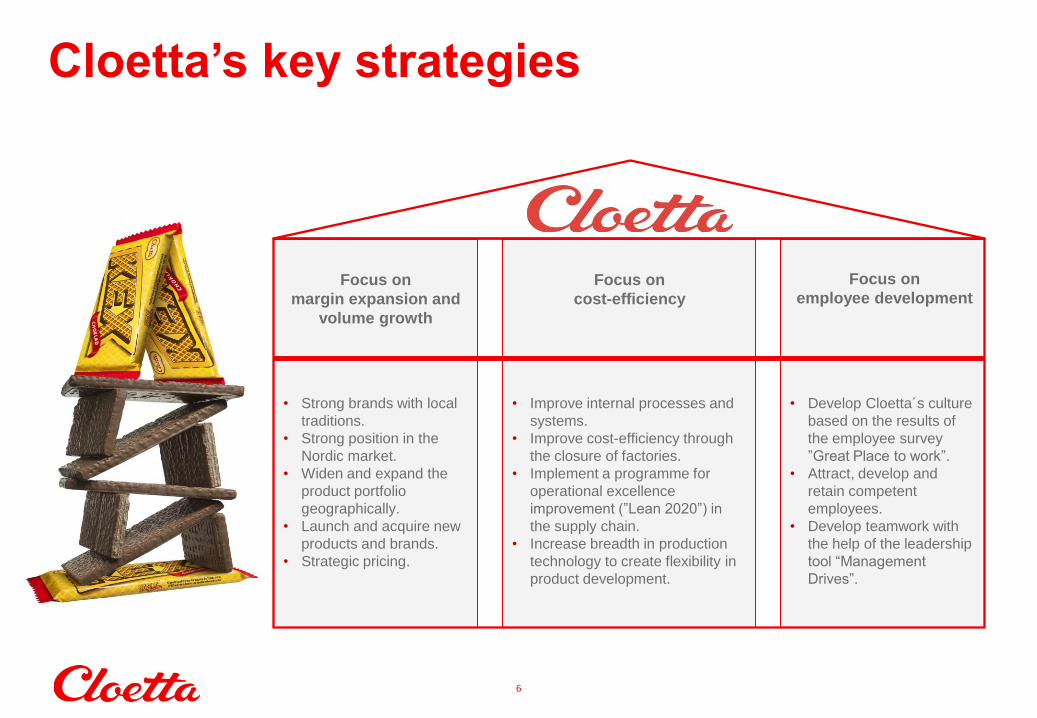
Cloetta’s key strategies
6
• Strong brands with local
traditions.
• Strong position in the
Nordic market.
• Widen and expand the
product portfolio
geographically.
• Launch and acquire new
products and brands.
• Strategic pricing.
• Improve internal processes and
systems.
• Improve cost-efficiency through
the closure of factories.
• Implement a programme for
operational excellence
improvement (”Lean 2020”) in
the supply chain.
• Increase breadth in production
technology to create flexibility in
product development.
• Develop Cloetta´s culture
based on the results of
the employee survey
”Great Place to work”.
• Attract, develop and
retain competent
employees.
• Develop teamwork with
the help of the leadership
tool “Management
Drives”.
Focus on
margin expansion and
volume growth
Focus on
cost-efficiency
Focus on
employee development
Title
Arial, Bold, 40 pt, red
Text/Bullets, Level 1-5
Arial, Regular, 20 pt, grey
Subtitle
Arial, Bold, 40 pt, grey
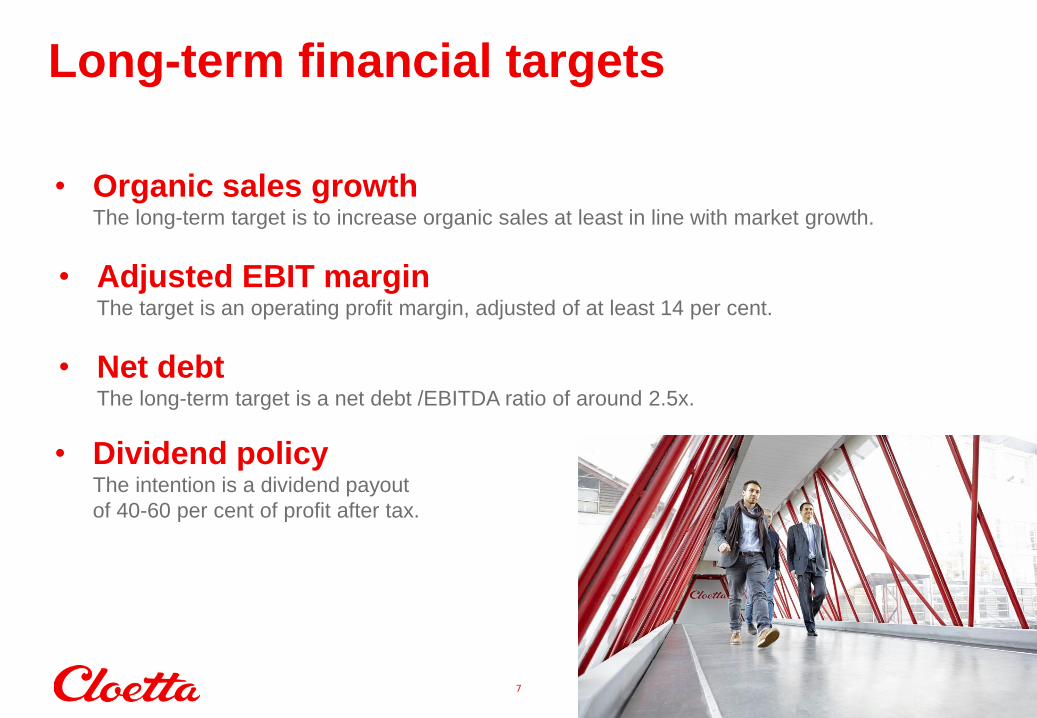
Long-term financial targets
7
• Organic sales growth The long-term target is to increase organic sales at least in line with market growth.
• Net debt The long-term target is a net debt /EBITDA ratio of around 2.5x.
• Adjusted EBIT margin The target is an operating profit margin, adjusted of at least 14 per cent.
• Dividend policy The intention is a dividend payout
of 40-60 per cent of profit after tax.
8
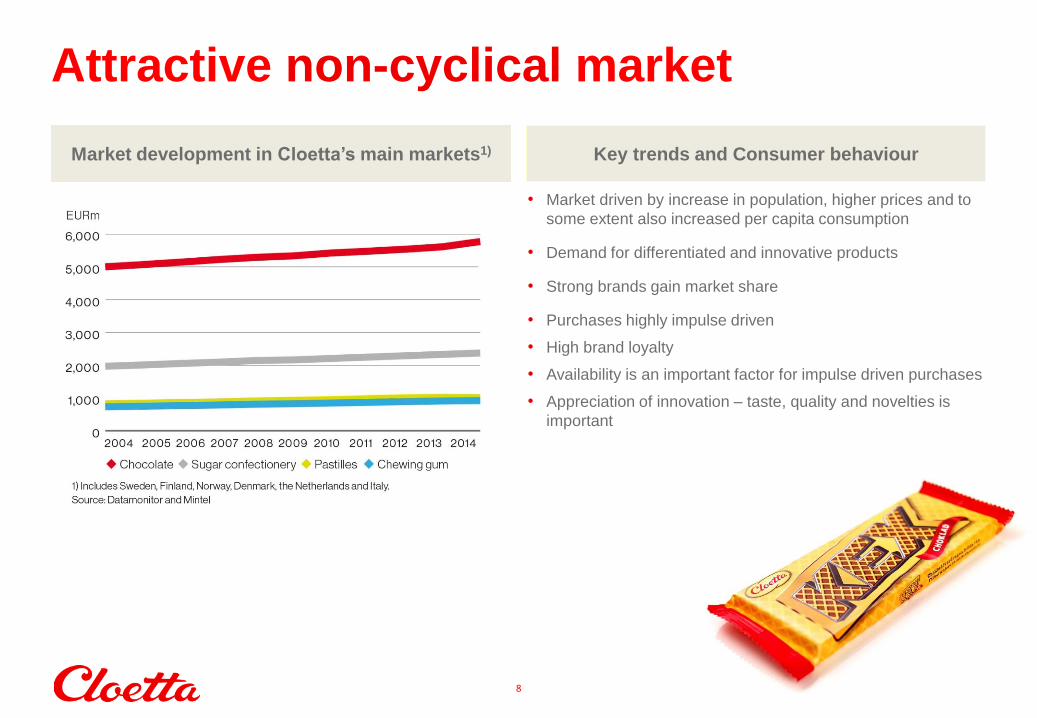
Attractive non-cyclical market
Market development in Cloetta’s main markets1) Key trends and Consumer behaviour
• Market driven by increase in population, higher prices and to
some extent also increased per capita consumption
• Demand for differentiated and innovative products
• Strong brands gain market share
• Purchases highly impulse driven
• High brand loyalty
• Availability is an important factor for impulse driven purchases
• Appreciation of innovation – taste, quality and novelties is
important
Title
Arial, Bold, 40 pt, red
Text/Bullets, Level 1-5
Arial, Regular, 20 pt, grey
Subtitle
Arial, Bold, 40 pt, grey
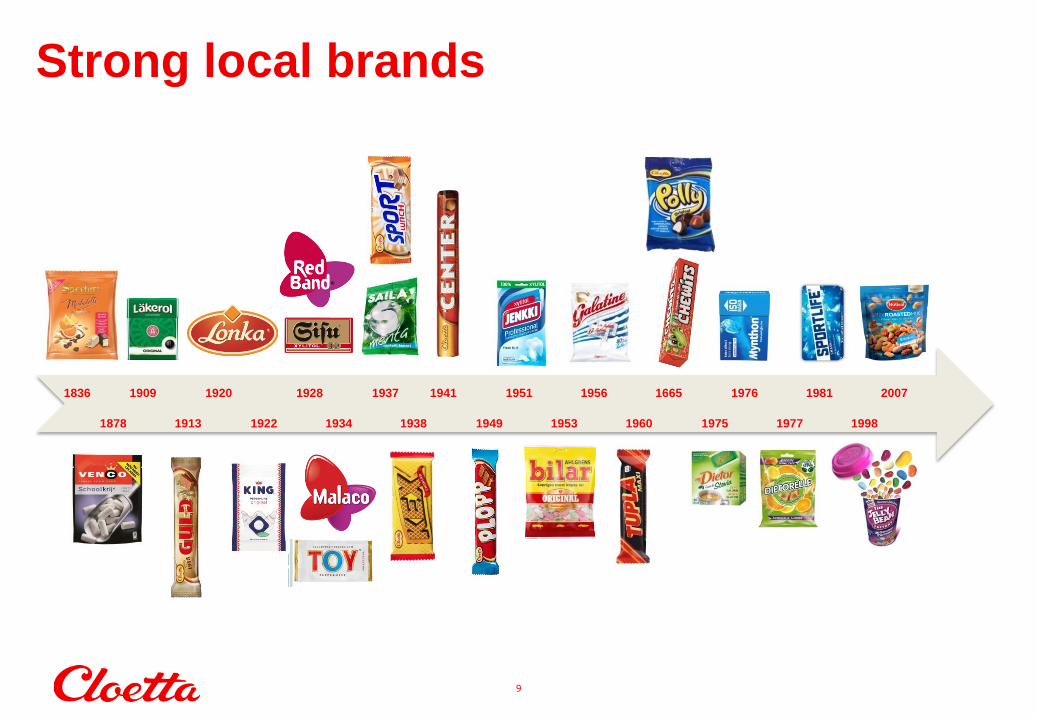
Strong local brands
9
1836 1909 1920 1928 1937 1941 1951 1956 1665 1976 1981 2007
1878 1913 1922 1934 1938 1949 1953 1960 1975 1977 1998
Title
Arial, Bold, 40 pt, red
Text/Bullets, Level 1-5
Arial, Regular, 20 pt, grey
Subtitle
Arial, Bold, 40 pt, grey
10
10
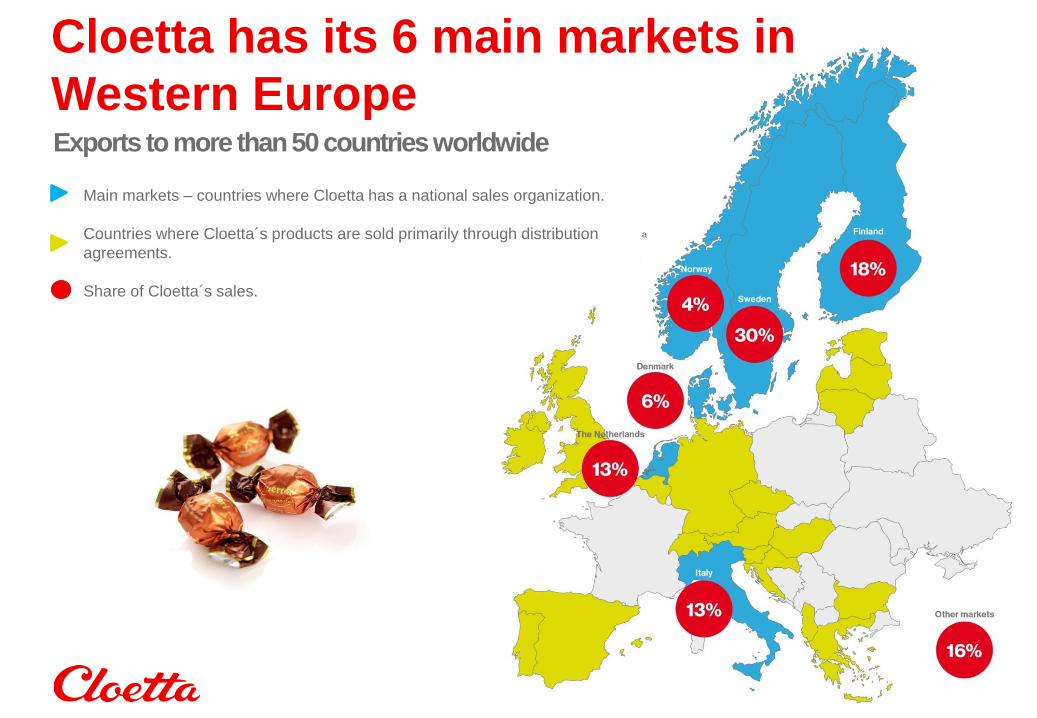
Exports to more than 50 countries worldwide
Main markets – countries where Cloetta has a national sales organization.
Countries where Cloetta´s products are sold primarily through distribution
agreements.
Share of Cloetta´s sales.
Cloetta has its 6 main markets in
Western Europe
11
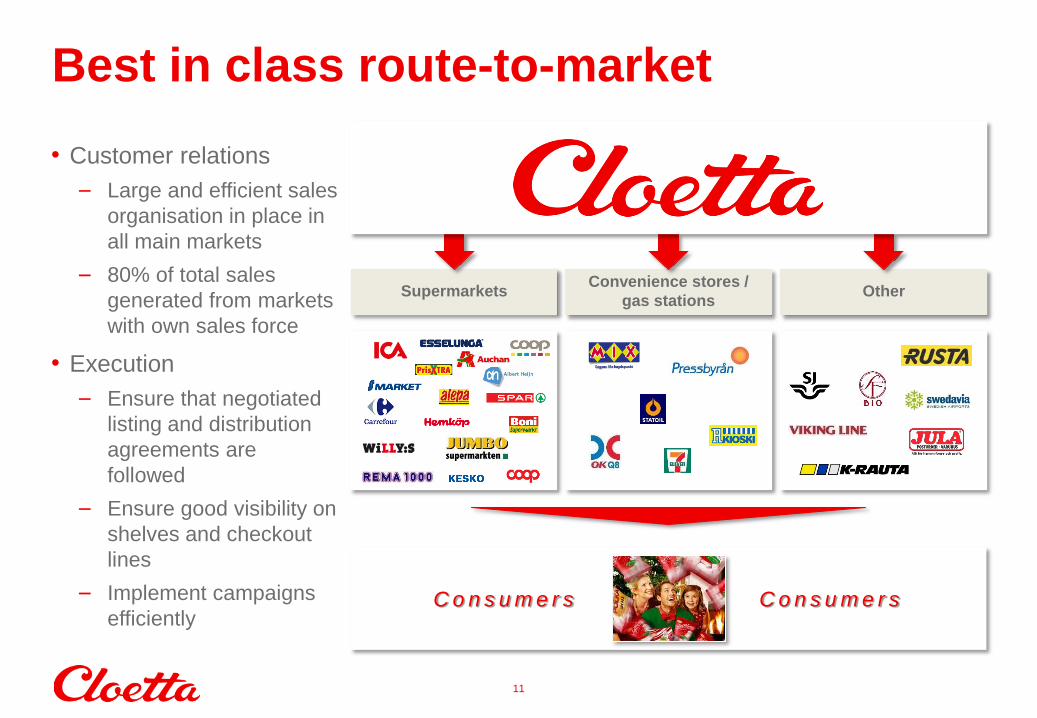
Best in class route-to-market
Supermarkets Convenience stores /
gas stations Other
• Customer relations
– Large and efficient sales
organisation in place in
all main markets
– 80% of total sales
generated from markets
with own sales force
• Execution
– Ensure that negotiated
listing and distribution
agreements are
followed
– Ensure good visibility on
shelves and checkout
lines
– Implement campaigns
efficiently C o n s u m e r s C o n s u m e r s

12
Profitable growth drivers
• Acquisitions
• New geographies
New territory
• Broaden distribution
• Promotion planning and
execution
• Advertising campaigns
• Seasonal products
• Packaging updates and
upgrades
• Line extensions
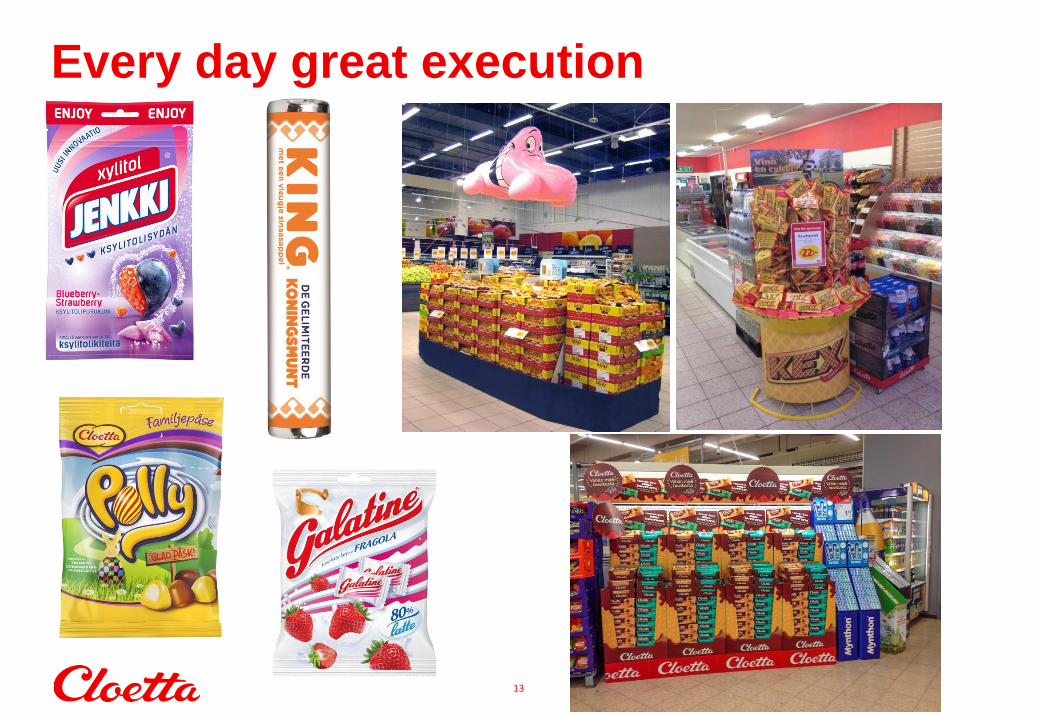
Every day great execution
• Sizing and pricing
• Brand extensions
• Fill white spots
• Geographical roll-out
• Brand re-launch
• Innovations
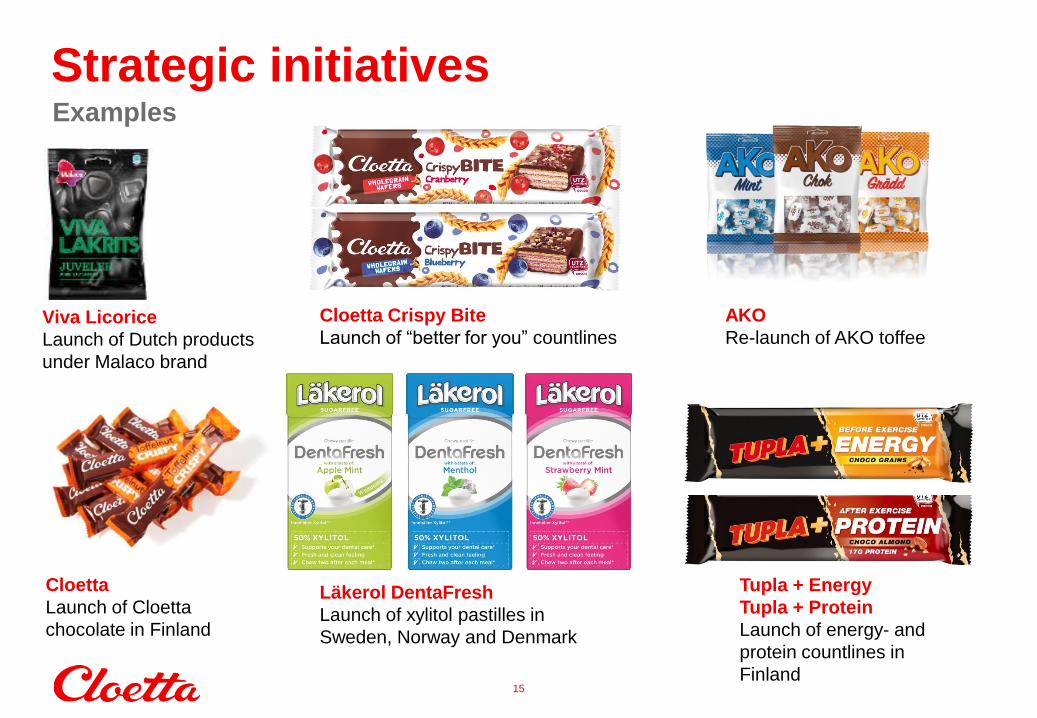
Strategic initiatives
Title
Arial, Bold, 40 pt, red
Text/Bullets, Level 1-5
Arial, Regular, 20 pt, grey
Subtitle
Arial, Bold, 40 pt, grey
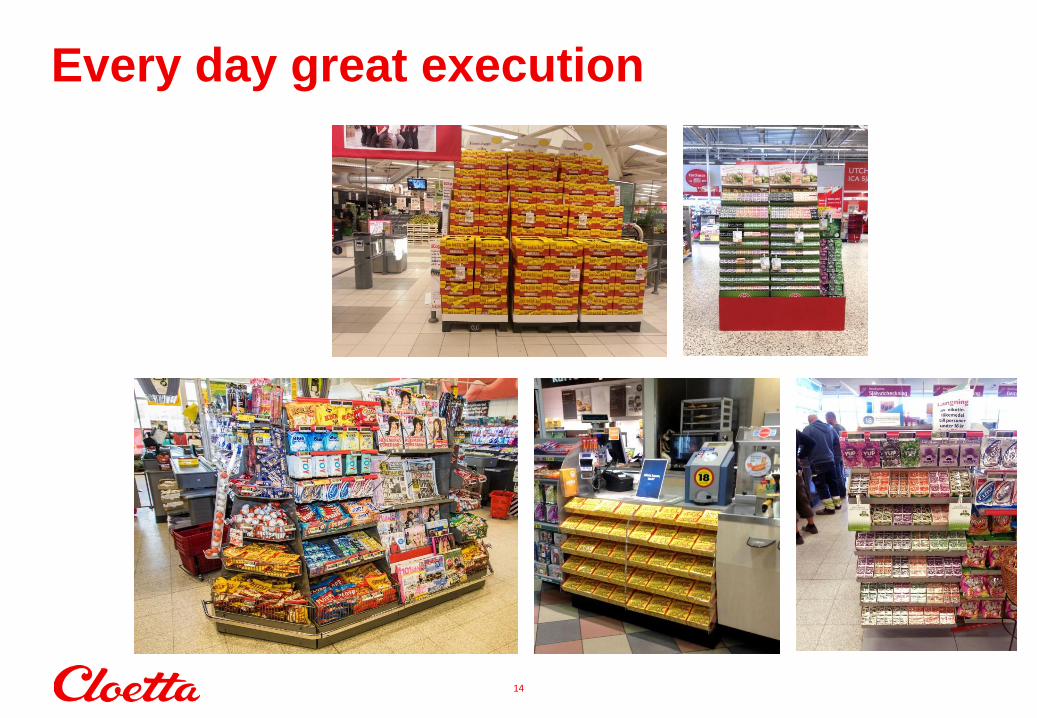
Every day great execution
13
Title
Arial, Bold, 40 pt, red
Text/Bullets, Level 1-5
Arial, Regular, 20 pt, grey
Subtitle
Arial, Bold, 40 pt, grey
Every day great execution
14
15
Strategic initiatives Examples
Viva Licorice
Launch of Dutch products
under Malaco brand
Cloetta Crispy Bite
Launch of “better for you” countlines
AKO
Re-launch of AKO toffee
Cloetta
Launch of Cloetta
chocolate in Finland
Läkerol DentaFresh
Launch of xylitol pastilles in
Sweden, Norway and Denmark
Tupla + Energy
Tupla + Protein
Launch of energy- and
protein countlines in
Finland
Title
Arial, Bold, 40 pt, red
Text/Bullets, Level 1-5
Arial, Regular, 20 pt, grey
Subtitle
Arial, Bold, 40 pt, grey
Enablers for improved profitability
• Supply Chain moves from restructuring to operational excellence
(Lean 2020-program)
• Accelerated growth and synergy realization of acquisitions
• Drive growth with new initiatives such as pick-and-mix
• Improve internal processes including a common ERP system
16

Lean 2020: From restructuring to
operational excellence in Supply Chain
• Major manufacturing restructuring completed
• There is potential to improve operations after a very disruptive period
• Cloetta Lean program provides a good base for continuous
improvement
17
Title
Arial, Bold, 40 pt, red
Text/Bullets, Level 1-5
Arial, Regular, 20 pt, grey
Subtitle
Arial, Bold, 40 pt, grey
18
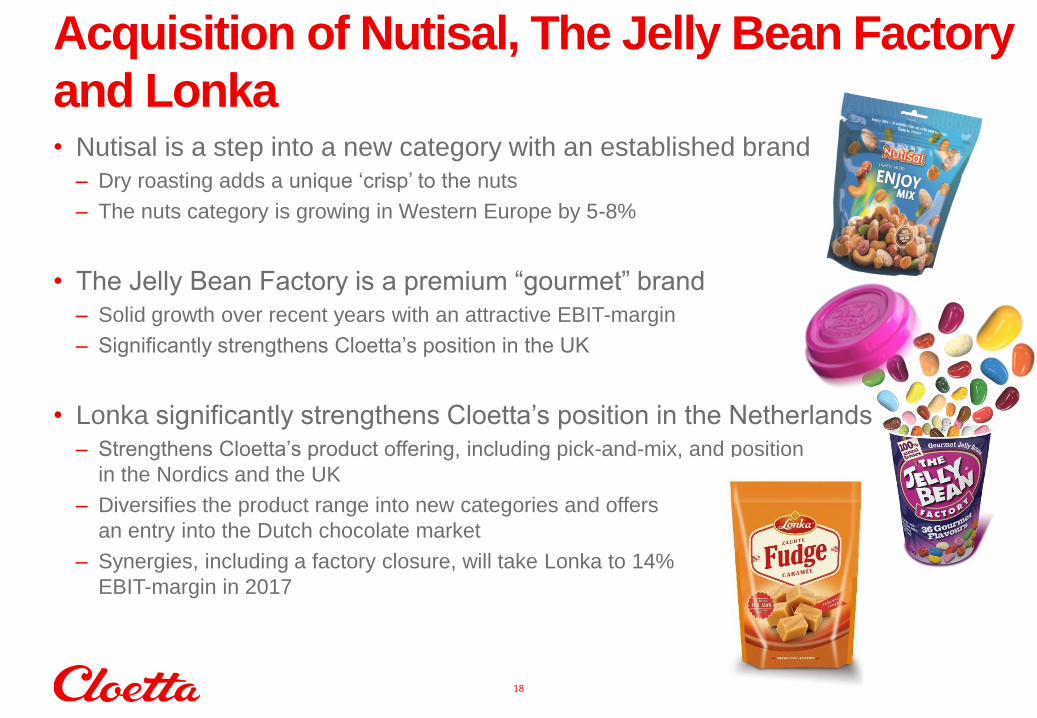
• Nutisal is a step into a new category with an established brand
– Dry roasting adds a unique ‘crisp’ to the nuts
– The nuts category is growing in Western Europe by 5-8%
• The Jelly Bean Factory is a premium “gourmet” brand
– Solid growth over recent years with an attractive EBIT-margin
– Significantly strengthens Cloetta’s position in the UK
• Lonka significantly strengthens Cloetta’s position in the Netherlands
– Strengthens Cloetta’s product offering, including pick-and-mix, and position
in the Nordics and the UK
– Diversifies the product range into new categories and offers
an entry into the Dutch chocolate market
– Synergies, including a factory closure, will take Lonka to 14%
EBIT-margin in 2017
Acquisition of Nutisal, The Jelly Bean Factory
and Lonka
Title
Arial, Bold, 40 pt, red
Text/Bullets, Level 1-5
Arial, Regular, 20 pt, grey
Subtitle
Arial, Bold, 40 pt, grey
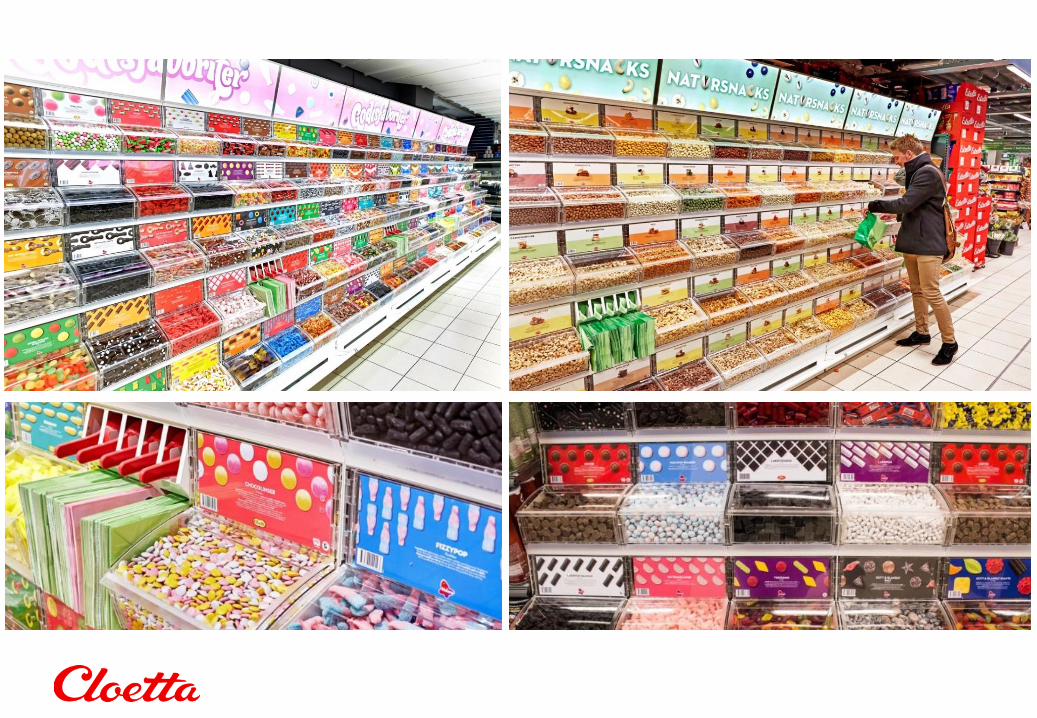
Pick-and-mix concept
19
• Cloetta launched a pick-and-mix concept in Coop Sweden early 2015
– Handling of product range, racks and merchandising
– Also a concept for natural snacks, e.g. nuts
• Cloetta has since many years its own pick-and-mix concept in Finland (Karkkikatu)
• Cloetta can utilize a wide range of products from several markets and factories
• Cloetta has experience from the entire value chain; production, logistics,
planogram and promotional activites
• Pick-and-mix accounts for 30% of total market volume in Sweden
• Pick-and-mix can contribute to drive growth - some small new Pick & Mix contracts
signed for 2016
Title
Arial, Bold, 40 pt, red
Text/Bullets, Level 1-5
Arial, Regular, 20 pt, grey
Subtitle
Arial, Bold, 40 pt, grey
Title
Arial, Bold, 40 pt, red
Text/Bullets, Level 1-5
Arial, Regular, 20 pt, grey
Subtitle
Arial, Bold, 40 pt, grey
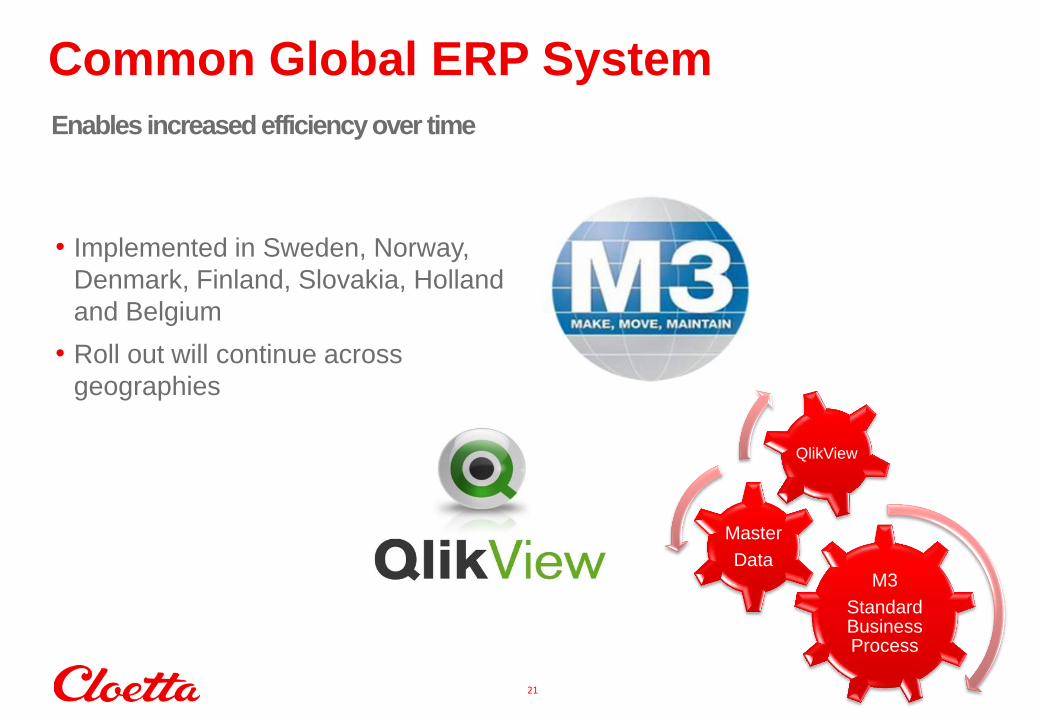
Common Global ERP System
Enables increased efficiency over time
• Implemented in Sweden, Norway,
Denmark, Finland, Slovakia, Holland
and Belgium
• Roll out will continue across
geographies
M3
Standard Business Process
Master
Data
QlikView
21
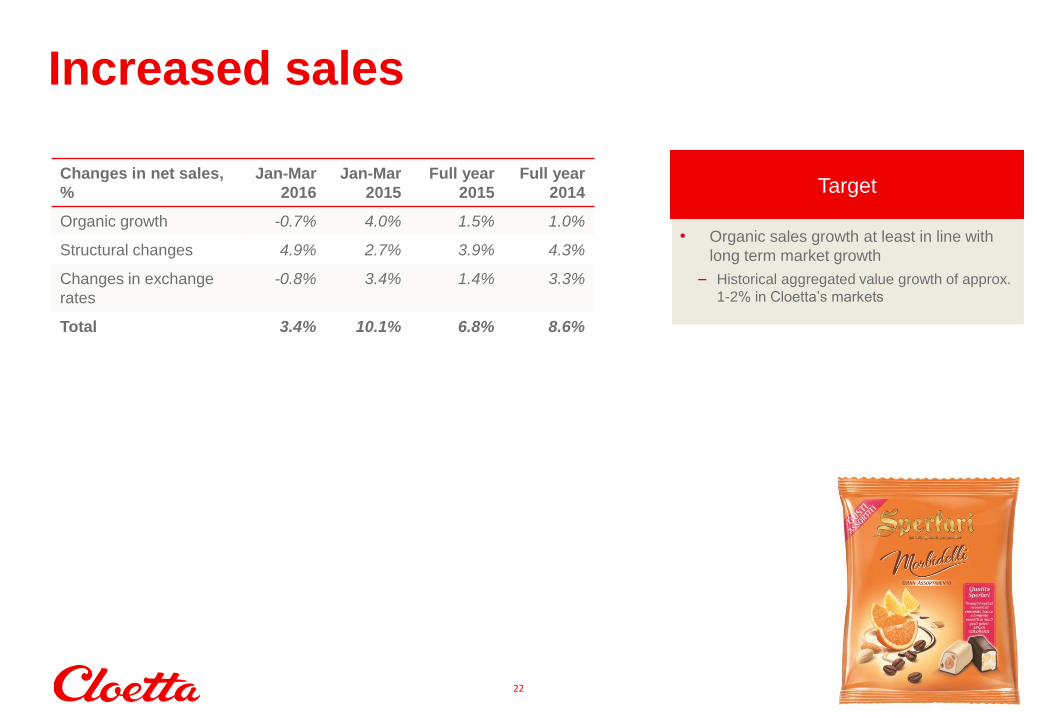
Increased sales
• Organic sales growth at least in line with
long term market growth
– Historical aggregated value growth of approx.
1-2% in Cloetta’s markets
22
Target Changes in net sales,
%
Jan-Mar
2016
Jan-Mar
2015
Full year
2015
Full year
2014
Organic growth -0.7% 4.0% 1.5% 1.0%
Structural changes 4.9% 2.7% 3.9% 4.3%
Changes in exchange
rates
-0.8% 3.4% 1.4% 3.3%
Total 3.4% 10.1% 6.8% 8.6%
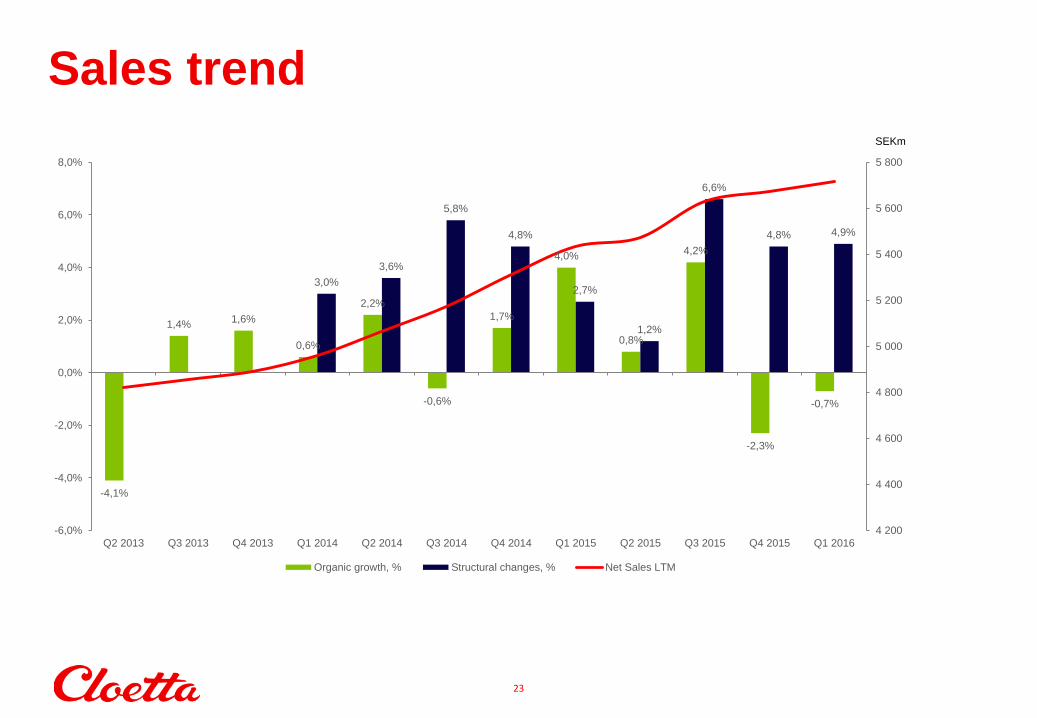
Sales trend
23
-4,1%
1,4% 1,6%
0,6%
2,2%
-0,6%
1,7%
4,0%
0,8%
4,2%
-2,3%
-0,7%
3,0%
3,6%
5,8%
4,8%
2,7%
1,2%
6,6%
4,8% 4,9%
4 200
4 400
4 600
4 800
5 000
5 200
5 400
5 600
5 800
-6,0%
-4,0%
-2,0%
0,0%
2,0%
4,0%
6,0%
8,0%
Q2 2013 Q3 2013 Q4 2013 Q1 2014 Q2 2014 Q3 2014 Q4 2014 Q1 2015 Q2 2015 Q3 2015 Q4 2015 Q1 2016
Organic growth, % Structural changes, % Net Sales LTM
SEKm
Title
Arial, Bold, 40 pt, red
Text/Bullets, Level 1-5
Arial, Regular, 20 pt, grey
Subtitle
Arial, Bold, 40 pt, grey
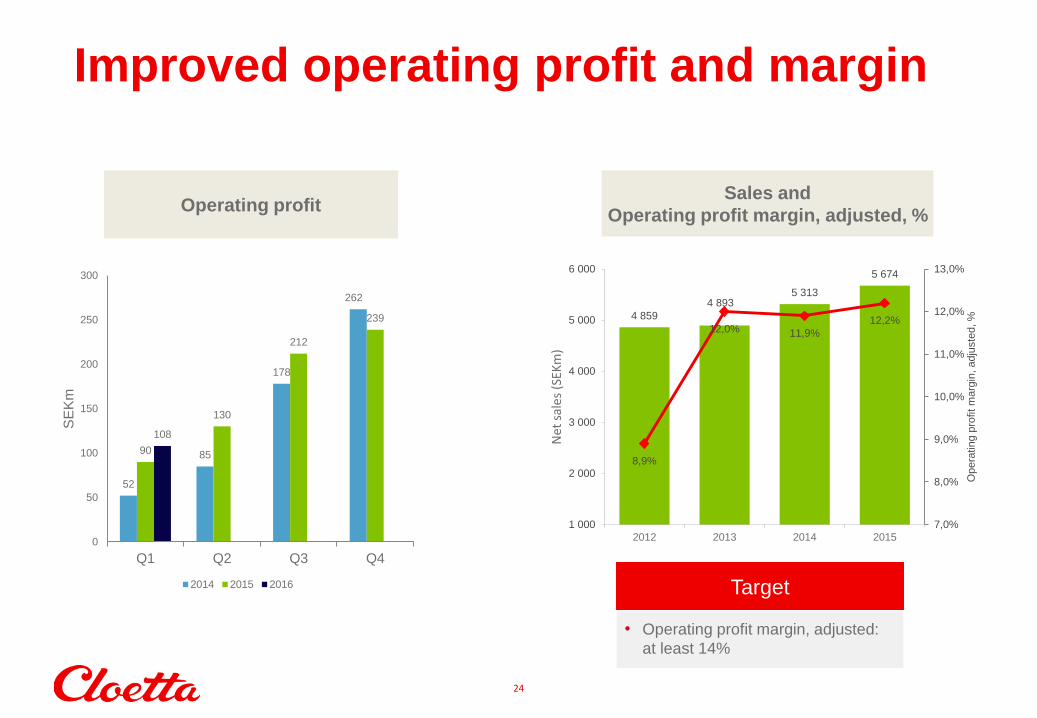
Improved operating profit and margin
24
Operating profit
52
85
178
262
90
130
212
239
108
0
50
100
150
200
250
300
Q1 Q2 Q3 Q4
SE
Km
2014 2015 2016
• Operating profit margin, adjusted:
at least 14%
Sales and
Operating profit margin, adjusted, %
Target
4 859
4 893 5 313
5 674
8,9%
12,0% 11,9%
12,2%
7,0%
8,0%
9,0%
10,0%
11,0%
12,0%
13,0%
1 000
2 000
3 000
4 000
5 000
6 000
2012 2013 2014 2015
Opera
tin
g p
rofit
marg
in, adju
ste
d, %
Net
sal
es (
SEK
m)
25
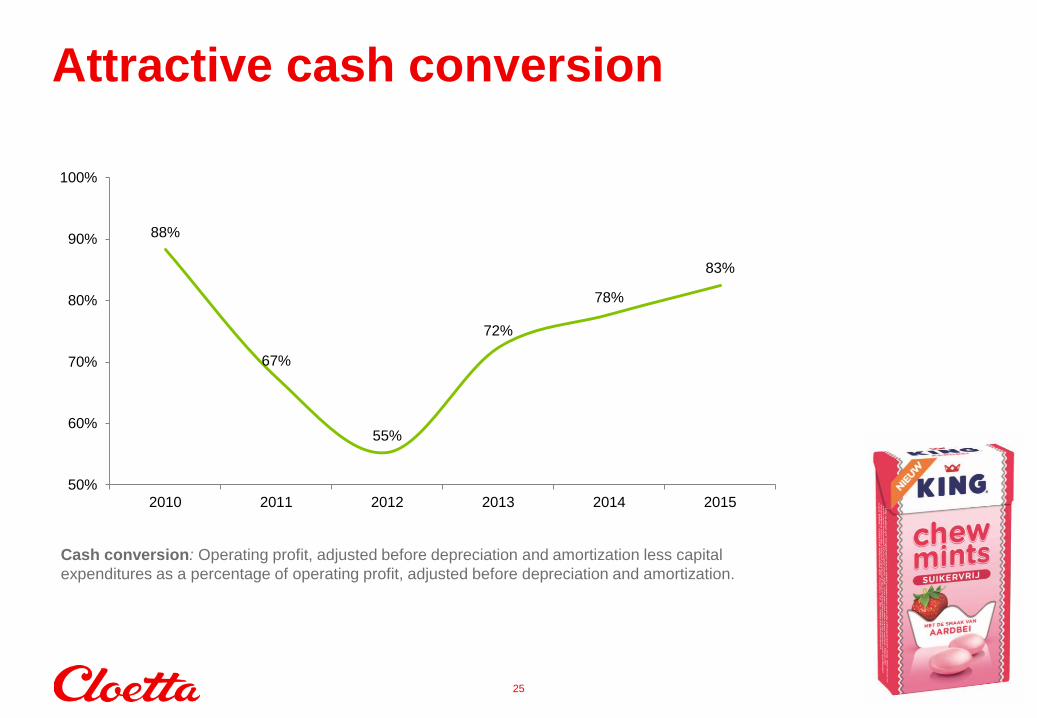
Attractive cash conversion
Cash conversion: Operating profit, adjusted before depreciation and amortization less capital
expenditures as a percentage of operating profit, adjusted before depreciation and amortization.
88%
67%
55%
72%
78%
83%
50%
60%
70%
80%
90%
100%
2010 2011 2012 2013 2014 2015

26
Strong cash flow from operating
activities
-35
125 93
147
-16 -23
54
116
91 44
75
290 223
163 174
367
253 330
131
500
927 957
-200
-
200
400
600
800
1 000
1 200
Q1 Q2 Q3 Q4 Q1 Q2 Q3 Q4 Q1 Q2 Q3 Q4 Q1 Q2 Q3 Q4 Q1
SE
Km
Cash flow from operating activities Cash flow from operating activities (rolling 12 months)
2012 2013 2014 2015 2016

2,0
2,5
3,0
3,5
4,0
4,5
5,0
2013Q1
2013Q2
2013Q3
2013Q4
2014Q1
2014Q2
2014Q3
2014Q4
2015Q1
2015Q2
2015Q3
2015Q4
2016Q1
27
Financial leverage
Continued decrease in Net debt/EBITDA, x
Target
Title
Arial, Bold, 80 pt, white Q1 Report
Title
Arial, Bold, 40 pt, red
Text/Bullets, Level 1-5
Arial, Regular, 20 pt, grey
Subtitle
Arial, Bold, 40 pt, grey
29
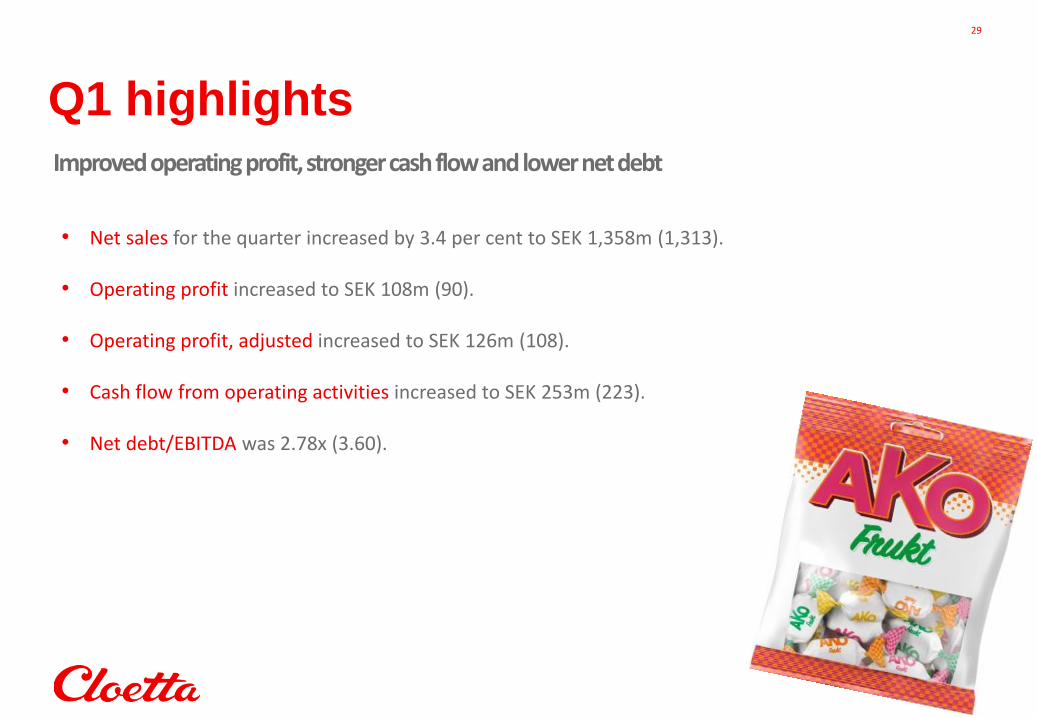
Improved operating profit, stronger cash flow and lower net debt
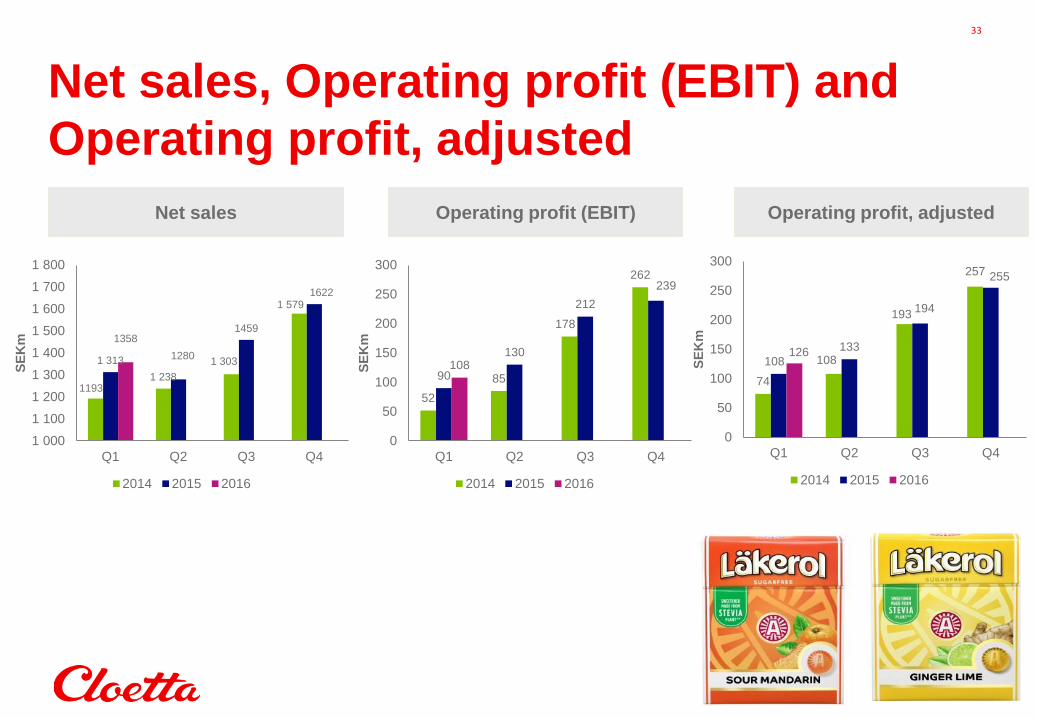
• Net sales for the quarter increased by 3.4 per cent to SEK 1,358m (1,313).
• Operating profit increased to SEK 108m (90).
• Operating profit, adjusted increased to SEK 126m (108).
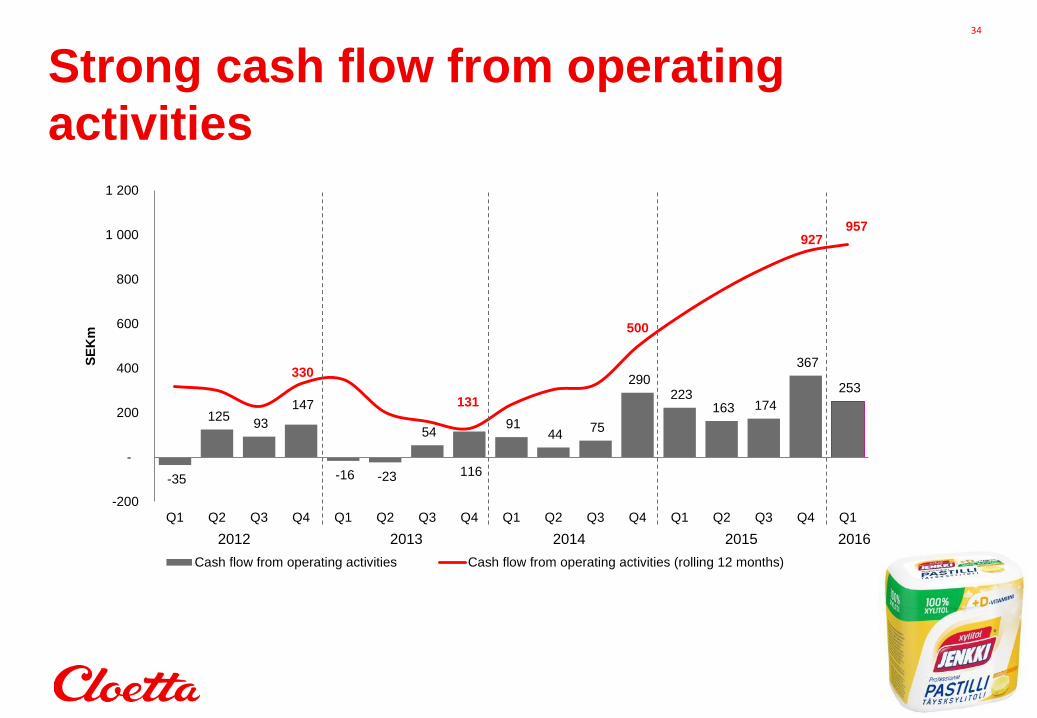
• Cash flow from operating activities increased to SEK 253m (223).
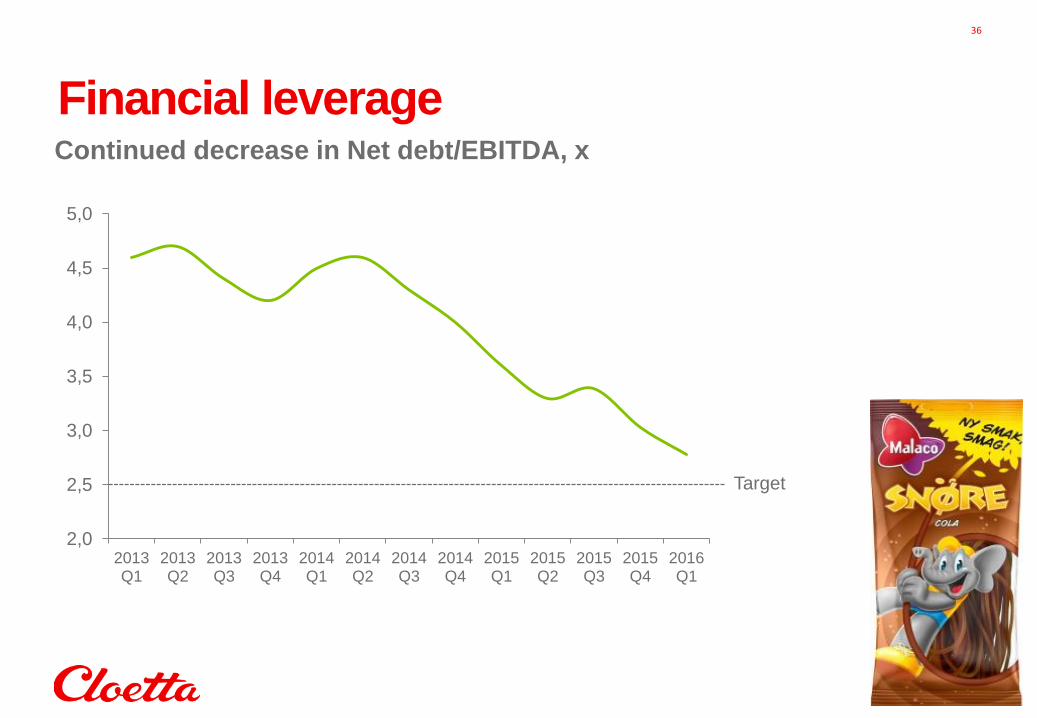
• Net debt/EBITDA was 2.78x (3.60).
Q1 highlights
Title
Arial, Bold, 40 pt, red
Text/Bullets, Level 1-5
Arial, Regular, 20 pt, grey
Subtitle
Arial, Bold, 40 pt, grey
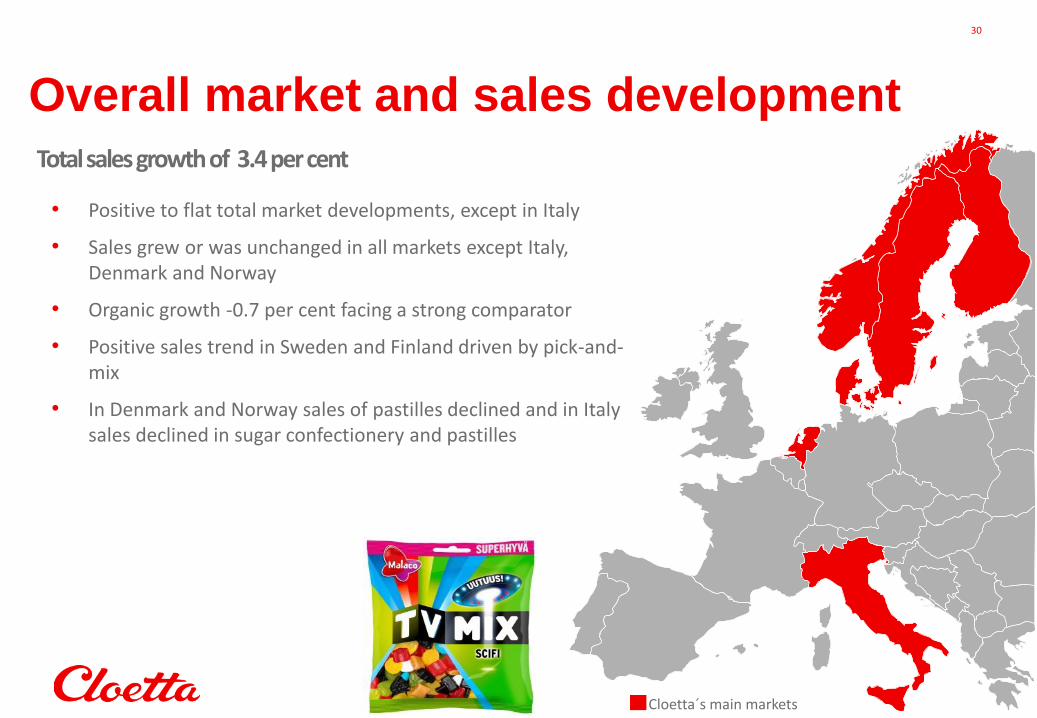
Overall market and sales development
Total sales growth of 3.4 per cent
• Positive to flat total market developments, except in Italy
• Sales grew or was unchanged in all markets except Italy, Denmark and Norway
• Organic growth -0.7 per cent facing a strong comparator
• Positive sales trend in Sweden and Finland driven by pick-and-mix
• In Denmark and Norway sales of pastilles declined and in Italy sales declined in sugar confectionery and pastilles
30
Cloetta´s main markets

31
1) Organic growth at constant exchange rates and comparable units -0.7 per cent for the quarter.
SEKm Jan-Mar 2016 Margin
%
Change
%
Jan-Mar
2015
Margin
% Rolling 12
Full year
2015
Net sales 1,358 3.41 1,313 5,719 5,674
Gross profit 506 37.3 3.1 491 37.4 2,226 2,211
Operating profit, adjusted 126 9.3 16.7 108 8.2 708 690
Operating profit (EBIT) 108 8.0 20.0 90 6.9 689 671
Net financial items -46 -48 -176 -178
Profit before tax 62 47.6 42 513 493
Profit for the period 44 33.3 33 397 386
Increased net sales and improved EBIT
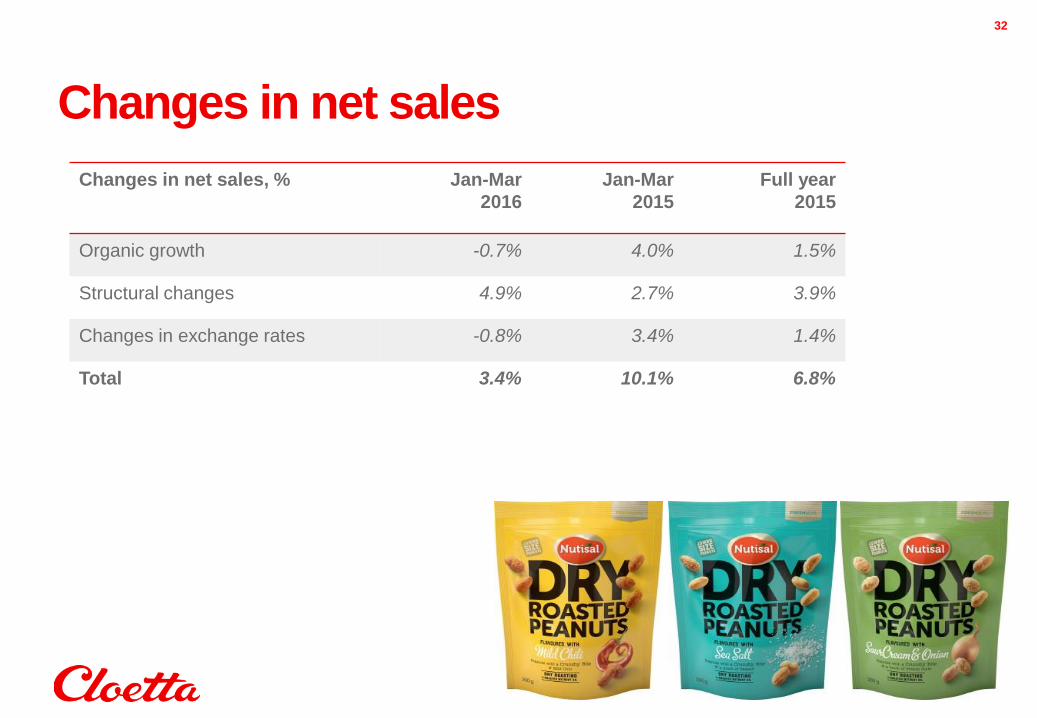
32
Changes in net sales, % Jan-Mar
2016
Jan-Mar
2015
Full year
2015
Organic growth -0.7% 4.0% 1.5%
Structural changes 4.9% 2.7% 3.9%
Changes in exchange rates -0.8% 3.4% 1.4%
Total 3.4% 10.1% 6.8%
Changes in net sales
Title
Arial, Bold, 40 pt, red
Text/Bullets, Level 1-5
Arial, Regular, 20 pt, grey
Subtitle
Arial, Bold, 40 pt, grey
Net sales, Operating profit (EBIT) and
Operating profit, adjusted
33
Net sales Operating profit (EBIT) Operating profit, adjusted
1193 1 238
1 303
1 579
1 313 1280
1459
1622
1358
1 000
1 100
1 200
1 300
1 400
1 500
1 600
1 700
1 800
Q1 Q2 Q3 Q4
SE
Km
2014 2015 2016
52
85
178
262
90
130
212
239
108
0
50
100
150
200
250
300
Q1 Q2 Q3 Q4
SE
Km
2014 2015 2016
74
108
193
257
108
133
194
255
126
0
50
100
150
200
250
300
Q1 Q2 Q3 Q4
SE
Km
2014 2015 2016
Title
Arial, Bold, 40 pt, red
Text/Bullets, Level 1-5
Arial, Regular, 20 pt, grey
Subtitle
Arial, Bold, 40 pt, grey
Strong cash flow from operating
activities
34
-35
125 93
147
-16 -23
54
116
91 44
75
290 223
163 174
367
253 330
131
500
927 957
-200
-
200
400
600
800
1 000
1 200
Q1 Q2 Q3 Q4 Q1 Q2 Q3 Q4 Q1 Q2 Q3 Q4 Q1 Q2 Q3 Q4 Q1
SE
Km
Cash flow from operating activities Cash flow from operating activities (rolling 12 months)
2012 2013 2014 2015 2016
Title
Arial, Bold, 40 pt, red
Text/Bullets, Level 1-5
Arial, Regular, 20 pt, grey
Subtitle
Arial, Bold, 40 pt, grey
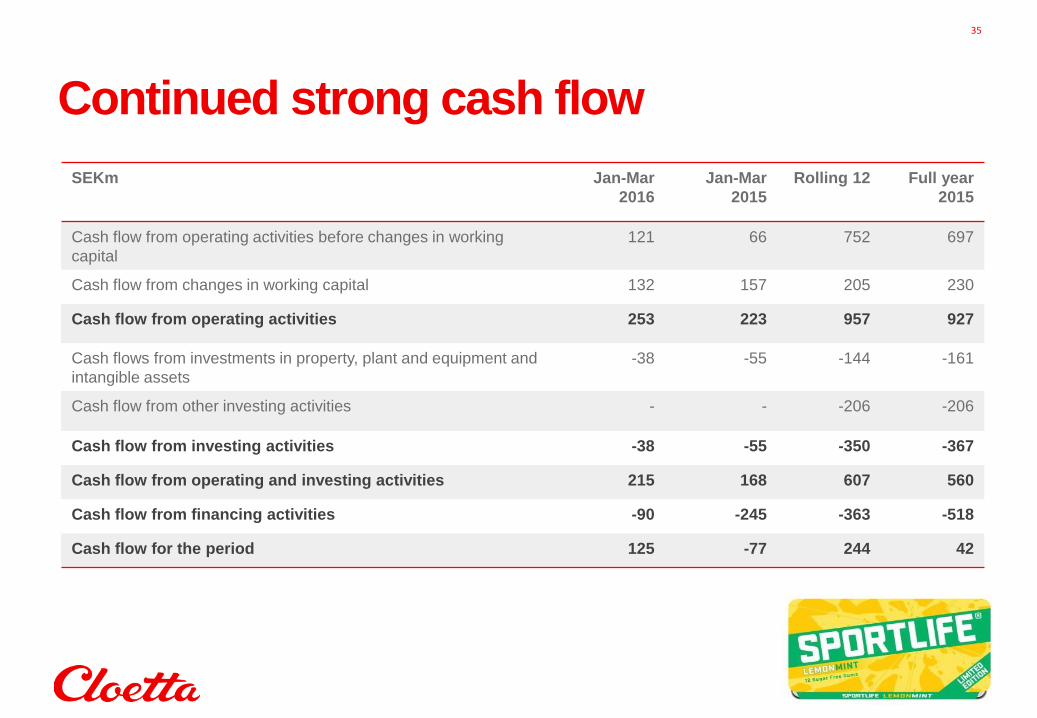
35
SEKm Jan-Mar
2016
Jan-Mar
2015
Rolling 12 Full year
2015
Cash flow from operating activities before changes in working
capital
121 66 752 697
Cash flow from changes in working capital 132 157 205 230
Cash flow from operating activities 253 223 957 927
Cash flows from investments in property, plant and equipment and
intangible assets
-38 -55 -144 -161
Cash flow from other investing activities - - -206 -206
Cash flow from investing activities -38 -55 -350 -367
Cash flow from operating and investing activities 215 168 607 560
Cash flow from financing activities -90 -245 -363 -518
Cash flow for the period 125 -77 244 42
Continued strong cash flow
2,0
2,5
3,0
3,5
4,0
4,5
5,0
2013Q1
2013Q2
2013Q3
2013Q4
2014Q1
2014Q2
2014Q3
2014Q4
2015Q1
2015Q2
2015Q3
2015Q4
2016Q1
36
Continued decrease in Net debt/EBITDA, x
Target
Financial leverage
Title
Arial, Bold, 40 pt, red
Text/Bullets, Level 1-5
Arial, Regular, 20 pt, grey
Subtitle
Arial, Bold, 40 pt, grey
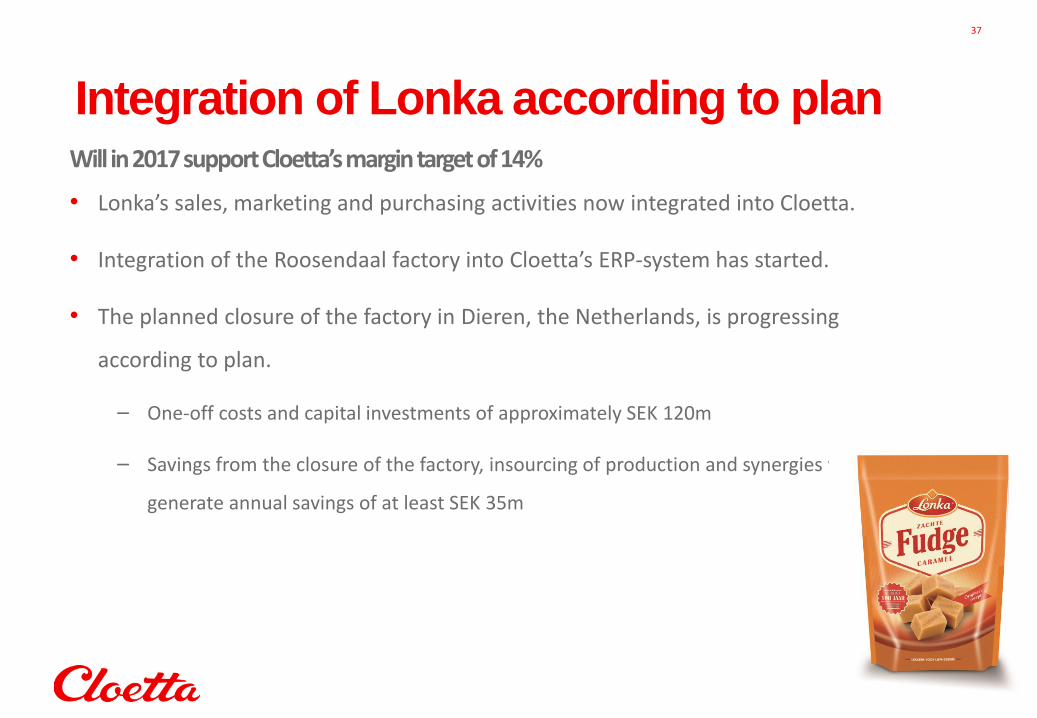
37
Will in 2017 support Cloetta’s margin target of 14%
• Lonka’s sales, marketing and purchasing activities now integrated into Cloetta.
• Integration of the Roosendaal factory into Cloetta’s ERP-system has started.
• The planned closure of the factory in Dieren, the Netherlands, is progressing
according to plan.
– One-off costs and capital investments of approximately SEK 120m
– Savings from the closure of the factory, insourcing of production and synergies will
generate annual savings of at least SEK 35m
Integration of Lonka according to plan
Title
Arial, Bold, 40 pt, red
Text/Bullets, Level 1-5
Arial, Regular, 20 pt, grey
Subtitle
Arial, Bold, 40 pt, grey
38
Profitable growth
Integration of Lonka
and closure of factory
in Dieren
Implement and drive
initiatives within pick-
and-mix
Operational
excellence in supply
chain through
Lean2020 initiative
In focus
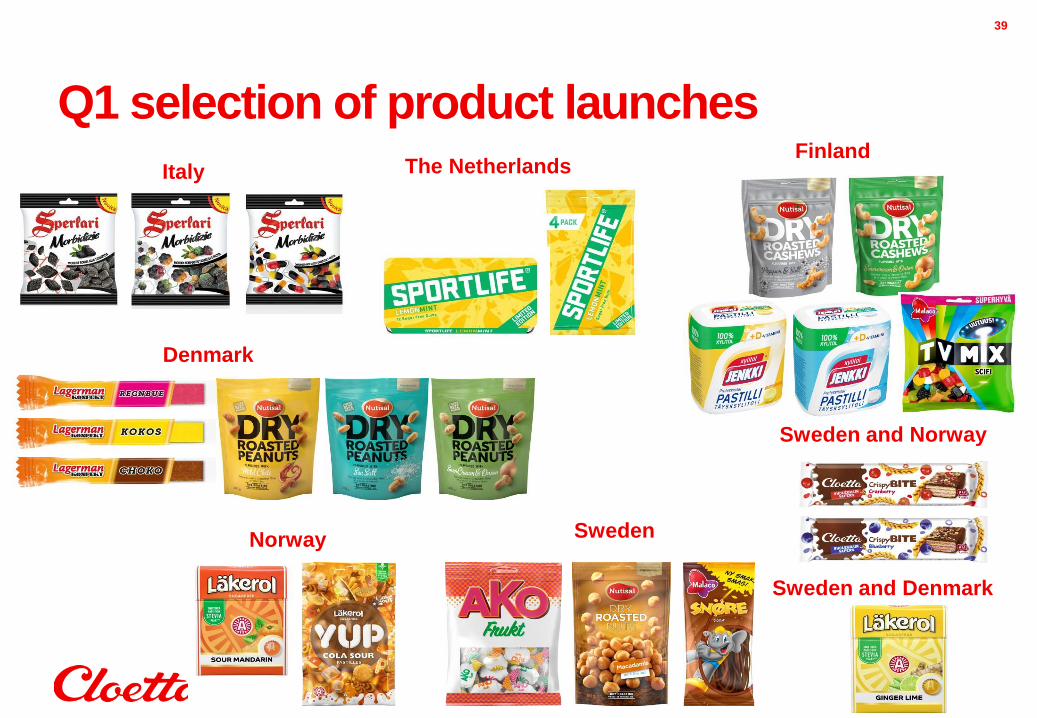
39
Italy Finland
Sweden Norway
Sweden and Denmark
Sweden and Norway
Denmark
The Netherlands
Q1 selection of product launches
Title
Arial, Bold, 80 pt, white Appendix
41
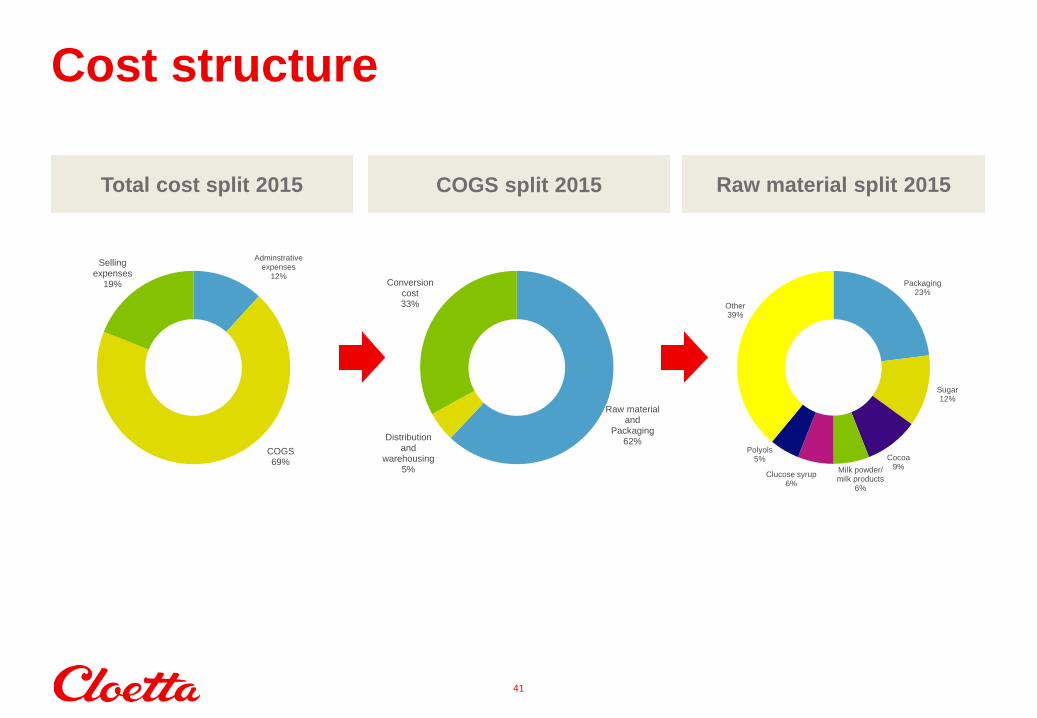
Cost structure
Raw material split 2015 Total cost split 2015 COGS split 2015
Raw material and
Packaging 62% Distribution
and warehousing
5%
Conversion cost 33%
Packaging 23%
Sugar 12%
Cocoa 9% Milk powder/
milk products 6%
Clucose syrup 6%
Polyols 5%
Other 39%
Adminstrative expenses
12%
COGS 69%
Selling expenses
19%
42
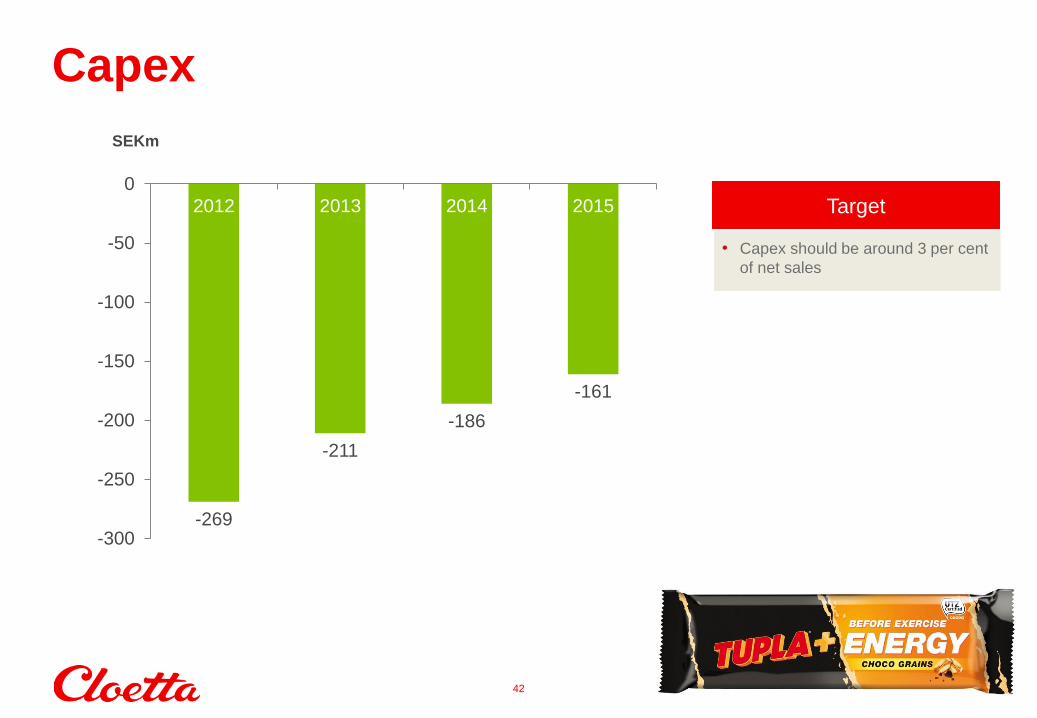
Capex
-269
-211
-186
-161
-300
-250
-200
-150
-100
-50
0
2012 2013 2014 2015
SEKm
• Capex should be around 3 per cent
of net sales
Target
43
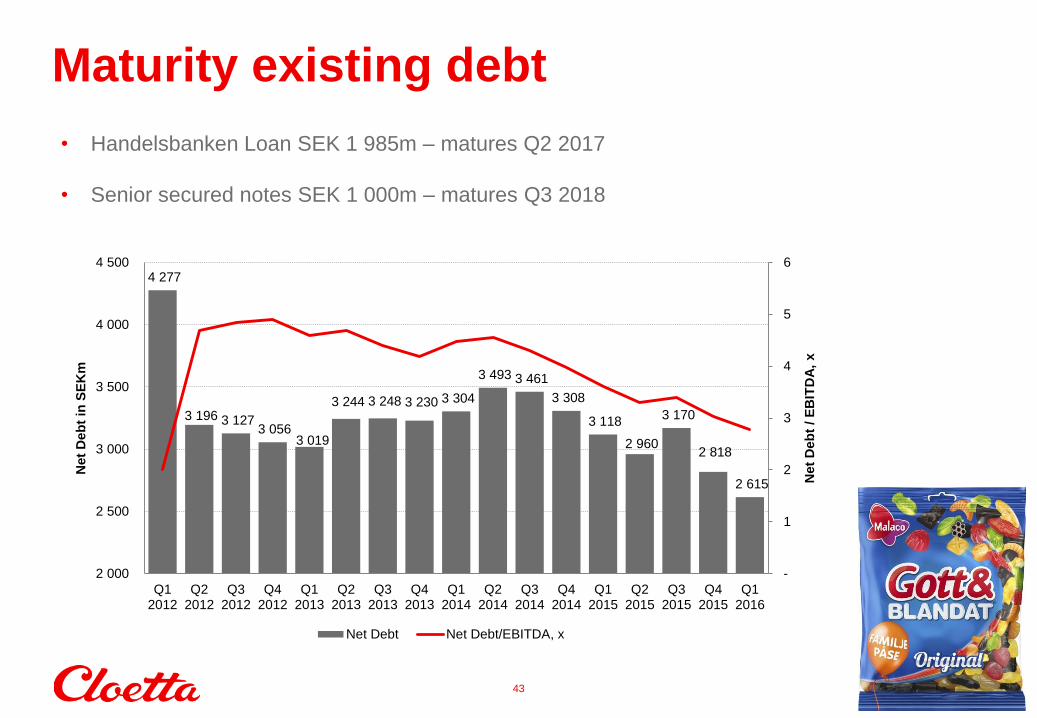
Maturity existing debt
• Handelsbanken Loan SEK 1 985m – matures Q2 2017
• Senior secured notes SEK 1 000m – matures Q3 2018
4 277
3 196 3 127 3 056
3 019
3 244 3 248 3 230 3 304
3 493 3 461
3 308
3 118
2 960
3 170
2 818
2 615
-
1
2
3
4
5
6
2 000
2 500
3 000
3 500
4 000
4 500
Q12012
Q22012
Q32012
Q42012
Q12013
Q22013
Q32013
Q42013
Q12014
Q22014
Q32014
Q42014
Q12015
Q22015
Q32015
Q42015
Q12016
Net
Deb
t / E
BIT
DA
, x
Net
Deb
t in
SE
Km
Net Debt Net Debt/EBITDA, x
44
• This presentation has been prepared by Cloetta AB (publ) (the “Company”) solely for use at this presentation and is furnished to
you solely for your information and may not be reproduced or redistributed, in whole or in part, to any other person. The
presentation does not constitute an invitation or offer to acquire, purchase or subscribe for securities. By attending the meeting
where this presentation is made, or by reading the presentation slides, you agree to be bound by the following limitations.
• This presentation is not for presentation or transmission into the United States or to any U.S. person, as that term is defined
under Regulation S promulgated under the Securities Act of 1933, as amended.
• This presentation contains various forward-looking statements that reflect management’s current views with respect to future
events and financial and operational performance. The words “believe,” “expect,” “anticipate,” “intend,” “may,” “plan,” “estimate,”
“should,” “could,” “aim,” “target,” “might,” or, in each case, their negative, or similar expressions identify certain of these forward-
looking statements. Others can be identified from the context in which the statements are made. These forward-looking
statements involve known and unknown risks, uncertainties and other factors, which are in some cases beyond the Company’s
control and may cause actual results or performance to differ materially from those expressed or implied from such forward-
looking statements. These risks include but are not limited to the Company’s ability to operate profitably, maintain its competitive
position, to promote and improve its reputation and the awareness of the brands in its portfolio, to successfully operate its
growth strategy and the impact of changes in pricing policies, political and regulatory developments in the markets in which the
Company operates, and other risks.
• The information and opinions contained in this document are provided as at the date of this presentation and are subject to
change without notice.
• No representation or warranty (expressed or implied) is made as to, and no reliance should be placed on, the fairness, accuracy
or completeness of the information contained herein. Accordingly, none of the Company, or any of its principal shareholders or
subsidiary undertakings or any of such person’s officers or employees accepts any liability whatsoever arising directly or
indirectly from the use of this document.
Disclaimer