cloetta - interim report q4 2015 – presentation
TRANSCRIPT

Title
Arial, Bold, 40 pt, red
Subtitle
Arial, Bold, 40 pt, grey
Q4 2015 results – 18 February 2016
David Nuutinen, CEO
Danko Maras, CFO
Jacob Broberg, SVP IR

Title
Arial, Bold, 40 pt, red
Text/Bullets, Level 1-5
Arial, Regular, 20 pt, grey
Subtitle
Arial, Bold, 40 pt, grey
Q4 highlights
2
Strong cash flow, decreased debt and proposed dividend
• Net sales for the quarter increased by 2.7 per cent to SEK 1,622m (1,579). For
the full year 2015 net sales increased by 6.8 per cent to SEK 5,674m (5,313).
• Operating profit was SEK 239m (262). For the full year 2015 operating profit
improved to SEK 671m (577).
• Operating profit, adjusted was SEK 255m (257). For the full year 2015
operating profit, adjusted improved to SEK 690m (632).
• Cash flow from operating activities improved to SEK 367m (290). For the
full year cash flow from operating activities improved to SEK 927m (500).
• Net debt/EBITDA was 3.03x (3.97).
• The Board proposes a dividend of SEK 0.50 (-) per share.

Title
Arial, Bold, 40 pt, red
Text/Bullets, Level 1-5
Arial, Regular, 20 pt, grey
Subtitle
Arial, Bold, 40 pt, grey
Overall market and sales development
Total sales growth of 2.7 per cent
• Positive to flat total market developments, except
seasonal products in Italy
• Organic growth -2.3 per cent for the quarter.
Excluding Italy, organic growth was 1.8 per cent
• Sales grew or was unchanged in all markets
except Italy, Denmark and UK.
• Positive sales trend in Sweden and Finland
driven by pick-and-mix.
• In Denmark sales of pastilles declined.
• Decline in Italy driven by a sharp decrease in
seasonal sales due to price increases to off-set
raw material price increases.
3
Cloetta´s main markets

Net sales and EBIT
4
1) Organic growth at constant exchange rates and comparable units -2.3% for the quarter and 1.5% for the year.
SEKm Oct-Dec
2015
Margin
%
Change
%
Oct-Dec
2014
Margin
%
Full year
2015
Full year
2014
Net sales 1,622 2.71 1,579 5,674 5,313
Operating profit, adjusted 255 15.7 -0.8 257 16.3 690 632
Operating profit (EBIT) 239 14.7 -8.8 262 16.6 671 577
Profit for the period 157 -0.6 158 386 242

Changes in net sales
5
Changes in net sales, % Oct-Dec
2015
Oct-Dec
2014
Full year
2015
Full year
2014
Organic growth -2.3% 1.7% 1.5% 1.0%
Structural changes 4.8% 4.8% 3.9% 4.3%
Changes in exchange rates 0.2% 3.1% 1.4% 3.3%
Total 2.7% 9.6% 6.8% 8.6%
-4,1%
1,4% 1,6%
0,6%
2,2%
-0,6%
1,7%
4,0%
0,8%
4,2%
-2,3%
3,0% 3,6%
5,8%
4,8%
2,7%
1,2%
6,6%
4,8%
4 200
4 400
4 600
4 800
5 000
5 200
5 400
5 600
5 800
-6,0%
-4,0%
-2,0%
0,0%
2,0%
4,0%
6,0%
8,0%
Q2 2013 Q3 2013 Q4 2013 Q1 2014 Q2 2014 Q3 2014 Q4 2014 Q1 2015 Q2 2015 Q3 2015 Q4 2015
Organic growth, %
Structural changes, %
Net Sales LTM

Title
Arial, Bold, 40 pt, red
Text/Bullets, Level 1-5
Arial, Regular, 20 pt, grey
Subtitle
Arial, Bold, 40 pt, grey
Net sales, Operating profit (EBIT) and
Operating profit, adjusted
6
Net sales Operating profit (EBIT) Operating profit, adjusted
1193 1 238
1 303
1 579
1 313 1280
1459
1622
0
200
400
600
800
1 000
1 200
1 400
1 600
1 800
Q1 Q2 Q3 Q4
SE
Km
2014 2015
52
85
178
262
90
130
212
239
0
50
100
150
200
250
300
Q1 Q2 Q3 Q4
SE
Km
2014 2015
74
108
193
257
108
133
194
255
0
50
100
150
200
250
300
Q1 Q2 Q3 Q4
SE
Km
2014 2015

Title
Arial, Bold, 40 pt, red
Text/Bullets, Level 1-5
Arial, Regular, 20 pt, grey
Subtitle
Arial, Bold, 40 pt, grey
-16 -23
54
116 91
44
75
290
223
163 174
367
-50
0
50
100
150
200
250
300
350
400
Q1 Q2 Q3 Q4
SE
Km
2013 2014 2015
Strong cash flow from operating activities
7

Title
Arial, Bold, 40 pt, red
Text/Bullets, Level 1-5
Arial, Regular, 20 pt, grey
Subtitle
Arial, Bold, 40 pt, grey
Cash flow 8
SEKm Oct-Dec
2015
Oct-Dec
2014
Full year
2015
Full year
2014
Cash flow from operating activities before changes in working
capital
295 267 697 492
Cash flow from changes in working capital 72 23 230 8
Cash flow from operating activities 367 290 927 500
Cash flows from investments in property, plant and equipment
and intangible assets
-48 -64 -161 -182
Cash flow from other investing activities - 4 -206 -187
Cash flow from investing activities -48 -60 -367 -369
Cash flow from operating and investing activities 319 230 560 131
Cash flow from financing activities -211 -114 -518 -24
Cash flow for the period 108 116 42 107

2,0
2,5
3,0
3,5
4,0
4,5
5,0
2013Q1
2013Q2
2013Q3
2013Q4
2014Q1
2014Q2
2014Q3
2014Q4
2015Q1
2015Q2
2015Q3
2015Q4
9
Financial leverage
Net debt/EBITDA, x
Target

Title
Arial, Bold, 40 pt, red
Text/Bullets, Level 1-5
Arial, Regular, 20 pt, grey
Subtitle
Arial, Bold, 40 pt, grey
Cloetta stands strong
10
Dividend of SEK 0.50 (-) per share proposed
• Improved EBITDA and very strong cash flow for the year.
– Cash flow from operating activities improved to SEK 927m (500).
• Net debt/EBITDA decreased to 3.03x (3.97).
– Well on track towards the target of Net debt/EBITDA of 2.5x
• The Board proposes a dividend of SEK 0.50 (-) per share
• Ambition is to use future cash flows for repayment of debts and payment of share
dividend, while at the same time providing financial flexibility for complementary
acquisitions.

Title
Arial, Bold, 40 pt, red
Text/Bullets, Level 1-5
Arial, Regular, 20 pt, grey
Subtitle
Arial, Bold, 40 pt, grey
Integration of Lonka according to plan
11
Will in 2017 support Cloetta’s margin target of 14%
• Decision to close the factory in Dieren, the Netherlands and transfer
production to Levice, Slovakia
– One-off costs and capital investments of approximately SEK 120m
• Joint sales and marketing organisation created in the Netherlands
• Savings from the closure of the factory in Dieren, insourcing of
production and synergies will generate savings of at least SEK 35m
• Plans for how to operate and launch Lonka in other markets finalised

Title
Arial, Bold, 40 pt, red
Text/Bullets, Level 1-5
Arial, Regular, 20 pt, grey
Subtitle
Arial, Bold, 40 pt, grey
In focus
12
Profitable growth
Integration of
Lonka and closure
of factory in
Dieren
Implement and
drive initiatives
within Pick & Mix
Operational
excellence in
supply chain
through Lean2020
initiative
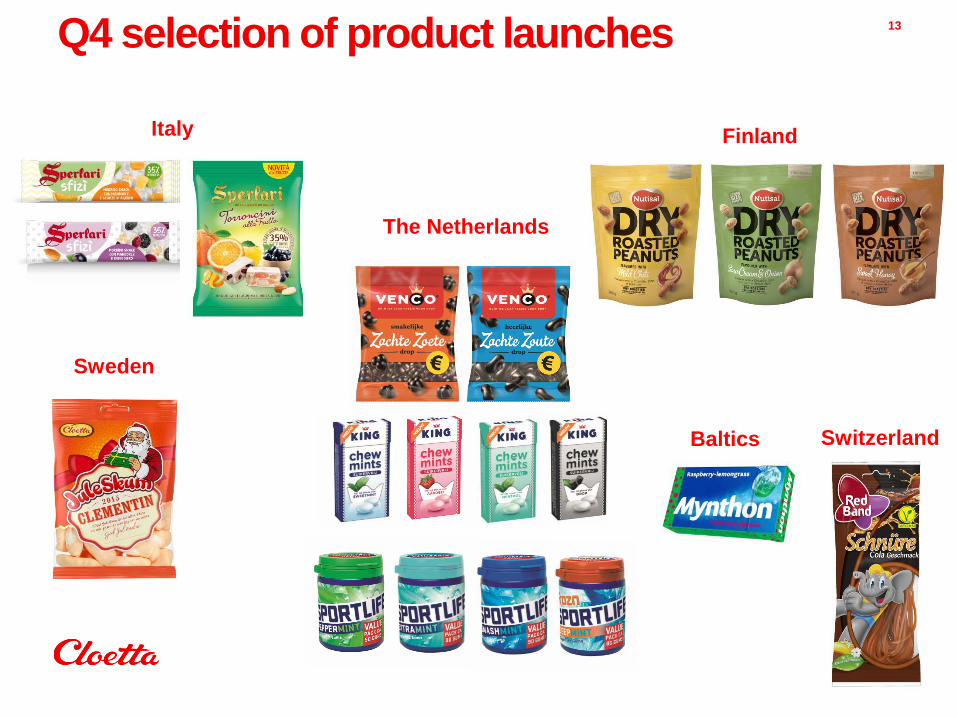
Q4 selection of product launches 13
Italy Finland
Sweden
Baltics
The Netherlands
Switzerland

Title
Arial, Bold, 80 pt, white Q&A

Title
Arial, Bold, 40 pt, red
Text/Bullets, Level 1-5
Arial, Regular, 20 pt, grey
Subtitle
Arial, Bold, 40 pt, grey
Disclaimer
• This presentation has been prepared by Cloetta AB (publ) (the “Company”) solely for use at this presentation and is furnished to you solely for your information and may not be reproduced or redistributed, in whole or in part, to any other person. The presentation does not constitute an invitation or offer to acquire, purchase or subscribe for securities. By attending the meeting where this presentation is made, or by reading the presentation slides, you agree to be bound by the following limitations.
• This presentation is not for presentation or transmission into the United States or to any U.S. person, as that term is defined under Regulation S promulgated under the Securities Act of 1933, as amended.
• This presentation contains various forward-looking statements that reflect management’s current views with respect to future events and financial and operational performance. The words “believe,” “expect,” “anticipate,” “intend,” “may,” “plan,” “estimate,” “should,” “could,” “aim,” “target,” “might,” or, in each case, their negative, or similar expressions identify certain of these forward-looking statements. Others can be identified from the context in which the statements are made. These forward-looking statements involve known and unknown risks, uncertainties and other factors, which are in some cases beyond the Company’s control and may cause actual results or performance to differ materially from those expressed or implied from such forward-looking statements. These risks include but are not limited to the Company’s ability to operate profitably, maintain its competitive position, to promote and improve its reputation and the awareness of the brands in its portfolio, to successfully operate its growth strategy and the impact of changes in pricing policies, political and regulatory developments in the markets in which the Company operates, and other risks.
• The information and opinions contained in this document are provided as at the date of this presentation and are subject to change without notice.
• No representation or warranty (expressed or implied) is made as to, and no reliance should be placed on, the fairness, accuracy or completeness of the information contained herein. Accordingly, none of the Company, or any of its principal shareholders or subsidiary undertakings or any of such person’s officers or employees accepts any liability whatsoever arising directly or indirectly from the use of this document.
15