clio: a 5 micron camera for the detection of giant exoplanets · clio: a 5 micron camera for the...
TRANSCRIPT

Clio: A 5 micron camera for the detection of giant exoplanets
Melanie Freeda, Philip M. Hinza, Michael R. Meyera, N. Mark Miltona, and Michael
Lloyd-Harta
aSteward Observatory, 933 N. Cherry Ave, Tucson, AZ 85721, USA
ABSTRACT
We plan to take advantage of the unprecedented combination of low thermal background and high resolutionprovided by the 6.5m MMT’s adaptive secondary mirror, to target the 3-5 micron atmospheric window wheregiant exoplanets are expected to be anomalously bright. We are in the process of building a 3-5 micron camerathat we will use to carry out a survey to characterize the prevalence and distribution of giant planets aroundnearby, Sun-like stars. Sensitivity estimates show that for a 1 Gyr old G0V primary at 10 pc, we expect to detect5 MJupiter and 15 MJupiter exoplanets at angular separations greater than 0.45-2.1” and 0.2-1.2” respectively.
Monte Carlo simulations based on these sensitivity estimates and a sample of 80 young (<1 Gyr), nearby (<20pc) M0V-F0V stars, predict the detection of 15±3 exoplanets with masses of 4-15 MJupiter and separations of
17-50 AU. Construction of the camera is currently underway and on-telescope testing is expected in the Fall2004-Winter 2005.
Keywords: exoplanets, thermal infrared, imaging, adaptive optics
1. INTRODUCTION
With the number of known extrasolar planets now exceeding 100 (http://www.obspm.fr/encycl/catalog.html),we have reached the point where we can begin to study the statistical properties of these planets (e.g. Marcy etal. (2003)1). However, while radial velocity surveys have provided a wealth of information about exoplanets, theyare unable to determine the inclination of the systems or obtain any spectral information about the exoplanets.In addition, they are limited to relatively small star-planet separations over a practical temporal baseline. Otherindirect methods such as astrometry and microlensing are also valuable tools for the detection of exoplanets.However, only by direct detection can any spectral information about the exoplanets be determined, which iscrucial to studying their physical properties (e.g. temperature, surface gravity, composition).
So far, the transit method is the only direct technique that has successfully detected exoplanets. The con-firmation of the radial velocity planet HD209458b by transit techniques2 led to the first detection of sodium inan exoplanetary atmosphere.3 Since then, three additional transitting exoplanets have been discovered withthe OGLE survey4–6 While transit techniques clearly have the potential to provide a wealth of informationabout exoplanets, they are also limited to close in planets, where multiple transits can quickly be observed andexoplanets are more likely to transit their primary star.
In an effort to directly detect exoplanets at separations left largely unexplored by current measurements,we are building an imager, Clio, to be used in the thermal infrared with ground-based adaptive optics (AO).Cool exoplanets (Teff < 1000 K) are thought to peak in brightness in the thermal IR from 3-5 microns (e.g.Burrows et al. (1997)7). Until now, it has been impossible to take high-resolution data in the thermal IRsince no appropriate space-based telescope exists and the thermal background is so large from the ground.Additional emissivity introduced by conventional AO systems overwhelms any astronomical signal. With theMMT’s adaptive secondary we can combine the thermal IR and high-resolution to help close the separationsensitivity gap between seeing-limited direct imaging surveys and indirect methods such as radial velocity surveys.
Further author information: (Send correspondence to M.F.)M.F.: E-mail: [email protected], Telephone: 1 520 626 8072
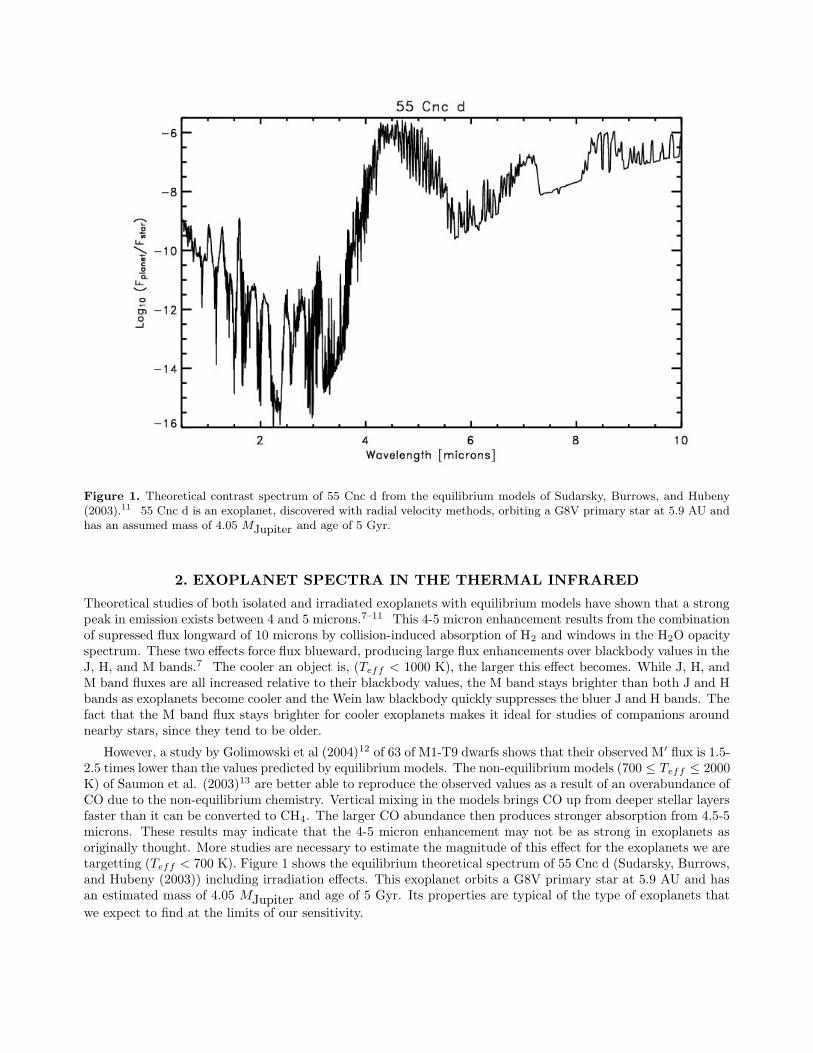
Figure 1. Theoretical contrast spectrum of 55 Cnc d from the equilibrium models of Sudarsky, Burrows, and Hubeny(2003).11 55 Cnc d is an exoplanet, discovered with radial velocity methods, orbiting a G8V primary star at 5.9 AU andhas an assumed mass of 4.05 MJupiter and age of 5 Gyr.
2. EXOPLANET SPECTRA IN THE THERMAL INFRARED
Theoretical studies of both isolated and irradiated exoplanets with equilibrium models have shown that a strongpeak in emission exists between 4 and 5 microns.7–11 This 4-5 micron enhancement results from the combinationof supressed flux longward of 10 microns by collision-induced absorption of H2 and windows in the H2O opacityspectrum. These two effects force flux blueward, producing large flux enhancements over blackbody values in theJ, H, and M bands.7 The cooler an object is, (Teff < 1000 K), the larger this effect becomes. While J, H, andM band fluxes are all increased relative to their blackbody values, the M band stays brighter than both J and Hbands as exoplanets become cooler and the Wein law blackbody quickly suppresses the bluer J and H bands. Thefact that the M band flux stays brighter for cooler exoplanets makes it ideal for studies of companions aroundnearby stars, since they tend to be older.
However, a study by Golimowski et al (2004)12 of 63 of M1-T9 dwarfs shows that their observed M′ flux is 1.5-2.5 times lower than the values predicted by equilibrium models. The non-equilibrium models (700 ≤ Teff ≤ 2000K) of Saumon et al. (2003)13 are better able to reproduce the observed values as a result of an overabundance ofCO due to the non-equilibrium chemistry. Vertical mixing in the models brings CO up from deeper stellar layersfaster than it can be converted to CH4. The larger CO abundance then produces stronger absorption from 4.5-5microns. These results may indicate that the 4-5 micron enhancement may not be as strong in exoplanets asoriginally thought. More studies are necessary to estimate the magnitude of this effect for the exoplanets we aretargetting (Teff < 700 K). Figure 1 shows the equilibrium theoretical spectrum of 55 Cnc d (Sudarsky, Burrows,and Hubeny (2003)) including irradiation effects. This exoplanet orbits a G8V primary star at 5.9 AU and hasan estimated mass of 4.05 MJupiter and age of 5 Gyr. Its properties are typical of the type of exoplanets that
we expect to find at the limits of our sensitivity.
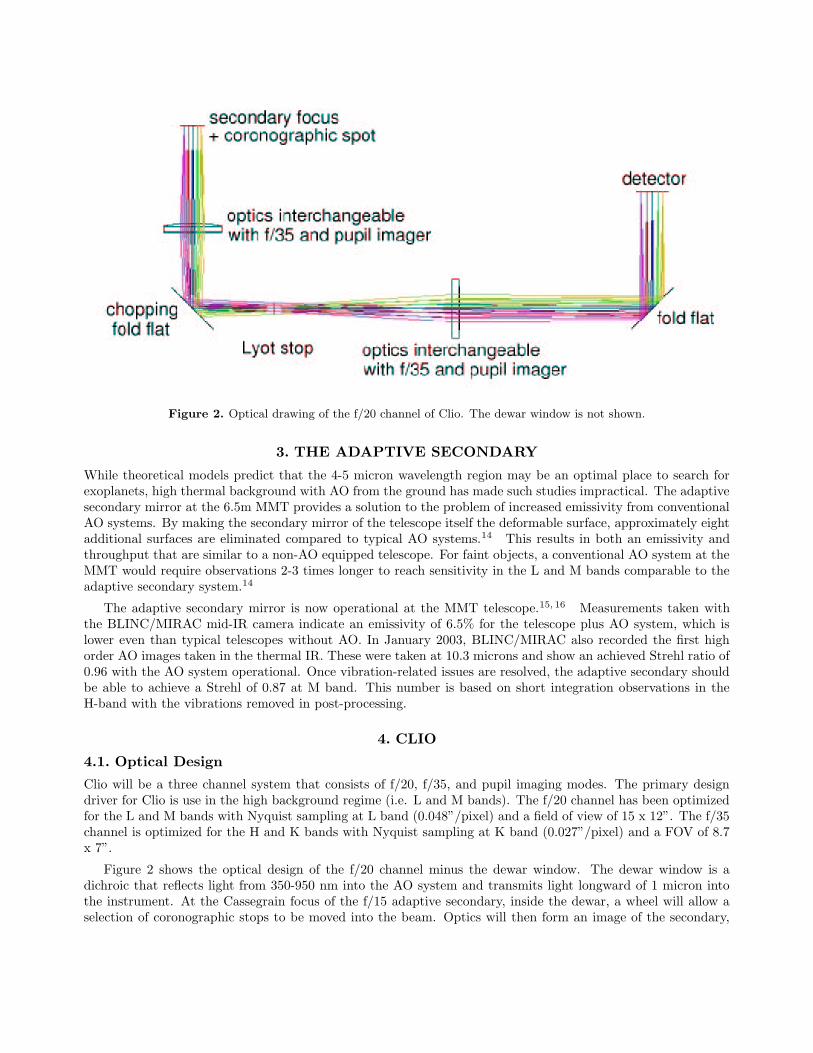
Figure 2. Optical drawing of the f/20 channel of Clio. The dewar window is not shown.
3. THE ADAPTIVE SECONDARY
While theoretical models predict that the 4-5 micron wavelength region may be an optimal place to search forexoplanets, high thermal background with AO from the ground has made such studies impractical. The adaptivesecondary mirror at the 6.5m MMT provides a solution to the problem of increased emissivity from conventionalAO systems. By making the secondary mirror of the telescope itself the deformable surface, approximately eightadditional surfaces are eliminated compared to typical AO systems.14 This results in both an emissivity andthroughput that are similar to a non-AO equipped telescope. For faint objects, a conventional AO system at theMMT would require observations 2-3 times longer to reach sensitivity in the L and M bands comparable to theadaptive secondary system.14
The adaptive secondary mirror is now operational at the MMT telescope.15, 16 Measurements taken withthe BLINC/MIRAC mid-IR camera indicate an emissivity of 6.5% for the telescope plus AO system, which islower even than typical telescopes without AO. In January 2003, BLINC/MIRAC also recorded the first highorder AO images taken in the thermal IR. These were taken at 10.3 microns and show an achieved Strehl ratio of0.96 with the AO system operational. Once vibration-related issues are resolved, the adaptive secondary shouldbe able to achieve a Strehl of 0.87 at M band. This number is based on short integration observations in theH-band with the vibrations removed in post-processing.
4. CLIO
4.1. Optical Design
Clio will be a three channel system that consists of f/20, f/35, and pupil imaging modes. The primary designdriver for Clio is use in the high background regime (i.e. L and M bands). The f/20 channel has been optimizedfor the L and M bands with Nyquist sampling at L band (0.048”/pixel) and a field of view of 15 x 12”. The f/35channel is optimized for the H and K bands with Nyquist sampling at K band (0.027”/pixel) and a FOV of 8.7x 7”.
Figure 2 shows the optical design of the f/20 channel minus the dewar window. The dewar window is adichroic that reflects light from 350-950 nm into the AO system and transmits light longward of 1 micron intothe instrument. At the Cassegrain focus of the f/15 adaptive secondary, inside the dewar, a wheel will allow aselection of coronographic stops to be moved into the beam. Optics will then form an image of the secondary,

where another wheel will allow a selection of Lyot stops to be introduced into the beam before the final image isformed on the detector. An articulating fold flat near the pupil will enable modulation of the sky signal on thedetector.
4.2. Detector
Clio’s detector is an Indigo Systems InSb 320x256 pixel chip with 30 micron pixels on an ISC9809 readout.This chip is in the process of being integrated with SDSU (a.k.a. Leach) electronics, rather than the IndigoSystems electronics for full desired functionality. Indigo Systems specifications give the detector’s dark currentas 6.2x10⁶ e-/s at 77 K. The readout has two selectable gain values that switch between two different modes ofthe chip. The high gain mode has a readnoise of 70 e- and a full well depth of 0.17x10⁶ e-, while the low gainmode has a readnoise of 700 e- and a full well depth of 3.5x10⁶ e-. The chip has 4 outputs than can each clockat approximately 1 MHz with the SDSU electronics. This chip was chosen because its specifications give goodperformance in the thermal infrared, especially at M band. The high full well depth and fast readout of thechip allow a large field of view relative to other detectors, which saturate quickly in M band. Since the thermalbackground is the dominant source of noise, the relatively large readnoise is a negligible noise source.
4.3. Dewar and Hardware
The dewar is a dual-vessel system where the external chamber is a simple liquid nitrogen vessel that cools the coldplate on which all of the optics are mounted. The interior vessel is isolated from the rest of the instrument andcontrols only the detector’s temperature. It has the option of pumping on the nitrogen to achieve temperaturesbelow 77K. This may be used to help reduce the high dark current of the detector. A vapor cooled shield hasbeen added around both vessels to increase the hold times.
4.4. Status
The dewar is currently being machined and assembled by IRLabs in Tucson, AZ and will be completed in Augustof 2004. Testing on the detector is ongoing. We plan to commission Clio with the MMT adaptive secondary inFall 2004-Winter 2005.
5. SENSITIVITY ANALYSIS
5.1. Filter Choice
To choose the best filters in the thermal IR for exoplanet detection, we calculated the signal-to-noise (S/N) ina series of filters for model exoplanets with two hour integrations on the MMT with the exoplanets placed at adistance of 10 pc. This was done for 34 exoplanets using theoretical spectral models from Burrows, Sudarsky,and Lunine (2003)10 and Sudarsky, Burrows, and Hubeny (2003).11 The 32 exoplanet models from Burrows,Sudarsky, and Lunine (2003) are equilibrium models that ignore stellar radiation and have masses ranging from1-25 MJupiter and ages ranging from 100 Myr - 5 Gyr. The final two exoplanet models from the work of
Sudarsky, Burrows, and Hubeny (2003) take stellar radiation into consideration. These latter two models arepredictions for spectra of 55 Cnc d, an exoplanet detected by radial velocity methods (4.05 MJupiter at 5.9 AU
from its 5 Gyr old G8V primary), and a 10 MJupiter exoplanet orbiting its G0V primary star at 10 AU with
an age of 1 Gyr. Signal-to-noise values were calculated for a set of filters with central wavelengths from 2.5-5.5microns in intervals of 0.05 microns and widths of 0.02-1.2 microns in intervals of 0.02 microns. Filters weremodelled by a boxcar shape with a maximum transmission of 85% and a minimum transmission of 0%. Thefollowing noise sources were taken into consideration:
• Throughput of the Telescope (primary and secondary Aluminum mirrors) + Adaptive Optics (no extraoptics) + Clio (dichroic window, ZnSe AR coated lens, Gold mirror, filter, Cleartran AR coated lens, Goldmirror, chip).
• Atmospheric absorption of Mauna Kea (1.2 mm water column; produced using the program IRTRANS4and obtained from the UKIRT worldwide web pages)

• Sky background (1.0 mm water column).17
• Telescope emissivity of 10%. Measurements of the telescope emissivity at the MMT with the adaptivesecondary give 6.5%. We have chosen 10% as a conservative value.
• Strehl ratio. Values achievable at the MMT system were assumed (40% at H band with vibrations removed;equivalent to 81% at L and 87% at M).
• Photon noise from the exoplanet signal.
• Detector dark current and readnoise (see Section 4.2).
• Photon and speckle noise from the primary star was ignored here for simplicity and will be addressed inthe following section. This is valid for exoplanets at large separations from their primary stars, where the
Figure 3. Results of filter choice analysis for a two hour integration at the MMT of a 55 Cnc d type system placed at10 pc. Theoretical models were taken from Sudarsky, Burrows, and Hubeny (2003). The best filter for detection has acentral wavelength near 4.75 microns and a width near 0.58 microns. (top) linear scaling to see best filter (bottom) 6throot scaling to see low signal-to-noise areas.

speckle and photon noise from the point spread function (PSF) become negligible relative to other noisesources.
Figure 3 shows the results of this analysis for a 55 Cnc d type system placed at 10 pc. Note that we showthis exoplanet because the model includes the effects of stellar irradiation and it is similar to the least massive,oldest planet we expect to detect with Clio. The best filter for detection was chosen by considering lower mass,older planets more strongly since they are more difficult to detect. The optimum chosen filter has a centralwavelength of approximately 4.75 microns and a width of 0.58 microns.
5.2. Full Sensitivity Calculation
Here, we add photon and speckle noise from the primary star to the calculation to produce sensitivity curves forthe filter chosen in the previous section. To do this, we have carried out monochromatic, temporally uncorrelatedAO simulations where the atmosphere is simulated by seven discreet layers. The properties and number of layersare based on a set of SCIDAR measurements taken at Mt. Graham and Mt. Hopkins in Arizona.18 For eachatmospheric layer we have created a series of independent, random, phase screens with Kolmogorov statisticsas described by Noll (1976).19 The noiseless shape of the deformable mirror (DM) was calculated using areconstructor matrix typical of that used for the MMT AO system. The following noise sources were includedin the AO simulation:
• Simulation fitting error. There is a limit to how well we can model the atmosphere because only the first496 Zernike modes can be calculated using double precision. Modes 497 through 5151 were calculated usingan arbitrary precision algorithm so that the residual fitting error was only σ2
sim fit = 0.00165004 rad2.
• Actuator fitting error. Fitting error due to the finite number of actuators on the DM is accounted for bythe fact that our reconstructor only calculates the DM shape using the first 54 Zernike modes.
• Reconstructor error. Photon noise from the primary star and sky background as well as detector readnoiseand dark current all contribute to noise in the wavefront reconstruction. These errors have been includedby propogating them through the linear system represented by the reconstructor and adding them to theuncorrected wavefront phase.
• Control loop time delay. The contribution of time delay to the error in each Zernike mode on the DMwas calculated by examining the behavior of the Zernike coefficients versus time using the temporal powerspectrum formulated by Roddier (1999).20 For each Zernike mode, the coefficient value was calculatedversus time for a time delay of 41 ms. The standard deviation of the differences between numerous(∼80000) pairs of coefficients, separated by that delay, was taken as the time delay error for that Zernikemode. Examination of the distribution of the differences showed that they were consistent with a gaussian.These random errors were then added to the uncorrected wavefront phase.
The above simulations produced a series of temporally uncorrelated residual phase screens that were thenpropogated through a Fourier optics model of Clio and added together to produce a time-averaged PSF. ThisPSF was then used to calculate the photon noise from the exoplanet’s primary star. In order to estimate thespeckle noise from the stellar PSF, the speckle noise formulation from Racine et al. (1999)21 was used:
σ2
speckle =Number of Photons in Speckle2
16 (Speckle Lifetime)
This method was preferred over a time-correlated AO model because of the extreme computational intensityrequired for an appropriate simulation of a two hour observation and, more importantly, the fact that atmosphericspeckles are known to underestimate the amount of observed speckle noise (i.e. they ignored super-speckles).Since the source of super-speckles is currently unknown, there are no models that are able to accurately reproducethem. As a result, we have chosen to use the above formula and explored several different speckle lifetime values(0.1, 1, 10, 100, 1000 seconds) to cover a reasonable range of speckle noise.

To try and understand which of these speckle lifetimes was most reasonable for the MMT, we examined datataken in the L band with MIRAC/BLINC (at the MMT) and found that the typical speckle lifetime was about4 seconds. This was determined by calculating the total error in a 10 s stellar image as a function of radius,subtracting off all other noise sources, scaling to a 2 hour integration, and plotting on an equivalent plot to Figure4 (described below) for L band. Since the MIRAC/BLINC image was only 10 s long, it may not have had enoughtime to record the full duration of a super speckle. As a result, the estimation is most likely a lower limit to theactual speckle lifetime of a long exposure image. More observations are necessary to determine the true specklelifetime with the MMT AO system, however we can impose an upper limit on the effective speckle lifetime byrotating the instrument during observations. We can achieve an approximately 90% observing efficiency whilerotating the instrument every 100 s of integration. Therefore, a reasonable range of actual speckle lifetimes forthe MMT AO system is approximately 4-100 s.
The estimated photon and speckle noise of a 1 Gyr old G0V primary star at 10 pc was then calculated toproduce a sensitivity vs. separation plot (see Figure 4) for the filter chosen in section 5.1. Figure 5 shows abreakdown of contributions from each of the individual noise sources. Speckle noise and thermal background
Figure 4. Results of Clio sensitivity analysis for filter with central wavelength of 4.75 microns and width of 0.58 microns(note AO simulations were monochromatic). The solid lines show the sensitivity estimates for five different values ofspeckle lifetimes. Speckle lifetimes of 0.1, 1, 10, 100, and 1000 seconds were assumed, where the top-most solid line is for0.1 second. Any exoplanets on the plot lying above these sensitivity lines are detectable. The primary star is assumed tobe a G0V (∼ 1 M¯) at 10pc and 1 Gyr old. The black dotted line shows where an irradiated 10 MJupiter exoplanet 10
AU from the primary star would lie on the plot.11 Therefore, we would expect to be able to detect this type of exoplanetat separations larger than 1.5 λ/D (0.2”) from the primary star for a speckle lifetime of 0.1 s and 8.7 λ/D (1.3”) for aspeckle lifetime of 1000 s. A series of 1 Gyr old isolated planet models from Burrows, Sudarsky, and Lunine (2003) arealso included on the plot as grey dashed lines.
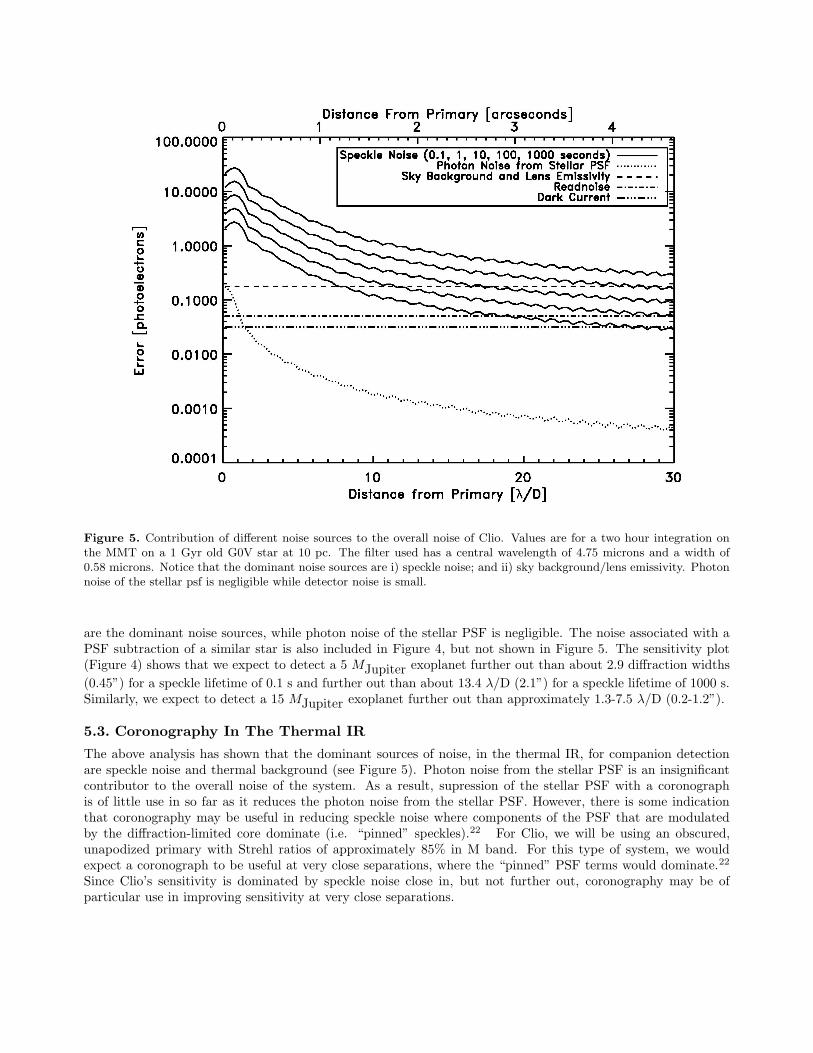
Figure 5. Contribution of different noise sources to the overall noise of Clio. Values are for a two hour integration onthe MMT on a 1 Gyr old G0V star at 10 pc. The filter used has a central wavelength of 4.75 microns and a width of0.58 microns. Notice that the dominant noise sources are i) speckle noise; and ii) sky background/lens emissivity. Photonnoise of the stellar psf is negligible while detector noise is small.
are the dominant noise sources, while photon noise of the stellar PSF is negligible. The noise associated with aPSF subtraction of a similar star is also included in Figure 4, but not shown in Figure 5. The sensitivity plot(Figure 4) shows that we expect to detect a 5 MJupiter exoplanet further out than about 2.9 diffraction widths
(0.45”) for a speckle lifetime of 0.1 s and further out than about 13.4 λ/D (2.1”) for a speckle lifetime of 1000 s.Similarly, we expect to detect a 15 MJupiter exoplanet further out than approximately 1.3-7.5 λ/D (0.2-1.2”).
5.3. Coronography In The Thermal IR
The above analysis has shown that the dominant sources of noise, in the thermal IR, for companion detectionare speckle noise and thermal background (see Figure 5). Photon noise from the stellar PSF is an insignificantcontributor to the overall noise of the system. As a result, supression of the stellar PSF with a coronographis of little use in so far as it reduces the photon noise from the stellar PSF. However, there is some indicationthat coronography may be useful in reducing speckle noise where components of the PSF that are modulatedby the diffraction-limited core dominate (i.e. “pinned” speckles).22 For Clio, we will be using an obscured,unapodized primary with Strehl ratios of approximately 85% in M band. For this type of system, we wouldexpect a coronograph to be useful at very close separations, where the “pinned” PSF terms would dominate.22
Since Clio’s sensitivity is dominated by speckle noise close in, but not further out, coronography may be ofparticular use in improving sensitivity at very close separations.

Figure 6. (left) Fractional chance of detecting various numbers of planets given a separation distribution functionof dn/da ∼ a0.7 and three different mass distribution functions for planets. All three mass distributions are clearlydistinguishable. (right) Fractional chance of detecting various numbers of planets given a mass distribution of dn/dM ∼
M−0.7 and 5 different separation distribution functions. It appears unlikely that no planets will be detected with thissurvey. If, indeed, no planets are detected, we should be able to rule out a significant region of parameter space for thesedistribution functions.
6. EXOPLANET SURVEY
Given our expected sensitivity and what is currently known about exoplanets, we have run a series of MonteCarlo simulations to understand what we expect to see with Clio. These results will be used to constructed asurvey that has the ability to provide statistical information about the exoplanet population, even for a nullresult.
Radial velocity surveys provide a baseline from which we can make predictions about the distribution ofexoplanets at further separations from their primaries. Current results indicate a companion mass distributionof dn/dM ∼ M−0.7 and a separation distribution of dn/da ∼ a>−1 (Marcy et al. 20031). A fit to the data (for0.2 AU < a < 2 AU) gives dn/da ∼ a0.7 as a starting point. Our survey will enable a quantitative test of thehypothesis that the mass and separation distributions of outer planets are consistent with those observed within5 AU.
As a first hypothesis to test, we can simply extend the observed distributions to larger separations. Weperformed a series of Monte Carlo simulations where the radial velocity mass distribution was taken to be validfrom 1-15 MJupiter and the separation distribution was extended from 0.01-50 AU. An outer boundary of 50
AU was chosen to be consistent with the outer edge of our Kuiper Belt23 as well as the radius of the smallestsilhouette disk in Orion.24 Estimates of our sensitivities versus separation from the central star are derived insection 5.2. We are using the estimates for a speckle lifetime of 100 s here as a conservative estimate. Notethat these sensitivity estimates assume equilibrium exoplanet models. Further investigation of non-equilibriummodels below 700 K is needed to determine the strength of the effect of increased CO absorption from 4.5-5microns for our targets.
These simulations were used to define an optimal survey sample of 80 M0-F0 stars within 20 pc and lessthan 1 Gyr old. With this sample, and assuming dn/da ∼ a0.7 and dn/dM ∼ M−0.7, we expect to detect 15±3companions with 4-15 MJupiter at 17-50 AU.
We do not necessarily expect our simple extrapolation to be valid given that at very small separations planetsmay have very different evolutionary histories than their larger separations counterparts (e.g. planet migrationafter formation25, 26). Our survey will provide an indication of the shape of the separation and mass distributionfunctions based on the number of companions detected.

Figure 6 indicates our chances of detecting various numbers of planets given dn/da ∼ a0.7 as well as threedifferent planet mass distribution functions of the form dn/dM ∼ Mα with α=[-1,0,1]. These three distributionfunctions are clearly distinguishable for the given sample. Assuming the given separation distribution function,we would be able to rule out dn/dM ∼ M−1 at 4σ and dn/dM ∼ M1 at 11σ in the event of no planet detections.
The same process can be repeated for various separation distributions. Figure 6 indicates our chances ofdetecting various numbers of planets, while this time keeping dn/dM ∼ M−0.7 and varying the separationdistribution function from dn/da ∼ aβ β=[-0.6,-0.2,0.1,0.7,2]. For a null result we can rule out β=-0.2 at 2σ andβ=0.7 at 4σ.
These limits will provide valuable constraints on theories of planet formation and evolution as well as helpguide the next generation of direct detection surveys.
ACKNOWLEDGMENTS
We would like to thank IRLabs for their expert help, especially Elliott Solheid for designing the instrumentdewar, Ken Salvestrini for helping with the detector testing, Mitch Nash for machining the parts, Kirby Hnat fordoing the thermal analysis, and Ron Dewitt for helping with the dewar design. Thanks also to Michael Lesserfor helping us integrate AZCam with Clio, Dave Sudarsky for slaving over the 10 MJupiter model and answering
all our model questions, John Codona for insightful discussions on speckle noise, Patrick Young for providing hispre-main sequence stellar models, and Dick Joyce for helping with filter measurements. M.Freed acknowledgessupport from the NASA Graduate Student Researchers Program (NGT5-50394). We also acknowledge supportfrom the TPF Foundation Science Program, AFOSR, and the NASA Astrobiology Institute “Laplace Center”node at the UofA.
REFERENCES
1. G. Marcy, P. R. Butler, D. A. Fischer, and S. S. Vogt, “Properties of extrasolar planets,” in Scientific
Frontiers in Research on Extrasolar Planets, D. Deming and S. Seager, eds., ASP Conf. Ser. 294, pp. 1–16,2003.
2. D. Charbonneau, T. M. Brown, D. W. Latham, and M. Mayor, “Detection of planetary transits across asun-like star,” ApJ 529, pp. L45–L48, 2000.
3. D. Charbonneau, T. M. Brown, R. W. Noyes, and R. L. Gilliland, “Detection of an extrasolar planetatmosphere,” ApJ 568, pp. 377–384, 2002.
4. M. Konacki, G. Torres, S. Jha, and D. D. Sasselov, “An extrasolar planet that transits the disk of its parentstar,” Nature 421, pp. 507–509, 2003.
5. F. Bouchy, F. Pont, N. C. Santos, C. Melo, M. Mayor, D. Queloz, and S. Udry, “Two new very hot jupitersamong the ogle transiting candidates,” A&A submitted, 2004.
6. M. Konacki and et al., “The transiting extrasolar giant planet around the star ogle-tr-113,” ApJ 609,pp. L37–L40, 2004.
7. A. Burrows, M. Marley, W. B. Hubbard, J. I. Lunine, T. Guillot, D. Saumon, R. Freedman, D. Sudarsky,and C. Sharp, “A nongray theory of extrasolar giant planets and brown dwarfs,” ApJ 491, pp. 856–875,1997.
8. G. Chabrier, I. Baraffe, F. Allard, and P. Hauschildt, “Evolutionary models for very low-mass stars andbrown dwarfs with dusty atmospheres,” ApJ 542, pp. 464–472, 2000.
9. M. S. Marley, S. Seager, D. Saumon, K. Lodders, A. S. Ackerman, R. S. Freedman, and X. Fan, “Clouds andchemistry: Ultracool dwarf atmospheric properties from optical and infrared colors,” ApJ 568, pp. 335–342,2002.
10. A. Burrows, D. Sudarsky, and J. I. Lunine, “Beyond the t dwarfs: Theoretical spectra, colors, and de-tectability of the coolest brown dwarfs,” ApJ 596, pp. 587–596, 2003.
11. D. Sudarsky, A. Burrows, and I. Hubeny, “Theoretical spectra and atmospheres of extrasolar giant planets,”ApJ 588, pp. 1121–1148, 2003.

12. D. A. Golimowski, S. K. Leggett, M. S. Marley, X. Fan, T. R. Geballe, G. R. Knapp, F. J. Vrba, A. A.Henden, C. B. Luginbuhl, H. H. Quetter, J. A. Munn, B. Canzian, W. Zheng, Z. I. Tsvetanov, K. Chiu,K. Glazebrook, E. A. Hoversten, D. P. Schneider, and J. Brinkmann, “L’ and m’ photometry of ultracooldwarfs,” AJ 127, pp. 3516–3536, 2004.
13. D. Saumon, M. S. Marley, K. Lodders, and R. S. Freedman, “Non-equilibrium chemistry in the atmospheresof brown dwarfs,” in Brown Dwarfs, E. Mart́ın, ed., Proc. of IAU Symp. 211, p. 345, 2003.
14. M. Lloyd-Hart, “Thermal performance enhancement of adaptive optics by use of a deformable secondarymirror,” PASP 112, pp. 264–272, 2000.
15. F. P. Wildi, G. Brusa, and M. Lloyd-Hart, “First light of the 6.5-m mmt adaptive optics system,” inAstronomical Adaptive Optics Systems and Applications, R. K. Tyson and M. Lloyd-Hart, eds., Proc. SPIE
5169, pp. 17–25, 2003.
16. G. Brusa-Zappellini, A. Riccardi, F. P. Wildi, M. Lloyd-Hart, H. M. Martin, R. Allen, D. L. Fisher, D. L.Miller, R. Biasi, D. Gallieni, and F. Zocchi, “Mmt adaptive secondary: first ao closed-loop results,” inAstronomical Adaptive Optics Systems and Applications, R. K. Tyson and M. Lloyd-Hart, eds., Proc. SPIE
5169, pp. 26–36, 2003.
17. F. C. Gillett and M. Mountain, “On the comparative performance of an 8m ngst and a ground based 8moptical/ir telescope,” in Science with the Next Generation Space Telescope, ASP Conf. Ser. 133, p. 42, 1998.
18. D. L. McKenna, R. Avila, J. M. Hill, S. Hippler, P. Salinari, P. C. Stanton, and R. Weiss, “Lbt facilityscidar: recent results,” in Adaptive Optical System Technologies II, P. L. Wizinowich and D. Bonaccini, eds.,Proc. SPIE 4839, pp. 825–836, 2003.
19. R. J. Noll, “Zernike polynomials and atmospheric turbulence,” J. Opt. Soc. Am. 66, pp. 207–211, 1976.
20. F. Roddier, Adaptive Optics in Astronomy, Cambridge University Press, Cambridge, UK, 1999.
21. R. Racine, G. A. H. Walker, D. Nadeau, R. Doyon, and C. Marois, “Speckle noise and the detection of faintcompanions,” PASP 111, pp. 587–594, 1999.
22. M. D. Perrin, A. Sivaramakrishnan, R. B. Makidon, B. R. Oppenheimer, and J. R. Graham, “The structureof high strehl ratio point-spread functions,” ApJ 596, pp. 702–712, 2003.
23. C. A. Trujillo and M. E. Brown, “The radial distribution of the kuiper belt,” ApJ 554, pp. L95–L98, 2001.
24. J. Bally, C. R. O’Dell, and M. J. McCaughrean, “Disks, microjets, windblown bubbles, and outflows in theorion nebula,” AJ 119, pp. 2919–2959, 2000.
25. P. J. Armitage, M. Livio, S. H. Lubow, and J. E. Pringle, “Predictions for the frequency and orbital radiiof massive extrasolar planets,” MNRAS 334, pp. 248–256, 2002.
26. D. E. Trilling, J. I. Lunine, and W. Benz, “Orbital migration and the frequency of giant planet formation,”A&A 394, pp. 241–251, 2002.