climb real estate san francisco year-end market recap 2015
DESCRIPTION
A recap of the San Francisco residential real estate market in 2015 from the Bay Area's most innovative real estate company, Climb Real EstateTRANSCRIPT

2 0 1 5
S A N F R A N C I S C O
M A R K E T R E C A P
Y E A R - E N D
CLIMBSF.COM

CLIMBSF.COM
IT’S MORE THAN A HOME IT’S YOUR LIFE
CRISSY FIELD | 3:17 PM

MESSAGE FROM THE CEO 2015 can only be described as a milestone year for San Francisco real estate. With unprecedented demand driving home sales, we saw record prices throughout the city. In particular, condominium and new construction sales led the way. For the first time in San Francisco history, the cost per foot of condominiums outpaced single-family homes. Single-family homes were up 14% in 2015; condos and lofts up roughly 12%. Inventory is down to less than one month for both single-family homes and condominiums.
While there were many achievements and new records in the local market, Climb Real Estate also celebrated many milestones. We are now over 100 agents in 5 offices. We are now consistently ranked one of the top brokerages in the city. Our website is nationally acclaimed. We launched Climb Labs in the summer in our new Mid-Market space, which offers real estate’s most innovative think tank. We launched our first new development project, Sapphire, in SOMA. Our Jack London Square office in the East Bay is now our fastest-growing market segment.
This past year, TV viewers nationally were introduced to the Climb brand when Million Dollar Listing aired on Bravo. Climb consistently represents properties over $3M, from Sea Cliff to Los Altos, Pacific Heights to Napa. Climb is no longer SOMA and South Beach, we are prepared to serve your real estate needs anywhere in the greater Bay Area.
Our tag line is “It’s More Than A Home. It’s Your Life,” and we demonstrated this in our community outreach including food and clothing drives, the AIDS Lifecycle Ride, Aim High, and numerous volunteer events. We do not just sell our communities’ real estate, we actively participate in those communities.
While Climb Real Estate continues to expand its reach in the greater Bay Area, our utmost goal is to serve buyers and sellers with integrity, professionalism, and superior market knowledge. Our talented salespeople are available to you to answer questions about the micro-trends within our marketplace.
Here’s to another great year in San Francisco real estate.
Sincerely,
Chris Lim

MEDIAN SALES PRICE
2015$1.3M
+16.8%YEAR-OVER-YEAR CHANGE
S I N G L E - F A M I L Y
H O M E S
2014$1.1M
C O N D O S & L O F T S
2015$1.1M
+15.2%YEAR-OVER-YEAR CHANGE
2014$1.0M
SINGLE-FAMILY HOMES
CONDOS & LOFTS
MEDIAN SALES PRICE
2015 2014 2015 2014
$1.3M $1.1M $1.1M $1.0M
DAYS ON MARKET UNTIL SALE
2015 2014 2015 2014
29.3 days 31.8 days 44.0 days 46.3 days
climbsf.com
© 2016 San Francisco Association of REALTORS®. All data subject to ERRORS, OMISSIONS or REVISIONS and is not WARRANTED.All information deemed reliable but is not guaranteed. Search all SFARMLS listings at www.sfrealtors.com. Powered by ShowingTime 10K.
- 4.8%YEAR-OVER-YEAR CHANGE YEAR-OVER-YEAR CHANGE
- 7.7%
YEAR-OVER-YEAR CHANGE YEAR-OVER-YEAR CHANGE
Climb Market Report
CONDOS & LOFTSSINGLE-FAMILY HOMES
+ 16.8% + 15.2%
SINGLE-FAMILY HOMES CONDOS & LOFTS
2015 ANNUAL REPORT
IT WAS AN EXCITING YEAR IN SAN FRANCISCO. INVENTORY SOLD QUICKLY AT HIGHER PRICES THAN AT ANY POINT IN THE CITY'S LONG, RICH HISTORY.
$600,000
$800,000
$1,000,000
$1,200,000
$1,400,000
2012 2013 2014 2015
20
30
40
50
60
70
80
90
2012 2013 2014 2015
SINGLE-FAMILY
CONDO & LOFT
SINGLE-FAMILY
CONDO & LOFT
CLIMB MARKET REPORT
DAYS ON MARKET UNTIL SALE
201529.3 DAYS
-7.7%YEAR-OVER-YEAR CHANGE
S I N G L E - F A M I L Y
H O M E S
201431.8 DAYS
C O N D O S & L O F T S
-4.8%YEAR-OVER-YEAR CHANGE
201544 DAYS
201446.3 DAYS
SINGLE-FAMILY HOMES
CONDOS & LOFTS
MEDIAN SALES PRICE
2015 2014 2015 2014
$1.3M $1.1M $1.1M $1.0M
DAYS ON MARKET UNTIL SALE
2015 2014 2015 2014
29.3 days 31.8 days 44.0 days 46.3 days
climbsf.com
© 2016 San Francisco Association of REALTORS®. All data subject to ERRORS, OMISSIONS or REVISIONS and is not WARRANTED.All information deemed reliable but is not guaranteed. Search all SFARMLS listings at www.sfrealtors.com. Powered by ShowingTime 10K.
- 4.8%YEAR-OVER-YEAR CHANGE YEAR-OVER-YEAR CHANGE
- 7.7%
YEAR-OVER-YEAR CHANGE YEAR-OVER-YEAR CHANGE
Climb Market Report
CONDOS & LOFTSSINGLE-FAMILY HOMES
+ 16.8% + 15.2%
SINGLE-FAMILY HOMES CONDOS & LOFTS
2015 ANNUAL REPORT
IT WAS AN EXCITING YEAR IN SAN FRANCISCO. INVENTORY SOLD QUICKLY AT HIGHER PRICES THAN AT ANY POINT IN THE CITY'S LONG, RICH HISTORY.
$600,000
$800,000
$1,000,000
$1,200,000
$1,400,000
2012 2013 2014 2015
20
30
40
50
60
70
80
90
2012 2013 2014 2015
SINGLE-FAMILY
CONDO & LOFT
SINGLE-FAMILY
CONDO & LOFT
CLIMB MARKET REPORT

District 1 resides in the northwest quadrant of San Francisco, stretching from near USF to the ocean. It is often regarded as a heavily residential neighborhood with a mix of desirable single-family homes and multi-tenant buildings enhanced by stunning views of the Golden Gate Bridge, Marin Headlands, and Pacific Ocean. We see many home buyers opting to stay in the city looking for the larger homes that this neighborhood offers.
+12.6% MORE THAN LAST YEAR
2014$1.47M
2015$1.65M
R I C H M O N DS E A C L I F F
L A K E J O R D O N P A R K
L A U R E L H E I G H T S
O U T E R / C E N T R A L / I N N E R
R I C H M O N D
L O N E M O U N T A I N
M E D I A N S A L E SP R I C E
D A Y S O NM A R K E T
2014 25
P R I C E P E RS Q . F T .
S O L DL I S T I N G S
192
2014
214
2015
$875$755
2823
-16% LESS THAN LAST YEAR
+16% MORE THAN LAST YEAR -10.3% LESS THAN LAST YEAR
2015
20142015
+3.5% MORE THAN LAST YEAR
2014$1.06M
2015$1.10M
M E D I A N S A L E SP R I C E
D A Y S O NM A R K E T
2014
P R I C E P E RS Q . F T .
S O L DL I S T I N G S
2014 2015
$826$750
44 40-9.4% LESS THAN LAST YEAR
+10.2% MORE THAN LAST YEAR -8% LESS THAN LAST YEAR
2015
20142015
SINGLE-FAMILY HOMES CONDOS & LOFTS
138 127
SUBMARKETBAROMETER
UP & COMING
POTENTIALOPPORTUNITIES
HOTMARKET
HOLDFOR NOW

District 2 resides in the southwest quadrant of San Francisco, stretching from near the Parnassus campus of UCSF to the ocean. Often called “the Avenues,” it is predominantly a mix of smaller detached single-family homes that were constructed in the 1920’s, first by Henry Doelger and later by Oliver Rousseau. With a steady turnover in inventory, we see many home buyers taking advantage here of some of the best priced single-family homes in the city.
+20.9% MORE THAN LAST YEAR
S U N S E TO U T E R S U N S E T
C E N T R A L S U N S E T
I N N E R S U N S E TO U T E R P A R K S I D E
P A R K S I D E
I N N E R P A R K S I D E
G O L D E N G A T E H E I G H T S
D A Y S O NM A R K E T
25
P R I C E P E RS Q . F T .
S O L DL I S T I N G S
405
2014
439
2015
$760$668
3226
-18.7% LESS THAN LAST YEAR
+13.8% MORE THAN LAST YEAR -7.7% LESS THAN LAST YEAR
2014$0.96M
2015$1.16M
M E D I A N S A L E SP R I C E
2014 2015
20142015
+7.6% MORE THAN LAST YEAR
2014$0.93M
2015$1.00M
M E D I A N S A L E SP R I C E
D A Y S O NM A R K E T
2014
P R I C E P E RS Q . F T .
S O L DL I S T I N G S
2014 2015
$726$655
3751
+ 37.5% MORE THAN LAST YEAR
+10.9% MORE THAN LAST YEAR +15.2% MORE THAN LAST YEAR
2015
20142015
SINGLE-FAMILY HOMES
33 38
CONDOS & LOFTS
SUBMARKETBAROMETER
UP & COMING
POTENTIALOPPORTUNITIES
HOTMARKET
HOLDFOR NOW
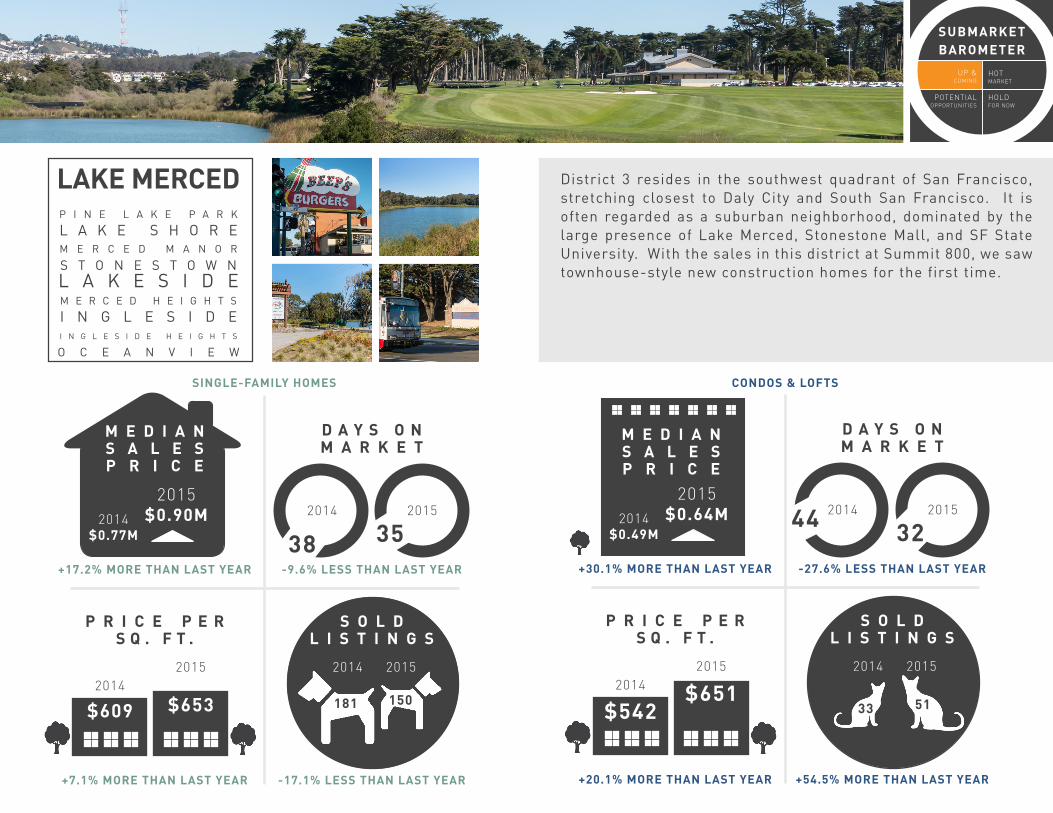
District 3 resides in the southwest quadrant of San Francisco, stretching closest to Daly City and South San Francisco. It is often regarded as a suburban neighborhood, dominated by the large presence of Lake Merced, Stonestone Mall, and SF State University. With the sales in this district at Summit 800, we saw townhouse-style new construction homes for the first time.
+17.2% MORE THAN LAST YEAR
LAKE MERCEDP I N E L A K E P A R K
L A K E S H O R EM E R C E D M A N O R
S T O N E S T O W N L A K E S I D EM E R C E D H E I G H T S
I N G L E S I D EI N G L E S I D E H E I G H T S
O C E A N V I E W
D A Y S O NM A R K E T
P R I C E P E RS Q . F T .
S O L DL I S T I N G S
150
2014
181
2015
$653$609
38 35-9.6% LESS THAN LAST YEAR
+7.1% MORE THAN LAST YEAR -17.1% LESS THAN LAST YEAR
SUBMARKETBAROMETER
UP & COMING
POTENTIALOPPORTUNITIES
HOTMARKET
HOLDFOR NOW
2014$0.77M
2015$0.90M
M E D I A N S A L E SP R I C E
2014 2015
20142015
+30.1% MORE THAN LAST YEAR
2014$0.49M
2015$0.64M
M E D I A N S A L E SP R I C E
D A Y S O NM A R K E T
2014
P R I C E P E RS Q . F T .
S O L DL I S T I N G S
2014 2015
$651$542
44 32-27.6% LESS THAN LAST YEAR
+20.1% MORE THAN LAST YEAR +54.5% MORE THAN LAST YEAR
2015
20142015
SINGLE-FAMILY HOMES
33 51
CONDOS & LOFTS

District 4 resides in the center quadrant of San Francisco, starting behind Twin Peaks and running southwest towards Highway 280. It is often overlooked as one of San Francisco’s most desirable suburbs, with a great range of single-family homes from starter homes and Eichlers to large St. Francis Wood estates. The area also offers single-family home buyers easy access to public transportation with a distinct neighborhood feel.
+16.1% MORE THAN LAST YEAR
WEST PORTALF O R E S T H I L L
S T . F R A N C I S W O O D
B A L B O A T E R R A C EM O U N T D A V I D S O N M A N O R
M I R A L O M A P A R K
D I A M O N D H E I G H T S
M I D T O W N T E R R A C E
D A Y S O NM A R K E T
P R I C E P E RS Q . F T .
S O L DL I S T I N G S
307
2014
334
2015
$815$730
28 29+4.9% MORE THAN LAST YEAR
+11.7% MORE THAN LAST YEAR +8.8% MORE THAN LAST YEAR
SUBMARKETBAROMETER
UP & COMING
POTENTIALOPPORTUNITIES
HOTMARKET
HOLDFOR NOW
2014$1.23M
2015$1.42M
M E D I A N S A L E SP R I C E
2014 2015
20142015
+19.3% MORE THAN LAST YEAR
2014$0.59M
2015$0.70M
M E D I A N S A L E SP R I C E
D A Y S O NM A R K E T
2014
P R I C E P E RS Q . F T .
S O L DL I S T I N G S
2014 2015
$710$624
40 44
+ 9.1% MORE THAN LAST YEAR
+13.7% MORE THAN LAST YEAR -20.0% LESS THAN LAST YEAR
2015
20142015
SINGLE-FAMILY HOMES
60 48
CONDOS & LOFTS

District 5 resides in the center of the city starting south of Golden Gate Park and extending through Haight Ashbury and 18th/Castro to beyond Noe Valley’s 24th Street. With proximity to desirable coffee shops, restaurants, and nightlife, this district is a mix of condominiums, apartment buildings, single-family homes, and TICs. With good weather, access to shuttles, and a neighborhood vibe, District 5 has been extremely popular with large segments of buyers.
+11.7% MORE THAN LAST YEAR
NOE VALLEYC O L E V A L L E Y
C A S T R OH A I G H T A S H B U R YG L E N P A R K
T W I N P E A K S M I S S I O N D O L O R E S D U B O C E T R I A N G L EB U E N A V I S T A /
A S H B U R Y H E I G H T S
D A Y S O NM A R K E T
25
P R I C E P E RS Q . F T .
S O L DL I S T I N G S
300
2014
325
2015
$980
2524
-3.2% LESS THAN LAST YEAR
+14.1% MORE THAN LAST YEAR -7.7% LESS THAN LAST YEAR
SUBMARKETBAROMETER
UP & COMING
POTENTIALOPPORTUNITIES
HOTMARKET
HOLDFOR NOW
2014$1.88M
2015$2.10M
M E D I A N S A L E SP R I C E
$1,119
2014 2015
20142015
+7.8% MORE THAN LAST YEAR
2014$1.18M
2015$1.27M
M E D I A N S A L E SP R I C E
D A Y S O NM A R K E T
2014
P R I C E P E RS Q . F T .
S O L DL I S T I N G S
2014 2015
$1,034$921
41 37-8.5% LESS THAN LAST YEAR
+12.2% MORE THAN LAST YEAR +5.4% MORE THAN LAST YEAR
2015
20142015
SINGLE-FAMILY HOMES
369 389
CONDOS & LOFTS

30
District 6 resides in the center of San Francisco, starting at the Civic Center and weaving through iconic areas north of Golden Gate Park. District 6 includes single-family homes, condos, TICs, 2-unit duplexes, and multi-tenant buildings. The area is best characterized by the Painted Ladies, a row of Victorian homes on Alamo Square. NOPA and Hayes Valley have seen increased popularity with boutique shops, coffee bars, and new restaurants openeing, driven by the construction of new condominium developments.
NO CHANGE FROM LAST YEAR
HAYES VALLEY & PANHANDLEL O W E R P A C I F I C H E I G H T S
A N Z A V I S T A
N O R T H P A N H A N D L E
W E S T E R N A D D I T I O N
A L A M O S Q U A R E
D A Y S O NM A R K E T
25
P R I C E P E RS Q . F T .
S O L DL I S T I N G S
Q314 Q315
30
NO CHANGE FROM LAST YEAR
-.5% LESS THAN LAST YEAR -17.8% LESS THAN LAST YEAR
SUBMARKETBAROMETER
UP & COMING
POTENTIALOPPORTUNITIES
HOTMARKET
HOLDFOR NOW
2014$2.25M
M E D I A N S A L E SP R I C E
$921 $91645 37
2015$2.25M
2014 2015
2014 2015
+22.2% MORE THAN LAST YEAR
2014$0.93M
2015$1.13M
M E D I A N S A L E SP R I C E
D A Y S O NM A R K E T
2014
P R I C E P E RS Q . F T .
S O L DL I S T I N G S
2014 2015
$986$864
49 40-18.6% LESS THAN LAST YEAR
+14.1% MORE THAN LAST YEAR -14.8% LESS THAN LAST YEAR
2015
20142015
SINGLE-FAMILY HOMES
256 218
CONDOS & LOFTS

District 7 resides in the northwest quadrant of San Francisco, starting at the Bay and heading south to the crest of Russian Hill. It is often regarded as a heavily residential neighborhood with a mix of desirable single-family homes and multi-tenant buildings with captivating views of the Golden Gate Bridge, Alcatraz, and Marin Headlands. One marquee sale was the CEO of Docusign’s purchase of a Pacific Heights mansion on Broadway for over $2M.
+27.4% MORE THAN LAST YEAR
D A Y S O NM A R K E T
P R I C E P E RS Q . F T .
S O L DL I S T I N G S
87
2014
117
2015
39-11.7% LESS THAN LAST YEAR
+23.4% MORE THAN LAST YEAR -25.6% LESS THAN LAST YEAR
M A R I N AP A C I F I CH E I G H T S
C O W H O L L O W
P R E S I D I OH E I G H T S
2014$3.91M
2015$4.98M
M E D I A N S A L E SP R I C E
35
$1,211$1,493
2014 2015
20142015
SUBMARKETBAROMETER
UP & COMING
POTENTIALOPPORTUNITIES
HOTMARKET
HOLDFOR NOW
+12.3% MORE THAN LAST YEAR
2014$1.33M
2015$1.50M
M E D I A N S A L E SP R I C E
D A Y S O NM A R K E T
2014
P R I C E P E RS Q . F T .
S O L DL I S T I N G S
2014 2015
$1,153$1,002
40 36-8.7% LESS THAN LAST YEAR
+15.0% MORE THAN LAST YEAR -20.6% LESS THAN LAST YEAR
2015
20142015
SINGLE-FAMILY HOMES
282 224
CONDOS & LOFTS

District 8 resides in the northeast quadrant of San Francisco and contains some of the oldest real estate in San Francisco, housing city icons like Coit Tower and the Transamerica building. Here we see a varied degree of housing stock, from earthquake cottages to single-family homes, multi-tenant buildings, condos, stock co-operatives, and large apartment buildings. With more technology companies now in the Financial District, accessibility to downtown will continue to create strong demand for properties in this area.
+2.6% MORE THAN LAST YEAR
D A Y S O NM A R K E T
P R I C E P E RS Q . F T .
S O L DL I S T I N G S
Q314 Q315
+15.3% MORE THAN LAST YEAR
+31.0% MORE THAN LAST YEAR NO CHANGE FROM LAST YEAR
NORTH BEACH & RUSSIAN HILLN O R T H W A T E R F R O N T
T E L E G R A P H H I L L
N O B H I L L
F I N A N C I A L D I S T R I C T
D O W N T O W N / V A N N E S S / C I V I C C E N T E R
T E N D E R L O I N
2014$2.76M
2015$2.83M
M E D I A N S A L E SP R I C E
$1,156$1,514 23 6
5245
23
SUBMARKETBAROMETER
UP & COMING
POTENTIALOPPORTUNITIES
HOTMARKET
HOLDFOR NOW
2014 2015
20142015
+17.7% MORE THAN LAST YEAR
2014$0.88M
2015$1.03M
M E D I A N S A L E SP R I C E
D A Y S O NM A R K E T
2014
P R I C E P E RS Q . F T .
S O L DL I S T I N G S
2014 2015
$1,066$944
49
-6.1% LESS THAN LAST YEAR
+12.9% MORE THAN LAST YEAR -18.4% LESS THAN LAST YEAR
2015
20142015
SINGLE-FAMILY HOMES
434 354
CONDOS & LOFTS
52

District 9 resides in the southeast quadrant of San Francisco, stretching from south of downtown along the Bay down to an area that was previously undeveloped. What was traditionally warehouses and industrial land has developed into some of the city’s most desirable real estate with a mix of luxury high-rises, live/work loft conversions, and mid-rise projects nestled alongside existing Victorian and mixed-use buildings. Further up the hill are some amazing single-family homes. We see the increase of commerce and services, such as UCSF’s Children’s Hospital, as having a positive impact on values in Mission Bay and the Dogpatch.
+14.8% MORE THAN LAST YEAR
D A Y S O NM A R K E T
P R I C E P E RS Q . F T .
S O L DL I S T I N G S
260
2014
233
2015
28-11.1% LESS THAN LAST YEAR
+14.2% MORE THAN LAST YEAR +11.6% LESS THAN LAST YEAR
SUBMARKETBAROMETER
UP & COMING
POTENTIALOPPORTUNITIES
HOTMARKET
HOLDFOR NOW
S O U T H O F M A R K E TS O U T H B E A C HY E R B A B U E N A
M I S S I O N B A YI N N E R M I S S I O NP O T R E R O H I L LC E N T R A L W A T E R F R O N T / D O G P A T C H
B E R N A L H E I G H T S
2014$1.20M
2015$1.38M
M E D I A N S A L E SP R I C E
25
$838$957
+16.2% MORE THAN LAST YEAR
2014$0.93M
2015$1.08M
M E D I A N S A L E SP R I C E
D A Y S O NM A R K E T
2014
P R I C E P E RS Q . F T .
S O L DL I S T I N G S
2014 2015
$1,077$963
47
+4.0% MORE THAN LAST YEAR
+11.8% MORE THAN LAST YEAR -11.7% LESS THAN LAST YEAR
2015
20142015
SINGLE-FAMILY HOMES
1,118 987
CONDOS & LOFTS
45

District 10 resides in the southern most quadrant of San Francisco. It is often regarded as a transitional neighborhood, and offers some of the city’s best weather. A mix of desirable single-family homes, multi-tenant buildings, and new construction offer some amazing views of San Francisco Bay and the Bay Bridge. With the release of the Shipyards in Hunter’s Point, this area is experiencing a dramatic change, with an influx of new construction planned communities well underway.
+14.5% MORE THAN LAST YEAR
D A Y S O NM A R K E T
P R I C E P E RS Q . F T .
S O L DL I S T I N G S
490
2014
521
2015
37 36-2.2% LESS THAN LAST YEAR
+15.0% MORE THAN LAST YEAR -6.0% LESS THAN LAST YEAR
SUBMARKETBAROMETER
UP & COMING
POTENTIALOPPORTUNITIES
HOTMARKET
HOLDFOR NOW
OUTER MISSION & BAYVIEWM I S S I O N T E R R A C EE X C E L S I O R
P O R T O L AS I L V E R T E R R A C E
H U N T E R S P O I N TC A N D L E S T I C K P O I N T
B A Y V I E W H E I G H T SV I S I T A C I O N V A L L E Y
C R O C K E R A M A Z O N
2014$0.69M
2015$0.79M
M E D I A N S A L E SP R I C E
$527 $607
+32.9% MORE THAN LAST YEAR
2014$0.51M
2015$0.68M
M E D I A N S A L E SP R I C E
D A Y S O NM A R K E T
2014
P R I C E P E RS Q . F T .
S O L DL I S T I N G S
2014 2015
$572$438
73
-25.1% LESS THAN LAST YEAR
+30.5% MORE THAN LAST YEAR +1.6% MORE THAN LAST YEAR
2015
20142015
SINGLE-FAMILY HOMES
61 62
CONDOS & LOFTS
97

PREPARED BY
SOURCE: © 2015 SAN FRANCISCO ASSOCIATION OF REALTORS®. ALL DATA SUBJECT TO ERRORS, OMISSIONS OR REVISIONS AND IS NOT WARRANTED. ALL INFORMATION DEEMED RELIABLE BUT IS NOT GUARANTEED. SEARCH ALL SFARMLS LISTINGS AT WWW.SFREALTORS.COM. POWERED BY 10K RESEARCH AND MARKETING.
climbSF.com
SAN F R A N C I S C O
WHAT I LIKE BEST ABOUT
I SS A N F R A N C I S C O
- F R A N K L L O Y D W R I G H T
ABOUT CLIMB REAL ESTATE
Founded in 2010, Climb Real Estate is an innovative full-service residential real estate brokerage that leverages the latest technology to serve clients in emerging, established, and luxury neighborhoods in San Francisco and around the Bay Area.
Climb offers a complete digital experience, including an extensive mobile-friendly website, social media presence, and mobile connection with agents that streamlines the buying and selling processes. Agents also connect face-to-face with clients in their neighborhoods via the Climb Airstream, a uniquely mobile real estate office. We are continuously rethinking the traditional home buying and selling experiences to better serve clients and close sales.
Chris Lim, Mark Choey, and Tiffany Combs founded Climb with a focus on new condo developments in the SOMA/South Beach neighborhood of San Francisco. In just five years, the brokerage has grown to 100 agents working in five offices and throughout the Bay Area. According to the San Francisco Association of Realtors, Climb ranked #7 in the city for residential property sales in 2014, and closed close to $1 billion in sales in 2015, making it among the fastest-growing residential real estate brokerages in San Francisco.