climatology of instantaneous precipitation rates : final report, 15
TRANSCRIPT

AFCRL-72-0430
CLIMATOLOGY OF INSTANTANEOUS PRECIPITATION RATES
Douglas M. A. Jones and Arthur L. Sims
Illinois State Water Survey at the
University of Illinois Urbana, Illinois 61801
Contract No. F19628-69-C-0070
Project No. 8624 Task No. 862401 Work Unit No. 86240101
FINAL REPORT
Period Covered: 15 November 1968 through 14 November 1971
December 1971
Contract Monitor: Allen E. Cole Aeronomy Laboratory
Approved for public release; distribution unlimited.
Prepared For
AIR FORCE CAMBRIDGE RESEARCH LABORATORIES OFFICE OF AEROSPACE RESEARCH UNITED STATES AIR FORCE
BEDFORD, MASSACHUSETTS 01730

Approved for public release; distribution unlimited.

AFCRL-72-0430
CLIMATOLOGY OF INSTANTANEOUS PRECIPITATION RATES
Douglas M. A. Jones and Arthur L. Sims
Illinois State Water Survey at the
University of Illinois Urbana, Illinois 61801
Contract No. F19628-69-C-0070
Project No. 8624 Task No. 862401 Work Unit No. 86240101
FINAL REPORT
Period Covered: 15 November 1968 through 14 November 1971
December 1971
Contract Monitor: Allen E. Cole Aeronomy Laboratory
Approved for public release; distribution unlimited.
Prepared For
AIR FORCE CAMBRIDGE RESEARCH LABORATORIES OFFICE OF AEROSPACE RESEARCH UNITED STATES AIR FORCE
BEDFORD, MASSACHUSETTS 01730

ABSTRACT
Nearly instantaneous precipitation rates have been measured in several locations to develop point frequencies of occurrence of 1-minute rates. These are tabulated by months for about one year of data from locations in Florida, North Carolina, New Jersey, Alaska, and the Marshall Islands. Four-minute rain rates are tabulated for a very limited sample of data from Bogor, Indonesia.
Similar data for shorter periods of time have been derived for Flagstaff, Arizona, and Fort Sherman, Canal Zone. A four-year average table of frequencies has been derived for the summer months at a location near Tombstone, Arizona. Tables of 4-minute rates are included for three locations in Vietnam.
Two-minute average frequencies along lines of raingages have been tabulated for England and central Florida.
i

CONTENTS
Page
INTRODUCTION 1 DATA AND INSTRUMENTATION 1 GENERAL ANALYSIS PROCEDURES 2 FURTHER DISCUSSION OF DATA AND ANALYSES BY LOCATIONS 3
Miami, Florida 3 Majuro Atoll, Marshall Islands 4 Wood Island, Alaska 4 Franklin, North Carolina 5 Island Beach, New Jersey 6 Bogor, Indonesia 6 Flagstaff, Arizona 7 Panama Canal Zone 7 Vietnam 8 Walnut Gulch, Arizona 9 Florida Thunderstorm Project Data 10 British Network Data 12
SUMMARY AND CONCLUSIONS 15 ACKNOWLEDGMENTS 18 REFERENCES 18 APPENDIX 21
ii

TABLES
Page
1. Frequencies of 1-Minute Precipitation Rates Measured at Miami, Florida from August 1957 to August 1958 23
2. Frequencies of 1-Minute Precipitation Rates Measured at Majuro Atoll from April 1959 to April 1960 24
3. Frequencies of 1-Minute Precipitation Rates Measured at Woody Island, Alaska from October 1959 to August 1960 25
4. Frequencies of. 1-Minute Precipitation Rates Measured near Franklin, North Carolina from December 1960 to April 1962 26
5. Frequencies of 1-Minute Precipitation Rates Measured at Island Beach, New Jersey from May 1961 to May 1962 27
6. Frequencies of 4-Minute Precipitation Rates Measured at Bogor, Indonesia from October 1959 to April 1961 28
7. Frequencies of 1-Minute Precipitation Rates Measured at Flagstaff, Arizona from July 20, 1967 to August 21, 1967 29
8. Frequencies of 1-Minute Precipitation Rates Measured in the Canal Zone (Atlantic Side) from June 1968 to November 1968 29
9. Frequencies of 4-Minute Precipitation Rates Measured at Saigon, Vietnam from January 1964 to December 1964 30
10. Frequencies of 4-Minute Precipitation Rates Measured at Danang, Vietnam from January 1963 to February 1964 31
11. Frequencies of 4-Minute Precipitation Rates Measured at Pleiku, Vietnam during the years 1963 and 1965 32
12. Frequencies of 1-Minute Precipitation Rates Measured at Walnut Gulch, Arizona during July through October in the years 1960 through 1963 33
13. Frequencies of 2-Minute Precipitation Rates Measured on Gage-Line 34-52 in the Florida Thunderstorm Project from May 19, 1946 to September 20, 1946 34
14. Frequencies of 2-Minute Precipitation Rates Measured on Gage-Line 2-40 in the Florida Thunderstorm Project from May 19, 1946 to September 20, 1946 35
iii

Page
15. Frequencies of 2-Minute Precipitation Rates Measured on Gage-Line 23-42 in the Florida Thunderstorm Project from May 19, 1946 to September 20, 1946 36
16. Frequencies of 1-Minute Precipitation Rates Measured by Gage #32 in the Florida Thunderstorm Project from May 19, 1946 to September 20, 1946 37
17. Frequencies of 2-Minute Precipitation Rates Measured by Gage #32 in the Florida Thunderstorm Project from May 19, 1946 to September 20, 1946 38
18. Frequencies of 2-Minute Precipitation Rates Measured on Gage-Line I in the Cardington Network During the Years 1957 through 1962 39
19. Frequencies of 2-Minute Precipitation Rates Measured on Gage-Line II in the Cardington Network During the Years 1957 through 1962 40
20. Frequencies of 2-Minute Precipitation Rates Measured by Gage #C2 in the Cardington Network During the Years 1957 through 1962 41
21. Frequencies of 2-Minute Precipitation Rates Measured on Gage-Line I in the Winchcombe Network During the Years 1962 through 1967 42
22. Frequencies of 2-Minute Precipitation Rates Measured on Gage-Line II in the Winchcombe Network During the Years 1962 through 1967 43
23. Frequencies of 2-Minute Precipitation Rates Measured by Gage #10 in the Winchcombe Network During the Years 1962 through 1967 44
iv

INTRODUCTION
The purpose of this research project has been to define the frequencies of occurrence of instantaneous rainfall rates for a wide variety of rain climates of the world. This was to be done for both point locations and for average rates along lines.
Such data are useful when selecting microwave frequencies and power levels for radars, ground and satellite communication systems, etc. These data are also important in the design of super-sonic vehicles, since the rate of erosion of the vehicles by precipitation particles is related directly to rainfall rates.
Knowledge of the amount of precipitation that fell in a 6-hour period tells little about how rainfall rates were distributed within that period. High rates lasting for short times are lost in the relatively long period rainfall amounts, and these can only be detected in short periods (minutes).
Early in this study it was determined that a one-minute interval was about as short a period for which a rainfall rate could be obtained from raingages with a reasonable degree of confidence. Such a 1-minute rate could only be ascertained from the best records available. Therefore, 1-minute rates have been calculated for locales where data existed, and these are defined to be "instantaneous" rates. There are some indications that if rates could be accurately determined for periods of less than one minute, the frequencies of these rates would not be significantly different than the frequencies of the l-minute rates.
DATA AND INSTRUMENTATION
At the start of the contract period, the data known to be available and suitable for calculating 1-minute rates were about one year of raingage data from each of six of the locations where the gages had been operated in conjunction with raindrop-size studies sponsored by the U. S. Army, (Stout, et al., 1968). These locations are Miami, Florida; Bogor, Indonesia; Majuro Atoll, Marshall Islands; Woody Island, Alaska (near Kodiak); Franklin, North Carolina; and Island Beach, New Jersey. Similar data for shorter periods of operation were available for Flagstaff, Arizona, and for Fort Sherman, Canal Zone; these data were also obtained under sponsorship of the U. S. Army.
The same type of recording raingage was used at all the locations mentioned above. This type of weighing-bucket precipitation gage has been used by the National Weather Service since 1945. It is a Fergusson type gage, manufactured by Bendix-Friez as its Model No. 775-B. As used in the collection of these data, this gage was equipped with a 12.648-in diameter receiver which drained through a 5/16-in diameter hole into the bucket. Recording was on an 11.5-in chart on

-2-
a clock clinder geared to rotate once each 6 hours. Precipitation was recorded on a vertical scale from 0 to 2.40 in with a single upward traverse of the chart, at which point reversal occurred and another 2.40 in of precipitation was recorded with a downward traverse. On the charts from this gage, 1 minute is equivalent to 0.8 mm of chart travel, and 2.5 mm of chart . height is equivalent to 1.0 mm of precipitation.
Other rainfall data have been obtained during the period of the contract and these data have been recorded on a variety of gages. These data are from three stations in South Vietnam; two networks of gages in England; selected gages in the Walnut Gulch Network operated by the Agricultural Research Service near Tombstone, Arizona; and the raingage records from the Florida portion of the Thunderstorm Project operated in the summer of 1946, (Byers and Braham, 1949). Further discussion of the instrumentation at these locations will be found in a later section of this report.
GENERAL ANALYSIS PROCEDURES
Although variations in the analytical procedure have been necessary because of the differing forms of the original data, basically similar procedures have been used for much of the data. For all the locations involved with the Army sponsored work, the original raingage charts were used. For other locations, microfilm or reproduced copies of the original charts were used. For the British data, already tabulated 2-minute accumulations were used. Cumulative frequency distributions of precipitation rates have been prepared for each location. These are Tables 1 through 23 in the Appendix.
For most of the data, the first step in the analysis was to digitize the records. Where original charts were used, and for some locations where data were obtained from reproduced copies, this digitization was done on an Auto-trol model 3200 digitizer. This equipment measures the chart trace to the nearest 1-thousandths of an inch on both X and Y axes. The coordinates of each measured point are punched semi-automatically into punch cards.
Another digitizer, the OSCAR Model F, was used for all records on . microfilm, since it has a projector that permits measurement from an enlarged projected image. The scaling on this equipment is variable, and was adjusted to permit the highest accuracy permitted by the size of the projected image. Although the precision of the measurements for this equipment is generally a slight bit less than from the Auto-trol, it is believed to be quite sufficient.
The digitized data on punch cards were then processed by computer. Various routine corrections were made for the tilt of the chart on the digitizer and to rectify the curvilinear scales of some of the charts. Then rates were calculated from the corrected measured points. Linear interpolation was made between the measured points. Precipitation rates were generally calculated for each 1-minute interval during precipitation periods. The Vietnamese data were judged suitable for no shorter than 4-minute intervals and, as previously indicated, the British data were supplied to us as 2-minute digitized accumulations.
-3-
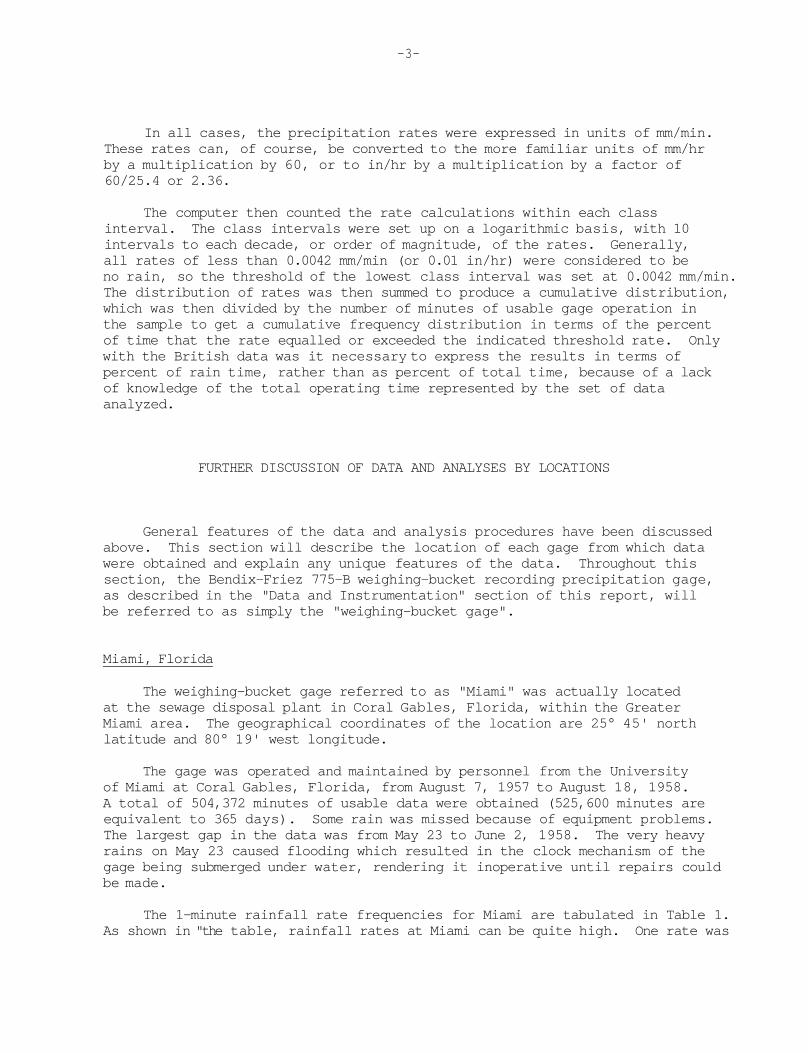
In all cases, the precipitation rates were expressed in units of mm/min. These rates can, of course, be converted to the more familiar units of mm/hr by a multiplication by 60, or to in/hr by a multiplication by a factor of 60/25.4 or 2.36.
The computer then counted the rate calculations within each class interval. The class intervals were set up on a logarithmic basis, with 10 intervals to each decade, or order of magnitude, of the rates. Generally, all rates of less than 0.0042 mm/min (or 0.01 in/hr) were considered to be no rain, so the threshold of the lowest class interval was set at 0.0042 mm/min. The distribution of rates was then summed to produce a cumulative distribution, which was then divided by the number of minutes of usable gage operation in the sample to get a cumulative frequency distribution in terms of the percent of time that the rate equalled or exceeded the indicated threshold rate. Only with the British data was it necessary to express the results in terms of percent of rain time, rather than as percent of total time, because of a lack of knowledge of the total operating time represented by the set of data analyzed.
FURTHER DISCUSSION OF DATA AND ANALYSES BY LOCATIONS
General features of the data and analysis procedures have been discussed above. This section will describe the location of each gage from which data were obtained and explain any unique features of the data. Throughout this section, the Bendix-Friez 775-B weighing-bucket recording precipitation gage, as described in the "Data and Instrumentation" section of this report, will be referred to as simply the "weighing-bucket gage".
Miami, Florida
The weighing-bucket gage referred to as "Miami" was actually located at the sewage disposal plant in Coral Gables, Florida, within the Greater Miami area. The geographical coordinates of the location are 25° 45' north latitude and 80° 19' west longitude.
The gage was operated and maintained by personnel from the University of Miami at Coral Gables, Florida, from August 7, 1957 to August 18, 1958. A total of 504,372 minutes of usable data were obtained (525,600 minutes are equivalent to 365 days). Some rain was missed because of equipment problems. The largest gap in the data was from May 23 to June 2, 1958. The very heavy rains on May 23 caused flooding which resulted in the clock mechanism of the gage being submerged under water, rendering it inoperative until repairs could be made.
The 1-minute rainfall rate frequencies for Miami are tabulated in Table 1. As shown in "the table, rainfall rates at Miami can be quite high. One rate was

-4-
found to be in excess of 3.98 mm/min (9.39 in/hr). The only other locations studied having rates as high are the tropical locations of the Canal Zone and Bogor, Indonesia. The percent of time that the rate exceeds 0.0042 mm/min is relatively low at only 2.57 percent for the annual frequency table.
Majuro Atoll, Marshall Islands
A weighing-bucket gage was installed and operated on the Majuro Atoll of the Marshall Islands during the period of April 15, 1959 to April 30, 1960. The gage was located at the U. S. Weather Bureau station at the city of Majuro which is located on the southeastern end of the Majuro Atoll. This atoll is a ring of islands surrounding a lagoon about 35 km long and about 6.4 km wide. Dalap Island, on which the gage was located, is oriented roughly east-west. The gage was installed at an elevation of 10 feet above sea level, at 7° 05' north latitude and 171° 23' east longitude.
The gage was operated by U. S. Weather Bureau personnel. A total of 462,227 minutes of usable data were recorded out of a possible 548,435 minutes. The missing data was mostly due to failures of the clock. These outages appeared to be random, and not likely to seriously influence the rate frequencies derived (Table 2). The data for January through March are from the year 1960. May through December are from 1959, and April is a combination of data from the two years.
The highest rates that occurred during the year of operations at Majuro were above 3.16 mm/min; however, such rates occurred only 0.00065 percent of the time. Rates exceeding 0.0042 mm/min occurred 5.53 percent of the time on an annual basis. This is more than twice the similar frequency of Miami.
Woody Island, Alaska
Woody Island is a small island, located 3 miles east of the city of Kodiak, in the Chiniak Bay of the Gulf of Alaska. The gage was located on the east coast of the island, at the top of a 50 foot cliff. The geographical coordinates of the location are 57° 47' north latitude and 150° 20' west longitude.
The gage at Woody Island was operated by personnel of the Federal Aviation Administration navigational facility on the island. The gage was operated from October 18, 1959 to August 15, 1960. During this period, the largest periods of missing data were slightly more than one day in October and a little less than a day in July. Of course, as indicated by the operation dates above, no data were obtained for the month of September.
Since this gage was located on the southern edge of Alaska, more of the precipitation was in liquid form than might be expected at a location so far north. Even so, the records of the winter months included some snow and

-5-
freezing rain. In many cases, this frozen and freezing precipitation collected in the upper portions of the gage and was recorded only as it was melted by warmer temperatures, or sometimes by warmth and by rain. In these cases, the rates calculated are ficticious. Since all the 64 mm of precipitation in March were involved in such problems, no frequency table has been presented for this month. Other winter months are likely to have some reduction in reliability due to these problems.
In examining the frequencies of 1-minute rates (Table 3), the most remarkable characteristic is the very large percentage of rain time above 0.0042 mm/min. The "all data" percentage is 12.1 percent, and for November it is almost 20 percent of the time. The maximum rates are low; the highest observed being less than 0.63 mm/min. In general, this location has long hours of light precipitation.
Franklin, North Carolina
The actual location of this weighing-bucket gage was 11 miles south-southwest of Franklin, North Carolina, within the grounds of the Coweeta Hydrologic Laboratory of the U. S. Forest Service, on the eastern slopes of the Appalachian Mountains. The gage was at an elevation of 4460 feet above mean sea level, at a saddle formation known as Mooney Gap. The land slopes upward from this site to nearby peaks of about 5000 feet on the southeast, west, and northwest. More specifically, the gage site was at 35° 1' 55" north latitude and 83° 28' 2" west longitude.
The weighing-bucket gage at this site was the same as the others previously described except that it was surrounded by a "Shasta III" windshield to reduce the effects of wind on the collection efficiency (Warnick, 1956).
The gage was serviced by personnel of the Coweeta Laboratory from the beginning of December 1960 through April 3, 1962. This site was chosen because of its high total annual rainfall. Coweeta Laboratory, gage No. 8 recorded a 23-year annual mean rainfall of 2358.9 mm (92.9 inches). During the 16 months of operation at Mooney Gap, 3106.6 mm were recorded. After adjusting for missing data and normalizing to an annual basis, this becomes 2535.4 mm, 176.5 mm more than the 23-year normal. Several months had greater than normal precipitation, but September and October rainfalls were much below normal.
The period of operation included a total of 703,390 minutes. Of this time, 643,440 minutes were successfully recorded. Most of the non-operational time occurred in the winter months of December, January, and February. Much of the precipitation during these months was snow. Where the trace was noted to be due to melting snow, such data were discarded, and a suitable adjustment was made to the operation time. Also, since the site was remote from the laboratory headquarters, it was sometimes difficult to visit the gage during adverse winter weather'. This resulted in some lost data due to clock stoppage. Overall, the winter data must be considered of much poorer quality than the data from other seasons.

-6-
The 1-minute rate frequencies for Franklin, North Carolina, are in Table 4. Note that the operational period covers December through March for two years, and the frequency tables for these months are the mean of the two years.
The annual frequency (which includes all the data for 16 months) shows a relatively high frequency of precipitation of 7.22 percent. The maximum rate is not excessive. The high annual total precipitation results more from high frequencies of precipitation, rather than from very high rates.
Island Beach, New Jersey
The weighing-bucket gage at Island Beach State Park was also equipped with a Shasta III windshield, as was the gage in North Carolina. This gage was located on the Atlantic beach within the park which is on a narrow peninsula between the Atlantic Ocean and the Barnegat Bay, about 63 miles south of New York City, at 39° 52' north latitude and 74° 5' west longitude.
The gage was installed in the fall of 1960 but good continuous data was not obtained until May 24, 1961. This gage was serviced from this time through May 24, 1962 by a local school teacher hired for this work by the Water Survey. During the year of operation, the only missed operations were in May and June, where in each month a small amount of data was lost due to gage malfunctions. During the winter months, some snow is included in the data. Snow was not as much of a problem here as it was in Alaska and North Carolina.
The frequencies of 1-minute rates for Island Beach are to be found in Table 5. This table shows, not surprisingly, that the highest rates occurred during the summer months but the highest percentages of rain time greater than 0.0042 mm/min are in the winter.
Bogor, Indonesia
A weighing-bucket gage was installed at the University of Indonesia in Bogor from October 31, 1959 to April 11, 1961. Bogor is located on the Island of Java, about 48 km south of Djakarta, at 6° 30' south latitude and 106° 48' east longitude. A plain slopes gently upward from the Java Sea at Djakarta to Bogor, which is at an elevation of about 260 m, but mountain peaks of 2 to 3 km are only 16 km south of Bogor.
Several difficulties encountered in the operation at Bogor result in this data being the poorest and most unreliable of all the data presented in this report. The gage was operated by the staff and students of the Department of Climatology of the University of Indonesia. These people were not at all familiar with the operation of the weighing-bucket gage sent to them. They had only our written instructions, which were not always understood sufficiently well. When the gage malfunctioned, it was always slow to be repaired.

-7-
At least in the early months of the operations, a chart was put on the gage only when rain was expected. Thus, much of the time with no rain was not documented, and almost certainly, rain was missed due to the gage not being ready. The total operation time of this gage is much less than the real time elapsed, and there are strong suspicions that this non-operation time is somewhat biased as to the part of it during which no rain fell.
During some of the periods of equipment failure, we were supplied with copies of records from a Hillman gage operated nearby. This float-type gage recorded on a 24-hour chart, suitable for calculating rates for intervals no shorter then four minutes. These rates are combined with the weighing-bucket gage rates in the table of 4—minute rate frequencies in Table 6. It can be seen that the operation times are much less than they should be (43200 minutes in a 30 day month, or 44640 for a 31 day month). Overall, only about 23 percent of possible time was operational, even with the addition of the Hillman gage data.
The data from Bogor are valid as an indication that certain rates did occur there, but do not show with any confidence the percent of time that these rates occurred. This table, Table 6, should be used with extreme caution, if at all, in any further analyses.
Flagstaff, Arizona
A small network of recording and non-recording raingages was operated during the summer rain months of 1967 in the Fort Valley Experimental Forest. This location is at an elevation of about 2.2 km, about 11 km northwest of Flagstaff, Arizona. The San Francisco Peaks nearby are responsible for considerable thunderstorm activity in the summer. Unfortunately, the recording precipitation gages for this project arrived late from the manufacturer, and were not installed until July 20, after the rainy period had already begun. Only the period from July 20 to August 21 was recorded by the recording gages.
The weighing-bucket gages used at Flagstaff were of the newer Fergusson pattern, Model 5-780, manufactured by the Belfort Instrument Company. Five of these gages, which are identical in operation to the previously described weighing-buckets gage, were installed with one at Fort Valley and four others each 3/4 mile north, east, south, and west of Fort Valley. This network was near 35° 14' north latitude and 111° 45' west longitude.
Table 7 shows the frequencies of rates for this 1-month sample at Fort Valley. In the same table is an average frequency distribution for all five gages of the network. There are only very slight differences between these tables; the 5-gage average may be worthy of greater confidence, since it contains five times as much data, which would reduce the effects of local variability in the rainfall.
Panama Canal Zone
Weighing-bucket gages were operated during the summer and fall of 1968 at Fort Sherman, Canal Zone, in association with the operation of a raindrop

-8-
camera as a part of a series of tests conducted by the Frankford Arsenal, U. S. Army. The first location was at the Pina artillery range from June 24 until July 19. This location is at an elevation of about 100 feet near the west shore of Gatun lake at 9° 14' north latitude and 79° 57' west longitude. A gage was operated at a location known as Battery Mackenzie from July 26 until October 3. This location is very near the Caribbean Sea at 9° 21' north latitude and 79° 59' west longitude. From November 1 to November 21, a gage was operated in a jungle clearing near the Chagres River about 2.4 km from the Caribbean. This clearing was part of a temporary artillery range known to the personnel involved with the tests there as the Chagres Range. This gage location was very near 9° 19' north latitude and 79° 59.5' west longitude. All three locations are quite near each other within that portion of the Canal Zone that lies between Gatun Lake and the Caribbean Sea and southwest of Limon Bay and the Panama Canal.
The periods during which these gages were in operation include much of the rainy half of the year in that region. The half-year from December to June is quite dry on the Caribbean side of the Isthmuth of Panama. The average total rainfall at Colon, Panama (Nelson, 1968) is 95.1 inches for June through November and only 34.7 inches for December through May. The total for January through April is only 10.5 inches.
The tables of frequencies of rainfall rates are in Table 8. The portion of this table headed "All data" is the average of the data from the three locations. It is probably the best estimate of frequencies for the wet half of the year. Frequencies for the dry portion of the year would be much smaller.
Vietnam
Microfilms of raingage charts from three locations in South Vietnam were provided by the U. S. Air Force. It appears from the charts that the gages used were of a float-type siphoning gage. The chart's rotation was once per 24 hours.
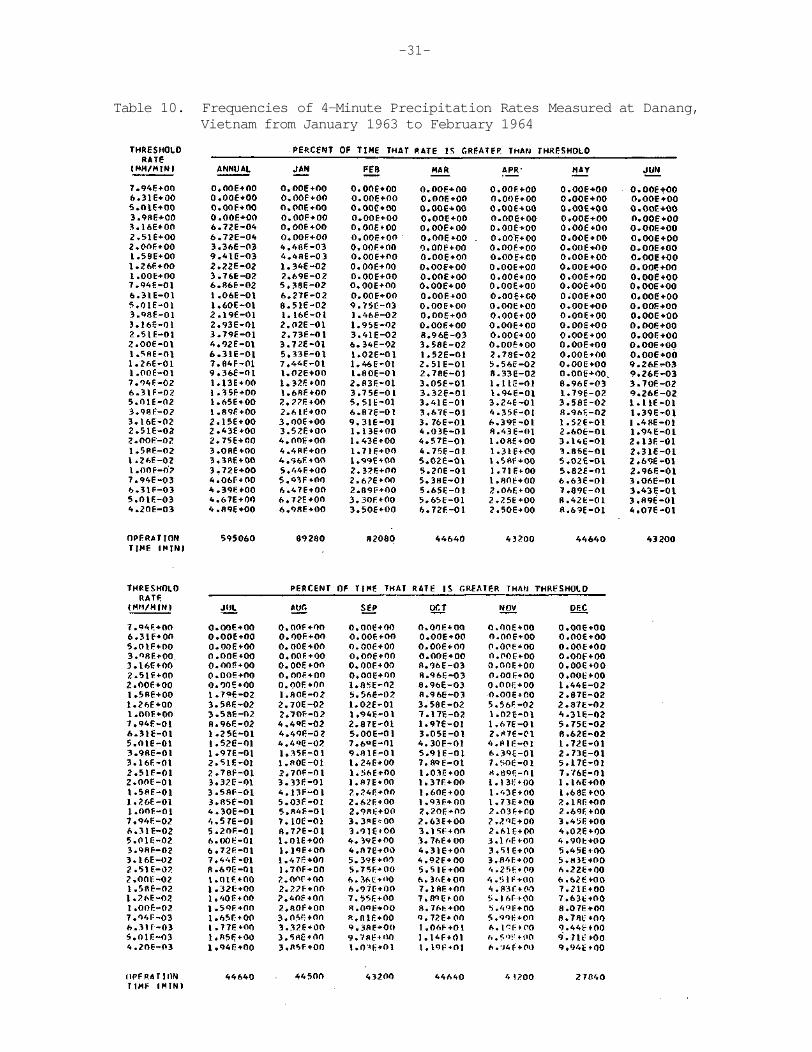
The record available from Tan Son Nhut Airport near Saigon was from January 1964 through December 1964 with no apparent missing data. The record available from Danang was from January 1963 through February 1964; however, six days were missing in December, 1963. Data was obtained for Pleiku for all of 1963 except November and for the year 1965 except that January, June, July, September, and November are missing. For November, 1963 the raingage charts were missing; however, a summary sheet was available which showed that the total rain for the month was only 10.6 mm and the total rain time was only 2.9 hours, or 0.4 percent of the month.
In the analysis of these data to derive the frequencies of rates in Tables 9, 10, and 11, the rate interval was restricted to four minutes because of the 24-hour period of rotation of the charts. The data was digitized on the Auto-trol from prints made from the microfilm. For locations where more than one year of data was available for any month, both years were used. Such

-9-
cases can be identified in the tables as those showing more than the usual 43200 or 44640 minutes of operation time. The "annual" column is actually a calculation for all the data available, somewhat more than one year for Pleiku and Danang. In the annual table for Pleiku, November has been considered as having no rain, but a complete record. Since evidence exists that shows this month to have rain only for 0.4 percent of the time, less error is made in the annual table this way than if the month had been considered missing.
All the three gages from Vietnam show a very definite seasonal trend, as would be expected with the monsoons of that region. Both Saigon and Pleiku have a dry season from December through April, while Danang is dry from March to July. The percentage of rain occurrence is greatest for any one month at Pleiku, where it rained at rates greater than 0.0042 mm/min for 17.2 percent of the time in September. The same station recorded no rain in January. The maximum rates might have been greater if 1-minute rates could have been measured. It has been noticed that the Saigon annual 4-minute frequency distribution is almost identical to a 4-minute frequency from the Miami, Florida data. The seasonal variations are very different, however.
Walnut Gulch, Arizona
The Walnut Gulch experimental watershed is located near Tombstone, in the southeastern corner of Arizona. It is operated by the Agricultural Research Service of the U. S. Department of Agriculture (Kincaid, et al., 1966). This network of gages is in a semiarid region which has its peak rainfall in the summer. The climatological records from Tucson, about 60 miles northwest of the network (U. S. Weather Bureau, 1969), show a normal annual rainfall of 11.00 inches, with only three months, July, August, and September having more than 1.00 inch per month. The maximum monthly rainfall is 2.88 inches in August, while the largest number of days with rain is in July, with 11 days normally having 0.01 inch or more.
In such an semiarid region, it is of even greater importance than at wetter regions to have a long record of rainfall data. Copies of charts were obtained for the four years of 1960 through 1963. Records for gages 2, 22, 41, and 61 were obtained, since these gages were operated in an open-scale way similar to the other weighing-bucket gages previously described. The gages were operated from sometime in June to October or November of each year. By choosing for each month the gage with the least operational difficulties, it was possible to put together a complete four-year record for the months of July, August, and September. For October, two years were complete, but two of the years each had only a little over a week of operation. The data for June and November were inadequate for a reasonably reliable analysis. It is believed that this use of the four gages interchangeably is justified, since all are of the same type and the maximum spacing between gages was less than nine miles.
The frequencies of 1-minute rainfall rates are in Table 12. These are all 4-year averages. The maximum frequency of rain is in July, but this maximum is only 1.23 percent. The highest rate, above 3.16 mm/min, occurs in August.

-10-
This is in agreement with the long term climate at Tucson. Apparently, the relatively high total rainfall in August is caused by a greater frequency of high rates, rather than by a larger total rain time.
Since the Tucson normals show that all the months not tabulated here have less than one inch of rain and not more than four days of measurable rain, the rain-rate frequencies for these months should not be much in excess of those shown here for September.
Florida Thunderstorm Project Data
A network of 55 weighing-bucket gages was operated near Orlando, Florida, during the summer of 1946 as a part of the Thunderstorm Project (Byers and Braham, 1949). The network was approximately rectangular, with the long axis lying east-west (see Figure 1). The center of the network was within the town of St. Cloud, near 28° 15' north latitude and 81° 15' west longitude. The raingage charts from these gages were obtained on microfilm from the National Weather Records Center for the period of operations, May 19, 1946 through September 20, 1946. Since the gages were serviced daily, the records are of generally high quality.
Two lines of gages were chosen from the Florida network for analysis. A line from gage 2 to gage 40, oriented roughly from the northwest to the southeast, contained 14 gages and had a length of 13.35 miles. A shorter north-south line had seven gages and a length of 6.23 miles. Also analyzed was a short line consisting of the six middle gages of the NW-SE line. This. line had a length of 5.94 miles, making it comparable in length to the N-S line.
For each of these three lines, 2-minute rates were used to derive "line-average" rates. Although the gages were of the same type from which we have generally calculated 1-minute rates, timing inaccuracies between gages in a line necessitate the use of a longer rate period for line averages. In calculating these line averages, the rate at any gage was considered to remain constant over half of the distance to the adjacent gages on either side, except that for the end gages, the length assigned extended only to the end gage. When a gage had a missing record, its length was divided between its adjacent gages. When two or more adjacent gages were missing, the rate was discarded and the operation time reduced accordingly. Since rain often occurs over only a portion of the lines, the average rates are significant to lower rates than the 0.0042 mm/min used as a cut-off value for most of the single gage analyses. The frequencies for the short north-south line (gages 34 to 52) are in Table 13. Similarly, Table 14 contains the frequencies of average rates for the long northwest-southeast line (gages 2 to 40) and Table 15 the short northwest-southeast line (gages 23 to 42). Single gage frequencies have been calculated for gage 32 near the center of the network. Frequencies of 1-minute rates are in Table 16, and 2-minute frequencies are in Table 17.
These tables show that similar length lines have similar rate frequencies, regardless of the line's direction. This is likely due to the generally air mass type of showers in Florida during the summer. It is expected that in more

-11-
Figure 1. Florida Thunderstorm Project raingage network.

-12-
northern areas, where many lines of showers occur parallel to a front, a line of gages in the same orientation as the average position of cold fronts would have a higher occurrence of high average rates than would a line of gages perpendicular to the mean frontal orientation.
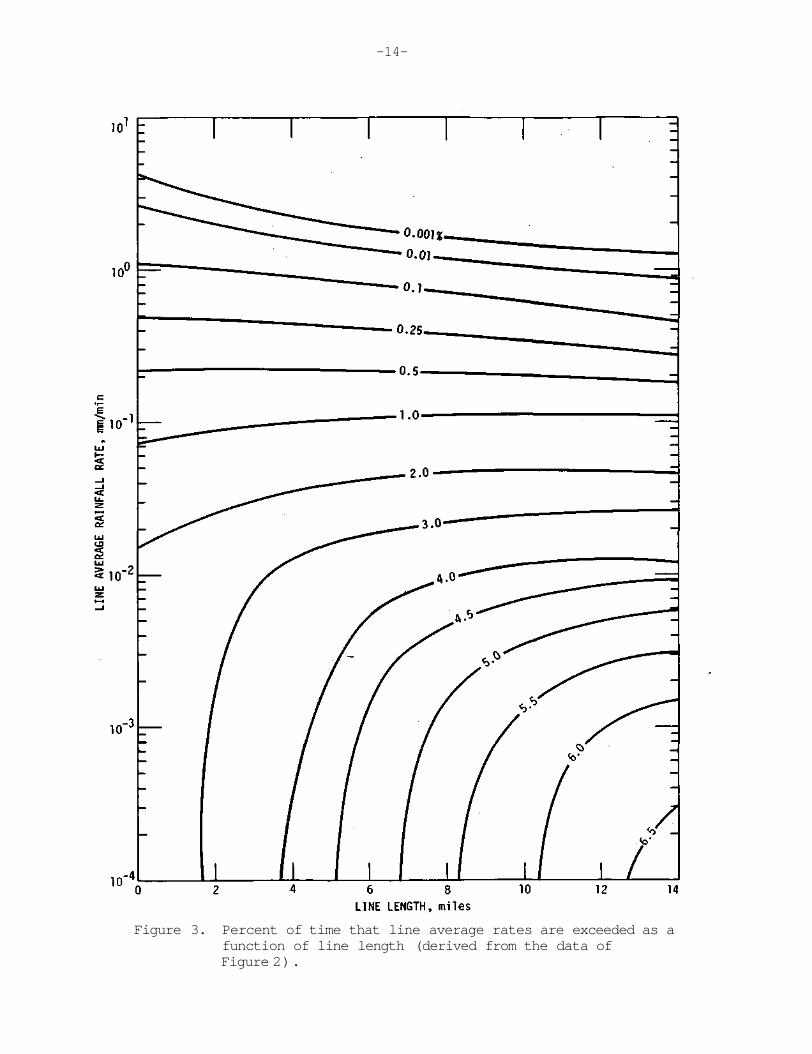
On Figure 2 are plotted the 2-minute rate frequencies for the single gage, the short (5.94 mile) portion of the northwest-southeast line, and the long (13.35 miles) line. The general effects of the length of the lines can be seen. The very high rates are seen to occur most often at a single gage. Since the high rates are likely to be of small area, linear arrays are likely to. include large areas of low or zero rain rates, thus reducing the line average. At low rates, the frequency of occurrence is greater for the lines. This same information is presented in another form in Figure 3. This family of curves has been interpolated from the data of Figure 2. It is more convenient for finding the percent of time that an average rate is exceeded for any length of line up to 13 miles. Of course, these curves only apply strictly to central Florida; however, similar changes with line length can be expected in other locations.
British Network Data
Tabulated 2-minute accumulations of rainfall have been obtained from two networks in England, one near Cardington and the other near Winchcombe. The instrument used was the Dines Tilting-Siphon Rain Recorder, fitted with an open-scale strip chart mechanism in place of the standard daily drum. This mechanism was electrically driven by an a-c motor at Cardington and by a crystal controlled battery driven motor at Winchcombe. Both of these motors drive the chart at the speed of 5 1/2 in/hr. The gage is fitted with an 11.31 in diameter collector, and 10 mm of chart indication is produced for 1 mm of rain.
These networks were operated by the British Meteorological Office. Operation of these gages was not possible during most of the winter months. The Cardington data are from the years 1957 through 1962, but for each year the starting and ending dates are variable, so that there is generally six years of data for the mid-summer months, but less for the months in early spring or in the fall. Similar shortages occur in the data from near Winchcombe, taken in the years 1962 through 1967.
Both of these data sets are also limited by the fact that data were included only when some gage within the network measured at least 0.5 mm in a 2-minute interval. Because of this problem, the data in Tables 18 through 23 have been presented as percentages of rain time rather than the usual percentage of total time, where the rain time is defined to be the time that any gage in the line had 0.5 mm or more rain in 2 minutes. Since the data tabulations, as received, were quantized to the nearest 0.01 mm per 2-minute interval, the rates in mm/min are quantized to the nearest 0.005 mm. This results in some empty class intervals at the low rate end of the cumulative frequency distributions for single gages.

-13-
Figure 2. Cumulative frequency distributions of rainfall rates for a single gage, a 5.94 mile line (line 23-42), and a 13.35 mile line (line 2-40) of the Florida Thunderstorm Project network.
-14-
Figure 3. Percent of time that line average rates are exceeded as a function of line length (derived from the data of Figure 2).

-15-
The lines of gages used are shown in Figure 4 for the Cardington network and in Figure 5 for the Winchcombe network. The Cardington lines both use five gages. The northeast-southwest line, line I, is 5.27 km in length and the northwest-southeast line, line II, is 3.87 km. At Winchcombe, the nearly north-south 6-gage line, line I, is 3.98 km long, and the northeast-southwest line of 8 gages, line II, is 6.36 km.
The line averages were calculated as described above for the Florida data. The line frequencies for the Cardington lines are in Tables 18 and 19. A single gage frequency for gage C2 near the intersection of the lines is in Table 20. For Winchcombe, line frequencies are in Tables 21 and 22, and a single gage frequency for gage 10 is in Table 23. The operation times indicated on these tables are times with non-zero rates. Since the frequencies are in percent of operation time with non-zero rates, all the tables show 100 percent at the lowest rate tabulated.
The general features of these line data for months where there are sufficient data are similar to those described for the Florida data.
SUMMARY AND CONCLUSIONS
The principle result of this research is the set of tables of instantaneous (or at least very short-period) precipitation rate frequencies presented in the Appendix. Although most of the tables represent only a year or less of data, this is a more extensive collection of such data than has been known to this time. Some of the tables, particularly those with the shorter operational times, should be used with caution. Nevertheless, these tables should be useful in estimating the probabilities of encountering various precipitation rates in a variety of climatic regions.
Further analysis of these data are being made by personnel of the Air Force Cambridge Research Laboratories. A preliminary report (Lenhard, Cole, and Sissenwine, 1971) described models that relate precipitation rate frequencies to commonly available climatological parameters.
Research is continuing in this area under AFCRL Contract No. F19628-71-C-0052. Some excellent records have been located in France and England, and records suitable for calculation of 4-minute rates are available from Israel and Germany. Three years of record have now been collected at Urbana, Illinois, on an open-scale weighing-bucket gage. These data, and others, will be analyzed and presented in the reports of Contract C-0052.

-16-
Figure 4. Cardington, England raingage network.

-17-
Figure 5. Winchcombe, England raingage network.

-18-
ACKNOWLEDGMENTS
This research has been made possible through the cooperation of many people who have assisted in the collection of the precipitation data over a number of years. Particular credit is due to the U. S. Army for sponsoring projects that resulted in the larger part of the data used. The Electronics Command at Fort Monmouth, New Jersey, sponsored the measurements at most of the raindrop camera locations. The Army's Frankford Arsenal supported the work in the Canal Zone, and the work at Flagstaff, Arizona was supported by the Army Research Office, Durham, North Carolina. Appreciation is also due to the numerous individuals who operated and serviced the gages used in these Army projects.
We also appreciate those who have made possible for us to receive copies of the data from England; Tombstone, Arizona; and the stations in Vietnam.
Appreciation is due to Glenn E. Stout, former Head of the Atmospheric Sciences Section, and to Stanley A. Changnon, Jr., present Head of the Atmospheric Sciences Section, under whose direction this work has been carried out. The personnel of the Survey's Research Support Group including Marvin Clevenger and Ileah Trover have contributed in the digitizing of the many records. Robert Swaringen did much of the early programming for this project. Many student workers have contributed to the analysis of the data. Lalit Kumar has been of considerable assistance, particularly in the preparation of this report. Much of the analysis was done on the IBM 360/75 computer system, at the University of Illinois, which is supported in part by the National Science Foundation.
REFERENCES
Byers, H. R. and R. R. Braham, Jr., 1949: The Thunderstorm. Report of the Thunderstorm Project. U. S. Department of Commerce, 287 pp.
Kincaid, D. R., H. B. Osborn, and J. L. Gardner, 1966: Use of unit-source watersheds for hydrologic investigations in the semiarid southwest. Water Resources Research, v. 2 (3): 381-392.
Lenhard, Robert W., Allen E. Cole, and Norman Sissenwine, 1971: Preliminary models for determining instantaneous precipitation intensities from available climatology. Air Force Cambridge Research Laboratories, Report AFCRL-71-0168, 20 pp.
Nelson, H. L. , 1968: Climatic data for representative stations of the world. University of Nebraska Press, Lincoln, 82 pp.

-19-
Stout, G. E., E. A. Mueller, A. L. Sims, R. Cataneo, and F. A. Huff, 1968: Summary of radar-rainfall research, 1952-1968. Interim Report 3 to U. S. Army, Contract DA-28-043 AMC-02071(E), 47 pp.
U. S. Weather Bureau, 1969: Local climatological data, annual summary for Tucson, Arizona. Washington, D. C.
Warnick, C. C., 1956: Influence of wind on precipitation measurements at high altitudes. Bulletin 10, University of Idaho Engineering Experiment Station, 63 pp.

APPENDIX
Tables

-23-
Table 1. Frequencies of 1-Minute Precipitation Rates Measured at Miami, Florida from August 1957 to August 1958

-24-
Table 2. Frequencies of 1-Minute Precipitation Rates Measured at Majuro Atoll from April 1959 to April 1960

-25-
Table 3. Frequencies of 1-Minute Precipitation Rates Measured at Woody-Island, Alaska from October 1959 to August 1960

-26-
Table 4. Frequencies of 1-Minute Precipitation Rates Measured Near Franklin, North Carolina from December 1960 to April 1962

-27-
Table 5. Frequencies of 1-Minute Precipitation Rates Measured at Island Beach, New Jersey from May 1961 to May 1962

-28-
Table 6. Frequencies of 4-Minute Precipitation Rates Measured at Bogor, Indonesia from October 1959 to April 1961

Table 7. Frequencies of 1-Minute Precipitation Rates Measured at Flagstaff, Arizona from July 20, 1967 to August 21, 1967
Table 8. Frequencies of 1-Minute Precipitation Rates Measured in the Canal Zone (Atlantic Side) from June 1968 to November 1968

-30-
Table 9. Frequencies of 4-Minute Precipitation Rates Measured at Saigon, Vietnam from January 1964 to December 1964
-31-
Table 10. Frequencies of 4—Minute Precipitation Rates Measured at Danang, Vietnam from January 1963 to February 1964

-32-
Table 11. Frequencies of 4-Minute Precipitation Rates Measured at Pleiku, Vietnam during the years 1963 and 1965

Table 12. Frequencies of 1-Minute Precipitation Rates Measured at Walnut Gulch, Arizona during July through October in the years 1960 through 1963

Table 13. Frequencies of 2-Minute Precipitation Rates Measured on the Gage-Line 34-52 in the Florida Thunderstorm Project from May 19 , 1946 to September 20, 1946

-35-
Table 14. Frequencies of 2-Minute Precipitation Rates Measured on Gage-Line 2-40 in the Florida Thunderstorm Project from May 19, 1946 to September 20, 1946

-36-
Table 15. Frequencies of 2-Minute Precipitation Rates Measured on Gage-Line 23-42 in the Florida Thunderstorm Project from May 19, 1946 to September 20, 1946

-37-
Table 16. Frequencies of 1-Minute Precipitation Rates Measured by Gage #32 in the Florida Thunderstorm Project from May 19, 1946 to September 20, 1946

-38-
Table 17. Frequencies of 2-Minute Precipitation Rates Measured by Gage #32 in the Florida Thunderstorm Project from May 19, 1946 to September 20, 1946

Table 18. Frequencies of 2-Minute Precipitation Rates Measured on Gage-Line I in the Cardington Network During the Years 1957 through 1962
NOTE: THE ABOVE FREQUENCIES ARE IN X OF OPERATION TIME WITH NON-ZERO RATESt NOT % OF TOTAL T I M E . THE INDICATED 'OPERATION T I M E ' IS TIME WITH NON-ZERO RATES.

Table 19. Frequencies of 2-Minute Precipitation Rates Measured on Gage-Line II in the Cardington Network During the Years 1957 through 1962
NOTE: THE ABOVE FREQUENCIES ARE IN % OF OPERATION TIME WITH NON-ZERO RATES. NOT % OF TOTAL TIME. THE INDICATED 'OPERATION TIME' IS TIME WITH NON-ZERO RATES.

Table 20. Frequencies of 2-Minute Precipitation Rates Measured by Gage #C2 in the Cardington Network During the Years 1957 through 1962

Table 21. Frequencies of 2-Minute Precipitation Rates Measured on Gage-Line I in the Winchcombe Network During the Years 1962 through 1967
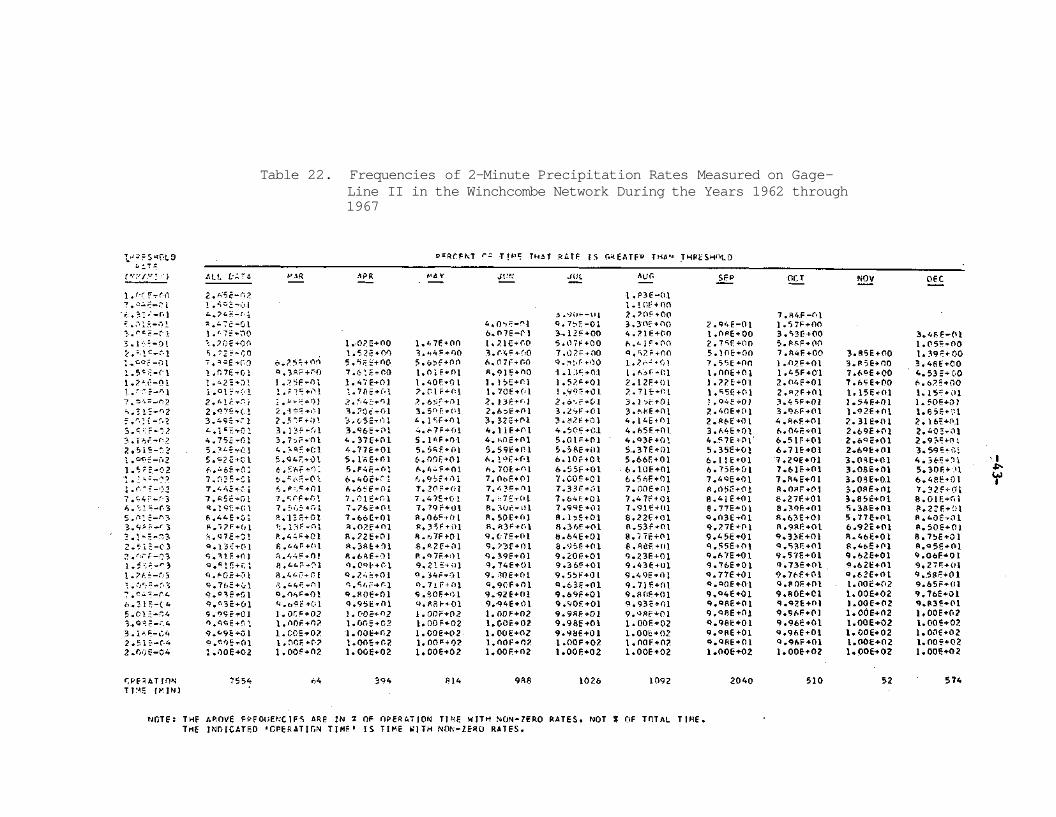
Table 22. Frequencies of 2-Minute Precipitation Rates Measured on Gage-Line II in the Winchcombe Network During the Years 1962 through 1967

Table 23. Frequencies of 2-Minute Precipitation Rates Measured by Gage #10 in the Winchcombe Network During the Years 1962 through 1967

