climatic variability in humid africa along the gulf of ... · climatic variability in humid africa...
TRANSCRIPT

ELSEVIER Journal of Hydrology 191 (1997) l-15
Journal
&rology
Climatic variability in humid Africa along the Gulf of Guinea Part I: detailed analysis of the phenomenon in C&e d’Ivoire
E. SeTVat”*, J.E. Patnrela, H. Lub&sb, B. Kouatm?, M. Ouedraogoa, J.M. MaasonC
‘ORSTOM, Pmgmmme FRIEND AOC, 06 BP 1203, Cidex I, Abiajan, Ivory Coast bOR.57OM, Progmmme F&END AOC, BP 5045, 34032 Montpellier C&x I, Fmnce
‘Labomtoire GLopuidedassins-Enu, URA-CNRS 1765, Universiti Montpzllier II, Place EugPne Batdon, 34095 Montpllier Cedex, France
Raxived 3 January 1996; revised 29 February 1996; mxqted 9 March 1996
The analysis presented here deals with ammal precipitation as well as the number of rainy days observed in C&e d’Ivoire during the decades from 1950 to 1980. The study is based on a set of methods both for interpolation and for cartographic representation as well as on statistical methods for the detection of breaks in the time series. The methods reveal a climatic variability in the country as a whole at the end of the 60s and at the beginning of the 70s. Indeed, the results show that there was a sharp decrease both in rainfall amounts and in the number of rainy days during the 60s and the 70s. C&e d’Ivoire, which belongs to humid Africa, was therefore affected by a climatic accident comparable to and in line with what was observed further north in the Sahelian region.
1. Introduction
The drought observed for some 20 years now in West and Central Africa often had tragic consequences in the countries of the Sahel, which explains and justifies the constant interest shown in those regions (Sircoulon, 1987; Hubert and Carbonnel, 1987; Hubert et al., 1989; Demsrke, 1990). However, more southwards and in regions with a more humid climate, it would seem that drought is also felt (Sutcliffe and Knott, 1987; Nichol- son et al., 1988; Mahe and Olivry, 1991; Olivry et al., 1993). It is a feeling that is unanimously shared by the populations of the countries located along the Gulf of Guinea.
* Comxponding author.
0022-1694/97/$17.00 0 1997 Published by Elsevier Science B.V. All rights rescNed PfI SOO22- 1694(96)03068-S

2 E. Servar et aL/Joumul of Hydrology 191 (1997) I-15
The consequences of this drought are generally less severe and less damaging in those more equatorial regions. The decreases in rainfall and in surface water inflows are, how- ever, such that they might penalize development projects, especially those having to do with agriculture. The operation of the works built following studies, conducted on the basis of data recorded during much more favourable periods, could also be seriously altered. For example, a recent study (Servat and Sakho, 1995) showed that there is a significant lack of stability in water resources in the Sassandra basin (west and south- west of C&e d’Ivoire), which has been especially felt since the beginning of the 70s. The consequences of this phenomenon have proved disquieting for the smooth operation and the profitability of the projects envisaged in that specific case, and more generally in the case of the works already built.
A general study conducted within the framework of the FRIEND AOC project (West and Central Africa) of the PHI of UNESCO is aimed at identifying and at measuring the consequences of the assumed climatic variability in the non-Sahelian parts of the west and central African region as a whole (Servat, 1994). The first studies carried out were on annual precipitation and on the number of rainy days (when this variable was available). The set of data available in C&e d’Ivoire enabled the development of tools and methods that were taken up later on in a regional context. The analysis of the phenomena is based both on the break detection procedures in the time series and on the study of the variations in space of: first, the precipitation isovalue lines; second, the number of rainy days; third, indices that characterize deficits and surpluses. The results that are specific to C&e d’Ivoire are presented here. An attempt at regional integration in the countries along the Gulf of Guinea (C&e d’Ivoire, Ghana, Togo, Benin and Nigeria) is the subject of a separate presentation (Paturel et al., 1996).
2. Data and methods
2.1. Data
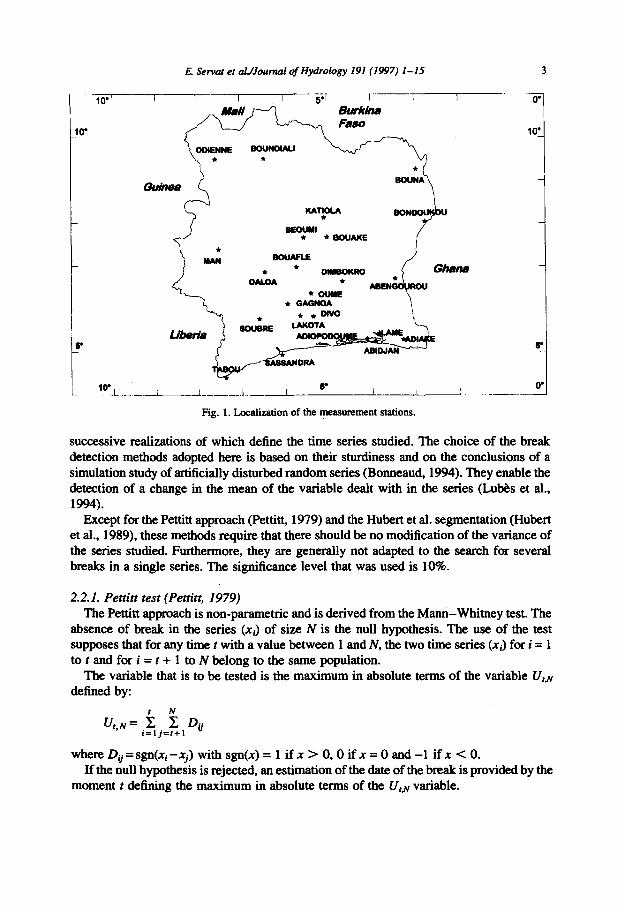
The data used are those acquired at the measurement stations of the C&e d’Ivoire national network. After a selection based on the quality and the length of the series of records available, a set of precipitation stations offering a relatively regular coverage of the Ivorian territory was selected. However, it should be noted that there are two zones with a low density of measurement stations (Fig. 1): the first is located along the Liberian and Guinean borders and the second is in the north-eastern part of the country and coin- cides with the Corn& national park.
Some of the series are shorter than the others and are terminating as early as 1980. In that case these series were investigated with the statistical break detection methods, but they were not taken in account for the maps. These were drawn only from the stations that covered the 4 decades (1950, 1960, 1970 and 1980).
2.2. Statistical break detection methods
A ‘break’ can be defined as a change in the law of probability of the variate, the
E. Se~at et al./Joumal of Hydrology 191 (1997) I-15
?? ??BOUAKE /
10-l , I I I 6
I _L ._ ___L-1_.____- ,___ 8 ,I _-__
Fig. 1. Lmxhation of the measurement stations.
successive realizations of which define the time series studied. The choice of the break detection methods adopted here is based on their sturdiness and on the conclusions of a simulation study of artificially disturbed random series (Bonneaud, 1994). They enable the detection of a change in the mean of the variable dealt with in the series (Lubes et al., 1994).
Except for the Pettitt approach (Pettitt, 1979) and the Hubert et al. segmentation (Hubert et al., 1989), these methods require that there should be no modification of the variance of the series studied. Furthermore, they are generally not adapted to the search for several breaks in a single series. The significance level that was used is 10%.
2.2.1. Per&f fest (Pettitt, 1979) The Pettitt approach is non-parametric and is derived from the Mann-Whitney test. The
absence of break in the series (xi) of size N is the null hypothesis. The use of the test supposes that for any time t with a value between 1 and N, the two time series (Xi) for i = 1 to t and for i = t + 1 to N belong to the same population.
The variable that is to be tested is the maximum in absolute terms of the variable lJtfl defined by:
V t.N= i$j=;,Dii
where Dq = Sp(Xi -5) with sgn(x) = 1 if x > 0,O if x = 0 and -1 if x < 0. If the null hypothesis is rejected, an estimation of the date of the break is provided by the
moment t defining the maximum in absolute terms of the U,& variable.

4 E. h-vat et alJJouma1 of Hydrology 191(1997) I-IS
2.2.2. Bayesian Lee and Heghinian method (Lee and Heghinian, 1977) The Bayesian Lee and Heghiian method proposes a parametric approach. It requires a
normal distribution of the values of the series. The basic model of the procedure is as follows:
{
P+Ei, i=1,...,7 Xi=
/.4+b+Ei, i=7+1, . . ..N
The ei are independent and normally distributed, with a mean equal to zero and a variance equal to a*. r and 6 represent the position in time and the scope of the possible change in the mean respectively.
The method establishes the a posterior-i distribution of the position in time of a change. When the distribution is unimodal, the date of the break is estimated by the mode with all the more accuracy as the dispersion of the distribution is small.
2.2.3. Buishand U statistic (Buishand, 1982, Buishand, 1984) The Buishand procedure refers to the same model and to the same hypotheses as the Lee
and Heghinian approach. If the assumption is that there is a uniform distribution for the position of the break point
ti, the Buishand U statistic is defined by: N-l
& C&lW2 = N(N+l)
where Sk= Cf=i(Xi-E) for k = 1, . . . . N and Dx is the standard deviation of the series. The null hypothesis of the statistical test is the absence of break in the series. In the case
of rejection of the null hypothesis, no estimation of the date of the break is proposed by this test.
In addition to these different procedures, the building of a control ellipse makes it possible to analyse the homogeneity of the (Xi) series. Under the null hypothesis assump- tion, the Sk variable, defined above, follows a normal distribution with a zero mean and a variance equal to k(N-k)N-’ u2, k = 0, . . . . N. It is consequently possible to define confidence limits including the series of the Sk.
2.2.4. Hubert segmentation (Hubert et al., 1989) The segmentation of time series procedure is appropriate for the research for multiple
changes in the mean values. It provides, thanks to a specific algorithm, one or several break dates (or possibly none) which separate contiguous segments whose means are significantly different in terms of the Scheffe test (Dagnelie, 1975).
2.2.5. Presentation of the results The results of the break detection methods are given in tables under several different
forms. A single year number means that all the methods used lead towards this year as the date of the break. Two year numbers mean that the different break detection methods lead towards two different dates of break in the series. Moreover, as a priority was given to the

E. Smut et al./Joumal of Hydrology 191 (1997) I-15 5
results of the Pettitt (1979) test, it was decided to talk of a discrepancy or ‘anomaly’ when some of the methods had detected a break in the series but not Pettitt’s.
3. Study of precipitation
3.1. Isohyets
This part of the study focused on the decades of the 195Os, 196Os, 1970s and 1980s. For each decade, the isohyets covering C&e d’Ivoire were computed and plotted (Fig. 2). Fig. 2 shows a definite general trend showing a shift of the isohyets towards the south/south- west, even though the 60s were the most humid of all the decades. For instance, special attention will be paid to the changes of the 1200 mm and 1800 mm isohyets during that 40- year period.
During the 50s the 1200 mm isohyet only covered a small part of the Ivorian territory in the eastern and central parts of the country. During the 6Os, the region with precipitations of less than 1200 mm was extremely reduced and was confined to the central and the
““I 7.001
am/
Fig. 2. Plot of the isohyets for the decades 1950s. 1
-. . .._-
4m *‘al. am &m 40 _ xm -m
,960s. 1970s and 1980s. (Isohyets are in 1110 mm.)

6 E. Servat et aNJournal of Hydrology 191 (1997) I-15
eastern parts of the country. This situation was reversed during the 70s; when the zone with less than 1200 mm of precipitation covers practically the almost totality of the north- eastern part of the country, that is, from Yamoussoukro to the Burkina Faso border. The 1980s brought about a marked increase in the shift towards the south and south-east of the 1200 mm isohyet, so that nowadays it is practically one third of the territory that has an annual precipitation level of less than 1200 mm year-‘.
The 1800 mm isohyet appeared during the 50s as being characteristic of an average precipitation level in the forest zone. The decade of the 1960s showed a marked reduction of this isohyet zone, particularly in the region between Sassandra and Abidjan, where it disappeared. This decrease was even sharper during the 7Os, especially in the west, in the mountainous region of Man. The only regions to have an annual precipitation level of more than 1800 mm are the Tabou region in the westernmost part of the country, and the region between Abidjan and the Ghanean border. This phenomenon of a shift towards the south and south-west increased further during the 80s. Apart from around Tabou and from the region along the Liberian border, the 1800 mm isohyet has completely disappeared from the Ivorian territory. The quantity of rain in the forest zone has therefore considerably diminished in the course of 40 years.
3.2. Precipitation indices
The precipitation index defined and used by Nicholson et al. (1988) was used in order to assess the variations in annual precipitation over the 4 decades previously studied. In concrete terms, it is a reduced centred variable calculated on annual precipitation:
(xi -.T)/s
with: xi, annual precipitation during year i at the station studied; f, average annual pre- cipitation over the period 19500989 at the station studied, s, standard deviation of annual precipitation over the period 1950/1989 at the station studied.
The methodology consists in selecting a mean value of the precipitation index per decade for each of the stations studied. It is then possible to determine the corresponding isovalue curves for the area studied. The cartography thus obtained is, in a certain way, a map of the ‘intensity’ of the deficit or of the surplus of rainfall.
Fig. 3 makes it possible to appreciate the very clear deficit of the 1970 and 1980 decades on the basis of a mean established over the period 1950-1989. The 1950s show a slight deficit that is limited to the regions of Yamoussoukro and Abengourou. Everywhere else, that period corresponds to a surplus trend which can be quite significant in some parts of the country. It is the case, for example, of two regions with completely different climates: the south-western forest region, with two rainy seasons (Sassandra region), and the north- east with its savannah and single rainy season (Gdienne region). In the central part of the country, the BCoumi region in the north-west of Bouake was also subjected to heavy rains during the 50s. The 60s can also be classified as surplus years on the whole. However, it should be noted the existence of an area showing a deficit, from the north to the south, in the west of the country and even more in the south-westernmost part. of the country, towards Tabou. At that time, the central, the eastern and the central-eastern regions returned to a precipitation surplus situation. The 70s were generally deficit years. The

E. Servat et alJJoumal of Hydrology 191(1997) I-15 7
i
Deflclt SUlplUS Pig. 3. Plot of the precipitation indices for the decades 195Ck, 1960s. 1970s and 1980s.
only region that appears to have benefited from a higher than average precipitation level is the one that corresponds to the Niger basin, in the north of the country. The 80s clearly confirm the existence of an increased tendency towards precipitation deficits. The north of the country and the coastal were especially affected, with the exception of Tabou.
As to the average level of precipitation, the areas located along the Liberian border in the west, and around Abengourou in the east, showed a consistent behaviour throughout the 4 decades studied. Apart from those special cases, there is a general trend towards a precipitation deficit since the 70s in both the forest and the Savannah zones. More parti- cularly, the existence of a ‘Soubrk-Dabakala’ axis with a high deficit can be noticed, as well as the first stages of a deficit situation in the coastal area, with an intensification of the phenomenon during the 1980s. During the 8Os, there was a sharp turn towards a deficit

8 E. Servat et alJJouma1 of Hydrology 191 (1997) I-IS
situation in the north of the ‘SoubrGDabakala’ axis. The noted variability in annual precipitation seems to have come earlier on the Atlantic coast and later in the centre and in the north of the country.
3.3. Detection of breaks in time series
For the precipitation stations chosen, the methods used for the detection of breaks in time series were used both for the complete series and for the series limited to the decades running from 1950 to 1980. This dual approach was-chosen as a priority because of the impossibility, for most methods, to detect several breaks within a single series. The studies conducted in the Sahelian regions showed breaks that were generally detected towards the end of the 60s or the beginning of the 70s (Sircoulon, 1987; Hubert and Carbonnel, 1987; Hubert et al., 1989; Demaree, 1990). In the humid zone, the study of the existence of phenomena comparable to and in phase with those observed further north, should conse- quently take into account the fact that, locally, some significant previous climatic acci- dents might mask changes that have occurred recently. The study of the results in both cases (long and short series) makes it possible to check the potential presence of a fluctuation since the beginning of the 50s and in particular around the 197Os, even if a more important variation was identified before that.
The oldest time series available that met the selection criteria (duration and quality of
Table I Annual rainfall at some C8te d’lvoire gauge stations. Results of the use of procedutes to detect breaks in long and short series
Station number Station Data availability Long series date Short series date
1 Abengourou 1920-1992 No break 2 Abidjan 1938-1992 1976-1982 3 Adiake 1945-1993 1982 4 Beoumi 1940-1992 1963-1964 5 Bondoukou 1937-1980 No break 6 Bouafle 1924-1992 1972 7 Bouna 1920-1980 No break 8 Boundiah 1934-1992 1975 9 Dimbokro 1922-1992 1968
10 Divo 1946-1992 1963-1972 11 Gagnoa 1930-1993 1966 12 Katiola 1949-1991 1968 13 L&OtS 1945-1992 1970 14 Lame 1929-1991 1963-1968 15 Man 1923-1992 An 1966 16 Gdienne 1933-1993 1979-1982 17 Oume 1945-1992 1976-1979 18 SSSSSlldra 1923-1993 1971 19 Soubte 1940-1992 1970 20 Tabou 1935-1992 No break
Underlined years: resuhs vary according to the length of the series. An: discrepancy between the results, or ‘anomaly’, according to the methcds.
No break 1976-1982 1970 1%3-1964 No break 1972 1963 1975 No break 1955-1972 1966 1968 1970 1963 An966 1979- 1982 1976-1979 1971 1970 An 1955

E. Servat et alJJoumal of Hydrology 191 (1997) I-15 9
the series available, lack of gaps) go back to the 1920s. The study of Table 1 allows a comparison of the results obtained for both the long and the short series. For some stations, the use of different methods led to different results within one same series. Under such circumstances, it becomes very difficult to conclude as to the exact time location of the break. This is the case for Abidjan-a&o for example. For other stations it was concluded that there was an anomaly in the case when all the procedures (in particular that of Lee and Heghinian, 1977) showed a break in the series, but that of Pettitt (1979) did not. In particular it was the case for the station of Man-a&o. There are also a few cases in which the use of different methods does not give the same results depending on the type of series, short or long (Adiake and Dimbokro for example). However, as a rule, the different procedures used have revealed the existence of a break which occurred during the 60s or at the beginning of the 70s. This phenomenon seems to have occurred later for the two stations in the north-west (Gdieme and Boundiali) and for Abidjan. The study of the results obtained for the long series makes it clear that this climatic accident is the only one or at least the most severe observed Since the beginning of the reCOrdhtgS at the precipitation stations studied.
For each of the stations studied, the mean rainfall deficit since the date of the break was assessed by comparing the means before and after the breaks in the time series. Table 2 shows those results. Generally speaking, this deficit can be estimated at around 20%, which is considerable, and which confirms to what extent this brutal climatic variation observed in the Sahelian region was also important in the so-called humid Africa.
Table 2
Annual rainfall at some C&e d’Ivoire gauge stations. Results of the use of pmcedures to detect breaks in short series and rainfall deficit assessment linked to climatic variability
Station number Station Dateofthehmak Deficit (% of the mean)
1 Abengourou No break 2 Abidjan 1976- 1982 3 Adiake 1970 4 Beoumi 1963-1964 5 Bondoukou Nobreak 6 Bouafle 1972 I Bouna 1%3 a Boundiali 1975 9 Dimbokm 1968
10 Divo 1955-1972 11 Gagooa 1966 12 Katiola 1968 13 L&Ota 1970 14 Lame 1963 15 Man 1966 16 Odienne 1976-1979 17 Oume 1976-1979 ia SasSandra 1971 19 Soubre 1970 20 Tabou 1955
31 19 19
19 25 28 13 la 16 22 25 21 10 22 22 26 21 13

10 E. Servat et alJJouma1 of Hydrology 191 (1997) I-15
4. Study of the number of rainy days a year
The variable ‘number of rainy days a year’ is more difficult to obtain since some recordings are often cumulated on several days. Nevertheless, in the case of C&e d’Ivoire, it was possible to select a set of measurement points that were relatively evenly distrib- uted, although there are two areas with a low density of measurement sites: along the Liberian and Guinean borders and in the north-east of the country.
4.1. Unes of isovalues
For each of the decades, 1950s. 196Os, 1970s and 198Os, the isovalue lines of the number of rainy days a year were calculated and plotted (Fig. 4). The interpretation of the graphs of Fig. 4 is to be made with caution given the low density of the measurement sites. However, the graphs show quite clearly that there is a general trend towards the shifting of the isovalue lines towards the south, which is the result of the reduction in the number of rainy days on the Ivorian territory as a whole.
The changes in the area with a number of rainy days a year lower than 100 are
Fig. 4. Plot of the isovahe lines of the number of rainy days a year for the decades 1950s. 1960s. 1970s and 1980s (Isovalue lines are in days.)

E. Senzat et al./Joumal of Hydrology 191 (1997) I-15 11
significant. During the 195Os, it was confined to the northeastern quarter of the country. It was reduced to a minimum during the 6Os, which, as was shown previously, were rela- tively humid. During the 197Os, there was, in addition to the north-east sector, a region with less than 100 rainy days year-’ in the forest zone between Sassandra and Abidjan. This low rain area not only maintained itself throughout the 80s but its size increased to cover almost all the northern region as well as the so-called “V BaouM” region, a Savannah zone around and in the south of Yamoussoukro.
4.2. Indices for the number of rainy days a year
An index of the number of rainy days a year was calculated for this variable, in the same
Deficit StlrplUS
Fig. 5. Plot of the indices of the number of rainy days a year for the decades 195Os, 1960s. 1970s and 1980s.

12 E. Servat et al./Joumal of Hydrology 191 (1997) I-15
way as for the pluviometric index. It was then studied using the same methodology than the one described earlier on. The resulting map (Fig. 5) is consequently a map of the intensity of the deficits or of the surpluses of the number of rainy days.
Fig. 5 shows that, generally speaking, the 70s and the 80s are clearly deficit decades. Looking at the different maps more in detail, the existence of a deficit zone can be noted in the central and the central-eastern parts of the country during the 50s. On the other hand, the coastal and western regions seem to have a significant surplus. During the 6Os, it seems that a reversal phenomenon took place, since a zone with a slight deficit is detected around Tabou in the extreme south-western part of the country whereas the north-east has a surplus. The 70s correspond to a clear change since almost all the Ivorian territory is in a deficit situation. The deficit is sharper along a north-west/south-east axis, particularly in the Sassandra region. The 80s witnessed a brutal intensification of the trend with the exception of the Tabou region in the extreme south-west. The northern and central regions were the most affected by that change.
4.3. Detection of a break in a time series
In the same vein as above, the methods for the detection of breaks in time series were used for both the complete series and the series limited to the decades from 1950 to 1980.
Table 3 shows the results in both cases. In many instances, it was not possible to make a difference between long and short series. However, when it was possible to study the long
Table 3 Number of rainy days a year at some C&e d’Ivoire gauge stations. Results of the use of procedures to detect breaks in long and short series
Station Data availability Long series date Short series date
Abidjan A&o 1940-1992 Abengourou 1933-1992 Adiak6 1945-1993 Adiopodoumk 1948-1977 Abidjan Banco 1949-1980 BouaflC 1954-1992 Daloa 1950-1986 Dimbokro 1951-1992 Divo 1947-1992 Gagnoa 1947-1993 JAkOta 1949-1992 Man A&o 1950-1992 Gdiennd 1945-1993 Chtme 1950-1992 Sassandra 1936-1993
1960-1963
1946(+) No break No break No break No break No break No break No break No break No break No break No break No break
$k$I!$
1960-1963 No break No break I%8 An 1973 1973-1982 1971 No break 1972 1970 No break 1972-1980 1968-1971 1976 1961-1964
Tabou 1935-31992 An 1939(+) No break 1 An 1967
Underlined years: results vary according to the length of the series. (+): sharp increase of the mean value of the studied variable. An: discrepancy between the results, or ‘anomaly’, according to the methods.

E. Servar et alJJoumal of Hydrology 191 (1997) l-15 13
series, it appeared that there had been an increase in the number of rainy days a year during the 1940s. Nevertheless, it is only an anomaly in view of the definition that was given beforehand, that is, a break detected by the Lee and Heghinian (1977) procedure but not by the Pettitt (1979) method. As for the short series, for five of the stations studied (Adiake, Abengourou, Dimbokro, Lakota and Tabou), the different procedures have revealed nothing. An anomaly was recorded at the Abidjan Banco station. On the other hand, for all the other precipitation stations, the different methods have shown a break that is generally found towards the end of 60s or the beginning of the 7Os, a result quite consistent with those obtained for annual precipitation.
5. Discussion and conclusion
The drawing of the different isohyets lines indicates that since 1950, they have clearly shifted towards the southlsouth-west of the country. This led to a marked decrease in rainfall on the Ivorian territory as a whole. This phenomenon, that was perceptible as early as during the 70s. gained in scope during the 80s. The latter decade was marked by the presence of the year 1983, an extremely dry year in C&e d’Ivoire and in the subregion. In the north of the country, some savannah areas have a rainfall that is well below 1000 mm year-’ nowadays, which corresponds to a definite settling into a Sudanian climatic regime, instead of a Guinean one as was admitted in the past (Eldin, 1971). The decrease in precipitation is also quite significant further south, where the forest zone is considerably less wet. Furthermore, this tendency is particularly pronounced on the Atlantic coast between Sassandra and Abidjan, where rains are traditionally more important. The expla- nation that is generally given for this local specificity (Aubmville, 1949; Eldin, 1971) is that the coast in that region has a different geographical orientation from the one further to the west or to the east of the country. This orientation, which is more parallel to the monsoon flows, makes it less prone to rains and consequently less wet. On the other hand, this general decrease in the amount of annual precipitation is less significant in the western mountain regions because of the overriding influence of the relief on rainfall.
As for the study conducted on the precipitation indices, it enables to have a correct appreciation of the intensity of the phenomenon. The fact that it is not uniform is the first obvious observation. The results show that the forest region seems to have been less severely affected than the savannah region, particularly in the west and south-west of the country. During the 1970s. this decrease in rainfall was more intensely felt first and foremost along a Soubm-Dabakala axis. Then it was perceived on both sides of this line, first progressively and then with more intensity in the north and on the coast during the 80s.
This progressive character in the evolution of the phenomenon translates into a varia- bility of the dates of the breaks in the series of annual precipitation according to the position of the raingauge station. Almost all of the stations in the centre of the country or along the Soubre-Dabakala axis have a break at the end of the 60s or the beginning of the 70s. The stations in the north (Odiend, Boundiali) or along the coast (Abidjan, Ad&?) generally display more belated but sharper breaks with rainfall deficit higher than 20% most of the time.

14 E. Sewat et alJJouma1 of Hydrology 191 (1997) I-15
The study on the number of rainy days gives results that confirm the above observations, for it shows that there is a parallel development between the decrease in annual precipita- tion and that of the number of rainy days a year. It is intensified as early as in the 7Os, especially in the region between Sassandra and Abidjan. The process will be even more pronounced during the 80s.
However, it should be noted that the dates of the breaks are not always the same as those observed for the annual rainfall series. That difference might be explained in a future study on the number of rainfall events according to their values.
What precedes clearly demonstrates that there was a decrease in rainfall at the end of the 60s and the beginning of the 70s on the whole of the Ivorian territory. If the dates of occurrence of this climatic variability can slightly vary from one region to the other, the reality of the phenomenon does not seem to be questionable. A climatic accident, which is parallel and comparable with the one observed further north in the Sahelian regions thus seems to have occurred in C&e d’Ivoire, a country which belongs to the humid zone. This situation, which has been described in detail here, extended to the regional level and now prevails for all the countries of the Gulf of Guinea (Paturel et al., 1996).
Acknowledgements
The authors would like to thank the Agence Nationale pour 1’Aviation Civile et la M&orologie (ANAM), which manages the Ivorian precipitation network, for having made available the data used in this study.
References
AubnWlle, A., 1949. Climats, For&s et Dksertification de I’ Afrique Tropicale. Sot. Ed. Maritimes et Col., Paris. Bonneaud, S.. 1994. M&hodes de Detection des Ruptures dans les Skies Chtonologiques. ISIM/ORSTOM,
Montpellier, 37 pp. Buishand, T.A.. 1982. Some methods for testing the homogeneity of rainfall records. J. Hydrol.. 50: 11-27. Buishand, T.A.. 1984. Tests for detecting a shift in the mean of hydrological time series. J. Hydrol., 73: 51-69. Dagnelie. P., 1975. ‘fh6orie et M6thodes Statistiques. Applications Agronomiques. Vol. 2, Les Presses Agro
nomiques de Gembloux. 459 pp. De&, G., 1990. An indication of climatic change as seen t%om the rainfall data of a Mauritanian station.
Theor. Appl. Climatol.. 42: 139-147. Eldin, M., 1971. Le climat. In: Avenard, J.M. et al. (Editors), Le Milieu Nature1 de la C&e d’lvoim. Mkmoires
ORSTGM No. 50, ORSTOM, Paris, 391 pp. Hubert, P. and Carbonnel J.P.. 1987. Apptoche statistique de l’ariditication de 1’Afrique de I’Ouest. J. Hydrol.. 95:
165-183. Hubert, P., Carbonnel, J.P. and Chaouche, A., 1989. Segmentation des skies hydrometriques. Application a des s
6ries de precipitations et de debits de I’ Afrique de I’Ouest. J. Hydrol., 110: 349-367. Lee, A.F.S. and Heghinian, S.M., 1977. A shift of the mean level in a sequence of independant normal random
variables - a bayesian approach. Technomeuics, 19(4): 503-506. Lubk H., Masson, J.M., Servat, E.. Paturel, J.E.. Kouame, B. and Boyer, J.F., 1994. Caract&isation de Fluctua-
tions dans une S&e Chtonologique par Applications de Tests Statistiques - Etude Bibliographique. ORS- TOM, Montpellier, 21 pp.
E. Servat et al./Joumal of Hydrology 191 (1997) I-15 15
MaM. G. and Olivry, J.C.. 1991. Changements climatiques et variations des Ccoulements en Afrique occidentale et centrale du mensuel g I’interannuel. In: Van de Ven, F.H.M.. Gutknecht, D., Lou&s, D.P. and Salewin. K.A. (Editors), Hydrology for the Water Management of Large River Basins, Rot. Vienne Symposia August 1991. IAHS Publ. No. 201, pp. 163-172.
Nicholson, S.E.. Kim, J. aad Hoopingamer, J., 1988. Atlas of African Rainfall and Its Interannual Variability. Depamnent of Meteorology, Florida State University, Tallahassee, FL, USA.
Olivry. J.C., Bricquet, J.P. and Mahe. G., 1993. Vers un appauvrissement durable des ressources en eau de I’Afrique hum%. Ix Gladwell. J.S. (Editor), Hydrology of Warm Humid Regions, Rot. Yokohama Sym- posium, July 1993. IAHS Publ. No. 216. pp. 67-78.
Paturel. J.E., Servat, E., Kouam~?. B., L&&s, H.. Ouedraogo, M. and Masson, J.M.. 1997. Climatic variability in humid Africa along the Gulf of Guinea 97. Part II: an integrated regional approach. J. Hydml., 191: 19-39.
Pettitt, A.N., 1979. A non-pamme& approach to the change-point problem. Appl. Stat., 28(2): 126135. Sexvat, E., 1994. ICCARB. Identification et ConsQueoces d’une variabilite du Climat en AfRique de I’ouest non
sabElienne. F%%entation du programmt. Antenne Hydmlogique ORSTOM. Abidjan, C&e d’Ivoirr, 25 pp. Servat, E. and Sakho, M., 1995. Instability of water msomces and management of a planned water system in non-
sahelian West Africa. Hydrol. Sci. J., 40(2): 217-230. Sinxulon, J., 1987. Variation des d&its des tours d’eau et des niveaux des lacs en Atiique de 1’Ouest
depuis le debut du 2O&me si&le. In: Solomon, S.I., Bevan. M. and Hogg, W. (Editors), The Influence of Climate Change and Climatic Variability on the Hydrologic Regime and Water Resource+ Proc. Vancouver Symposium, August 1987. IAHS Publ. No. 168, pp. 13-25.
Sutcliffe. J.V. and Knott, D.G., 1987. Historical variations in African water resources. In: Solomon, S.I., Bevan. M. and Hogg, W. (Editors), The Influence of Climate Change and Climatic Variability on the Hydrologic Regime and Water Resources, proc Vancouver Symposium, August 1987. IAHS Publ. No. 168. pp. 463-475.