climatic and synoptic characterization of heat waves in ... · characterizationofheatwavesinbrazil...
TRANSCRIPT
INTERNATIONAL JOURNAL OF CLIMATOLOGYInt. J. Climatol. (2017)Published online in Wiley Online Library(wileyonlinelibrary.com) DOI: 10.1002/joc.5294
Climatic and synoptic characterization of heat waves in Brazil
João L. Geirinhas,a Ricardo M. Trigo,a Renata Libonati,b* Caio A. S. Coelhoc andAna Cristina Palmeirab
a Instituto Dom Luiz, Faculdade de Ciências da Universidade de Lisboa, Portugalb Departamento de Meteorologia, Instituto de Geociências, Universidade Federal do Rio de Janeiro, Brazil
c Centro de Previsão de Tempo e Estudos Climáticos (CPTEC), Instituto Nacional de Pesquisas Espaciais (INPE), Cachoeira Paulista, São Paulo,Brazil
ABSTRACT: According to the latest global and regional circulation models, the probability of occurrence of large heat waves(HWs), such as the 2003 European or the 2010 Russian events will increase significantly in the following decades under mostclimate scenarios. Currently, there are numerous studies for the Northern Hemisphere characterizing HWs and evaluatingtheir impacts in several areas such as public health, economy, and agriculture. However, over South America, and in particularfor Brazil, similar analysis is lacking despite its large geographical extension and numerous population potentially affected.Here we perform an assessment of HW events and characteristics recorded in six large Brazilian cities during the last fivedecades. The performed analysis reveals the existence of positive and significant trends in HW frequency since the 1980s,particularly for the cities of São Paulo, Manaus, and Recife. Over the last decades, Brasília was the city that recorded thehighest number of days per year under a HW regime, contrasting with Rio de Janeiro that recorded the lowest value. Theassessment of the large-scale atmospheric circulation patterns associated with summer HWs, indicated for Porto Alegre,São Paulo, Rio de Janeiro, and Brasília the presence of well-marked concentric and positive 500 hPa geopotential heightanomalies followed by positive 850 hPa temperature anomalies. These anomalies are likely associated with quasi-stationaryanticyclonic systems promoted by anomalous westward displacements of the South Atlantic Subtropical High System whichare related to a weakening of other transients (and non-transient) systems such the Intertropical Convergence Zone (ITCZ)and the South Atlantic Convergence Zone. For Manaus, the identified anomalies are linked to a northward displacement ofthe ITCZ. This configuration is compatible with an increase in solar radiative pattern and decreased soil moisture, enhancingsurface temperature values, possibly associated with positive feedback mechanisms between soil and the atmosphere.
KEY WORDS heat waves; Brazil; atmospheric circulation patterns
Received 11 May 2017; Revised 21 August 2017; Accepted 23 August 2017
1. Introduction
Observational records reveal that the global average sur-face temperature has been increasing since the early 20thcentury, particularly after the 1970s decade (Intergovern-mental Panel on Climate Change (IPCC), 2014). Futureclimate change scenarios based on global climate mod-els show significant positive trends of surface temperature,accompanied by an increase in the frequency and inten-sity of hot extreme periods such as heat waves (HWs).According to the last IPCC report published in 2014, it isvery likely that HW frequency has increased since the mid-dle of the 20th century over large parts of Europe, Asia,and Australia. Several studies also suggest that anthro-pogenic forcing contribution was partially responsible forthe occurrence of large HW’s recorded in recent years,such as the 2003 European HW (Luterbacher et al., 2004;Stott et al., 2004; Coelho et al., 2008; Zhu et al., 2013) or
* Correspondence to: R. Libonati, Departamento de Meteorologia, Insti-tuto de Geociências, Universidade Federal do Rio de Janeiro, Av. Athosda Silveira Ramos, 274, Bl. G, Cidade Universitária, 21941-916 Rio deJaneiro, RJ, Brazil. E-mail: [email protected]
the 2010 Russian HW, which were classified as mega-heatwaves due to their spatial extent, magnitude and associatedhuman, and socio-economic impacts (Barriopedro et al.,2011; Dole et al., 2011).
HWs are responsible for a wide range of effects inecosystems (Bastos et al., 2014) and in human health,including cardiopulmonary diseases, premature death, andother illnesses that occur when air temperature reachesunhealthy levels (Gosling et al., 2009), impacting directlyon public health (Linares and Diaz, 2008), and economy(García-Herrera et al., 2010). Although HW impacts aremainly health-service-related (IPCC, 2014); they are alsoassociated with settlement and social conditions, particu-larly for children and elderly people (Trigo et al., 2009;Son et al., 2016). Persistent unusual high temperaturesmay also induce the occurrence of vegetation fires (Pereiraet al., 2005; Silva et al., 2016), losses for the agriculturesector, water supplies, food storage, and energy system(García-Herrera et al., 2010).
Accordingly, there is a global demand for understandingand characterizing HW events, considering the associatedsocial, economic, and environmental impacts. However,the widespread interest in characterizing the occurrence
© 2017 Royal Meteorological Society

J. L. GEIRINHAS et al.
of extreme temperatures in various continents has notattained the same level in South America and particularlyin Brazil, despite few exceptions (Cerne and Vera, 2011;Renom et al., 2011; Rusticucci, 2012; Hannart et al., 2015;Bitencourt et al., 2016; Ceccherini et al., 2016; Rustic-ucci et al., 2016, 2017). Nevertheless, South America andBrazil, in particular, are no exception to the global positivetrend of surface temperature in the last decades (Vincentet al., 2005; Alexander et al., 2006; Skansi et al., 2013;Soares et al., 2017). In particular, Brazil has been affectedby a marked increase in both minimum and maximum tem-peratures since the 1960s (Marengo and Camargo, 2008).The northeast Brazilian region, which is characterized bya semi-arid climate and for being historically affectedby dry and extreme hot periods, has registered a gradualincrease of extreme heat events, especially since the 1990sdecade (Moura, 2016). Moreover, most models (either atthe global or regional scale) point to a significant warmerfuture in South America, with air temperature increas-ing between 2 and 5 ∘C by the end of the current century(IPCC, 2014).
Currently, there are several HW definitions and, tosome extent, all present advantages and caveats. A cer-tain definition is in most cases effective solely to thegroup affected and/or to the respective study reporting theanalysis (Perkins and Alexander, 2013). Nevertheless, acommon denominator rises among all the definitions, con-sidering that an HW can be interpreted as an extreme cli-mate event characterized by a period of consecutive dayswith daily temperatures expressively higher than the clima-tological background values (Frich et al., 2002).The mosthazardous effects of climate change are related to a poten-tial increase of extreme weather and climate events (Rus-ticucci, 2012). The vulnerability of the society and ecosys-tems to most climate extreme events depends crucially onthe location and area affected, on the temporal extent ofthe event and naturally on the ecosystems and crops atrisk (Costa et al., 2015). From a human perspective on thepotential rise in morbidity or mortality rates, these impactsalso depend on the type of population affected, namely theage structure and overall adaptation of society to extremetemperatures (Son et al., 2016).
In mid-latitude, HW genesis is generally associated withthe establishment of a large-scale anticyclonic atmosphericcirculation pattern (Black et al., 2004; Dole et al., 2011)characterized by quasi-stationary 500-hPa anomalies thatinduce descending vertical air motion (subsidence) lead-ing to clear sky conditions, light surface winds, advectionof warm air masses and prolonged hotter than usual con-ditions (Xoplaki et al., 2003; Meehl and Tebaldi, 2004).Over Brazil, these patterns can be induced by a westwardmigration of the South Atlantic Subtropical high in asso-ciation with sea surface temperature (SST) anomalies overthe South Atlantic Ocean. In equatorial regions, hot anddry episodes can be associated with the northward migra-tion of the Intertropical Convergence Zone (ITCZ) inassociation with warmer than normal SST over the NorthTropical Atlantic Ocean and also with the warm phaseof El Niño Southern Oscillation (ENSO) phenomena
in the equatorial Pacific (Zeng et al., 2008; Coelhoet al., 2012).
Given the relatively unexplored characterization of HWsin Brazil, this study aims to depict the decadal evolutionof HW events for a number of important Brazilian cities,analysing in particular possible frequency changes andalso investigating trends of HW events. The second objec-tive of this work is to establish the relationship betweensummer HW events for each city and the main large-scaleatmospheric circulation patterns associated with these pro-longed temperature anomalies at the surface.
2. Data and methodology
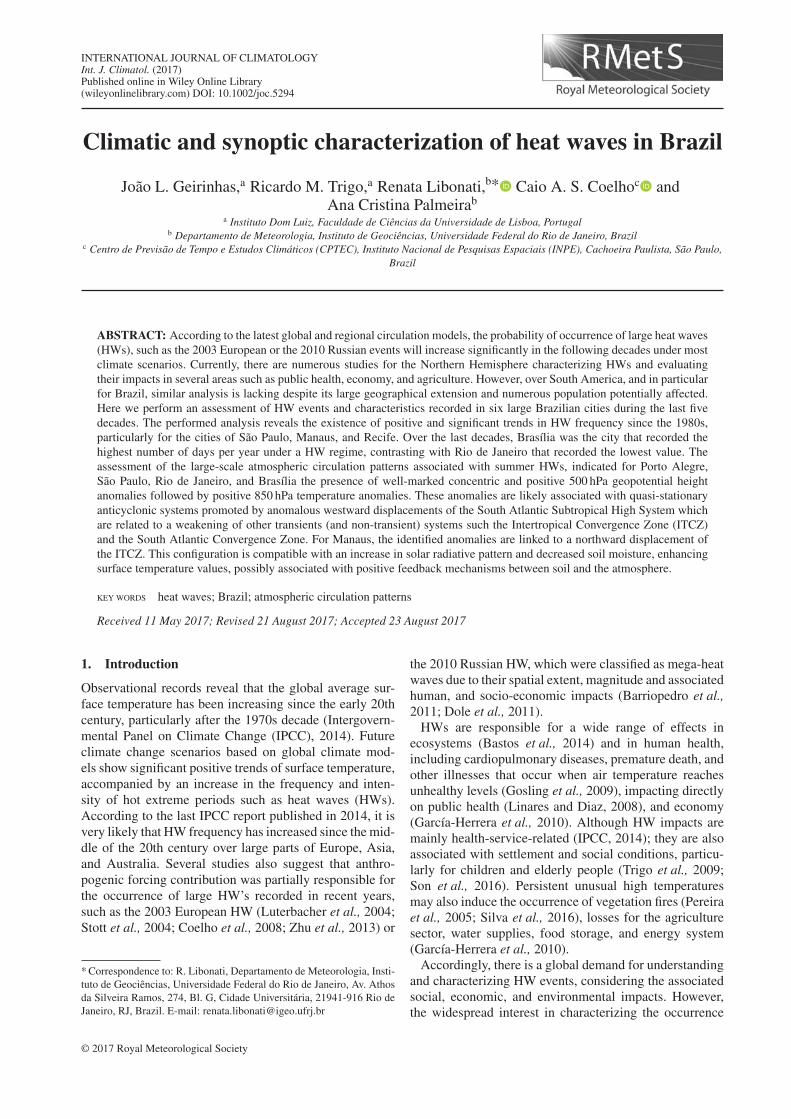
Daily values of both minimum and maximum surfaceair temperatures from different meteorological stationswere analysed for the period of 1961–2014. The sixstations used here are located within the urban area ofsix major Brazilian cities, namely, São Paulo, Rio deJaneiro, Brasília, Porto Alegre, Manaus, and Recife. Eachcity/station belongs to one macro region, namely: North(Manaus), Northeast (Recife), Central-West (Brasília),South (Porto Alegre), and Southeast (São Paulo andRio de Janeiro), covering the whole country (Figure 1).The macro regions were defined according to the Insti-tuto Brasileiro de Geografia e Estatística (IBGE). Datawere obtained from the meteorological station network ofINMET (National Meteorology Institute of Brazil) and ofICEA (Air Traffic Control Institute of Brazil). Despite thequality control provided by INMET and ICEA, the temper-ature data are affected by missing data. We have analysedthe temperature records and computed the percentage ofmissing values along the time series. The obtained percent-age of missing values varies from 0.56 to 8.10% for eachstation, not hindering the HW index computation.
Various HW indices are often constructed for differentactivity (e.g. human health, wildfire, agriculture, etc.). In acontinental country such as Brazil, with a highly diversepopulation and regions with different atmospheric fea-tures, it is important to adopt an index that is versatile.Several indices are based on absolute thresholds, but thesecan be less suitable to be applied in some sub-regions(Perkins, 2011). Alternatives to absolute thresholds arepercentile-based thresholds that define HW as eventsthat exceed a threshold relative to the area of interest,not an absolute universal threshold. In particular, thesepercentile-based methods allow a more robust comparisonof results between the different Brazilian regions and arebetter suited to be used in a climate change context. Takinginto account all these aspects this work uses two indices,based on the 90th percentile of maximum (CTX90pct)and minimum (CTN90pct) temperatures. These types ofindexes were also used in previous studies regardingHWs in South America (Rusticucci et al., 2016). Thuswe define HW as a period of three or more consecutivedays characterized by daily Tmax and daily Tmin abovethe climatological (1961–2014 base period) calendar day90th Tmax percentile (CTX90pct) and 90th Tmin percentile
© 2017 Royal Meteorological Society Int. J. Climatol. (2017)
CHARACTERIZATION OF HEAT WAVES IN BRAZIL
Figure 1. Map of South America highlighting Brazil (bold black line),the five Brazilian main geographical regions (black lines – North, North-east, Central-West, Southeast, and South), the six Brazilian meteorolog-ical stations from ICEA and INMET, and the topography (m). [Colour
figure can be viewed at wileyonlinelibrary.com].
(CTN90pct) calculated on a 15-day window (centred onthe day in question). In this procedure a different percentilethreshold value is computed for each day of the year inorder to take into account the seasonal cycle. These twoindices showed to be effective in defining and identifyingHW events over the Australian territory, which is similarto Brazil in terms of spatial extent and ranges of regionalclimate variability (Perkins and Alexander, 2013).
The climatic characterization was conducted analysingfor each city and for both indexes the number of HW daysper year (NHWD), a value that is dependent on the annualnumber of HW’s and also on the duration of each HWevent. Any major variation on the annual number of HWsor on the duration of the events will impinge a changein the values of NHWD. Thus this metric represents amore inclusive assessment when compared to analysingseparately the annual number of HW or the duration of allevents recorded.
Regional atmospheric circulation of summer corre-sponding to December, January, and February (DJF) HWperiods was analysed through ERA-Interim reanalysisfields from European Centre for Medium-Range WeatherForecast (ECMWF) for the period spanning from 1979to 2014 and over an area of 85–30∘W and 13∘N-60∘S.The meteorological variables used are daily time seriesof sea level pressure (SLP), 500 hPa geopotential height(H500), 850 hPa level temperature (T850), maximum
and minimum air temperature at 2 m (Tmax and Tminrespectively), zonal and meridional wind components at10 m (U10 and V10 respectively), relative humidity atsurface (HRsup), precipitation rate (Prec), solar radiativebalance at surface (RadS) and thermal radiative balance atsurface (RadTerm).
All values correspond to daily mean averages, except forTmax, Tmin, RadS, and RadT. Regarding Tmax (Tmin)the daily values correspond to the maximum (minimum)temperature recorded on each day. Regarding RadS andRadT, the daily values correspond to daily levels of accu-mulated radiation. The reanalysis data, although based onobserved fields, depends also on the quality of the fore-cast model used. This caution note must be consideredwhen analysing the Prec variable because it is particularlydependent on the forecast model, and thus, susceptibleto model systematic errors. Nevertheless, the large-scaleatmospheric circulation analyses performed in this paperwere based on anomaly composites (mean field removed)as explained in the following paragraph, which filter con-siderably the impact of model biases (Trigo et al., 2002,2004; Pereira et al., 2005).
Anomaly composite fields of different meteorologicalvariables relative to each city were obtained by averagingthe summer anomalies (with respect to the 1979–2014 cli-matology) for the dates identified as intense HW events(see definition below). In other words, an anomaly com-posite of intense summer HW events regarding a specificcity is defined as the mean of the meteorological variablevalues recorded during the days identified as being partof an intense summer HW event. An intense summer HWevent, relatively to a specific city and to a certain meteoro-logical parameter was defined as an event whose temporalextension was longer than the 90th percentile of all thedurations (of all summer events recorded over the periodof 1979–2014) obtained for the same city.
3. Results
3.1. Climatic characterization
3.1.1. Number of HW days per year
As mentioned in Section 2, the climatic characterizationwas conducted analysing for each city and for both indicesthe NHWD. Figure 2 provides a full assessment of thesevarious components for the city of São Paulo showing thatthe NHWD time evolution (Figure 2(c)) results from theannual number of HWs evolution (Figure 2(a)) as well asfrom the duration of the HW events recorded (Figure 2(b)).
Table 1 reveals a well-marked disparity in NHWD meanand standard deviation values between cities and even,for the same city, between both indices. Regarding theCTX90pct index, Brasília was the city showing the high-est mean NHWD value of 20.5 days. On the other hand,Rio de Janeiro showed the smallest mean NHWD valueof 7.8 days. The cities of São Paulo and Porto Alegreshowed similar mean values (14.5 and 14 days year−1,respectively) to what was obtained for the cities of Recife
© 2017 Royal Meteorological Society Int. J. Climatol. (2017)

J. L. GEIRINHAS et al.
Figure 2. Time evolution (1961–2014) of the annual number of HW’s for São Paulo (a). Histogram of the durations of all HW events recorded forSão Paulo over the period of 1961–2014 (b). Time evolution (1961–2014) of the annual number of HW days (c). All values were recorded regarding
the CTX90pct index.
Table 1. NHWD statistical values (means and standard deviation)for the 1961–2014 period for the six Brazilian cites and for both
indices.
NHWD Mean (day year−1) Standard deviation(day year−1)
CTX90pct CTN90pct CTX90pct CTN90pct
Manaus 16.6 18.1 21.0 39.0Recife 17.6 7.7 22.6 10.8Brasília 20.5 14.1 15.9 17.2São Paulo 14.5 12.5 14.1 12.7R. Janeiro 7.8 16.7 6.1 16.6P. Alegre 14.0 16.1 12.3 11.4
and Manaus (17.6 and 16.6 days year−1, respectively).Regarding the CTN90pct index, Recife showed, in con-trast with the large mean value for the CTX90pct, thesmallest mean NHWD value, just 7.7 days year−1, con-firming the disparity of results often observed between
the two computed indices. Likewise, contrary to whatwas noticed for CTX90pct, Rio de Janeiro was one ofthe cities with the highest value (16.7 days year−1) withCTN90pct index. Finally, Manaus recorded the highestvalues (18.1 days year−1) with CTN90pct index.
This disparity between indices is also noticed in theNHWD standard deviation values. For both indices, Man-aus showed the highest results, including the exceptionalvalue of 39 days year−1 for the CTN90pct. RegardingCTX90pct index, Recife was the city with the highestvalue (22.6 days year−1) while Rio de Janeiro showedthe smallest (6.1 days year−1). Again, results for theCTN90pct show a very different picture with Rio deJaneiro presenting the highest value and Recife thesmallest (10.8 days year−1).
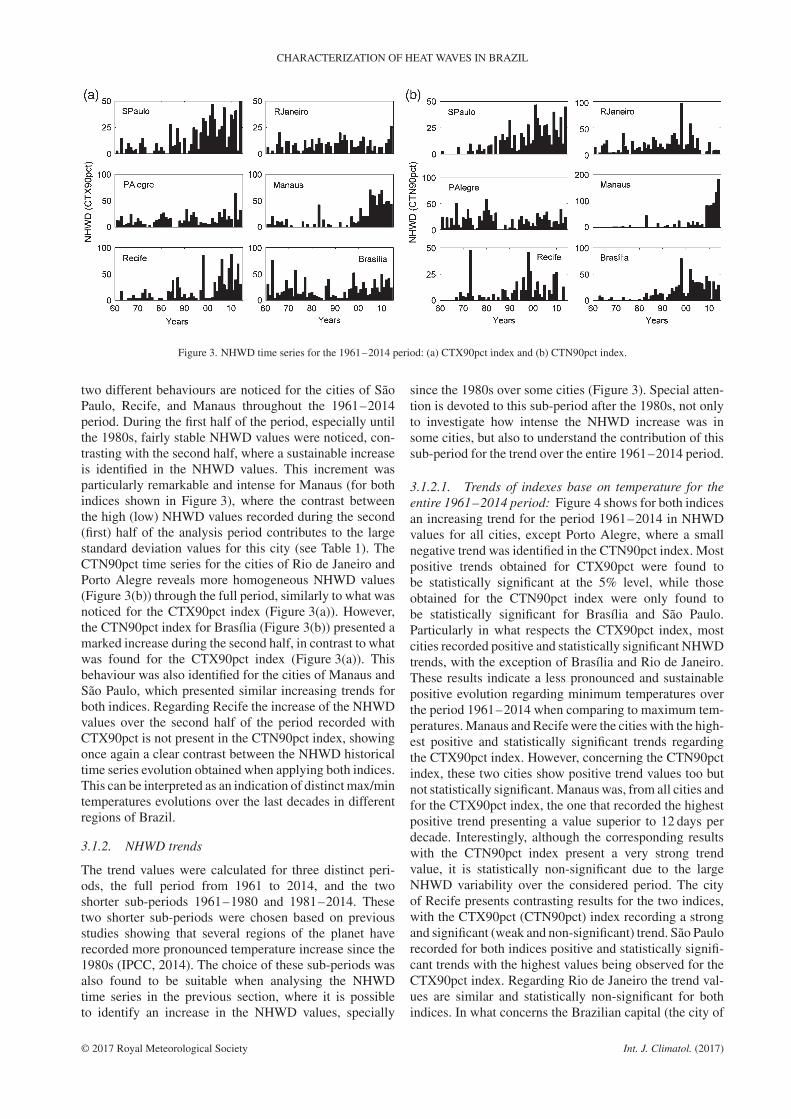
This contrast over the analysis period between indicesis also observed in terms of the NHWD historical timeseries, as shown in Figure 3. Regarding the NHWD valuesobtained by applying the CTX90pct index (Figure 3(a))
© 2017 Royal Meteorological Society Int. J. Climatol. (2017)
CHARACTERIZATION OF HEAT WAVES IN BRAZIL
Figure 3. NHWD time series for the 1961–2014 period: (a) CTX90pct index and (b) CTN90pct index.
two different behaviours are noticed for the cities of SãoPaulo, Recife, and Manaus throughout the 1961–2014period. During the first half of the period, especially untilthe 1980s, fairly stable NHWD values were noticed, con-trasting with the second half, where a sustainable increaseis identified in the NHWD values. This increment wasparticularly remarkable and intense for Manaus (for bothindices shown in Figure 3), where the contrast betweenthe high (low) NHWD values recorded during the second(first) half of the analysis period contributes to the largestandard deviation values for this city (see Table 1). TheCTN90pct time series for the cities of Rio de Janeiro andPorto Alegre reveals more homogeneous NHWD values(Figure 3(b)) through the full period, similarly to what wasnoticed for the CTX90pct index (Figure 3(a)). However,the CTN90pct index for Brasília (Figure 3(b)) presented amarked increase during the second half, in contrast to whatwas found for the CTX90pct index (Figure 3(a)). Thisbehaviour was also identified for the cities of Manaus andSão Paulo, which presented similar increasing trends forboth indices. Regarding Recife the increase of the NHWDvalues over the second half of the period recorded withCTX90pct is not present in the CTN90pct index, showingonce again a clear contrast between the NHWD historicaltime series evolution obtained when applying both indices.This can be interpreted as an indication of distinct max/mintemperatures evolutions over the last decades in differentregions of Brazil.
3.1.2. NHWD trends
The trend values were calculated for three distinct peri-ods, the full period from 1961 to 2014, and the twoshorter sub-periods 1961–1980 and 1981–2014. Thesetwo shorter sub-periods were chosen based on previousstudies showing that several regions of the planet haverecorded more pronounced temperature increase since the1980s (IPCC, 2014). The choice of these sub-periods wasalso found to be suitable when analysing the NHWDtime series in the previous section, where it is possibleto identify an increase in the NHWD values, specially
since the 1980s over some cities (Figure 3). Special atten-tion is devoted to this sub-period after the 1980s, not onlyto investigate how intense the NHWD increase was insome cities, but also to understand the contribution of thissub-period for the trend over the entire 1961–2014 period.
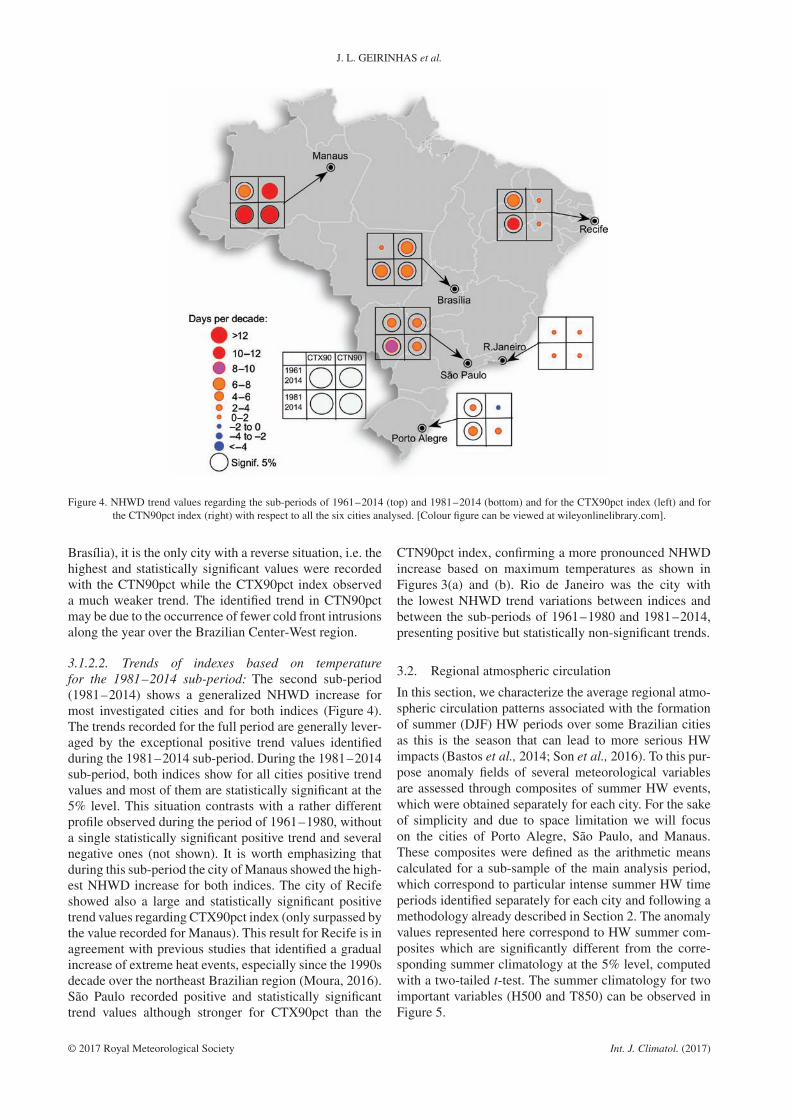
3.1.2.1. Trends of indexes base on temperature for theentire 1961–2014 period: Figure 4 shows for both indicesan increasing trend for the period 1961–2014 in NHWDvalues for all cities, except Porto Alegre, where a smallnegative trend was identified in the CTN90pct index. Mostpositive trends obtained for CTX90pct were found tobe statistically significant at the 5% level, while thoseobtained for the CTN90pct index were only found tobe statistically significant for Brasília and São Paulo.Particularly in what respects the CTX90pct index, mostcities recorded positive and statistically significant NHWDtrends, with the exception of Brasília and Rio de Janeiro.These results indicate a less pronounced and sustainablepositive evolution regarding minimum temperatures overthe period 1961–2014 when comparing to maximum tem-peratures. Manaus and Recife were the cities with the high-est positive and statistically significant trends regardingthe CTX90pct index. However, concerning the CTN90pctindex, these two cities show positive trend values too butnot statistically significant. Manaus was, from all cities andfor the CTX90pct index, the one that recorded the highestpositive trend presenting a value superior to 12 days perdecade. Interestingly, although the corresponding resultswith the CTN90pct index present a very strong trendvalue, it is statistically non-significant due to the largeNHWD variability over the considered period. The cityof Recife presents contrasting results for the two indices,with the CTX90pct (CTN90pct) index recording a strongand significant (weak and non-significant) trend. São Paulorecorded for both indices positive and statistically signifi-cant trends with the highest values being observed for theCTX90pct index. Regarding Rio de Janeiro the trend val-ues are similar and statistically non-significant for bothindices. In what concerns the Brazilian capital (the city of
© 2017 Royal Meteorological Society Int. J. Climatol. (2017)
J. L. GEIRINHAS et al.
Figure 4. NHWD trend values regarding the sub-periods of 1961–2014 (top) and 1981–2014 (bottom) and for the CTX90pct index (left) and forthe CTN90pct index (right) with respect to all the six cities analysed. [Colour figure can be viewed at wileyonlinelibrary.com].
Brasília), it is the only city with a reverse situation, i.e. thehighest and statistically significant values were recordedwith the CTN90pct while the CTX90pct index observeda much weaker trend. The identified trend in CTN90pctmay be due to the occurrence of fewer cold front intrusionsalong the year over the Brazilian Center-West region.
3.1.2.2. Trends of indexes based on temperaturefor the 1981–2014 sub-period: The second sub-period(1981–2014) shows a generalized NHWD increase formost investigated cities and for both indices (Figure 4).The trends recorded for the full period are generally lever-aged by the exceptional positive trend values identifiedduring the 1981–2014 sub-period. During the 1981–2014sub-period, both indices show for all cities positive trendvalues and most of them are statistically significant at the5% level. This situation contrasts with a rather differentprofile observed during the period of 1961–1980, withouta single statistically significant positive trend and severalnegative ones (not shown). It is worth emphasizing thatduring this sub-period the city of Manaus showed the high-est NHWD increase for both indices. The city of Recifeshowed also a large and statistically significant positivetrend values regarding CTX90pct index (only surpassed bythe value recorded for Manaus). This result for Recife is inagreement with previous studies that identified a gradualincrease of extreme heat events, especially since the 1990sdecade over the northeast Brazilian region (Moura, 2016).São Paulo recorded positive and statistically significanttrend values although stronger for CTX90pct than the
CTN90pct index, confirming a more pronounced NHWDincrease based on maximum temperatures as shown inFigures 3(a) and (b). Rio de Janeiro was the city withthe lowest NHWD trend variations between indices andbetween the sub-periods of 1961–1980 and 1981–2014,presenting positive but statistically non-significant trends.
3.2. Regional atmospheric circulation
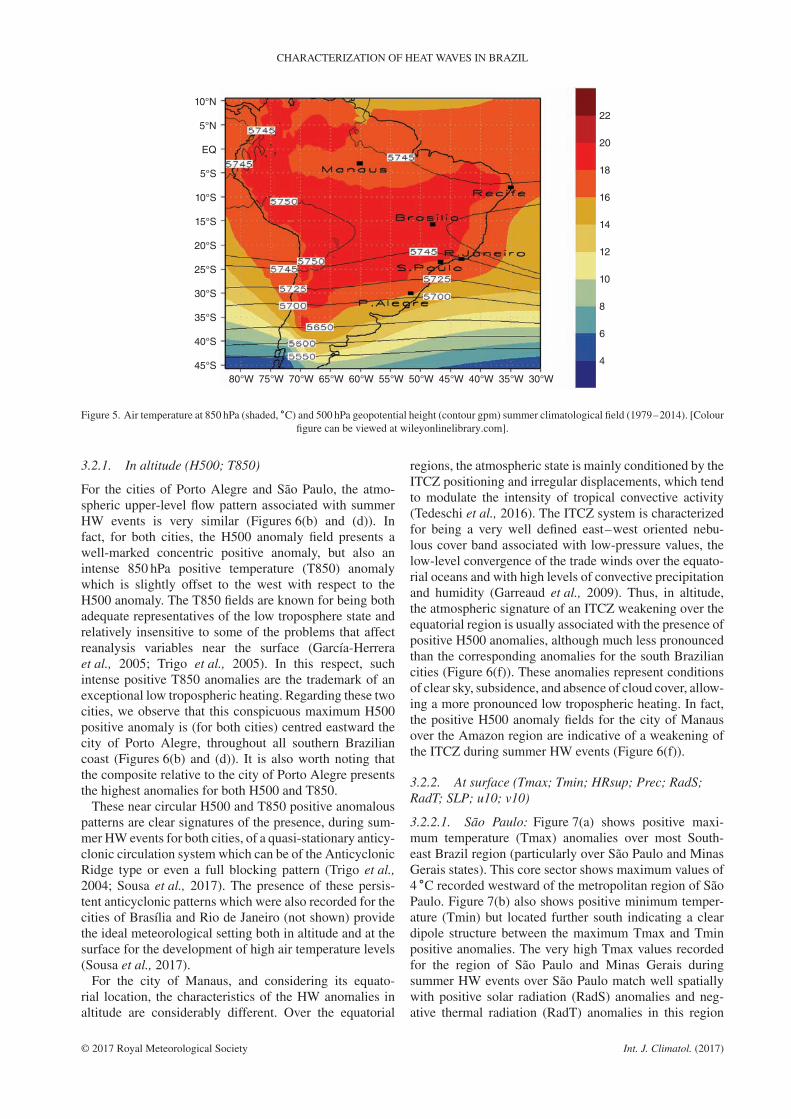
In this section, we characterize the average regional atmo-spheric circulation patterns associated with the formationof summer (DJF) HW periods over some Brazilian citiesas this is the season that can lead to more serious HWimpacts (Bastos et al., 2014; Son et al., 2016). To this pur-pose anomaly fields of several meteorological variablesare assessed through composites of summer HW events,which were obtained separately for each city. For the sakeof simplicity and due to space limitation we will focuson the cities of Porto Alegre, São Paulo, and Manaus.These composites were defined as the arithmetic meanscalculated for a sub-sample of the main analysis period,which correspond to particular intense summer HW timeperiods identified separately for each city and following amethodology already described in Section 2. The anomalyvalues represented here correspond to HW summer com-posites which are significantly different from the corre-sponding summer climatology at the 5% level, computedwith a two-tailed t-test. The summer climatology for twoimportant variables (H500 and T850) can be observed inFigure 5.
© 2017 Royal Meteorological Society Int. J. Climatol. (2017)
CHARACTERIZATION OF HEAT WAVES IN BRAZIL
10°N22
20
18
16
14
12
10
8
6
4
5°N
EQ
5°S
10°S
15°S
20°S
25°S
30°S
35°S
40°S
45°S80°W 75°W 70°W 65°W 60°W 55°W 50°W 45°W 40°W 35°W 30°W
Figure 5. Air temperature at 850 hPa (shaded, ∘C) and 500 hPa geopotential height (contour gpm) summer climatological field (1979–2014). [Colourfigure can be viewed at wileyonlinelibrary.com].
3.2.1. In altitude (H500; T850)
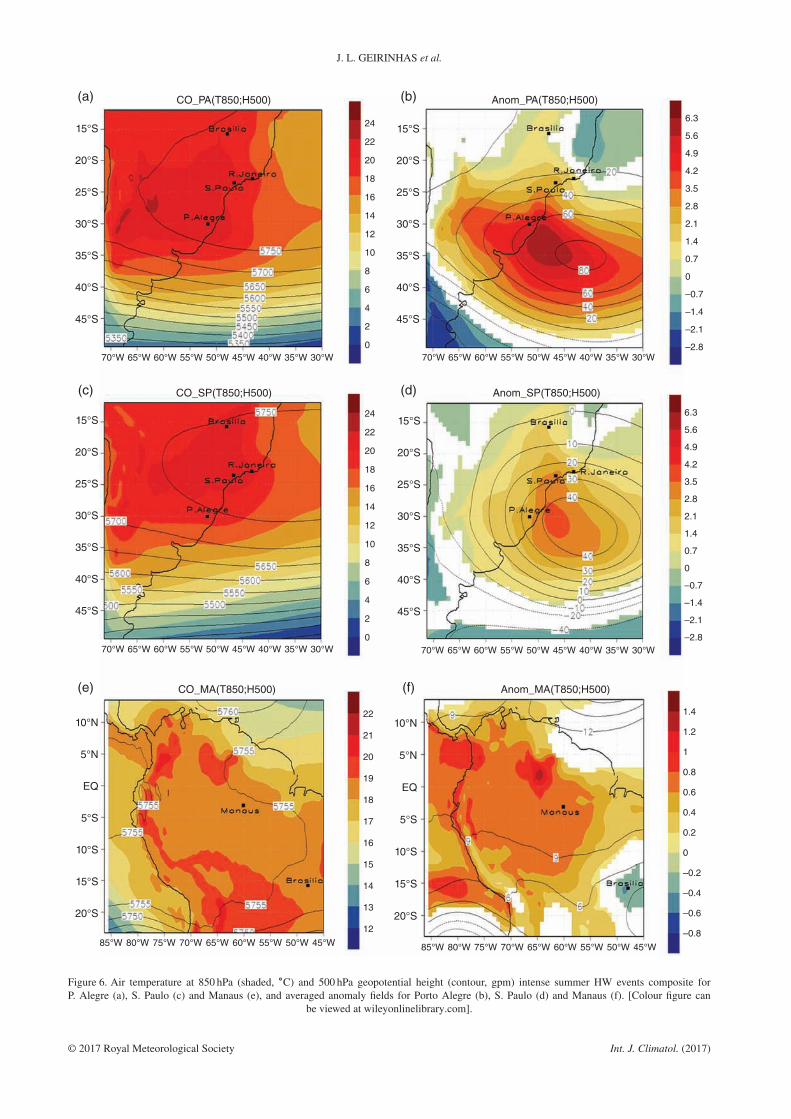
For the cities of Porto Alegre and São Paulo, the atmo-spheric upper-level flow pattern associated with summerHW events is very similar (Figures 6(b) and (d)). Infact, for both cities, the H500 anomaly field presents awell-marked concentric positive anomaly, but also anintense 850 hPa positive temperature (T850) anomalywhich is slightly offset to the west with respect to theH500 anomaly. The T850 fields are known for being bothadequate representatives of the low troposphere state andrelatively insensitive to some of the problems that affectreanalysis variables near the surface (García-Herreraet al., 2005; Trigo et al., 2005). In this respect, suchintense positive T850 anomalies are the trademark of anexceptional low tropospheric heating. Regarding these twocities, we observe that this conspicuous maximum H500positive anomaly is (for both cities) centred eastward thecity of Porto Alegre, throughout all southern Braziliancoast (Figures 6(b) and (d)). It is also worth noting thatthe composite relative to the city of Porto Alegre presentsthe highest anomalies for both H500 and T850.
These near circular H500 and T850 positive anomalouspatterns are clear signatures of the presence, during sum-mer HW events for both cities, of a quasi-stationary anticy-clonic circulation system which can be of the AnticyclonicRidge type or even a full blocking pattern (Trigo et al.,2004; Sousa et al., 2017). The presence of these persis-tent anticyclonic patterns which were also recorded for thecities of Brasília and Rio de Janeiro (not shown) providethe ideal meteorological setting both in altitude and at thesurface for the development of high air temperature levels(Sousa et al., 2017).
For the city of Manaus, and considering its equato-rial location, the characteristics of the HW anomalies inaltitude are considerably different. Over the equatorial
regions, the atmospheric state is mainly conditioned by theITCZ positioning and irregular displacements, which tendto modulate the intensity of tropical convective activity(Tedeschi et al., 2016). The ITCZ system is characterizedfor being a very well defined east–west oriented nebu-lous cover band associated with low-pressure values, thelow-level convergence of the trade winds over the equato-rial oceans and with high levels of convective precipitationand humidity (Garreaud et al., 2009). Thus, in altitude,the atmospheric signature of an ITCZ weakening over theequatorial region is usually associated with the presence ofpositive H500 anomalies, although much less pronouncedthan the corresponding anomalies for the south Braziliancities (Figure 6(f)). These anomalies represent conditionsof clear sky, subsidence, and absence of cloud cover, allow-ing a more pronounced low tropospheric heating. In fact,the positive H500 anomaly fields for the city of Manausover the Amazon region are indicative of a weakening ofthe ITCZ during summer HW events (Figure 6(f)).
3.2.2. At surface (Tmax; Tmin; HRsup; Prec; RadS;RadT; SLP; u10; v10)
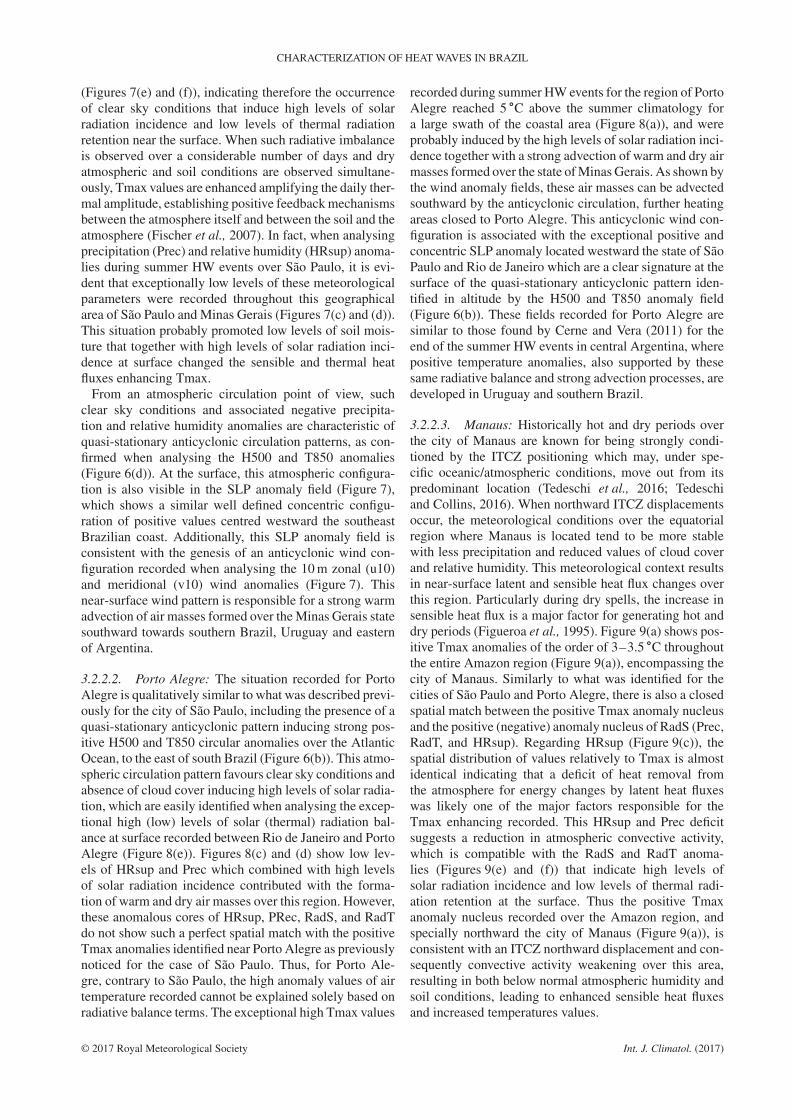
3.2.2.1. São Paulo: Figure 7(a) shows positive maxi-mum temperature (Tmax) anomalies over most South-east Brazil region (particularly over São Paulo and MinasGerais states). This core sector shows maximum values of4 ∘C recorded westward of the metropolitan region of SãoPaulo. Figure 7(b) also shows positive minimum temper-ature (Tmin) but located further south indicating a cleardipole structure between the maximum Tmax and Tminpositive anomalies. The very high Tmax values recordedfor the region of São Paulo and Minas Gerais duringsummer HW events over São Paulo match well spatiallywith positive solar radiation (RadS) anomalies and neg-ative thermal radiation (RadT) anomalies in this region
© 2017 Royal Meteorological Society Int. J. Climatol. (2017)
J. L. GEIRINHAS et al.
15°S
(a) (b)
(c) (d)
(e) (f)
CO_PA(T850;H500) Anom_PA(T850;H500)
CO_SP(T850;H500) Anom_SP(T850;H500)
CO_MA(T850;H500) Anom_MA(T850;H500)
24 6.3
5.6
4.9
4.2
3.5
2.8
2.1
1.4
0.7
0
–0.7
–1.4
–2.1
–2.8
6.3
5.6
4.9
4.2
3.5
2.8
2.1
1.4
0.7
0
–0.7
–1.4
–2.1
–2.8
1.4
1.2
1
0.8
0.6
0.4
0.2
0
–0.2
–0.4
–0.6
–0.8
22
20
18
16
14
12
10
8
6
4
2
0
24
22
20
18
16
14
12
10
8
6
4
2
0
22
21
20
19
18
17
16
15
14
13
12
20°S
25°S
30°S
35°S
40°S
45°S
70°W 65°W 60°W 55°W 50°W 45°W 40°W 35°W 30°W
15°S
20°S
25°S
30°S
35°S
40°S
45°S
70°W 65°W 60°W 55°W 50°W 45°W 40°W 35°W 30°W
70°W 65°W 60°W 55°W 50°W 45°W 40°W 35°W 30°W
70°W 65°W 60°W 55°W 50°W 45°W 40°W 35°W 30°W
85°W 80°W 75°W 70°W 65°W 60°W 55°W 50°W 45°W 85°W 80°W 75°W 70°W 65°W 60°W 55°W 50°W 45°W
15°S
20°S
25°S
30°S
35°S
40°S
45°S
10°N
5°N
EQ
5°S
10°S
15°S
20°S
10°N
5°N
EQ
5°S
10°S
15°S
20°S
15°S
20°S
25°S
30°S
35°S
40°S
45°S
Figure 6. Air temperature at 850 hPa (shaded, ∘C) and 500 hPa geopotential height (contour, gpm) intense summer HW events composite forP. Alegre (a), S. Paulo (c) and Manaus (e), and averaged anomaly fields for Porto Alegre (b), S. Paulo (d) and Manaus (f). [Colour figure can
be viewed at wileyonlinelibrary.com].
© 2017 Royal Meteorological Society Int. J. Climatol. (2017)
CHARACTERIZATION OF HEAT WAVES IN BRAZIL
(Figures 7(e) and (f)), indicating therefore the occurrenceof clear sky conditions that induce high levels of solarradiation incidence and low levels of thermal radiationretention near the surface. When such radiative imbalanceis observed over a considerable number of days and dryatmospheric and soil conditions are observed simultane-ously, Tmax values are enhanced amplifying the daily ther-mal amplitude, establishing positive feedback mechanismsbetween the atmosphere itself and between the soil and theatmosphere (Fischer et al., 2007). In fact, when analysingprecipitation (Prec) and relative humidity (HRsup) anoma-lies during summer HW events over São Paulo, it is evi-dent that exceptionally low levels of these meteorologicalparameters were recorded throughout this geographicalarea of São Paulo and Minas Gerais (Figures 7(c) and (d)).This situation probably promoted low levels of soil mois-ture that together with high levels of solar radiation inci-dence at surface changed the sensible and thermal heatfluxes enhancing Tmax.
From an atmospheric circulation point of view, suchclear sky conditions and associated negative precipita-tion and relative humidity anomalies are characteristic ofquasi-stationary anticyclonic circulation patterns, as con-firmed when analysing the H500 and T850 anomalies(Figure 6(d)). At the surface, this atmospheric configura-tion is also visible in the SLP anomaly field (Figure 7),which shows a similar well defined concentric configu-ration of positive values centred westward the southeastBrazilian coast. Additionally, this SLP anomaly field isconsistent with the genesis of an anticyclonic wind con-figuration recorded when analysing the 10 m zonal (u10)and meridional (v10) wind anomalies (Figure 7). Thisnear-surface wind pattern is responsible for a strong warmadvection of air masses formed over the Minas Gerais statesouthward towards southern Brazil, Uruguay and easternof Argentina.
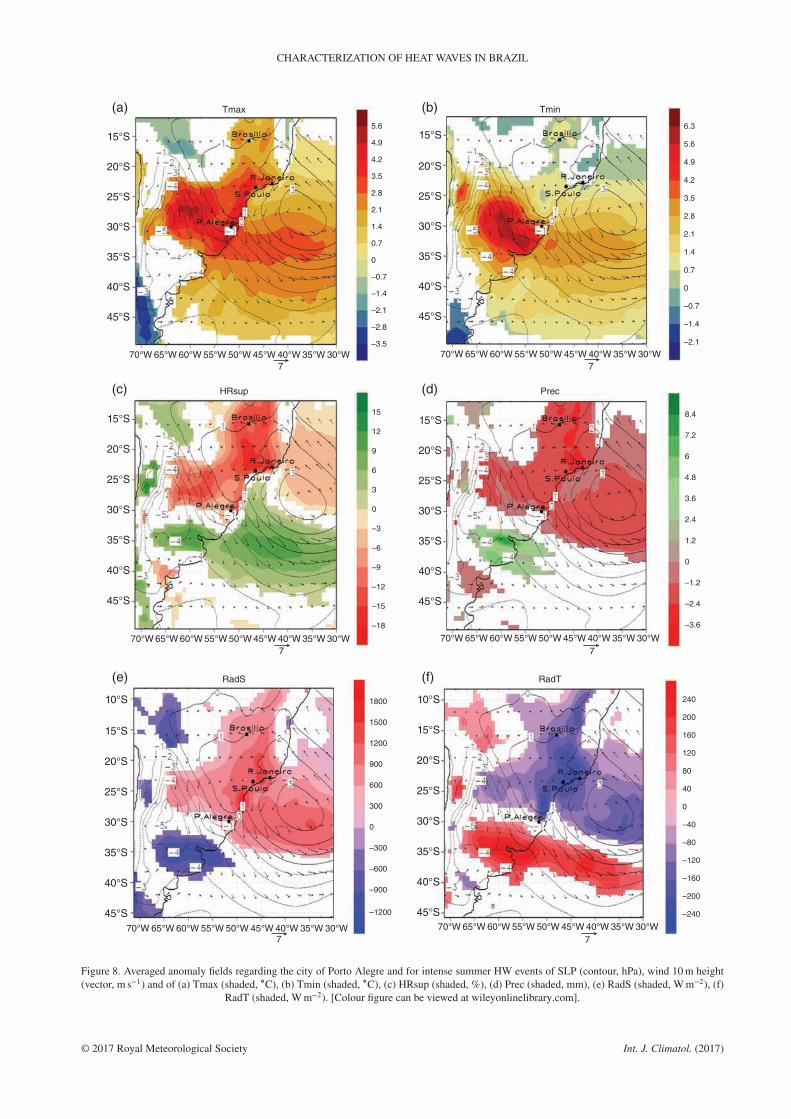
3.2.2.2. Porto Alegre: The situation recorded for PortoAlegre is qualitatively similar to what was described previ-ously for the city of São Paulo, including the presence of aquasi-stationary anticyclonic pattern inducing strong pos-itive H500 and T850 circular anomalies over the AtlanticOcean, to the east of south Brazil (Figure 6(b)). This atmo-spheric circulation pattern favours clear sky conditions andabsence of cloud cover inducing high levels of solar radia-tion, which are easily identified when analysing the excep-tional high (low) levels of solar (thermal) radiation bal-ance at surface recorded between Rio de Janeiro and PortoAlegre (Figure 8(e)). Figures 8(c) and (d) show low lev-els of HRsup and Prec which combined with high levelsof solar radiation incidence contributed with the forma-tion of warm and dry air masses over this region. However,these anomalous cores of HRsup, PRec, RadS, and RadTdo not show such a perfect spatial match with the positiveTmax anomalies identified near Porto Alegre as previouslynoticed for the case of São Paulo. Thus, for Porto Ale-gre, contrary to São Paulo, the high anomaly values of airtemperature recorded cannot be explained solely based onradiative balance terms. The exceptional high Tmax values
recorded during summer HW events for the region of PortoAlegre reached 5 ∘C above the summer climatology fora large swath of the coastal area (Figure 8(a)), and wereprobably induced by the high levels of solar radiation inci-dence together with a strong advection of warm and dry airmasses formed over the state of Minas Gerais. As shown bythe wind anomaly fields, these air masses can be advectedsouthward by the anticyclonic circulation, further heatingareas closed to Porto Alegre. This anticyclonic wind con-figuration is associated with the exceptional positive andconcentric SLP anomaly located westward the state of SãoPaulo and Rio de Janeiro which are a clear signature at thesurface of the quasi-stationary anticyclonic pattern iden-tified in altitude by the H500 and T850 anomaly field(Figure 6(b)). These fields recorded for Porto Alegre aresimilar to those found by Cerne and Vera (2011) for theend of the summer HW events in central Argentina, wherepositive temperature anomalies, also supported by thesesame radiative balance and strong advection processes, aredeveloped in Uruguay and southern Brazil.
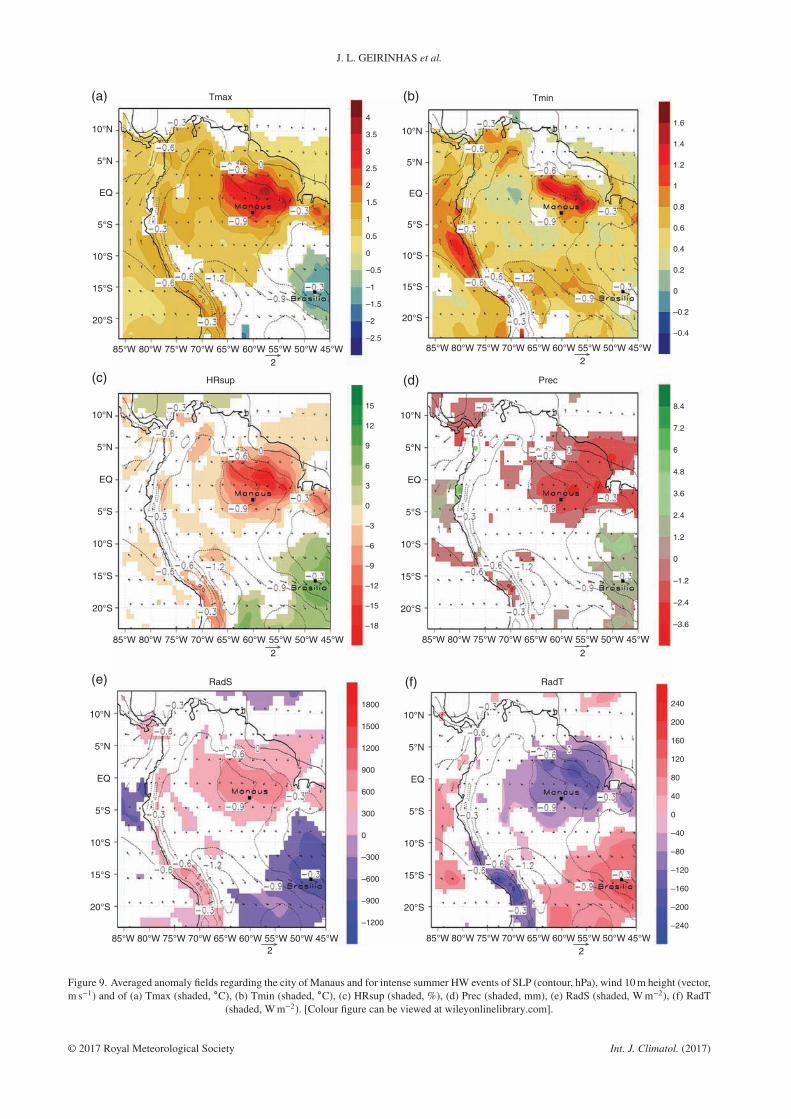
3.2.2.3. Manaus: Historically hot and dry periods overthe city of Manaus are known for being strongly condi-tioned by the ITCZ positioning which may, under spe-cific oceanic/atmospheric conditions, move out from itspredominant location (Tedeschi et al., 2016; Tedeschiand Collins, 2016). When northward ITCZ displacementsoccur, the meteorological conditions over the equatorialregion where Manaus is located tend to be more stablewith less precipitation and reduced values of cloud coverand relative humidity. This meteorological context resultsin near-surface latent and sensible heat flux changes overthis region. Particularly during dry spells, the increase insensible heat flux is a major factor for generating hot anddry periods (Figueroa et al., 1995). Figure 9(a) shows pos-itive Tmax anomalies of the order of 3–3.5 ∘C throughoutthe entire Amazon region (Figure 9(a)), encompassing thecity of Manaus. Similarly to what was identified for thecities of São Paulo and Porto Alegre, there is also a closedspatial match between the positive Tmax anomaly nucleusand the positive (negative) anomaly nucleus of RadS (Prec,RadT, and HRsup). Regarding HRsup (Figure 9(c)), thespatial distribution of values relatively to Tmax is almostidentical indicating that a deficit of heat removal fromthe atmosphere for energy changes by latent heat fluxeswas likely one of the major factors responsible for theTmax enhancing recorded. This HRsup and Prec deficitsuggests a reduction in atmospheric convective activity,which is compatible with the RadS and RadT anoma-lies (Figures 9(e) and (f)) that indicate high levels ofsolar radiation incidence and low levels of thermal radi-ation retention at the surface. Thus the positive Tmaxanomaly nucleus recorded over the Amazon region, andspecially northward the city of Manaus (Figure 9(a)), isconsistent with an ITCZ northward displacement and con-sequently convective activity weakening over this area,resulting in both below normal atmospheric humidity andsoil conditions, leading to enhanced sensible heat fluxesand increased temperatures values.
© 2017 Royal Meteorological Society Int. J. Climatol. (2017)
J. L. GEIRINHAS et al.
70°W 65°W 60°W 55°W 50°W 45°W 40°W3
35°W 30°W 70°W 65°W 60°W 55°W 50°W 45°W 40°W3
35°W 30°W
33
3
70°W 65°W 60°W 55°W 50°W 45°W 40°W 35°W 30°W
65°W 60°W 55°W 50°W 45°W 40°W3
35°W 30°W
10°S
Tmax Tmin
HRsup Prec
RadS RadT
15°S
20°S
25°S
30°S
35°S
40°S
45°S
70°W 65°W 60°W 55°W 50°W 45°W 40°W 35°W 30°W
10°S
15°S
20°S
25°S
30°S
35°S
40°S
45°S
70°W 65°W 60°W 55°W 50°W 45°W 40°W 35°W 30°W
10°S
15°S
20°S
25°S
30°S
35°S
40°S
45°S
10°S5.6 6.3
5.6
4.9
4.2
3.5
2.8
2.1
1.4
0.7
0
–0.7
–1.4
–2.1
4.9
4.2
3.5
2.8
2.1
1.4
0.7
0
–0.7
–1.4
–2.1
–2.8
–3.5
15 8.4
7.2
6
4.8
3.6
2.4
1.2
0
–1.2
–2.4
–3.6
240
200
160
120
80
40
0
–40
–80
–120
–160
–200
–240
12
9
6
3
0
–3
–6
–9
–12
–15
–18
1800
1500
1200
900
600
300
0
–300
–600
–900
–1200
15°S
20°S
25°S
30°S
35°S
40°S
45°S
10°S
15°S
20°S
25°S
30°S
35°S
40°S
10°S
15°S
20°S
25°S
30°S
35°S
40°S
45°S
(a) (b)
(c) (d)
(e) (f)
Figure 7. Averaged anomaly fields regarding the city of São Paulo and for intense summer HW events of SLP (contour, hPa), wind 10 m height(vector, m s−1)) and of (a) Tmax (shaded, ∘C), (b) Tmin (shaded, ∘C), (c) HRsup (shaded, %), (d) Prec (shaded, mm), (e) RadS (shaded, W m−2), (f)
RadT (shaded, W m−2). [Colour figure can be viewed at wileyonlinelibrary.com].
© 2017 Royal Meteorological Society Int. J. Climatol. (2017)
CHARACTERIZATION OF HEAT WAVES IN BRAZIL
15°S
20°S
25°S
30°S
35°S
40°S
45°S
70°W 65°W 60°W 55°W 50°W 45°W 40°W7
35°W 30°W 70°W 65°W 60°W 55°W 50°W 45°W 40°W7
35°W 30°W
70°W65°W60°W55°W50°W45°W40°W7
35°W30°W 70°W65°W60°W55°W50°W45°W40°W7
35°W30°W
70°W 65°W 60°W 55°W 50°W 45°W 40°W7
35°W 30°W 70°W 65°W 60°W 55°W 50°W 45°W 40°W7
35°W 30°W
15°S
20°S
25°S
30°S
35°S
40°S
45°S
15°S
20°S
25°S
30°S
35°S
40°S
45°S
10°S
15°S
20°S
25°S
30°S
35°S
40°S
45°S
10°S
15°S
20°S
25°S
30°S
35°S
40°S
45°S
15°S
20°S
25°S
30°S
35°S
40°S
45°S
Tmax Tmin
HRsup Prec
RadS RadT
(a) (b)
(c) (d)
(e) (f)
5.6
4.9
4.2
3.5
2.8
2.1
1.4
0.7
0
–0.7
–1.4
–2.1
–2.8
–3.5
15
12
9
6
3
0
–3
–6
–9
–12
–15
–18
1800
1500
1200
900
600
300
0
–300
–600
–900
–1200
6.3
5.6
4.9
4.2
3.5
2.8
2.1
1.4
0.7
0
–0.7
–1.4
–2.1
8.4
7.2
6
4.8
3.6
2.4
1.2
0
–1.2
–2.4
–3.6
240
200
160
120
80
40
0
–40
–80
–120
–160
–200
–240
Figure 8. Averaged anomaly fields regarding the city of Porto Alegre and for intense summer HW events of SLP (contour, hPa), wind 10 m height(vector, m s−1) and of (a) Tmax (shaded, ∘C), (b) Tmin (shaded, ∘C), (c) HRsup (shaded, %), (d) Prec (shaded, mm), (e) RadS (shaded, W m−2), (f)
RadT (shaded, W m−2). [Colour figure can be viewed at wileyonlinelibrary.com].
© 2017 Royal Meteorological Society Int. J. Climatol. (2017)
J. L. GEIRINHAS et al.
10°N4
1.6
1.4
1.2
1
0.8
0.6
0.4
0.2
0
–0.2
–0.4
8.4
7.2
6
4.8
3.6
2.4
1.2
0
–1.2
–2.4
–3.6
3.5
3
2.5
2
1.5
1
0.5
0
–0.5
–1
–1.5
–2
–2.5
15
12
9
6
3
0
–3
–6
–9
–12
–15
–18
1800 240
200
160
120
80
40
0
–40
–80
–120
–160
–200
–240
1500
1200
900
600
300
0
–300
–600
–900
–1200
5°N
EQ
5°S
10°S
15°S
20°S
85°W 80°W 75°W 70°W 65°W 60°W 55°W2
50°W 45°W 85°W 80°W 75°W 70°W 65°W 60°W 55°W2
50°W 45°W
85°W 80°W 75°W 70°W 65°W 60°W 55°W2 2
50°W 45°W 85°W 80°W 75°W 70°W 65°W 60°W 55°W 50°W 45°W
85°W 80°W 75°W 70°W 65°W 60°W 55°W2 2
50°W 45°W 85°W 80°W 75°W 70°W 65°W 60°W 55°W 50°W 45°W
10°N
5°N
EQ
5°S
10°S
15°S
20°S
10°N
5°N
EQ
5°S
10°S
15°S
20°S
10°N
5°N
EQ
5°S
10°S
15°S
20°S
10°N
5°N
EQ
5°S
10°S
15°S
20°S
10°N
5°N
EQ
5°S
10°S
15°S
20°S
Tmax Tmin
HRsup Prec
RadS RadT
(a) (b)
(c) (d)
(e) (f)
Figure 9. Averaged anomaly fields regarding the city of Manaus and for intense summer HW events of SLP (contour, hPa), wind 10 m height (vector,m s−1) and of (a) Tmax (shaded, ∘C), (b) Tmin (shaded, ∘C), (c) HRsup (shaded, %), (d) Prec (shaded, mm), (e) RadS (shaded, W m−2), (f) RadT
(shaded, W m−2). [Colour figure can be viewed at wileyonlinelibrary.com].
© 2017 Royal Meteorological Society Int. J. Climatol. (2017)
CHARACTERIZATION OF HEAT WAVES IN BRAZIL
4. Discussion
From a climatic point of view, results show a clear contrastover the NHWD values recorded for the different Brazil-ian cities and in some cases even for the same city betweenthe two investigated indices. Disparities on NHWD val-ues were identified for all statistical aspects here analysednamely the NHWD mean, the NHWD standard deviationvalues and also the trend values for the total analysis period(1961–2014) and for the sub-period (1981–2014). Despiteall disparities, cities like São Paulo, Manaus, Recife, andBrasília showed a clear statistically significant NHWDpositive trend since the 1980s decade which is in agree-ment with recent studies. Soares et al. (2017) show that thenear-surface temperature has been increasing over much ofSouth America during the period of 1975–2004, suggest-ing a particularly strong warming over central Brazil whichcan not be explained by natural climate variability alone.In particular, Ceccherini et al. (2016) and Bitencourt et al.(2016) highlighted the increase in intensity and in the fre-quency of HWs in South America and in Brazil since 2000,associated with a faster increasing in maximum temper-ature compared to the minimum temperature. The north-east Brazilian region has been recording since 1974, anincrease of the number and intensity of positive thermalanomalies (Moura, 2016). Almeida et al. (2017) recordedfor the Amazon region and for the period 1980–2014, verysignificant positive trend values for both maximum andminimum temperatures, which is in agreement with ourresults that show for both indices a strong positive andsignificant NHWD trend for the city of Manaus and forthe sub-period 1981–2014. We recognize that urban heatislands and deforestation/land use may have an importantrole for the development of HWs here investigated andtherefore enhance the impacts of extreme climate events.Recent studies indicate that this region has experiencedboth effects (urbanization and land use and cover change)in the last four decades (de Souza et al., 2016; Omettoet al., 2016). The exceptional high NHWD values recordedsince the beginning of 21st century and especially for theyears of 2005 and 2010 regarding the city of Manaus arerepresentative of the abnormally hot and dry periods thathave been observed in this region. The extreme 2005 and2010 Amazon droughts events resulted in part from thewarming of the Tropical North Atlantic SST and of theco-occurrence of an El Niño in the particular case of 2010(Marengo and Espinoza, 2016; Panisset et al., 2017).
Concerning the regional atmospheric circulation ofsummer HW episodes for the cities of Manaus, São Pauloand Porto Alegre, it is clear that in all cases the HWgenesis is closely related to a very well defined radiativeenergy transfer pattern. This configuration is defined byexceptionally high values of solar radiative incidence atthe surface, which is associated with dry meteorologicalconditions represented here by negative precipitation andrelative humidity anomalies. This relationship between thesummer HW episodes and such radiative and dry meteoro-logical scenario is supported on the almost perfect spatialmatch between the Tmax, Prec, HRsup, RadS, and RadT
anomalies, also found in other studies which notice thatduring the hot and dry Amazon years of 2005 and 2010 thesolar radiation levels at surface and the land surface tem-perature values were above normal (Panisset et al., 2017).
Due to the different geographical localizations, thehigh-level atmospheric circulation patterns responsible forthese specific radiative and dry meteorological scenariosare not the same for the three cities here investigated:Manaus, São Paulo, and Porto Alegre. The city of Manausis situated within the north and equatorial Brazilianregion, where the atmospheric configuration is influencedby the Tropical Atlantic Ocean and tends to experiencewet meteorological conditions in association with activeITCZ episodes, favouring convective activity over thisregion. Throughout the seasonal cycle, ITCZ presentsvery well defined migration mechanisms responsible forthe observed climatic conditions, namely in what concernswater vapour transport and precipitation levels over theequatorial and central South America. This migration con-stancy led some authors to describe the north and centralSouth America climate as making part of the monsoontype (Jones and Carvalho, 2002; Vera et al., 2006). Theweakening of the convective activity and the decrease ofthe water vapour content over northern South America,which is connected to the development of above normaldry and hot conditions at the surface, is the result of excep-tional intense northward ITCZ displacements (Tedeschiet al., 2016; Tedeschi and Collins, 2016). Northward ITCZdisplacements are related to SST anomalies over the NorthTropical Atlantic Ocean (Zeng et al., 2008) and to ENSO,that tend to influence the normal wind pattern, the levels oftemperature and atmospheric convective activity through-out this region (Grimm, 2003; Andreoli et al., 2017).
Based on the anomaly fields description this work helpedto establish a relationship between summer HW events inManaus and above the normal clear sky and dry condi-tions, likely promoted by ITCZ northward displacementsassociated with meridional SST gradients over the Trop-ical North Atlantic Ocean. This relationship was docu-mented in previous studies through negative correlationbetween the abnormal SST values and Amazonian precip-itation and river flow levels (Aragão et al., 2007; Marengoet al., 2008; Coelho et al., 2012; Panisset et al., 2017).
Regarding the cities of São Paulo and Porto Alegre, thequasi-stationary anticyclonic atmospheric circulation pat-tern that provided the ideal radiative and dry meteorologi-cal conditions for the development of summer HW events,was likely promoted by a westward migration of the SouthAtlantic Subtropical High System. During the summer, the500 hPa flow pattern, which guides the baroclinic waves(cold fronts on the surface), moves to higher latitudes,allowing the Subtropical High to prevail in the SouthernAtlantic close to the continent. This move towards SWhinders the passage of frontal systems that usually affectthe south, southeast and central-west regions of Brazil.Under these conditions, subsidence prevails promotingdecreased atmospheric humidity, reduced cloudiness (i.e.clear sky conditions prevail) and high levels of solar radi-ation incidence at the surface (Sousa et al., 2017). This
© 2017 Royal Meteorological Society Int. J. Climatol. (2017)
J. L. GEIRINHAS et al.
radiative and dry meteorological pattern was identified forboth São Paulo and Porto Alegre HW conditions, whichpresented a considerable spatial match between Tmax,RadS, RadT, Prec, HRsup anomalies. Those results are inagreement with previous studies which shows the influ-ence of the South Atlantic Convergence Zone (SACZ) onHWs occurrences over subtropical South America (Cerneet al., 2007; Cerne and Vera, 2011; Hannart et al., 2015).Over the southeast Brazilian region where the city of SãoPaulo is located, the presence of this anticyclone pat-tern is associated with a reduced in the number of SACZepisodes. The SACZ, similarly to the ITCZ, is character-ized by a well-defined northwest-southeast oriented nebu-lous cover band associated with high levels of precipitationand humidity and to wet meteorological conditions. Dur-ing austral summer the SACZ is essential for defining pre-cipitation variability over the central west and southeastregions of Brazil. Eventual reduction of SACZ episodesover these regions in association with westward migrationof the South Atlantic Subtropical High, which in turn canbe related to SST anomalies over the South Atlantic Ocean,can lead to abnormally warm and dry conditions in theseregions (Otto et al., 2015; Coelho et al., 2016).
Porto Alegre is situated further south from all the othercities considered in an extratropical region. The climateover this Brazilian region is also strongly determined bythe South Atlantic High positioning. Under high-pressureconditions, clouds are absent and consequently high lev-els of solar radiation incidence are received at the surface.Thus, in similarity with São Paulo, a westward migrationof the Atlantic Subtropical high helps to explain the persis-tent anticyclonic circulation pattern identified for summerHW events over Porto Alegre associated with abnormallydry conditions and increased solar radiation incidence atthe surface that lead to the development of exceptionallyhigh temperatures. This configuration was also responsi-ble for a strongly southward advection of hot and dry airmasses from the region of Minas Gerais.
The establishment of this persistent anticyclonic circu-lation pattern centred over the southwest South AtlanticOcean to the east of the southeast Brazilian regions canalso be linked to strengthening the final part of the SouthAmerican Low-Level Jet (SALLJ). The SALLJ, the SACZ,and the ITCZ are all part of South America Monsoon Sys-tem. The SALLJ is a low-level atmospheric jet located overthe eastern border of the Andes mountain range, betweenthe latitudes of 20–40∘S. During the summer this low-leveljet is induced by the tropical North Atlantic trade windswhich suffer a southeast deflection promoted by the Andesmountain range (Marengo et al., 2004). Thus SALLJ isresponsible for transporting large amounts of moisturefrom the Amazon basin to south and Southeast Brazilianregions (Gimeno et al., 2016) and therefore predominantlydry and warm periods over these Brazilian regions arecommonly associated with the SALLJ weakening (Lieb-mann et al., 2004). The wind anomalies of Figure 8 show,particularly between 25 and 30∘S, an enhanced south-ward flow, suggesting a strengthened LLJAS induced bythe anticyclonic circulation. Such a strengthened SALLJ
contributes with an anomalous transport of water vapoursouthward, resulting in positive RadT (Figure 8(f)) andHRsup (Figure 8(c)) anomalies.
5. Conclusions
The overwhelming majority of future climate scenariospoint out for an increase of extreme climate events likeHWs, partially due to the anthropogenic component (Fis-cher and Knutti, 2015; Ouzeau et al., 2016). It is, therefore,necessary to describe and understand more accurately thebridge between these extreme events and several impactsthat may result from them for the human activity. Thisreveals to be even more important in regions such as SouthAmerica and especially Brazil where, despite the invest-ment over the last years in investigating the relation ofHWs with public health and with certain economic sec-tors, there is a clear gap of studies analysing the topicfrom a purely atmospheric and climatic perspective. Thewide range of HWs impacts across many different sec-tors implies that in most cases their definitions are broadand ambiguous. Taking into account all these aspects, thisstudy presents an objective climatic HW characterizationfor six Brazilian cities over the most recent decades, basedon two indices to define HWs.
It is interesting to notice some distinction in results whenassessing the evolution of HW events throughout Brazilaccording to the use of the definition being based on themaximum or minimum temperature. Corroborating previ-ous works, this study also identified positive and statisti-cally significant HW frequency trends over the 1981–2014period for all investigated cities but particularly strongfor the cities of São Paulo, Recife and Manaus. Besidesregional warming induced by climate change, the posi-tive identified trends are also related to urban heat islandand deforestation use effects. Furthermore, the ENSO phe-nomenon and sea breeze circulation may also play animportant role in enhancing and/or weakening regionaltemperature conditions. Using reanalysis fields in respectto several meteorological variables it was also possibleto establish the bridge between the summer HW eventsand the main regional atmospheric systems acting overSouth America. The radiative balance at the surface hasbeen found to be the main and fundamental factor respon-sible for the development of summer HWs in Manaus,São Paulo, and Porto Alegre. The excessive solar radiativeflux and associated lack of soil moisture imply changes inthe near-surface latent and sensible heat fluxes namely anincrease in sensible heat flux that represents a major factorfor triggering an HW event.
The methodology adopted in this study is very rele-vant as, to the best of our knowledge, there has neverbeen a comprehensive assessment of HWs for Brazil,evaluating various regions and including an exten-sive atmospheric regional circulation component. Thisapproach provides robust climatic and meteorologicalsupport for future studies seeking to understand theassociated HWs impacts. Possible improvements of thecurrent analysis should be addressed in future studies, for
© 2017 Royal Meteorological Society Int. J. Climatol. (2017)
CHARACTERIZATION OF HEAT WAVES IN BRAZIL
instance, considering the intensity and persistence of HWevents.
This work can also be used for diagnosing general circu-lation models control runs and evaluating future climaticscenarios. With this in mind, it is fundamental to invest inthis type of analysis for both additional Brazilian regionsand meteorological variables driving efforts to improve themeteorological station data network in order to use otherHW definitions and meteorological variables that can com-plement this type of approaches.
Despite the characterization of HW events and associ-ated climate anomalies in atmospheric parameters, impactsremain to be investigated in the region. Several studiesapplied to Brazil established a relationship between theoccurrence of periods marked by high temperatures (oftenaccompanied by high air pollution levels) and an increasein deaths related to cardiovascular/cerebrovascular acci-dents and respiratory diseases (Gouveia et al., 2003; Hajatet al., 2005; Bell et al., 2008). From an economic point ofview, some studies show that the occurrence of exception-ally high temperatures in Brazil can be related to short-ages in agriculture and animal production (Gusso et al.,2003; McKechnie and Wolf, 2010; Olesen et al., 2011) andincreases in energy consumption due to air conditioningdemand. All these socio-economic impacts are particularlyrelevant in vast countries like Brazil that present a widerange of ecoregions, a large and diverse population andwith several economic sectors heavily weather dependent(e.g. agriculture, animal production, natural resources, andenergy production). Based on climatic change scenarios, itis projected that at the end of the 21st century some coun-ties located in northern Brazil are likely to be particularlyaffected by high rates of temperature increase, and takinginto account the low wealth levels per capita in this region,it is envisaged that a fraction of the poorest population willsuffer serious health and economic damages (Costa et al.,2015).
Acknowledgements
The research was supported by FAPESP/FCT ProjectBrazilian Fire-Land-Atmosphere System (1389/2014and 2015/01389-4), RMT and RL were partially sup-ported by FAPERJ, respectively, by the Visiting programfunded (E-26/200.636/2016) and the Thematic program(E-26/210.904/2015). CASC was supported by CNPq,process 304586/2016-1. We also acknowledge the supportprovided by FAPESP CLIMAX project (2015/50687-8).
References
Alexander LV, Zhang X, Peterson TC, Caesar J, Gleason B, Klein TankAMG, Haylock M, Collins D, Trewin B, Rahimzadeh F, Tagipour A,Rupa Kumar K, Revadekar J, Griffiths G, Vincent L, Stephenson DB,Burn J, Aguilar E, Brunet M, Taylor M, New M, Zhai P, Rusticucci M,Vazquez-Aguirre JL. 2006. Global observed changes in daily climateextremes of temperature and precipitation. J. Geophys. Res. 111(D5):D05109. https://doi.org/10.1029/2005JD006290.
Almeida CT, Oliveira-Júnior JF, Delgado RC, Cubo P, Ramos MC.2017. Spatiotemporal rainfall and temperature trends throughout
the Brazilian legal Amazon, 1973-2013. Int. J. Climatol. 37(4):2013–2026. https://doi.org/10.1002/joc.4831.
Andreoli RV, de Oliveira SS, Kayano MT, Viegas J, de Souza RAF,Candido LA. 2017. The influence of different el Niño types on thesouth American rainfall. Int. J. Climatol. 37: 1374–1390. https://doi.org/10.1002/joc.4783.
Aragão LEOC, Malhi Y, Roman-Cuesta RM, Saatchi S, Anderson LO,Shimabukuro YE. 2007. Spatial patterns and fire response of recentAmazonian droughts. Geophys. Res. Lett. 34(7): 1–5. https://doi.org/10.1029/2006GL028946.
Barriopedro D, Fischer EM, Luterbacher J, Trigo RM, García-HerreraR. 2011. The hot summer of 2010: redrawing the temperature recordmap of Europe. Science 332(6026): 220–224.
Bastos A, Gouveia CM, Trigo RM, Running SW. 2014. Analysing thespatio-temporal impacts of the 2003 and 2010 extreme heatwaveson plant productivity in Europe. Biogeosciences 11(13): 3421–3435.https://doi.org/10.5194/bg-11-3421-2014.
Bell ML, O’Neill MS, Ranjit N, Borja-Aburto VH, Cifuentes LA,Gouveia NC. 2008. Vulnerability to heat-related mortality in LatinAmerica: a case-crossover study in Sao Paulo, Brazil, Santiago, Chileand Mexico City, Mexico. Int. J. Epidemiol. 37(4): 796–804. https://doi.org/10.1093/ije/dyn094.
Bitencourt DP, Fuentes MV, Maia PA, Amorim FT, Bitencourt DP,Fuentes MV, Maia PA, Amorim FT. 2016. Frequência, Duração,Abrangência Espacial e Intensidadedas Ondas de Calor no Brasil.Rev. Brasi. Meteorol. 31(4): 506–517. https://doi.org/10.1590/0102-778631231420150077.
Black E, Blackburn M, Harrison G, Hoskins B, Methven J. 2004. Factorscontributing to the summer 2003 European heatwave. Weather 59(8):217–223. https://doi.org/10.1256/wea.74.04.
Ceccherini G, Russo S, Ameztoy I, Patricia Romero C, Carmona-MorenoC. 2016. Magnitude and frequency of heat and cold waves in recentdecades: the case of South America. Nat. Hazards Earth Syst.Sci.16(3): 821–831. https://doi.org/10.5194/nhess-16-821-2016.
Cerne SB, Vera CS. 2011. Influence of the intraseasonal variability onheat waves in subtropical South America. Clim. Dyn. 36(11–12):2265–2277. https://doi.org/10.1007/s00382-010-0812-4.
Cerne SB, Vera CS, Liebmann B. 2007. The nature of a heat wave ineastern Argentina occurring during SALLJEX. Mon. Weather Rev.135(3): 1165–1174. https://doi.org/10.1175/MWR3306.1.
Coelho CAS, Ferro CAT, Stephenson DB, Steinskog DJ. 2008. Methodsfor exploring spatial and temporal variability of extreme events inclimate data. J. Clim. 21(10): 2072–2092. https://doi.org/10.1175/2007JCLI1781.1.
Coelho CAS, Cavalcanti IAF, Costa S, Freitas SR, Ito ER, Luz G, SantosAF, Nobre CA, Marengo JA, Pezza AB. 2012. Climate diagnostics ofthree major drought events in the Amazon and illustrations of theirseasonal precipitation predictions. Meteorol. Appl. 19(2): 237–255.
Coelho CAS, Cardoso DHF, Firpo MAF. 2016. Precipitation diagnosticsof an exceptionally dry event in São Paulo, Brazil. Theor. Appl.Climatol. 125(3–4): 769–784. https://doi.org/10.1007/s00704-015-1540-9.
Costa D, Hacon SS, Siqueira A, Pinheiro S, Gonçalves KS, Oliveira A,Cox P. 2015. Municipal temperature and heatwave predictions as atool for integrated socio-environmental impact analysis in Brazil. Am.J. Clim. Change 4: 385–396.
Dole R, Hoerling M, Perlwitz J, Eischeid J, Pegion P, Zhang T, QuanX-W, Xu T, Murray D. 2011. Was there a basis for anticipating the2010 Russian heat wave? Geophys. Res. Lett. 38(6): L06702. https://doi.org/10.1029/2010GL046582.
Figueroa SN, Satyamurty P, Da Silva Dias PL. 1995. Simulations ofthe summer circulation over the south American region with an etacoordinate model. J. Atmos. Sci. 52(10): 1573–1584.
Fischer EM, Knutti R. 2015. Anthropogenic contribution to global occur-rence of heavy-precipitation and high-temperature extremes. Nat.Clim. Change 5: 560–564. https://doi.org/10.1038/NCLIMATE2617.
Fischer EM, Seneviratne SI, Vidale PL, Lüthi D, Schär C. 2007. Soilmoisture–atmosphere interactions during the 2003 European sum-mer heat wave. J. Clim. 20(20): 5081–5099. https://doi.org/10.1175/JCLI4288.1.
Frich P, Alexander L, Della-Marta P, Gleason B, Haylock M, Klein TankA, Peterson T. 2002. Observed coherent changes in climatic extremesduring the second half of the twentieth century. Clim. Res. 19(3):193–212. https://doi.org/10.3354/cr019193.
García-Herrera R, Díaz J, Trigo RM, Hernández E. 2005. Extremesummer temperatures in Iberia: health impacts and associated synopticconditions. Ann. Geophys. 23(2): 239–251. https://doi.org/10.5194/angeo-23-239-2005.
© 2017 Royal Meteorological Society Int. J. Climatol. (2017)
J. L. GEIRINHAS et al.
García-Herrera R, Díaz J, Trigo RM, Luterbacher J, Fischer EM.2010. A review of the European summer heat wave of 2003. Crit.Rev. Environ. Sci. Technol. 40(4): 267–306. https://doi.org/10.1080/10643380802238137.
Garreaud RD, Vuille M, Compagnucci R, Marengo J. 2009. Present-daysouth American climate. Palaeogeogr. Palaeoclimatol. Palaeoecol.281(3): 180–195. https://doi.org/10.1016/j.palaeo.2007.10.032.
Gimeno L, Dominguez F, Nieto R, Trigo R, Drumond A, Reason CJC,Taschetto AS, Ramos AM, Kumar R, Marengo J. 2016. Major mech-anisms of atmospheric moisture transport and their role in extremeprecipitation events. Annu. Rev. Env. Resour. 41(1): 117–141.
Gosling SN, McGregor GR, Lowe JA. 2009. Climate change andheat-related mortality in six cities part 2: climate model evaluation andprojected impacts from changes in the mean and variability of temper-ature with climate change. Int. J. Biometeorol. 53(1): 31–51. https://doi.org/10.1007/s00484-008-0189-9.
Gouveia N, Hajat S, Armstrong B. 2003. Socioeconomic differentialsin the temperature-mortality relationship in São Paulo, Brazil. Int. J.Epidemiol. 32(3): 390–397. https://doi.org/10.1093/ije/dyg077.
Grimm AM. 2003. The el Niño impact on the summer monsoon in Brazil:regional processes versus remote influences. J. Clim. 16(2): 263–280.https://doi.org/10.1175/1520-0442.
Gusso A, Ducati JR, Veronez MR, Sommer V, Gonzaga L, SilveiraJunior D. 2003. Monitoring heat waves and their impacts on summercrop development in southern Brazil. Agric. Sci. 5(5): 353–364.https://doi.org/10.4236/as.2014.54037.
Hajat S, Armstrong BG, Gouveia N, Wilkinson P. 2005. Mortalitydisplacement of heat-related deaths: a comparison of Delhi, São Paulo,and London. Epidemiology 16(5): 613–620.
Hannart A, Vera C, Otto FEL, Cerne B. 2015. Causal influence ofanthropogenic forcings on the Argentinian heat wave of December2013. Bull. Am. Meteorol. Soc. 96(12): S41–S45.
IPCC. 2014. Climate change 2014: impacts, adaptation, and vulnerabil-ity. Part B: Regional aspects. In Contribution of Working Group II tothe Fifth Assessment Report of the Intergovernmental Panel on Cli-mate Change, Barros VR, Field CB, Dokken DJ, Mastrandrea MD,Mach KJ, Bilir TE, Chatterjee M, Ebi KL, Estrada YO, Genova RC,Girma B, Kissel ES, Levy AN, MacCracken S, Mastrandrea PR, WhiteLL (eds). Cambridge University Press: Cambridge, United Kingdomand New York, NY, 688.
Jones C, Carvalho LMV. 2002. Active and break phases in the southAmerican monsoon system. J. Clim. 15(8): 905–914.
Liebmann B, Kiladis GN, Vera CS, Saulo AC, Carvalho LMV. 2004.Subseasonal variations of rainfall in South America in the vicinity ofthe low-level jet east of the Andes and comparison to those in the SouthAtlantic convergence zone. J. Clim. 17(19): 3829–3842.
Linares C, Diaz J. 2008. Impact of high temperatures on hospital admis-sions: comparative analysis with previous studies about mortality(Madrid). Eur. J. Public Health 18(3): 317–322. https://doi.org/10.1093/eurpub/ckm108.
Luterbacher J, Dietrich D, Xoplaki E, Grosjean M, Wanner H. 2004.European seasonal and annual temperature variability, trends andextremes since 1500. Science 303: 1499–1503. https://doi.org/10.1126/science.1093877.
Marengo JA, Camargo CC. 2008. Surface air temperature trends insouthern Brazil for 1960–2002. Int. J. Climatol. 28(7): 893–904.https://doi.org/10.1002/joc.1584.
Marengo JA, Espinoza JC. 2016. Extreme seasonal droughts and floodsin Amazonia: causes, trends and impacts. Int. J. Climatol. 36(3):1033–1050. https://doi.org/10.1002/joc.4420.
Marengo JA, Soares WR, Saulo C, Nicolini M. 2004. Climatology ofthe low-level jet east of the Andes as derived from the NCEP–NCARReanalyses: characteristics and temporal variability. J. Clim. 17(12):2261–2280.
Marengo JA, Nobre CA, Tomasella J, Oyama MD, Sampaio de OliveiraG, De Oliveira R, Camargo H, Alves LM, Brown IF, de Oliveira GS,De Oliveira R, Camargo H, Alves LM, Brown IF. 2008. The drought ofAmazonia in 2005. J. Clim. 21(3): 495–516. https://doi.org/10.1175/2007JCLI1600.1.
McKechnie AE, Wolf BO. 2010. Climate change increases the likelihoodof catastrophic avian mortality events during extreme heat waves. Biol.Lett. 6(2): 253–256.
Meehl GA, Tebaldi C. 2004. More intense, more frequent, and longerlasting heat waves in the 21st century. Science 305(5686): 994–997.
Moura MO. 2016. Anomalias das Temperaturas Extremas do Ar emFortaleza, Ceará, Brasil (Anomalies of Extreme Air Temperatures inFortaleza, CE, Brazil). Rev. Brasil. Geogr. Física 8(6): 1588–1600.https://doi.org/10.5935/RBGF.V8I6.1535.
Olesen JE, Trnka M, Kersebaum KC, Skjelvåg AO, Seguin B,Peltonen-Sainio P, Rossi F, Kozyra J, Micale F. 2011. Impacts andadaptation of European crop production systems to climate change.Eur. J. Agron. 34(2): 96–112. https://doi.org/10.1016/j.eja.2010.11.003.
Ometto JP, Sousa-Neto ER, Tejada G. 2016. Land Use, Land Cover andLand Use Change in the Brazilian Amazon (1960–2013). Springer:Berlin, Heidelberg, 369–383. https://doi.org/10.1007/978-3-662-49902-3_15.
Otto FEL, Coelho CAS, King A, De Perez EC, Wada Y, Van OldenborghGJ, Haarsma R, Haustein K, Uhe P, Van Aalst M, Aravequia JA,Almeida W, Cullen H. 2015. Factors other than climate change,main drivers of 2014/15 water shortage in southeast Brazil. Bull. Am.Meteorol. Soc. 96(12): S35–S40. https://doi.org/10.1175/BAMS-D-15-00120.1.
Ouzeau G, Soubeyroux J-M, Schneider M, Vautard R, Planton S. 2016.Heat waves analysis over France in present and future climate: appli-cation of a new method on the EURO-CORDEX ensemble. Clim. Serv.4: 1–12. https://doi.org/10.1016/j.cliser.2016.09.002.
Panisset JS, Libonati R, Gouveia CMP, Machado-Silva F, França DA,França JRA, Peres LF. 2017. Contrasting patterns of most extremedrought episodes of 2005, 2010 and 2015 in the Amazon Basin. Int. J.Climatol. https://doi.org/10.1002/joc.5224.
Pereira MG, Trigo RM, da Camara CC, Pereira JMCC, Leite SM.2005. Synoptic patterns associated with large summer forest fires inPortugal. Agric. For. Meteorol. 129(1–2): 11–25. https://doi.org/10.1016/j.agrformet.2004.12.007.
Perkins SE. 2011. Biases and model agreement in projections of climateextremes over the tropical Pacific. Earth Interact. 15(24): 1–36.https://doi.org/10.1175/2011EI395.1.
Perkins SE, Alexander LV. 2013. On the measurement of heatwaves. J. Clim. 26(13): 4500–4517. https://doi.org/10.1175/JCLI-D-12-00383.1.
Renom M, Rusticucci M, Barreiro M. 2011. Multidecadal changes in therelationship between extreme temperature events in Uruguay and thegeneral atmospheric circulation. Clim. Dyn. 37(11–12): 2471–2480.https://doi.org/10.1007/s00382-010-0986-9.
Rusticucci M. 2012. Observed and simulated variability of extremetemperature events over South America. Atmos. Res. 106: 1–17.https://doi.org/10.1016/j.atmosres.2011.11.001.
Rusticucci M, Kyselý J, Almeira G, Lhotka O. 2016. Long-term variabil-ity of heat waves in Argentina and recurrence probability of the severe2008 heat wave in Buenos Aires. Theor. Appl. Climatol. 124(3–4):679–689. https://doi.org/10.1007/s00704-015-1445-7.
Rusticucci M, Barrucand M, Collazo S. 2017. Temperature extremesin the Argentina central region and their monthly relationship withthe mean circulation and ENSO phases. Int. J. Climatol. 37(6):3003–3017. https://doi.org/10.1002/joc.4895.
Silva P, Bastos A, DaCamara CC, Libonati R. 2016. Future projec-tions of fire occurrence in Brazil using EC-earth climate model.Rev. Brasil. Meteorol. 31(3): 288–297. https://doi.org/10.1590/0102-778631320150142.
Skansi M, Brunet M, Sigró J, Aguilar E, Arevalo Groening JA, BentancurOJ, Castellón Geier YR, Correa Amaya RL, Jácome H, MalheirosRamos A, Oria Rojas C, Pasten AM, Sallons Mitro S, VillaroelJiménez C, Martínez R, Alexander LV, Jones PD. 2013. Warming andwetting signals emerging from analysis of changes in climate extremeindices over South America. Global Planet. Change 100: 295–307.https://doi.org/10.1016/j.gloplacha.2012.11.004.
Soares DDB, Lee H, Loikith PC. 2017. Can significant trends be detectedin surface air temperature and precipitation over South America inrecent decades? Int. J. Climatol. 1493: 1483–1493. https://doi.org/10.1002/joc.4792.
Son J-Y, Gouveia N, Bravo MA, de Freitas CU, Bell ML. 2016. Theimpact of temperature on mortality in a subtropical city: effects ofcold, heat, and heat waves in São Paulo, Brazil. Int. J. Biometeorol.60(1): 113–121. https://doi.org/10.1007/s00484-015-1009-7.
Sousa PM, Trigo RM, Barriopedro D, Soares PMM, Ramos AM, Lib-erato MLR. 2017. Responses of European precipitation distributionsand regimes to different blocking locations. Clim. Dyn. 48(3–4):1141–1160. https://doi.org/10.1007/s00382-016-3132-5.
de Souza DO, Alvalá RC dos S, do NMG. 2016. Urbanization effectson the microclimate of Manaus: a modeling study. Atmos. Res. 167:237–248. https://doi.org/10.1016/j.atmosres.2015.08.016.
Stott PA, Stone DA, Allen MR. 2004. Human contribution to the Euro-pean heatwave of 2003. Nature 432(7017): 610–614. https://doi.org/10.1038/nature03089.
Tedeschi RG, Collins M. 2016. The influence of ENSO on south Amer-ican precipitation during austral summer and autumn in observations
© 2017 Royal Meteorological Society Int. J. Climatol. (2017)
CHARACTERIZATION OF HEAT WAVES IN BRAZIL
and models. Int. J. Climatol. 36(2): 618–635. https://doi.org/10.1002/joc.4371.
Tedeschi RG, Grimm AM, Cavalcanti IFA. 2016. Influence of central andeast ENSO on precipitation and its extreme events in South Americaduring austral autumn and winter. Int. J. Climatol. 36(15): 4797–4814.https://doi.org/10.1002/joc.4670.
Trigo R, Osborn T, Corte-Real J. 2002. The North Atlantic oscillationinfluence on Europe: climate impacts and associated physical mecha-nisms. Climate Res. 20(1): 9–17. https://doi.org/10.3354/cr020009.
Trigo RM, Trigo IF, DaCamara CC, Osborn TJ. 2004. Climate impactof the European winter blocking episodes from the NCEP/NCARReanalyses. Clim. Dyn. 23(1): 17–28. https://doi.org/10.1007/s00382-004-0410-4.
Trigo RM, García-Herrera R, Díaz J, Trigo IF, Valente MA. 2005.How exceptional was the early august 2003 heatwave in France?Geophys. Res. Lett. 32(10): L10701. https://doi.org/10.1029/2005GL022410.
Trigo RM, Ramos AM, Nogueira PJ, Santos FD, Garcia-herrera R, Gou-veia C, Santo FE. 2009. Evaluating the impact of extreme temperaturebased indices in the 2003 heatwave excessive mortality in Portugal.Environ. Sci. Policy 12(7): 844–854. https://doi.org/10.1016/j.envsci.2009.07.007.
Vera C, Higgins W, Amador J, Ambrizzi T, Garreaud R, Gochis D,Gutzler D, Lettenmaier D, Marengo J, Mechoso CR, Nogues-PaegleJ, Dias PLS, Zhang C. 2006. Toward a unified view of the American
monsoon systems. J. Clim. 19(20): 4977–5000. https://doi.org/10.1175/JCLI3896.1.
Vincent LA, Peterson TC, Barros VR, Marino MB, Rusticucci M,Carrasco G, Ramirez E, Alves LM, Ambrizzi T, Berlato MA, GrimmAM, Marengo JA, Molion L, Moncunill DF, Rebello E, AnunciaçãoYMT, Quintana J, Santos JL, Baez J, Coronel G, Garcia J, Trebejo I,Bidegain M, Haylock MR, Karoly D. 2005. Observed trends in indicesof daily temperature extremes in South America 1960–2000. J. Clim.18(23): 5011–5023. https://doi.org/10.1175/JCLI3589.1.
Xoplaki E, González-Rouco JF, Luterbacher J, Wanner H. 2003.Mediterranean summer air temperature variability and its connectionto the large-scale atmospheric circulation and SSTs. Clim. Dyn.20(7–8): 723–739. https://doi.org/10.1007/s00382-003-0304-x.
Zeng N, Yoon J-H, Marengo JA, Subramaniam A, Nobre CA, MariottiA, Neelin JD. 2008. Causes and impacts of the 2005 Amazon drought.Environ. Res. Lett. 3(1): 14002. https://doi.org/10.1088/1748-9326/3/1/014002.
Zhu Z, Bi J, Pan Y, Ganguly S, Anav A, Xu L, Samanta A, Piao S,Nemani RR, Myneni RB. 2013. Global data sets of vegetation leafarea index (LAI)3g and fraction of photosynthetically active radiation(FPAR)3g derived from global inventory modeling and mapping stud-ies (GIMMS) normalized difference vegetation index (NDVI3G) forthe period 1981 to 2. Remote Sens. (Basel) 5(2): 927–948. https://doi.org/10.3390/rs5020927.
© 2017 Royal Meteorological Society Int. J. Climatol. (2017)