climate inequality in the commonwealth: a call for urgent ... · 2 climate inequality in the...
TRANSCRIPT
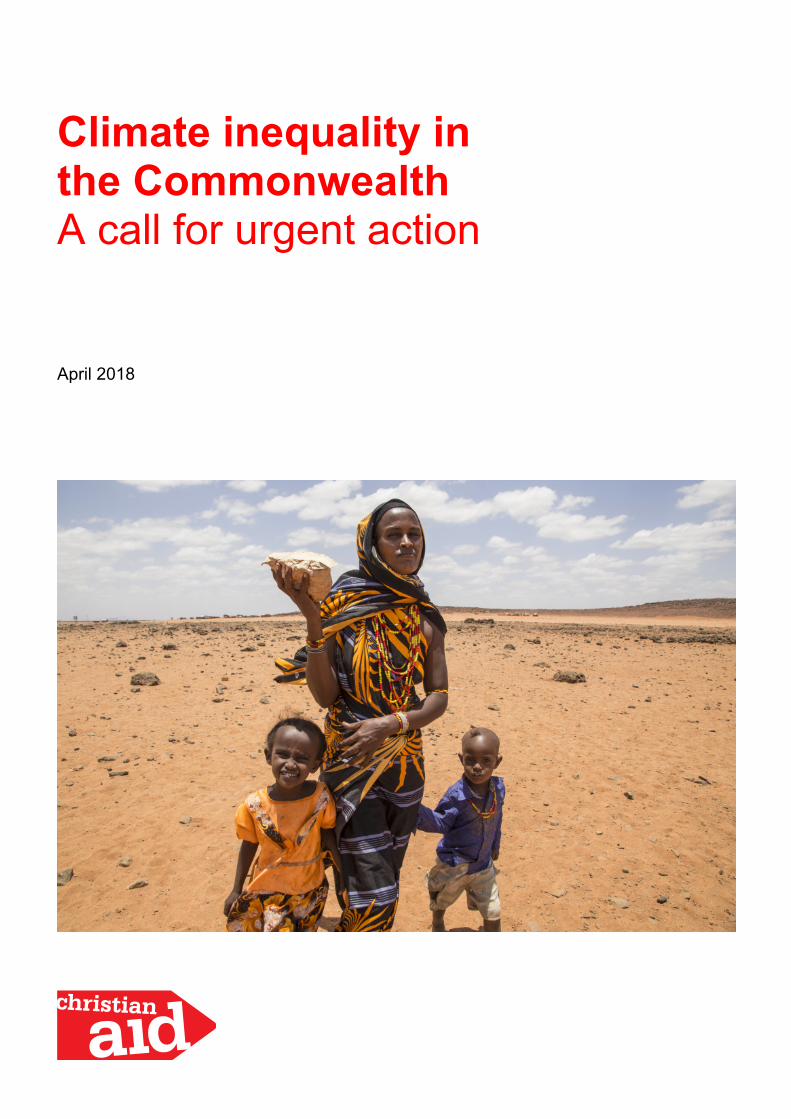
Climate inequality in the Commonwealth A call for urgent action
April 2018

2 Climate inequality in the Commonwealth: A call for urgent action
Christian Aid is a Christian organisation that insists the world can and must be swiftly changed to one where everyone can live a full life, free from poverty.
We work globally for profound change that eradicates the causes of poverty, striving to achieve equality, dignity and freedom for all, regardless of faith or nationality. We are part of a wider movement for social justice.
We provide urgent, practical and effective assistance where need is great, tackling the effects of poverty as well as its root causes.
christianaid.org.uk
Contact us Christian Aid 35 Lower Marsh Waterloo London SE1 7RL T: +44 (0) 20 7620 4444 E: [email protected] W: christianaid.org.uk Eng and Wales registered charity no. 1105851 Scot charity no. SC039150 Company no. 5171525 Christian Aid Ireland: NI charity no. NIC101631 Company no. NI059154 and ROI charity no. 20014162 Company no. 426928 The Christian Aid name and logo are trademarks of Christian Aid © Christian Aid April 2018 J63028
Authors:
Mohamed Adow, Joe Ware and Tom Viita
Acknowledgements:
Thanks to the Climate Equity Reference Project, an initiative of EcoEquity and the Stockholm Environment Institute, for expert analysis and advice.
Climate inequality in the Commonwealth: A call for urgent action 3
Contents Introduction 5
Executive summary 6
Policy recommendations 6
Not all Commonwealth countries are doing their fair share 8
Climate equity 8
Poorer countries are doing more than their fair share 8
Tackling climate change can solve energy poverty 13
Energy poverty 13
Support for renewables 14
How much it will cost 17
Conclusion 18
Sources 19
Cover: Christian Aid partner PACIDA has supported many communities with food and water to relieve the effects of a two-year drought in northern Kenya. Photographs: Cover, page 12: Christian Aid/Elaine Duigenan; page 15: Christian Aid/GBY; page 18: Christian Aid/GMB Akash.
4 Climate inequality in the Commonwealth: A call for urgent action
List of acronyms CAT Climate Action Tracker
CERP Climate Equity Reference Project
CHOGM Commonwealth Heads of Government Meeting
CO2 carbon dioxide
CO2e carbon dioxide equivalent
GDP gross domestic product
Gt gigatonne
INDC intended nationally determined contribution
IPCC Intergovernmental Panel on Climate Change
IRENA International Renewable Energy Agency
Mt megatonne
NDC nationally determined contribution
REmap Renewable Energy Roadmap
TWh terawatt hour
UNFCCC United Nations Framework Convention on Climate Change
Climate inequality in the Commonwealth: A call for urgent action 5
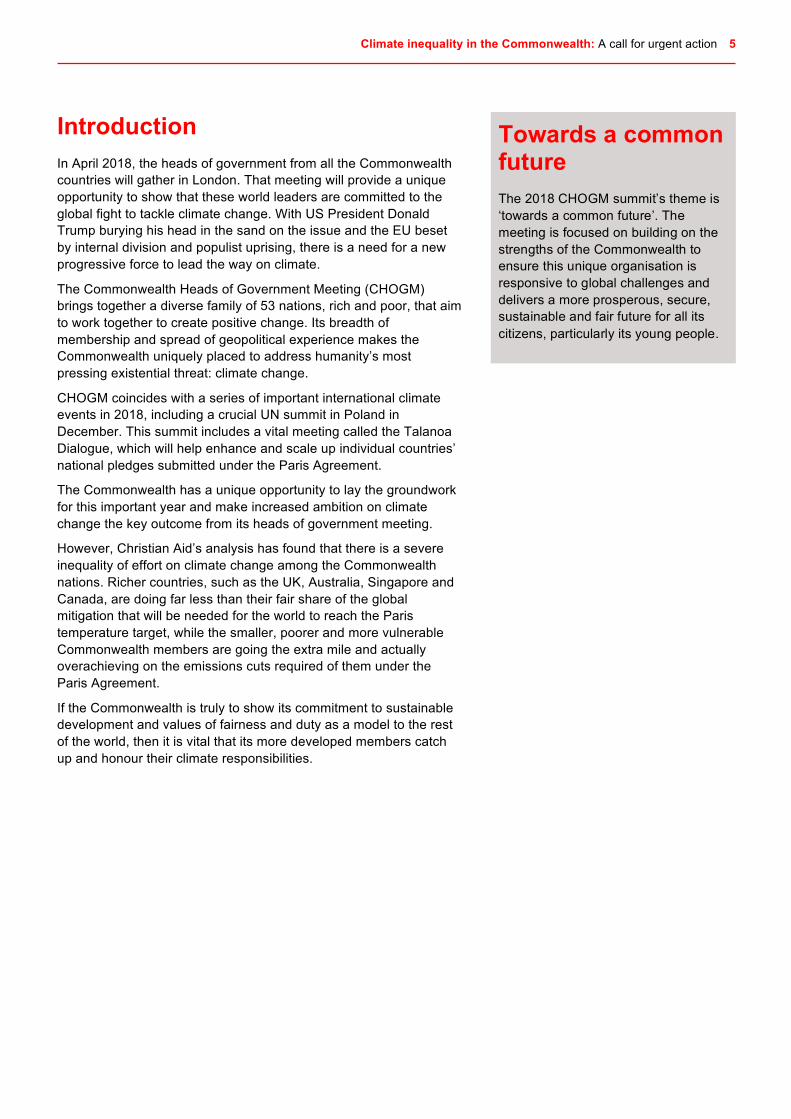
Introduction In April 2018, the heads of government from all the Commonwealth countries will gather in London. That meeting will provide a unique opportunity to show that these world leaders are committed to the global fight to tackle climate change. With US President Donald Trump burying his head in the sand on the issue and the EU beset by internal division and populist uprising, there is a need for a new progressive force to lead the way on climate.
The Commonwealth Heads of Government Meeting (CHOGM) brings together a diverse family of 53 nations, rich and poor, that aim to work together to create positive change. Its breadth of membership and spread of geopolitical experience makes the Commonwealth uniquely placed to address humanity’s most pressing existential threat: climate change.
CHOGM coincides with a series of important international climate events in 2018, including a crucial UN summit in Poland in December. This summit includes a vital meeting called the Talanoa Dialogue, which will help enhance and scale up individual countries’ national pledges submitted under the Paris Agreement.
The Commonwealth has a unique opportunity to lay the groundwork for this important year and make increased ambition on climate change the key outcome from its heads of government meeting.
However, Christian Aid’s analysis has found that there is a severe inequality of effort on climate change among the Commonwealth nations. Richer countries, such as the UK, Australia, Singapore and Canada, are doing far less than their fair share of the global mitigation that will be needed for the world to reach the Paris temperature target, while the smaller, poorer and more vulnerable Commonwealth members are going the extra mile and actually overachieving on the emissions cuts required of them under the Paris Agreement.
If the Commonwealth is truly to show its commitment to sustainable development and values of fairness and duty as a model to the rest of the world, then it is vital that its more developed members catch up and honour their climate responsibilities.
Towards a common future The 2018 CHOGM summit’s theme is ‘towards a common future’. The meeting is focused on building on the strengths of the Commonwealth to ensure this unique organisation is responsive to global challenges and delivers a more prosperous, secure, sustainable and fair future for all its citizens, particularly its young people.
6 Climate inequality in the Commonwealth: A call for urgent action
Executive summary The Paris Agreement marked a historic moment for global climate action. However, the UN Environment Programme has warned that, based on the current national pledges, the world is at risk of warming between 2.7°C and 3.5°C.
Fortunately, at the core of the Paris Agreement is the ‘ambition mechanism’, a series of five-year cycles designed to strengthen countries’ commitments over time. We are currently in the first of these cycles, with the first collective global stocktake of ambition (known as the ‘Talanoa Dialogue’) taking place in 2018.
The Commonwealth is perfectly placed to show leadership in this process and pave the way for other countries to follow suit. The Commonwealth solidarity and its politics of collective responsibility could help the world break new ground and set a new tone of international cooperation on our biggest global threat.
Between now and 2020, all countries must step up their actions to reduce greenhouse gas emissions – but the level of extra effort and support required varies greatly across the Commonwealth’s members.
Christian Aid worked with the Climate Equity Reference Project (CERP), an initiative of EcoEquity and the Stockholm Environment Institute, to analyse whether each country of the Commonwealth is taking its ‘fair share’ of global climate action needed to achieve a 1.5°C outcome. Is each country doing enough to deliver a fair and equitable outcome to protect the most vulnerable nations from climate risk?
This report exposes the climate inequality at the heart of the Commonwealth. The Commonwealth needs to enhance sustainable development across all its member states, and deliver vital clean, renewable energy to its most vulnerable communities.
Policy recommendations Christian Aid is calling on the Commonwealth and its members to demonstrate their goal of delivering a more sustainable future by:
1. Triggering more ambitious climate goals and accelerated action by member countries, based on fair shares; wealthier countries, including the UK, Australia, Singapore and Canada, deepening their domestic mitigation and, crucially, also increasing their financial, technological and other support to poorer countries.
2. Accelerating the transition to sustainable energy across the Commonwealth by helping members tackle a lack of access to sustainable energy and promote green energy options. Wealthy Commonwealth members must provide financial and technical support and incentives to help the poorest member countries.
3. Playing a positive, leading role in the Talanoa Dialogue to enhance the political will towards strengthening national mitigation and adaptation ambition by 2020 in order to achieve the Paris Agreement goals.
What the science is telling us The world is not on track to achieve the Paris Agreement’s aim of keeping global temperature rise to well below 2°C, while pursuing efforts to limit it to 1.5°C.
Many Commonwealth countries are already living with the reality of climate impacts, suffering disasters, increasing disease, increasing displacement of people, loss of life and livelihoods, and economic losses. These are predicted to worsen if we do not take urgent action to reduce atmospheric pollution.
The current emission reduction pledges contained in the Paris Agreement in 2015 risk global warming of at least 3°C by 2100. Scientists warn that a temperature rise of that magnitude risks climate chaos and severe human, economic and social consequences – which is why the Talanoa Dialogue to strengthen ambition is so important.
The Talanoa Dialogue The Paris Agreement included a decision to meet in 2018 to take stock of the collective efforts on climate change. This is part of the Talanoa Dialogue, established at the 2017 UN climate negotiations led by Fiji.
Talanoa is a word used in Fiji and across the Pacific to reflect a process of inclusive, participatory and transparent dialogue that leads to decision making for the greater good.
The Talanoa Dialogue aims to build trust and boost climate change ambition, ultimately leading to governments committing to strengthen their Nationally Determined Contributions by 2020.

Climate inequality in the Commonwealth: A call for urgent action 7
It should be noted that an equitable response to climate change must include delivering support for climate-vulnerable countries to build resilience and adaptation, risk reduction and disaster preparedness, and help them to deal with the irreversible loss and damage from climate change.
8 Climate inequality in the Commonwealth: A call for urgent action
Not all Commonwealth countries are doing their fair share This report ranks the climate pledges of the 53 Commonwealth countries and shows that its richer members, including Australia, Canada and the UK, are failing to do their fair share to prevent climate change, while poorer nations are working much harder. Our analysis exposes the climate inequality at the heart of the Commonwealth.
The gap between what is required to limit global warming and what has been so far pledged by Commonwealth countries is unbalanced and favours the interests of the rich. This situation must change or it risks being an embarrassment to the Commonwealth’s established economies, unless they take further action as a matter of urgency. If they cannot even do the bare minimum on an issue with such devastating impacts upon their fellow members and close allies, then how can their claims for solidarity on trade or other partnerships be taken seriously?
Climate equity The Paris Agreement is different from previous attempts to address climate change in that it is a bottom-up approach. Every country made pledges and promised to improve these over time.
The Paris Agreement also reaffirmed the high-level equity principles of the United Nations Framework Convention on Climate Change (UNFCCC), including historical responsibility for previous emissions and the capacity of countries to take action. Obviously, richer countries that have done more to cause climate change and have a greater financial capacity to address it should do their fair share to mitigate the effects, especially in light of the fact that poor countries are now acting much more ambitiously.
This study takes these factors into account and shows those countries which are pledging to do their fair share and which are shirking their responsibilities.
The data is the result of Christian Aid’s work with CERP to analyse how equitable the climate action of different countries is across the Commonwealth. The calculation is based on CERP’s Responsibility and Capacity Index, which allows users to calculate indicative national fair shares of the global climate transition effort, based on their own characterisation of the UNFCCC’s fundamental equity principles of capability and responsibility.
Poorer countries are doing more than their fair share An analysis of Commonwealth countries’ pledged actions under the Paris Agreement shows that poorer countries are unconditionally pledging more than their fair shares and wealthier countries are pledging less than theirs. Additional pledges by poorer countries – conditional on financial and technical support from richer nations – can help to narrow the global mitigation gap and help achieve the Paris goals – but this narrowing will only be realised if there is
‘Our analysis exposes the climate inequality at the heart of the Commonwealth’
Methodology The evidence and calculations presented in this paper are based on the Responsibility and Capacity Index from the Climate Equity Reference Project (CERP). This approach is not explained in detail here, but there are two points to note.
The CERP approach does not formulaically produce a single set of fair share calculations. Rather, it allows users to specify equity benchmarks, and then calculates national Responsibility and Capacity Indexes that correspond to those benchmarks.
In the interests of simplicity and clarity in this very brief report, we have chosen to show the results for only one equity benchmark – one in which historical responsibility is calculated beginning in 1990 and capacity is calculated in moderately progressive terms. This equity benchmark is described further below.
For more information on the CERP methodology, and in particular on its approach to equity benchmarks, see http://civilsocietyreview.org/report2017/appendix
Climate inequality in the Commonwealth: A call for urgent action 9
substantially scaled-up international support, which richer nations are yet to deliver at the necessary scale and speed.
A wealthy nation typically has a fair share that exceeds its own emissions. In order to do its fair share and account for its historical emissions, it not only has to decarbonise its domestic economy to reduce current and future emissions, but also support decarbonisation in poorer countries so that they are able to adopt lower emitting development pathways. However, there is no hard and fast rule for determining how much of a nation’s fair share should be delivered through domestic versus international action.
Figure 1 and Table 1 show the mitigation pledges Commonwealth countries have made and compare these pledges to their fair shares. These are based on complex models, but the overall message is clear: wealthier countries are doing less than their fair share and need to increase their efforts, while poorer countries are fulfilling their obligations and committing to go even further if they are given support. There is not only an inequality in how climate change is impacting on citizens of the Commonwealth, but there is also a glaring inequality in how their governments are responding.
The country fair shares are calculated using an ambitious global mitigation pathway and a moderately progressive equity benchmark.
The global mitigation pathway used in this analysis is the 1.5°C pathway from Climate Action Tracker (CAT). It is an ambitious mitigation pathway that is widely used by climate analysts and is derived from the Fifth Assessment Report scenario analysis of the Intergovernmental Panel on Climate Change (IPCC).1
The equity benchmark used here set the ‘development threshold’ at $7,500 per person per year (or about $20/day); this is the point below which income is not considered to contribute to national capacity. Income above this threshold counts towards national capability at a steadily rising rate, until it reaches a ‘luxury threshold’ of $50,000. Above this luxury threshold, all income is counted towards national capability. These settings define a progressive capacity calculation, in the same way that a graduated income tax works. This is not an extravagantly progressive setting – $50,000 falls well below the income of the highest-earning 1% of the global population. Note that this does not mean that all income above this level is used to pay climate costs. It merely means that this income is included in the calculation of a country’s capacity.
The historical responsibility setting in our equity benchmark reflects national emissions since 1990. This is the most recent date that we consider plausible by any reckoning, and is extremely favourable to wealthier countries that developed their prosperity long ago.
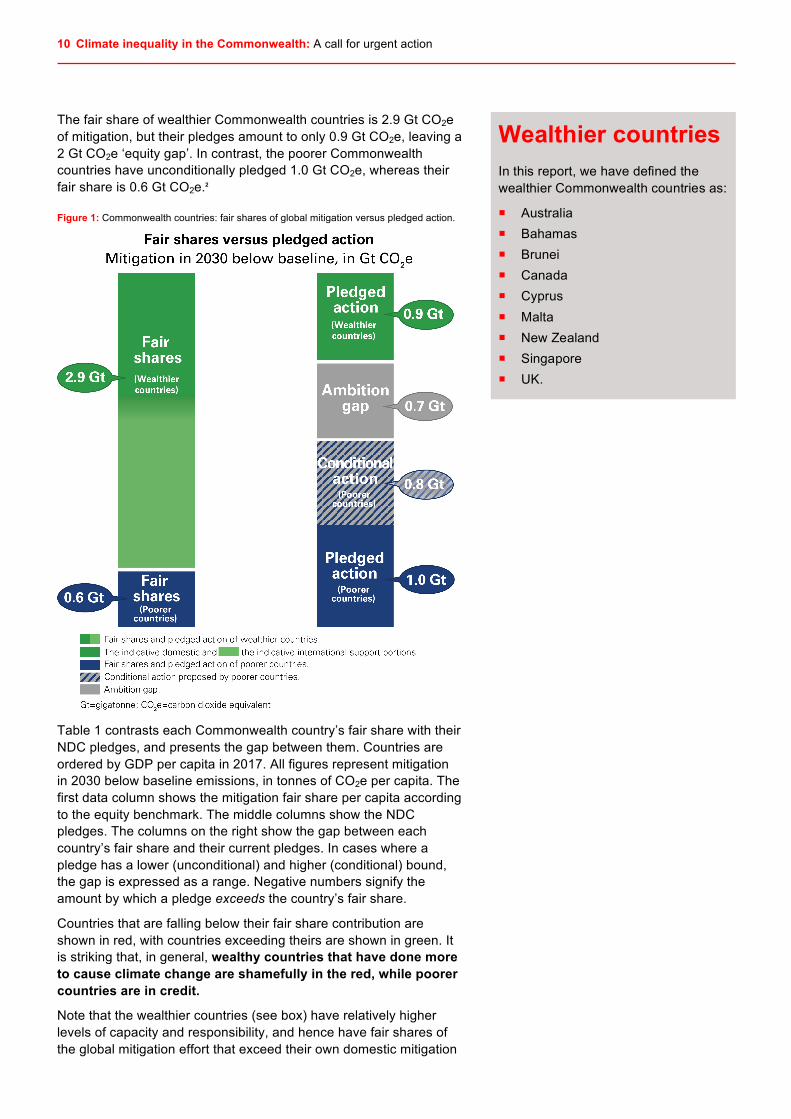
Figure 1 shows Commonwealth countries’ fair shares versus the national mitigation pledges made in the Paris Agreement. The right bar depicts the pledges of wealthier countries, the pledges of poorer countries that are not conditional on the receipt of international climate finance, and the pledges of poorer countries that are conditional on finance. In addition, it shows the ‘ambition gap’ between the sum of all pledges and the mitigation that Commonwealth countries as a group need to undertake to remain in compliance with the global 1.5°C pathway.
10 Climate inequality in the Commonwealth: A call for urgent action
The fair share of wealthier Commonwealth countries is 2.9 Gt CO2e of mitigation, but their pledges amount to only 0.9 Gt CO2e, leaving a 2 Gt CO2e ‘equity gap’. In contrast, the poorer Commonwealth countries have unconditionally pledged 1.0 Gt CO2e, whereas their fair share is 0.6 Gt CO2e.2
Figure 1: Commonwealth countries: fair shares of global mitigation versus pledged action.
Table 1 contrasts each Commonwealth country’s fair share with their NDC pledges, and presents the gap between them. Countries are ordered by GDP per capita in 2017. All figures represent mitigation in 2030 below baseline emissions, in tonnes of CO2e per capita. The first data column shows the mitigation fair share per capita according to the equity benchmark. The middle columns show the NDC pledges. The columns on the right show the gap between each country’s fair share and their current pledges. In cases where a pledge has a lower (unconditional) and higher (conditional) bound, the gap is expressed as a range. Negative numbers signify the amount by which a pledge exceeds the country’s fair share.
Countries that are falling below their fair share contribution are shown in red, with countries exceeding theirs are shown in green. It is striking that, in general, wealthy countries that have done more to cause climate change are shamefully in the red, while poorer countries are in credit.
Note that the wealthier countries (see box) have relatively higher levels of capacity and responsibility, and hence have fair shares of the global mitigation effort that exceed their own domestic mitigation
Wealthier countries In this report, we have defined the wealthier Commonwealth countries as:
! Australia ! Bahamas ! Brunei ! Canada ! Cyprus ! Malta ! New Zealand ! Singapore ! UK.

Climate inequality in the Commonwealth: A call for urgent action 11
potential. They would need to provide support to poorer countries to enable mitigation internationally to fulfil their fair share. Fair shares of the poorer countries on this list are smaller (and sometimes much smaller) than their domestic mitigation potential. With additional international support, they could mitigate much further, so as to fully shift to a low-carbon pathway consistent with the Paris goals.
Table 1: The fair share of emissions reductions needed in Commonwealth countries versus nationally determined contributions pledged.
Country Fair share mitigation below baseline
Nationally determined contributions (NDCs)
Gap between fair share and NDCs
Wealthier/poorer
(ranked by GDP per capita)
(Tonnes CO2 equivalent per capita)
Low/ unconditional
High/ conditional
Minimum (high NDCs)
Maximum (low NDCs)
Australia 31.36 8.49 8.88 22.48 22.87 Wealthier
Canada 26.06 6.97 19.09
Singapore* 22.07 0.00 22.07
UK 15.19 4.38 10.81
New Zealand 11.70 4.15 6.63 5.07 7.55
Brunei 47.19 26.14 21.05 Malta 6.74 4.02 2.72
Bahamas 6.71 3.14 5.37 1.34 3.57
Cyprus 5.35 3.23 2.12
St Kitts and Nevis* 3.74 0.00 3.74 Poorer
Barbados 5.16 9.91 −4.75
Seychelles 4.61 2.24 3.77 0.84 2.37
Antigua and Barbuda 4.71 2.25 2.46
Malaysia 4.07 5.27 7.36 −3.29 −1.20 Mauritius 1.90 3.31 −1.41
Botswana 5.07 6.85 −1.78
South Africa 4.17 2.48 6.19 −2.02 1.69
Grenada 3.55 1.37 2.18
St Vincent and the Grenadines*
0.74 0.00 0.74
Dominica 0.92 4.84 −3.92
St Lucia* 0.56 0.00 0.56
Namibia 5.44 3.64 9.57 −4.13 1.80
Jamaica* 0.79 0.00 0.79 Fiji* 0.41 0.00 0.41
Sri Lanka 0.26 1.60 1.77 −1.51 −1.34
Tuvalu 0.13 0.31 −0.18
Samoa* 0.08 0.00 1.85 −1.77 0.08
Swaziland 0.29 2.40 −2.11
Vanuatu 0.07 0.50 0.69 −0.62 −0.43
India 0.05 0.19 0.33 −0.28 −0.14 Papua New Guinea 0.33 8.20 8.40 −8.07 −7.87
Ghana 0.01 0.25 0.88 −0.87 −0.24
Nigeria* 0.03 0.00 0.37 −0.34 0.03
Kiribati 0.01 0.55 0.78 −0.77 −0.54

12 Climate inequality in the Commonwealth: A call for urgent action
Country Fair share mitigation below baseline
Nationally determined contributions (NDCs)
Gap between fair share and NDCs
Wealthier/poorer
Zambia 0.19 2.77 3.28 −3.09 −2.58 Solomon Islands 0.01 0.22 −0.21
Lesotho 0.07 0.12 0.42 −0.35 −0.05
Cameroon 0.05 2.00 −1.95
Pakistan 0.00 0.07 −0.07
Kenya 0.06 0.20 −0.14
Bangladesh 0.00 0.12 0.25 −0.25 −0.12
Rwanda 0.00 0.84 −0.84
Tanzania 0.00 1.10 1.20 −1.20 −1.10 Sierra Leone 0.00 1.19 −1.19
Gambia 0.02 3.05 −3.03
Uganda* 0.00 0.00 0.18 −0.18 0.00
Mozambique 0.00 0.39 −0.39
Malawi* 0.00 0.00 0.00
* NDC pledges are assessed to correspond to an increase, rather than a reduction, of emissions relative to baseline. In these cases, the pledged mitigation is considered to be zero, rather than an increase beyond baseline. All numbers are in tonnes of CO2e per capita of mitigation below baseline levels in 2030. Figures are shows in per-capita terms to allow direct comparison between countries with vastly different population sizes. Baseline levels are the levels of emissions that would occur in each country if no climate action were to be undertaken. The fair share column shows the average per-capita amount of emissions reductions relative to baseline that each country would have to do to meet its fair share. The NDC columns show the average per-capita amount that each country is currently pledging to do, and the gap columns show the difference between these amounts and are colour-coded to show whether countries’ pledges exceed their fair shares (green) or fall short of them (red). Note: Several smaller Commonwealth countries (Trinidad and Tobago, Nauru, Belize, Guyana and Tonga) were excluded from this table due to data idiosyncrasies. This table estimates the national fair shares of all Commonwealth countries, as well as the gaps between their NDC pledges and those fair shares.
The ultimate goal of the Talanoa Dialogue is to support countries as they seek paths to more ambitious NDCs in which these gaps are closed. Thus, countries with pledges that do not meet their fair share (shown in red in the gap column) should do more, either domestically or by way of international cooperative action.
Above: Elders gather in Marsabit County, northern Kenya, an area suffering from a two-year drought, which has left communities without reliable water sources or food.
Recommendation: Lead in the Talanoa Dialogue The Commonwealth needs to urge its member states to take a positive, leading role in the Talanoa Dialogue to enhance the political will towards strengthening national mitigation and adaptation ambition by 2020.
Climate inequality in the Commonwealth: A call for urgent action 13
Tackling climate change can solve energy poverty The richer Commonwealth countries, including the UK, Australia and Canada, hold the keys to an opportunity of global significance. By delivering their fair share to tackle emissions, they can not only reduce the impacts of climate change, but also help eliminate energy poverty in some of the Commonwealth’s poorest countries. This would help erase the inequality within the Commonwealth and make it a global leader in humanity’s fight for a safe and secure world.
Energy poverty In developing economies, energy production has not kept pace with rising demand. Energy poverty is a lack of access to modern energy services; it hinders economic development and reinforces inequalities. Access to energy is key to lifting people out of poverty.
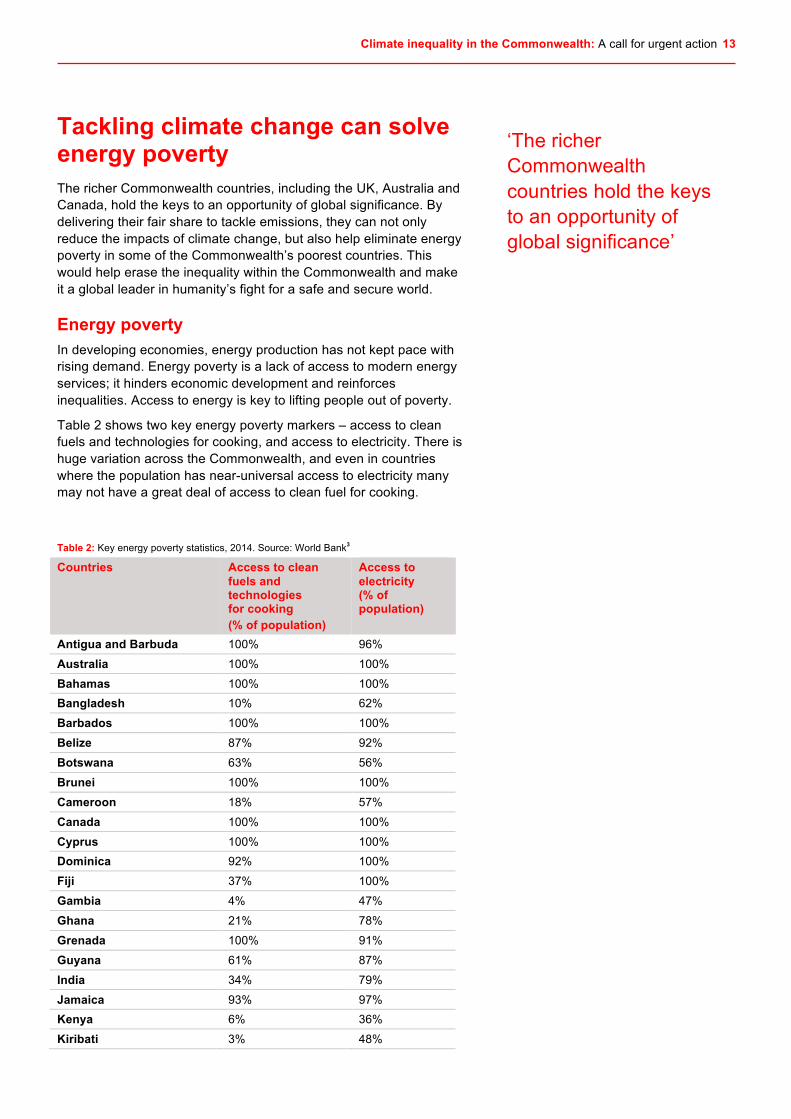
Table 2 shows two key energy poverty markers – access to clean fuels and technologies for cooking, and access to electricity. There is huge variation across the Commonwealth, and even in countries where the population has near-universal access to electricity many may not have a great deal of access to clean fuel for cooking.
Table 2: Key energy poverty statistics, 2014. Source: World Bank3
Countries Access to clean fuels and technologies for cooking (% of population)
Access to electricity (% of population)
Antigua and Barbuda 100% 96%
Australia 100% 100%
Bahamas 100% 100% Bangladesh 10% 62%
Barbados 100% 100%
Belize 87% 92%
Botswana 63% 56%
Brunei 100% 100%
Cameroon 18% 57%
Canada 100% 100%
Cyprus 100% 100% Dominica 92% 100%
Fiji 37% 100%
Gambia 4% 47%
Ghana 21% 78%
Grenada 100% 91%
Guyana 61% 87%
India 34% 79%
Jamaica 93% 97% Kenya 6% 36%
Kiribati 3% 48%
‘The richer Commonwealth countries hold the keys to an opportunity of global significance’

14 Climate inequality in the Commonwealth: A call for urgent action
Countries Access to clean fuels and technologies for cooking (% of population)
Access to electricity (% of population)
Lesotho 32% 28%
Malawi 3% 12%
Malaysia 100% 100%
Malta 100% 100%
Mauritius 99% 99% Mozambique 4% 21%
Namibia 46% 50%
Nauru 0% 99%
New Zealand 100% 100%
Nigeria 2% 58%
Pakistan 45% 98%
Papua New Guinea 31% 20%
Rwanda 2% 20% Samoa 27% 98%
Seychelles 100% 100%
Sierra Leone 2% 13%
Singapore 100% 100%
Solomon Islands 9% 35%
South Africa 82% 86%
Sri Lanka 19% 92% St Kitts and Nevis 100% 100%
St Lucia 100% 98%
St Vincent and the Grenadines
100% 99%
Swaziland 35% 65%
Tanzania 2% 16%
Tonga 63% 95%
Trinidad and Tobago 100% 100%
Tuvalu 30% 99%
Uganda 2% 20% UK 100% 100%
Vanuatu 16% 34%
Zambia 16% 28%
Access to electricity is notably low in many Commonwealth countries, especially in Africa. It is possible to lift these countries out of energy poverty without increasing emissions, but it will need financial and technological support for them to do so.4
Support for renewables Our analysis shows that wealthy countries cannot undertake all the emission reductions required of them within their own borders. Wealthy countries need to reduce their domestic emissions much further than they have thus far pledged to do, and also act internationally if they are to fulfil their fair share of the global effort.

Climate inequality in the Commonwealth: A call for urgent action 15
Above: As part of a programme funded by the UK’s Department for International Development in Malawi, solar lights are used to help children study at night.
They would act internationally by supporting poorer countries reduce their emissions. This includes investing in renewable energy projects in these countries, helping to displace fossil fuel use and address energy poverty.
The international support that these wealthier countries would need to provide to fulfil their fair share obligations is translated into units of renewable energy in Table 3. This is done by converting international mitigation support (in Mt CO2e) into terawatt hours (TWh) of renewable electricity.
If this support were realised, it could have a transformative effect on the fortunes of the poorer Commonwealth members. Table 4 shows the amount of renewable energy needed by five Commonwealth countries – India, South Africa, Kenya, Malaysia and Bangladesh – in order to solve their energy poverty problem, according to the scenarios laid out by the International Renewable Energy Agency (IRENA) in its Renewable Energy Roadmaps (REmap). These scenarios are characterised by a concerted effort to achieve the Paris objectives and Sustainable Development Goal 7: ‘Ensure access to affordable, reliable, sustainable and modern energy for all’.
It is important to note that while REmap is a reasonably ambitious scenario with respect to meeting energy access and climate goals, it is possible that greater efforts still are warranted. The IRENA doubling scenario, and the Greenpeace Energy [R]evolution analysis, for example, are scenarios with even greater expansion of energy access and carbon reductions.5 As such, the present analysis should be taken as an indicative estimate on the low side of what may be achievable.
The total amount of international mitigation support that wealthy Commonwealth countries should provide as their fair share (5,020 TWh) is nearly two and a half times the amount needed by poorer Commonwealth countries (2,050 TWh).
‘The total amount of international support that wealthy Commonwealth countries should provide as their fair share is nearly two and a half times the amount needed by poorer Commonwealth countries’
Recommendation: Support members’ transition to sustainable energy The Commonwealth needs to accelerate the transition to sustainable energy by helping members tackle a lack of access to sustainable energy and promote green energy options. Wealthy Commonwealth members must provide financial and technical support and incentives to help the poorest member countries.

16 Climate inequality in the Commonwealth: A call for urgent action
Table 3: Amount of international support required by 2030 to meet fair share of emissions cuts.
Country International support (Mt CO2)
International support (TWh)
Australia 550 1,360
Canada 620 1,530
Singapore 125 310
UK 700 1,730
Other wealthier Commonwealth countries
40 100
Total 2,035 5,020 International mitigation in Mt CO2 has been translated into TWh of renewable electricity.
Table 4: Additional renewable generation required to meet the REmap scenario and end energy poverty. Source: IRENA6
Country TWh required South Africa 95
India 1,050
Kenya 10
Malaysia 85
Bangladesh7 140 Other poorer Commonwealth countries
670
Total 2,050
Table 3 presents the support that the richer countries would provide as the international portion of their fair share of the global climate effort by 2030. Detail is given for Australia, Canada, Singapore and the UK, which between them ‘owe’ the bulk of the support.8
The primary form of international support rich nations must provide is financial investment, both public and private. At present these investments are rarely guided towards the goals of energy access or climate action.
The Africa Renewable Energy Initiative sets forth a helpful set of guiding principles to ensure that investments are designed and implemented in a manner consistent with this goal.9 In brief, investments should enhance well-being and sound economic development by ensuring universal access to sufficient amounts of clean, appropriate and affordable energy; and help recipient countries leapfrog towards renewable energy systems that support their low-carbon development strategies while enhancing economic and energy security.
For countries in Table 4, analysis is based on the required growth in renewable energy by 2030 that would be necessary to achieve the REmap scenario.
Climate inequality in the Commonwealth: A call for urgent action 17
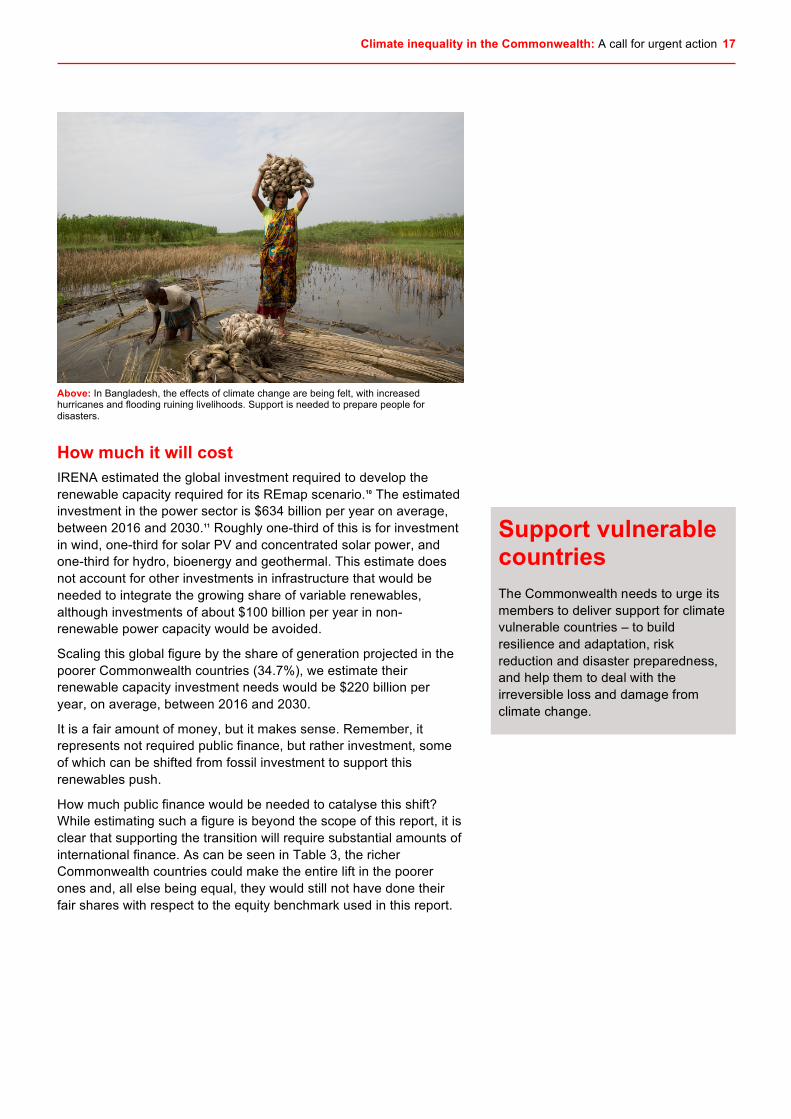
Above: In Bangladesh, the effects of climate change are being felt, with increased hurricanes and flooding ruining livelihoods. Support is needed to prepare people for disasters.
How much it will cost IRENA estimated the global investment required to develop the renewable capacity required for its REmap scenario.10 The estimated investment in the power sector is $634 billion per year on average, between 2016 and 2030.11 Roughly one-third of this is for investment in wind, one-third for solar PV and concentrated solar power, and one-third for hydro, bioenergy and geothermal. This estimate does not account for other investments in infrastructure that would be needed to integrate the growing share of variable renewables, although investments of about $100 billion per year in non-renewable power capacity would be avoided.
Scaling this global figure by the share of generation projected in the poorer Commonwealth countries (34.7%), we estimate their renewable capacity investment needs would be $220 billion per year, on average, between 2016 and 2030.
It is a fair amount of money, but it makes sense. Remember, it represents not required public finance, but rather investment, some of which can be shifted from fossil investment to support this renewables push.
How much public finance would be needed to catalyse this shift? While estimating such a figure is beyond the scope of this report, it is clear that supporting the transition will require substantial amounts of international finance. As can be seen in Table 3, the richer Commonwealth countries could make the entire lift in the poorer ones and, all else being equal, they would still not have done their fair shares with respect to the equity benchmark used in this report.
Support vulnerable countries The Commonwealth needs to urge its members to deliver support for climate vulnerable countries – to build resilience and adaptation, risk reduction and disaster preparedness, and help them to deal with the irreversible loss and damage from climate change.
18 Climate inequality in the Commonwealth: A call for urgent action
Conclusion The Commonwealth family makes much of its collaboration based on shared history and shared values. A unique alliance of both rich and poor, countries from the global North and South, there is no better group of nations to demonstrate the impacts of climate change – global in reach and diverse in its manifestations. The Commonwealth also illustrates the promise and potential of working together as an international community to respond to it.
Yet rather than modelling to the world the solidarity and fair approach we need to tackle our carbon emissions, the Commonwealth’s responses to climate change run the risk of reinforcing the injustice that makes climate change such a tragic scourge of the world’s poor, and entrenching inequality between people and nations.
This report shows that climate leadership is not coming from the rich countries that claim that mantle, but from the poorest nations that have done little or nothing to cause the problem in the first place. The poorer nations are over-achieving, but they cannot deliver a safe climate on their own. Their richer, more polluting, Commonwealth allies must heed their call to put their shoulder to the wheel and meet their responsibilities.
The benefits of fair effort from the UK, Canada, Singapore and Australia could be transformative. Not only would they help to deliver the Paris Agreement goal of keeping global temperature rise to 1.5°C, they would also help eradicate energy poverty within the Commonwealth. That would have many benefits for the citizens of the Commonwealth, reduce humanitarian need and bring social benefits, not to mention provide an economic boost to nations that may become ever-closer trading partners in the near future.
This is a crucial year in the fight to deliver a safe and secure climate. The Talanoa Dialogue will be a focal point for increased ambition and the step forward to ensure the Paris Agreement is a living accord that can grow stronger over time. The 2018 Commonwealth Heads of Government Meeting is a prime opportunity to fire the starting gun on this process and lead the world at this most important of moments.

Climate inequality in the Commonwealth: A call for urgent action 19
Sources Africa Renewable Energy Initiative, www.arei.org
Holz C, Athanasiou T, Kartha S, Estimates of Emissions Levels Associated with the Intended Nationally Determined Contributions (INDCs), Harvard Dataverse, V2, 2017, https://doi.org/10.7910/DVN/RIBJXF
International Renewable Energy Agency, REmap: Roadmap for A Renewable Energy Future. 2016 Edition, IRENA, 2016, www.irena.org/publications/2016/Mar/REmap-Roadmap-for-A-Renewable-Energy-Future-2016-Edition
International Renewable Energy Agency, Renewable Power Generation Costs in 2017, IRENA, 2018, www.irena.org/publications/2018/Jan/Renewable-power-generation-costs-in-2017
Kemp-Benedict E, Holz C, Baer P, et al, Climate Equity Reference Calculator, Climate Equity Reference Project, EcoEquity and Stockholm Environment Institute, 2017, https://calculator.climateequityreference.org
Meinshausen M, Alexander R, NDC & INDC Factsheets, Australian-German Climate and Energy College, 4 November 2016, http://climate-energy-college.org/ndc-indc-factsheets
Renewable Energy Policy Network for the 21st Century, Renewables 2017 Global Status Report, REN21, 2017, www.ren21.net/wp-content/uploads/2017/06/17-8399_GSR_2017_Full_Report_0621_Opt.pdf

20 Climate inequality in the Commonwealth: A call for urgent action
Endnotes
1 This pathway is actually considered to be a
‘strong 2°C pathway’, rather than a 1.5°C pathway, because CAT characterises it as having a ‘greater than or equal to 50% chance of being below 1.5°C in 2100’, rather than a ‘likely’ (greater than 50% chance). It cannot, therefore, be understood to be ‘likely’ to limit warming to less than 1.5°C above pre-industrial levels (in IPCC terminology ‘likely’ pathways require a success probability of at least 66%) chance. On the other hand, this pathway does have a greater probability of more than 66% probability of limiting warming to less than 2°C in 2100, and it therefore qualifies as a likely 2°C pathway, in IPCC terminology.
2 These results are closely consistent with those of the equity assessment of the NDCs of all countries reported in Equity and the Ambition Ratchet: Towards a Meaningful 2018 Facilitative Dialogue (Civil Society Equity Review, 2017, http://civilsocietyreview.org), even though the single equity setting used here is slightly different from the equity range presented in that report.
3 The two datasets shown in Table 2 are from the World Development Indicators database compiled by the World Bank (http://databank.worldbank.org), using data from 2014, the most recent year for which all the data fields were complete for all 53 Commonwealth countries. The definition of these two data sets is: ! Access to clean fuels and
technologies for cooking is the proportion of total population primarily using clean cooking fuels and technologies for cooking. Under WHO guidelines, kerosene is excluded from clean cooking fuels.
! Access to electricity is the percentage of population with access to electricity. Electrification data are collected from industry, national surveys and international sources.
4 Low-carbon Africa: leapfrogging to a green future, Alison Doig, Mohamed Adow, Christian Aid, 2011.
5 REmap: Roadmap for A Renewable Energy Future. 2016 Edition, International Renewable Energy Agency, 2016, www.irena.org/publications/2016/Mar/REmap-Roadmap-for-A-Renewable-Energy-Future-2016-Edition
The Energy [R]evolution, Greenpeace, 2015, https://www.greenpeace.org/archive-international/en/campaigns/climate-change/energyrevolution
6 Analysis is available regarding the required growth in renewable energy by 2030 (expressed in terawatt hours) necessary to achieve the REMAP scenario. This scenario is characterised by a concerted effort to achieve the Paris objectives and Sustainable Development Goal 7: ‘Ensure access to affordable, reliable, sustainable and modern energy for all’. See: REmap: Roadmap for A Renewable Energy Future. 2016 Edition, International Renewable Energy Agency, 2016, www.irena.org/publications/2016/Mar/REmap-Roadmap-for-A-Renewable-Energy-Future-2016-Edition and http://resourceirena.irena.org/gateway/dashboard
7 The REmap analysis does not provide detailed data for Bangladesh, so the figure
here was estimated as being proportional to the sum of the others, pro-rated by population.
8 These numbers have been estimated by: ! Calculating the fair share for each
country. ! Making the conservative assumption
that the country has at least halved its emissions relative to its baseline by 2030, thereby ensuring that its domestic action is no less ambitious than what is required globally.
! Taking the remaining portion of each country’s fair share as its share of international support (in Mt CO2).
! Converting this international support (in Mt CO2) into terawatt hours (TWh) of electricity. This electricity would need to be generated by investments in renewable energy that contribute to sustainable development.
This conversion assumes that renewable energy investments displace a mix of other capacity investments with an average carbon intensity that is reasonably characterised by a natural gas combined cycle power plant (0.404 MtCO2/TWh), as per IPCC AR4, Working Group 3, Chapter 4.
9 Africa Renewable Energy Initiative, www.arei.org
10 REmap: Roadmap for A Renewable Energy Future. 2016 Edition, International Renewable Energy Agency, 2016, www.irena.org/publications/2016/Mar/REmap-Roadmap-for-A-Renewable-Energy-Future-2016-Edition
11 See note 10, p 122.