climate finance - aiib.org
TRANSCRIPT
2 0 2 0
JOINT REPORT ON MULTILATERAL
DEVELOPMENT BANKS’
CL
IMA
TE
FIN
AN
CE

JUNE 2021
This report was written by a group of multilateral development banks (MDBs), composed of the African Development Bank (AfDB), the Asian Development Bank (ADB), the Asian Infrastructure Investment Bank (AIIB), the European Bank for Reconstruction
and Development (EBRD), the European Investment Bank (EIB), the Inter-American Development Bank Group (IDBG), the Islamic Development Bank (IsDB),
the New Development Bank (NDB) and the World Bank Group (WBG). The findings, interpretations and conclusions expressed in this work do not
necessarily reflect the official views of the MDBs’ Boards of Executive Directors or the governments they represent.
JOINT REPORT ON MULTILATERAL DEVELOPMENT BANKS’
C L I M A T EF I N A N C E
2 0 2 0
2 Abbreviations and acronyms 3 Preface 6 Executive summary
10 1. OVERVIEW OF MDB METHODOLOGIES FOR TRACKING CLIMATE FINANCE 10 1.1. Finance for adaptation to climate change 10 1.2. Finance for the mitigation of climate change 12 2. MDB CLIMATE FINANCE, 2020 12 2.1. Total MDB climate finance 15 2.2. MDB climate finance by type of recipient or borrower 16 2.3. MDB climate finance by type of instrument 17 2.4. MDB climate finance by region 18 3. MDB ADAPTATION FINANCE, 2020 22 4. MDB MITIGATION FINANCE, 2020 26 5. CLIMATE CO-FINANCE, 2020
29 ANNEX A. Definitions and clarifications 31 ANNEX B. Joint methodology for tracking climate change adaptation finance 35 ANNEX C. Joint methodology for tracking climate change mitigation finance 44 ANNEX D. Finance that benefits both adaptation and mitigation 46 ANNEX E. Types of instrument 53 ANNEX F. Geographical coverage of the report
ADB Asian Development BankAfDB African Development BankAIIB Asian Infrastructure Investment BankCCF climate co-financeCIF Climate Investment FundsCO2 carbon dioxideEBRD European Bank for Reconstruction and DevelopmentEIB European Investment BankEU European Union€ euroFY fiscal yearGCF Green Climate FundGEF Global Environment FacilityGHG greenhouse gasIDB Inter-American Development BankIDBG Inter-American Development Bank Group, composed of the IDB, IDB Lab and IDB Invest
IDB Invest the private sector arm of the IDBG IDB Lab the innovation laboratory of the IDBGIDFC International Development Finance ClubIFC International Finance CorporationIsDB Islamic Development BankMDBs multilateral development banksMIGA Multilateral Investment Guarantee AgencyNAMAs Nationally Appropriate Mitigation ActionsNDB New Development Bank NDCs Nationally Determined Contributions UNFCCC United Nations Framework Convention on Climate Change US$ United States dollarWB World Bank, composed of the International Bank
for Reconstruction and Development, and the International Development Association
WBG World Bank Group, composed of the WB, IFC and MIGA
CONTENTS
ABBREVIATIONS AND ACRONYMS
2020 JOINT REPORT ON MULTILATERAL DEVELOPMENT BANKS’ CLIMATE FINANCE
2
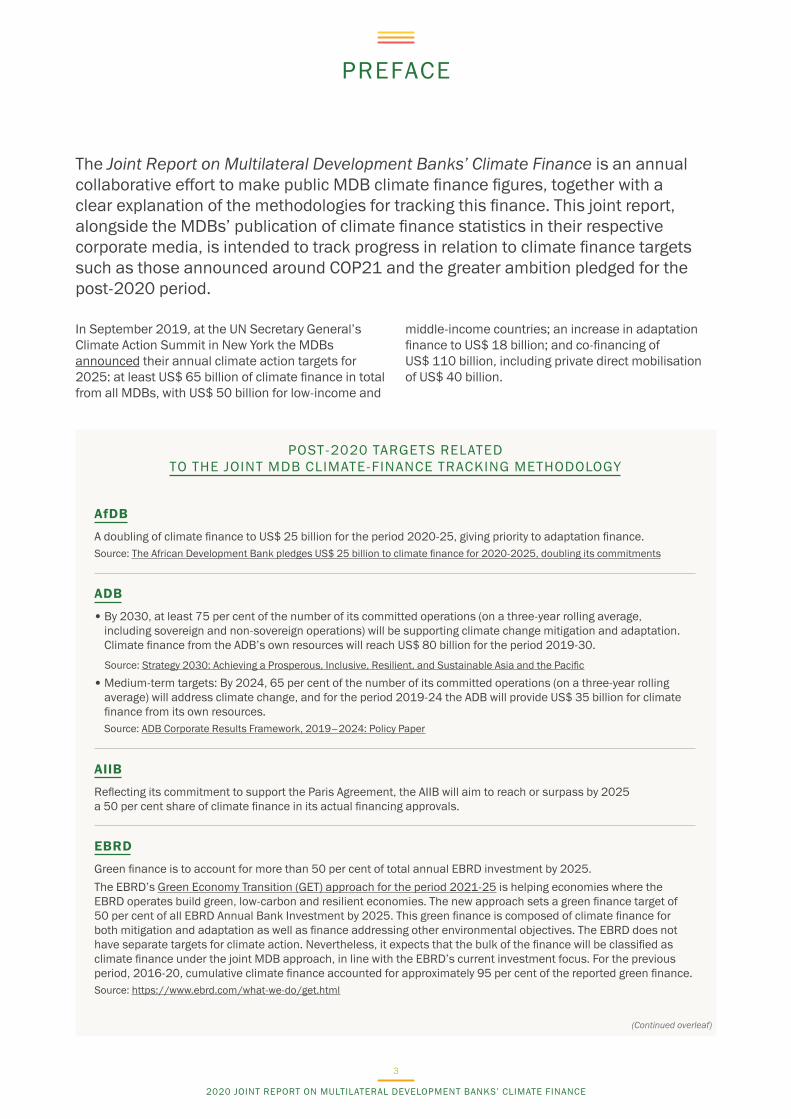
The Joint Report on Multilateral Development Banks’ Climate Finance is an annual collaborative effort to make public MDB climate finance figures, together with a clear explanation of the methodologies for tracking this finance. This joint report, alongside the MDBs’ publication of climate finance statistics in their respective corporate media, is intended to track progress in relation to climate finance targets such as those announced around COP21 and the greater ambition pledged for the post-2020 period.
In September 2019, at the UN Secretary General’s Climate Action Summit in New York the MDBs announced their annual climate action targets for 2025: at least US$ 65 billion of climate finance in total from all MDBs, with US$ 50 billion for low-income and
middle-income countries; an increase in adaptation finance to US$ 18 billion; and co-financing of US$ 110 billion, including private direct mobilisation of US$ 40 billion.
PREFACE
(Continued overleaf)
POST-2020 TARGETS RELATED TO THE JOINT MDB CLIMATE-FINANCE TRACKING METHODOLOGY
AfDB
A doubling of climate finance to US$ 25 billion for the period 2020-25, giving priority to adaptation finance.Source: The African Development Bank pledges US$ 25 billion to climate finance for 2020-2025, doubling its commitments
ADB
• By 2030, at least 75 per cent of the number of its committed operations (on a three-year rolling average, including sovereign and non-sovereign operations) will be supporting climate change mitigation and adaptation. Climate finance from the ADB’s own resources will reach US$ 80 billion for the period 2019-30.
Source: Strategy 2030: Achieving a Prosperous, Inclusive, Resilient, and Sustainable Asia and the Pacific
• Medium-term targets: By 2024, 65 per cent of the number of its committed operations (on a three-year rolling average) will address climate change, and for the period 2019-24 the ADB will provide US$ 35 billion for climate finance from its own resources. Source: ADB Corporate Results Framework, 2019–2024: Policy Paper
EBRD
Green finance is to account for more than 50 per cent of total annual EBRD investment by 2025. The EBRD’s Green Economy Transition (GET) approach for the period 2021-25 is helping economies where the EBRD operates build green, low-carbon and resilient economies. The new approach sets a green finance target of 50 per cent of all EBRD Annual Bank Investment by 2025. This green finance is composed of climate finance for both mitigation and adaptation as well as finance addressing other environmental objectives. The EBRD does not have separate targets for climate action. Nevertheless, it expects that the bulk of the finance will be classified as climate finance under the joint MDB approach, in line with the EBRD’s current investment focus. For the previous period, 2016-20, cumulative climate finance accounted for approximately 95 per cent of the reported green finance. Source: https://www.ebrd.com/what-we-do/get.html
AIIB
Reflecting its commitment to support the Paris Agreement, the AIIB will aim to reach or surpass by 2025 a 50 per cent share of climate finance in its actual financing approvals.
2020 JOINT REPORT ON MULTILATERAL DEVELOPMENT BANKS’ CLIMATE FINANCE
3
Since the first Joint Report on Multilateral Development Banks’ Climate Finance, which covered climate finance for 2011, figures reported for climate finance have been based on a jointly developed MDB tracking methodology, which has been gradually updated and detailed. From the 2014 report onwards, the methodology has included reporting on climate co-finance alongside MDB climate finance. The first eight editions of the report provided climate finance data on a group of emerging and developing economies as defined by the MDBs, with slight fluctuations in geographical coverage year by year.
Starting with the 2019 report, for purposes of greater transparency and consistency, MDBs agreed to start reporting on all economies where these banks operate, in other words to provide data on MDB climate finance commitments beyond those directed solely at developing and emerging economies. This change to reporting on all economies where the MDBs
operate is made so that MDB climate finance data is more comprehensive and also includes a further breakdown by income level.
In 2015, the MDBs and the International Development Finance Club (IDFC) agreed on a set of Common Principles for finance to mitigate climate change and an initial set of Common Principles for finance to support adaptation to climate change. Their intention was to take a common approach to tracking and, in future, to reporting climate finance. These institutions are expected to promote the Common Principles as their starting point and to discuss all differences transparently. In December 2019, MDBs1 and members of the IDFC published the joint Framework and Principles for Climate Resilience Metrics in Financing Operations, setting out the core concepts and characteristics of climate resilience metrics alongside a high-level framework for such metrics in financing operations.
1 The AfDB, ADB, AIIB, EBRD, EIB, IDBG and IsDB.
EIB
The EIB will gradually increase the share of its financing dedicated to climate action and environmental sustainability to exceed 50 per cent of its operations in 2025.From 2021, the EIB will deliver against a target that comprises both climate finance and environmental sustainability finance. Although the EIB will not have a separate climate finance target, it will continue to track climate finance separately within its overall target. The new target was approved by the EIB’s Management Committee and Board, accompanied by modelling the climate-finance as a percentage of total financing. This modelling showed that EIB climate finance is expected to comprise approximately 85 per cent of the volume reported against the target.Source: EU member states approve EIB Group Climate Bank Roadmap 2021-2025
IsDB
The IsDB is committed to a climate finance target of 35 per cent of total financial commitment by 2025.Source: IsDB 2020-2025 Climate Action Plan
IDBG
Climate finance in IDB Group operations (climate finance approved, as a percentage of total amount approved) for 2020-23:
• IDB: 30 per cent (annual floor) • IDB Lab: 30 per cent (annual floor) • IDB Invest 30 per cent (climate finance
committed, as a percentage of total amount committed) (annual floor).
Projects supporting climate change mitigation and/or adaptation (percentage of new approvals/commitments) for 2020-23:
• IDB: 65 per cent • IDB Invest: 40 per cent • IDB Lab: 40 per cent
Source: https://crf.iadb.org/en
WBG
The WBG announced a target for an average of 35 per cent of its financing to be climate finance over the period 2021-25. At least 50 per cent of World Bank – IBRD and IDA – climate financing will support adaptation. The 35 per cent target is a significant increase from the 26 per cent achieved on average in FY 2016-20 and an even larger increase in dollar terms as the World Bank Group’s total financing has also expanded.Source: World Bank Group Climate Change Action Plan 2021–2025 : Supporting Green, Resilient, and Inclusive Development
Note: The NDB is considering the inclusion of a climate finance target in its General Strategy for the period 2022-26, which is under preparation, with implementation of the target set to start in 2022.
(continued from previous page)
2020 JOINT REPORT ON MULTILATERAL DEVELOPMENT BANKS’ CLIMATE FINANCE
4
In 2020, the Climate Change Adaptation Working Group continued to harmonise the application of the adaptation finance tracking methodology and the Common Principles, in particular across more complex sectors and in jointly financed projects, and to harmonise the approach to reporting on climate resilience results.
In 2021, the MDBs commenced a review of the joint MDB methodology for tracking adaptation finance. This review aims to take stock of recent developments in the field of adaptation finance, MDBs’ efforts to support climate adaptation and resilience through a wide range of sectors beyond traditional infrastructure sectors, and the increasing diversity of financial modalities that are used to support adaptation and resilience. This review will complement ongoing efforts by MDBs to enhance the robustness and transparency of climate finance tracking and support climate action, in line with the objectives of the Paris Agreement.
The Climate Change Mitigation Working Group finalised its review of the tracking methodology for climate mitigation finance, and commenced tracking using the new methodology on 1 January 2021 for the AfDB, ADB, AIIB, EBRD, EIB, IDBG, IsDB and NDB and on 1 July 2021 for the WBG to coincide with the institutions’ new fiscal years. The new version of the methodology includes a more granular breakdown of types of eligible activity, clear criteria that must be met and additional guidance to facilitate the application of these criteria.
The MDBs will continue to improve their tracking and reporting of climate finance in the context of their commitments to ensure consistent financial flows to the countries’ long-term, low-carbon2 and climate-resilient development pathways, as established in Article 2.1(c) of the Paris Agreement. At COP25 in December 2019 the MDBs presented an update on their work to align with the Paris Agreement, including the key principles and criteria of their approach, as well as some draft methodological guidance on how to operationalise it. Furthermore, MDBs intend to ensure that the only activities they report as climate finance are those that are consistent with the countries’ long-term, low-carbon and climate-resilient pathways to meet the goals of the Paris Agreement. As the development of specific methodologies for assessing such consistency is a work in progress,
financial flows presented in this report are not necessarily considered to be consistent with the countries’ long-term, low-carbon and climate-resilient development pathways.
In 2020, MDBs responded to the global Covid-19 crisis through their individual response programmes. Countries now have a once-in-a-generation chance to set themselves on a green, resilient and inclusive development path. Decisions taken now will determine to what extent the world experiences renewed development progress, sustainable job creation and low-carbon, resilient economic transformation. Highlighting the importance of rebuilding healthier, greener, more inclusive and resilient economies, these programmes enabled countries to: improve people’s access to health services and essential supplies; provide humanitarian support to millions of highly affected people; maintain liquidity in businesses and households; and secure jobs and livelihoods. In addition, MDBs also sought to embed green and climate-focused solutions in their Covid-19 responses. Examples of such initiatives included the installation of renewable energy in health centres; the delivery of climate-smart agricultural interventions to avert hunger; sustainable water and sanitation solutions to improve public health and resource efficiency; and “shock-responsive” social protection programmes for vulnerable populations. While these pandemic programmes affected MDBs’ normal lending operations and thus, the delivery of their climate finance targets, interventions and support from MDBs laid a solid foundation for “building back better” for a greener, post-Covid-19 future.
This 2020 edition was prepared by the European Bank for Reconstruction and Development, together with partners the African Development Bank, the Asian Development Bank, the Asian Infrastructure Investment Bank, the European Investment Bank, the Inter-American Development Bank Group, the Islamic Development Bank, the New Development Bank and the World Bank Group. Special thanks to Nadya Myasnikova at the EBRD for coordination and successful delivery, over the past five years, of this flagship annual joint report on MDBs’ climate finance.
June 2021
2 “Low-carbon pathways” are also referred as to “low-greenhouse gas (GHG) emission pathways”.
www.ebrd.com/2020-joint-report-on-mdbs-climate-finance
www.ebrd.com/2020-joint-report-on-mdbs-climate-finance-infographic
Download this report at:
Download the infographic summary at:
2020 JOINT REPORT ON MULTILATERAL DEVELOPMENT BANKS’ CLIMATE FINANCE
5
EXECUTIVE SUMMARY
This tenth edition of the Joint Report on Multilateral Development Banks’ Climate Finance is an overview of climate finance committed in 2020 by the African Development Bank (AfDB), the Asian Development Bank (ADB), the Asian Infrastructure Investment Bank (AIIB), the European Bank for Reconstruction and Development (EBRD), the European Investment Bank (EIB), the Inter-American Development Bank Group (IDBG), the Islamic Development Bank (IsDB) and the World Bank Group (WBG). This year’s report summarises information on climate finance tracking from the New Development Bank (NDB), presented separately from the joint figures.3 NDB climate finance commitments are not yet included in the total MDB climate finance reported in this year’s edition.
The data and statistics presented in this year’s report result from the uniform application of the methodologies developed jointly by the MDBs for their annual commitments.
In this report, the term “MDB climate finance” refers to the financial resources (from own accounts and MDB-managed external resources) committed by MDBs to development operations and components thereof which enable activities that mitigate climate change and support adaptation to climate change.
The term “climate co-finance” refers to the volume of financial resources invested by other public and private external parties alongside MDBs for climate mitigation and adaptation activities. The MDBs have reported jointly on climate finance since the first edition in 2012, which reported figures for 2011, and have added joint reporting on climate co-finance since the 2015 edition.
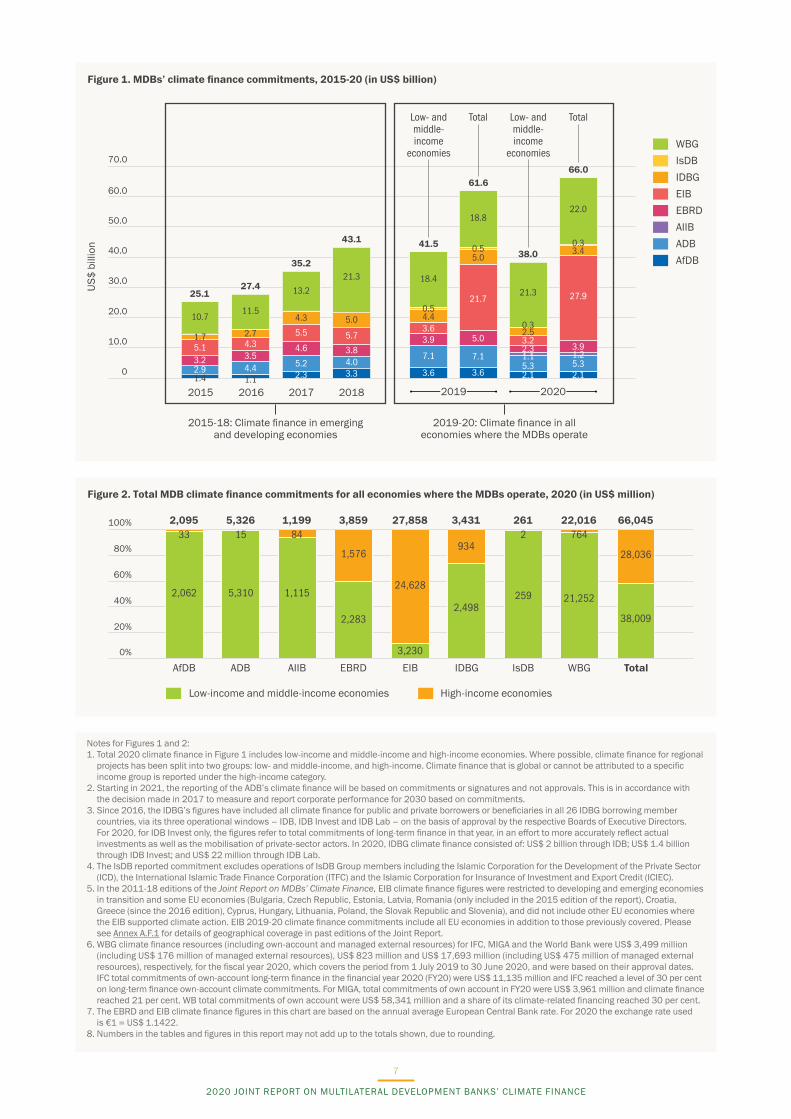
In total, the MDBs committed US$ 66,045 million in climate finance in 2020 – US$ 49,945 million or 76 per cent of this total for climate change mitigation finance and US$ 16,100 million or 24 per cent for climate change adaptation finance. The net total climate co-finance committed during 2020 alongside MDB resources was US$ 85,084 million. Together, MDB climate finance and climate co-finance totalled US$ 151,129 million.
The MDB climate finance commitments are presented separately in two main groups: 1) low-income and middle-income economies, a grouping that includes upper-middle, lower-middle and low-income economies, and 2) high-income economies. MDBs made an attempt to attribute climate finance in the category of global, multi-regional projects to specific income groups; when such attribution was not possible, they used a pro-rata approach. In 2020, US$ 38,009 million or 58 per cent of total MDB commitments was for low-income and middle-income economies and US$ 28,036 million or 42 per cent for high-income economies. See Figure 2 for the breakdown of climate finance by income group per institution. The economies are categorised by income grouping in accordance with the World Bank’s classification dated June 2020 (see Table A.F.1).
Figure 1 presents MDB climate finance commitments reported for 2015-18 for emerging and developing economies and for 2019-20 for all economies in which the MDBs operate. Figure 2 shows a more detailed breakdown of total MDB climate finance commitments in 2020 by MDB and by income group. Figure 3 outlines MDB climate finance commitments by income grouping, with the inclusion of total MDB climate finance for high-income economies that was not reported in the 2015-18 editions of the Joint Report on MDBs’ Climate Finance.
3 See page 9 for data on NDB climate finance commitments.
2020 JOINT REPORT ON MULTILATERAL DEVELOPMENT BANKS’ CLIMATE FINANCE
6
WBGIsDBIDBGEIBEBRDAIIBADBAfDB
US$
bill
ion
2015
2015-18: Climate finance in emerging and developing economies
2019-20: Climate finance in all economies where the MDBs operate
2017 2018
Low- and middle-income
economies
Total Low- and middle-income
economies
Total
2016
30.0
40.0
70.0
60.0
20.0
50.0
0
10.0
2019 2020
25.1
10.711.5
13.2
21.3 18.4
18.8
0.55.0
21.3
22.0
0.33.4
27.9
3.91.25.32.1
0.32.53.22.31.15.32.1
21.7
5.0
7.1
3.6
0.54.43.63.9
7.1
3.6
5.0
5.7
3.84.03.3
4.3
5.5
4.6
5.22.3
2.7
1.1
4.33.54.4
1.75.13.22.91.4
27.4
35.2
43.1 41.5
61.6
38.0
66.0
Figure 1. MDBs’ climate finance commitments, 2015-20 (in US$ billion)
Low-income and middle-income economies High-income economies
AfDB ADB AIIB EBRD EIB IDBG IsDB WBG Total
100%
80%
60%
40%
20%
0%
2,062
332,095
5,310
155,326
1,115
841,199
2,283
1,576
3,859
3,230
24,628
27,858
2,498
934
3,431
259
2261
21,252
76422,016
38,009
28,036
66,045
Figure 2. Total MDB climate finance commitments for all economies where the MDBs operate, 2020 (in US$ million)
Notes for Figures 1 and 2:1. Total 2020 climate finance in Figure 1 includes low-income and middle-income and high-income economies. Where possible, climate finance for regional
projects has been split into two groups: low- and middle-income, and high-income. Climate finance that is global or cannot be attributed to a specific income group is reported under the high-income category.
2. Starting in 2021, the reporting of the ADB’s climate finance will be based on commitments or signatures and not approvals. This is in accordance with the decision made in 2017 to measure and report corporate performance for 2030 based on commitments.
3. Since 2016, the IDBG̓s figures have included all climate finance for public and private borrowers or beneficiaries in all 26 IDBG borrowing member countries, via its three operational windows – IDB, IDB Invest and IDB Lab – on the basis of approval by the respective Boards of Executive Directors. For 2020, for IDB Invest only, the figures refer to total commitments of long-term finance in that year, in an effort to more accurately reflect actual investments as well as the mobilisation of private-sector actors. In 2020, IDBG climate finance consisted of: US$ 2 billion through IDB; US$ 1.4 billion through IDB Invest; and US$ 22 million through IDB Lab.
4. The IsDB reported commitment excludes operations of IsDB Group members including the Islamic Corporation for the Development of the Private Sector (ICD), the International Islamic Trade Finance Corporation (ITFC) and the Islamic Corporation for Insurance of Investment and Export Credit (ICIEC).
5. In the 2011-18 editions of the Joint Report on MDBs’ Climate Finance, EIB climate finance figures were restricted to developing and emerging economies in transition and some EU economies (Bulgaria, Czech Republic, Estonia, Latvia, Romania (only included in the 2015 edition of the report), Croatia, Greece (since the 2016 edition), Cyprus, Hungary, Lithuania, Poland, the Slovak Republic and Slovenia), and did not include other EU economies where the EIB supported climate action. EIB 2019-20 climate finance commitments include all EU economies in addition to those previously covered. Please see Annex A.F.1 for details of geographical coverage in past editions of the Joint Report.
6. WBG climate finance resources (including own-account and managed external resources) for IFC, MIGA and the World Bank were US$ 3,499 million (including US$ 176 million of managed external resources), US$ 823 million and US$ 17,693 million (including US$ 475 million of managed external resources), respectively, for the fiscal year 2020, which covers the period from 1 July 2019 to 30 June 2020, and were based on their approval dates. IFC total commitments of own-account long-term finance in the financial year 2020 (FY20) were US$ 11,135 million and IFC reached a level of 30 per cent on long-term finance own-account climate commitments. For MIGA, total commitments of own account in FY20 were US$ 3,961 million and climate finance reached 21 per cent. WB total commitments of own account were US$ 58,341 million and a share of its climate-related financing reached 30 per cent.
7. The EBRD and EIB climate finance figures in this chart are based on the annual average European Central Bank rate. For 2020 the exchange rate used is €1 = US$ 1.1422.
8. Numbers in the tables and figures in this report may not add up to the totals shown, due to rounding.
2020 JOINT REPORT ON MULTILATERAL DEVELOPMENT BANKS’ CLIMATE FINANCE
7
Multi-regionalLow-income Lower-middle income
Upper-middle income
High-income High-income (not reported in previous editions)
2015 2016 2017 2018 2019 2020
25
30
20
15
10
5
0
25
30
20
15
10
5
022 11
11
17
12
2
6
20 20
1716 16
11
2
108
3
18
13 14
5 4
1412
19
43 3 3 3
28
3
43 44 51 56 62 66
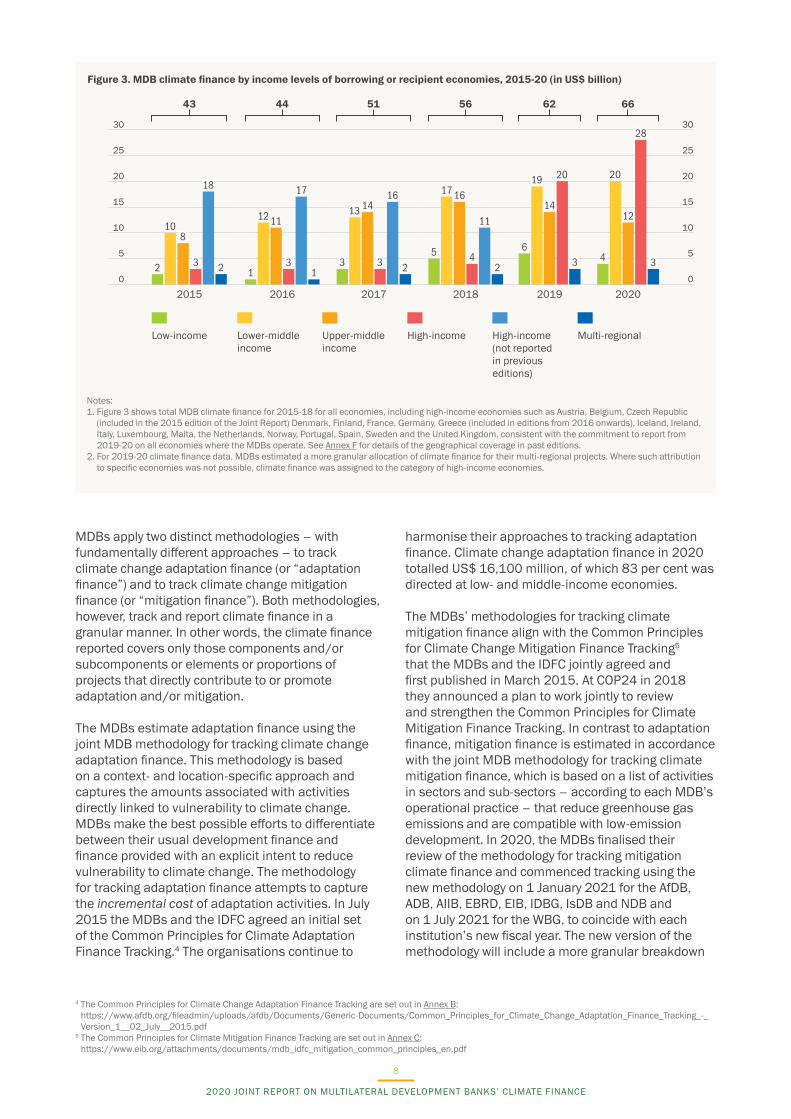
Figure 3. MDB climate finance by income levels of borrowing or recipient economies, 2015-20 (in US$ billion)
Notes: 1. Figure 3 shows total MDB climate finance for 2015-18 for all economies, including high-income economies such as Austria, Belgium, Czech Republic
(included in the 2015 edition of the Joint Report) Denmark, Finland, France, Germany, Greece (included in editions from 2016 onwards), Iceland, Ireland, Italy, Luxembourg, Malta, the Netherlands, Norway, Portugal, Spain, Sweden and the United Kingdom, consistent with the commitment to report from 2019-20 on all economies where the MDBs operate. See Annex F for details of the geographical coverage in past editions.
2. For 2019-20 climate finance data, MDBs estimated a more granular allocation of climate finance for their multi-regional projects. Where such attribution to specific economies was not possible, climate finance was assigned to the category of high-income economies.
MDBs apply two distinct methodologies – with fundamentally different approaches – to track climate change adaptation finance (or “adaptation finance”) and to track climate change mitigation finance (or “mitigation finance”). Both methodologies, however, track and report climate finance in a granular manner. In other words, the climate finance reported covers only those components and/or subcomponents or elements or proportions of projects that directly contribute to or promote adaptation and/or mitigation.
The MDBs estimate adaptation finance using the joint MDB methodology for tracking climate change adaptation finance. This methodology is based on a context- and location-specific approach and captures the amounts associated with activities directly linked to vulnerability to climate change. MDBs make the best possible efforts to differentiate between their usual development finance and finance provided with an explicit intent to reduce vulnerability to climate change. The methodology for tracking adaptation finance attempts to capture the incremental cost of adaptation activities. In July 2015 the MDBs and the IDFC agreed an initial set of the Common Principles for Climate Adaptation Finance Tracking.4 The organisations continue to
harmonise their approaches to tracking adaptation finance. Climate change adaptation finance in 2020 totalled US$ 16,100 million, of which 83 per cent was directed at low- and middle-income economies.
The MDBs’ methodologies for tracking climate mitigation finance align with the Common Principles for Climate Change Mitigation Finance Tracking5 that the MDBs and the IDFC jointly agreed and first published in March 2015. At COP24 in 2018 they announced a plan to work jointly to review and strengthen the Common Principles for Climate Mitigation Finance Tracking. In contrast to adaptation finance, mitigation finance is estimated in accordance with the joint MDB methodology for tracking climate mitigation finance, which is based on a list of activities in sectors and sub-sectors – according to each MDB’s operational practice – that reduce greenhouse gas emissions and are compatible with low-emission development. In 2020, the MDBs finalised their review of the methodology for tracking mitigation climate finance and commenced tracking using the new methodology on 1 January 2021 for the AfDB, ADB, AIIB, EBRD, EIB, IDBG, IsDB and NDB and on 1 July 2021 for the WBG, to coincide with each institution’s new fiscal year. The new version of the methodology will include a more granular breakdown
4 The Common Principles for Climate Change Adaptation Finance Tracking are set out in Annex B: https://www.afdb.org/fileadmin/uploads/afdb/Documents/Generic-Documents/Common_Principles_for_Climate_Change_Adaptation_Finance_Tracking_-_Version_1__02_July__2015.pdf
5 The Common Principles for Climate Mitigation Finance Tracking are set out in Annex C: https://www.eib.org/attachments/documents/mdb_idfc_mitigation_common_principles_en.pdf
2020 JOINT REPORT ON MULTILATERAL DEVELOPMENT BANKS’ CLIMATE FINANCE
8
of types of eligible activity, clear criteria that must be met and additional guidance to help interpretation. Climate change mitigation finance in 2020 totalled US$ 49,945 million, of which 49 per cent was directed at low-income and middle-income economies.
In addition to reporting on mitigation and adaptation finance, some MDBs report on volumes of climate finance that have dual, simultaneous benefits: reducing GHGs and promoting adaptation to climate change. In 2020, the AIIB, EBRD and IDBG reported a total of US$ 795 million for dual-benefit projects. See Annex D for further climate finance statistics and examples of such projects. Given the relatively smaller volumes of “dual-benefit” climate finance and in order
to simplify data presentation the tables (see notes to Table 3) and graphs throughout this report present data by mitigation or adaptation finance, as indicated by the reporting MDBs.
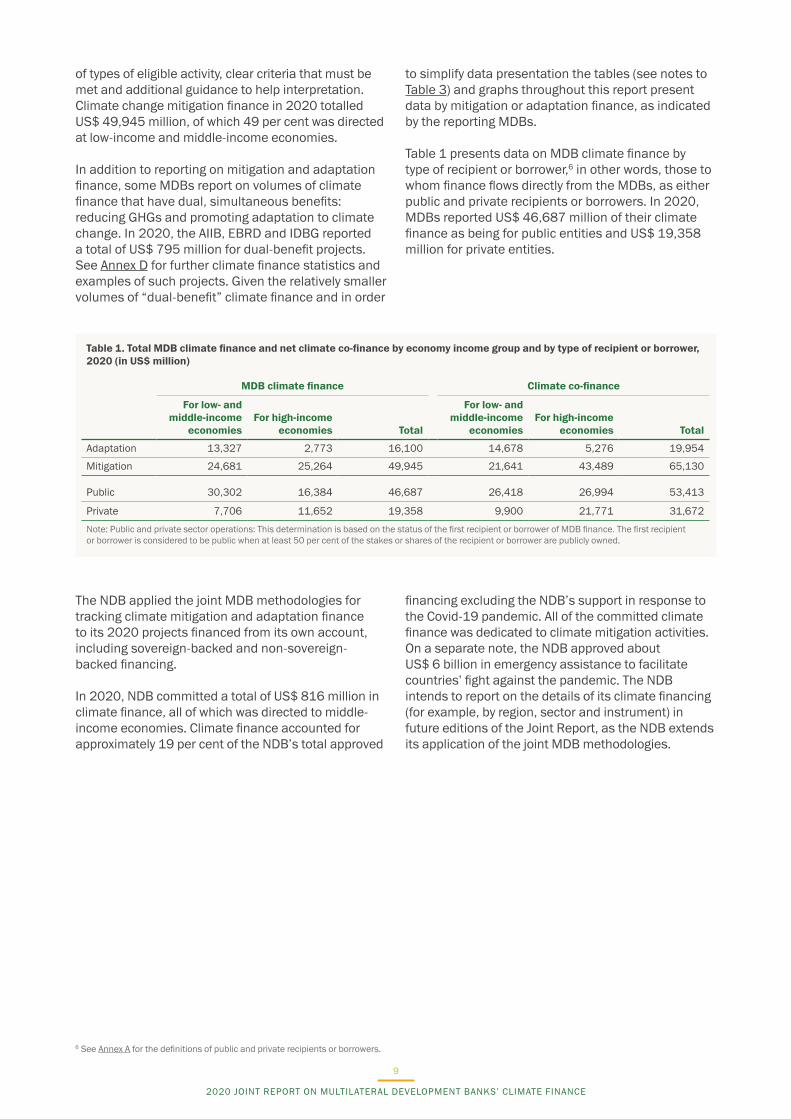
Table 1 presents data on MDB climate finance by type of recipient or borrower,6 in other words, those to whom finance flows directly from the MDBs, as either public and private recipients or borrowers. In 2020, MDBs reported US$ 46,687 million of their climate finance as being for public entities and US$ 19,358 million for private entities.
6 See Annex A for the definitions of public and private recipients or borrowers.
Table 1. Total MDB climate finance and net climate co-finance by economy income group and by type of recipient or borrower, 2020 (in US$ million)
MDB climate finance Climate co-finance
For low- and middle-income
economiesFor high-income
economies Total
For low- and middle-income
economiesFor high-income
economies Total
Adaptation 13,327 2,773 16,100 14,678 5,276 19,954
Mitigation 24,681 25,264 49,945 21,641 43,489 65,130
Public 30,302 16,384 46,687 26,418 26,994 53,413
Private 7,706 11,652 19,358 9,900 21,771 31,672
Note: Public and private sector operations: This determination is based on the status of the first recipient or borrower of MDB finance. The first recipient or borrower is considered to be public when at least 50 per cent of the stakes or shares of the recipient or borrower are publicly owned.
The NDB applied the joint MDB methodologies for tracking climate mitigation and adaptation finance to its 2020 projects financed from its own account, including sovereign-backed and non-sovereign-backed financing.
In 2020, NDB committed a total of US$ 816 million in climate finance, all of which was directed to middle-income economies. Climate finance accounted for approximately 19 per cent of the NDB’s total approved
financing excluding the NDB’s support in response to the Covid-19 pandemic. All of the committed climate finance was dedicated to climate mitigation activities. On a separate note, the NDB approved about US$ 6 billion in emergency assistance to facilitate countries’ fight against the pandemic. The NDB intends to report on the details of its climate financing (for example, by region, sector and instrument) in future editions of the Joint Report, as the NDB extends its application of the joint MDB methodologies.
2020 JOINT REPORT ON MULTILATERAL DEVELOPMENT BANKS’ CLIMATE FINANCE
9
OVERVIEW OF MDB METHODOLOGIES FOR TRACKING CLIMATE FINANCE
1
The tracking of MDB climate finance is based on the harmonised principles and jointly agreed methodologies detailed in Annexes B and C of this report. In this publication, the term “MDB climate finance” refers to the amounts committed by MDBs to finance climate change mitigation and adaptation activities in the projects they undertake. See Annex F for details of the 2020 report’s geographic coverage, and that of past editions.
MDB climate finance includes commitments from the MDBs’ own accounts, and from external resources channelled through and managed by the banks. Climate co-finance includes the amount of financial resources contributed by external resources alongside MDB climate finance. These may include entities from both the private (commercial) and public (non-commercial) sectors.
1.1. FINANCE FOR ADAPTATION TO CLIMATE CHANGE
Climate change adaptation aims to reduce the risks or vulnerabilities posed by climate change and to increase climate resilience. Identification of climate change adaptation finance is the result of a three-step process and thus, for a project to be counted either fully or partially towards MDB adaptation finance, it must:
a. set out the project’s context of vulnerability to climate change
b. make an explicit statement of intent to address this vulnerability as part of the project, and
c. articulate a clear and direct link between the vulnerability and the specific project activities.
The MDB methodology for tracking climate change adaptation finance follows a context- and location-specific, conservative and granular approach. It tracks MDB financing only for those components and/or subcomponents or elements or proportions of projects that directly contribute to or promote adaptation. It is important to note the following:
a. The adaptation finance reported might not capture certain activities that might contribute significantly to resilience, but cannot always be tracked in quantitative terms (for example, operational procedures that support adaptation to climate change) or might not be associated with costs (such as siting assets outside flood-prone areas).
b. Climate adaptation finance, as defined by the methodology, is not intended to capture the value of an entire project or investment that may increase resilience as a result of specific adaptation activities that take place as part of the project.
The joint methodology for tracking climate adaptation finance is contained in Annex B of this report.
1.2. FINANCE FOR THE MITIGATION OF CLIMATE CHANGE
Climate change mitigation reduces, limits or sequesters greenhouse gas (GHG) emissions to mitigate climate change. However, not all activities that reduce GHGs are eligible to be counted towards MDB mitigation finance, which is calculated based on a list of activities that are compatible with low-emission pathways.
The joint methodology for tracking climate change mitigation finance recognises the importance of long-term structural changes, such as the shift to renewable energy technologies, and the modal shift to low-carbon modes of transport. Consequently, the methodology includes both greenfield and brownfield renewable energy projects as well as modal-shift projects in transport. For energy efficiency projects the methodology acknowledges that drawing a boundary between increasing production and reducing emissions per unit of output is difficult. Consequently, greenfield energy efficiency investments are included only in a few cases where they help to prevent a long-term lock-in to high-carbon infrastructure. For brownfield energy efficiency investments to be considered as climate finance, old technologies must be replaced, retrofitted or retired well before the end of their lifetimes with new technologies that are substantially more efficient. Alternatively, new technologies or processes are required to be substantially more efficient than those normally used in greenfield projects.
The methodology has some explicit exclusions in certain sectors. Examples include hydropower plants with high methane emissions from reservoirs that exceed GHG reductions associated with the plant’s renewable energy output; geothermal power plants with a high carbon dioxide (CO2) content in the geothermal fluid that cannot be reinjected; and biofuel projects that deplete carbon pools more than they reduce GHG emissions, due to high emissions during production, processing and transportation.
10
2020 JOINT REPORT ON MULTILATERAL DEVELOPMENT BANKS’ CLIMATE FINANCE

The joint methodology for tracking climate mitigation finance is contained in Annex C of this report.7
There are fundamental differences between the tracking methodologies for climate change adaptation activities and those for mitigation activities. For mitigation activities, a one-tonne reduction in CO2 emissions has the same impact regardless of where the activities take place. It is therefore possible to define lists of typical activities that are deemed to support the path to low-carbon development.
However, adaptation activities are project- and location-specific, and they respond to specific climate vulnerabilities. Therefore, unlike mitigation activities, it is not possible to produce a standalone “list of adaptation activities” that can be used under all circumstances.
When comparing climate finance data, it is important to understand the differences and similarities. Table 2 summarises the key points in this regard.
7 As highlighted in the executive summary of this report, the MDBs finalised in 2020 their review of the methodology for tracking climate change mitigation finance, with the aim of commencing tracking using the new methodology in 2021.
Table 2. Comparison of methodologies for tracking adaptation and mitigation finance
Item
CLIMATE CHANGE ACTIVITY
Adaptation Mitigation
General scope of qualifying activity
The activity is typically a component or element of a project, and in certain circumstances an entire project, contributing to resilience (including socioeconomic resilience) or adaptation to climate change.
This is typically a project (or component thereof) that avoids, reduces or sequesters GHG emissions, or promotes efforts to achieve these goals.
Basis for tracking Adaptation finance tracking is incremental (component based); it only takes into account those activities that specifically address vulnerability to climate change. Eligible components are usually parts of a larger project, for example, water-saving equipment that is part of a larger capital expenditure (capex) investment in an area vulnerable to increased risk of drought.
Mitigation finance tracking is either project- or component-based. Project-based: If the whole project is considered to be a mitigation activity, for example, a typical renewable energy project or a project dedicated to improving the energy efficiency of an existing facility, then 100 per cent of the project investment is considered to be mitigation finance.Component-based: In a project, if only a component of that project is a mitigation activity, such as energy efficiency equipment that is part of a larger capex investment, then the respective fraction of the project is considered to be mitigation finance.
Granular approach to finance tracking
The adaptation finance methodology intends to capture only the value of those activities within the project that are aimed at addressing specific climate vulnerabilities. It is not intended to capture the value of the entire project that is made more climate-resilient as a consequence of specific adaptation activities within the project.
A granular approach is used. Climate finance methodology intends to capture only the value of the project or its components that avoid, reduce, limit, sequester or promote the avoidance, reduction, limitation or sequestration of GHG emissions and are specified in the eligible list of activities.
Scale of impact Local, regional, national or global Global
Indicator(s) to quantify and compare project outcomes
Multiple (project- and context-specific) indicators are needed; the intended outcomes depend on the nature of the project.
Ultimately, all mitigation projects can be compared on the basis of their direct or indirect reduction of GHGs (for example, systems for monitoring GHGs that lead to better use of energy systems).
Qualification for climate finance
Qualification is based on a three-step assessment process, taking into account the climate change vulnerability context and the specific project intent to reduce climate vulnerabilities.
Qualification is based on a “positive list” of activities that qualify for mitigation finance and a set of specific qualification and exclusion criteria.
Climate finance tracking
Following the three-step assessment process, a share of those project components that are clearly and directly linked to the climate vulnerability context and contribute to climate change resilience is classified as climate change adaptation finance.
Following the positive-list approach, financing of the eligible project activities is classified as climate change mitigation finance.
See Annexes B and C for a full description of the methodologies and examples of their application to MDB projects in an array of sectors.
11
2020 JOINT REPORT ON MULTILATERAL DEVELOPMENT BANKS’ CLIMATE FINANCE
MDB CLIMATE FINANCE, 20202
2.1. TOTAL MDB CLIMATE FINANCE
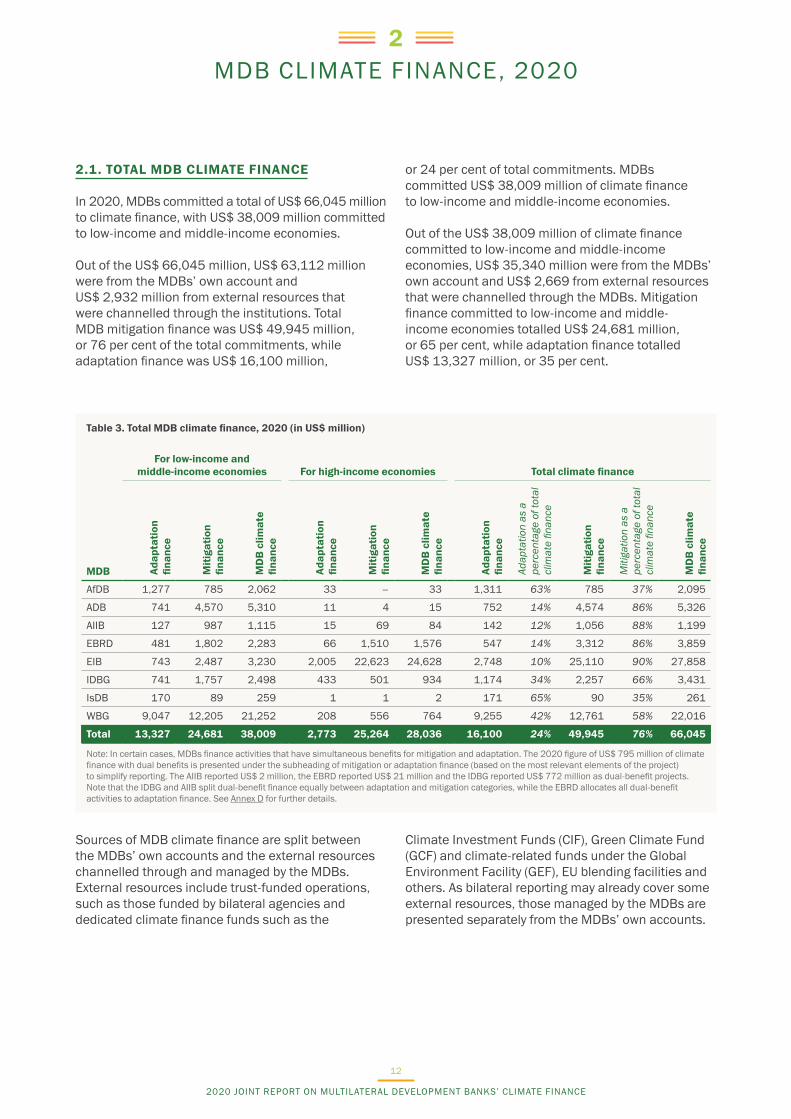
In 2020, MDBs committed a total of US$ 66,045 million to climate finance, with US$ 38,009 million committed to low-income and middle-income economies.
Out of the US$ 66,045 million, US$ 63,112 million were from the MDBs’ own account and US$ 2,932 million from external resources that were channelled through the institutions. Total MDB mitigation finance was US$ 49,945 million, or 76 per cent of the total commitments, while adaptation finance was US$ 16,100 million,
or 24 per cent of total commitments. MDBs committed US$ 38,009 million of climate finance to low-income and middle-income economies.
Out of the US$ 38,009 million of climate finance committed to low-income and middle-income economies, US$ 35,340 million were from the MDBs’ own account and US$ 2,669 from external resources that were channelled through the MDBs. Mitigation finance committed to low-income and middle-income economies totalled US$ 24,681 million, or 65 per cent, while adaptation finance totalled US$ 13,327 million, or 35 per cent.
Table 3. Total MDB climate finance, 2020 (in US$ million)
For low-income and middle-income economies For high-income economies Total climate finance
MDB Adap
tatio
n fin
ance
Miti
gatio
n
finan
ce
MD
B c
limat
e fin
ance
Adap
tatio
n fin
ance
Miti
gatio
n
finan
ce
MD
B c
limat
e fin
ance
Adap
tatio
n fin
ance
Adap
tatio
n as
a
perc
enta
ge o
f tot
al
clim
ate
finan
ce
Miti
gatio
n
finan
ce
Miti
gatio
n as
a
perc
enta
ge o
f tot
al
clim
ate
finan
ce
MD
B c
limat
e fin
ance
AfDB 1,277 785 2,062 33 – 33 1,311 63% 785 37% 2,095
ADB 741 4,570 5,310 11 4 15 752 14% 4,574 86% 5,326
AIIB 127 987 1,115 15 69 84 142 12% 1,056 88% 1,199
EBRD 481 1,802 2,283 66 1,510 1,576 547 14% 3,312 86% 3,859
EIB 743 2,487 3,230 2,005 22,623 24,628 2,748 10% 25,110 90% 27,858
IDBG 741 1,757 2,498 433 501 934 1,174 34% 2,257 66% 3,431
IsDB 170 89 259 1 1 2 171 65% 90 35% 261
WBG 9,047 12,205 21,252 208 556 764 9,255 42% 12,761 58% 22,016
Total 13,327 24,681 38,009 2,773 25,264 28,036 16,100 24% 49,945 76% 66,045
Note: In certain cases, MDBs finance activities that have simultaneous benefits for mitigation and adaptation. The 2020 figure of US$ 795 million of climate finance with dual benefits is presented under the subheading of mitigation or adaptation finance (based on the most relevant elements of the project) to simplify reporting. The AIIB reported US$ 2 million, the EBRD reported US$ 21 million and the IDBG reported US$ 772 million as dual-benefit projects. Note that the IDBG and AIIB split dual-benefit finance equally between adaptation and mitigation categories, while the EBRD allocates all dual-benefit activities to adaptation finance. See Annex D for further details.
Sources of MDB climate finance are split between the MDBs’ own accounts and the external resources channelled through and managed by the MDBs. External resources include trust-funded operations, such as those funded by bilateral agencies and dedicated climate finance funds such as the
Climate Investment Funds (CIF), Green Climate Fund (GCF) and climate-related funds under the Global Environment Facility (GEF), EU blending facilities and others. As bilateral reporting may already cover some external resources, those managed by the MDBs are presented separately from the MDBs’ own accounts.
2020 JOINT REPORT ON MULTILATERAL DEVELOPMENT BANKS’ CLIMATE FINANCE
12
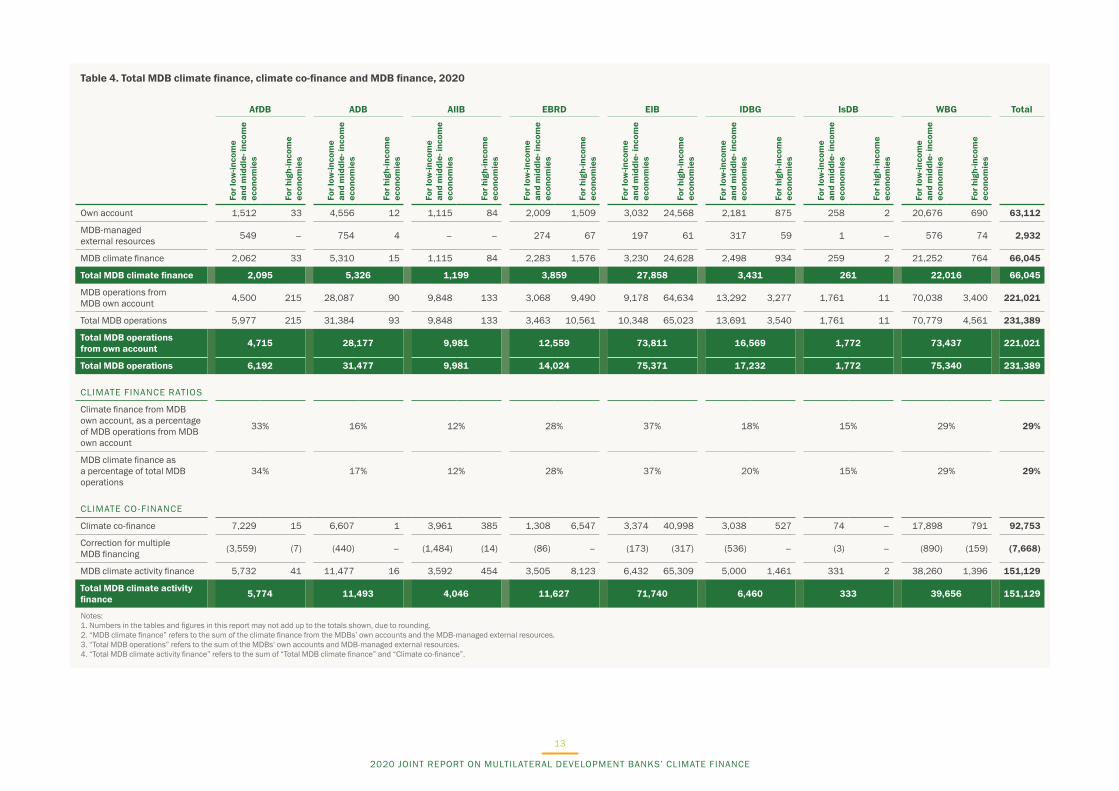
Table 4. Total MDB climate finance, climate co-finance and MDB finance, 2020
AfDB ADB AIIB EBRD EIB IDBG IsDB WBG Total
For l
ow-in
com
e
and
mid
dle-
inco
me
econ
omie
s
For h
igh-
inco
me
econ
omie
s
For l
ow-in
com
e
and
mid
dle-
inco
me
econ
omie
s
For h
igh-
inco
me
econ
omie
s
For l
ow-in
com
e
and
mid
dle-
inco
me
econ
omie
s
For h
igh-
inco
me
econ
omie
s
For l
ow-in
com
e
and
mid
dle-
inco
me
econ
omie
s
For h
igh-
inco
me
econ
omie
s
For l
ow-in
com
e
and
mid
dle-
inco
me
econ
omie
s
For h
igh-
inco
me
econ
omie
s
For l
ow-in
com
e
and
mid
dle-
inco
me
econ
omie
s
For h
igh-
inco
me
econ
omie
s
For l
ow-in
com
e
and
mid
dle-
inco
me
econ
omie
s
For h
igh-
inco
me
econ
omie
s
For l
ow-in
com
e
and
mid
dle-
inco
me
econ
omie
s
For h
igh-
inco
me
econ
omie
s
Own account 1,512 33 4,556 12 1,115 84 2,009 1,509 3,032 24,568 2,181 875 258 2 20,676 690 63,112
MDB-managed external resources 549 – 754 4 – – 274 67 197 61 317 59 1 – 576 74 2,932
MDB climate finance 2,062 33 5,310 15 1,115 84 2,283 1,576 3,230 24,628 2,498 934 259 2 21,252 764 66,045
Total MDB climate finance 2,095 5,326 1,199 3,859 27,858 3,431 261 22,016 66,045
MDB operations from MDB own account 4,500 215 28,087 90 9,848 133 3,068 9,490 9,178 64,634 13,292 3,277 1,761 11 70,038 3,400 221,021
Total MDB operations 5,977 215 31,384 93 9,848 133 3,463 10,561 10,348 65,023 13,691 3,540 1,761 11 70,779 4,561 231,389
Total MDB operations from own account 4,715 28,177 9,981 12,559 73,811 16,569 1,772 73,437 221,021
Total MDB operations 6,192 31,477 9,981 14,024 75,371 17,232 1,772 75,340 231,389
CLIMATE FINANCE RATIOS
Climate finance from MDB own account, as a percentage of MDB operations from MDB own account
33% 16% 12% 28% 37% 18% 15% 29% 29%
MDB climate finance as a percentage of total MDB operations
34% 17% 12% 28% 37% 20% 15% 29% 29%
CLIMATE CO-FINANCE
Climate co-finance 7,229 15 6,607 1 3,961 385 1,308 6,547 3,374 40,998 3,038 527 74 – 17,898 791 92,753
Correction for multiple MDB financing (3,559) (7) (440) – (1,484) (14) (86) – (173) (317) (536) – (3) – (890) (159) (7,668)
MDB climate activity finance 5,732 41 11,477 16 3,592 454 3,505 8,123 6,432 65,309 5,000 1,461 331 2 38,260 1,396 151,129
Total MDB climate activity finance 5,774 11,493 4,046 11,627 71,740 6,460 333 39,656 151,129
Notes: 1. Numbers in the tables and figures in this report may not add up to the totals shown, due to rounding.2. “MDB climate finance” refers to the sum of the climate finance from the MDBs’ own accounts and the MDB-managed external resources.3. “Total MDB operations” refers to the sum of the MDBs’ own accounts and MDB-managed external resources.4. “Total MDB climate activity finance” refers to the sum of “Total MDB climate finance” and “Climate co-finance”.
2020 JOINT REPORT ON MULTILATERAL DEVELOPMENT BANKS’ CLIMATE FINANCE
13

MDBs’ CLIMATE FINANCE DELIVERY DURING COVID-19
The summary below provides additional information on each MDB’s climate finance results related to their Covid-19 response operations. As MDBs have different approaches to classifying and quantifying investments for Covid-19 response projects, the information presented here should not be used for the purposes of comparison.
The AfDB approved a US$ 10 billion Covid-19 Response Facility (CRF) in 2020. The Bank’s total approved operations for the same year were US$ 6.2 billion. While the AfDB’s climate finance share stood at 34 per cent, without CRF projects, climate finance stood at 44 per cent.
The ADB in 2020 provided US$ 10,097 million of comprehensive response to the Covid-19 pandemic through its Covid-19 Pandemic Response Option (CPRO). Therefore, without taking this into consideration in the total operations, the ADB’s climate finance share reached 25 per cent compared with the 16 per cent reported in Table 4.
The AIIB’s 2020 climate finance share was calculated including projects financed through the Bank̓s Covid-19 Crisis Recovery Facility (CRF). This share would be 41 per cent if CRF projects were excluded. The AIIB̓s CRF is a temporary facility designed specifically to respond to the Covid-19 crisis and does not represent the Bank̓s usual financing focus. The nature of AIIB CRF projects means that they have few or no climate finance components.
The EBRD reported record investment of €11 billion in 2020, including Covid-19 response projects committed through the Bank’s Solidarity Package, which was approved for a total volume of €21 billion. The EBRD dedicated a large portion of its investment to directly helping its clients and investee economies fight the impact of the pandemic. The Bank achieved this through crisis response instruments for short-term liquidity and working capital that, by nature, did not support new capital expenditure in the green economy. While the level of green finance remained high in other areas of EBRD activity, the overall percentage of climate finance for 2020 reflects the limited opportunities for such investment under the Bank’s crisis response.
The EIB Group’s financing to tackle the Covid-19 crisis totalled €25.5 billion in 2020, with €49 billion of further financing being approved for financing in future reporting years. In tackling the pandemic, the EIB Group decided to uphold delivery against its climate finance target and achieve an overall climate finance share of 37 per cent of total lending. This decision, however, has resulted in an overall reduction in climate finance provided to middle- to low-income countries as compared with the Group’s 2019 results.
The IDB invested US$ 2 billion in climate finance in 2020, equivalent to 15 per cent of the total portfolio amount approved. Excluding Covid-19-related investments,8 IDB climate finance reached 30 per cent of the total amount approved. Changes in demand from countries affected the overall climate finance results.
The IsDB9 committed US$ 1.5 billion to the IsDB Group’s Strategic Preparedness and Response Programme (SPRP) for the Covid-19 pandemic, to support its member countries’ efforts to respond, restore and restart. The Bank’s 2020 climate finance including the Covid-19 SPRP commitment amounted to 15 per cent while its climate finance commitment excluding Covid-19 SPRP commitment amounted to 18 per cent.
The World Bank Group made a strategic choice to define its Covid-19 operations as all those contributing to addressing the crisis and supporting the recovery and, as such, for FY20, which ended in June 2020, the Group did not separately report climate finance excluding Covid-19 operations. Over a 15-month period ending June 2021, the WBG is expected to make available up to US$ 160 billion to 112 countries to address the health, economic and social shocks from the Covid-19 pandemic. This figure includes US$ 50 billion of new concessional transfers from IDA, with built-in debt relief for countries at risk of debt distress.
8 In the case of the IDB, Covid-19 operations include all prototypes for Covid-19 response, Special Development Lending (SDL) operations and contingent loans that cover in their totality the response to the pandemic.
9 This committed amount is for the IsDB and does not include the commitments of IsDB Group entities ICD, ICIEC and ITFC to addressing the Covid-19 pandemic.
2020 JOINT REPORT ON MULTILATERAL DEVELOPMENT BANKS’ CLIMATE FINANCE
14
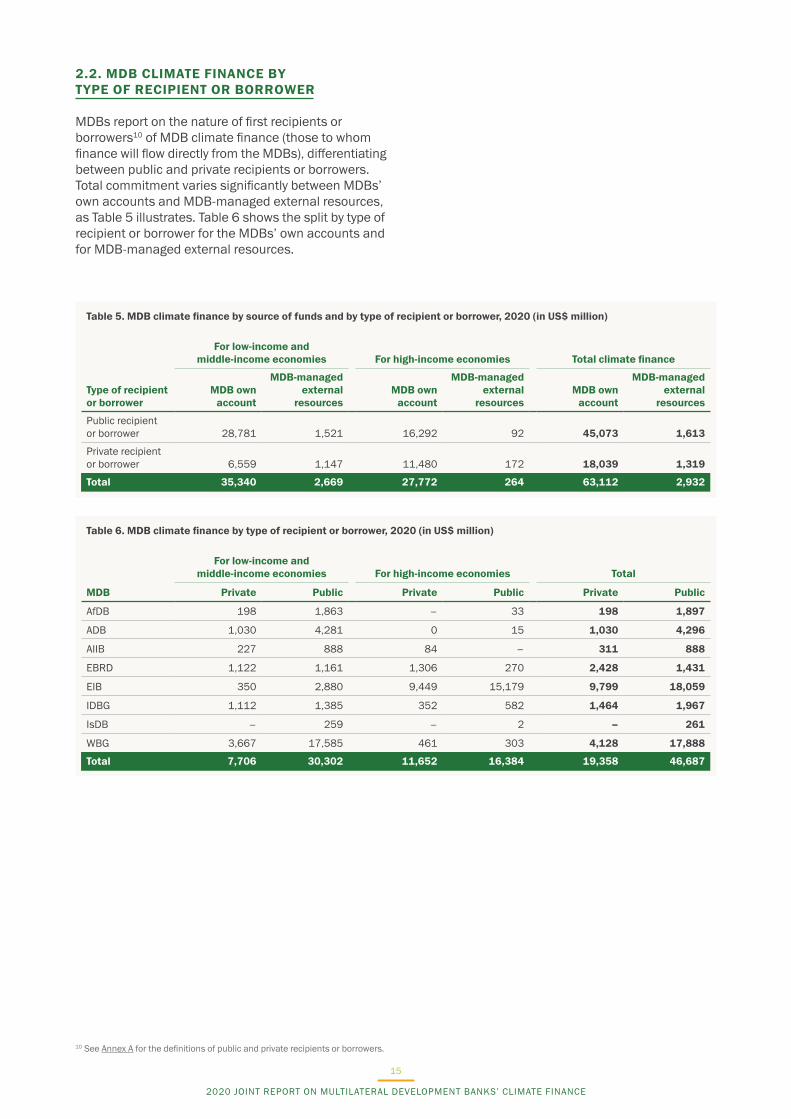
2.2. MDB CLIMATE FINANCE BY TYPE OF RECIPIENT OR BORROWER
MDBs report on the nature of first recipients or borrowers10 of MDB climate finance (those to whom finance will flow directly from the MDBs), differentiating between public and private recipients or borrowers. Total commitment varies significantly between MDBs’ own accounts and MDB-managed external resources, as Table 5 illustrates. Table 6 shows the split by type of recipient or borrower for the MDBs’ own accounts and for MDB-managed external resources.
Table 5. MDB climate finance by source of funds and by type of recipient or borrower, 2020 (in US$ million)
For low-income and middle-income economies For high-income economies Total climate finance
Type of recipient or borrower
MDB own account
MDB-managed external
resourcesMDB own
account
MDB-managed external
resourcesMDB own
account
MDB-managed external
resources
Public recipient or borrower 28,781 1,521 16,292 92 45,073 1,613
Private recipient or borrower 6,559 1,147 11,480 172 18,039 1,319
Total 35,340 2,669 27,772 264 63,112 2,932
Table 6. MDB climate finance by type of recipient or borrower, 2020 (in US$ million)
For low-income and middle-income economies For high-income economies Total
MDB Private Public Private Public Private Public
AfDB 198 1,863 – 33 198 1,897
ADB 1,030 4,281 0 15 1,030 4,296
AIIB 227 888 84 – 311 888
EBRD 1,122 1,161 1,306 270 2,428 1,431
EIB 350 2,880 9,449 15,179 9,799 18,059
IDBG 1,112 1,385 352 582 1,464 1,967
IsDB – 259 – 2 – 261
WBG 3,667 17,585 461 303 4,128 17,888
Total 7,706 30,302 11,652 16,384 19,358 46,687
10 See Annex A for the definitions of public and private recipients or borrowers.
2020 JOINT REPORT ON MULTILATERAL DEVELOPMENT BANKS’ CLIMATE FINANCE
15
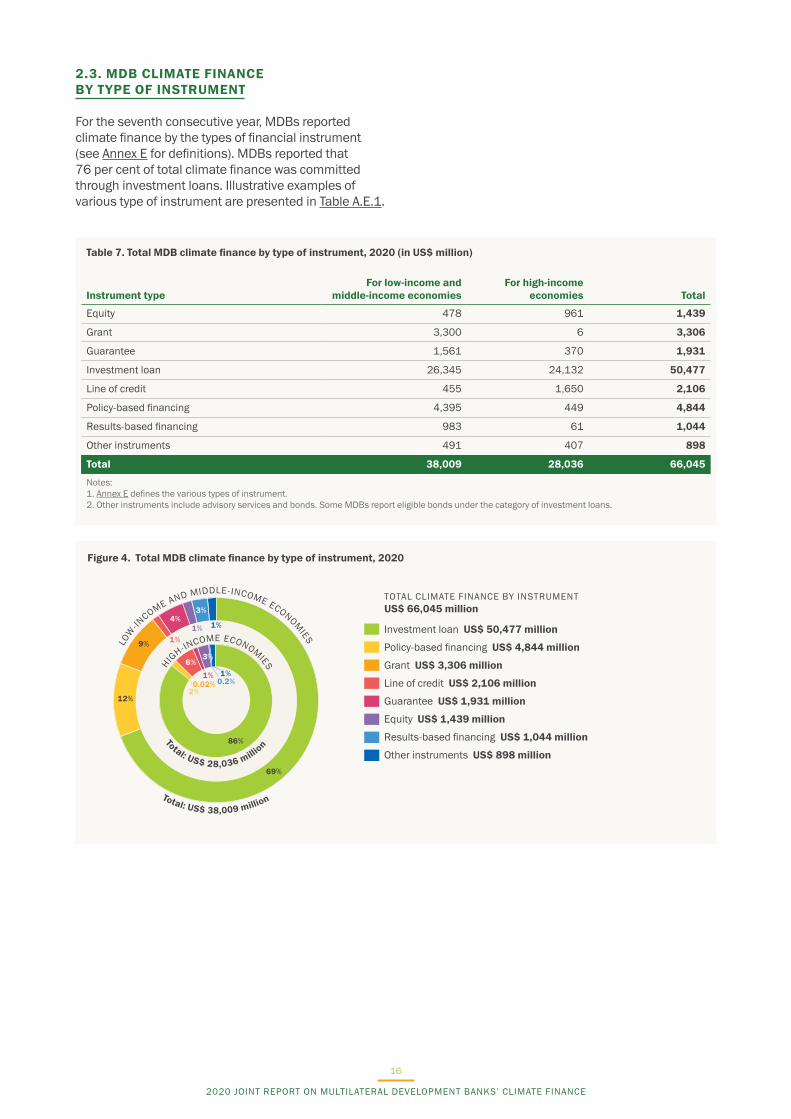
2.3. MDB CLIMATE FINANCE BY TYPE OF INSTRUMENT
For the seventh consecutive year, MDBs reported climate finance by the types of financial instrument (see Annex E for definitions). MDBs reported that 76 per cent of total climate finance was committed through investment loans. Illustrative examples of various type of instrument are presented in Table A.E.1.
Table 7. Total MDB climate finance by type of instrument, 2020 (in US$ million)
Instrument typeFor low-income and
middle-income economiesFor high-income
economies Total
Equity 478 961 1,439
Grant 3,300 6 3,306
Guarantee 1,561 370 1,931
Investment loan 26,345 24,132 50,477
Line of credit 455 1,650 2,106
Policy-based financing 4,395 449 4,844
Results-based financing 983 61 1,044
Other instruments 491 407 898
Total 38,009 28,036 66,045
Notes: 1. Annex E defines the various types of instrument.2. Other instruments include advisory services and bonds. Some MDBs report eligible bonds under the category of investment loans.
69%
12%
9% 1%1% 1%
3%4%
86%
0.02%
6%
1%
3%
0.2%1%
2%
Figure 4. Total MDB climate finance by type of instrument, 2020
TOTAL CLIMATE FINANCE BY INSTRUMENT US$ 66,045 million
Investment loan US$ 50,477 million
Policy-based financing US$ 4,844 million
Grant US$ 3,306 million
Line of credit US$ 2,106 million
Guarantee US$ 1,931 million
Equity US$ 1,439 million
Results-based financing US$ 1,044 million
Other instruments US$ 898 million
Total: US$ 38,009 million
LOW
-INCOME AND MIDDLE-INCOME ECONOM
IES
Total: US$ 28,036 million
HIGH-IN
COME ECONOMIES
2020 JOINT REPORT ON MULTILATERAL DEVELOPMENT BANKS’ CLIMATE FINANCE
16

0.1% 24%
94%
0.3%0%
5%
0.05%0.2%0.7%
21%
14%
17%
11%
7%
4% 3%
Figure 5. MDB climate finance by region, 2020
TOTAL CLIMATE FINANCE BY REGION US$ 66,045 million
Europe: EU US$ 26,366 million
Sub-Saharan Africa US$ 9,061 million
South Asia US$ 8,033 million
Latin America and the Caribbean US$ 6,708 million
East Asia and the Pacific US$ 6,445 million
Europe: Non-EU US$ 3,993 million
Middle East and North Africa US$ 2,880 million
Central Asia US$ 1,420 million
Multi-regional US$ 1,138 million
Total: US$ 38,009 million
LOW
-INCOME AND MIDDLE-INCOME ECONOM
IES
Total: US$ 28,036 million
HIGH-IN
COME ECONOMIES
2.4. MDB CLIMATE FINANCE BY REGION
MDB climate finance commitments are grouped by region.11
11 See Table A.F.1 for regional groupings. 12 https://www.un.org/development/desa/dpad/least-developed-country-category/ldc-criteria.html13 https://unfccc.int/topics/resilience/workstreams/national-adaptation-programmes-of-action/ldc-country-information 14 https://www.aosis.org/about/member-states/
Table 8. MDB climate finance by region, 2020 (in US$ million)
RegionFor low-income and
middle-income economiesFor high-income
economies Total
Central Asia 1,420 – 1,420
East Asia and the Pacific 6,432 13 6,445
Europe: EU 41 26,325 26,366
Europe: Non-EU 3,993 – 3,993
Latin America and the Caribbean 5,345 1,362 6,708
Middle East and North Africa 2,818 62 2,880
South Asia 8,033 0 8,033
Sub-Saharan Africa 8,975 86 9,061
Multi-regional 951 187 1,138
Total 38,009 28,036 66,045
MDB climate finance allocated to small island states and to least-developed economies is presented in Table 9. Least-developed economies are defined according to the UNFCCC criteria12 and presented based on the UNFCCC list.13 Small island states are
defined according to the Alliance of Small Island States (AOSIS) list.14 Economies considered to be least-developed economies and/or small island states are listed in Annex F.
Table 9. MDB climate finance for least-developed economies and small island states, 2020 (in US$ million)
Mitigation finance Adaptation finance Total
Least-developed economies that are not small island states 3,279 3,621 6,900
Small island states that are not least-developed economies 305 550 855
Least-developed economies and small island economies 121 324 445
Total 3,705 4,494 8,199
2020 JOINT REPORT ON MULTILATERAL DEVELOPMENT BANKS’ CLIMATE FINANCE
17
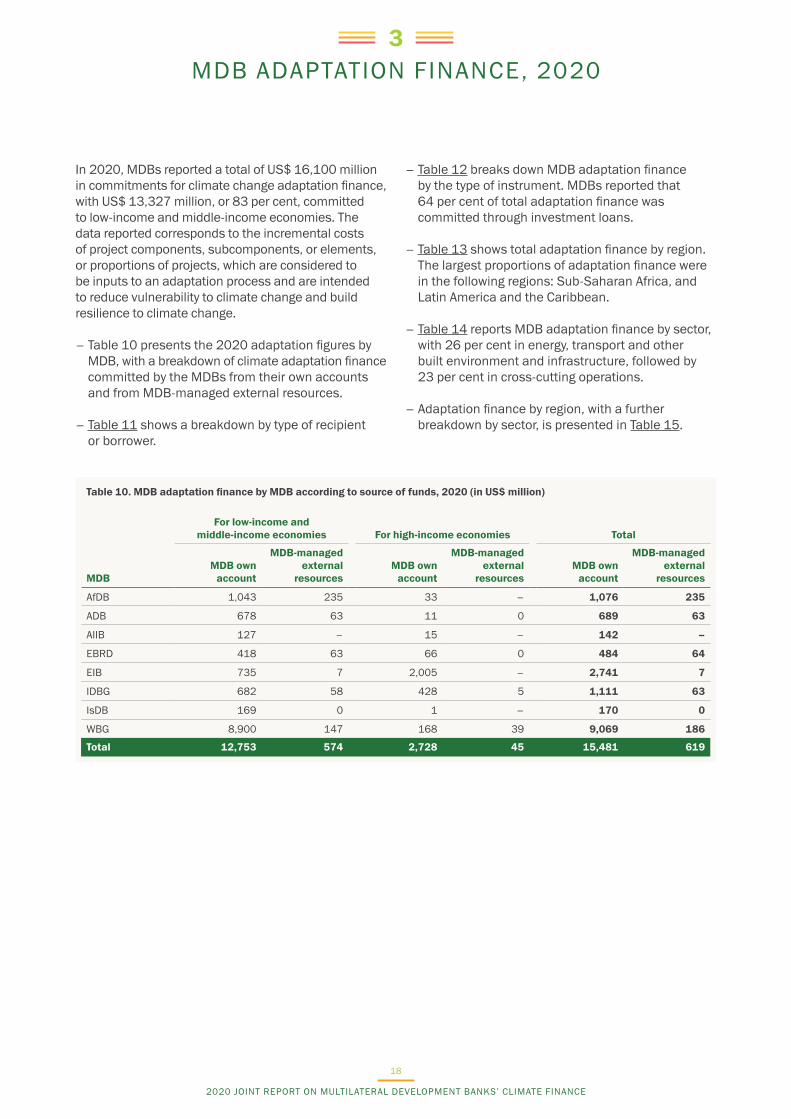
MDB ADAPTATION FINANCE, 20203
In 2020, MDBs reported a total of US$ 16,100 million in commitments for climate change adaptation finance, with US$ 13,327 million, or 83 per cent, committed to low-income and middle-income economies. The data reported corresponds to the incremental costs of project components, subcomponents, or elements, or proportions of projects, which are considered to be inputs to an adaptation process and are intended to reduce vulnerability to climate change and build resilience to climate change.
– Table 10 presents the 2020 adaptation figures by MDB, with a breakdown of climate adaptation finance committed by the MDBs from their own accounts and from MDB-managed external resources.
– Table 11 shows a breakdown by type of recipient or borrower.
– Table 12 breaks down MDB adaptation finance by the type of instrument. MDBs reported that 64 per cent of total adaptation finance was committed through investment loans.
– Table 13 shows total adaptation finance by region. The largest proportions of adaptation finance were in the following regions: Sub-Saharan Africa, and Latin America and the Caribbean.
– Table 14 reports MDB adaptation finance by sector, with 26 per cent in energy, transport and other built environment and infrastructure, followed by 23 per cent in cross-cutting operations.
– Adaptation finance by region, with a further breakdown by sector, is presented in Table 15.
Table 10. MDB adaptation finance by MDB according to source of funds, 2020 (in US$ million)
For low-income and middle-income economies For high-income economies Total
MDBMDB own
account
MDB-managed external
resources MDB own
account
MDB-managed external
resources MDB own
account
MDB-managed external
resources
AfDB 1,043 235 33 – 1,076 235
ADB 678 63 11 0 689 63
AIIB 127 – 15 – 142 –
EBRD 418 63 66 0 484 64
EIB 735 7 2,005 – 2,741 7
IDBG 682 58 428 5 1,111 63
IsDB 169 0 1 – 170 0
WBG 8,900 147 168 39 9,069 186
Total 12,753 574 2,728 45 15,481 619
2020 JOINT REPORT ON MULTILATERAL DEVELOPMENT BANKS’ CLIMATE FINANCE
18
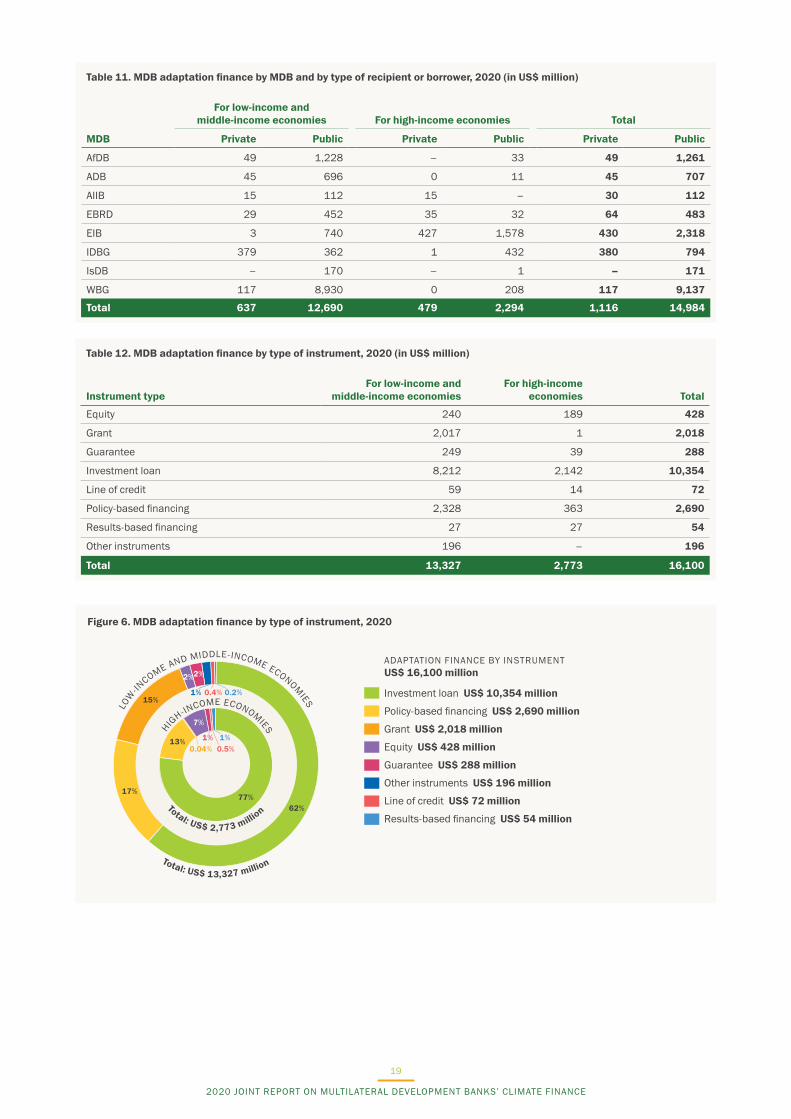
Table 11. MDB adaptation finance by MDB and by type of recipient or borrower, 2020 (in US$ million)
For low-income and middle-income economies For high-income economies Total
MDB Private Public Private Public Private Public
AfDB 49 1,228 – 33 49 1,261
ADB 45 696 0 11 45 707
AIIB 15 112 15 – 30 112
EBRD 29 452 35 32 64 483
EIB 3 740 427 1,578 430 2,318
IDBG 379 362 1 432 380 794
IsDB – 170 – 1 – 171
WBG 117 8,930 0 208 117 9,137
Total 637 12,690 479 2,294 1,116 14,984
Table 12. MDB adaptation finance by type of instrument, 2020 (in US$ million)
Instrument typeFor low-income and
middle-income economies For high-income
economies Total
Equity 240 189 428
Grant 2,017 1 2,018
Guarantee 249 39 288
Investment loan 8,212 2,142 10,354
Line of credit 59 14 72
Policy-based financing 2,328 363 2,690
Results-based financing 27 27 54
Other instruments 196 – 196
Total 13,327 2,773 16,100
Figure 6. MDB adaptation finance by type of instrument, 2020
ADAPTATION FINANCE BY INSTRUMENT US$ 16,100 million
Investment loan US$ 10,354 million
Policy-based financing US$ 2,690 million
Grant US$ 2,018 million
Equity US$ 428 million
Guarantee US$ 288 million
Other instruments US$ 196 million
Line of credit US$ 72 million
Results-based financing US$ 54 million
2%
15%
2%
62%
0.4%
17%
0.2%1%
7%
0.04%1%
77%
0.5%13% 1%
Total: US$ 13,327 million
LOW
-INCOME AND MIDDLE-INCOME ECONOM
IES
Total: US$ 2,773 million
HIGH-IN
COME ECONOMIES
2020 JOINT REPORT ON MULTILATERAL DEVELOPMENT BANKS’ CLIMATE FINANCE
19
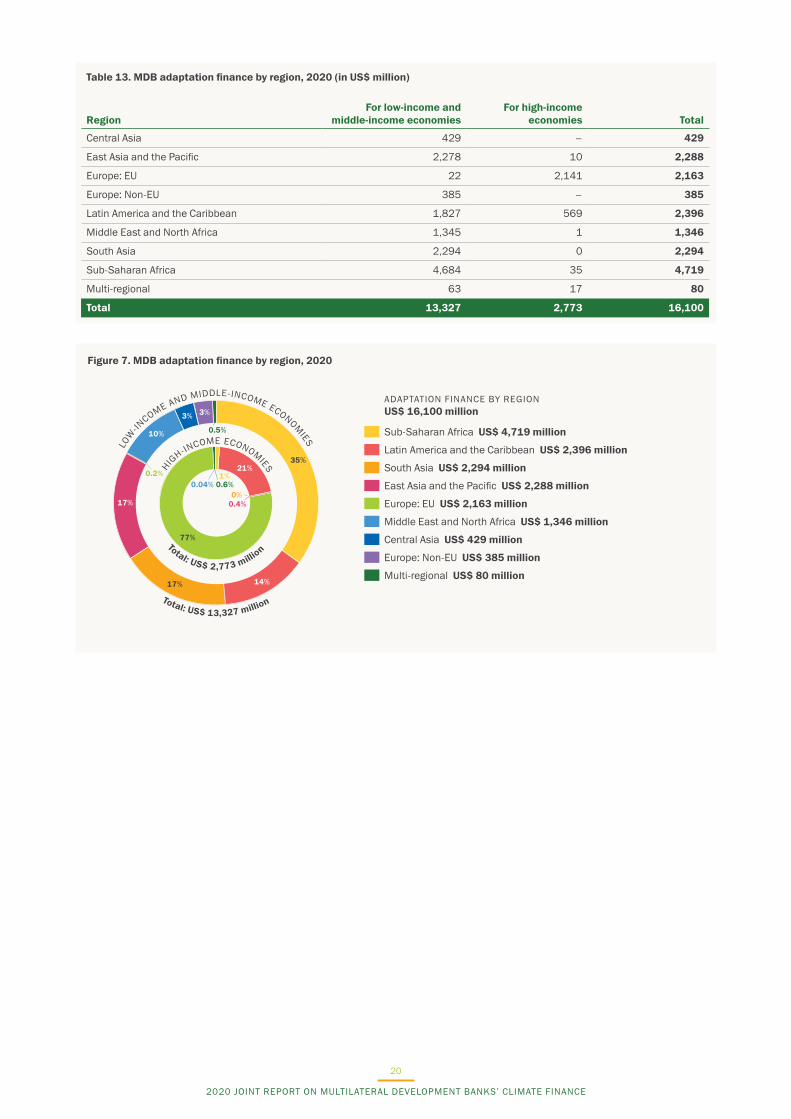
Table 13. MDB adaptation finance by region, 2020 (in US$ million)
RegionFor low-income and
middle-income economiesFor high-income
economies Total
Central Asia 429 – 429
East Asia and the Pacific 2,278 10 2,288
Europe: EU 22 2,141 2,163
Europe: Non-EU 385 – 385
Latin America and the Caribbean 1,827 569 2,396
Middle East and North Africa 1,345 1 1,346
South Asia 2,294 0 2,294
Sub-Saharan Africa 4,684 35 4,719
Multi-regional 63 17 80
Total 13,327 2,773 16,100
Figure 7. MDB adaptation finance by region, 2020
3%
17%
0.2%
3%
14%
10%
17%
35%
0.5%
0.4%
77%
21%
0.04%0%
1%0.6%
ADAPTATION FINANCE BY REGION US$ 16,100 million
Sub-Saharan Africa US$ 4,719 million
Latin America and the Caribbean US$ 2,396 million
South Asia US$ 2,294 million
East Asia and the Pacific US$ 2,288 million
Europe: EU US$ 2,163 million
Middle East and North Africa US$ 1,346 million
Central Asia US$ 429 million
Europe: Non-EU US$ 385 million
Multi-regional US$ 80 million
Total: US$ 13,327 million
LOW
-INCOME AND MIDDLE-INCOME ECONOM
IES
Total: US$ 2,773 million
HIGH-IN
COME ECONOMIES
2020 JOINT REPORT ON MULTILATERAL DEVELOPMENT BANKS’ CLIMATE FINANCE
20
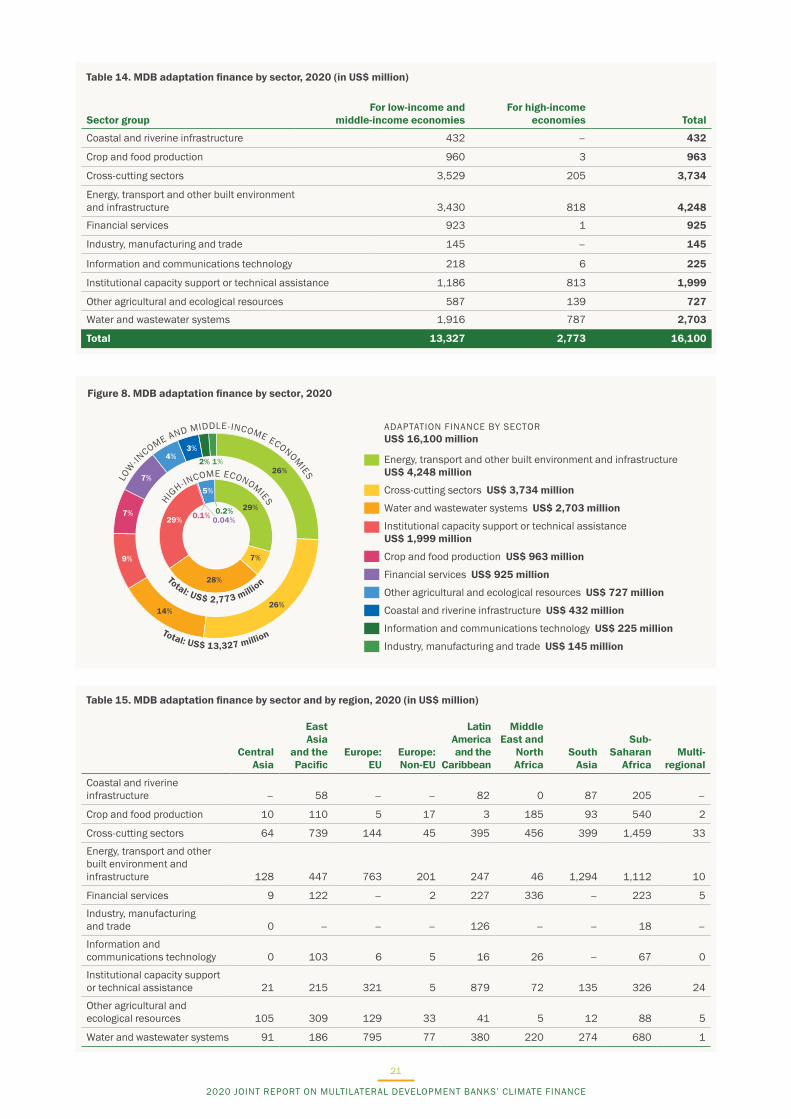
Table 14. MDB adaptation finance by sector, 2020 (in US$ million)
Sector groupFor low-income and
middle-income economiesFor high-income
economies Total
Coastal and riverine infrastructure 432 – 432
Crop and food production 960 3 963
Cross-cutting sectors 3,529 205 3,734
Energy, transport and other built environment and infrastructure 3,430 818 4,248
Financial services 923 1 925
Industry, manufacturing and trade 145 – 145
Information and communications technology 218 6 225
Institutional capacity support or technical assistance 1,186 813 1,999
Other agricultural and ecological resources 587 139 727
Water and wastewater systems 1,916 787 2,703
Total 13,327 2,773 16,100
Figure 8. MDB adaptation finance by sector, 2020
ADAPTATION FINANCE BY SECTOR US$ 16,100 million
Energy, transport and other built environment and infrastructure US$ 4,248 million
Cross-cutting sectors US$ 3,734 million
Water and wastewater systems US$ 2,703 million
Institutional capacity support or technical assistance US$ 1,999 million
Crop and food production US$ 963 million
Financial services US$ 925 million
Other agricultural and ecological resources US$ 727 million
Coastal and riverine infrastructure US$ 432 million
Information and communications technology US$ 225 million
Industry, manufacturing and trade US$ 145 million
3%
7%
26%
7%
1%2%
9%
4%
14%
26%
0.1%
7%
0.04%0.2%
29%
5%
28%
29%
Total: US$ 13,327 million
LOW
-INCOME AND MIDDLE-INCOME ECONOM
IES
Total: US$ 2,773 million
HIGH-IN
COME ECONOMIES
Table 15. MDB adaptation finance by sector and by region, 2020 (in US$ million)
Central Asia
East Asia
and the Pacific
Europe: EU
Europe: Non-EU
Latin America and the
Caribbean
Middle East and
North Africa
South Asia
Sub-Saharan
AfricaMulti-
regional
Coastal and riverine infrastructure – 58 – – 82 0 87 205 –
Crop and food production 10 110 5 17 3 185 93 540 2
Cross-cutting sectors 64 739 144 45 395 456 399 1,459 33
Energy, transport and other built environment and infrastructure 128 447 763 201 247 46 1,294 1,112 10
Financial services 9 122 – 2 227 336 – 223 5
Industry, manufacturing and trade 0 – – – 126 – – 18 –
Information and communications technology 0 103 6 5 16 26 – 67 0
Institutional capacity support or technical assistance 21 215 321 5 879 72 135 326 24
Other agricultural and ecological resources 105 309 129 33 41 5 12 88 5
Water and wastewater systems 91 186 795 77 380 220 274 680 1
2020 JOINT REPORT ON MULTILATERAL DEVELOPMENT BANKS’ CLIMATE FINANCE
21
MDB MITIGATION FINANCE, 20204
In 2020, MDBs reported a total of US$ 49,945 million in financial commitments to the mitigation of climate change, with US$ 24,681 million, or 49 per cent, committed to low-income and middle-income economies. Data reported corresponds to the financing of mitigation projects or of those components, subcomponents, or elements, or proportions of projects that provide mitigation benefits (rather than reporting the entire project cost).
– Table 16 provides a breakdown of climate mitigation finance committed by the MDBs from MDB own-account and external resources.
– Table 17 shows a breakdown by type of recipient or borrower.
– Table 18 breaks down MDB mitigation finance by type of instrument. MDBs reported that 80 per cent of total mitigation finance was committed through investment loans.
– Table 19 shows total mitigation finance by region. The largest proportions of mitigation finance were in the following regions: Europe: EU and South Asia.
– Table 20 reports MDBs’ mitigation finance by sector, with 26 per cent in transport, followed by 24 per cent in renewable energy and 24 per cent energy efficiency.
– Mitigation finance by region, with further breakdown by sectors, is presented in Table 21.
Table 16. MDB mitigation finance by MDB, according to source of funds, 2020 (in US$ million)
For low-income and middle-income economies For high-income economies Total
MDBMDB own
account
MDB-managed external
resources MDB own
account
MDB-managed external
resources MDB own
account
MDB-managed external
resources
AfDB 470 315 – – 470 315
ADB 3,879 691 1 4 3,879 695
AIIB 987 – 69 – 1,056 –
EBRD 1,591 211 1,443 66 3,034 277
EIB 2,297 190 22,563 61 24,859 251
IDBG 1,499 258 447 54 1,945 312
IsDB 89 0 1 – 90 0
WBG 11,775 429 521 35 12,297 464
Total 22,587 2,094 25,044 219 47,631 2,314
Table 17. MDB mitigation finance by MDB and by type of recipient or borrower, 2020 (in US$ million)
For low-income and middle-income economies For high-income economies Total
MDB Private Public Private Public Private Public
AfDB 149 635 – – 149 635
ADB 985 3,585 0 4 985 3,589
AIIB 212 775 69 – 281 775
EBRD 1,092 710 1,272 238 2,364 948
EIB 347 2,140 9,022 13,601 9,369 15,741
IDBG 733 1,023 350 150 1,084 1,174
IsDB – 89 – 1 – 90
WBG 3,550 8,655 461 95 4,011 8,750
Total 7,069 17,613 11,174 14,090 18,242 31,703
2020 JOINT REPORT ON MULTILATERAL DEVELOPMENT BANKS’ CLIMATE FINANCE
22

Table 18. MDB mitigation finance by type of instrument, 2020 (in US$ million)
Instrument typeFor low-income and
middle-income economies For high-income
economies Total
Equity 451 934 1,385
Grant 1,283 5 1,287
Guarantee 1,366 370 1,735
Investment loan 18,133 21,990 40,123
Line of credit 396 1,637 2,033
Policy-based financing 2,067 87 2,154
Results-based financing 734 22 756
Other instruments 251 219 470
Total 24,681 25,264 49,945
Figure 9. MDB mitigation finance by type of instrument, 2020
MITIGATION FINANCE BY INSTRUMENT US$ 49,945 million
Investment loan US$ 40,123 million
Policy-based financing US$ 2,154 million
Line of credit US$ 2,033 million
Guarantee US$ 1,735 million
Equity US$ 1,385 million
Grant US$ 1,287 million
Results-based financing US$ 756 million
Other instruments US$ 470 million
2%5%
6%
73%
2%
8%
3%
1%
4%
0.02%1%
87%
6%
0.3%0.1%
1%
Total: US$ 24,681 million
LOW
-INCOME AND MIDDLE-INCOME ECONOM
IES
Total: US$ 25,264 million
HIGH-IN
COME ECONOMIES
2020 JOINT REPORT ON MULTILATERAL DEVELOPMENT BANKS’ CLIMATE FINANCE
23

Table 19. MDB mitigation finance by region, 2020 (in US$ million)
RegionFor low-income and
middle-income economiesFor high-income
economies Total
Central Asia 991 – 991
East Asia and the Pacific 4,154 3 4,157
Europe: EU 19 24,184 24,203
Europe: Non-EU 3,608 – 3,608
Latin America and the Caribbean 3,518 794 4,312
Middle East and North Africa 1,473 61 1,534
South Asia 5,739 0 5,739
Sub-Saharan Africa 4,292 50 4,342
Multi-regional 888 170 1,058
Total 24,681 25,264 49,945
Figure 10. MDB mitigation finance by region, 2020
MITIGATION FINANCE BY REGION US$ 49,945 million
Europe: EU US$ 24,203 million
South Asia US$ 5,739 million
Sub-Saharan Africa US$ 4,342 million
Latin America and the Caribbean US$ 4,312 million
East Asia and the Pacific US$ 4,157 million
Europe: Non-EU US$ 3,608 million
Middle East and North Africa US$ 1,534 million
Multi-regional US$ 1,058 million
Central Asia US$ 991 million
4%
17%
0.1%
15%
14%
6% 23%
17%
4%
0.01%
96%
3%
0.2%0%0.2%
1%
Total: US$ 24,681 million
LOW
-INCOME AND MIDDLE-INCOME ECONOM
IES
Total: US$ 25,264 million
HIGH-IN
COME ECONOMIES
2020 JOINT REPORT ON MULTILATERAL DEVELOPMENT BANKS’ CLIMATE FINANCE
24
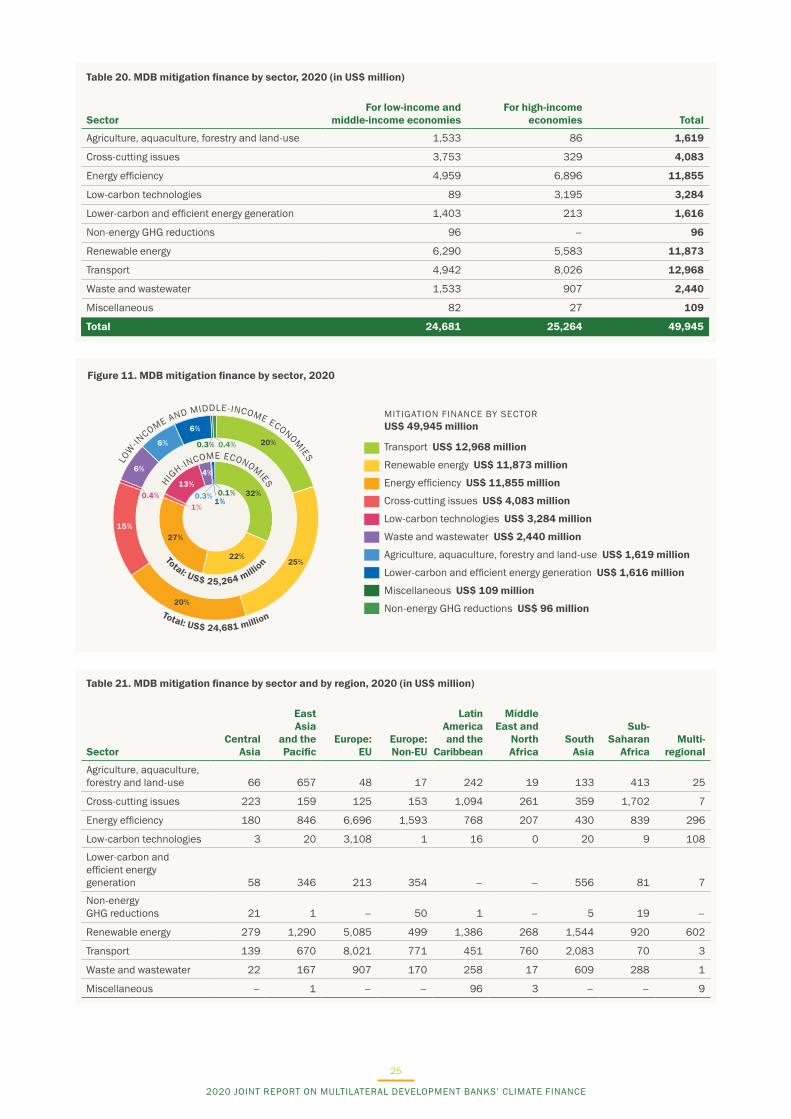
Figure 11. MDB mitigation finance by sector, 2020
MITIGATION FINANCE BY SECTOR US$ 49,945 million
Transport US$ 12,968 million
Renewable energy US$ 11,873 million
Energy efficiency US$ 11,855 million
Cross-cutting issues US$ 4,083 million
Low-carbon technologies US$ 3,284 million
Waste and wastewater US$ 2,440 million
Agriculture, aquaculture, forestry and land-use US$ 1,619 million
Lower-carbon and efficient energy generation US$ 1,616 million
Miscellaneous US$ 109 million
Non-energy GHG reductions US$ 96 million
15%
20%
6%
6%
6%
0.3%
0.4%
0.4%
25%
20%
0.3%1%
27%
1%
4%
0.1%13%
22%
32%
Total: US$ 24,681 million
LOW
-INCOME AND MIDDLE-INCOME ECONOM
IES
Total: US$ 25,264 million
HIGH-IN
COME ECONOMIES
Table 20. MDB mitigation finance by sector, 2020 (in US$ million)
SectorFor low-income and
middle-income economiesFor high-income
economies Total
Agriculture, aquaculture, forestry and land-use 1,533 86 1,619
Cross-cutting issues 3,753 329 4,083
Energy efficiency 4,959 6,896 11,855
Low-carbon technologies 89 3,195 3,284
Lower-carbon and efficient energy generation 1,403 213 1,616
Non-energy GHG reductions 96 – 96
Renewable energy 6,290 5,583 11,873
Transport 4,942 8,026 12,968
Waste and wastewater 1,533 907 2,440
Miscellaneous 82 27 109
Total 24,681 25,264 49,945
Table 21. MDB mitigation finance by sector and by region, 2020 (in US$ million)
SectorCentral
Asia
East Asia
and the Pacific
Europe: EU
Europe: Non-EU
Latin America and the
Caribbean
Middle East and
North Africa
South Asia
Sub-Saharan
AfricaMulti-
regional
Agriculture, aquaculture, forestry and land-use 66 657 48 17 242 19 133 413 25
Cross-cutting issues 223 159 125 153 1,094 261 359 1,702 7
Energy efficiency 180 846 6,696 1,593 768 207 430 839 296
Low-carbon technologies 3 20 3,108 1 16 0 20 9 108
Lower-carbon and efficient energy generation 58 346 213 354 – – 556 81 7
Non-energy GHG reductions 21 1 – 50 1 – 5 19 –
Renewable energy 279 1,290 5,085 499 1,386 268 1,544 920 602
Transport 139 670 8,021 771 451 760 2,083 70 3
Waste and wastewater 22 167 907 170 258 17 609 288 1
Miscellaneous – 1 – – 96 3 – – 9
2020 JOINT REPORT ON MULTILATERAL DEVELOPMENT BANKS’ CLIMATE FINANCE
25
CLIMATE CO-FINANCE, 20205
From 2015 the MDBs began reporting on climate co-financing (CCF) flows in line with the harmonised definitions and indicators that had been established to estimate CCF. Tracking of climate co-finance aims to estimate the volume of financial resources invested by public and private external parties alongside MDBs for climate mitigation and adaptation activities.
This approach presents sources of CCF in the following categories: (i) other MDBs; (ii) IDFC member institutions, including bilateral and multilateral members; (iii) other international public entities such as donor governments; (iv) contributions from other domestic public entities such as recipient-country governments (for example, financing by local counterparts); and (v) all private entities (defined as those with at least 50 per cent of their shares held privately), split into private direct mobilisation and private indirect mobilisation. This level of granularity enables MDBs to present an increasingly nuanced picture of co-finance flows used for climate change interventions.
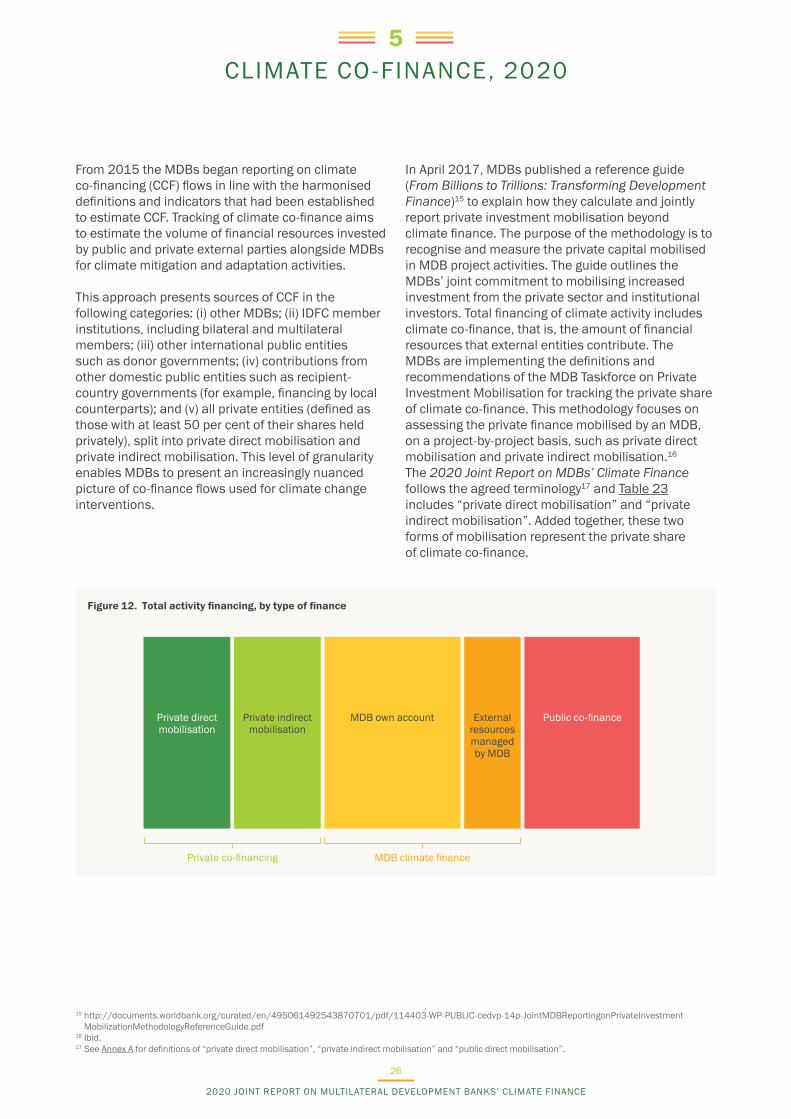
In April 2017, MDBs published a reference guide (From Billions to Trillions: Transforming Development Finance)15 to explain how they calculate and jointly report private investment mobilisation beyond climate finance. The purpose of the methodology is to recognise and measure the private capital mobilised in MDB project activities. The guide outlines the MDBs’ joint commitment to mobilising increased investment from the private sector and institutional investors. Total financing of climate activity includes climate co-finance, that is, the amount of financial resources that external entities contribute. The MDBs are implementing the definitions and recommendations of the MDB Taskforce on Private Investment Mobilisation for tracking the private share of climate co-finance. This methodology focuses on assessing the private finance mobilised by an MDB, on a project-by-project basis, such as private direct mobilisation and private indirect mobilisation.16 The 2020 Joint Report on MDBs’ Climate Finance follows the agreed terminology17 and Table 23 includes “private direct mobilisation” and “private indirect mobilisation”. Added together, these two forms of mobilisation represent the private share of climate co-finance.
Private direct mobilisation
Private indirect mobilisation
Public co-financeExternal resources managed by MDB
MDB own account
Private co-financing MDB climate finance
Figure 12. Total activity financing, by type of finance
15 http://documents.worldbank.org/curated/en/495061492543870701/pdf/114403-WP-PUBLIC-cedvp-14p-JointMDBReportingonPrivateInvestment MobilizationMethodologyReferenceGuide.pdf
16 Ibid.17 See Annex A for definitions of “private direct mobilisation”, “private indirect mobilisation” and “public direct mobilisation”.
2020 JOINT REPORT ON MULTILATERAL DEVELOPMENT BANKS’ CLIMATE FINANCE
26
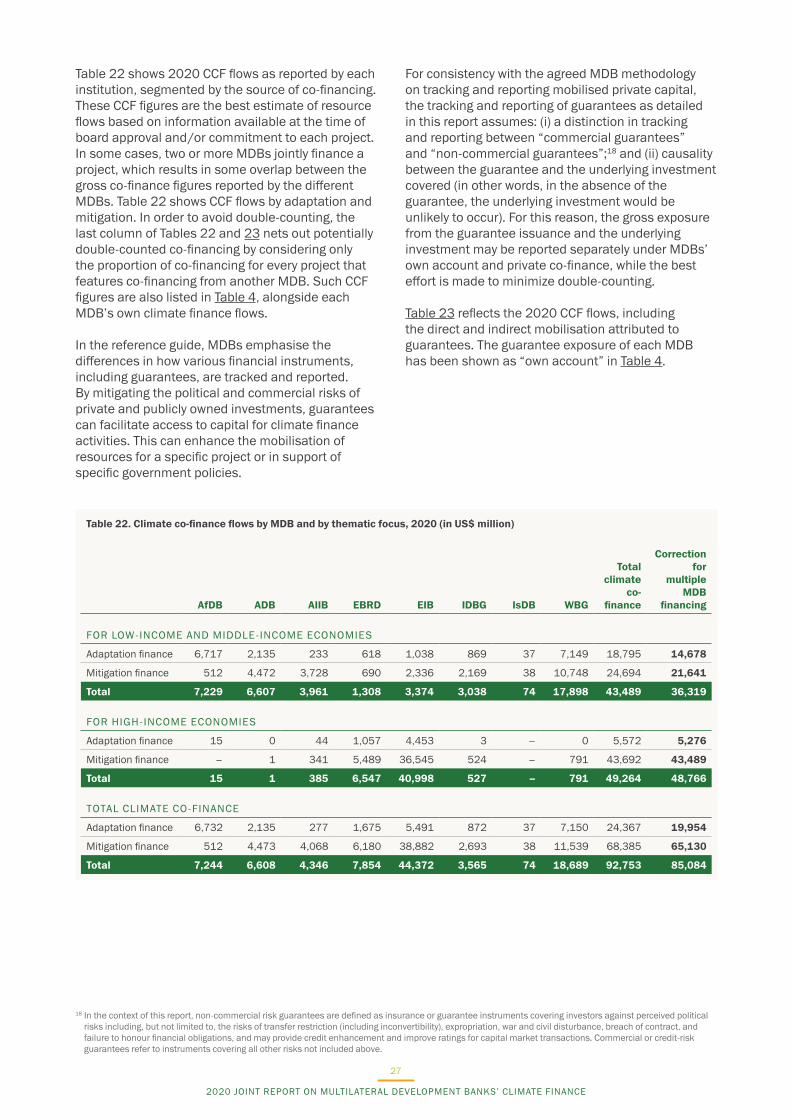
Table 22 shows 2020 CCF flows as reported by each institution, segmented by the source of co-financing. These CCF figures are the best estimate of resource flows based on information available at the time of board approval and/or commitment to each project. In some cases, two or more MDBs jointly finance a project, which results in some overlap between the gross co-finance figures reported by the different MDBs. Table 22 shows CCF flows by adaptation and mitigation. In order to avoid double-counting, the last column of Tables 22 and 23 nets out potentially double-counted co-financing by considering only the proportion of co-financing for every project that features co-financing from another MDB. Such CCF figures are also listed in Table 4, alongside each MDB’s own climate finance flows.
In the reference guide, MDBs emphasise the differences in how various financial instruments, including guarantees, are tracked and reported. By mitigating the political and commercial risks of private and publicly owned investments, guarantees can facilitate access to capital for climate finance activities. This can enhance the mobilisation of resources for a specific project or in support of specific government policies.
For consistency with the agreed MDB methodology on tracking and reporting mobilised private capital, the tracking and reporting of guarantees as detailed in this report assumes: (i) a distinction in tracking and reporting between “commercial guarantees” and “non-commercial guarantees”;18 and (ii) causality between the guarantee and the underlying investment covered (in other words, in the absence of the guarantee, the underlying investment would be unlikely to occur). For this reason, the gross exposure from the guarantee issuance and the underlying investment may be reported separately under MDBs’ own account and private co-finance, while the best effort is made to minimize double-counting.
Table 23 reflects the 2020 CCF flows, including the direct and indirect mobilisation attributed to guarantees. The guarantee exposure of each MDB has been shown as “own account” in Table 4.
Table 22. Climate co-finance flows by MDB and by thematic focus, 2020 (in US$ million)
AfDB ADB AIIB EBRD EIB IDBG IsDB WBG
Total climate
co-finance
Correction for
multiple MDB
financing
FOR LOW-INCOME AND MIDDLE-INCOME ECONOMIES
Adaptation finance 6,717 2,135 233 618 1,038 869 37 7,149 18,795 14,678
Mitigation finance 512 4,472 3,728 690 2,336 2,169 38 10,748 24,694 21,641
Total 7,229 6,607 3,961 1,308 3,374 3,038 74 17,898 43,489 36,319
FOR HIGH-INCOME ECONOMIES
Adaptation finance 15 0 44 1,057 4,453 3 – 0 5,572 5,276
Mitigation finance – 1 341 5,489 36,545 524 – 791 43,692 43,489
Total 15 1 385 6,547 40,998 527 – 791 49,264 48,766
TOTAL CLIMATE CO-FINANCE
Adaptation finance 6,732 2,135 277 1,675 5,491 872 37 7,150 24,367 19,954
Mitigation finance 512 4,473 4,068 6,180 38,882 2,693 38 11,539 68,385 65,130
Total 7,244 6,608 4,346 7,854 44,372 3,565 74 18,689 92,753 85,084
18 In the context of this report, non-commercial risk guarantees are defined as insurance or guarantee instruments covering investors against perceived political risks including, but not limited to, the risks of transfer restriction (including inconvertibility), expropriation, war and civil disturbance, breach of contract, and failure to honour financial obligations, and may provide credit enhancement and improve ratings for capital market transactions. Commercial or credit-risk guarantees refer to instruments covering all other risks not included above.
2020 JOINT REPORT ON MULTILATERAL DEVELOPMENT BANKS’ CLIMATE FINANCE
27

Table 23. Climate co-finance flows by MDB and by source, 2020 (in US$ million)
AfDB ADB AIIB EBRD EIB IDBG IsDB WBG
Total climate
co-finance
Correction for
multiple MDB
financing
FOR LOW- AND MIDDLE-INCOME ECONOMIES
Public direct mobilisation – – – – 94 92 22 8,158 8,366 8,366
Public co-finance
Other MDBs 2,465 704 1,586 252 969 200 8 1,966 8,150 8,150
IDFC members 265 628 61 155 372 307 – 200 1,988 1,774
Other international public 4,197 10 – 9 94 244 44 1,022 5,620 1,946
Other domestic public 96 3,046 2,264 438 1,407 45 – 874 8,170 6,182
Total private mobilisation
Private direct mobilisation 3 – – 1 196 334 – 3,021 3,556 3,556
Private indirect mobilisation 203 2,219 50 453 242 1,816 – 2,657 7,640 6,345
Total 7,229 6,607 3,961 1,308 3,374 3,038 74 17,898 43,489 36,319
FOR HIGH-INCOME ECONOMIES
Public direct mobilisation – – – – 1,565 93 – 0 1,658 1,658
Public co-finance
Other MDBs 8 – 14 335 138 – – 319 813 813
IDFC members – – 11 – 244 2 – – 256 251
Other international public 8 – – 204 4,272 – – – 4,484 4,477
Other domestic public – 1 7 64 20,020 3 – – 20,095 19,796
Total private mobilisation
Private direct mobilisation – – 180 280 1,645 – – 249 2,354 2,354
Private indirect mobilisation – 0 173 5,664 13,114 429 – 223 19,604 19,417
Total 15 1 385 6,547 40,998 527 – 791 49,264 48,766
TOTAL CLIMATE CO-FINANCE
Public direct mobilisation – – – – 1,659 184 22 8,159 10,024 10,024
Public co-finance
Other MDBs 2,473 704 1,600 586 1,107 200 8 2,285 8,962 8,962
IDFC members 265 628 71 155 616 309 – 200 2,244 2,026
Other international public 4,204 10 – 213 4,366 244 44 1,022 10,104 6,423
Other domestic public 96 3,047 2,271 502 21,428 48 – 874 28,266 25,978
Total private mobilisation
Private direct mobilisation 3 – 180 281 1,841 334 – 3,270 5,910 5,910
Private indirect mobilisation 203 2,219 224 6,117 13,356 2,245 – 2,880 27,243 25,762
Total 7,244 6,608 4,346 7,854 44,372 3,565 74 18,689 92,753 85,084
Notes: 1. Co-financing figures are current as of 1 April 2021. Fluctuations are expected due to changes in project financing between Board approvals,
loan signatures and execution.2. For non-commercial guarantees, private direct mobilisation corresponds to the underlying investment covered by the guarantee. For MDBs reporting
on own account associated with non-commercial guarantees, an adjustment must be made by the MDB to avoid double-counting.3. Local counterpart financing is reported under “Other domestic public”.
2020 JOINT REPORT ON MULTILATERAL DEVELOPMENT BANKS’ CLIMATE FINANCE
28
ANNEX A. DEFINITIONS AND CLARIFICATIONSA
AVOIDING DOUBLE-COUNTING Where the same project, sub-project or project element contributes to mitigation and adaptation, an MDB’s individual processes will determine which proportion is counted as mitigation or as adaptation, so that the actual financing will not be recorded more than once. Some MDBs are reporting as a separate category climate finance in projects where the same components or elements contribute to mitigation and adaptation simultaneously. The MDBs are working on the best method for reporting projects where the same components or elements contribute to both mitigation and adaptation.
CONSERVATIVENESS Where data is unavailable, any uncertainty must be overcome by taking a conservative approach, where under-reported rather than over-reported climate finance is preferable.
FINANCING INSTRUMENTS This report accounts for climate finance through the largest and most relevant development-finance instruments of MDBs, including grants, loans, guarantees, equity, and performance-based instruments.
GRANULARITY MDBs report climate finance by taking only those components and/or subcomponents or elements or proportions of projects with activities that contribute directly to or promote climate change adaptation and/or mitigation.
INVESTMENTS AND TECHNICAL ASSISTANCE Refers to vehicles that MDBs use to channel specific investments to finance capital and recurrent expenditures for goods and services, as well as to specialised advisory services and capacity-building initiatives.
MDB-MANAGED EXTERNAL RESOURCES Refers to the volume of operations supported by bilateral institutions through dedicated climate finance entities such as the GEF and CIF, or other donor funds such as EU blending facilities, which may also be reported to the Development Assistance Committee of the Organisation for Economic Co-operation and Development (OECD) by contributor countries.
POINT OF REPORTING Data reported herein reflects financial commitments at the time of Board approval or financial agreement signature and is therefore based on ex-ante estimations. All efforts have been made to prevent double-counting. No revisions will be issued in cases where a project’s scope changes later to either increase or decrease climate financing.
PRIVATE DIRECT MOBILISATION Financing from a private entity on commercial terms due to the active and direct involvement of an MDB leading to commitment. Evidence of active and direct involvement includes mandate letters, fees linked to financial commitment or other valid or auditable evidence of an MDB’s active and direct role leading to commitments by private financiers. Private direct mobilisation does not include sponsor financing.
PRIVATE INDIRECT MOBILISATION Financing from private entities supplied in connection with a specific activity for which an MDB is providing financing, where no MDB is playing an active or direct role that leads to the commitment of the private entity’s finance. Private indirect mobilisation includes sponsor financing, if the sponsor qualifies as a private entity.
PUBLIC AND PRIVATE SECTOR OPERATIONS This determination is based on the status of the first recipient or borrower of MDB finance. The first recipient or borrower is considered to be public when at least 50 per cent of the stakes or shares of the recipient or borrower are publicly owned.
PUBLIC DIRECT MOBILISATION Financing from a public entity due to the active and direct involvement of an MDB leading to commitment. Evidence of active and direct involvement includes mandate letters or other valid or auditable evidence of an MDB’s active and direct role. The main difference between an external resource under MDB management (ERUM) and a public direct mobilisation is the disbursement which under public direct mobilisation goes directly from a public entity to the beneficiary.
2020 JOINT REPORT ON MULTILATERAL DEVELOPMENT BANKS’ CLIMATE FINANCE
29
RECIPIENT OR BORROWER Refers to the first borrower or beneficiary to whom finance will flow directly. The MDBs acknowledge that this classification is neither simple nor straightforward and that the characteristics of the first recipient or borrower may not be the same as those of the final beneficiary or borrower. An example would be a loan to a national development bank (the first recipient) for energy efficiency in small and medium-sized enterprises (the final beneficiaries). Operations through public-private partnerships (PPPs) add another layer of complexity to this classification.
REPORTING PERIOD This report’s data covers the fiscal year 2020. Even though MDBs do not follow the same reporting cycle, data remains comparable across MDBs as all reporting cycles correspond to a 12-month period.
RESOURCES COVEREDThese include MDBs’ own accounts as well as a range of external resources managed by the MDBs and various sources of co-financing.
VALUES OF ZERO AND “–”Reporting is complete for all fields and tables. A value of 0 in a table means that the value is below US$ 0.5 million while a “–” means that no amount was reported. As all financial figures are rounded to the nearest US$ million, calculations contained in a table may vary slightly and may not always add up to 100 per cent or to the total shown.
2020 JOINT REPORT ON MULTILATERAL DEVELOPMENT BANKS’ CLIMATE FINANCE
30
ANNEX B. JOINT METHODOLOGY FOR TRACKING CLIMATE CHANGE ADAPTATION FINANCE
B
BACKGROUND AND GUIDING PRINCIPLES
Climate resilience and adaptation are intrinsically linked to development. This makes it challenging to accurately estimate adaptation finance elements in development operations. In response to this challenge, the joint MDB Working Group on Climate Finance Tracking applies a common adaptation finance tracking methodology to identify within the development operations of MDBs those specific adaptation activities (or, in other words, the differentiating elements of development operations) that are carried out in response to perceived or expected climate change impacts. The methodology applies a context-specific, location-specific and granular approach, and estimations are made conservatively to reduce scope for over-reporting of adaptation finance.
The MDB adaptation finance tracking methodology considers the sub-project level or project-element level to be appropriate. The joint MDB approach also seeks to identify the links between adaptation activities and the project’s explicit intent to reduce vulnerability to climate change. Thus, the volume of MDB-reported adaptation finance is an estimation of total project finance for specific project activities that contribute to overall project outcomes in the process of adapting to climate change.
It is important to note that the MDBs’ estimated climate finance may not express the full value of project finance that contributes to climate resilience. For instance, the granular approach would capture financing for improved drainage of a newly constructed road to withstand heavy rainfall or storm surges that in turn contributes to the overall resilience of the road and the investment. The granular approach does not capture the value of the entire project or investment that may increase resilience due to specific adaptation activities within the project. In addition, some activities without associated incremental costs, such as operational procedures to ensure business continuity or the practice of siting assets outside the range of a future storm surge, may not be tracked in quantitative terms.
MDB METHODOLOGY AND MDB-IDFC COMMON PRINCIPLES
MDBs and the International Development Finance Club (IDFC) are fully committed to promoting and supporting climate-resilient development as an essential part of the sustainability of their investments. With this shared commitment, MDBs
and the IDFC work together towards improved definitions and understanding of the different approaches and principles for tracking climate change adaptation finance.
As a result, in July 2015 these institutions agreed on the Common Principles for Climate Change Adaptation Finance Tracking. The Principles establish the parameters with which to identify and estimate the volume of adaptation finance in MDB and IDFC operations. They also form the basis for further joint work to increase the comparability of reported figures on climate adaptation finance and to harmonise key concepts related to reporting guidelines and processes. MDBs and the IDFC are currently developing additional metrics to identify and report on climate resilience in their development operations.
APPLICATION OF THE ADAPTATION FINANCE TRACKING METHODOLOGY
The MDB methodology on adaptation finance tracking consists of the following three key steps:
1. setting out the climate change vulnerability context of the project
2. making an explicit statement of intent of the project to reduce climate change vulnerability, and
3. articulating a clear and direct link between specific project activities and the project’s objective to reduce vulnerability to climate change.
The identification and estimation of adaptation finance is limited solely to those project activities (that is, projects, project components, or elements or proportions of projects) that are clearly linked to the climate change vulnerability context.
STEP 1. CONTEXT OF VULNERABILITY TO CLIMATE CHANGE
For a project to be considered as contributing to adaptation, the context of climate change vulnerability must first be set out clearly using a robust evidence base. Project documents may refer to existing analyses and reports or to original, bespoke assessments of climate change vulnerability, such as those carried out as part of project preparation. Good practice in the use of existing analyses or reports includes citing authoritative, preferably peer-reviewed sources, such as academic journals, national communications to the UNFCCC, Nationally Determined Contributions (NDCs),
2020 JOINT REPORT ON MULTILATERAL DEVELOPMENT BANKS’ CLIMATE FINANCE
31
reports of the Intergovernmental Panel on Climate Change, or strategic programmes for climate resilience.
Good practice in conducting original, bespoke analysis entails the use of information from trusted sources, which document the vulnerability of communities, physical assets or ecosystems to climate change as well as the use of recent climate trends including any departures from historic means. These may be combined with climate change projections drawn from a range of climate change models, with high and low greenhouse gas emission scenarios, to explore the full array of projected outcomes and uncertainties. Climate projection uncertainties should be presented and interpreted in a transparent way. The timescale of projected climate change impacts should match the intended lifespan of the assets and systems being financed through the project (for example, a time horizon of 2030, 2050, 2080, and so on).
STEP 2. STATEMENT OF PURPOSE OR INTENT
Once a project’s context of vulnerability to climate change has been established, the project should set out the explicit intention to address the context-specific and location-specific climate change vulnerabilities in response to the project’s climate vulnerability assessment. This is an important step to distinguish between a development project contributing to climate change adaptation and a standard development project.
The methodology is flexible about the location and form of this statement of intent in the document, as long as the MDB is able to record and track the rationale for each adaptation element linked to the climate-change vulnerability context described. MDB projects with adaptation finance usually state – in final technical documents, documents for Board approval, internal memos or other associated project documents – the intention to reduce vulnerability.
STEP 3. CLEAR AND DIRECT LINK BETWEEN CLIMATE CHANGE VULNERABILITY AND PROJECT ACTIVITIES
In line with the principles of the overall MDB climate finance tracking methodology, adaptation finance estimations consider only the finance allocated to specific project activities that are clearly linked to the project’s climate-change vulnerability context.
Where climate change adaptation activities are planned in projects that have additional objectives, adaptation finance tracking takes into account the estimated incremental cost or investment associated with such discrete project components – or elements of project design – that address risks and vulnerabilities under
conditions of current and future climate change, and compares these with a project design that does not consider such conditions.
When it is not possible to estimate incremental cost or investment directly from project budgets – for example, when using policy instruments or balance-sheet lending, equity investments or credit-line lending through financial intermediaries – a proportion of the project cost or investment corresponding to adaptation activities may be used to represent the incremental amount.
Table 1 in Annex B of the 2016 Joint Report on Multilateral Development Bank’s Climate Finance19 provides a list of examples illustrating sector-specific and subsector-specific adaptation activities in which MDB adaptation finance may be identified. The list is not meant to be exhaustive, nor is it intended for application as a positive list. It is for illustrative purposes only. Any adaptation finance that is identified needs to be substantiated through the application of the three-step process described above.
For an illustration of how the MDB adaptation finance tracking methodology is applied to development operations, see Table A.B.1.
ADAPTATION FINANCE TRACKING AMONG DEVELOPMENT FINANCE INSTITUTIONS
A growing number of institutions and initiatives work on the methodologies for tracking climate adaptation finance and make increasing efforts to harmonise these approaches. The MDB-IDFC Common Principles result from such joint work. These institutions continue their efforts for greater harmonisation, comparability and transparency of their reported climate finance. In addition, the OECD, which designed and applies the OECD-DAC Rio Markers, recommends the MDB methodology’s three-step approach to tracking climate adaptation finance as a “best practice”. The OECD’s efforts have resulted in improved guidance for tracking bilateral official development assistance (ODA) targeting climate change adaptation.
In 2021, the MDBs commenced a review of the joint MDB methodology for tracking adaptation finance. This review aims to take stock of recent developments in the field of adaptation finance, MDBs’ efforts to support climate adaptation and resilience through a wide range of sectors beyond traditional infrastructure sectors, and the increasing diversity of financial modalities that are used to support adaptation and resilience. This review will complement ongoing efforts by MDBs to enhance the robustness and transparency of climate finance tracking and support climate action, in line with the objectives of the Paris Agreement.
19 www.ebrd.com/2016-joint-report-on-mdbs-climate-finance.pdf
2020 JOINT REPORT ON MULTILATERAL DEVELOPMENT BANKS’ CLIMATE FINANCE
32
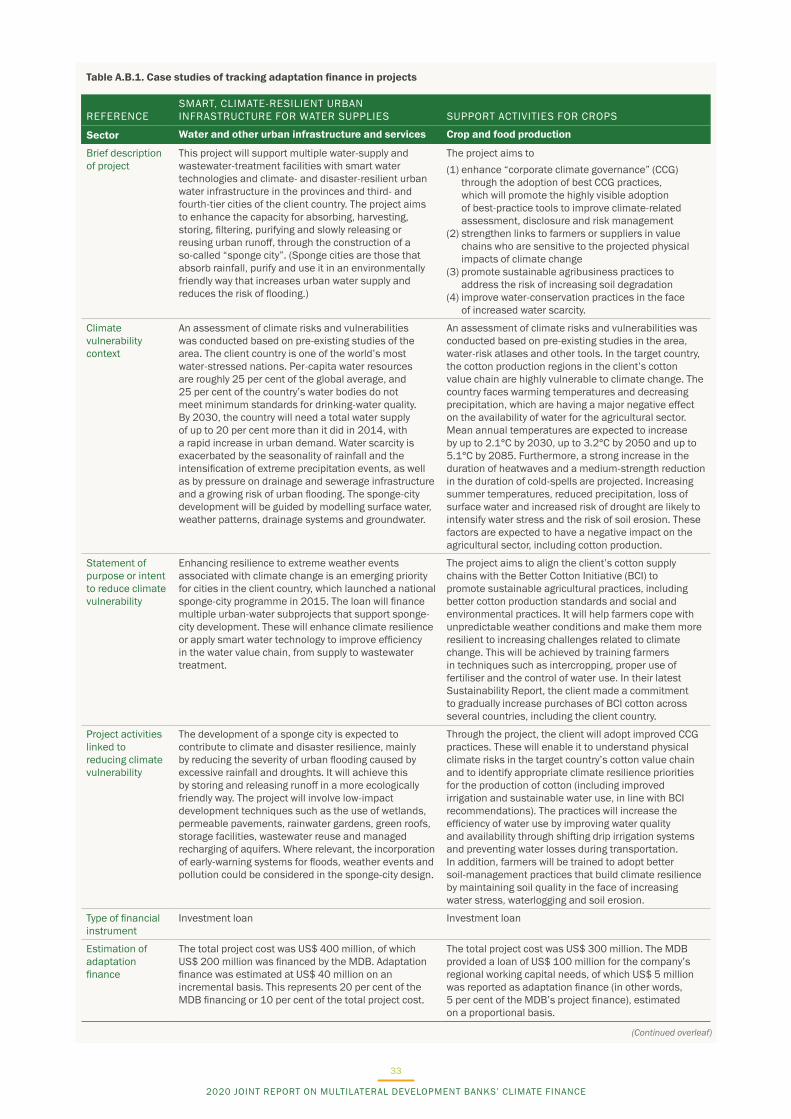
Table A.B.1. Case studies of tracking adaptation finance in projects
REFERENCE SMART, CLIMATE-RESILIENT URBAN INFRASTRUCTURE FOR WATER SUPPLIES SUPPORT ACTIVITIES FOR CROPS
Sector Water and other urban infrastructure and services Crop and food production
Brief description of project
This project will support multiple water-supply and wastewater-treatment facilities with smart water technologies and climate- and disaster-resilient urban water infrastructure in the provinces and third- and fourth-tier cities of the client country. The project aims to enhance the capacity for absorbing, harvesting, storing, filtering, purifying and slowly releasing or reusing urban runoff, through the construction of a so-called “sponge city”. (Sponge cities are those that absorb rainfall, purify and use it in an environmentally friendly way that increases urban water supply and reduces the risk of flooding.)
The project aims to (1) enhance “corporate climate governance” (CCG)
through the adoption of best CCG practices, which will promote the highly visible adoption of best-practice tools to improve climate-related assessment, disclosure and risk management
(2) strengthen links to farmers or suppliers in value chains who are sensitive to the projected physical impacts of climate change
(3) promote sustainable agribusiness practices to address the risk of increasing soil degradation
(4) improve water-conservation practices in the face of increased water scarcity.
Climate vulnerability context
An assessment of climate risks and vulnerabilities was conducted based on pre-existing studies of the area. The client country is one of the world’s most water-stressed nations. Per-capita water resources are roughly 25 per cent of the global average, and 25 per cent of the country’s water bodies do not meet minimum standards for drinking-water quality. By 2030, the country will need a total water supply of up to 20 per cent more than it did in 2014, with a rapid increase in urban demand. Water scarcity is exacerbated by the seasonality of rainfall and the intensification of extreme precipitation events, as well as by pressure on drainage and sewerage infrastructure and a growing risk of urban flooding. The sponge-city development will be guided by modelling surface water, weather patterns, drainage systems and groundwater.
An assessment of climate risks and vulnerabilities was conducted based on pre-existing studies in the area, water-risk atlases and other tools. In the target country, the cotton production regions in the client’s cotton value chain are highly vulnerable to climate change. The country faces warming temperatures and decreasing precipitation, which are having a major negative effect on the availability of water for the agricultural sector. Mean annual temperatures are expected to increase by up to 2.1°C by 2030, up to 3.2°C by 2050 and up to 5.1°C by 2085. Furthermore, a strong increase in the duration of heatwaves and a medium-strength reduction in the duration of cold-spells are projected. Increasing summer temperatures, reduced precipitation, loss of surface water and increased risk of drought are likely to intensify water stress and the risk of soil erosion. These factors are expected to have a negative impact on the agricultural sector, including cotton production.
Statement of purpose or intent to reduce climate vulnerability
Enhancing resilience to extreme weather events associated with climate change is an emerging priority for cities in the client country, which launched a national sponge-city programme in 2015. The loan will finance multiple urban-water subprojects that support sponge-city development. These will enhance climate resilience or apply smart water technology to improve efficiency in the water value chain, from supply to wastewater treatment.
The project aims to align the client’s cotton supply chains with the Better Cotton Initiative (BCI) to promote sustainable agricultural practices, including better cotton production standards and social and environmental practices. It will help farmers cope with unpredictable weather conditions and make them more resilient to increasing challenges related to climate change. This will be achieved by training farmers in techniques such as intercropping, proper use of fertiliser and the control of water use. In their latest Sustainability Report, the client made a commitment to gradually increase purchases of BCI cotton across several countries, including the client country.
Project activities linked to reducing climate vulnerability
The development of a sponge city is expected to contribute to climate and disaster resilience, mainly by reducing the severity of urban flooding caused by excessive rainfall and droughts. It will achieve this by storing and releasing runoff in a more ecologically friendly way. The project will involve low-impact development techniques such as the use of wetlands, permeable pavements, rainwater gardens, green roofs, storage facilities, wastewater reuse and managed recharging of aquifers. Where relevant, the incorporation of early-warning systems for floods, weather events and pollution could be considered in the sponge-city design.
Through the project, the client will adopt improved CCG practices. These will enable it to understand physical climate risks in the target country’s cotton value chain and to identify appropriate climate resilience priorities for the production of cotton (including improved irrigation and sustainable water use, in line with BCI recommendations). The practices will increase the efficiency of water use by improving water quality and availability through shifting drip irrigation systems and preventing water losses during transportation. In addition, farmers will be trained to adopt better soil-management practices that build climate resilience by maintaining soil quality in the face of increasing water stress, waterlogging and soil erosion.
Type of financial instrument
Investment loan Investment loan
Estimation of adaptation finance
The total project cost was US$ 400 million, of which US$ 200 million was financed by the MDB. Adaptation finance was estimated at US$ 40 million on an incremental basis. This represents 20 per cent of the MDB financing or 10 per cent of the total project cost.
The total project cost was US$ 300 million. The MDB provided a loan of US$ 100 million for the company’s regional working capital needs, of which US$ 5 million was reported as adaptation finance (in other words, 5 per cent of the MDB̓s project finance), estimated on a proportional basis.
(Continued overleaf)
2020 JOINT REPORT ON MULTILATERAL DEVELOPMENT BANKS’ CLIMATE FINANCE
33
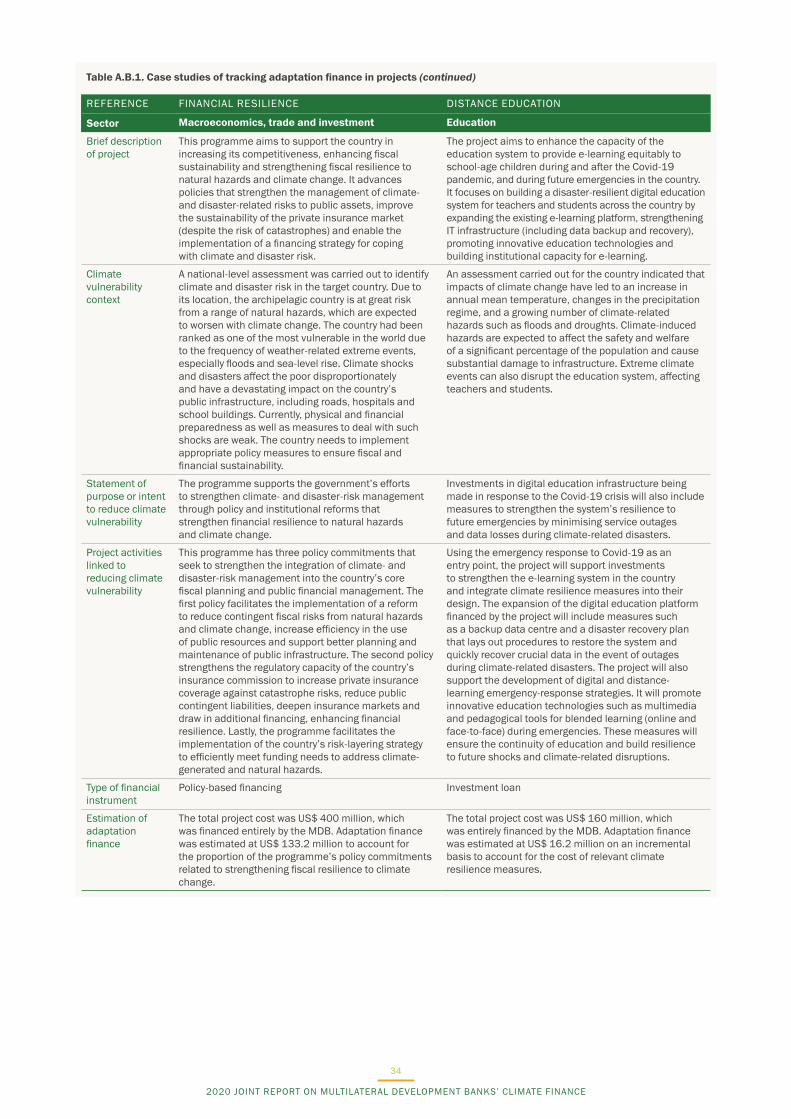
Table A.B.1. Case studies of tracking adaptation finance in projects (continued)
REFERENCE FINANCIAL RESILIENCE DISTANCE EDUCATION
Sector Macroeconomics, trade and investment Education
Brief description of project
This programme aims to support the country in increasing its competitiveness, enhancing fiscal sustainability and strengthening fiscal resilience to natural hazards and climate change. It advances policies that strengthen the management of climate- and disaster-related risks to public assets, improve the sustainability of the private insurance market (despite the risk of catastrophes) and enable the implementation of a financing strategy for coping with climate and disaster risk.
The project aims to enhance the capacity of the education system to provide e-learning equitably to school-age children during and after the Covid-19 pandemic, and during future emergencies in the country. It focuses on building a disaster-resilient digital education system for teachers and students across the country by expanding the existing e-learning platform, strengthening IT infrastructure (including data backup and recovery), promoting innovative education technologies and building institutional capacity for e-learning.
Climate vulnerability context
A national-level assessment was carried out to identify climate and disaster risk in the target country. Due to its location, the archipelagic country is at great risk from a range of natural hazards, which are expected to worsen with climate change. The country had been ranked as one of the most vulnerable in the world due to the frequency of weather-related extreme events, especially floods and sea-level rise. Climate shocks and disasters affect the poor disproportionately and have a devastating impact on the country’s public infrastructure, including roads, hospitals and school buildings. Currently, physical and financial preparedness as well as measures to deal with such shocks are weak. The country needs to implement appropriate policy measures to ensure fiscal and financial sustainability.
An assessment carried out for the country indicated that impacts of climate change have led to an increase in annual mean temperature, changes in the precipitation regime, and a growing number of climate-related hazards such as floods and droughts. Climate-induced hazards are expected to affect the safety and welfare of a significant percentage of the population and cause substantial damage to infrastructure. Extreme climate events can also disrupt the education system, affecting teachers and students.
Statement of purpose or intent to reduce climate vulnerability
The programme supports the government’s efforts to strengthen climate- and disaster-risk management through policy and institutional reforms that strengthen financial resilience to natural hazards and climate change.
Investments in digital education infrastructure being made in response to the Covid-19 crisis will also include measures to strengthen the system’s resilience to future emergencies by minimising service outages and data losses during climate-related disasters.
Project activities linked to reducing climate vulnerability
This programme has three policy commitments that seek to strengthen the integration of climate- and disaster-risk management into the country’s core fiscal planning and public financial management. The first policy facilitates the implementation of a reform to reduce contingent fiscal risks from natural hazards and climate change, increase efficiency in the use of public resources and support better planning and maintenance of public infrastructure. The second policy strengthens the regulatory capacity of the country’s insurance commission to increase private insurance coverage against catastrophe risks, reduce public contingent liabilities, deepen insurance markets and draw in additional financing, enhancing financial resilience. Lastly, the programme facilitates the implementation of the country̓s risk-layering strategy to efficiently meet funding needs to address climate-generated and natural hazards.
Using the emergency response to Covid-19 as an entry point, the project will support investments to strengthen the e-learning system in the country and integrate climate resilience measures into their design. The expansion of the digital education platform financed by the project will include measures such as a backup data centre and a disaster recovery plan that lays out procedures to restore the system and quickly recover crucial data in the event of outages during climate-related disasters. The project will also support the development of digital and distance-learning emergency-response strategies. It will promote innovative education technologies such as multimedia and pedagogical tools for blended learning (online and face-to-face) during emergencies. These measures will ensure the continuity of education and build resilience to future shocks and climate-related disruptions.
Type of financial instrument
Policy-based financing Investment loan
Estimation of adaptation finance
The total project cost was US$ 400 million, which was financed entirely by the MDB. Adaptation finance was estimated at US$ 133.2 million to account for the proportion of the programme’s policy commitments related to strengthening fiscal resilience to climate change.
The total project cost was US$ 160 million, which was entirely financed by the MDB. Adaptation finance was estimated at US$ 16.2 million on an incremental basis to account for the cost of relevant climate resilience measures.
2020 JOINT REPORT ON MULTILATERAL DEVELOPMENT BANKS’ CLIMATE FINANCE
34
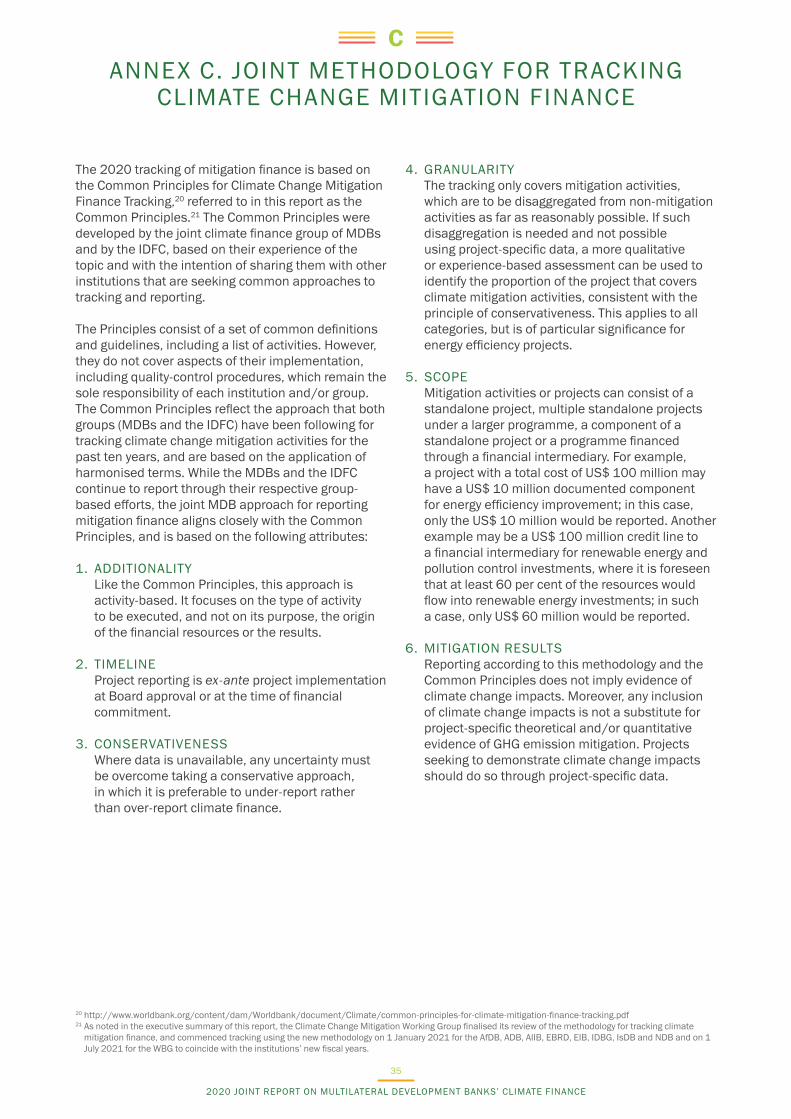
ANNEX C. JOINT METHODOLOGY FOR TRACKING CLIMATE CHANGE MITIGATION FINANCE
C
The 2020 tracking of mitigation finance is based on the Common Principles for Climate Change Mitigation Finance Tracking,20 referred to in this report as the Common Principles.21 The Common Principles were developed by the joint climate finance group of MDBs and by the IDFC, based on their experience of the topic and with the intention of sharing them with other institutions that are seeking common approaches to tracking and reporting.
The Principles consist of a set of common definitions and guidelines, including a list of activities. However, they do not cover aspects of their implementation, including quality-control procedures, which remain the sole responsibility of each institution and/or group. The Common Principles reflect the approach that both groups (MDBs and the IDFC) have been following for tracking climate change mitigation activities for the past ten years, and are based on the application of harmonised terms. While the MDBs and the IDFC continue to report through their respective group-based efforts, the joint MDB approach for reporting mitigation finance aligns closely with the Common Principles, and is based on the following attributes:
1. ADDITIONALITYLike the Common Principles, this approach is activity-based. It focuses on the type of activity to be executed, and not on its purpose, the origin of the financial resources or the results.
2. TIMELINEProject reporting is ex-ante project implementation at Board approval or at the time of financial commitment.
3. CONSERVATIVENESSWhere data is unavailable, any uncertainty must be overcome taking a conservative approach, in which it is preferable to under-report rather than over-report climate finance.
4. GRANULARITYThe tracking only covers mitigation activities, which are to be disaggregated from non-mitigation activities as far as reasonably possible. If such disaggregation is needed and not possible using project-specific data, a more qualitative or experience-based assessment can be used to identify the proportion of the project that covers climate mitigation activities, consistent with the principle of conservativeness. This applies to all categories, but is of particular significance for energy efficiency projects.
5. SCOPEMitigation activities or projects can consist of a standalone project, multiple standalone projects under a larger programme, a component of a standalone project or a programme financed through a financial intermediary. For example, a project with a total cost of US$ 100 million may have a US$ 10 million documented component for energy efficiency improvement; in this case, only the US$ 10 million would be reported. Another example may be a US$ 100 million credit line to a financial intermediary for renewable energy and pollution control investments, where it is foreseen that at least 60 per cent of the resources would flow into renewable energy investments; in such a case, only US$ 60 million would be reported.
6. MITIGATION RESULTSReporting according to this methodology and the Common Principles does not imply evidence of climate change impacts. Moreover, any inclusion of climate change impacts is not a substitute for project-specific theoretical and/or quantitative evidence of GHG emission mitigation. Projects seeking to demonstrate climate change impacts should do so through project-specific data.
20 http://www.worldbank.org/content/dam/Worldbank/document/Climate/common-principles-for-climate-mitigation-finance-tracking.pdf 21 As noted in the executive summary of this report, the Climate Change Mitigation Working Group finalised its review of the methodology for tracking climate
mitigation finance, and commenced tracking using the new methodology on 1 January 2021 for the AfDB, ADB, AIIB, EBRD, EIB, IDBG, IsDB and NDB and on 1 July 2021 for the WBG to coincide with the institutions’ new fiscal years.
2020 JOINT REPORT ON MULTILATERAL DEVELOPMENT BANKS’ CLIMATE FINANCE
35
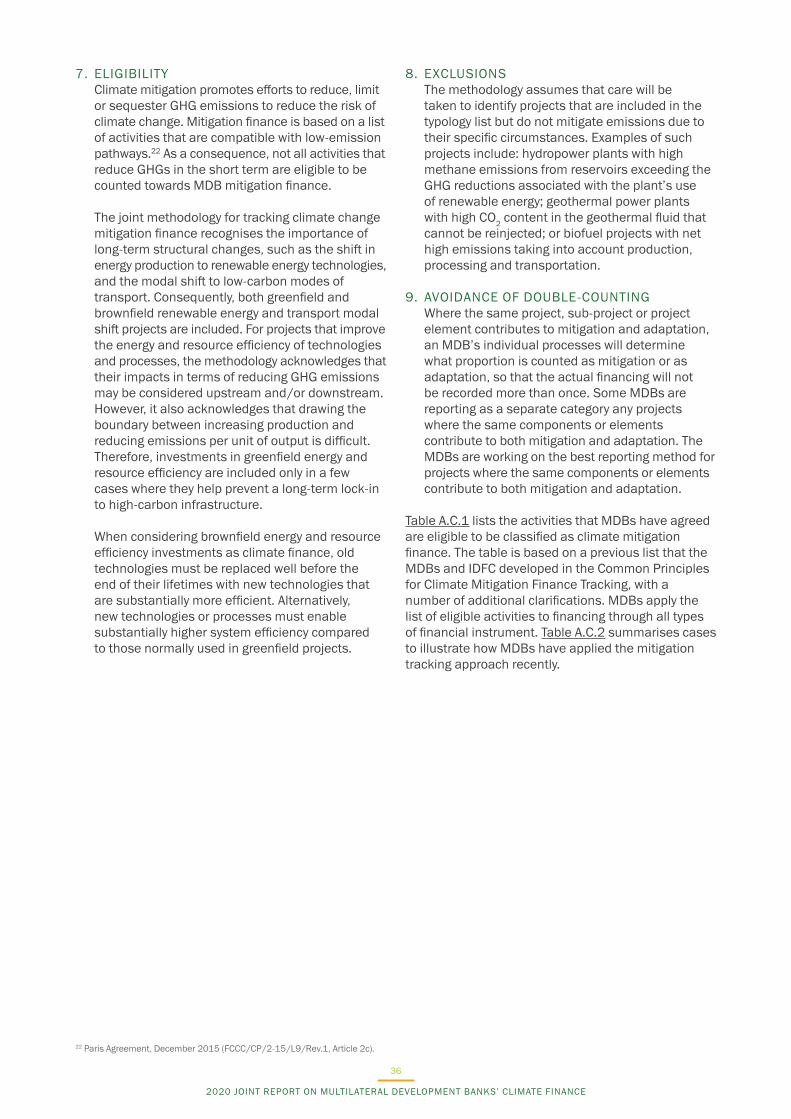
7. ELIGIBILITYClimate mitigation promotes efforts to reduce, limit or sequester GHG emissions to reduce the risk of climate change. Mitigation finance is based on a list of activities that are compatible with low-emission pathways.22 As a consequence, not all activities that reduce GHGs in the short term are eligible to be counted towards MDB mitigation finance.
The joint methodology for tracking climate change mitigation finance recognises the importance of long-term structural changes, such as the shift in energy production to renewable energy technologies, and the modal shift to low-carbon modes of transport. Consequently, both greenfield and brownfield renewable energy and transport modal shift projects are included. For projects that improve the energy and resource efficiency of technologies and processes, the methodology acknowledges that their impacts in terms of reducing GHG emissions may be considered upstream and/or downstream. However, it also acknowledges that drawing the boundary between increasing production and reducing emissions per unit of output is difficult. Therefore, investments in greenfield energy and resource efficiency are included only in a few cases where they help prevent a long-term lock-in to high-carbon infrastructure.
When considering brownfield energy and resource efficiency investments as climate finance, old technologies must be replaced well before the end of their lifetimes with new technologies that are substantially more efficient. Alternatively, new technologies or processes must enable substantially higher system efficiency compared to those normally used in greenfield projects.
8. EXCLUSIONSThe methodology assumes that care will be taken to identify projects that are included in the typology list but do not mitigate emissions due to their specific circumstances. Examples of such projects include: hydropower plants with high methane emissions from reservoirs exceeding the GHG reductions associated with the plant’s use of renewable energy; geothermal power plants with high CO2 content in the geothermal fluid that cannot be reinjected; or biofuel projects with net high emissions taking into account production, processing and transportation.
9. AVOIDANCE OF DOUBLE-COUNTINGWhere the same project, sub-project or project element contributes to mitigation and adaptation, an MDB’s individual processes will determine what proportion is counted as mitigation or as adaptation, so that the actual financing will not be recorded more than once. Some MDBs are reporting as a separate category any projects where the same components or elements contribute to both mitigation and adaptation. The MDBs are working on the best reporting method for projects where the same components or elements contribute to both mitigation and adaptation.
Table A.C.1 lists the activities that MDBs have agreed are eligible to be classified as climate mitigation finance. The table is based on a previous list that the MDBs and IDFC developed in the Common Principles for Climate Mitigation Finance Tracking, with a number of additional clarifications. MDBs apply the list of eligible activities to financing through all types of financial instrument. Table A.C.2 summarises cases to illustrate how MDBs have applied the mitigation tracking approach recently.
22 Paris Agreement, December 2015 (FCCC/CP/2-15/L9/Rev.1, Article 2c).
2020 JOINT REPORT ON MULTILATERAL DEVELOPMENT BANKS’ CLIMATE FINANCE
36
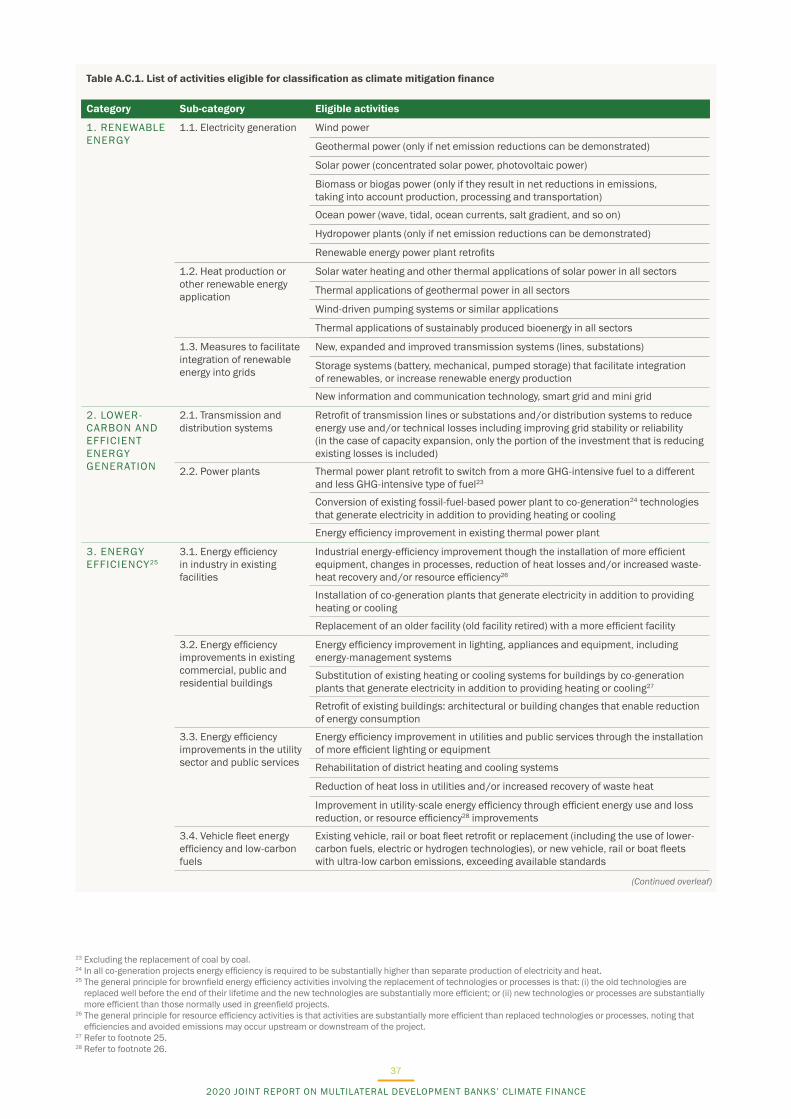
Table A.C.1. List of activities eligible for classification as climate mitigation finance
Category Sub-category Eligible activities
1. RENEWABLE ENERGY
1.1. Electricity generation Wind power
Geothermal power (only if net emission reductions can be demonstrated)
Solar power (concentrated solar power, photovoltaic power)
Biomass or biogas power (only if they result in net reductions in emissions, taking into account production, processing and transportation)
Ocean power (wave, tidal, ocean currents, salt gradient, and so on)
Hydropower plants (only if net emission reductions can be demonstrated)
Renewable energy power plant retrofits
1.2. Heat production or other renewable energy application
Solar water heating and other thermal applications of solar power in all sectors
Thermal applications of geothermal power in all sectors
Wind-driven pumping systems or similar applications
Thermal applications of sustainably produced bioenergy in all sectors
1.3. Measures to facilitateintegration of renewableenergy into grids
New, expanded and improved transmission systems (lines, substations)
Storage systems (battery, mechanical, pumped storage) that facilitate integration of renewables, or increase renewable energy production
New information and communication technology, smart grid and mini grid
2. LOWER-CARBON AND EFFICIENT ENERGY GENERATION
2.1. Transmission and distribution systems
Retrofit of transmission lines or substations and/or distribution systems to reduce energy use and/or technical losses including improving grid stability or reliability (in the case of capacity expansion, only the portion of the investment that is reducing existing losses is included)
2.2. Power plants Thermal power plant retrofit to switch from a more GHG-intensive fuel to a different and less GHG-intensive type of fuel23
Conversion of existing fossil-fuel-based power plant to co-generation24 technologies that generate electricity in addition to providing heating or cooling
Energy efficiency improvement in existing thermal power plant
3. ENERGY EFFICIENCY25
3.1. Energy efficiency in industry in existing facilities
Industrial energy-efficiency improvement though the installation of more efficient equipment, changes in processes, reduction of heat losses and/or increased waste-heat recovery and/or resource efficiency26
Installation of co-generation plants that generate electricity in addition to providing heating or cooling
Replacement of an older facility (old facility retired) with a more efficient facility
3.2. Energy efficiency improvements in existing commercial, public and residential buildings
Energy efficiency improvement in lighting, appliances and equipment, including energy-management systems
Substitution of existing heating or cooling systems for buildings by co-generation plants that generate electricity in addition to providing heating or cooling27
Retrofit of existing buildings: architectural or building changes that enable reduction of energy consumption
3.3. Energy efficiency improvements in the utility sector and public services
Energy efficiency improvement in utilities and public services through the installation of more efficient lighting or equipment
Rehabilitation of district heating and cooling systems
Reduction of heat loss in utilities and/or increased recovery of waste heat
Improvement in utility-scale energy efficiency through efficient energy use and loss reduction, or resource efficiency28 improvements
3.4. Vehicle fleet energy efficiency and low-carbon fuels
Existing vehicle, rail or boat fleet retrofit or replacement (including the use of lower-carbon fuels, electric or hydrogen technologies), or new vehicle, rail or boat fleets with ultra-low carbon emissions, exceeding available standards
23 Excluding the replacement of coal by coal.24 In all co-generation projects energy efficiency is required to be substantially higher than separate production of electricity and heat.25 The general principle for brownfield energy efficiency activities involving the replacement of technologies or processes is that: (i) the old technologies are
replaced well before the end of their lifetime and the new technologies are substantially more efficient; or (ii) new technologies or processes are substantially more efficient than those normally used in greenfield projects.
26 The general principle for resource efficiency activities is that activities are substantially more efficient than replaced technologies or processes, noting that efficiencies and avoided emissions may occur upstream or downstream of the project.
27 Refer to footnote 25.28 Refer to footnote 26.
(Continued overleaf)
2020 JOINT REPORT ON MULTILATERAL DEVELOPMENT BANKS’ CLIMATE FINANCE
37
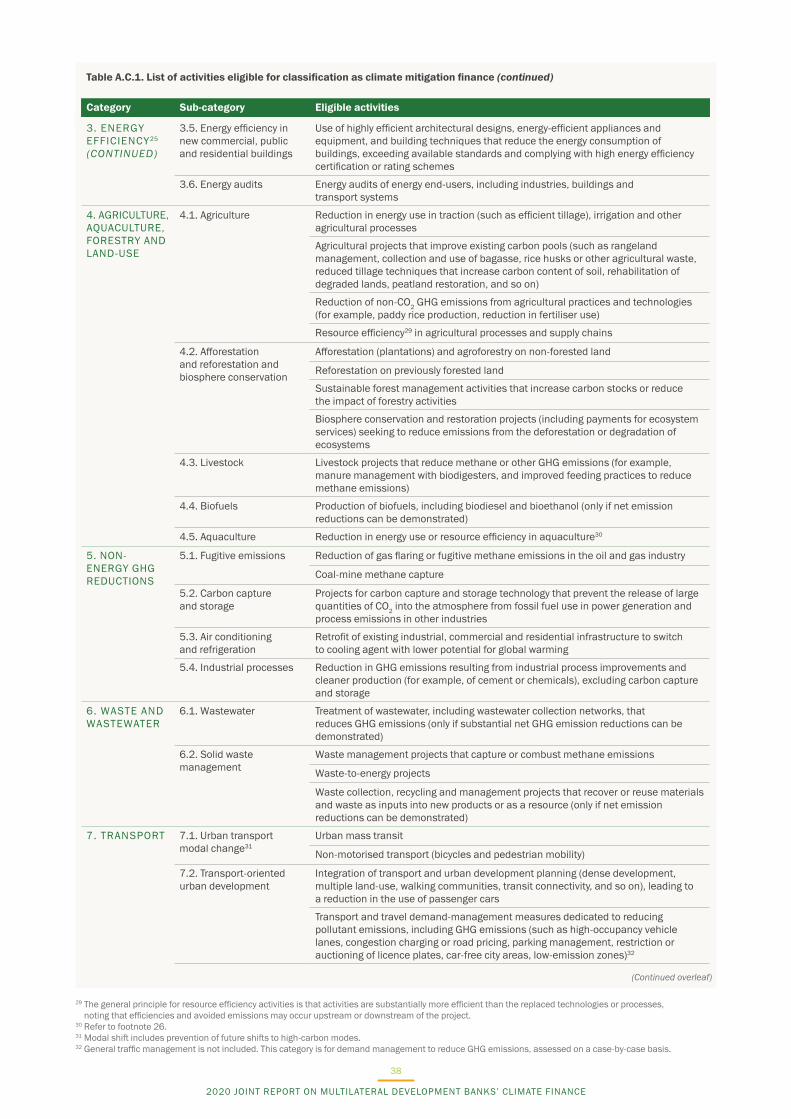
3. ENERGY EFFICIENCY25
(CONTINUED)
3.5. Energy efficiency in new commercial, public and residential buildings
Use of highly efficient architectural designs, energy-efficient appliances and equipment, and building techniques that reduce the energy consumption of buildings, exceeding available standards and complying with high energy efficiency certification or rating schemes
3.6. Energy audits Energy audits of energy end-users, including industries, buildings and transport systems
4. AGRICULTURE, AQUACULTURE, FORESTRY AND LAND-USE
4.1. Agriculture Reduction in energy use in traction (such as efficient tillage), irrigation and other agricultural processes
Agricultural projects that improve existing carbon pools (such as rangeland management, collection and use of bagasse, rice husks or other agricultural waste, reduced tillage techniques that increase carbon content of soil, rehabilitation of degraded lands, peatland restoration, and so on)
Reduction of non-CO2 GHG emissions from agricultural practices and technologies (for example, paddy rice production, reduction in fertiliser use)
Resource efficiency29 in agricultural processes and supply chains
4.2. Afforestation and reforestation and biosphere conservation
Afforestation (plantations) and agroforestry on non-forested land
Reforestation on previously forested land
Sustainable forest management activities that increase carbon stocks or reduce the impact of forestry activities
Biosphere conservation and restoration projects (including payments for ecosystem services) seeking to reduce emissions from the deforestation or degradation of ecosystems
4.3. Livestock Livestock projects that reduce methane or other GHG emissions (for example, manure management with biodigesters, and improved feeding practices to reduce methane emissions)
4.4. Biofuels Production of biofuels, including biodiesel and bioethanol (only if net emission reductions can be demonstrated)
4.5. Aquaculture Reduction in energy use or resource efficiency in aquaculture30
5. NON-ENERGY GHG REDUCTIONS
5.1. Fugitive emissions Reduction of gas flaring or fugitive methane emissions in the oil and gas industry
Coal-mine methane capture
5.2. Carbon capture and storage
Projects for carbon capture and storage technology that prevent the release of large quantities of CO2 into the atmosphere from fossil fuel use in power generation and process emissions in other industries
5.3. Air conditioning and refrigeration
Retrofit of existing industrial, commercial and residential infrastructure to switch to cooling agent with lower potential for global warming
5.4. Industrial processes Reduction in GHG emissions resulting from industrial process improvements and cleaner production (for example, of cement or chemicals), excluding carbon capture and storage
6. WASTE AND WASTEWATER
6.1. Wastewater Treatment of wastewater, including wastewater collection networks, that reduces GHG emissions (only if substantial net GHG emission reductions can be demonstrated)
6.2. Solid waste management
Waste management projects that capture or combust methane emissions
Waste-to-energy projects
Waste collection, recycling and management projects that recover or reuse materials and waste as inputs into new products or as a resource (only if net emission reductions can be demonstrated)
7. TRANSPORT 7.1. Urban transport modal change31
Urban mass transit
Non-motorised transport (bicycles and pedestrian mobility)
7.2. Transport-oriented urban development
Integration of transport and urban development planning (dense development, multiple land-use, walking communities, transit connectivity, and so on), leading to a reduction in the use of passenger cars
Transport and travel demand-management measures dedicated to reducing pollutant emissions, including GHG emissions (such as high-occupancy vehicle lanes, congestion charging or road pricing, parking management, restriction or auctioning of licence plates, car-free city areas, low-emission zones)32
Table A.C.1. List of activities eligible for classification as climate mitigation finance (continued)
Category Sub-category Eligible activities
29 The general principle for resource efficiency activities is that activities are substantially more efficient than the replaced technologies or processes, noting that efficiencies and avoided emissions may occur upstream or downstream of the project.
30 Refer to footnote 26. 31 Modal shift includes prevention of future shifts to high-carbon modes.32 General traffic management is not included. This category is for demand management to reduce GHG emissions, assessed on a case-by-case basis.
(Continued overleaf)
2020 JOINT REPORT ON MULTILATERAL DEVELOPMENT BANKS’ CLIMATE FINANCE
38
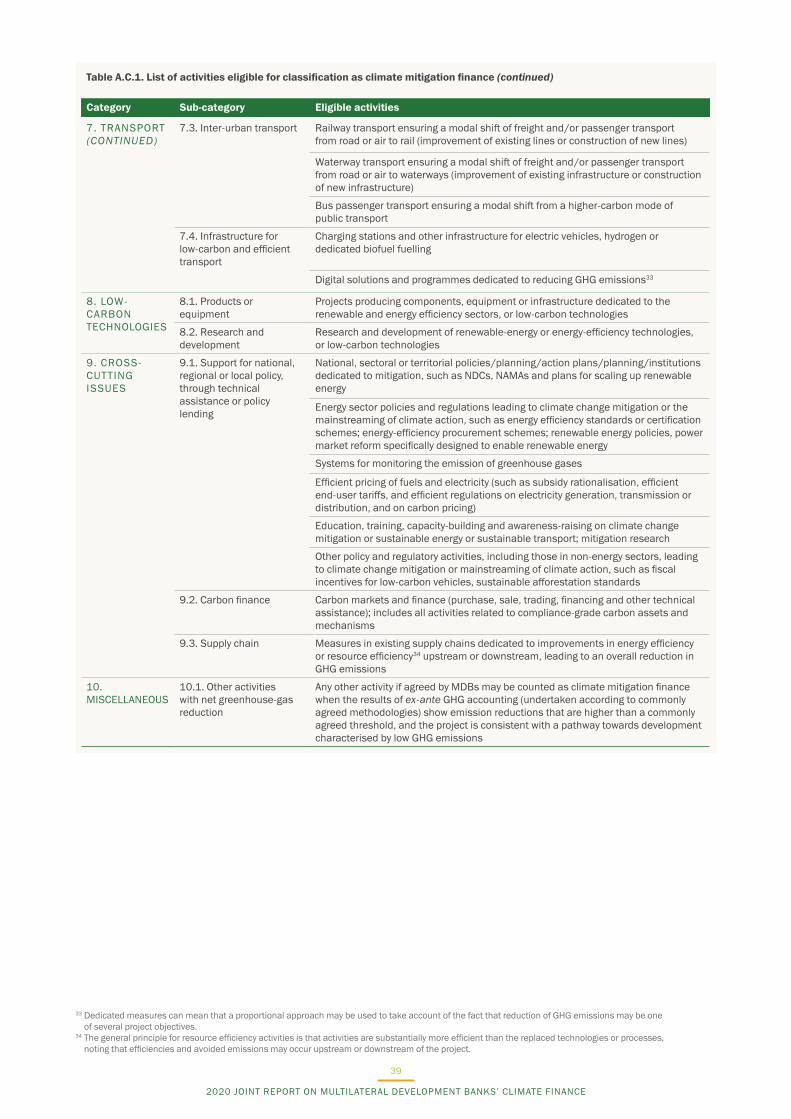
7. TRANSPORT (CONTINUED)
7.3. Inter-urban transport Railway transport ensuring a modal shift of freight and/or passenger transport from road or air to rail (improvement of existing lines or construction of new lines)
Waterway transport ensuring a modal shift of freight and/or passenger transport from road or air to waterways (improvement of existing infrastructure or construction of new infrastructure)
Bus passenger transport ensuring a modal shift from a higher-carbon mode of public transport
7.4. Infrastructure for low-carbon and efficient transport
Charging stations and other infrastructure for electric vehicles, hydrogen or dedicated biofuel fuelling
Digital solutions and programmes dedicated to reducing GHG emissions33
8. LOW-CARBON TECHNOLOGIES
8.1. Products or equipment
Projects producing components, equipment or infrastructure dedicated to the renewable and energy efficiency sectors, or low-carbon technologies
8.2. Research and development
Research and development of renewable-energy or energy-efficiency technologies, or low-carbon technologies
9. CROSS-CUTTING ISSUES
9.1. Support for national, regional or local policy, through technical assistance or policy lending
National, sectoral or territorial policies/planning/action plans/planning/institutions dedicated to mitigation, such as NDCs, NAMAs and plans for scaling up renewable energy
Energy sector policies and regulations leading to climate change mitigation or the mainstreaming of climate action, such as energy efficiency standards or certification schemes; energy-efficiency procurement schemes; renewable energy policies, power market reform specifically designed to enable renewable energy
Systems for monitoring the emission of greenhouse gases
Efficient pricing of fuels and electricity (such as subsidy rationalisation, efficient end-user tariffs, and efficient regulations on electricity generation, transmission or distribution, and on carbon pricing)
Education, training, capacity-building and awareness-raising on climate change mitigation or sustainable energy or sustainable transport; mitigation research
Other policy and regulatory activities, including those in non-energy sectors, leading to climate change mitigation or mainstreaming of climate action, such as fiscal incentives for low-carbon vehicles, sustainable afforestation standards
9.2. Carbon finance Carbon markets and finance (purchase, sale, trading, financing and other technical assistance); includes all activities related to compliance-grade carbon assets and mechanisms
9.3. Supply chain Measures in existing supply chains dedicated to improvements in energy efficiency or resource efficiency34 upstream or downstream, leading to an overall reduction in GHG emissions
10. MISCELLANEOUS
10.1. Other activities with net greenhouse-gas reduction
Any other activity if agreed by MDBs may be counted as climate mitigation finance when the results of ex-ante GHG accounting (undertaken according to commonly agreed methodologies) show emission reductions that are higher than a commonly agreed threshold, and the project is consistent with a pathway towards development characterised by low GHG emissions
Table A.C.1. List of activities eligible for classification as climate mitigation finance (continued)
Category Sub-category Eligible activities
33 Dedicated measures can mean that a proportional approach may be used to take account of the fact that reduction of GHG emissions may be one of several project objectives.
34 The general principle for resource efficiency activities is that activities are substantially more efficient than the replaced technologies or processes, noting that efficiencies and avoided emissions may occur upstream or downstream of the project.
2020 JOINT REPORT ON MULTILATERAL DEVELOPMENT BANKS’ CLIMATE FINANCE
39

Table A.C.2. Case studies of tracking mitigation finance in projects
PROJECT FOCUS
MULTI-HAZARD-RESILIENT APPROACH IN DISASTER-RISK MANAGEMENT, WITH A SPECIFIC FOCUS ON MANAGING COVID-19
ASSISTANCE TO THE POWER SECTOR DURING THE COVID-19 PANDEMIC
Sector Health Energy
Brief description of project
The emergency project was prepared in response to the government’s request for assistance in managing the Covid-19 outbreak in the country. The project will provide (i) immediate financing to help the government deal with the crisis quickly and flexibly by strengthening its public health preparedness and responsiveness; and (ii) a social protection component for quick financial support to help meet the basic needs of vulnerable and poor segments of society and to stimulate the domestic economy. The project is part of the MDB’s support for developing member countries in their fight against the pandemic.The project outputs are as follows:Strengthening the emergency preparedness and response of the public health system. The activities under this output include:i. providing stockpiles of personal protective equipment, medicines and medical supplies, along with inventory control, to public health facilities to prepare them for any unexpected surge during the initial three to six months, and to equip them and their frontline health workers for the projected (at the time) nine-month duration of the Covid-19 crisisii. upgrading or expanding public medical facilities including, but not limited to, sex-segregated patient wards; intensive care units; separate changing and resting facilities for male and female health workers; facilities (such as medium-sized incinerators, autoclaves) for managing Covid-19-contaminated medical waste; clean energy supplies and backup; communication systems; and water, sanitation and hygiene facilities, as needediii. providing additional health staff for emergency surges and safeguarding essential health services; training new and current health staff on the management of Covid-19 cases, risk communication and health management systems (such as inventory control, disease surveillance and standard protocols); and exchanging knowledge with neighbouring countries and others in the regioniv. strengthening disaster preparedness and quick response by providing multi-hazard rescue and relief capacity in remote border areas, including emergency-response vehicles, equipment, training and suppliesv. supporting social distancing measures, and strengthening the outreach of Covid-19 communications by establishing a multipurpose interface for communication and education in remote and marginal communities, especially in border areas, that have limited television, cable and internet coveragevi. providing safe community water-supply and sanitation facilities for the general public in selected health facilities and public spaces, including in remote rural communities and informal urban settlements, to improve health and hygiene and reduce the rate of infection. This provision is expected to include public handwashing and toilet facilities.
The borrower is the country’s largest renewable-energy company. It develops and operates utility-scale wind and solar projects across the country. The borrower has been mandated to continue operating in order to ensure a smooth and uninterrupted flow of power supply during the Covid-19 crisis. The majority of the borrower’s operational portfolio consists of long-term power-purchase agreements with various distribution companies. For independent power producers, the lower levels of power demand during the Covid-19 lockdown are expected to extend the number of days that customers take to pay their power bills. The direct impact of an increase in the working-capital cycle includes (i) an increase in the working capital that must be provided by the borrower to its subsidiaries and affiliates, and (ii) a reduction in the dividend income from subsidiaries and affiliates, as a result of less cash being available due to delays in the receipt of revenue. Based on post-pandemic financial projections on a standalone basis, the borrower’s working capital requirement to support its own projects and subsidiaries and its accounts receivable will increase. Delays in commissioning new projects may also result in potential loss of revenue, further affecting the company’s ability to maintain a stable cash flow to sustain its operations. The borrower proposes to mitigate these impacts by (i) postponing a planned capacity expansion by delaying construction by a few months, (ii) borrowing a short-term liquidity facility from the MDB, and (iii) using part of its existing cash balance. The proceeds of the MDB debt financing facility will partially finance the borrower’s working capital needs arising from cashflow mismatches that may occur because of delayed payments by its customers in the Covid-19 pandemic. The purpose of the debt financing facility is limited to helping the company sustain its operations.The MDB financing will enable the borrower to continue its operations and deliver a reliable supply of power to the domestic grid, ensuring the continuity of renewable power delivery. The financing will ensure that the company can continue to pay its employees’ salaries and will help it maintain a minimum cash balance to sustain operations. The project complements the government’s financial package to provide liquidity support to state distribution companies to enable them to partly clear their payment obligations, which had been building up even prior to the Covid-19 crisis. The MDB support will address short-term liquidity constraints at a time when local commercial banks have become risk averse and have reduced their lending activity.
Social protection for poor and vulnerable women will be delivered. The project will finance the immediate additional cash transfers and provide support to the government to continue the expansion of cash transfers as the Covid-19 situation evolves.
(Continued overleaf)
2020 JOINT REPORT ON MULTILATERAL DEVELOPMENT BANKS’ CLIMATE FINANCE
40
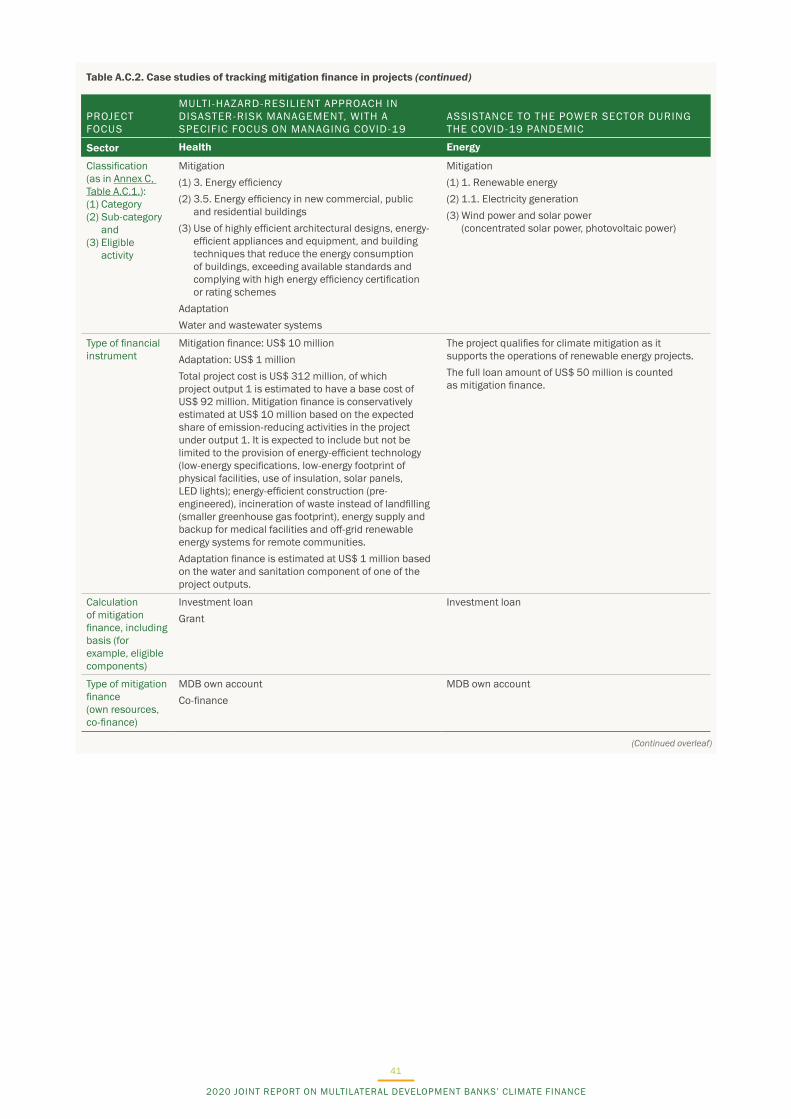
Table A.C.2. Case studies of tracking mitigation finance in projects (continued)
PROJECT FOCUS
MULTI-HAZARD-RESILIENT APPROACH IN DISASTER-RISK MANAGEMENT, WITH A SPECIFIC FOCUS ON MANAGING COVID-19
ASSISTANCE TO THE POWER SECTOR DURING THE COVID-19 PANDEMIC
Sector Health Energy
Classification (as in Annex C, Table A.C.1.): (1) Category (2) Sub-category
and (3) Eligible
activity
Mitigation(1) 3. Energy efficiency(2) 3.5. Energy efficiency in new commercial, public
and residential buildings(3) Use of highly efficient architectural designs, energy-
efficient appliances and equipment, and building techniques that reduce the energy consumption of buildings, exceeding available standards and complying with high energy efficiency certification or rating schemes
AdaptationWater and wastewater systems
Mitigation(1) 1. Renewable energy (2) 1.1. Electricity generation(3) Wind power and solar power
(concentrated solar power, photovoltaic power)
Type of financial instrument
Mitigation finance: US$ 10 millionAdaptation: US$ 1 millionTotal project cost is US$ 312 million, of which project output 1 is estimated to have a base cost of US$ 92 million. Mitigation finance is conservatively estimated at US$ 10 million based on the expected share of emission-reducing activities in the project under output 1. It is expected to include but not be limited to the provision of energy-efficient technology (low-energy specifications, low-energy footprint of physical facilities, use of insulation, solar panels, LED lights); energy-efficient construction (pre-engineered), incineration of waste instead of landfilling (smaller greenhouse gas footprint), energy supply and backup for medical facilities and off-grid renewable energy systems for remote communities.Adaptation finance is estimated at US$ 1 million based on the water and sanitation component of one of the project outputs.
The project qualifies for climate mitigation as it supports the operations of renewable energy projects.The full loan amount of US$ 50 million is counted as mitigation finance.
Calculation of mitigation finance, including basis (for example, eligible components)
Investment loanGrant
Investment loan
Type of mitigation finance (own resources, co-finance)
MDB own accountCo-finance
MDB own account
(Continued overleaf)
2020 JOINT REPORT ON MULTILATERAL DEVELOPMENT BANKS’ CLIMATE FINANCE
41

Table A.C.2. Case studies of tracking mitigation finance in projects (continued)
PROJECT FOCUS
INDUSTRIAL COMPETITIVENESS AND JOBS
ELECTROMOBILITY (VEHICLE FLEET ENERGY EFFICIENCY AND LOW-CARBON FUELS)
Sector Multisectoral Transport
Brief description of project
The project aims to promote private investment, job creation and environmental sustainability in participating economic zones and software technology parks. It supports the efforts to recover economically from the Covid-19 pandemic, addressing supply-side constraints for industry and manufacturers, the ability of these producers to restart production and the capacity of the country’s entrepreneurs to capitalise on increased demand for the digital delivery of services. One of the project’s core focuses is advancing the country’s climate and environment agenda. As such, the project’s interventions will catalyse a strong shift towards more environmentally sustainable production and greater use of cleaner and more energy-efficient technology across the industries supported. The project also incorporates renewable technologies and low-carbon considerations into the design of these industrial parks and associated civil work. Lastly, it strongly emphasises institutional capacity-building and good governance to implement institutional, regulatory and administrative reforms and capacity-building programmes relevant to project’s climate and environment agenda.
This is the first loan operation of a conditional credit line for investment projects (CCLIP) aimed at reducing fossil fuel consumption and greenhouse gas emissions by boosting investment in electric vehicles. The specific objectives of this operation are: (i) to stimulate financing for private investment in electric vehicles and (ii) to encourage the replacement of internal combustion vehicles. The achievement of these objectives will support the general objective of reducing fossil fuel consumption and greenhouse gas emissions by promoting low-carbon mobility.The operation includes:• long-term loans to finance the purchase of electric
vehicles, with an inclusive orientation towards women entrepreneurs in the taxi sector
• resources to provide, under the first component, scrappage certificates or payments to beneficiaries who certify that they will scrap the internal combustion vehicle being replaced by the electric vehicle.
The first component (US$ 30 million) will use concessional resources from the Clean Technology Fund (CTF) alongside the MDB’s ordinary capital to provide long-term loans for financing the purchase of electric vehicles. The CTF financing was approved under the third phase of dedicated private-sector programmes which aim to use an array of financing instruments to shoulder risks that commercial lenders are unable to assume. The second component (US$ 3 million) will provide scrappage certificates or payments to beneficiaries under the first component who certify that they will scrap the internal combustion vehicle replaced by the electric vehicle. Payments will be administered by the Ministry of Transportation and Public Works.
Classification (as in Annex C, Table A.C.1.): (1) Category (2) Sub-category
and (3) Eligible
activity
Multiple classifications were applied to this project, including: (1) 1. Renewable energy (2) 1.1 Electricity generation (3) 1.3 Solar
6. Waste and wastewater 6.2 Solid waste management Waste management projects that capture or combust methane emissions; waste collection, recycling and management projects that recover or reuse materials.
9. Cross-cutting issues9.1. Support for national, regional or local policy, through technical assistance or policy lending
(1) Mitigation Vehicle fleet energy efficiency and low-carbon fuels
Type of financial instrument
Investment loan First loan from a global credit programme
(Continued overleaf)
2020 JOINT REPORT ON MULTILATERAL DEVELOPMENT BANKS’ CLIMATE FINANCE
42
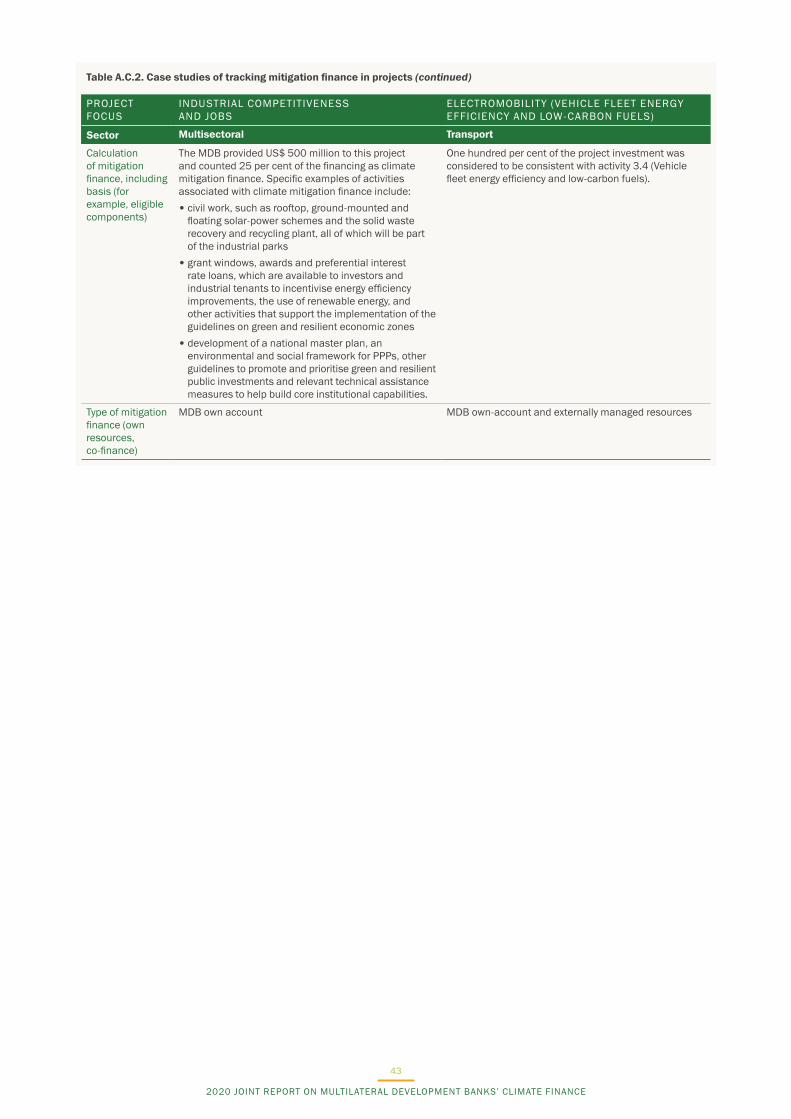
Table A.C.2. Case studies of tracking mitigation finance in projects (continued)
PROJECT FOCUS
INDUSTRIAL COMPETITIVENESS AND JOBS
ELECTROMOBILITY (VEHICLE FLEET ENERGY EFFICIENCY AND LOW-CARBON FUELS)
Sector Multisectoral Transport
Calculation of mitigation finance, including basis (for example, eligible components)
The MDB provided US$ 500 million to this project and counted 25 per cent of the financing as climate mitigation finance. Specific examples of activities associated with climate mitigation finance include: • civil work, such as rooftop, ground-mounted and
floating solar-power schemes and the solid waste recovery and recycling plant, all of which will be part of the industrial parks
• grant windows, awards and preferential interest rate loans, which are available to investors and industrial tenants to incentivise energy efficiency improvements, the use of renewable energy, and other activities that support the implementation of the guidelines on green and resilient economic zones
• development of a national master plan, an environmental and social framework for PPPs, other guidelines to promote and prioritise green and resilient public investments and relevant technical assistance measures to help build core institutional capabilities.
One hundred per cent of the project investment was considered to be consistent with activity 3.4 (Vehicle fleet energy efficiency and low-carbon fuels).
Type of mitigation finance (own resources, co-finance)
MDB own account MDB own-account and externally managed resources
2020 JOINT REPORT ON MULTILATERAL DEVELOPMENT BANKS’ CLIMATE FINANCE
43
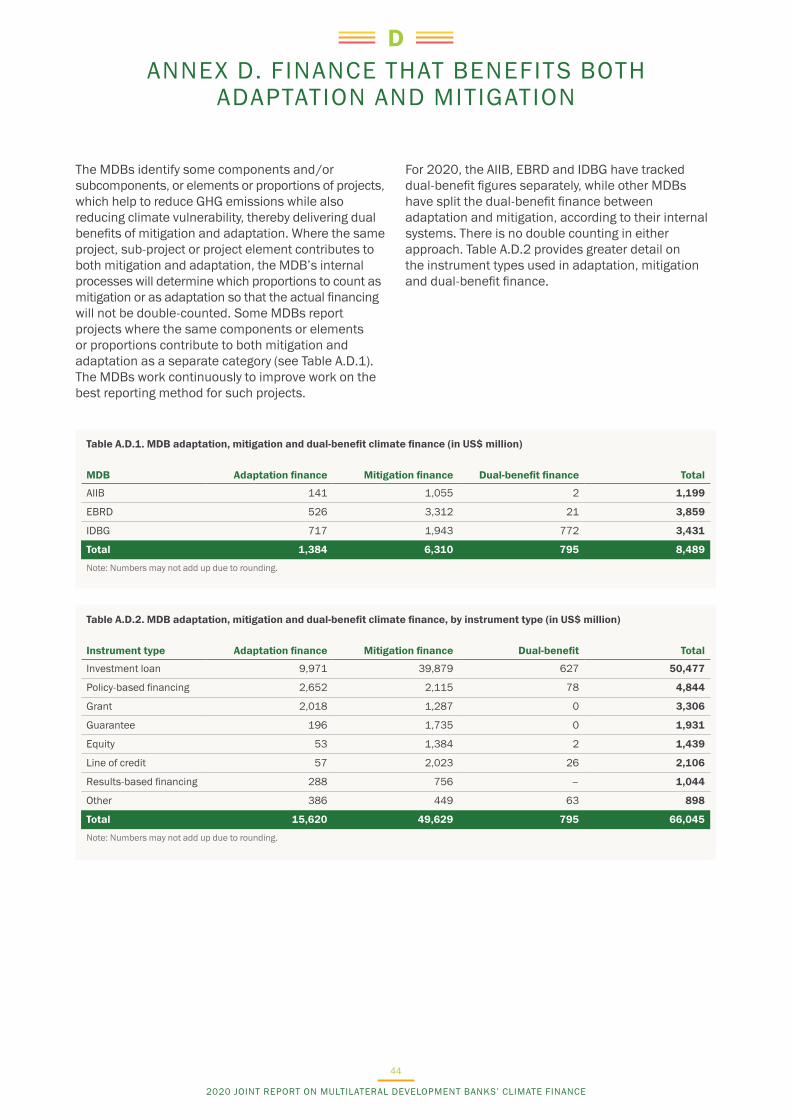
ANNEX D. FINANCE THAT BENEFITS BOTH ADAPTATION AND MITIGATION
D
The MDBs identify some components and/or subcomponents, or elements or proportions of projects, which help to reduce GHG emissions while also reducing climate vulnerability, thereby delivering dual benefits of mitigation and adaptation. Where the same project, sub-project or project element contributes to both mitigation and adaptation, the MDB’s internal processes will determine which proportions to count as mitigation or as adaptation so that the actual financing will not be double-counted. Some MDBs report projects where the same components or elements or proportions contribute to both mitigation and adaptation as a separate category (see Table A.D.1). The MDBs work continuously to improve work on the best reporting method for such projects.
For 2020, the AIIB, EBRD and IDBG have tracked dual-benefit figures separately, while other MDBs have split the dual-benefit finance between adaptation and mitigation, according to their internal systems. There is no double counting in either approach. Table A.D.2 provides greater detail on the instrument types used in adaptation, mitigation and dual-benefit finance.
Table A.D.1. MDB adaptation, mitigation and dual-benefit climate finance (in US$ million)
MDB Adaptation finance Mitigation finance Dual-benefit finance Total
AIIB 141 1,055 2 1,199
EBRD 526 3,312 21 3,859
IDBG 717 1,943 772 3,431
Total 1,384 6,310 795 8,489
Note: Numbers may not add up due to rounding.
Table A.D.2. MDB adaptation, mitigation and dual-benefit climate finance, by instrument type (in US$ million)
Instrument type Adaptation finance Mitigation finance Dual-benefit Total
Investment loan 9,971 39,879 627 50,477
Policy-based financing 2,652 2,115 78 4,844
Grant 2,018 1,287 0 3,306
Guarantee 196 1,735 0 1,931
Equity 53 1,384 2 1,439
Line of credit 57 2,023 26 2,106
Results-based financing 288 756 – 1,044
Other 386 449 63 898
Total 15,620 49,629 795 66,045
Note: Numbers may not add up due to rounding.
2020 JOINT REPORT ON MULTILATERAL DEVELOPMENT BANKS’ CLIMATE FINANCE
44

Table A.D.3. Case study of tracking a dual-benefit project
PROJECT FOCUS POLICY AND REGULATIONS/ENVIRONMENT AND DISASTER RISK
Brief description of project
This policy-based loan aims to improve the country’s governance for sustainability by strengthening and modernising the regulatory framework. It will support ongoing efforts at regulatory reform to improve: (i) the efficiency and sustainability of spatial planning, development control and water resource management; (ii) natural asset management; and (iii) disaster risk management and resilience.Most of the country̓s productive assets and attractive development prospects are coastal in location. The national territory is water-scarce, with most of its potable water supply derived from groundwater, and the country is exposed to increasing risks from natural hazards and climate change. Regional projections suggest that climate change will decrease mean annual precipitation, increase mean annual air temperature, increase the frequency and severity of coastal hazards and generate new types of hazards such as sea level rise. A reduction in annual rainfall could lead to increased concentrations of contaminants in groundwater. Meanwhile, increased rainfall intensity may exacerbate flooding risks. Lastly, sea level rise is likely to cause coastal erosion and flooding, affecting the beaches that protect the country̓s coastal regions and are a vital asset to its economy.The project will include the modernisation of the country̓s Integrated Coastal Zone Management Policy to address and integrate resilience to climate change and disaster risks. It will also support governance reforms to enhance disaster risk management and resilience to climate impacts. In addition, by supporting the protection of maritime and coastal ecosystems, the project will support the sequestration of carbon through mangroves and other plant species, with dual benefits (mitigation and adaptation).The policies in the project̓s policy matrix that were linked to reducing climate vulnerability and increasing resilience were related to updating the water management plan to include adaptation considerations (two policies); the modernisation of the National Integrated Zonal Coast Management policy to integrate resilience to disaster and climate risk (one policy); and the support of reforms to enhance disaster risk management and resilience (three policies).
Classification for dual benefit:(1) mitigation and (2) adaptation finance
1. Cross-cutting issues (support for national, regional or local policy through technical assistance or policy lending)
2. Institutional capacity support or technical assistance (disaster risk management; water and wastewater systems)
Calculation of (1) mitigation and (2) adaptation finance
Of the total of US$ 80,000,000 approved, 80 per cent counts as climate finance, out of which 10 per cent counts as dual-benefit investment given that one of the policies financed is related to the National Physical Development Plan, which focuses on setting out policies for land-use in addition to other topics. This policy is expected to support the protection of maritime and coastal ecosystems that work as carbon sinks (mitigation) and as an adaptative measure by enhancing coastline stability and protecting coastal settlements from tropical storm surges (adaptation). In addition, 60 per cent of the total climate finance was counted as adaptation (institutional capacity support and technical assistance on disaster risk management and water and wastewater systems) and 10 per cent as mitigation (support for national, regional or local policy through technical assistance or policy lending).A figure of 10 per cent for dual-benefit finance was estimated by assigning an equal value to all policy commitments and counting the dual benefit (adaptation and mitigation)-related policy commitments in the policy matrix (one policy) as a proportion of all policy commitments (10 policies).
Type of financial instrument
Policy-based financing
Type of finance MDB own account
2020 JOINT REPORT ON MULTILATERAL DEVELOPMENT BANKS’ CLIMATE FINANCE
45
ANNEX E. TYPES OF INSTRUMENTE
The types of financial instrument containing climate finance as reported for 2020 include the following:
a) ADVISORY SERVICES MDB advisory services include advising national and local governments as well as private sector actors on a variety of topics, for instance how to improve their investment climate and strengthen basic infrastructure. The MDB tracks and reports the costs of managing advisory programmes, which may consist of staff time, studies, and training with clients. Similar to investments, some programmes are 100 per cent climate-related and some have a climate component tracked in the overall programme budget.
b) EQUITY Ownership interest in an enterprise that represents a claim on the assets of the entity in proportion to the number and class of shares owned.
c) GRANTS Transfers made in cash, goods or services for which no repayment is required. Grants are provided for investment support, policy-based support and/or technical assistance and advice.
d) BOND A type of bond, the issuance of which is done by a client and supported by an MDB, where the proceeds are applied exclusively to financing or re-financing, in part or in full, new and/or existing climate projects.
Only the percentage of proceeds that are used for activities included in the joint MDB methodology for tracking climate finance count as climate finance.
e) GUARANTEES Guarantees are instruments provided by an MDB to cover commercial and non-commercial risk.
Guarantees support private sector investments, commercial borrowing by sovereign or state-owned enterprises, and/or commercial borrowing by the sovereign for budget financing and to support reform programmes. Guarantees are extended for eligible projects that enable financing partners to transfer certain risks that they cannot easily absorb or manage on their own. Guarantees cover equity and a wide variety of debt instruments and support financial sector projects (including those of capital market investments and trade financiers and non-financial-sector business activities corresponding to activities across sectors).
f) INVESTMENT LOANS Loans are transfers for which repayment is required. Investment loans can be used for any development activity that has the overall objective of promoting sustainable social and/or economic development, in line with the MDBs’ mandates. Proceeds used for activities included in the joint MDB methodology for tracking climate finance count as climate finance.
• Refinancing: Refinancing is the replacement of an existing debt obligation with another debt obligation under different terms.
Refinancing can be classified as climate finance subject to the following terms:
– Refinancing of assets that have reached financial closure for the entire term of the project or that have passed the break-even point, provided that the client commits to originating new climate deals for that amount within the next 24 months.
– Refinancing of assets where financial closure has not yet taken place, or the project has not yet been fully constructed and is not yet operational.
– Bringing in additional long-term funds to replace short-term bridge loans or strengthening the financial terms of the climate-related asset through long-term loans with better terms than those of previous loans (for example, they correct a mismatch of maturity, adjust the costs of asset construction, reduce exchange rate impact, replace expensive debt, and so on).
– Refinancing climate finance projects that have already been constructed or are already operational but have not passed the break-even point (for example, recently built solar projects). The break-even conditions are confirmed by the investment team.
2020 JOINT REPORT ON MULTILATERAL DEVELOPMENT BANKS’ CLIMATE FINANCE
46
• Working capital: Working capital is finance provided for operational expenditures.
Working capital is considered to be climate finance if it leads to, enables or supports the implementation and operation of activities included in the joint MDB methodology for tracking climate finance.
g) LINES OF CREDIT Lines of credit provide a guarantee that funds will be made available but no financial asset exists until funds have been advanced. Climate finance is the proportion of the credit line that is committed to activities defined as eligible in the MDBs’ climate finance tracking methodologies.
h) POLICY-BASED FINANCING (PBF) Financing for a public borrower that helps the borrower to address actual or anticipated requirements for development finance of domestic or external origins.
Policy-based financing supports a programme of policy and institutional actions for a particular theme or sector of national policy. While it does not use the cost estimation approach for each policy action, disbursements of PBF are conditional on the borrower fulfilling their policy commitments in the lending agreement.
The proportion of this public financing that is reported as climate finance is the same as the proportion of the climate-related “prior actions” agreed in order to allow the policy-based financing to proceed. For example, if one in three prior actions are climate-related, one-third of the resulting policy-based financing would be counted as climate finance.
i) RESULTS-BASED FINANCING (RBF) Results-based financing directly links the disbursement of funds to measurable results in a government-owned programme.
RBF aims to increase accountability and incentives for delivering and sustaining results, improve the effectiveness and efficiency of government-owned sector programmes, promote institutional development and enhance the effectiveness of development. Proceeds used for activities included in the joint MDB methodology for tracking climate finance count as climate finance.
2020 JOINT REPORT ON MULTILATERAL DEVELOPMENT BANKS’ CLIMATE FINANCE
47
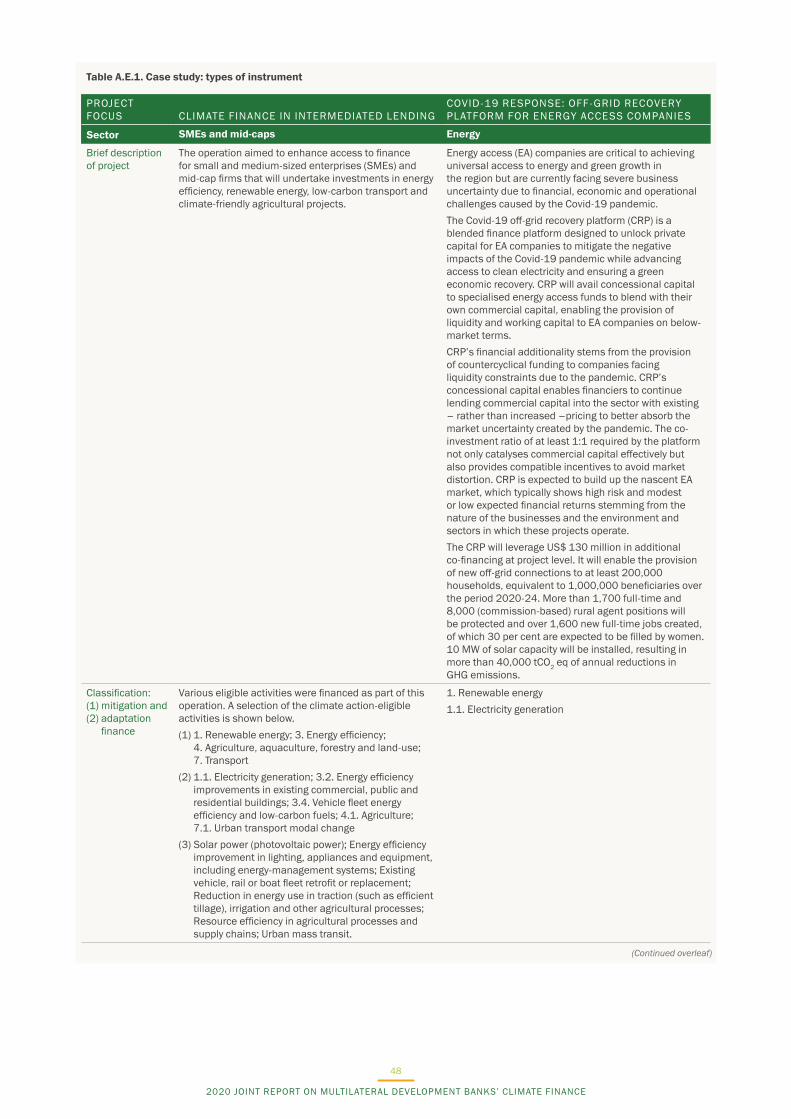
Table A.E.1. Case study: types of instrument
PROJECT FOCUS CLIMATE FINANCE IN INTERMEDIATED LENDING
COVID-19 RESPONSE: OFF-GRID RECOVERY PLATFORM FOR ENERGY ACCESS COMPANIES
Sector SMEs and mid-caps Energy
Brief description of project
The operation aimed to enhance access to finance for small and medium-sized enterprises (SMEs) and mid-cap firms that will undertake investments in energy efficiency, renewable energy, low-carbon transport and climate-friendly agricultural projects.
Energy access (EA) companies are critical to achieving universal access to energy and green growth in the region but are currently facing severe business uncertainty due to financial, economic and operational challenges caused by the Covid-19 pandemic.The Covid-19 off-grid recovery platform (CRP) is a blended finance platform designed to unlock private capital for EA companies to mitigate the negative impacts of the Covid-19 pandemic while advancing access to clean electricity and ensuring a green economic recovery. CRP will avail concessional capital to specialised energy access funds to blend with their own commercial capital, enabling the provision of liquidity and working capital to EA companies on below-market terms.CRP’s financial additionality stems from the provision of countercyclical funding to companies facing liquidity constraints due to the pandemic. CRP’s concessional capital enables financiers to continue lending commercial capital into the sector with existing – rather than increased –pricing to better absorb the market uncertainty created by the pandemic. The co-investment ratio of at least 1:1 required by the platform not only catalyses commercial capital effectively but also provides compatible incentives to avoid market distortion. CRP is expected to build up the nascent EA market, which typically shows high risk and modest or low expected financial returns stemming from the nature of the businesses and the environment and sectors in which these projects operate.The CRP will leverage US$ 130 million in additional co-financing at project level. It will enable the provision of new off-grid connections to at least 200,000 households, equivalent to 1,000,000 beneficiaries over the period 2020-24. More than 1,700 full-time and 8,000 (commission-based) rural agent positions will be protected and over 1,600 new full-time jobs created, of which 30 per cent are expected to be filled by women. 10 MW of solar capacity will be installed, resulting in more than 40,000 tCO2 eq of annual reductions in GHG emissions.
Classification:(1) mitigation and (2) adaptation
finance
Various eligible activities were financed as part of this operation. A selection of the climate action-eligible activities is shown below.(1) 1. Renewable energy; 3. Energy efficiency;
4. Agriculture, aquaculture, forestry and land-use; 7. Transport
(2) 1.1. Electricity generation; 3.2. Energy efficiency improvements in existing commercial, public and residential buildings; 3.4. Vehicle fleet energy efficiency and low-carbon fuels; 4.1. Agriculture; 7.1. Urban transport modal change
(3) Solar power (photovoltaic power); Energy efficiency improvement in lighting, appliances and equipment, including energy-management systems; Existing vehicle, rail or boat fleet retrofit or replacement; Reduction in energy use in traction (such as efficient tillage), irrigation and other agricultural processes; Resource efficiency in agricultural processes and supply chains; Urban mass transit.
1. Renewable energy1.1. Electricity generation
(Continued overleaf)
2020 JOINT REPORT ON MULTILATERAL DEVELOPMENT BANKS’ CLIMATE FINANCE
48
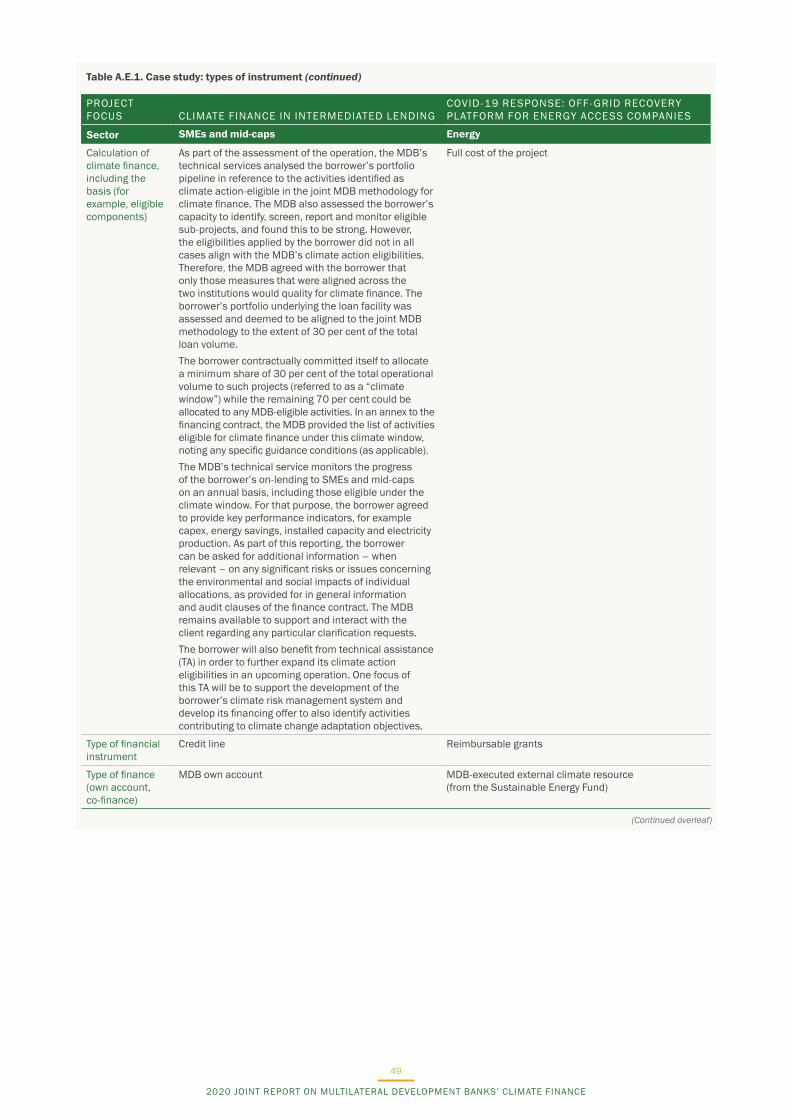
Table A.E.1. Case study: types of instrument (continued)
PROJECT FOCUS CLIMATE FINANCE IN INTERMEDIATED LENDING
COVID-19 RESPONSE: OFF-GRID RECOVERY PLATFORM FOR ENERGY ACCESS COMPANIES
Sector SMEs and mid-caps Energy
Calculation of climate finance, including the basis (for example, eligible components)
As part of the assessment of the operation, the MDB’s technical services analysed the borrower’s portfolio pipeline in reference to the activities identified as climate action-eligible in the joint MDB methodology for climate finance. The MDB also assessed the borrower’s capacity to identify, screen, report and monitor eligible sub-projects, and found this to be strong. However, the eligibilities applied by the borrower did not in all cases align with the MDB’s climate action eligibilities. Therefore, the MDB agreed with the borrower that only those measures that were aligned across the two institutions would quality for climate finance. The borrower’s portfolio underlying the loan facility was assessed and deemed to be aligned to the joint MDB methodology to the extent of 30 per cent of the total loan volume.The borrower contractually committed itself to allocate a minimum share of 30 per cent of the total operational volume to such projects (referred to as a “climate window”) while the remaining 70 per cent could be allocated to any MDB-eligible activities. In an annex to the financing contract, the MDB provided the list of activities eligible for climate finance under this climate window, noting any specific guidance conditions (as applicable).The MDB’s technical service monitors the progress of the borrower’s on-lending to SMEs and mid-caps on an annual basis, including those eligible under the climate window. For that purpose, the borrower agreed to provide key performance indicators, for example capex, energy savings, installed capacity and electricity production. As part of this reporting, the borrower can be asked for additional information – when relevant – on any significant risks or issues concerning the environmental and social impacts of individual allocations, as provided for in general information and audit clauses of the finance contract. The MDB remains available to support and interact with the client regarding any particular clarification requests.The borrower will also benefit from technical assistance (TA) in order to further expand its climate action eligibilities in an upcoming operation. One focus of this TA will be to support the development of the borrower’s climate risk management system and develop its financing offer to also identify activities contributing to climate change adaptation objectives.
Full cost of the project
Type of financial instrument
Credit line Reimbursable grants
Type of finance (own account, co-finance)
MDB own account MDB-executed external climate resource (from the Sustainable Energy Fund)
(Continued overleaf)
2020 JOINT REPORT ON MULTILATERAL DEVELOPMENT BANKS’ CLIMATE FINANCE
49
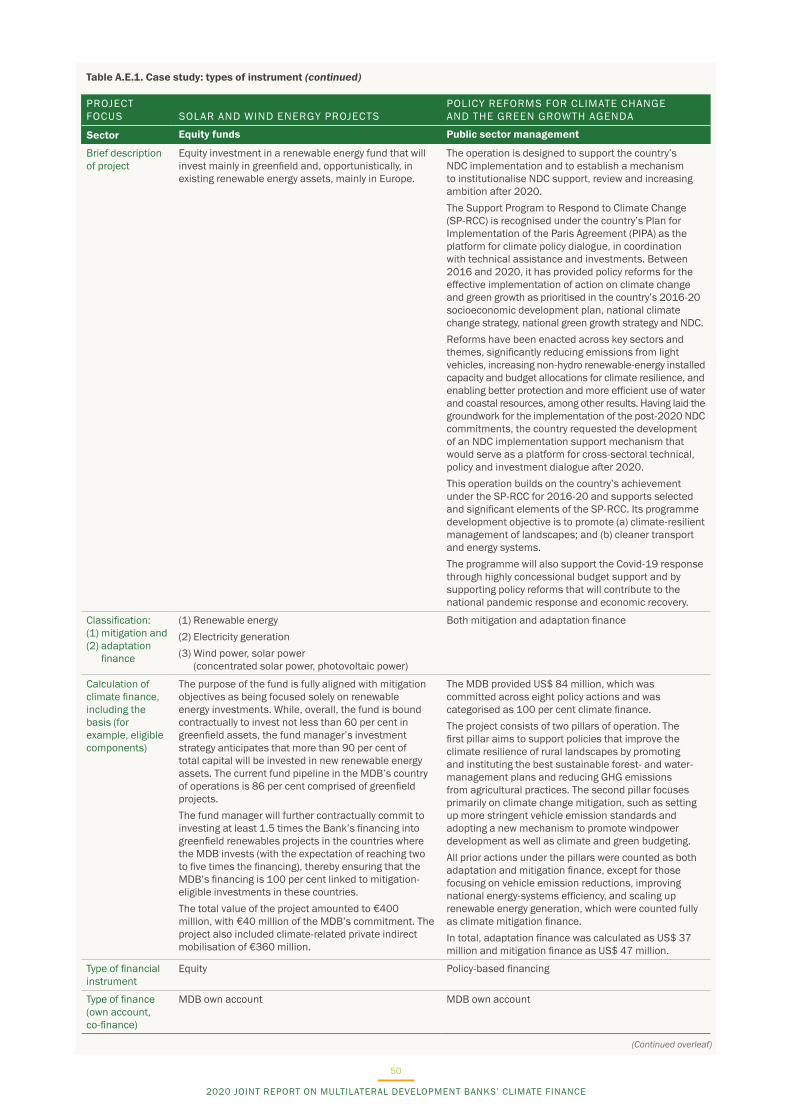
Table A.E.1. Case study: types of instrument (continued)
PROJECT FOCUS SOLAR AND WIND ENERGY PROJECTS
POLICY REFORMS FOR CLIMATE CHANGE AND THE GREEN GROWTH AGENDA
Sector Equity funds Public sector management
Brief description of project
Equity investment in a renewable energy fund that will invest mainly in greenfield and, opportunistically, in existing renewable energy assets, mainly in Europe.
The operation is designed to support the country’s NDC implementation and to establish a mechanism to institutionalise NDC support, review and increasing ambition after 2020.The Support Program to Respond to Climate Change (SP-RCC) is recognised under the country’s Plan for Implementation of the Paris Agreement (PIPA) as the platform for climate policy dialogue, in coordination with technical assistance and investments. Between 2016 and 2020, it has provided policy reforms for the effective implementation of action on climate change and green growth as prioritised in the country’s 2016-20 socioeconomic development plan, national climate change strategy, national green growth strategy and NDC. Reforms have been enacted across key sectors and themes, significantly reducing emissions from light vehicles, increasing non-hydro renewable-energy installed capacity and budget allocations for climate resilience, and enabling better protection and more efficient use of water and coastal resources, among other results. Having laid the groundwork for the implementation of the post-2020 NDC commitments, the country requested the development of an NDC implementation support mechanism that would serve as a platform for cross-sectoral technical, policy and investment dialogue after 2020. This operation builds on the country’s achievement under the SP-RCC for 2016-20 and supports selected and significant elements of the SP-RCC. Its programme development objective is to promote (a) climate-resilient management of landscapes; and (b) cleaner transport and energy systems. The programme will also support the Covid-19 response through highly concessional budget support and by supporting policy reforms that will contribute to the national pandemic response and economic recovery.
Classification:(1) mitigation and (2) adaptation
finance
(1) Renewable energy(2) Electricity generation(3) Wind power, solar power
(concentrated solar power, photovoltaic power)
Both mitigation and adaptation finance
Calculation of climate finance, including the basis (for example, eligible components)
The purpose of the fund is fully aligned with mitigation objectives as being focused solely on renewable energy investments. While, overall, the fund is bound contractually to invest not less than 60 per cent in greenfield assets, the fund manager’s investment strategy anticipates that more than 90 per cent of total capital will be invested in new renewable energy assets. The current fund pipeline in the MDB’s country of operations is 86 per cent comprised of greenfield projects.The fund manager will further contractually commit to investing at least 1.5 times the Bank’s financing into greenfield renewables projects in the countries where the MDB invests (with the expectation of reaching two to five times the financing), thereby ensuring that the MDB’s financing is 100 per cent linked to mitigation-eligible investments in these countries. The total value of the project amounted to €400 million, with €40 million of the MDB’s commitment. The project also included climate-related private indirect mobilisation of €360 million.
The MDB provided US$ 84 million, which was committed across eight policy actions and was categorised as 100 per cent climate finance.The project consists of two pillars of operation. The first pillar aims to support policies that improve the climate resilience of rural landscapes by promoting and instituting the best sustainable forest- and water-management plans and reducing GHG emissions from agricultural practices. The second pillar focuses primarily on climate change mitigation, such as setting up more stringent vehicle emission standards and adopting a new mechanism to promote windpower development as well as climate and green budgeting. All prior actions under the pillars were counted as both adaptation and mitigation finance, except for those focusing on vehicle emission reductions, improving national energy-systems efficiency, and scaling up renewable energy generation, which were counted fully as climate mitigation finance. In total, adaptation finance was calculated as US$ 37 million and mitigation finance as US$ 47 million.
Type of financial instrument
Equity Policy-based financing
Type of finance (own account, co-finance)
MDB own account MDB own account
(Continued overleaf)
2020 JOINT REPORT ON MULTILATERAL DEVELOPMENT BANKS’ CLIMATE FINANCE
50
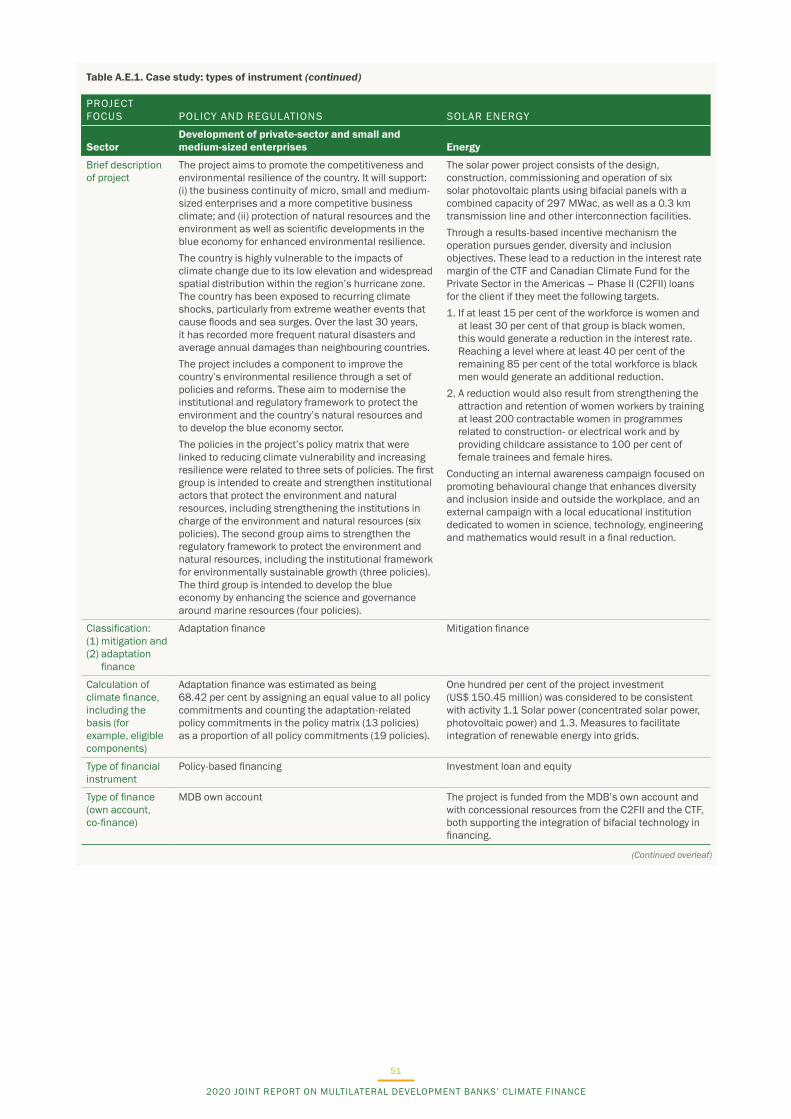
Table A.E.1. Case study: types of instrument (continued)
PROJECT FOCUS POLICY AND REGULATIONS SOLAR ENERGY
SectorDevelopment of private-sector and small and medium-sized enterprises Energy
Brief description of project
The project aims to promote the competitiveness and environmental resilience of the country. It will support: (i) the business continuity of micro, small and medium-sized enterprises and a more competitive business climate; and (ii) protection of natural resources and the environment as well as scientific developments in the blue economy for enhanced environmental resilience.The country is highly vulnerable to the impacts of climate change due to its low elevation and widespread spatial distribution within the region’s hurricane zone. The country has been exposed to recurring climate shocks, particularly from extreme weather events that cause floods and sea surges. Over the last 30 years, it has recorded more frequent natural disasters and average annual damages than neighbouring countries.The project includes a component to improve the country’s environmental resilience through a set of policies and reforms. These aim to modernise the institutional and regulatory framework to protect the environment and the country’s natural resources and to develop the blue economy sector.The policies in the project’s policy matrix that were linked to reducing climate vulnerability and increasing resilience were related to three sets of policies. The first group is intended to create and strengthen institutional actors that protect the environment and natural resources, including strengthening the institutions in charge of the environment and natural resources (six policies). The second group aims to strengthen the regulatory framework to protect the environment and natural resources, including the institutional framework for environmentally sustainable growth (three policies). The third group is intended to develop the blue economy by enhancing the science and governance around marine resources (four policies).
The solar power project consists of the design, construction, commissioning and operation of six solar photovoltaic plants using bifacial panels with a combined capacity of 297 MWac, as well as a 0.3 km transmission line and other interconnection facilities.Through a results-based incentive mechanism the operation pursues gender, diversity and inclusion objectives. These lead to a reduction in the interest rate margin of the CTF and Canadian Climate Fund for the Private Sector in the Americas – Phase II (C2FII) loans for the client if they meet the following targets.1. If at least 15 per cent of the workforce is women and
at least 30 per cent of that group is black women, this would generate a reduction in the interest rate. Reaching a level where at least 40 per cent of the remaining 85 per cent of the total workforce is black men would generate an additional reduction.
2. A reduction would also result from strengthening the attraction and retention of women workers by training at least 200 contractable women in programmes related to construction- or electrical work and by providing childcare assistance to 100 per cent of female trainees and female hires.
Conducting an internal awareness campaign focused on promoting behavioural change that enhances diversity and inclusion inside and outside the workplace, and an external campaign with a local educational institution dedicated to women in science, technology, engineering and mathematics would result in a final reduction.
Classification:(1) mitigation and (2) adaptation
finance
Adaptation finance Mitigation finance
Calculation of climate finance, including the basis (for example, eligible components)
Adaptation finance was estimated as being 68.42 per cent by assigning an equal value to all policy commitments and counting the adaptation-related policy commitments in the policy matrix (13 policies) as a proportion of all policy commitments (19 policies).
One hundred per cent of the project investment (US$ 150.45 million) was considered to be consistent with activity 1.1 Solar power (concentrated solar power, photovoltaic power) and 1.3. Measures to facilitate integration of renewable energy into grids.
Type of financial instrument
Policy-based financing Investment loan and equity
Type of finance (own account, co-finance)
MDB own account The project is funded from the MDB’s own account and with concessional resources from the C2FII and the CTF, both supporting the integration of bifacial technology in financing.
(Continued overleaf)
2020 JOINT REPORT ON MULTILATERAL DEVELOPMENT BANKS’ CLIMATE FINANCE
51
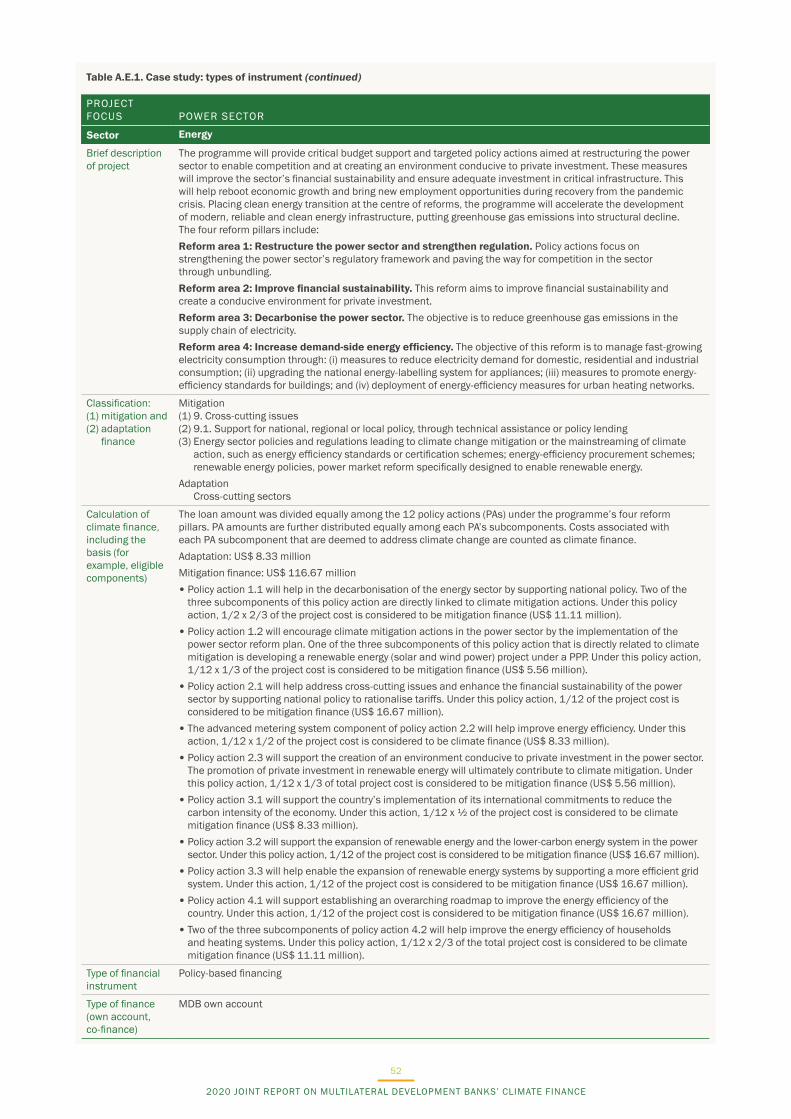
Table A.E.1. Case study: types of instrument (continued)
PROJECT FOCUS POWER SECTOR
Sector Energy
Brief description of project
The programme will provide critical budget support and targeted policy actions aimed at restructuring the power sector to enable competition and at creating an environment conducive to private investment. These measures will improve the sector’s financial sustainability and ensure adequate investment in critical infrastructure. This will help reboot economic growth and bring new employment opportunities during recovery from the pandemic crisis. Placing clean energy transition at the centre of reforms, the programme will accelerate the development of modern, reliable and clean energy infrastructure, putting greenhouse gas emissions into structural decline. The four reform pillars include: Reform area 1: Restructure the power sector and strengthen regulation. Policy actions focus on strengthening the power sector’s regulatory framework and paving the way for competition in the sector through unbundling. Reform area 2: Improve financial sustainability. This reform aims to improve financial sustainability and create a conducive environment for private investment. Reform area 3: Decarbonise the power sector. The objective is to reduce greenhouse gas emissions in the supply chain of electricity. Reform area 4: Increase demand-side energy efficiency. The objective of this reform is to manage fast-growing electricity consumption through: (i) measures to reduce electricity demand for domestic, residential and industrial consumption; (ii) upgrading the national energy-labelling system for appliances; (iii) measures to promote energy-efficiency standards for buildings; and (iv) deployment of energy-efficiency measures for urban heating networks.
Classification:(1) mitigation and (2) adaptation
finance
Mitigation (1) 9. Cross-cutting issues (2) 9.1. Support for national, regional or local policy, through technical assistance or policy lending (3) Energy sector policies and regulations leading to climate change mitigation or the mainstreaming of climate
action, such as energy efficiency standards or certification schemes; energy-efficiency procurement schemes; renewable energy policies, power market reform specifically designed to enable renewable energy.
Adaptation Cross-cutting sectors
Calculation of climate finance, including the basis (for example, eligible components)
The loan amount was divided equally among the 12 policy actions (PAs) under the programme’s four reform pillars. PA amounts are further distributed equally among each PA’s subcomponents. Costs associated with each PA subcomponent that are deemed to address climate change are counted as climate finance.Adaptation: US$ 8.33 millionMitigation finance: US$ 116.67 million• Policy action 1.1 will help in the decarbonisation of the energy sector by supporting national policy. Two of the
three subcomponents of this policy action are directly linked to climate mitigation actions. Under this policy action, 1/2 x 2/3 of the project cost is considered to be mitigation finance (US$ 11.11 million).
• Policy action 1.2 will encourage climate mitigation actions in the power sector by the implementation of the power sector reform plan. One of the three subcomponents of this policy action that is directly related to climate mitigation is developing a renewable energy (solar and wind power) project under a PPP. Under this policy action, 1/12 x 1/3 of the project cost is considered to be mitigation finance (US$ 5.56 million).
• Policy action 2.1 will help address cross-cutting issues and enhance the financial sustainability of the power sector by supporting national policy to rationalise tariffs. Under this policy action, 1/12 of the project cost is considered to be mitigation finance (US$ 16.67 million).
• The advanced metering system component of policy action 2.2 will help improve energy efficiency. Under this action, 1/12 x 1/2 of the project cost is considered to be climate finance (US$ 8.33 million).
• Policy action 2.3 will support the creation of an environment conducive to private investment in the power sector. The promotion of private investment in renewable energy will ultimately contribute to climate mitigation. Under this policy action, 1/12 x 1/3 of total project cost is considered to be mitigation finance (US$ 5.56 million).
• Policy action 3.1 will support the country’s implementation of its international commitments to reduce the carbon intensity of the economy. Under this action, 1/12 x ½ of the project cost is considered to be climate mitigation finance (US$ 8.33 million).
• Policy action 3.2 will support the expansion of renewable energy and the lower-carbon energy system in the power sector. Under this policy action, 1/12 of the project cost is considered to be mitigation finance (US$ 16.67 million).
• Policy action 3.3 will help enable the expansion of renewable energy systems by supporting a more efficient grid system. Under this action, 1/12 of the project cost is considered to be mitigation finance (US$ 16.67 million).
• Policy action 4.1 will support establishing an overarching roadmap to improve the energy efficiency of the country. Under this action, 1/12 of the project cost is considered to be mitigation finance (US$ 16.67 million).
• Two of the three subcomponents of policy action 4.2 will help improve the energy efficiency of households and heating systems. Under this policy action, 1/12 x 2/3 of the total project cost is considered to be climate mitigation finance (US$ 11.11 million).
Type of financial instrument
Policy-based financing
Type of finance (own account, co-finance)
MDB own account
2020 JOINT REPORT ON MULTILATERAL DEVELOPMENT BANKS’ CLIMATE FINANCE
52
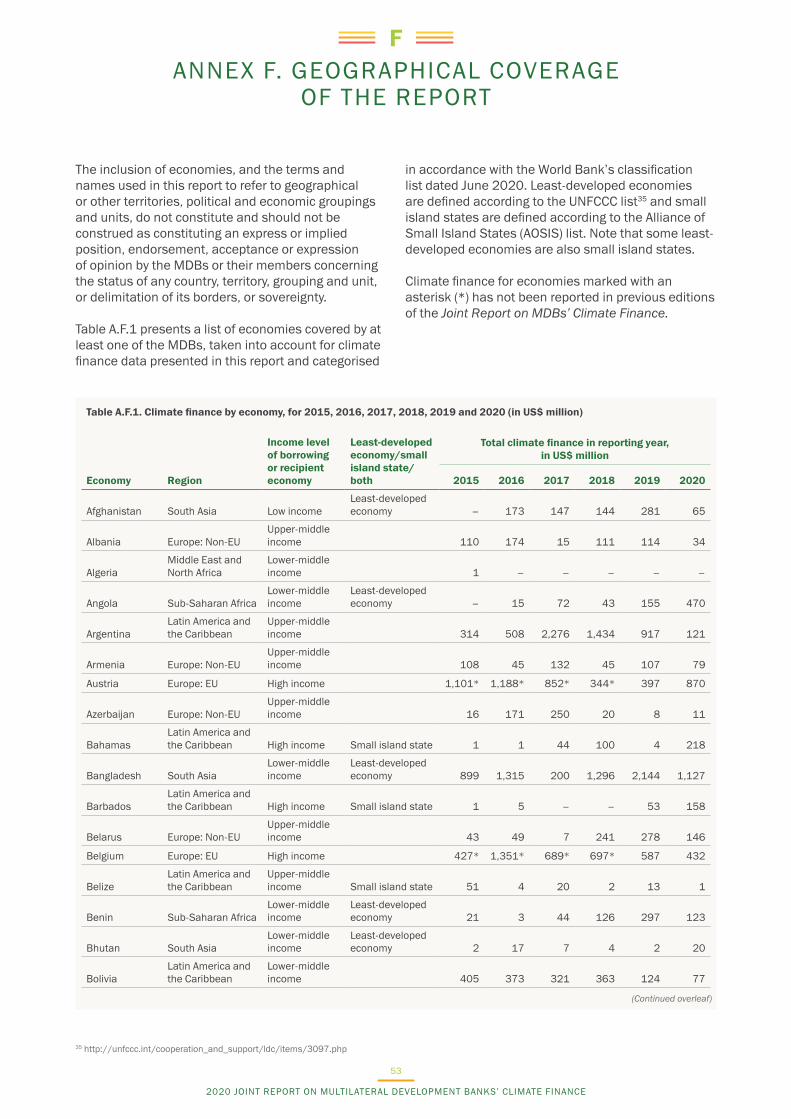
ANNEX F. GEOGRAPHICAL COVERAGE OF THE REPORT
F
The inclusion of economies, and the terms and names used in this report to refer to geographical or other territories, political and economic groupings and units, do not constitute and should not be construed as constituting an express or implied position, endorsement, acceptance or expression of opinion by the MDBs or their members concerning the status of any country, territory, grouping and unit, or delimitation of its borders, or sovereignty.
Table A.F.1 presents a list of economies covered by at least one of the MDBs, taken into account for climate finance data presented in this report and categorised
in accordance with the World Bank’s classification list dated June 2020. Least-developed economies are defined according to the UNFCCC list35 and small island states are defined according to the Alliance of Small Island States (AOSIS) list. Note that some least-developed economies are also small island states.
Climate finance for economies marked with an asterisk (*) has not been reported in previous editions of the Joint Report on MDBs’ Climate Finance.
Table A.F.1. Climate finance by economy, for 2015, 2016, 2017, 2018, 2019 and 2020 (in US$ million)
Economy Region
Income level of borrowing or recipient economy
Least-developed economy/small island state/both
Total climate finance in reporting year, in US$ million
2015 2016 2017 2018 2019 2020
Afghanistan South Asia Low incomeLeast-developed economy – 173 147 144 281 65
Albania Europe: Non-EUUpper-middle income 110 174 15 111 114 34
AlgeriaMiddle East and North Africa
Lower-middle income 1 – – – – –
Angola Sub-Saharan AfricaLower-middle income
Least-developed economy – 15 72 43 155 470
ArgentinaLatin America and the Caribbean
Upper-middle income 314 508 2,276 1,434 917 121
Armenia Europe: Non-EUUpper-middle income 108 45 132 45 107 79
Austria Europe: EU High income 1,101* 1,188* 852* 344* 397 870
Azerbaijan Europe: Non-EUUpper-middle income 16 171 250 20 8 11
BahamasLatin America and the Caribbean High income Small island state 1 1 44 100 4 218
Bangladesh South AsiaLower-middle income
Least-developed economy 899 1,315 200 1,296 2,144 1,127
BarbadosLatin America and the Caribbean High income Small island state 1 5 – – 53 158
Belarus Europe: Non-EUUpper-middle income 43 49 7 241 278 146
Belgium Europe: EU High income 427* 1,351* 689* 697* 587 432
BelizeLatin America and the Caribbean
Upper-middle income Small island state 51 4 20 2 13 1
Benin Sub-Saharan AfricaLower-middle income
Least-developed economy 21 3 44 126 297 123
Bhutan South AsiaLower-middle income
Least-developed economy 2 17 7 4 2 20
BoliviaLatin America and the Caribbean
Lower-middle income 405 373 321 363 124 77
35 http://unfccc.int/cooperation_and_support/ldc/items/3097.php
(Continued overleaf)
2020 JOINT REPORT ON MULTILATERAL DEVELOPMENT BANKS’ CLIMATE FINANCE
53

Bosnia and Herzegovina Europe: Non-EU
Upper-middle income 27 95 101 110 180 78
Botswana Sub-Saharan AfricaUpper-middle income – – 143 – 19 –
BrazilLatin America and the Caribbean
Upper-middle income 548 914 766 1,473 1,700 1,436
Bulgaria Europe: EUUpper-middle income 58 156 112 137 5 41
Burkina Faso Sub-Saharan Africa Low incomeLeast-developed economy 9 7 166 130 194 134
Burundi Sub-Saharan Africa Low incomeLeast-developed economy 25 22 28 27 3 108
CambodiaEast Asia and the Pacific
Lower-middle income
Least-developed economy 46 85 86 117 139 121
Cameroon Sub-Saharan AfricaLower-middle income 2 17 329 186 761 57
Cape Verde Sub-Saharan AfricaLower-middle income Small island state 1 – 15 – 11 5
Central African Republic Sub-Saharan Africa Low income
Least-developed economy 7 – 10 23 99 8
Chad Sub-Saharan Africa Low incomeLeast-developed economy 6 – – 41 58 101
ChileLatin America and the Caribbean High income 119 153 208 7 22 459
ChinaEast Asia and the Pacific
Upper-middle income 1,091 2,349 2,305 2,019 2,424 2,363
ColombiaLatin America and the Caribbean
Upper-middle income 182 904 747 719 980 657
Comoros Sub-Saharan AfricaLower-middle income Both 5 – 4 – 23 93
Congo Sub-Saharan AfricaLower-middle income – 25 2 58 58 1
Cook IslandsEast Asia and the Pacific High income Small island state – 4 12 – 5 5
Costa RicaLatin America and the Caribbean
Upper-middle income 200 – 5 4 162 379
Côte d̓Ivoire Sub-Saharan AfricaLower-middle income 5 73 296 346 535 453
Croatia Europe: EU High income 174 16 68 311 36 134
Cyprus Europe: EU High income 22 27 46 34 45 91
Czech Republic Europe: EU High income 91 11* 144* 59* 620 498
Democratic Republic of the Congo Sub-Saharan Africa Low income
Least-developed economy 10 153 128 6 98 305
Denmark Europe: EU High income 115* 2* 151* 175* 335 275
Djibouti Sub-Saharan AfricaLower-middle income
Least-developed economy – 2 – 41 21 103
DominicaLatin America and the Caribbean
Upper-middle income Small island state – – – 39 70 19
Dominican Republic
Latin America and the Caribbean
Upper-middle income Small island state 1 137 3 509 258 1
EcuadorLatin America and the Caribbean
Upper-middle income 582 325 27 792 616 446
EgyptMiddle East and North Africa
Lower-middle income 511 693 1,585 1,597 1,611 1,508
Table A.F.1. Climate finance by economy, for 2015, 2016, 2017, 2018, 2019 and 2020 (in US$ million) (continued)
Economy Region
Income level of borrowing or recipient economy
Least-developed economy/small island state/both
Total climate finance in reporting year, in US$ million
2015 2016 2017 2018 2019 2020
(Continued overleaf)
2020 JOINT REPORT ON MULTILATERAL DEVELOPMENT BANKS’ CLIMATE FINANCE
54
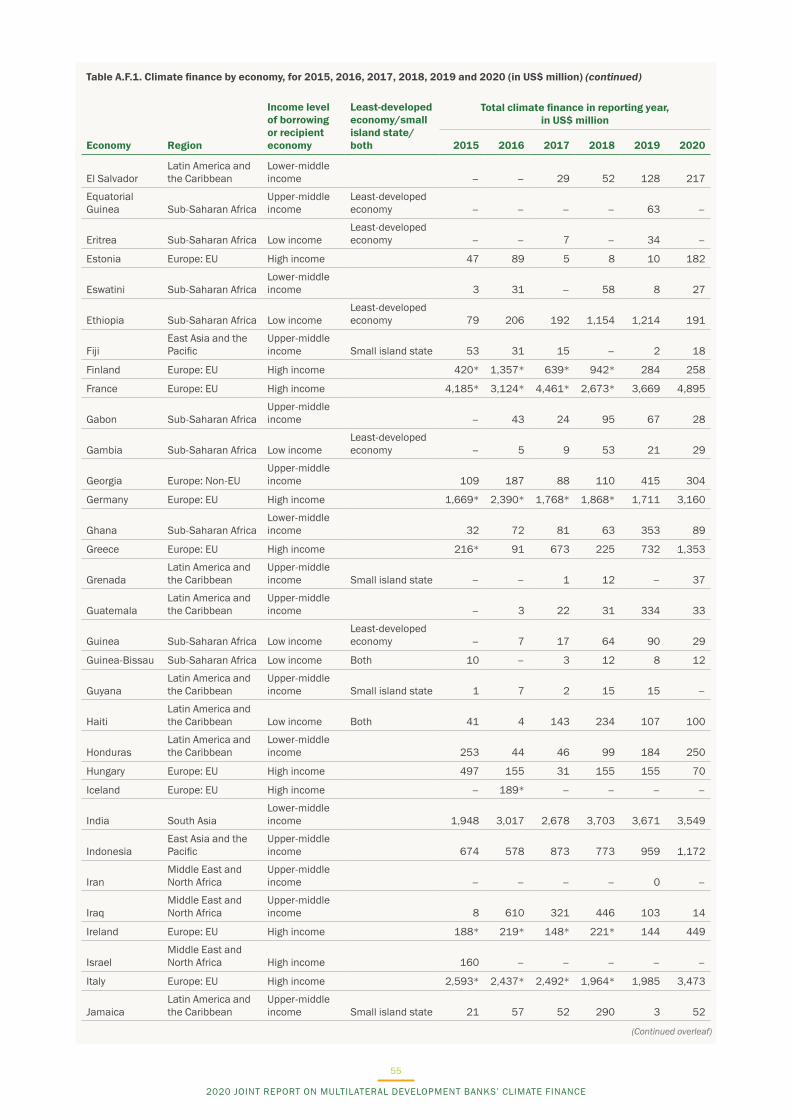
El SalvadorLatin America and the Caribbean
Lower-middle income – – 29 52 128 217
Equatorial Guinea Sub-Saharan Africa
Upper-middle income
Least-developed economy – – – – 63 –
Eritrea Sub-Saharan Africa Low incomeLeast-developed economy – – 7 – 34 –
Estonia Europe: EU High income 47 89 5 8 10 182
Eswatini Sub-Saharan AfricaLower-middle income 3 31 – 58 8 27
Ethiopia Sub-Saharan Africa Low incomeLeast-developed economy 79 206 192 1,154 1,214 191
FijiEast Asia and the Pacific
Upper-middle income Small island state 53 31 15 – 2 18
Finland Europe: EU High income 420* 1,357* 639* 942* 284 258
France Europe: EU High income 4,185* 3,124* 4,461* 2,673* 3,669 4,895
Gabon Sub-Saharan AfricaUpper-middle income – 43 24 95 67 28
Gambia Sub-Saharan Africa Low incomeLeast-developed economy – 5 9 53 21 29
Georgia Europe: Non-EUUpper-middle income 109 187 88 110 415 304
Germany Europe: EU High income 1,669* 2,390* 1,768* 1,868* 1,711 3,160
Ghana Sub-Saharan AfricaLower-middle income 32 72 81 63 353 89
Greece Europe: EU High income 216* 91 673 225 732 1,353
GrenadaLatin America and the Caribbean
Upper-middle income Small island state – – 1 12 – 37
GuatemalaLatin America and the Caribbean
Upper-middle income – 3 22 31 334 33
Guinea Sub-Saharan Africa Low incomeLeast-developed economy – 7 17 64 90 29
Guinea-Bissau Sub-Saharan Africa Low income Both 10 – 3 12 8 12
GuyanaLatin America and the Caribbean
Upper-middle income Small island state 1 7 2 15 15 –
HaitiLatin America and the Caribbean Low income Both 41 4 143 234 107 100
HondurasLatin America and the Caribbean
Lower-middle income 253 44 46 99 184 250
Hungary Europe: EU High income 497 155 31 155 155 70
Iceland Europe: EU High income – 189* – – – –
India South AsiaLower-middle income 1,948 3,017 2,678 3,703 3,671 3,549
IndonesiaEast Asia and the Pacific
Upper-middle income 674 578 873 773 959 1,172
IranMiddle East and North Africa
Upper-middle income – – – – 0 –
IraqMiddle East and North Africa
Upper-middle income 8 610 321 446 103 14
Ireland Europe: EU High income 188* 219* 148* 221* 144 449
IsraelMiddle East and North Africa High income 160 – – – – –
Italy Europe: EU High income 2,593* 2,437* 2,492* 1,964* 1,985 3,473
JamaicaLatin America and the Caribbean
Upper-middle income Small island state 21 57 52 290 3 52
Table A.F.1. Climate finance by economy, for 2015, 2016, 2017, 2018, 2019 and 2020 (in US$ million) (continued)
Economy Region
Income level of borrowing or recipient economy
Least-developed economy/small island state/both
Total climate finance in reporting year, in US$ million
2015 2016 2017 2018 2019 2020
(Continued overleaf)
2020 JOINT REPORT ON MULTILATERAL DEVELOPMENT BANKS’ CLIMATE FINANCE
55

JordanMiddle East and North Africa
Upper-middle income 238 412 517 272 457 262
Kazakhstan Central AsiaUpper-middle income 438 521 389 260 364 96
Kenya Sub-Saharan AfricaLower-middle income 260 159 581 1,161 378 451
KiribatiEast Asia and the Pacific
Lower-middle income Both – 11 – 2 32 49
Kosovo Europe: Non-EUUpper-middle income 74 56 31 48 96 57
Kyrgyz Republic Central Asia
Lower-middle income 73 179 55 118 189 101
Laos East Asia and the Pacific
Lower-middle income
Least-developed economy 106 13 40 109 72 59
Latvia Europe: EU High income 247 2 86 – 102 2
LebanonMiddle East and North Africa
Upper-middle income 303 27 82 581 241 2
Lesotho Sub-Saharan AfricaLower-middle income
Least-developed economy – 11 5 15 108 9
Liberia Sub-Saharan Africa Low incomeLeast-developed economy 3 68 26 4 70 41
Lithuania Europe: EU High income 183 215 95 157 30 559
Luxembourg Europe: EU High income 60* 3* – – 223 0
Madagascar Sub-Saharan Africa Low incomeLeast-developed economy – 37 131 89 280 195
Malawi Sub-Saharan Africa Low incomeLeast-developed economy 58 1 210 218 210 301
MalaysiaEast Asia and the Pacific
Upper-middle income – – – – 0 –
Maldives South AsiaUpper-middle income Small island state 5 35 19 2 2 148
Mali Sub-Saharan Africa Low incomeLeast-developed economy – 9 104 94 144 102
MaltaMiddle East and North Africa High income – – – – 1 0
Marshall Islands
East Asia and the Pacific
Upper-middle income Small island state 2 1 21 32 12 17
Mauritania Sub-Saharan AfricaLower-middle income
Least-developed economy – 6 – 11 39 56
Mauritius Sub-Saharan Africa High income Small island state 9 – – 1 – 81
MexicoLatin America and the Caribbean
Upper-middle income 330 277 1,211 1,193 1,006 575
MicronesiaEast Asia and the Pacific
Lower-middle income Small island state – – – – 46 23
Moldova Europe: Non-EULower-middle income 45 106 110 7 68 186
MongoliaEast Asia and the Pacific
Lower-middle income 13 44 150 356 162 255
Montenegro Europe: Non-EUUpper-middle income 62 1 68 25 7 13
MoroccoMiddle East and North Africa
Lower-middle income 914 729 668 1,057 927 842
Mozambique Sub-Saharan Africa Low incomeLeast-developed economy 111 51 55 224 408 312
MyanmarEast Asia and the Pacific
Lower-middle income
Least-developed economy 81 107 212 178 90 574
Table A.F.1. Climate finance by economy, for 2015, 2016, 2017, 2018, 2019 and 2020 (in US$ million) (continued)
Economy Region
Income level of borrowing or recipient economy
Least-developed economy/small island state/both
Total climate finance in reporting year, in US$ million
2015 2016 2017 2018 2019 2020
(Continued overleaf)
2020 JOINT REPORT ON MULTILATERAL DEVELOPMENT BANKS’ CLIMATE FINANCE
56
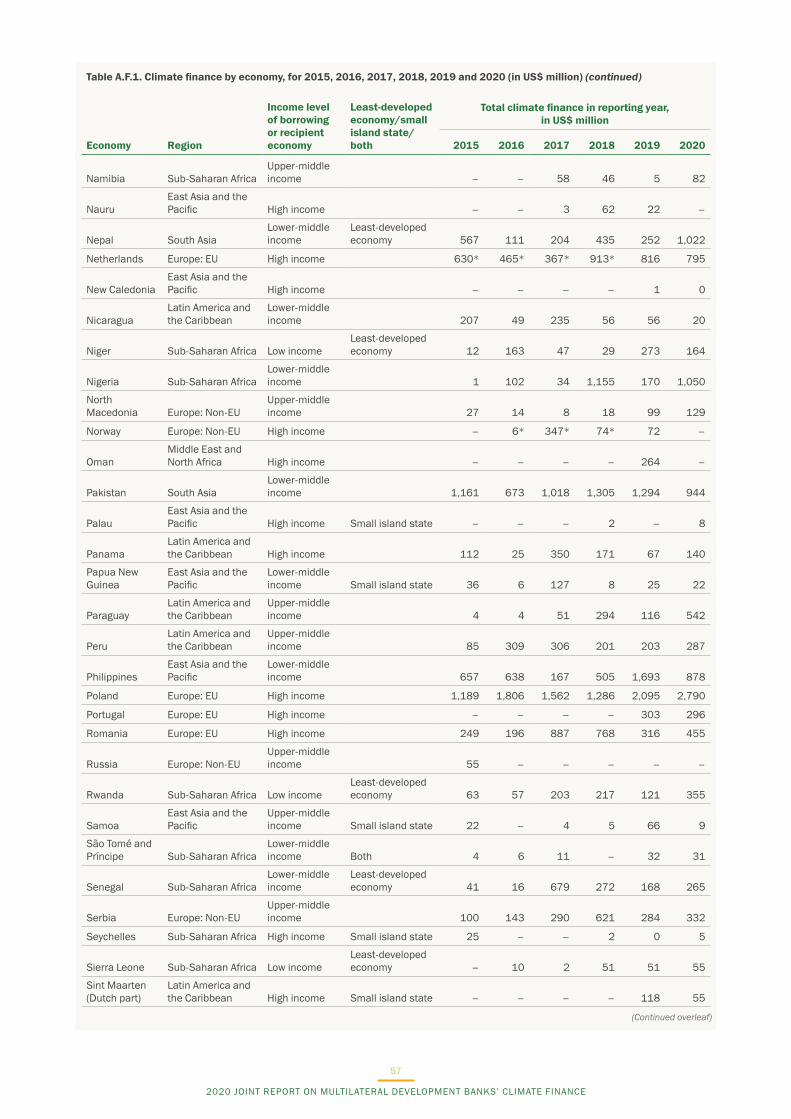
Namibia Sub-Saharan AfricaUpper-middle income – – 58 46 5 82
NauruEast Asia and the Pacific High income – – 3 62 22 –
Nepal South AsiaLower-middle income
Least-developed economy 567 111 204 435 252 1,022
Netherlands Europe: EU High income 630* 465* 367* 913* 816 795
New CaledoniaEast Asia and the Pacific High income – – – – 1 0
NicaraguaLatin America and the Caribbean
Lower-middle income 207 49 235 56 56 20
Niger Sub-Saharan Africa Low incomeLeast-developed economy 12 163 47 29 273 164
Nigeria Sub-Saharan AfricaLower-middle income 1 102 34 1,155 170 1,050
North Macedonia Europe: Non-EU
Upper-middle income 27 14 8 18 99 129
Norway Europe: Non-EU High income – 6* 347* 74* 72 –
OmanMiddle East and North Africa High income – – – – 264 –
Pakistan South AsiaLower-middle income 1,161 673 1,018 1,305 1,294 944
PalauEast Asia and the Pacific High income Small island state – – – 2 – 8
PanamaLatin America and the Caribbean High income 112 25 350 171 67 140
Papua New Guinea
East Asia and the Pacific
Lower-middle income Small island state 36 6 127 8 25 22
ParaguayLatin America and the Caribbean
Upper-middle income 4 4 51 294 116 542
PeruLatin America and the Caribbean
Upper-middle income 85 309 306 201 203 287
PhilippinesEast Asia and the Pacific
Lower-middle income 657 638 167 505 1,693 878
Poland Europe: EU High income 1,189 1,806 1,562 1,286 2,095 2,790
Portugal Europe: EU High income – – – – 303 296
Romania Europe: EU High income 249 196 887 768 316 455
Russia Europe: Non-EUUpper-middle income 55 – – – – –
Rwanda Sub-Saharan Africa Low incomeLeast-developed economy 63 57 203 217 121 355
SamoaEast Asia and the Pacific
Upper-middle income Small island state 22 – 4 5 66 9
São Tomé and Príncipe Sub-Saharan Africa
Lower-middle income Both 4 6 11 – 32 31
Senegal Sub-Saharan AfricaLower-middle income
Least-developed economy 41 16 679 272 168 265
Serbia Europe: Non-EUUpper-middle income 100 143 290 621 284 332
Seychelles Sub-Saharan Africa High income Small island state 25 – – 2 0 5
Sierra Leone Sub-Saharan Africa Low incomeLeast-developed economy – 10 2 51 51 55
Sint Maarten (Dutch part)
Latin America and the Caribbean High income Small island state – – – – 118 55
Table A.F.1. Climate finance by economy, for 2015, 2016, 2017, 2018, 2019 and 2020 (in US$ million) (continued)
Economy Region
Income level of borrowing or recipient economy
Least-developed economy/small island state/both
Total climate finance in reporting year, in US$ million
2015 2016 2017 2018 2019 2020
(Continued overleaf)
2020 JOINT REPORT ON MULTILATERAL DEVELOPMENT BANKS’ CLIMATE FINANCE
57

Slovak Republic Europe: EU High income 302 87 53 281 143 36
Slovenia Europe: EU High income 154 18 47 1 93 6
Solomon Islands
East Asia and the Pacific
Lower-middle income Both – 10 36 10 101 17
Somalia Sub-Saharan Africa Low incomeLeast-developed economy – 8 – 1 27 228
South Africa Sub-Saharan AfricaUpper-middle income 55 59 103 544 178 557
South Sudan Sub-Saharan Africa Low incomeLeast-developed economy – 1 39 – 28 15
Spain Europe: EU High income 1,973* 560* 1,876* 1,526* 2,561 3,259
Sri Lanka South AsiaLower-middle income 84 212 574 72 604 192
St. LuciaLatin America and the Caribbean
Upper-middle income Small island state – – 2 35 1 15
St. Vincent and the Grenadines
Latin America and the Caribbean
Upper-middle income Small island state – – 9 – 11 10
Sudan Sub-Saharan Africa Low incomeLeast-developed economy 5 – 13 41 58 13
SurinameLatin America and the Caribbean
Upper-middle income Small island state 1 8 26 32 95 19
Sweden Europe: EU High income 557* 417* 1,431* 1,038* 1,383 1,681
Switzerland Europe: Non-EU High income – 6 – – 2 –
SyriaMiddle East and North Africa Low income – – – – 1 –
Tajikistan Central Asia Low income 149 34 232 192 116 214
Tanzania Sub-Saharan AfricaLower-middle income
Least-developed economy 243 138 549 198 44 376
ThailandEast Asia and the Pacific
Upper-middle income 176 91 130 533 97 76
Timor-LesteEast Asia and the Pacific
Lower-middle income Both – 5 9 2 – 46
Togo Sub-Saharan Africa Low incomeLeast-developed economy – – 6 42 32 43
TongaEast Asia and the Pacific
Upper-middle income Small island state 15 8 1 14 83 28
Trinidad and Tobago
Latin America and the Caribbean High income Small island state 1 1 – – – 21
Tunisia Middle East and North Africa
Lower-middle income 19 96 387 265 427 90
Turkey Europe: Non-EUUpper-middle income 2,582 2,135 1,790 1,450 1,449 1,383
Turkmenistan Central AsiaUpper-middle income 1 1 6 5 – 4
TuvaluEast Asia and the Pacific
Upper-middle income Both 7 3 1 10 26 13
Uganda Sub-Saharan Africa Low incomeLeast-developed economy 124 15 166 621 283 394
Ukraine Europe: Non-EULower-middle income 940 865 833 519 1,115 1,192
United Arab Emirates
Middle East and North Africa High income – – – – 2 2
United Kingdom Europe: EU High income 4,010* 3,272* 376* 255 179 –
Table A.F.1. Climate finance by economy, for 2015, 2016, 2017, 2018, 2019 and 2020 (in US$ million) (continued)
Economy Region
Income level of borrowing or recipient economy
Least-developed economy/small island state/both
Total climate finance in reporting year, in US$ million
2015 2016 2017 2018 2019 2020
(Continued overleaf)
2020 JOINT REPORT ON MULTILATERAL DEVELOPMENT BANKS’ CLIMATE FINANCE
58
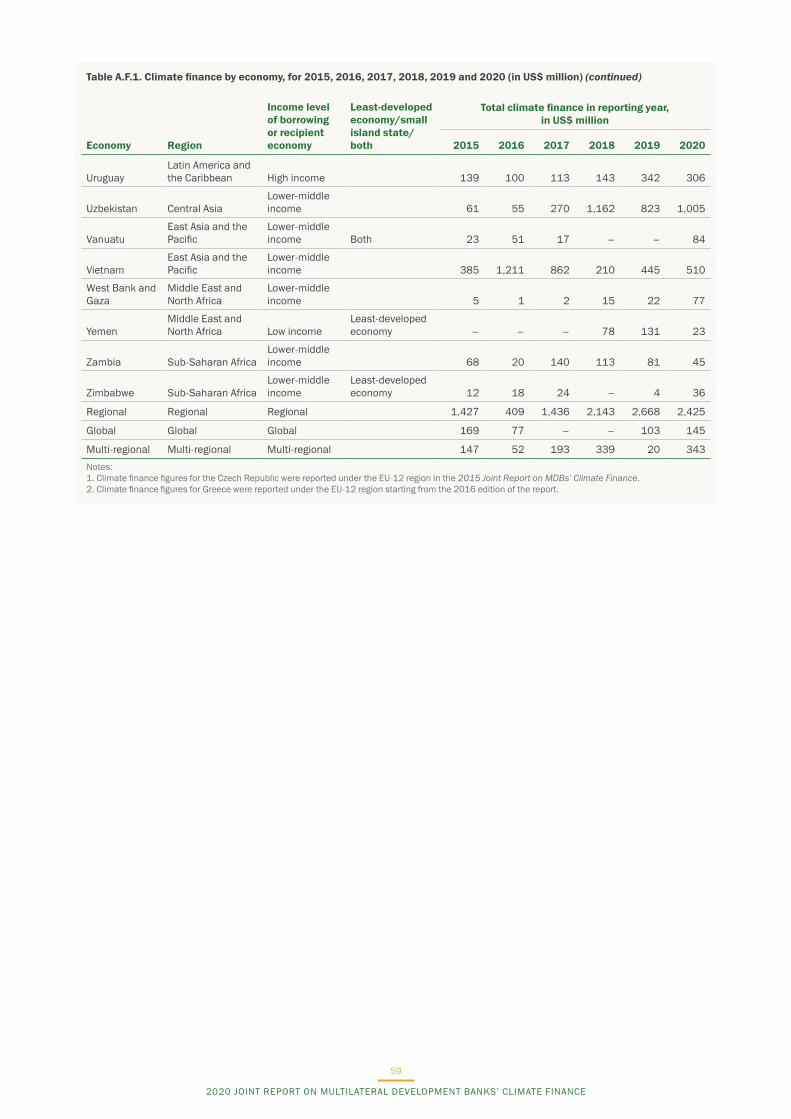
UruguayLatin America and the Caribbean High income 139 100 113 143 342 306
Uzbekistan Central AsiaLower-middle income 61 55 270 1,162 823 1,005
VanuatuEast Asia and the Pacific
Lower-middle income Both 23 51 17 – – 84
VietnamEast Asia and the Pacific
Lower-middle income 385 1,211 862 210 445 510
West Bank and Gaza
Middle East and North Africa
Lower-middle income 5 1 2 15 22 77
YemenMiddle East and North Africa Low income
Least-developed economy – – – 78 131 23
Zambia Sub-Saharan AfricaLower-middle income 68 20 140 113 81 45
Zimbabwe Sub-Saharan AfricaLower-middle income
Least-developed economy 12 18 24 – 4 36
Regional Regional Regional 1,427 409 1,436 2,143 2,668 2,425
Global Global Global 169 77 – – 103 145
Multi-regional Multi-regional Multi-regional 147 52 193 339 20 343
Notes:1. Climate finance figures for the Czech Republic were reported under the EU-12 region in the 2015 Joint Report on MDBs’ Climate Finance.2. Climate finance figures for Greece were reported under the EU-12 region starting from the 2016 edition of the report.
Table A.F.1. Climate finance by economy, for 2015, 2016, 2017, 2018, 2019 and 2020 (in US$ million) (continued)
Economy Region
Income level of borrowing or recipient economy
Least-developed economy/small island state/both
Total climate finance in reporting year, in US$ million
2015 2016 2017 2018 2019 2020
2020 JOINT REPORT ON MULTILATERAL DEVELOPMENT BANKS’ CLIMATE FINANCE
59
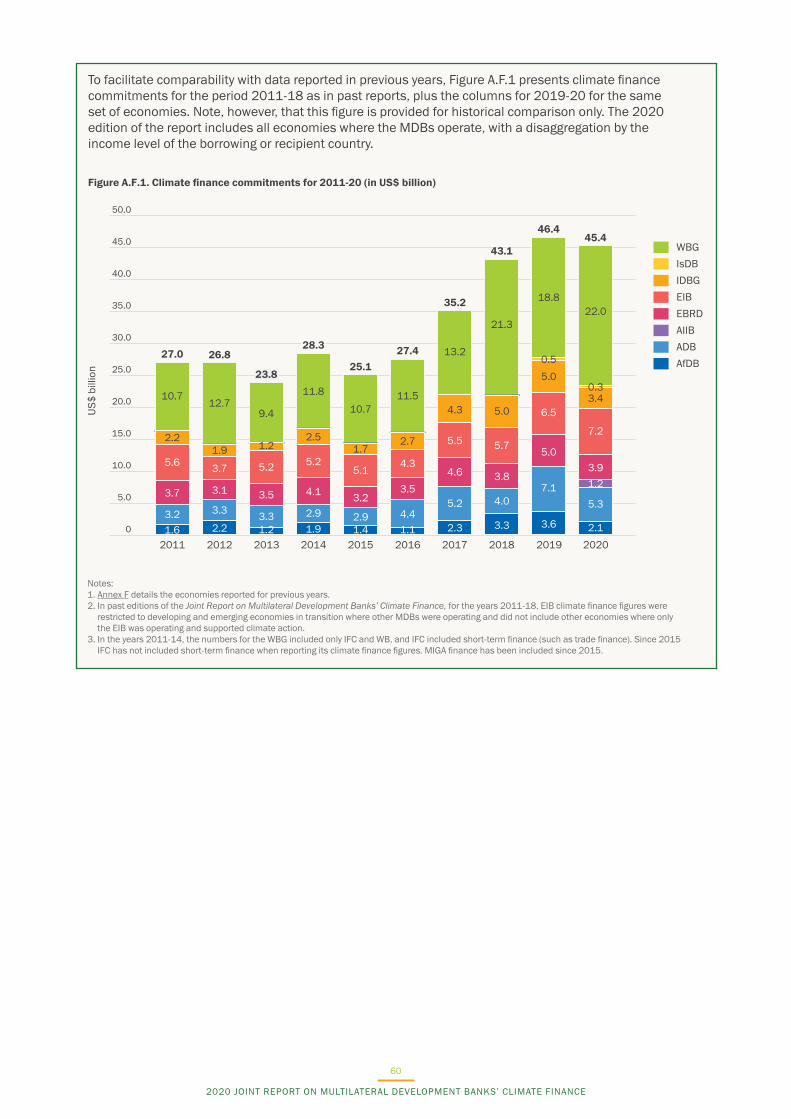
To facilitate comparability with data reported in previous years, Figure A.F.1 presents climate finance commitments for the period 2011-18 as in past reports, plus the columns for 2019-20 for the same set of economies. Note, however, that this figure is provided for historical comparison only. The 2020 edition of the report includes all economies where the MDBs operate, with a disaggregation by the income level of the borrowing or recipient country.
Notes:1. Annex F details the economies reported for previous years. 2. In past editions of the Joint Report on Multilateral Development Banks’ Climate Finance, for the years 2011-18, EIB climate finance figures were
restricted to developing and emerging economies in transition where other MDBs were operating and did not include other economies where only the EIB was operating and supported climate action.
3. In the years 2011-14, the numbers for the WBG included only IFC and WB, and IFC included short-term finance (such as trade finance). Since 2015 IFC has not included short-term finance when reporting its climate finance figures. MIGA finance has been included since 2015.
Figure A.F.1. Climate finance commitments for 2011-20 (in US$ billion)
US$
bill
ion
2011 2012 2013 2014 2015 2017 2018 2019 20202016
35.0
30.0
25.0
45.0
40.0
50.0
20.0
15.0
5.0
10.0
0
WBGIsDBIDBGEIBEBRDAIIBADBAfDB
3.2 3.3 3.3 2.9 2.9 4.45.2 4.0
3.3
3.8
5.7
5.0
21.3
2.3
4.6
5.5
4.3
13.2
1.1
3.5
4.3
2.7
11.5
1.4
3.2
5.1
1.7
10.7
1.9
4.1
5.2
2.5
11.8
1.2
3.5
5.2
1.2
9.4
2.2
3.1
3.7
1.9
12.7
1.6
3.7
5.6
2.2
10.7
27.0 26.8
23.8
28.3
25.127.4
35.2
43.1
3.6
7.1
5.0
6.5
5.0
18.8
0.5
46.4
2.1
5.3
1.23.9
7.2
22.0
3.40.3
45.4
2020 JOINT REPORT ON MULTILATERAL DEVELOPMENT BANKS’ CLIMATE FINANCE
60

EUROPEAN BANK FOR RECONSTRUCTION AND DEVELOPMENTONE EXCHANGE SQUARELONDONEC2A 2JNUNITED KINGDOM
www.ebrd.com