climate classification - iowa state universityagron- · pdf fileclimate classification ... the...
TRANSCRIPT

Agronomy 541 : Lesson 8a
Climate Classification
Introduction
Developed by D. Todey
It is suggested that you watch Video 8A and complete the exercise in the video before continuing with thelesson.
Podcast Version Full Podcast List
With the globalization of agriculture, knowledge of how climates are defined, how climates work in other parts ofthe world, and where and when other crops are grown is of prime importance. One of the primary factorscontrolling all agricultural systems is the climate of the region. What the mean and extreme temperatures of aregion are and when and how much rain is expected must be known to create a management plan for an area.More about crop geography will be discussed in Agronomy 531 Crop Management. This lesson will describethe main climate types, how they are produced and by what means they are designated. These will then beapplied to understanding how they affect the agriculture of various areas around the world.
The general circulation discussed in Lesson 7b illustrates how the orientation of the earth with respect to thesun and the resulting placement and amount of solar radiation create the large-scale background flow of windsworldwide. The general flows establish the initial regimes of weather and climate for locations around the worldas patterns of rising and sinking motion create conditions conducive to large amounts of rainfall or deserts.Other factors, such as ocean currents and continental positions further modify the situation created by thegeneral circulation. The application of how these produce climate will be discussed in this lesson.
What You Will Learn in This Lesson:
How climates are differentiated.How the main climate types differ.

What the main climatic influences are across the globe.
Reading Assignments:
Aguado & Burt pg. 411-430

Agronomy 541 : Lesson 8a
Climate Classification
Climate Differentiation
Early geographers observed the weather surrounding them and attempted to explain the occurrences theywere seeing. When noting the natural vegetation of a region, it became apparent that certain trees andgrasses grew certain places and others would not. Plants are obvious integrators of the weather and climatearound them. Whatever is happening in the environment, the plants will experience. As more detailedinformation about the globe became available, the geographers tried to classify the observed environmentsinto categories to easily describe the weather and climate of an area. In this way they could compare theclimate of one place to another region far away. Differentiating one climate from another is often exceedinglydifficult.
There are a variety of different methods of dividing climate types. The most common methods usually includewhen and how much precipitation occurs and some sort of average temperature and temperature variation.The easiest visual method to review climate types is to view a climograph. A climograph depicts temperatureand precipitation throughout the year. These can be done using daily or monthly averages. Let's look at anexample.
Study Question 8.1
Two of these three stations are of the same climate type. Which of these three is a different climate? Click oneach image for a larger view.
Check Answer
As illustrated above, differentiating climates can be very difficult and seem inconsistent. Demarcations betweendifferent climates are not distinct. Instead of observing that one area is a certain climate, while a short distanceaway another climate type prevails, what is observed is a gradual change from one climate to another invarious phases. Drawing a line between climate types then becomes very subjective.

IN DETAIL : Climograph
Daily- or monthly-value climographs summarize the daily averages and extremes (Fig. 8.1) or monthly averages (Fig.8.2) for a climate station averaged over a given number a years. Usually 30 years is used as a climatological period.
Fig. 8.1 Daily climograph for Cedar Rapids, IA. Data include daily
average and extreme maximum and minimum temperatures (°F) and
average daily precipitation (inches).

Close Window
Fig. 8.2 Daily climograph for Pocatello, ID. Data include monthly
average temperatures (°C) and average monthly precipitation (mm).

Agronomy 541 : Lesson 8a
Climate Classification
Climate Classification
The main climate type in use is the Koeppen climate classification system, developed by German VladimirKoeppen. This system divides world climates into six main categories, using the letters from A-E and H, todifferentiate climate based upon different temperature ranges, precipitation amounts, and precipitation timing.Several variants and adaptations of this system exist in specifying or naming of the finer details, such as thesub-categories, of the climates. But the basic premise of the main climate types is the same for each. Thelettering follows generally latitudinal lines caused by radiational influences by latitude from the near-equatorialareas (A climates) to the Polar (E climates) (Table 8.1). The range of temperatures experienced and severity ofwinters changes gradually progressing toward the pole as indicated by the names.
Table 8.1 Koeppen climate types
A Tropical
B Desert
C Mild mid-latitude
D Severe mid-latitude
E Polar
H Highland
These basic climate types are derived from Fig. 8.4. The X-axis is the mean annual temperature, and the Y-axisis the mean precipitation. Go back and compare the figure from Study Question 8.1 to see why the climates aredifferent.

Fig. 8.3 Main climate region differentiation (Akin 1991)
Other schemes use modifications of this basic scheme, but the lettering conventions are very common.Subtypes of each category use finer differences in climates to further delineate the main types. In theTrewartha modification of the Koeppen system a second (lower case) letter is added to determine when the dryseason occurs if there is one. Table 8.2 indicates the conventions for the A, C, and D climates.
Table 8.2 Trewartha Sub-classifications
f no dry season
m monsoonal wet-dry cycle
w winter dry season
s summer dry season
The B climates follow a different scheme since they have minimal amounts of rainfall. Their second lettersubdivides into moderately dry (BS) and drier BW climates. The BS are steppe climates, which have marginalamounts of rainfall and do support some agricultural production, especially grain farming. The western GreatPlains of the United States are a steppe climate. These exist in transitional areas between other moisterclimates and the true deserts (BW). The BW climates are true desert with minimal amounts of rainfall, such theSahara Desert of Africa and the deserts of the southwestern United States.
A third letter is added to describe the summer or winter temperature extremes. For the C and D climates thesubcategories extend from a (warmest) to d (coldest). For the B climates the temperature subdivision refers tosub-tropical (h) to mid-latitude (k).
The climate types for the United States are displayed in more detail in Figure 8.5. Climates of the United States

range from the A's on the southern tip of Florida to the D's throughout the northeastern part of the country.
Fig. 8.5 Detailed climates of the United States. The range of most of the
climates are appear across the country. Click on the thumbnail to view
a larger figure.
To see the climographs of stations in different climates go back to Lesson 1
Study Question 8.2
What is the climate type of Indiana?
CfaBSkDfaCsb
Check Answer
Since the original use was to classify climate using observed features, references to plants are very common.Since plants integrate all the environmental details experienced, they can be used as indicators of climatedifferences. Koeppen explained much of his original system using differences in plant types and then fittemperature and precipitation differences to the areas. Therefore, much of the original classification betweenclimate types is associated with certain plants or lack of certain plants. The transition between the D and Eclimates is placed where no monthly temperature averages above 10°C (50°F). This corresponds to the treeline since the more severe E climates cannot support the growth of trees.
Temperature and precipitation are the most obvious and easily measured quantities for describing climate. Buta number of other meteorological quantities can describe the climate of an area. And how the climate isdescribed is very much based on what is needed by the user of the climate.

Close Window
IN DETAIL : Temperature Extremes
Knowing how extreme temperature and precipitation are and when these extremes occur is necessary for completelyunderstanding climate. Often averages of temperature and precipitation are discussed. But while areas may havesimilar annual averages, they may have disparate extremes depending on the climatic forcing. The timing of theprecipitation may be drastically different. In the savanna (Aw) climates, annual temperature extremes are not great,but rainfall is. Goiania, Brazil has an annual precipitation of 1584 mm (62.4 in.), slightly less than twice that of Iowa.Each of three months of the year receive 10 mm (~0.4 in.) of precipitation or less per month. (The lowest averagemonth in Iowa is about 25 mm (1 in.). In contrast to the very dry months of the savanna, six months of the year receive175 mm (~7 in.) or more. Precipitation, thus, indicates much more variability than temperature which varies by a fewdegrees C annually (Fig. 8.4).
Fig. 8.4 Climograph for Goiania, Brazil.
To see how this compares with other stations in the U.S. go back to the climograph figures in Lesson 1.

Agronomy 541 : Lesson 8a
Climate Classification
Thornthwaite Classification
When using temperature and precipitation to define climate, the two must be combined in a single method. Asseen in the previous part of this lesson, the temperature designations were mostly latitudinally driven. Moisturevaried through other considerations causing the B (dry) climates to vary throughout latitude bands. Anothersystem was developed to account for differing climates based mostly on the water balance of a region rather,the temperature and precipitation specifically.
Thornthwaite developed another classification system dependent on the modified potentialevapotranspiration (PET) of a region. His concern was with the amount of water available. The driving factorin this system is the water budget of a region. Regions were classified in categories ranging from being humidto arid. The main factor used in classifying climates is then what is most important in the classification. TheThornthwaite system uses temperature as a modifying factor in determining PET, but it is not the major factoras in the Koeppen system. Temperature in this system was a controller of PET, not a direct classification.
Where the index Im is based on precipitation P and Potential Evapotranspiration PE. For the US this leads toFig. 8.6

Fig. 8.6 United States climate types based on the Thornthwaite system.

Agronomy 541 : Lesson 8a
Climate Classification
Specific Climate Types
The main climate types proceed from the equator poleward. The A climates straddle the equator, experiencingthe most direct radiation throughout the year. Because of this they produce thunderstorms and rainfallregularly. The general circulation discussion in Lesson 7b described the background conditions for the risingmotion. Thus, the A climates have consistently warm temperatures and ample to excessive precipitation.Regular solar radiation creates warm temperatures in this region. These are located where the ITCZ is locatedat least at some time during the year. The movement of the ITCZ across the Equator brings rains throughoutthe area. The change in position of the ITCZ causes the differentiation in A climates from those which are wetcontinually (tropical rain forest, (Fig. 8.7), where the ITCZ is always overhead) to those which change from wetto dry. Savannas occur (Fig. 8.8), where the ITCZ moves over bringing rains and then moves away, leaving theregion dry. Each climate has plants and soils, which are often associated with that climate. Af climates havevery dense and very diverse plant populations. The savannas must adapt to being dormant when the rains arenot occurring. Plant coverage is much less dense.
Fig. 8.7 Typical tropical forest
growth in the Amazon, an Af,
tropical wet climate.

Fig. 8.8 Savanna plant growth. Plants adapt to the distinct wet and
dry periods occurring here.
B climates are prevalent around 20-30° latitude in the sub-tropics, the latitude of sinking motion called thehorse latitudes. Looking on a global climate map, numerous deserts (Fig. 8.9) exist near this latitude. This canbe overcome by other factors, such as the warm ocean waters near the southeast edge of continents. Floridais in the region which could be a desert. But the ocean modifies the background flow to make the climate moist.This will be discussed more in the climate controls section. Consequently, B climates can extend throughout therange of latitudes since they deal mainly with lack of precipitation.
Fig. 8.9 Typical completely arid land without vegetation.
All deserts (BS) are not without vegetation (Fig. 8.10). Some have sparse vegetation. Some can be quite lushwhen rain does fall. Agriculturally, deserts can often be quite productive if managed correctly and if water canbe provided to them. The Central Valley of California and areas of Arizona are good examples of this. Becauseof the little rainfall over their history, the soil may have a large nutrient contact. But since they are usuallypoorly formed soils, they can be damaged and overused easily.

Fig. 8.10 Here sheep graze on grass growing in a desert climate in
China.
Fig. 8.11 Comparison of irrigated vs. non-irrigated yields for
Nebraska.
Steppe climates (BW) occur in transitions between true deserts and surrounding climates. These can be veryproductive grain growing areas (Fig. 8.12). Yields are mostly limited by lack of precipitation. Again, whereirrigation can occur, the land can be very productive.
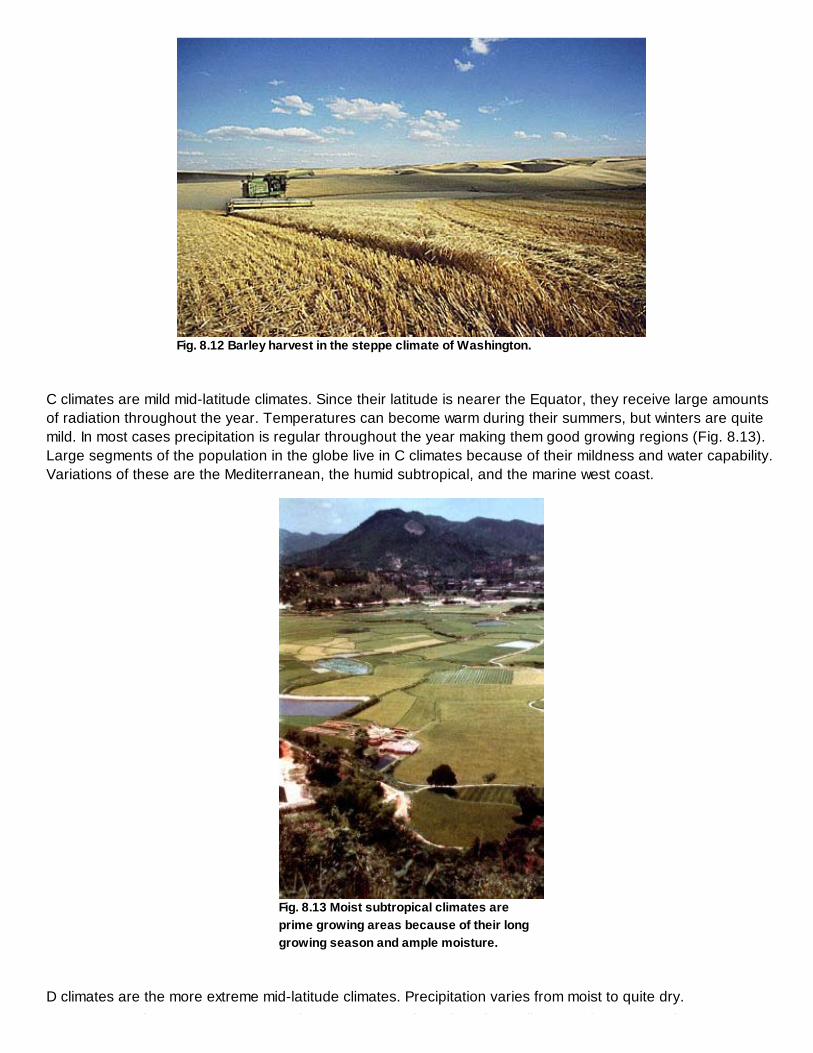
Fig. 8.12 Barley harvest in the steppe climate of Washington.
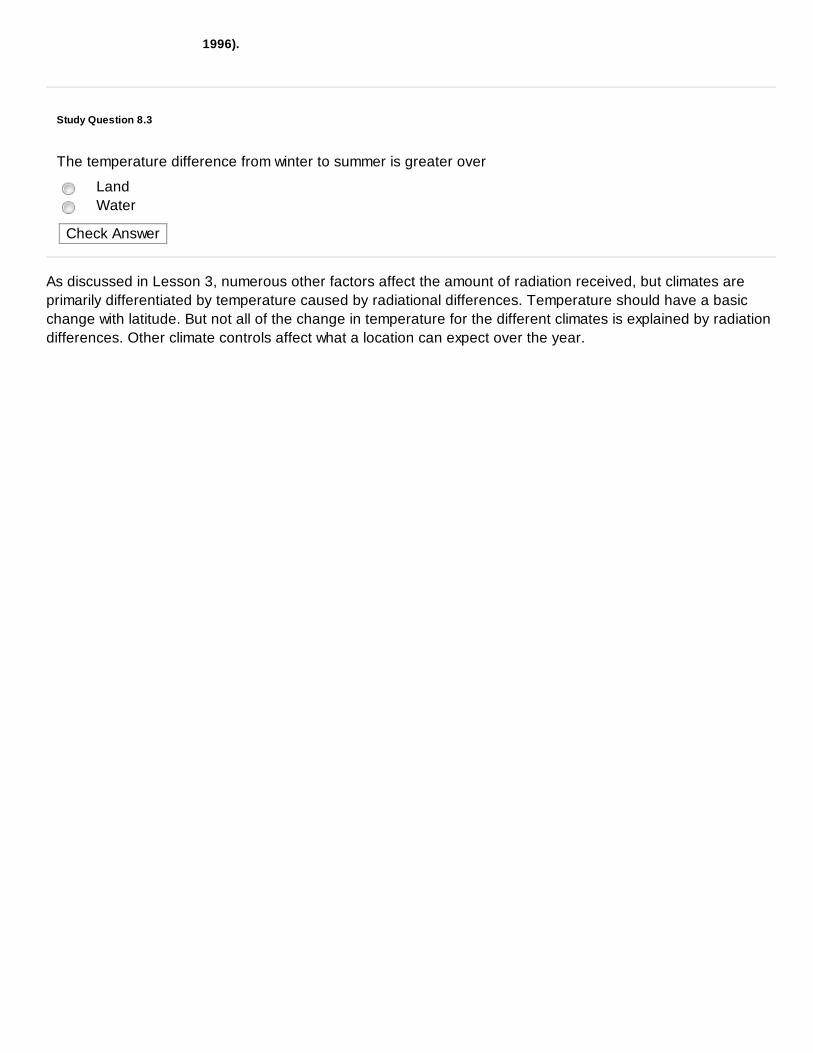
C climates are mild mid-latitude climates. Since their latitude is nearer the Equator, they receive large amountsof radiation throughout the year. Temperatures can become warm during their summers, but winters are quitemild. In most cases precipitation is regular throughout the year making them good growing regions (Fig. 8.13).Large segments of the population in the globe live in C climates because of their mildness and water capability.Variations of these are the Mediterranean, the humid subtropical, and the marine west coast.
Fig. 8.13 Moist subtropical climates are
prime growing areas because of their long
growing season and ample moisture.
D climates are the more extreme mid-latitude climates. Precipitation varies from moist to quite dry.
T t h t f t i t th th C li t Th d t

Temperatures here are more extreme from summer to winter than the C climates. The more moderate ones aregood agricultural areas (Iowa for example). Large crop growing regions of Canada and Russia are also Dclimates. These are confined to the large land masses of the northern hemisphere.
Discussion Topic 8.1
Why are the climates of the central U.S., Canada, and Russia so productive? What effects doesclimate have on the soil? What about the temperature and moisture conditions?
The E climates are the far northern climates of the tundra and ice cap. The tundra has very low-growingvegetation because of its extreme nature, while the ice cap (Fig. 8.14) has none. Little agriculturally can begrown in these areas because of their severity.
Fig. 8.14 Polar ice cap climate.

Agronomy 541 : Lesson 8a
Climate Classification
Climate Controls
Several different processes in the atmosphere, ocean, or on the ground control weather patterns and howclimates are created.
Radiation
The initial climate control for every place on the globe is radiation. All life, weather, and climate exist as a resultof solar radiation. All energy, weather and climate are result from this shortwave energy reaching the surface ofthe Earth. Because of the rotation, revolution, and tilt of the globe, differences exist in the amount of radiationreceived at the global surface. The balance of radiation has been discussed previously in Lesson 3b. Thesedifferences in net shortwave radiation have a seasonal variation (Fig. 8.15).
Fig. 8.15 Shortwave radiation received at the surface (W/m2) and its
annual variation. Click on the thumbnail to view a movie displaying
average monthly net radiation.
Large amounts of radiation impact the surface near the equator throughout the year, while little radiation isreceived near the poles. This radiation difference induces temperature differences, which were discussed inthe general circulation. The radiation also determines the temperature of the region. More radiation in near-equatorial regions produces very warm conditions, while the lack of radiation in polar regions leaves them cold.The global temperature response induced by the solar radiational variation can be seen for the extrememonths of January and July (Fig 8.15).

Fig. 8.16a Average January surface temperatures (1968-96) (Kalnay et
al., 1996).
Fig. 8.16b Average July surface temperatures (1968-96) (Kalnay et al.,
1996).
Study Question 8.3
The temperature difference from winter to summer is greater over
LandWater
Check Answer
As discussed in Lesson 3, numerous other factors affect the amount of radiation received, but climates areprimarily differentiated by temperature caused by radiational differences. Temperature should have a basicchange with latitude. But not all of the change in temperature for the different climates is explained by radiationdifferences. Other climate controls affect what a location can expect over the year.

Agronomy 541 : Lesson 8a
Climate Classification
Climate Controls
Continentality
Another climate control is involved with the relationship between land and the ocean. The land-ocean contrasthas several different components. As mentioned several times previously, land and water heat and cool verydifferently. Water maintains a very slowly varying seasonal temperature, while land warms and cools quickly.The short time and distance scale effect of this is the sea breeze . On longer time scales and larger areas, apressure difference is induced among the ocean basins and land.
Study Question 8.4
During the winter, would higher or lower surface pressure exist over land as compared to pressure over theoceans?
HighLowNeither, pressure would be similar
Check Answer
Since ocean temperatures change very little, the land temperatures produce the contrast. The pressures aremostly relative in comparison to the other surface. Cold air and cold mid-continental land surfaces during thewinter result in higher average sea-level pressures over the continents. Warmer water and rising motion wouldproduce relatively low pressure over water. During the summer, the pressure fields reverse. Relatively lowpressure occurs over the warmer land surface with higher pressure over the water. The highs and lowsdiscussed become most pronounced over larger ocean basins and larger continents (Fig. 8.17).

Fig. 8.17a Average sea level pressure during January (1968-96)
(Kalnay et al., 1996).
Fig. 8.17b Average sea level pressure during July (1968-96) (Kalnay et
al., 1996).
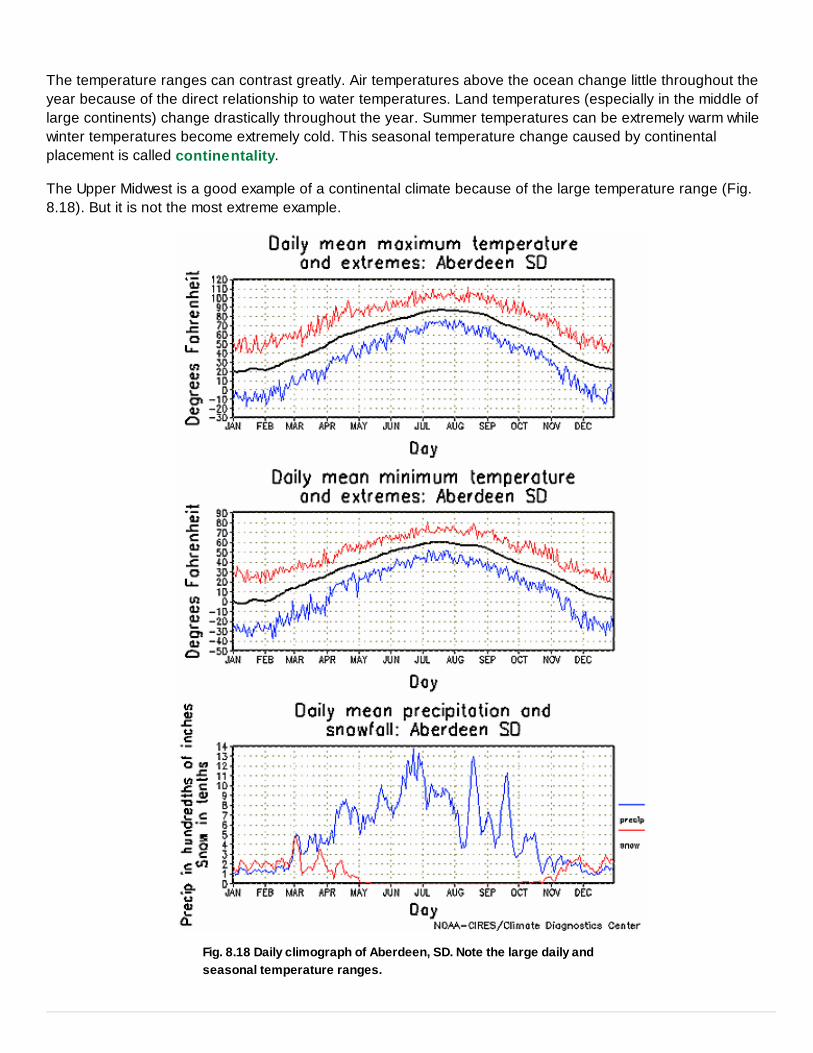
The temperature ranges can contrast greatly. Air temperatures above the ocean change little throughout theyear because of the direct relationship to water temperatures. Land temperatures (especially in the middle oflarge continents) change drastically throughout the year. Summer temperatures can be extremely warm whilewinter temperatures become extremely cold. This seasonal temperature change caused by continentalplacement is called continentality.
The Upper Midwest is a good example of a continental climate because of the large temperature range (Fig.8.18). But it is not the most extreme example.
Fig. 8.18 Daily climograph of Aberdeen, SD. Note the large daily and
seasonal temperature ranges.
Study Question 8.5
What country might have a continental climate similar to the central United States and Canada?
FrancePanamaIndiaRussia
Check Answer
One of the most extreme examples of a continental climate is from Verkhoyansk, Russia. Here the average mid-summer temperature reaches about 15°C (59°F) while winter temperatures plunge to -48°C (-55°F). Thesetemperature extremes are a direct result of positioning within a continent. Locations closer to oceans are morebuffered in their temperature response.

Agronomy 541 : Lesson 8a
Climate Classification
Climate Controls
Oceanic effects
Several different effects occur as a result of the ocean-land contrast. The first is a simple temperaturemoderation of coastal cities versus inland cities. The ocean acts as a buffer against large temperatureextremes. This is a direct application of the sea breeze effect to a climatological response. While two stations ata similar latitude should have similar amounts of sunlight throughout the year, their annual temperature rangesare quite different.
Two stations which illustrate this are Kansas City, MO and San Francisco, CA (Fig. 8.19). Both are locatedabout 30° N but have greatly different winter-summer temperature ranges. The winter-summer temperaturerange in Kansas City is around 45°F (25°C) compared to the 20°F (11°C) temperature range in San Francisco,where colder ocean temperatures greatly modify the temperatures throughout the year.
(a) (b)
Fig. 8.19 Climograph for a) San Francisco, CA and b) Kansas City, MO.
Click on each thumbnail to view a larger figure.
Not only are the oceans temperature modifiers, they supply much of the moisture available for precipitation.The Gulf of Mexico is a main supplier of moisture to the midwest. That oceanic moisture influence is quiteobvious when looking at national precipitation. The general trend is for total precipitation to increase the closerto the ocean. The further inland, the less precipitation falls (Fig. 8.20).

Fig. 8.20 Annual district precipitation (inches).
In the eastern part of the country this is a fairly direct relationship. In the west mountains become acomplicating factor changing storm tracks and removing moisture as air passes over the coastal ranges (notethe amount of precipitation in western Washington and Oregon compared to the eastern parts of each state). InLesson 6 doing the mountain simulation we discussed some of the problems associated with air flow over themountains and how it can affect climate.

Agronomy 541 : Lesson 8a
Climate Classification
Climate Controls
Ocean Currents
The high and low pressure areas (Fig. 8.17) produced by the land-water heating difference are a stable fixtureof the climate of the globe. These systems, called semi-permanent highs and lows, are found around the globe.As with all high and low pressure areas, they have a wind structure associated with them. Because of theirpermanence, the winds are fairly regular around them. When stable wind fields blow over an open ocean theycan create a circulation in the ocean basin, called a gyre . These currents in the ocean now cause temperaturedifferences in the oceanic temperature structure as they transport water around an ocean basin.
Study Question 8.6
Look at the July sea level pressure picture (Figure 8.17b). Judging from that picture, what direction shouldthe current flow along the east coast of the United States? Along the west coast?
East West
Check Answer

Agronomy 541 : Lesson 8a
Climate Classification
Climate Controls
Ocean Currents (cont.)
How the oceans actually respond to these wind flows and other factors is shown in (Fig. 8.21)
Fig. 8.21 The regular ocean currents around the world. Warm currents
in red, cold currents in blue.
Ocean currents are much slower than depicted here, but have a regular motion. These ocean currents then actas huge transporters of heat as warm and cold water are circulated globally. The average ocean temperaturesproduced can be seen in Fig. 8.22.
Fig. 8.22 Global sea surface temperatures on July 18, 1999. Click on
the thumbnail to view a larger figure.
Notice the transport of warmer water along the eastern coasts of continents while colder water is transportedsouthward along western coasts. This is true for nearly all continents despite the variation of continental sizeand shape. Warm ocean water helps moderate and warm the climates on the southeastern edge of all thecontinents. All continents have a region of Cfa climate here. Most continents are affected by the colder oceancurrents along the west coasts (resulting in the Marine West Coast climates). The Bermuda High we havediscussed briefly as a transporter of moisture to the Midwest. These have a dramatic effect on the climates ofthe different coasts. Smaller-scale gyres and other circulations exist in the ocean, but these have the largesteffect on climates.
Other smaller climate controls exist, but are not discussed here. These controls in addition to the generalcirculation should allow for reasonably easy description of most climates around the globe.

These large scale effects are the main drivers of climate across the globe. Climate that are defined by thesenow are not even stagnant. As temperatures and precipitation change, the boundaries of the climates changebased on the figures earlier in the lesson. Smaller scale effects are also influential in driving the climate. Butthese are the main focus of discussion.

Agronomy 541 : Lesson 8b
Highs and Lows
Introduction
Developed by D. Todey
It is suggested that you watch Video 8B and complete the exercise in the video before continuing with thelesson.
Podcast Version Full Podcast List
Please note that this video ends abruptly at about 12½ min.
Semi-permanent highs and lows that are induced by heating and cooling of land and water are one version ofsurface features of low pressure and high pressure. The more transitory lows and highs are commonly seen inthe evening weather discussion on TV. The direction of flow around lows and highs are one the first thingsmany people learn about the weather. But the flow around the pressure centers and the causes of the lows andhighs are just as important to understand. The different types of air masses associated with highs and lows andtheir characteristics are also discussed in this lesson.
Figure 8.23 shows a high in the middle of the United States, a low over Arizona, and a low over New England.This is not an atypical situation for the country during the summer. Conditions associated with this situationwould be dry for the Midwest and wet for Arizona and New Mexico. We had a picture that looked a lot like this in1988. When the surface map looks like this, the Midwest has a drought because high pressure produces clearskies, especially from the center of it to the east. Areas of low pressure usually are associated with storms andrainfall.
Figure 8.23 Surface map depicting highs, lows, and wind flow around
the lows and highs.
Unequal heating on the earth gives us the weather patterns that we have. The heating differences inducepressure differences, which in turn produce wind (discussed in Lesson 4). The large-scale circulations havebeen talked about in the general circulation pattern. Included are the easterly trade winds near the equator, the

prevailing westerlies in the mid-latitudes, and the polar easterly winds that generally stay north of the polarfront in Canada and the Arctic. Similar wind regimes are found in the Southern Hemisphere.
What You Will Learn in This Lesson:
How the vertical structure of lows and highs influences the winds we see at the surface.About the different types of air masses and their source regions.
Reading Assignments:
Aguado & Burt pg. 193-197, 237-246

Agronomy 541 : Lesson 8b
Highs and Lows
Semi-Permanent Highs and Lows
Roughly permanent high and low pressure areas can be found in the general circulation. Recall the discussionof flow around a water-only non-tilted planet. If the planet wasn't tilted and was covered with water, there wouldbe a high at the North Pole, and highs somewhere across Arizona and down across Georgia and Florida (about30° N). A band of lows would drape across Canada and along the equator (Fig. 8.24). Low pressure is createdwhere the air is rising, while high pressure would occur where air is sinking. But since the earth has landmasses and is tilted with respect to the sun, bands of high and low pressure generally don't exist. They take ona more cellular appearance because of ocean-land heating differences. (See Figure on page 207 of text.)
The southern hemisphere is somewhat more banded than the cellular northern hemisphere.
Fig.8.24 Latitude bands of lows and highs if there were no land
masses.
Similar amounts of radiation striking water and the land affect temperatures far differently. Radiation striking theocean will penetrate the water to a great depth. In clear water, it has some effect down to 80 feet. The lessclear the water is, the more shallow the effect. Assume that the sun's effect on the ocean is about 80 feet. Thesun heats the land to a depth of 5 inches. The sun has a skin effect on the land, and a deep effect in the water.

Fig. 8.25 Depth to which radiation directly effects land and water.
There is also a different reflectance. Land may reflect a different amount of the energy than the water doesbased on different surface characteristics. Generally, a land surface will reflect more radiation than will thewater. More energy is being used to heat the land than the water. The amount of heat needed to warm water isgreater than land. Water has a very high heat capacity. The same amount of heat energy added to differentsubstances causes different temperature changes. For instance, an average land surface probably has a heatcapacity that is about 40% that of water. If you add the same amount of heat to water and land, the land willheat up faster.
Fig. 8.26.
Study Question 8.7
Assuming the same heat capacity of water, how much would the water heat up if 10 cal of heat were applied

to the water?
5°10°20°100°
Check Answer
These three characteristics combine to make the amount of heat or energy needed heat up a volume of watergreater than for a volume of land. Therefore, the water will heat more slowly.
There are a couple of other factors that go along with this. The ocean has regular currents and eddies, stirringand mixing the heat away. The ocean water turns over and moves around creating a difference that becomesvery apparent daily and seasonally. The land will heat up very quickly, becoming warmer than the ocean in thedaytime, and cool off quickly, becoming cooler than the ocean at night. While their average temperature is thesame, throughout the year the land temperatures can vary greatly. Average winter temperatures are somethingbelow freezing while temperature in the summer averages between 60° F and 70° F (16°C-21°C). This createsa 40° F temperature difference for the average daily temperature for summer to winter here in the Midwest(Fig. 8.27). The ocean temperature doesn't vary more than 18°F (10°C) anywhere unless the big oceancurrents move and come into a new location. Much greater variability of temperature exists on land than in theocean. These temperature differences overcome some of the banding expected from the general circulationmodel.

Fig. 8.27. Average monthly maximum and minimum temperatures (°F)
and precipitation (in.) for 1951-1997.
Some patterns do become very apparent. Typical January pressure patterns may be seen on pg. 43 of yourtext. High pressure regions can be found in the Atlantic, near the Azores and Pacific off Baja, California. Theseare in the typical band area where highs would be expected. High pressure areas are also found overcontinental North America and Asia. These are formed because the land mass is colder than the surroundingoceans. Colder air leads to sinking motion. As long as this pattern holds up, weather will be dry under this highpressure. Januaries in the Midwest will be quite dry, being the minimum precipitation month in Iowa (about 1inch of precipitation, see Figure 8.27). It may fall as 12 inches of snow. But melting it down would produceabout 1 inch of precipitation. Low pressure areas tend to persist over the Aleutians and Iceland.
Discussion Topic 8.2
Why would low pressure areas persist over these two areas? Discuss with class members.
These patterns of highs and lows on the earth are most likely to look like this configuration. The weather mapdoes not always look this way during January. But it occurs very often. Averaging of pressures over time wouldproduce a map similar to this.
Looking at July, high pressure becomes very dominant across the Atlantic. When it establishes over Bermuda,getting close to the United States, we say that the Bermuda High Pressure is in place. Low pressure developsbecause intense heating over the desert of Arizona and into Nevada causes rising motion and a thermal low.High pressure expands out in the Hawaii area. Low pressure becomes very dominant in Asia becomingassociated with the monsoon winds and the rains in southern Asia.

Close Window
FYI : Snow-Precipitation
What is the snowfall-water equivalent factor? Or how much precipitation fell in 1 inch of snow? The general rule is that10" of snow is equivalent to 1" (10:1 ratio) of water when melted. There can be a much wider range of ratios, though.Snow that falls near or above freezing can have a ratio of 3:1 or 4:1. Snow that falls during an extremely coldoutbreak can have ratios of 30:1 or more. The actual snowfall and the water equivalent are reported for snow events.

Close Window
FYI : Arizona
During extremely hot times in the southwest, the rising motion becomes a serious problem. The rising air creates verylow pressure at the surface. Since this area is at a relatively high elevation anyway, the air density becomes evenlower. When the air density becomes too low, it is difficult for jet aircraft to land and take off. On occasion, the Phoenixairport has been closed because the air was too thin for aircraft to take off.

Agronomy 541 : Lesson 8b
Highs and Lows
High and Low Structure
It would be appropriate to say that a high pressure is simply a pile of air on the ground. Air may sink down fromthe upper atmosphere, often because it's cool. The pile of air on the ground spreads out in all directions justlike a pile of corn or beans would. Looking down on it from the top, our pile of air (with our contour lines ofheight indicated) would spread out in straight lines. But the world is turning. Since the world is turning, thingsmoving in the Northern Hemisphere are deflected to the right of their paths of motion. High pressure is thenassociated with clockwise flow of air around it and slightly away from the center of the high (Fig. 8.28).
Fig. 8.28 Vertical and horizontal motions associated with a high and
low.
A low pressure, or a cyclonic disturbance, has a counter clockwise flow of air as the air fills in to this lowpressure area.
Study Question 8.8
If high pressure is a pile of air on the ground, what's a low pressure?
Rising motionA lack of air on the groundFlow into a low area
Check Answer
The low discussed in the southwestern United States (from the FYI of the previous page) is called a thermal lowpressure. Because the ground becomes very warm, the air near it is warmed, becomes buoyant, and rises.Rising air leaves a partial vacuum and a low pressure area underneath. When air flows toward the low to begin

filling in, it begins to flow counterclockwise. Thermal low pressure is a characteristic feature of the southwestduring the summer. Once that low gets in place and moving, it will have a very definite influence on theprecipitation pattern in the southwest United States. New Mexico and Arizona get most of their precipitationduring the summer as we do. But they get their precipitation because of the thermal low, bringing theprecipitation up mainly from the Gulf of Mexico, transporting it over the mountains. This moisture flow producesprecipitation in the summer when the desert needs it the most.
On the other side of that low, over California, the air is moving down the mountains toward the coast. Thesehot, dry winds are called the Santa Ana winds. Hot dry winds coming down the hills are much like the chinookwinds which we've already described.
Another way to form a low pressure is to have air masses that are conflicting with each other. Sometimes twoconflicting high pressures may interact. A particular situation might occur where high pressure is centered overthe United States with its associated air flow. The polar front would extend along the Canadian-U.S. border.Behind that cold front would be another area of high pressure. The two clockwise circulations of air collide. Thisoften creates turbulent conditions.
Fig. 8.29 Colliding air masses between highs may produce rising
motion and a low.
The colliding air along the front (usually referred to as convergence) can give the air some buoyancy. If it startsrising and keeps rising, then lows will develop along the front. Many of these little lows develop along the front.Fronts will be discussed in Lesson 9. Once the low gets started it can propagate eastward, producing stormsalong the front. Quite often when there's a front staying in the area, every 12-24 hours a low pressure will comealong the front and produce more precipitation as those little waves come by.
There are a couple of other ways that low pressures are formed. One that you already know a great deal aboutdoesn't require the front but just requires the unstable air, and that is the thunder storm where, with the lowpressure, the air begins to rise and it can result in a thunder storm. Sometimes a dust devil or a tornado couldform in much the same way. There are also some lows which form around Denver because of the nature of theair moving down off the mountains in that area.

Agronomy 541 : Lesson 8b
Highs and Lows
High and Low Air Flow
Wind is associated with these highs and with these lows. How much wind is associated with them depends onhow great the pressure difference is.
If a low or a high is drawn on a surface map, lines of equal pressure (isobars) are drawn on the weather map.The strength of the high or low is given as a pressure in millibars. In the middle of a high it may be 1000mb,near normal sea level pressure. The next line out would be 996mb progressing to lower pressure moving awayfrom the high. The contours typically change by 4, 996mb, 992mb, etc. This high pressure wasn't very strong,but at least it was higher than the surrounding area. The pressure drops off when moving away from thecenter. Where the lines are close together, the pressure is changing most rapidly and the winds are thestrongest (Fig. 8.30).
Fig. 8.30 Isobars with pressure
dropping away from the center
of the high; closely spaced
isobars indicate faster wind
speeds.
Study Question 8.9
What quadrant of the high in Figure 8.30 would have the strongest winds?
NWSWSENE
Check Answer
Up in the atmosphere several thousand feet, the wind will blow essentially parallel to the lines of equalpressure. At these levels the pressure gradient force and the Coriolis force are balanced. This balance occursbecause air initially attempts to even the pressure by going from a high to a low. This can be thought of aswater trying to flow to level itself. At ground level, the wind moving along the ground encounters friction. The

ground slows the air's speed of movement. Because of friction and the rotation of the Earth, it tends to bedeflected to the right in the Northern Hemisphere. Because it's dragging on the earth, it would stay more withthe speed of the earth than it would a couple of thousand feet above. So we end up with wind that won't do thisand won't do that, but does something halfway in between. So it crosses the isobars at about 30 to 45° anglenear the ground.
Quite often air around high pressures is referred to as an air mass. Lows are not associated with an air mass;generally, low pressure forms at boundaries between air masses, called fronts. Quite often what we're dealingwith when we hear that "an arctic air mass is moving into the United States", is a dome of high pressure. Itsstructure is depicted in Figure 8.31. Here a cold pool of air or dome of air from the northern part of thecontinent is moving down into the United States; an arctic air mass coming our way.
Fig. 8.31 Air masses and polar front over the United States.
Agronomy 541 : Lesson 8b
Highs and Lows
High and Low Air Flow
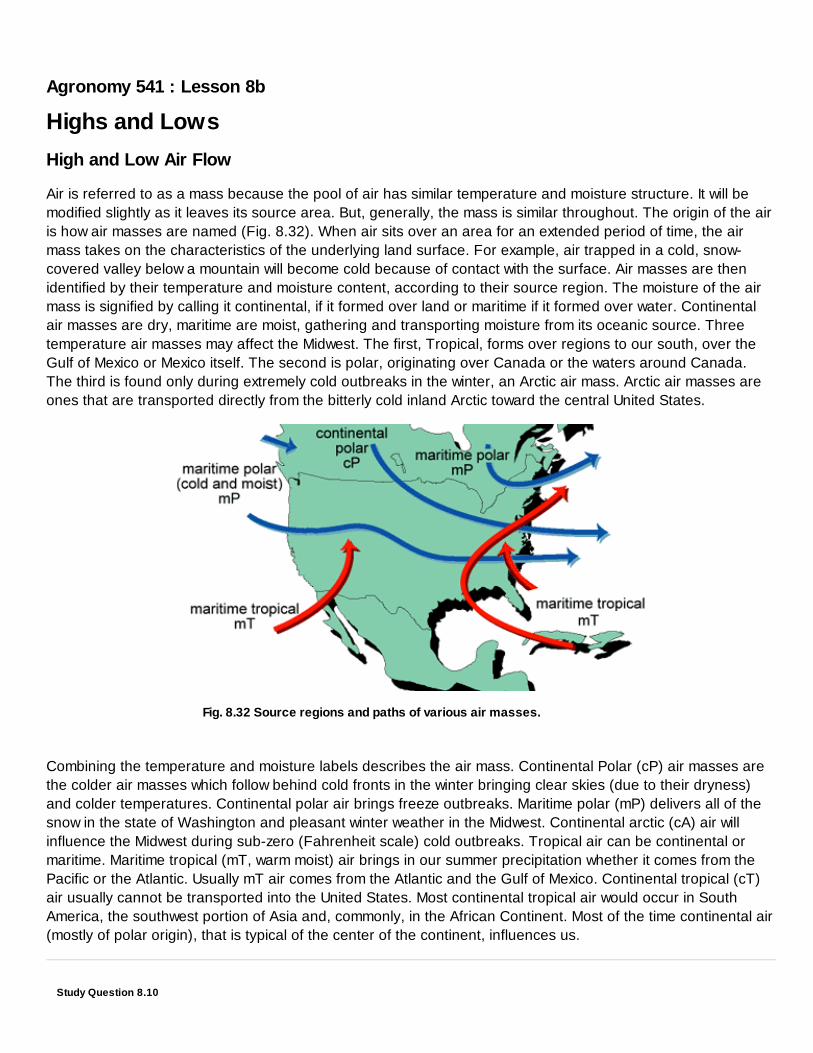
Air is referred to as a mass because the pool of air has similar temperature and moisture structure. It will bemodified slightly as it leaves its source area. But, generally, the mass is similar throughout. The origin of the airis how air masses are named (Fig. 8.32). When air sits over an area for an extended period of time, the airmass takes on the characteristics of the underlying land surface. For example, air trapped in a cold, snow-covered valley below a mountain will become cold because of contact with the surface. Air masses are thenidentified by their temperature and moisture content, according to their source region. The moisture of the airmass is signified by calling it continental, if it formed over land or maritime if it formed over water. Continentalair masses are dry, maritime are moist, gathering and transporting moisture from its oceanic source. Threetemperature air masses may affect the Midwest. The first, Tropical, forms over regions to our south, over theGulf of Mexico or Mexico itself. The second is polar, originating over Canada or the waters around Canada.The third is found only during extremely cold outbreaks in the winter, an Arctic air mass. Arctic air masses areones that are transported directly from the bitterly cold inland Arctic toward the central United States.
Fig. 8.32 Source regions and paths of various air masses.
Combining the temperature and moisture labels describes the air mass. Continental Polar (cP) air masses arethe colder air masses which follow behind cold fronts in the winter bringing clear skies (due to their dryness)and colder temperatures. Continental polar air brings freeze outbreaks. Maritime polar (mP) delivers all of thesnow in the state of Washington and pleasant winter weather in the Midwest. Continental arctic (cA) air willinfluence the Midwest during sub-zero (Fahrenheit scale) cold outbreaks. Tropical air can be continental ormaritime. Maritime tropical (mT, warm moist) air brings in our summer precipitation whether it comes from thePacific or the Atlantic. Usually mT air comes from the Atlantic and the Gulf of Mexico. Continental tropical (cT)air usually cannot be transported into the United States. Most continental tropical air would occur in SouthAmerica, the southwest portion of Asia and, commonly, in the African Continent. Most of the time continental air(mostly of polar origin), that is typical of the center of the continent, influences us.
Study Question 8.10

Maritime polar (mP) air would be
Check Answer
Study Question 8.11
A warm humid summer day would caused by what type of air mass?
Continental polarContinental tropicalMaritime tropical
Check Answer

Agronomy 541 : Lesson 8b
Highs and Lows
High and Low Air Flow
Stability
Air masses are very different from one another in characteristics depending on the time of year they form andwhether they form over the ocean or over the land. A stable air mass is one in which there is warm air overlyingcold air. Why is that called stable? It is stable because if something should bump the underlying cold air andpush it up, the colder air, being more dense than the air above it, will sink right back down to the ground. Ifsomething were to bump some of this warm air and push it down, that warm air would be less dense and wouldbounce back up to where it was. So if you deflect this air from where it has been, it will return right to that place.That is a stable air mass. The air aloft does not necessarily have to be at a temperature exceeding the airbelow, it just must be warmer than would be expected if air were lifted aloft (Fig. 8.33).
Fig. 8.33 Stable air mass with warm air overlying cold air.
Suppose an opposite situation exists, warm on the bottom and cold on the top. Pushing this warm air up towhere the air is cold will cause the now less dense air to continue rising like a hot air balloon. The same thingwould occur with the cold air. If something pushes it down, it will be colder than the surrounding air, and will sinkall the way to the ground. An unstable air mass is one with relatively cold air on top of warm air (Fig. 8.34).
Fig. 8.34 Unstable air mass with cold air over warm air.
Let's look at a couple of these air masses as examples and discuss them. The continental structure with the twomountain ranges tends to funnel cP air masses down the center of the continent. Figure 8.34 indicates threetypical paths of continental Polar air masses. A very typical path is to move down the continent and swingacross the Great Lakes. If the lakes are not frozen as the air mass crosses, the water is warmer than the airmass. The air mass begins to pick up a lot of moisture and some additional heat. Now the air mass is warm andwet near the bottom, creating an unstable situation. As it passes over to the east side of the Great Lakes, theair mass gives places such as Buffalo, NY, and the Upper Peninsula of Michigan much heavier snowfalls than
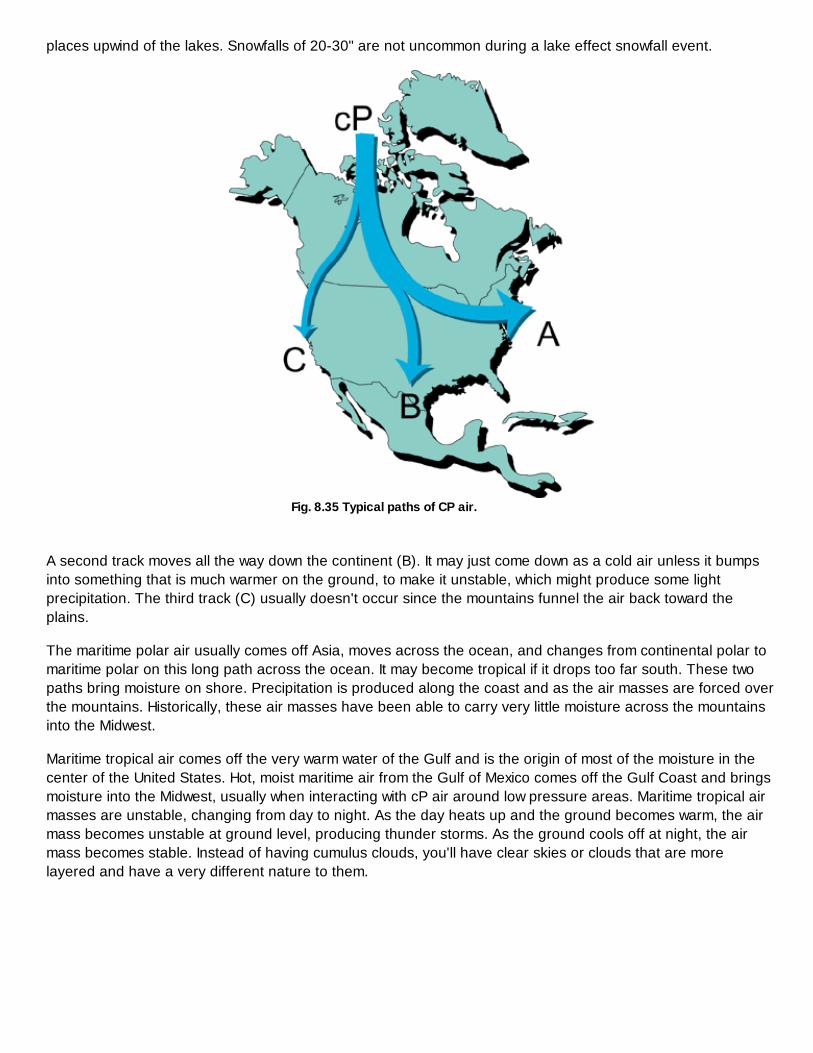
places upwind of the lakes. Snowfalls of 20-30" are not uncommon during a lake effect snowfall event.
Fig. 8.35 Typical paths of CP air.
A second track moves all the way down the continent (B). It may just come down as a cold air unless it bumpsinto something that is much warmer on the ground, to make it unstable, which might produce some lightprecipitation. The third track (C) usually doesn't occur since the mountains funnel the air back toward theplains.
The maritime polar air usually comes off Asia, moves across the ocean, and changes from continental polar tomaritime polar on this long path across the ocean. It may become tropical if it drops too far south. These twopaths bring moisture on shore. Precipitation is produced along the coast and as the air masses are forced overthe mountains. Historically, these air masses have been able to carry very little moisture across the mountainsinto the Midwest.
Maritime tropical air comes off the very warm water of the Gulf and is the origin of most of the moisture in thecenter of the United States. Hot, moist maritime air from the Gulf of Mexico comes off the Gulf Coast and bringsmoisture into the Midwest, usually when interacting with cP air around low pressure areas. Maritime tropical airmasses are unstable, changing from day to night. As the day heats up and the ground becomes warm, the airmass becomes unstable at ground level, producing thunder storms. As the ground cools off at night, the airmass becomes stable. Instead of having cumulus clouds, you'll have clear skies or clouds that are morelayered and have a very different nature to them.

Agronomy 541 : Lesson 8b
Highs and Lows
Adiabatic
Sometimes it is difficult to tell what is exactly what's warm and what's cold. Another impact involves the moisturein the air. There is a great amount of energy contained in the moisture as well. Air mass stability is influencedby dryness and wetness as well as by temperature difference. Adiabatic charts are methods of measuring thisstability. The chart in Figure 8.33 has a blue line, called the moist adiabat. As you go up in altitude, thetemperature decreases. With wet air, remember it cools about 2° - 3°F for every thousand feet you go up. If theair is dry, it cools off 5°F, a considerably greater cooling. Air cools off fast if it's dry and slowly if it's moist.Adiabatic charts show the expected temperature if a unit of air is lifted to different height. This is compared tothe actual temperature measured at that height. If the lofted parcel is warmer than the air around it, it will rise. Ifthe unit of air is cooler, it will sink.
Fig. 8.36 A unit of air is lifted from A--B. A--P indicates
actual temperature of the atmosphere.
If the air is very warm from the surface to some elevation as shown in Figure 8.36 (P) A, and some air isdisplaced from the ground "A" to height "B", it will be cooler than the surrounding air. This is a stable air mass.

Fig. 8.37 Air lofted from A--B is warmer that actual air. A--
P is unstable.
If air is very cold aloft (Fig. 8.37), air displaced from "A" to "B" would be warmer than the surroundings and beless dense. This air will be allowed to lift in the "unstable" atmosphere.
Study Question 8.12
Which situation, Figure 8.36 or Figure 8.37, would produce clouds?
Figure 8.36Figure 8.37
Check Answer
Some idealized profiles of temperature for air masses can be described. These are included in Figure 8.38.
Fig. 8.38 Vertical structure of various air masses.

Assignment 8.1
Click here for Assignment 8.1
Lesson 8 Reflection
Why reflect?
Submit your answers to the following questions in the Student Notebook System.
1. In your own words, write a short summary (< 150 words) for this lesson.2. What is the most valuable concept that you learned from the lesson? Why is this concept valuable to
you?3. What concepts in the lesson are still unclear/the least clear to you?4. What learning strategies did you use in this lesson?

Agronomy 541 : Lesson 8b
Highs and Lows
References
Image provided by the NOAA-CIRES Climate Diagnostics Center, Boulder Colorado from their Web site athttp://www.cdc.noaa.gov/
Akin, W.E., 1991: Global Patterns Climate Vegetation Soils. University of Oklahoma Press. 370pp.
Kalnay, E. and Coauthors, 1996: The NCEP/NCAR Reanalysis 40-year Project. Bull. Amer. Meteor. Soc., 77,437-471.

Agronomy 541 : Lesson 8a
Climate Classification
Introduction
Developed by D. Todey
It is suggested that you watch Video 8A and complete the exercise in the video before continuing with thelesson.
Podcast Version Full Podcast List
With the globalization of agriculture, knowledge of how climates are defined, how climates work in other parts ofthe world, and where and when other crops are grown is of prime importance. One of the primary factorscontrolling all agricultural systems is the climate of the region. What the mean and extreme temperatures of aregion are and when and how much rain is expected must be known to create a management plan for an area.More about crop geography will be discussed in Agronomy 531 Crop Management. This lesson will describethe main climate types, how they are produced and by what means they are designated. These will then beapplied to understanding how they affect the agriculture of various areas around the world.
The general circulation discussed in Lesson 7b illustrates how the orientation of the earth with respect to thesun and the resulting placement and amount of solar radiation create the large-scale background flow of windsworldwide. The general flows establish the initial regimes of weather and climate for locations around the worldas patterns of rising and sinking motion create conditions conducive to large amounts of rainfall or deserts.Other factors, such as ocean currents and continental positions further modify the situation created by thegeneral circulation. The application of how these produce climate will be discussed in this lesson.
What You Will Learn in This Lesson:
How climates are differentiated.How the main climate types differ.

What the main climatic influences are across the globe.
Reading Assignments:
Aguado & Burt pg. 411-430