climate change policy in brazil and mexico: how … · climate change policy in brazil and mexico:...
TRANSCRIPT

0
Climate Change Policy in Brazil and Mexico: how Similar are the Impacts and Solutions?
Angelo Costa Gurgel* Claudia Octaviano+
Sergey Paltsev++
Abstract - This paper investigates the impacts of several alternative climate change policy scenarios for Brazil and Mexico. The goal is to compare the options for GHG reductions in Brazil and Mexico and to explore the similarities and differences in the potential approach to climate change mitigation between these two countries, in order to asses if a global “one-fits-all” policy can be justified or the countries should focus on their own strategies for emission mitigation. We use the MIT Emission Prediction and Policy Analysis (EPPA) model, a global energy-economic computable general equilibrium model. The scenarios consider broad classical instruments in reducing GHG emissions and pollutants, as tax and cap and trade systems, as also alternative climate change policies under discussion. We demonstrate that Mexico’s and Brazil’s commitments for 2020, made during the UN climate meetings in Copenhagen and Cancun, while reachable come at very different costs for both countries. The comparative analysis of these two big Latin American economies underscore the need to design climate policy that considers the specific characteristics of each country, including the natural resources available as well as their current economic structure. Also, our results suggest that there are other environmental and economic consequences for Brazil and Mexico of stringent climate policies at the global scale, such as the uncertainties in the value of energy resources traded in international markets. Key-words: Climate policy, Brazil, Mexico, general equilibrium, energy resources
Resumo - O presente estudo investiga os impactos de diversas alternativas de políticas de mudança do clima para o Brasil e o México. O objetivo é comparar as opções para reduzir emissões de GGEs nesses países e explorar as similaridades e diferenças em potenciais estratégias de mitigação de mudanças climáticas entre eles, de forma a identificar se um política única global seria adequada, ou se cada país deve focar na sua própia estratégia de mitigação. Para tal, utiliza-se o modelo MIT Emission Prediction and Policy Analysis (EPPA), um modelo computável de equilíbrio geral de representação global dos sistemas econômicos e energéticos. Os cenários consideram instrumentos clássicos amplos de redução de emissões de GGEs e poluentes, como impostos e mercados de permissões de emissões, além de políticas de mudança do clima em discussão. Os resultados demonstram que os compromissos assumidos por México e Brasil durante os encontros da ONU em Copenhague e Cancun são atingíveis a custos bem diferentes entre esses países. Uma análise comparativa entre essas duas maiores economias da América Latina revela a necessidade de desenhar políticas climáticas que consideram as características particulares de cada país, incluindo seus estoques de recursos naturais disponíveis assim como suas estruturas econômicas atuais. Os resultados ainda sugerem outras consequências ambientais e econômicas para Brasil e Mexico advindas de políticas climáticas mais restritivas, como as incertezas na valoração dos seus recursos energéticos negociados nos mercados internacionais. Palavras-chave: Política climática, Brasil, México, equilíbrio geral, recursos energéticos Classificação no JEL: Q58, Q56, C68 Área ANPEC: Área 11 – Economia Agrícola e do Meio Ambiente
* Sao Paulo School of Economics, Fundacao Getulio Vargas, bolsista do CNPq, [email protected] + Joint Program on the Science and Policy of Global Change, Massachusetts Institute of Technology, [email protected] ++ Joint Program on the Science and Policy of Global Change, Massachusetts Institute of Technology, [email protected]
1
1. Introduction
In the context of climate change mitigation policy, current debate hinges on the future role that big developing countries will play in long-term agreements to mitigate the climate risk. In the case of Latin America, Brazil and Mexico being the biggest economies in the region play a central role. Both countries have actively participated in the international efforts under the UN Framework Convention on Climate Change, as well as in other policy forums such as the G8+5 Climate Change Dialogue. In 2012 with a GDP of $2.25 and $1.18 trillion US dollars respectively, Brazil and Mexico account for 62 per cent of all of Latin America’s economy (WB, 2014). The population of these two countries is 55 percent of the region, 200.4 million people in Brazil and 120.8 million people in Mexico (UN, 2013). Both upper middle income countries, Brazil and Mexico have higher income per capita, $11,690 and $9,940 US dollars respectively, than the average in Latin America of $9,314 US dollars (WB, 2014). Thus, both countries have been under significant international pressure to enhance mitigation action.
Regarding greenhouse gas (GHG) emissions, in 2005 Brazil and Mexico emitted 2,032 and 667 million tons of CO2e respectively (MME and EPE, 2013) (SEMARNAT, 2013). These figures include emissions from fossil fuel use, other industrial emissions and land use change. In 2010, Mexico’s emissions were 748 million tons of CO2e, an increase of 12% in five years. In contrast, Brazil’s emissions experienced a significant reduction of 39% in the same period, with total emissions in 2010 of 1,246 million ton CO2e. The reduction of Brazil’s emissions comes as a result of deforestation control policy. While total CO2 emissions in Brazil from land use experienced a sharp drop, industrial and agriculture emissions kept an upward trend. In 2010, Mexico’s per capita emissions from fossil fuels were 3.8 ton CO2, while Brazil’s per capita emission were 2.2 ton CO2. However, if we account for total emissions including land use change and non-CO2 GHG, per capita emissions of Brazil were 6.8 ton of CO2e and Mexico’s 6.1 ton of CO2e.
The goal of this paper is to compare the options for GHG reductions in Brazil and Mexico and to explore the similarities and differences in the potential approach to climate change mitigation between these two countries. We seek to understand if a global “one-fits-all” policy like the same carbon price or similar percent reduction in emissions can be justified or the countries should focus on their own strategies for emission mitigation. We use the MIT Emission Prediction and Policy Analysis (EPPA) model (Paltsev et al., 2005), which is a global energy-economic computable general equilibrium (CGE) model, developed at MIT Joint Program on the Science and Policy of Global Change. The scenarios considered here are developed to consider alternative climate change policies under discussion.
In this paper, we focus on the dynamics of emissions trends, the resulting energy choices and explain the macroe- conomic costs in climate policy scenarios. The paper is organized as follows. Section 2 describes the EPPA model. Section 3 provides an overview of the reference scenario, focusing on emissions, energy and electricity mix in the business as usual case. This section describes some of the key diferences in energy structures to understand policy costs in Brazil and Mexico. Section 4 presents the results of several climate policy scenarios. Section 5 concludes.
2. The MIT Emissions Predictions and Policy Analysis (EPPA) model
The EPPA model (Table 1) is a multi-region, multi-sector recursive dynamic representation of the global economy (Paltsev et al., 2005). The GTAP data set provides the base information on the input-output structure for regional economies, including bilateral trade flows (Hertel, 1997; Dimaranan and McDougall, 2002). We aggregate the data into 16 regions and 21 sectors.
Table 1 presents the countries or regions represented in the model and broadly identifies final demand sectors and energy supply and conversion sectors. Final demand sectors include five industrial sectors and two household demands, transportation and other household activities (space conditioning, lighting, etc.), as shown in the table.

2
Table 1. Aggregation of regions, sectors and primary factors in the EPPA model
Source: Paltsev et al. (2005).
Energy supply and conversion sectors are modeled insufficient detail to identify fuels and
technologies with different CO2 emissions and to represent both fossil and non-fossil advanced technologies. There are 16 geographical regions represented explicitly in the model including major countries (Brazil, Mexico, U.S., Japan, Canada, China, India, Russia) and 10 regions that are aggregations of countries, among them the Latin American region, which in EPPA represents the rest of Latin America without Brazil and Mexico. In this paper we focus on the results for two countries: Brazil and Mexico.
The synthetic coal gas industry produces a perfect substitute for natural gas. The oil shale industry produces a perfect substitute for refined oil. All electricity generation technologies produce perfectly substitutable electricity except for renewable energy technologies, which have a special treatment in the model. For wind and solar technologies we represent two types of penetration, at low levels of penetration a generic Wind and Solar technology is modeled as producing an imperfect substitute of electricity, reflecting its diurnal and seasonal variability and intermittency. At large-scale penetration, we allow wind and solar to enter as perfect substitutes, but require a back-up generating unit either from natural gas or biomass. We introduce these “hybrid” technologies considering that wind and solar technologies could penetrate the mix if they become competitive under climate policy, but will require additional capacity to overcome its intermittency issues. For more details on this formulation see Morris et al. (2010). Biomass use is included both in electric generation and in transport where a liquid fuel is produced that is assumed to be a perfect substitute for refined oil.
Regarding land use we explicitly model land conversion to different economic uses. Each land type is a renewable resource whose quantities can be altered through conversion to another type or abandonment to a non-use category. In the general equilibrium framework, we need to keep both consistencies with the physical units and with the economic value. The first of these conditions is achieved by assuming that 1

3
hectare of land of one type is converted to 1 hectare of another type, and through conversion it takes on the productivity level of the average for that type for that region, either cropland, pastureland or managed forest. The second of these conditions is achieved by observing that in equilibrium the marginal conversion cost of land from one type to another should be equal to the difference in value of the types. We require that conversion uses real inputs through a land transformation function (Gurgel et al., 2007).
The model includes representation of abatement of non-CO2 greenhouse gas emissions (CH4, N2O, HFCs, PFCs and SF6) and the calculations consider both the emissions mitigation that occurs as a byproduct of actions directed at CO2 and reductions resulting from gas-specific control measures. Targeted control measures include reductions in the emissions of: CO2 from the combustion of fossil fuels and land use; the industrial gases that replace CFCs controlled by the Montreal Protocol and produced at aluminum smelters; CH4 from fossil energy production and use, agriculture, and waste, and N2O from fossil fuel combustion, chemical production and improved fertilizer use. More detail on how abatement costs are represented for these substances is provided in (Hyman et al., 2003).
Future scenarios are driven by economic growth that results from savings and investments and exogenously spec- ified productivity improvement in labor, energy, and land. Growth in demand for goods produced from each sector including food and fuels occurs as GDP and income grow. Stocks of depletable resources (like coal, oil and natural gas) fall as they are used, driving production to higher cost grades. Sectors that use renewable resources such as land compete for the available flow of services from them, generating rents. These together with policies, such as constraints on the amount of greenhouse gases, change the relative economics of different technologies over time and across scenarios. The timing of entry of advanced technologies, such as cellulosic bio-oil or wind and solar technologies, is endogenous when they become cost competitive with existing technologies.
When emissions constraints on certain countries, gases, or sectors are imposed in a CGE model such as EPPA, the model calculates a shadow value of the constraint which is interpretable as a price that would be obtained under an allowance market that developed under a cap and trade system. The solution algorithm of the EPPA model finds least- cost reductions for each gas in each sector and if emissions trading is allowed it equilibrates the prices among sectors and gases (using GWP weights). This set of conditions, often referred to as what and where flexibility, will tend to lead to least-cost abatement. Without these conditions abatement costs will vary among sources and that will impact the estimated welfare cost, because abatement will be least-cost within a sector or region or for a specific gas, but will not be equilibrated among them. In these scenarios, no emissions trading between countries was allowed, since international trading in GHG gases still an political and institutional challenge worldwide.
For this study, we have improved the EPPA model in the following way. Flex-fuel vehicles for Brazil are included, allowing for the substitution between gasoline-ethanol blend and pure ethanol. Also, to reflect current fleet trends in Brazil (in 2012 the share of flex fuel cars was 58%), we increase the share of flex fuel vehicles (it starts as 30% of the fleet in 2005 and grows to 95% of the fleet by 2065, staying constant thereafter). We also included bioelectricity production from sugarcane bagasse, which was calibrated for a total generation of 0.07 EJ in 2010. We parameterized the model so that this type of energy represents around 3 to 4 % of the power mix in our reference scenario. We also updated population trends based in UN data (UN, 2013), as well as GDP growth and the electricity sector fuel use for Brazil and Mexico up till 2010 data. In term of emissions, for Brazil EPPA estimates in 2005 a total of 2208 million tons compared to 2,032 of the national emissions inventory. Given the high reduction of emissions from deforestation, we adjusted EPPA trends to match the inventory data for deforestation in 2010. With this adjustment, EPPA CO2e emissions for Brazil in 2010 for Brazil are 1,210 million, compared to 1,246 million tons of CO2e reported in the National Emissions Inventory of Brazil, 3% higher. In the case of Mexico, 2005 EPPA emissions for Mexico are 710 million CO2e compared to 667 million ton of CO2e reported in Mexico’s national inventory, 6% higher. These small deviations result from slightly higher emissions in the energy sector in Mexico and Brazil, and

4
also higher N2O emissions, in the case of Mexico. The next section present the reference, or “business as usual”, scenario projected in EPPA assuming no climate policies in Brazil or Mexico, besides those already implemented in 2010 or before. Further details about EPPA may be found in Paltsev et al. (2005) and Gurgel and Paltsev (2014).
3. Overview of the Reference Scenario
This section presents an overview of the EPPA model estimates for the emissions trajectories of Brazil and Mexico during this century. In the Reference scenario we assume no explicit climate policy. As we discuss later, the costs of climate policy and emissions abatement potential of the two countries are related to their current energy mix and natural resources. With vast hydropower resources and productive and large land area, Brazil relies on hydropower for electricity and has developed its bio-energy sector. In addition to having vast resources, Brazil experienced high energy prices during the oil shock in the 70’s, a situation that triggered policy to diversify its energy mix and reduce foreign oil dependence. In contrast, Mexico, endowed with substantial oil resources, developed a significant petroleum industry and positioned itself as an important oil exporting country. While Mexico’s renewable energy resources are abundant, the availability of low-cost oil resulted in fossil energy as a preferred choice in the country. Thus, as a result of both resource availability and energy policies, Mexico’s primary energy comes 98% from fossil fuels sources, contrasting with 62% in the Brazilian energy mix.
This starting position results in a very diferent initial breakdown of these two economies’ emissions. Figure 1 shows the reference emissions by sector for the two countries. As shown, energy related emissions are much higher in Mexico than in Brazil (35% vs 21%), but land-use emissions are higher in Brazil (36% vs 12%). The industrial and transportation sectors contribute with similar share of emissions in both countries (around 20% and 18%, respectively). A big difference between the two countries is also the participation of the residential and commercial sector in emissions, being 13% in Mexico and only 2% in Brazil.
Figure 1 – Share of GHG emissions in 2010 by sector inn Mexico and Brazil Source: Brazil (2013) and SEMANART (2013)
Our results for the Reference projection of primary energy in both countries are shown in Figure 2 for Brazil and Mexico. Currently, Brazil has a substantial contribution from hydro energy, but since development of hydropower is limited by total resource availability, other energy sources start growing at a faster pace. By the end of the century, EPPA model results show that Brazil will increase significantly its use of natural gas, oil and biomass. Nuclear energy is not projected to increase its share. In the case of Mexico, natural gas increases its participation significantly and oil use also grows. In the reference scenario, without further policy, no other energy sources seem to increase its participation in Mexico. In the Reference scenario, without further energy or climate policy, Mexico is projected to rely on oil and natural gas for its energy

5
needs.
Figure 2 – Primary energy output in Brazil and Mexico, 2010 – 2050. Source: EPPA model results. 3.1 Electricity
Brazil has a cleaner electricity mix than Mexico with 70% of its power in 2010 coming from hydro energy, followed by natural gas (11%), oil (9%), and coal (5%). In contrast, Mexico’s power mix in 2010 was heavily dominated by fossil fuels: natural gas (42%) and oil (24%) and coal (10%). Figure 3 shows our projections for electricity mix up to 2050. Brazil continues to rely on hydro power and also expands its natural gas based generation. Mexico’s growth in electricity is based on expansion of natural gas.
Figure 3 – Electricity use by source in Brazil and Mexico, 2010 – 2050. Source: EPPA model results. 3.2. Final Energy Use: Industry, Transportation and Residential and Commercial
Final energy use grows in all sectors of the economy in Brazil and Mexico, as shown in Figure 4. In Brazil most of the growth is expected in industry and transportation, while in Mexico residential and commercial use is expected to grow faster. This result is based on relative shares of the sectors, their competitiveness and improvements in energy efficiency.
3.3. Emissions trends
The resulting emissions trends for Brazil and Mexico are shown in Figure 5. First, one important policy was included in the baseline that shift emissions from 2005 level downwards in Brazil. Considering the drastic drop in emissions from deforestation in Brazil, which have in the last 5 years decrease 80%, we impose a policy constraint on land use emissions to reflect this command and control regulation.
0
2
4
6
8
10
12
14
2010 2020 2030 2040 2050
EJ
Mexico- Primary Energy
Solar
Wind
Hydro
Nuclear
Biomass
Coal
Gas
Oil
0
5
10
15
20
25
2010 2020 2030 2040 2050
EJ
Brazil - Primary Energy
Solar
Wind
Nuclear
Hydro
Biomass
Coal
Gas
Oil
0
0.5
1
1.5
2
2.5
2010 2020 2030 2040 2050
EJ
Mexico - Electricity
Hydro
Nuclear
Gas
Oil
Coal
0
0.5
1
1.5
2
2.5
3
3.5
4
4.5
5
2010 2020 2030 2040 2050
EJ
Brazil - Electricity
Wind
Solar
Nuclear
Biomass
Gas
Oil
Coal
Hydro

6
Interestingly, in terms of CO2 emissions by the end of the model period, both countries emissions trajectory almost end at the same level. However, regarding non-CO2 gases, Brazil emits 3.5 times as much as Mexico of methane and twice as much nitrous oxide, a difference that is maintain in the case of methane throughout the period and increases in the case of nitrous oxide. Figure 6 splits the total contribution of CO2 emissions from combustion processes from those of land use change, an important distinction for mitigation strategies.
Figure 4 – Electricity consumption by source in Brazil and Mexico. Source: EPPA model results.
0
500
1000
1500
2000
2005 2020 2040 2060 2080 2100
Mt
CO
2çy
r
CO2 emissions
MEX
BRA
0
10
20
30
40
50
20
05
20
10
20
20
20
30
20
40
20
50
20
60
20
70
20
80
20
90
21
00
Mt
CH
4çy
r
CH4 emissions
MEX
BRA
0
0.5
1
1.5
2
2.5
20
05
20
10
20
20
20
30
20
40
20
50
20
60
20
70
20
80
20
90
21
00
kt
N2
Oçy
r
N2O emissions
MEX
BRA
0.000
0.001
0.001
0.002
0.002
0.003
0.003
0.004
0.004
2005 2010 2020 2030 2040 2050
Mt
/ y
r
HFC emissions
MEX
BRA

7
Figure 5 – GHG Emissions in Brazil and Mexico, 2005 – 2100. Source: EPPA model results.
Figure 6 – GHG Emissions from fossil fuel and industry and from land use changes in Brazil and Mexico. Source: EPPA model results. 4. Policy Scenarios
In order to project the costs and consequences of common alternative climate policies on the Brazilian
and Mexican economies, we modeled seven alternative policy scenarios: 1) the Copenhagen climate mitigation pledges (scenario 1b), 2) a carbon tax of 10 dollars per ton of CO2e starting in 2020, and increasing by 4% each year (scenario 2a), 3) a carbon tax of 50 dollars per ton of CO2e starting in 2020 and increasing by 4% each year (scenario 2c), 4) a cap on total CO2e emissions reducing from 2010 levels a 5% in 2010, a 10% in 2030, a 15% in 2040 and 20% on 2050 and onwards (scenario 2d), 5) a more stringent cap on total CO2e emissions reducing from 2010 levels a 12.5% in 2020, a 25% in 2030, a 37.5% in 2040, and 50% in 2050 and onwards (scenario 2e), 6) a cap on CO2 emissions only following the same reductions of scenario 2d (scenario 2f), and 7) a cap on CO2 emissions only following the same reductions of scenario of 2d and 2e (scenario 2f and 2g) (See Table 2).
Table 2. Policy scenarios implemented
The first policy scenario (1b) considers only those policies assumed by countries during the
Copenhagen COP meeting in 2009. Scenarios 2a and 2c assumes the imposition of a CO2 tax (price) on all GHG emissions starting at $10 and $50 per ton of CO2 equivalent, respectively. Scenarios 2d and 2e considers cap-and-trade policies able to reduce emissions from 5% and 10% to 20% and 50% respectively by 2050, imposed as national level policies in all sectors at same time, excluding land use changes emissions,
0
200
400
600
800
1000
1200
1400
20
05
20
10
20
20
20
30
20
40
20
50
20
60
20
70
20
80
20
90
21
00
Mt
CO
2
CO2 emissions from fossil fuels and
industry
MEX
BRA
0
200
400
600
800
1000
1200
1400
20
05
20
10
20
20
20
30
20
40
20
50
20
60
20
70
20
80
20
90
21
00
Mt
CO
2
CO2 emissions from Land Use
MEX
BRA
8
with trade of CO2 permits among sectors and GHG gases (using GWP equivalents). The choice of these policy scenarios aims to consider broad and general policies discussed by the environmental economics as able to promote efficiency and effectiveness. At same time, they allow to verify how the same policy set up would affect two developing countries with different energy matrixes and emissions profile.
These last two scenarios were specified to verify how the outcome of the policies would differ if only CO2 emissions were targeted in the policies. For the Copenhagen pledges, we consider the voluntary commitments to reduce emissions by 2020 in 36 to 39% for Brazil from its business as usual level and 30% for Mexico from its business as usual. Brazil projected business as usual emissions of 2,703 million tons of CO2e by 2020; the Copenhagen commitments were to reduce them between 975 and 1,052 million tons, which means that in 2020 Brazil could have emissions around 1,652 or 1,728 million tons of CO2e. Given that Brazil’s emissions in 2010 were already below the target, the Copenhagen goal is already met. In our modeling, we only impose a small requirement for the industry to reduce emissions in 6%, considering the breakdown that Brazil proposed for sectoral emissions reduction, which resulted in an almost negligible policy cost. Brazil has no further announcements of what the policy target will be beyond 2020; therefore we let the Brazil emissions grow again after 2020. In the case of Mexico, current programs have pledge continuing reductions goals to meet a 50% reduction by 2050, if international assistance is provided to reduce emissions. In the case of Mexico, the Copenhagen pledges by 2020 also require only modest reductions compared to our reference case of current policies scenario (emissions in 2020 from scenario 1a and 1b are only 3% apart). For our modeling, we consider that Mexico would not increase again from the 30% reduction level considering the policies that indicate Mexico will pursue even stricter mitigation targets. We do not impose a 50% reduction by 2050, because international transfers to reach emissions to that level seems unlikely so far, and because scenario 2e could be used to evaluate such as stringent policy. In this way, we can compare what would happen if Mexico reaches the 30% and what if Mexico is able to further reduce emissions to 50%.
Figure 7 shows total emissions trajectories in CO2e for each of the policies and Figure 8 shows the associated policy cost, measured as loss GDP in dollars of 2005. To facilitate policy comparison, we integrate the areas under the curves to show total cumulative emissions for each policy as well as total cost, although with this method, for the moment, we are not discounting costs occurred later in the period (see Figure 9). Regarding total emissions trajectories, the results show that for Brazil and Mexico the Copenhagen pledges require very different mitigation efforts. In the case of Brazil, almost no additional mitigation action is required in this scenario, since we considered in the baseline the reduction of emissions from deforestation that has already taken place. For Mexico, in contrast the Copenhagen voluntary goal is comparable in terms of emissions reduction to a high tax on CO2e emissions or cap reaching 50% reductions by 2050. For both countries the policies of a high carbon tax (scenario 2c) and a total emissions cap of 20% by 2050 (scenario 2d) resulted in similar emissions reductions. As expected, a low carbon tax (scenario 2a) resulted for both countries in higher emissions at the beginning of the period and more emissions reduction by the end of the horizon. The most stringent scenario was the cap on emissions to reach 50% by 2050 only with CO2e
(scenario 2g); however this scenario is built for modeling comparison purposes and more attention should be paid to scenario 2e that allows mitigation to occur in all the economy (this is particularly important for costs in Brazil).
The policies modeled imply an increasing lost GDP from the beginning of the policy to 2050, growing from 4% GDP loss to 11% for Mexico and from 0 to 4% for Brazil in the different scenarios (see Figure 9). The policy cost is the highest in the stringent cap for both countries. Interestingly, total cumulative emissions are very similar in each of the countries under scenarios 2c and 2d (high carbon tax and cap on all emissions to reach 50% by 2050), and so are the total policy costs as shown in Figure 9b. However, as shown in Figures 8a and 8b the policy costs occur at different points in time, a key difference between these policies. For Brazil, a high carbon tax (policy 2c) has less costs at the beginning of the horizon compared to a cap to reach 20% by 2050 (policy 2d). While total policy costs are of the same magnitude, once discounted the

9
policy 2c could be preferable (depending on the discount rate selected). The same conclusion could be draw for Mexico, although to a much lesser extent. Our results suggests also, that pricing carbon even with a low carbon tax of 10 dollars per ton CO2e that increase as the economy grows could have an important impact in total emissions trajectories. The low carbon tax policy achieves 25 and 28% of total cumulative emissions reductions in Brazil and Mexico, respectively, compared to the baseline emissions. In comparison, a cap on total GHG emissions to reach 50% reductions by 2050 (2e scenario), reduces 50 and 60% of total cumulative emissions in Brazil and Mexico, respectively the total cost of this stringent cap policy is 10 and 7 times higher for Brazil and Mexico, respectively. In the case of the high tax policy, the costs are 4.2 and 4.5 times higher than the low tax policy. This as a result of the upward slope of the mitigation curves, which reflects the fact that mitigation becomes more expensive as abatement increases and further reductions become more and more expensive.
Figure 7 – GHG Emissions trajectories in Brazil and Mexico under the climate change policies. Source: EPPA model results.
Figure 8 – Yearly GDP losses in Brazil and Mexico under the climate change policies from 2020 to 2050. Source: EPPA model results.
In the following sections we describe some of the interesting changes that occur in each of the simulated policies, in terms of energy use, technology deployment in relevant sectors and land-use changes.
0
200
400
600
800
1000
1200
2005 2010 2020 2030 2040 2050
MtC
O2
e
Mexico CO2e
1a
1b
2a
2c
2d
2e
2f
2g0
500
1000
1500
2000
2500
2005 2010 2020 2030 2040 2050
Mt
CO
2e
Brazil CO2e
1a
1b
2a
2c
2d
2e
2f
2g
0
100
200
300
400
500
600
2020 2030 2040 2050
bil
lio
n U
SD
$2
00
5
Brazil - Policy Cost
Scenario 1a
Scenario 1b
Scenario 2a
Scenario 2c
Scenario 2d
Scenario 2e
Scenario 2f
Scenario 2g 0
100
200
300
400
500
600
700
2020 2030 2040 2050
bil
lio
n U
SD
$2
00
5
Mexico - Policy Cost
Scenario 1a
Scenario 1b
Scenario 2a
Scenario 2c
Scenario 2d
Scenario 2e
Scenario 2f
Scenario 2g

10
Figure 9 – Cumulative GDP losses in Brazil and Mexico under the climate policies from 2020 to 2050. Source: EPPA model results. 4.1. Energy consumption
In order to achieve emissions reductions, the countries can use less carbon intensive substitutes into their production and consumption activities, deploy new low-carbon technologies into their production processes and end-use, and/or reduce their overall consumption. An important share of the mitigation required will imply reduced energy consumption (Figures 10a and 10b). Compared to the reference scenario, in 2020 Brazil and Mexico reduce their primary energy use in similar shares of 4% and 14% for the low and high tax scenarios. By 2050, both countries needs to reduce its energy consumption in all scenarios between 10 and 13% for the less stringent scenario (low carbon tax) and 34 and 42% in the 2e scenario, for Brazil and Mexico, respectively. This with the exemption of the Copenhagen scenario where Brazil is allowed to increased its emissions after 2020. 4.2. Low-carbon electricity technologies deployment
As shown in Figure 10b, policy 2a (low carbon tax) implies primarily a reduction in total electricity generation in Mexico of 10% less than the baseline, by 2050. The policy also triggers a slightly higher penetration of wind energy in both countries, as shown in Figures 10a and 10b. For the rest of the scenarios, Brazil continues to use its hydropower and adds natural gas with CCS, and more wind. In contrast, for Mexico, the rest of the scenarios require important deployment of new technologies in the power sector as well as additional decrements in generation, which reduces almost by half for the high tax and stringent cap scenarios. For the high tax scenario and stringent caps, Mexico deploys natural gas and coal with CCS technologies by 2050. Both countries will need to fully decarbonize their electricity mix in the stringent cap scenario controlling only CO2 emissions (policy 2g).
It is worth mentioning that while we focus in the 2050 horizon in this paper, we estimated the scenarios results up to 2100 in order to allow future exercises in the integrated modeling system IGSM model, finding other technologies also playing a significant role later in the period. As population and economic trends push for more energy use while emissions are capped, the electric power sector starts transitioning to a more drastic change to low-carbon technologies in the second half of the century. After 2050, our results show a transition towards wind and solar technologies at fast pace under the stringent scenarios 2e and 2g, and their penetration increases also in all other scenarios. The later deployment of renewables in our modeling results obey to two sets of reasons. First, our model considers the costs of replacing the build infrastructure already in place in the different regions (in other words, it internalizes the costs of vintaged capital), as well as institutional costs that slow-down the penetration of new technologies in the model (as a function of installed capacity in the previous period). Second, the intermittent nature of

11
renewables in our model is taken care of by imposing a requirement of full back-up capacity for
Figure 10a: Mitigation in the electricity sector in the climate change policies scenarios in Brazil. Souce: EPPA model results.
0
0.5
1
1.5
2
2.5
3
3.5
4
4.5
5
2010 2020 2030 2040 2050
EJ
Brazil - Electricity 2a
0
0.5
1
1.5
2
2.5
3
3.5
4
4.5
2010 2020 2030 2040 2050
EJ
Brazil - Electricity 2c
0
0.5
1
1.5
2
2.5
3
3.5
4
4.5
2010 2020 2030 2040 2050
EJ
Brazil - Electricity 2d
0
0.5
1
1.5
2
2.5
3
3.5
4
4.5
2010 2020 2030 2040 2050
EJ
Brazil - Electricity 2e
0
0.5
1
1.5
2
2.5
3
3.5
4
4.5
2010 2020 2030 2040 2050
EJ
Brazil Electricity 2f
0
0.5
1
1.5
2
2.5
3
3.5
4
4.5
2010 2020 2030 2040 2050
EJ
Brazil Electricity 2g
0.000
0.500
1.000
1.500
2.000
2.500
3.000
3.500
4.000
4.500
5.000
2010 2020 2030 2040 2050
EJ
Brazil -Electricity 1b
0
0.5
1
1.5
2
2.5
3
3.5
4
4.5
2010
EJ
Secondary Energy|Electricity|Wind
Secondary Energy|Electricity|Solar
Secondary Energy|Electricity|Nuclear
Secondary Energy|Electricity|Biomass
Secondary Energy|Electricity|Gas|w/o CCS
Secondary Energy|Electricity|Hydro
Secondary Energy|Electricity|Gas|w/ CCS
Secondary Energy|Electricity|Oil
Secondary Energy|Electricity|Coal|w/o CCS
Secondary Energy|Electricity|Coal|w/ CCS

12
Figure 10b: Mitigation in the electricity sector in the climate change policies scenarios in Mexico. Souce: EPPA model results.
large-scale penetration of renewables, either with natural gas turbines or with bioelectricity plants, to account for reliability constraints. Thus, we find first a transition towards natural gas technologies and then the deployment of zero emissions technologies, primarily wind and solar. Current model developments include more detailed studies to better incorporate the operational constraints that renewables will bring to power
0
0.2
0.4
0.6
0.8
1
1.2
1.4
1.6
1.8
2
2010 2020 2030 2040 2050
EJ
Mexico - Electricity 2a
0
0.2
0.4
0.6
0.8
1
1.2
1.4
1.6
2010 2020 2030 2040 2050
EJ
Mexico - Electricity 2c
0
0.2
0.4
0.6
0.8
1
1.2
1.4
2010 2020 2030 2040 2050
EJ
Mexico - Electricity 2d
0
0.2
0.4
0.6
0.8
1
1.2
2010 2020 2030 2040 2050
EJ
Mexico -Electricity 2e
0
0.2
0.4
0.6
0.8
1
1.2
2010 2020 2030 2040 2050
EJ
Mexico Electricity 2f
0
0.2
0.4
0.6
0.8
1
1.2
2010 2020 2030 2040 2050
EJ
Mexico Electricity 2g
0.000
0.200
0.400
0.600
0.800
1.000
1.200
1.400
2010 2020 2030 2040 2050
EJ
Mexico -Electricity 1b
0
0.2
0.4
0.6
0.8
1
1.2
EJ
Secondary Energy|Electricity|Wind
Secondary Energy|Electricity|Solar
Secondary Energy|Electricity|Hydro
Secondary Energy|Electricity|Nuclear
Secondary Energy|Electricity|Biomass
Secondary Energy|Electricity|Gas|w/o CCS
Secondary Energy|Electricity|Gas|w/ CCS
Secondary Energy|Electricity|Oil
Secondary Energy|Electricity|Coal|w/o CCS
Secondary Energy|Electricity|Coal|w/ CCS

13
systems with large-scale penetration of renewables, and the need of flexibility options such as storage technologies and transmission and distribution networks (Octaviano et al., forthcoming). We expect that if economically available, these supporting infrastructure for renewables that reduces the problems of intermittency, could bring these technologies earlier into the power mix under climate policy.
4.3. Land-use changes A careful analysis of changes in land-use driven by climate policy is of the utmost importance in the
region. While agriculture contributed with 5% and 3% of total GDP of Brazil and Mexico in 2010, the population working on this sector is 17% and 13% in Brazil and Mexico. An important number of the vulnerable population in these countries, including poor households and indigenous communities, depend on this activity. Thus, the consequences for farmers and communities in Brazil and Mexico are logically of special concern for policy design. In addition to providing important ecosystem services including carbon sequestration, the forests and special ecosystems in Brazil and Mexico, have a critical value for their biodiversity; both Brazil and Mexico are among the 17 megadiverse countries of the world (Groombridge, 1994). In the past, economic growth has driven an expansion of agriculture and pasture, at the expense of forests and other ecosystems. Our economic modeling provides a high-level analysis of economic incentives that will drive land conversion under climate policies. Figure 11 shows EPPA model estimates for land uses in Brazil and Mexico, as a result of expected land conversion.
Figure 11 – Land Use in Brazil and Mexico in the Reference Scenario (1b). Souce: EPPA model results.
For our baseline scenario, we consider the policies that Brazil and Mexico have implemented to
reduce deforestation. For Brazil, total land-use emissions are maintain to the level in 2005. Total cropland still expands, in order to meet food demand and biofuels production; total land cover for crops expands from 8 to 22%. This expansion comes from conversion of other arable land (6%) and forests (8%). Pasture also expands from 17 to 19%, at the expense of forests. While Mexico has implemented policies to slow down deforestation rates in the country, it still experiences high deforestation rates. Without further policy efforts, we expect Mexico could decrease from 38% of land cover in forest to 20% by the end of the century, expanding agriculture from 19 to 32%, and decreasing pasture from 47 to 42%. In addition to impacts in deforestation, an important land use change driver is the use of bioenergy. In our reference scenario, we include the biofuels mandate implemented in 2010 by the US and the European Union, as well as the current policies to incentivize the use of biofuels in Brazil. For Brazil, the two tax scenarios increase the production of bioenergy, while the two cap scenarios decrease it compared to the reference; for Mexico biofuels production increases in all scenarios (but remain relatively small given low flex-fuel fleet in the country).
0
100
200
300
400
500
600
700
800
900
2010 2020 2030 2040 2050
mil
lio
n H
a/y
ea
r
Brazil - Land Cover
Land Cover|Pasture
Land Cover|Other
Land
Land Cover|Other
Arable Land
Land Cover|Forest
Land Cover|Cropland
0
50
100
150
200
250
2010 2020 2030 2040 2050
mil
lio
n H
a/y
r
Mexico- Land Cover
Land Cover|Pasture
Land Cover|Other
Land
Land Cover|Other
Arable Land
Land Cover|Forest
Land
Cover|Cropland
14
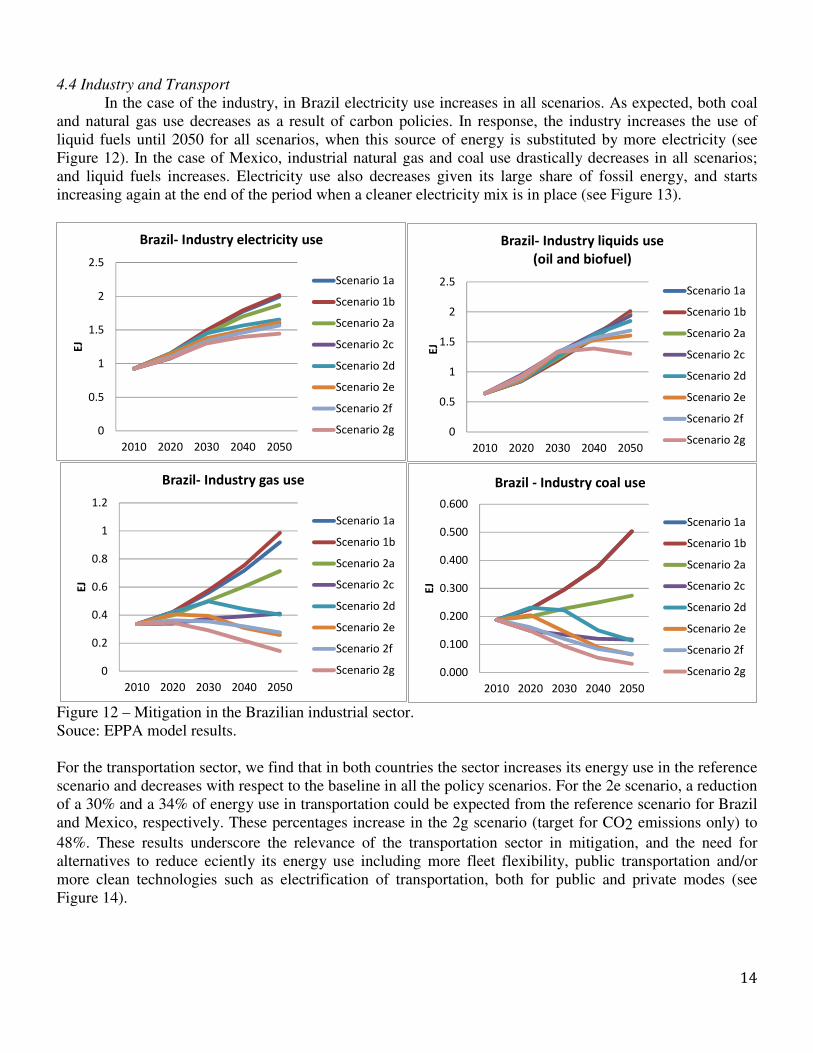
4.4 Industry and Transport In the case of the industry, in Brazil electricity use increases in all scenarios. As expected, both coal
and natural gas use decreases as a result of carbon policies. In response, the industry increases the use of liquid fuels until 2050 for all scenarios, when this source of energy is substituted by more electricity (see Figure 12). In the case of Mexico, industrial natural gas and coal use drastically decreases in all scenarios; and liquid fuels increases. Electricity use also decreases given its large share of fossil energy, and starts increasing again at the end of the period when a cleaner electricity mix is in place (see Figure 13).
Figure 12 – Mitigation in the Brazilian industrial sector. Souce: EPPA model results. For the transportation sector, we find that in both countries the sector increases its energy use in the reference scenario and decreases with respect to the baseline in all the policy scenarios. For the 2e scenario, a reduction of a 30% and a 34% of energy use in transportation could be expected from the reference scenario for Brazil and Mexico, respectively. These percentages increase in the 2g scenario (target for CO2 emissions only) to 48%. These results underscore the relevance of the transportation sector in mitigation, and the need for alternatives to reduce eciently its energy use including more fleet flexibility, public transportation and/or more clean technologies such as electrification of transportation, both for public and private modes (see Figure 14).
0
0.5
1
1.5
2
2.5
2010 2020 2030 2040 2050
EJ
Brazil- Industry electricity use
Scenario 1a
Scenario 1b
Scenario 2a
Scenario 2c
Scenario 2d
Scenario 2e
Scenario 2f
Scenario 2g
0
0.2
0.4
0.6
0.8
1
1.2
2010 2020 2030 2040 2050
EJ
Brazil- Industry gas use
Scenario 1a
Scenario 1b
Scenario 2a
Scenario 2c
Scenario 2d
Scenario 2e
Scenario 2f
Scenario 2g
0
0.5
1
1.5
2
2.5
2010 2020 2030 2040 2050
EJ
Brazil- Industry liquids use
(oil and biofuel)
Scenario 1a
Scenario 1b
Scenario 2a
Scenario 2c
Scenario 2d
Scenario 2e
Scenario 2f
Scenario 2g
0.000
0.100
0.200
0.300
0.400
0.500
0.600
2010 2020 2030 2040 2050
EJ
Brazil - Industry coal use
Scenario 1a
Scenario 1b
Scenario 2a
Scenario 2c
Scenario 2d
Scenario 2e
Scenario 2f
Scenario 2g

15
Figure 13 – Mitigation in the Mexican industrial sector. Souce: EPPA model results.
Figure 14 – Energy use in the transportation sector in the alternative scenarios in Brazil and Mexico. Souce: EPPA model results.
4.5 Energy Trade
International trade of energy products is an important consideration in evaluating climate policy. In the case of oil trade, both Mexico and Brazil are currently experiencing profound changes in their oil sector,
0
0.1
0.2
0.3
0.4
0.5
0.6
0.7
0.8
2010 2020 2030 2040 2050
EJ
Mexico - Industry electricity use
Scenario 1a
Scenario 1b
Scenario 2a
Scenario 2c
Scenario 2d
Scenario 2e
Scenario 2f
Scenario 2g
0
0.1
0.2
0.3
0.4
0.5
0.6
0.7
0.8
2010 2020 2030 2040 2050
EJ
Mexico - Industry gas use
Scenario 1a
Scenario 1b
Scenario 2a
Scenario 2c
Scenario 2d
Scenario 2e
Scenario 2f
Scenario 2g
0
0.0002
0.0004
0.0006
0.0008
0.001
0.0012
0.0014
0.0016
2010 2020 2030 2040 2050
EJ
Mexico - Industry liquids use
(oil and biofuel)
Scenario 1a
Scenario 1b
Scenario 2a
Scenario 2c
Scenario 2d
Scenario 2e
Scenario 2f
Scenario 2g
0
0.001
0.002
0.003
0.004
0.005
0.006
2010 2020 2030 2040 2050
EJ
Mexico - Industry coal use
Scenario 1a
Scenario 1b
Scenario 2a
Scenario 2c
Scenario 2d
Scenario 2e
Scenario 2f
Scenario 2g

16
although the two defer in the state of development of their petroleum industries. While Mexico has been exploiting oil resources for international trade since the 1970’s, Brazil has only recently started to be almost self-sufficient in terms of oil and analysts and policy makers in the country expect Brazil to become an important oil exporter in the Americas, following its developments in deepwater sites (IEA, 2014, 2013; BP, 2014) . In the case of Mexico, its main oil fields appear to have reached maturity; this situation has resulted in a milestone energy reform to canalize private investment in order to revitalize the oil industry, after the alarming decay of key oil fields. Manifold uncertainties surround the future development of the oil industry in both countries. New institutional arrangements to provide incentives for adequate levels of investment are needed. Also inherent technological challenges of the exploitation of more complex formations onshore and in the deep ocean are to be taken into account when projecting the development of these markets. In our reference scenario, we consider that both countries will be able to revitalize and consolidate their oil industries, and thus remain being oil exporters. Following the IEA projection for Mexico, we consider that, despite recent declines in exports, by 2020 the country will recover production levels of 2.9 mbd (IEA, 2014). In the case of Brazil, we consider 3 mbd production by 2020, also in accordance with (IEA, 2014).
Figure 15 presents oil exports for Mexico and Brazil, respectively, with and without climate policy considering this positive production scenario. The most stringent climate policy for the energy sector (2g scenario) results in reduced oil exports for Mexico of 13% from the reference scenario and 47% for Brazil. With and without policy oil exports peak in the 2030s for both countries. In the case of Brazil, production grows but exports start declining as domestic production is used to meet fast-growing oil demand. Reduced exports respond to a contraction in economic activity internationally resulting from carbon policy; oil resources get exported at a slower rate as all countries try to switch away from fossil energy when there is a price on carbon. Thus, results suggests that policy scenarios might influence how fast these resources could be developed, with implications on investments in energy infrastructure.
Figure 15 – Oil Exports. Source: EPPA model results and historical data.
In addition to oil exports, we find that Brazil increases its biofuel exports in all scenarios, particularly
under the tax scenarios, however even in the stringent policy scenario biofuel exports are about 0.2 EJ indicating that with the policies modeled we do not expect biofuels to play a major role in energy exports (see Figure 16).
Regarding energy imports, in the reference scenario both countries are net importers of refined oil products and coal, as shown in Figures 17 and 18. Under climate policy, for all scenarios Brazil eliminates coal imports and substitutes for natural gas. Brazil also increases its imports of refined oil products

17
particularly in 2050, when we expect domestic demand to be higher than national oil production. In the case of Mexico, coal imports are generally low (below 0.01 EJ in most scenarios), but increase in some scenarios as a result of its use in the power sector along with CCS technologies.
Figure 16 – Biofuel exports from Brazil. Source: EPPA model results.
Figure 17 – Energy imports in Brazil Source: EPPA model results.
Natural gas is of strategic importance in Mexico as it’s expected to meet most of the power sector energy demand and is also important for industrial use (see 4.2 and 4.4), thus we describe in some detail our modeling assumptions for this fuel. In 2010, domestic demand for natural gas in Mexico was 6,341 million cubic feet per day (mmcfd) and production 5,004 mmcdd, resulting in total imports of 1458 mmcdd (SENER, 2013). Demand and production estimates in EPPA are 10% higher than historical figures in 2010, with the same level of imports (See Figure 16). The Mexican government estimates that, by 2027, Mexico will reach a production of 6,848 mmcfd (the EPPA estimate for 2025 is 6,721). Using this baseline data by 2050, EPPA estimate of Mexico’s domestic production of natural gas is 12,552 mmcfd, requiring additional 2,117 imports mmcfd to satisfy demand in that year. In order to maintain imports below this level (between 14 and 20% of total demand) domestic production in the country needs to keep a fast-paced growth matching demand trends (see Figure 19). We consider for our reference case that domestic production of natural gas will be developed
0
0.05
0.1
0.15
0.2
0.25
2010 2020 2030 2040 2050
EJ
Brazil Biofuel Trade
1a
1b
2a
2c
2d
2e
2f
2g
0.00
0.05
0.10
0.15
0.20
0.25
2020 2030 2040 2050
EJ
Brazil Coal Imports
1a
1b
2a
2c
2d
2e
2f
-0.20
0.00
0.20
0.40
0.60
0.80
2020 2030 2040 2050
EJ
Brazil Refined Oil Imports
1a
1b
2a
2c
2d
2e
2f

18
to meet demand. If policies are not put in place to canalize investment to develop local resources and the supporting infrastructure1, imports will grow faster than the reference case presented by EPPA (up to the gap existing between the demand estimate and realized production). Our modeling results show that in the case of stringent climate policy (scenario 2g), natural gas imports decrease 48% from reference, as a result of induced energy eciency and a decreased of economic activity domestically and internationally that results from climate policy.
Figure 18 – Energy imports in Mexico. Source: EPPA model results.
Figure 19 –Mexico natural gas market. Source: EPPA model results and historical data.
1Currently, Mexico has been experiencing acute infrastructure bottlenecks that have increased the imports of natural gas. In 2010, about 47% of the imports were identify by the Ministry of Energy as “logistic-imports” meaning those required due to lack of pipelines and other infrastructure to use local resources (See SENER (2013)).
0.00
0.01
0.01
0.02
0.02
2020 2030 2040 2050
EJ
Mexico Coal Imports
1a
1b
2a
2c
2d
2e
2f0.00
0.10
0.20
0.30
0.40
0.50
0.60
0.70
0.80
2020 2030 2040 2050
EJ
Mexico Refined Oil Imports
1a
1b
2a
2c
2d
2e
2f
19
It is worth mentioning that without investments in oil and gas resources, both Mexico and Brazil could substantially increase its imports of both energy resources. Due to the above mentioned technological and institutional uncertainties, the risks involved in developing fossil energy adds an important consideration to investing in energy diversification, such as renewables. Mexico, unlike Brazil that can rely in its hydro power resources for electricity generation, will have to heavily rely on imports of natural gas if local resources remain dicult to tap. In addition, if energy investment into oil exploration and exploitation is not timely, or if it results unsuccessful for technical reasons, both countries will be importing oil to satisfy the growing demand for transportation and industrial uses. The risks involved in the development of these resources should be considered when crafting climate policy.
5. Conclusions
GHG emission reduction requires substantial changes in energy and land use practices. Because of a global nature of GHG impacts, a successful agreement to limit climate change needs a global participation. Mitigation by even the largest emitters alone would not solve the problem (Reilly et al., 2012), therefore, actions are needed from all emitters. So far, international climate negotiations face a challenge of finding a “fair” scheme for individual country’s contributions to GHG emission reduction at a global level. There are numerous proposals for burden sharing (IPCC, 2014) that look at equal percentage, equal marginal cost or same carbon price among the countries. Studies have shown that a global carbon tax or cap-and-trade system is an efficient way to reduce emissions. However, recent approaches, discussed at the UN conferences in Copenhagen (UN, 2009) and Cancun (UN, 2010), focus on national plans that are very different from country to country. In our study we evaluated the options and implications for the two largest Latin American economies: Brazil and Mexico. We found that because energy and land use mixes in these two countries are very different, same carbon prices and emission caps lead to very different policy costs, namely cumulative costs in Mexico are about twice as high as in Brazil. Another difference is that Mexico’s major source of GHG emissions comes from energy, while in Brazil agricultural activities are responsible for a largest share. Therefore, a policy that targets only energy emissions would miss many other sources in Brazil. Energy efficiency plays an important role in mitigation scenarios for both countries. Energy and electricity uses are reduced in all policy scenarios in comparison to a no-policy scenario. In electricity sector, Brazil continues to rely on hydropower with some additional wind and natural gas with CCS, while Mexico employs CCS substantially on fossil-based electricity.
Land-use emissions policies are important to consider in both countries. In Brazil, a successful story of dramatic reduction in deforestation between 2005 and 2010 should be maintained. Mexico should use Brazil’s example of deforestation control to reduce its land use emissions. While Brazil and Mexico’s emissions are not among the largest in the world, their contribution to GHG emissions mitigation are extremely important. First, these countries are key leaders among the middle-income countries that play an important role of engaging developing world in a climate negotiation process. Second, reaching substantial reductions required for eliminating the worst potential consequences of future climate change, need participation from every country. Third, a reduction in fossil fuels also has substantial pollution reduction benefits. Our study confirms that climate policy designs chosen by Brazil and Mexico and proposed in Copenhagen and Cancun are solid steps in a right direction. Continuing with developing their own strategies that fits their countries’ energy and land use composition better is a wise policy that should be maintained. Our study illustrates the challenges that lie ahead in the process of further GHG mitigation in Mexico and Brazil.
Acknowledgments
The authors gratefully acknowledge the financial support for this work provided by the Mario Molina Center, the National Council for Science and Technology of Mexico (CONACYT) and the National Council for Research of Brazil (CNPq). The MIT Emissions Prediction and Policy Analysis (EPPA) model is
20
supported by a consortium of government, industry, and foundations sponsors of the MIT Joint Program on the Science and Policy of Global Change, including the U.S. Department of Energy, Oce of Science (DE-FG02-94ER61937). (For a complete list of sponsors, see: http://globalchange.mit.edu/sponsors/all)
References
BP. British Petroleum Energy Outlook 2035. 2014. Available at: http://www.bp.com/en/global/corporate/about-bp/energy-economics/energy-outlook/countryand-regional-insights/brazil-insights.html.
Brazil. Estimativas anuais de emissões de gases de efeito estufa. Ministério da Ciência, Tecnologia e Inovação, Brasília, 2013.
Dimaranan, B., Mcdougall, R. Global trade, assistance, and production: the GTAP 5 Data Base. West Lafayette: Center for Global Trade Analysis, Purdue University, 2002.
Groombridge, B. E. Biodiversity Data Sourcebook. WCMC Biodiversity Series No 1. World Conservation Monitor Centre. The World Conservation Union, United Nations Environment Programme, World Wide Fund for Nature. World Conservation Press. 1994
Gurgel, A., Reilly, J., Paltsev, S. Potential land use implications of a global biofuels industry. Journal of Agricultural & Food Industrial Organization. v. 5, p.9 - , 2007.
Gurgel, A. C., Paltsev, S. Costs of reducing GHG emissions in Brazil. Climate Policy, v. 14, p. 209 - 223, 2014.
Hertel, T. Global trade analysis: modeling and Applications. Cambridge: Cambridge University Press, 1997. Hyman, R., Reilly, J., Babiker, M., Masin, A. V. D., Jacoby, H. Modeling non-co2 greenhouse gas
abatement. Environmental Modeling and Assessment. v. 8, n. 3, p. 175 – 186.2003. IEA. World Energy Outlook 2013. International Energy Agency. 2013. IEA. Medium-Term Oil Market Report 2014. Market Analysis and Forecasts to 2019. 2014. IEA. Ministerio de Minas e Energia and Empresa de Pesquisa Energetica. Balanco Energetico Nacional 2013.
2013. Morris, J., Reilly, J., Paltsev, S. Combining a renewable portfolio standard with a cap-and-trade policy: A
general equilibrium analysis. MIT Joint Program on the Science and Policy of Global Change. Report 187. 2010.
Octaviano, C., Ignacio, P., Reilly, J. The value of electricity storage: a hybrid modeling approach. Forthcoming.
Paltsev, S., Reilly, J., Jacoby, H., Eckhaus, R., McFarland, J., Saforim, M., Asadoorian, M., Babiker, M., The MIT Emission Prediction and Policy Analysis (EPPA) model: version 4. Report: no. 125. Cambridge, MA: MIT Joint Program on the Science and Policy of Global Change. 2005.
Reilly, J. M., Paltsev, S., Strzepek, K., Selin, N. E., Cai, Y., Nam, K. M., Monier, E., Dutkiewicz, S., Scott, J., Webster, M., Sokolov, A. Valuating climate impacts in integrated assessment models: the MIT IGSM. Climatic Change, v 117, n. 3, p. 561-573, 2013.
SEMARNAT. Inventario Nacional de Emisiones de Gases de Efecto Invernadero 1990-2010. Secretaria de Medio Ambiente y Recursos Naturales, 2013.
SENER. Prospectiva de Gas Natural y Gas L.P. Secretaria de Energia. 2013. UN. Copenhagen Accord. United Nations Framework Convention on Climate Change. 2009. UN. Cancun Agreements. United Nations Framework Convention on Climate Change, 2010. Available at:
http://cancun.unfccc.int/. UN. World Population Prospects: The 2012 Revision. Population Division, United Nations Department of
Economic and Social Affairs, 2013. Available at: http://esa.un.org/unpd/wpp/Excel-Data/population.htm. WB. World Development Indicators. The World Bank, 2014. Available at:
http://data.worldbank.org/country/brazil