climate change impacts in the united states this section is mainly from: global climate change...
TRANSCRIPT
Climate Change Impacts in the United States
This section is mainly from: Global Climate Change Impacts in the United States,U.S. Global Change Research Program, Cambridge University Press, 2009.

General National Impacts
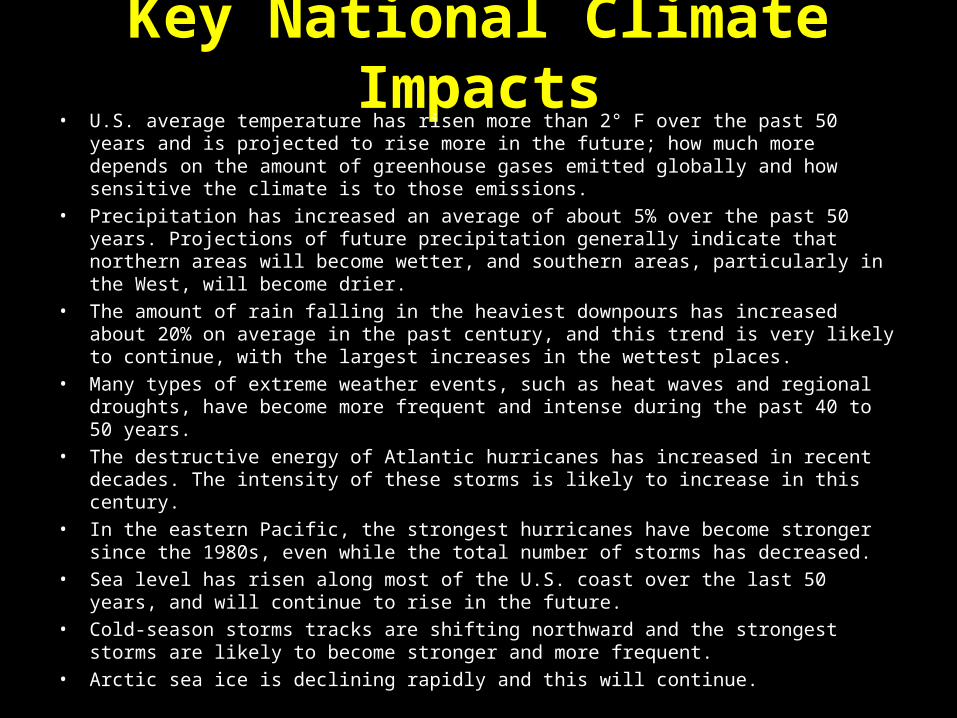
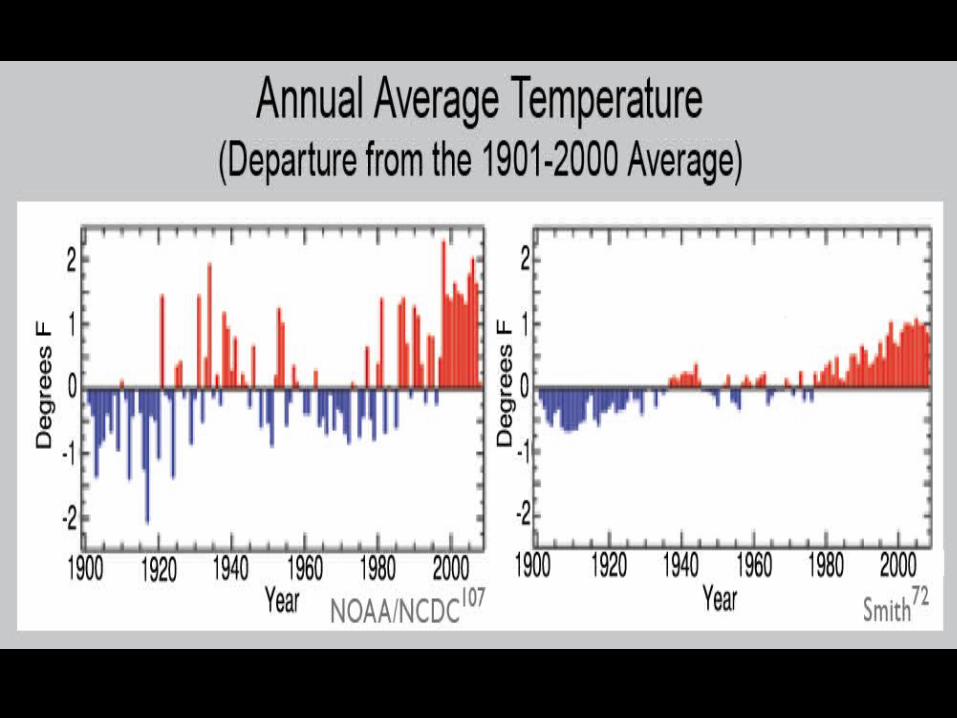
Key National Climate Impacts• U.S. average temperature has risen more than 2° F over the past 50 years and is projected to
rise more in the future; how much more depends on the amount of greenhouse gases emitted globally and how sensitive the climate is to those emissions.
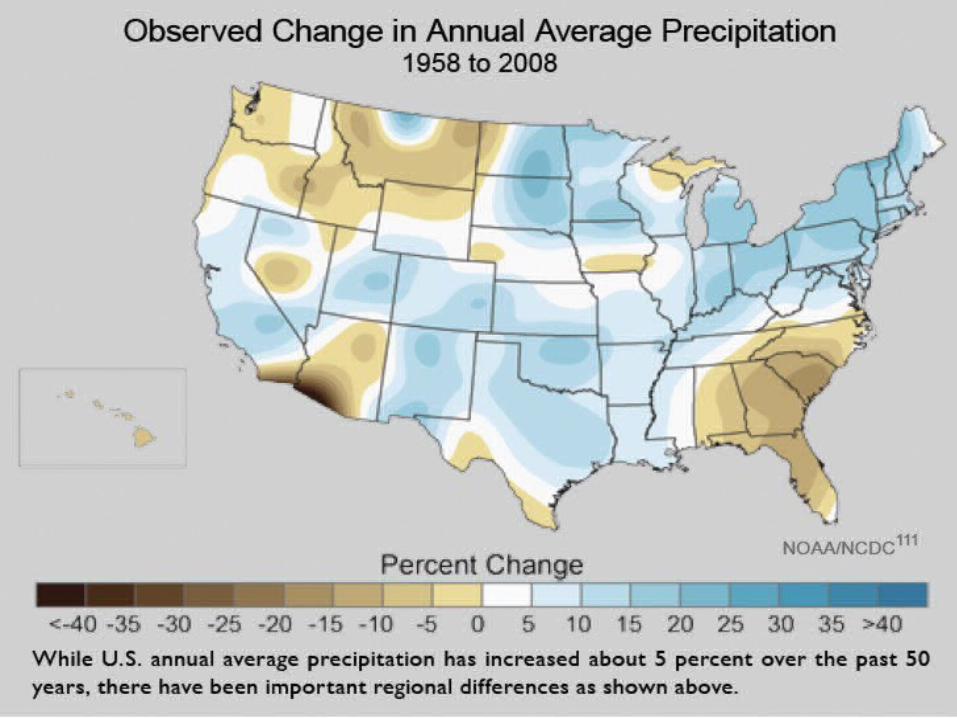
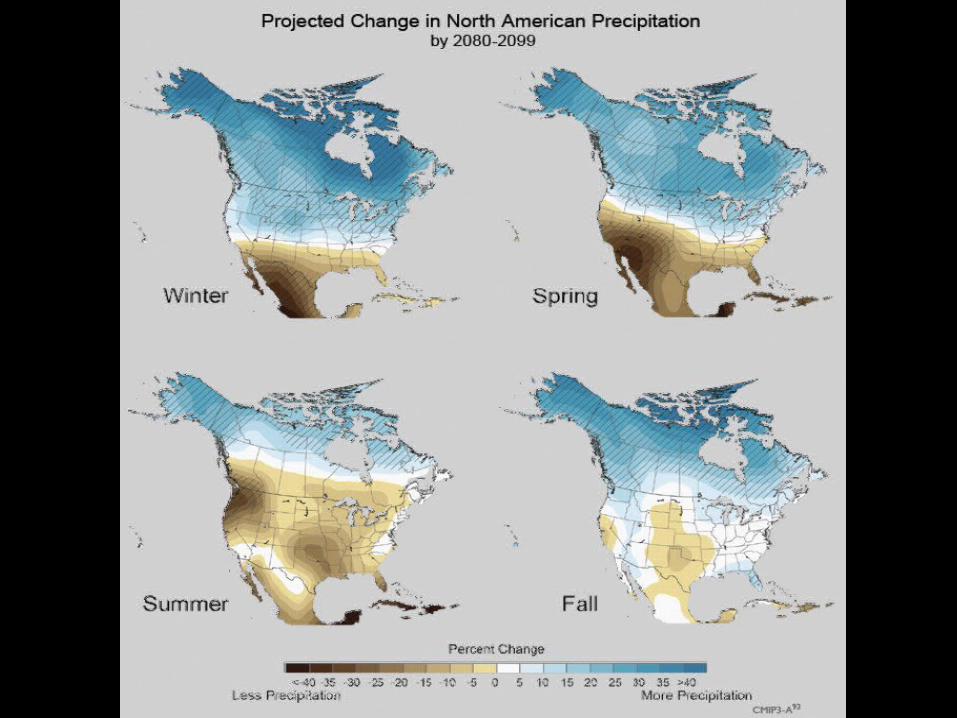
• Precipitation has increased an average of about 5% over the past 50 years. Projections of future precipitation generally indicate that northern areas will become wetter, and southern areas, particularly in the West, will become drier.
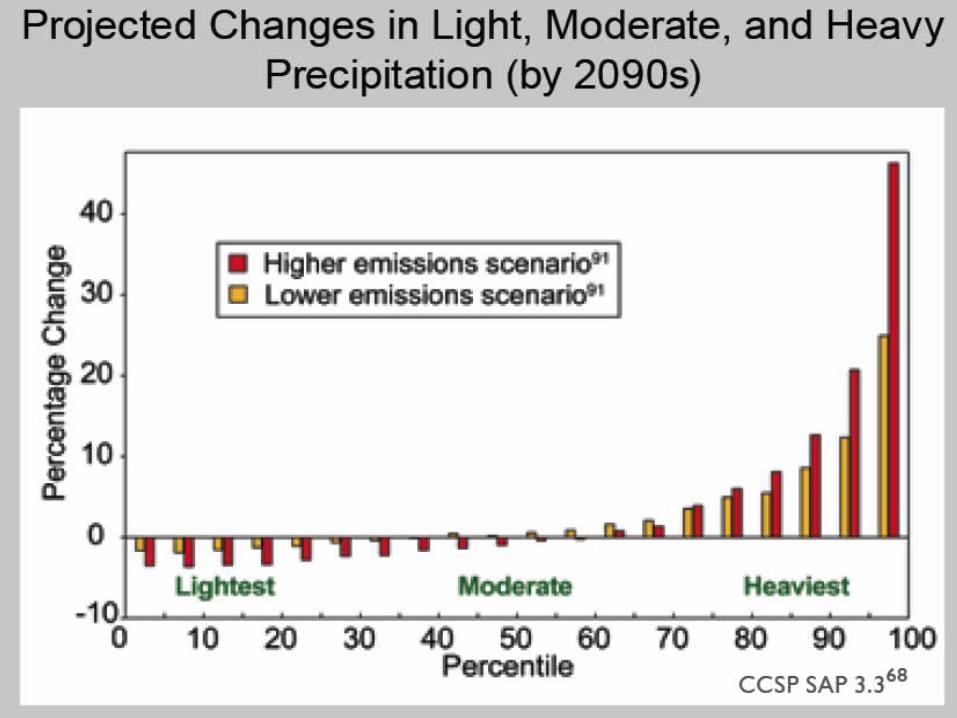
• The amount of rain falling in the heaviest downpours has increased about 20% on average in the past century, and this trend is very likely to continue, with the largest increases in the wettest places.
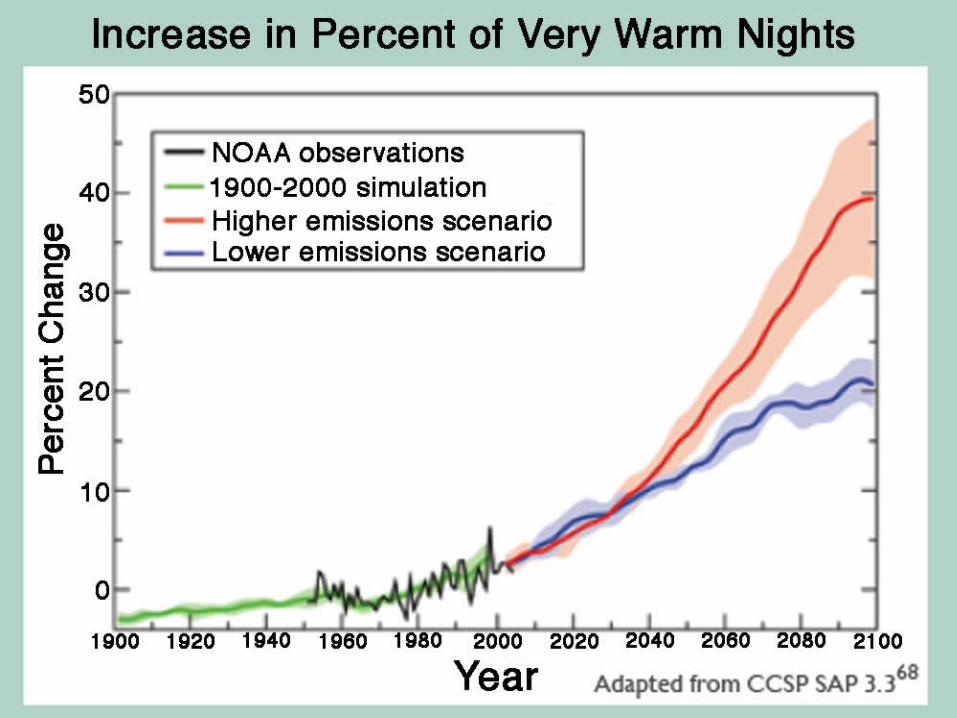
• Many types of extreme weather events, such as heat waves and regional droughts, have become more frequent and intense during the past 40 to 50 years.
• The destructive energy of Atlantic hurricanes has increased in recent decades. The intensity of these storms is likely to increase in this century.
• In the eastern Pacific, the strongest hurricanes have become stronger since the 1980s, even while the total number of storms has decreased.
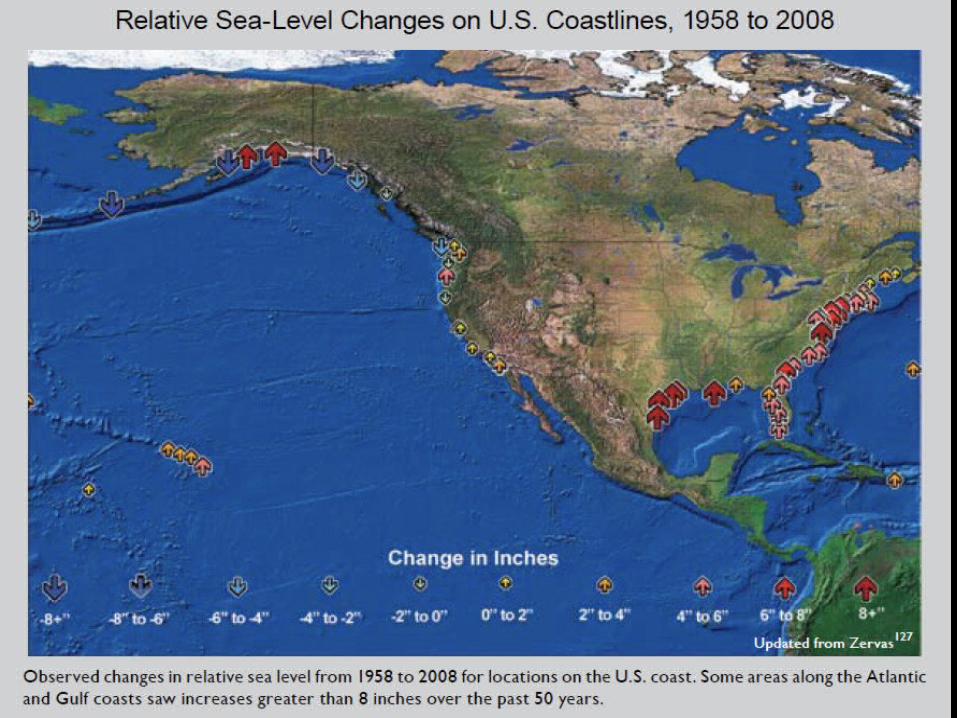
• Sea level has risen along most of the U.S. coast over the last 50 years, and will continue to rise in the future.
• Cold-season storms tracks are shifting northward and the strongest storms are likely to become stronger and more frequent.
• Arctic sea ice is declining rapidly and this will continue.

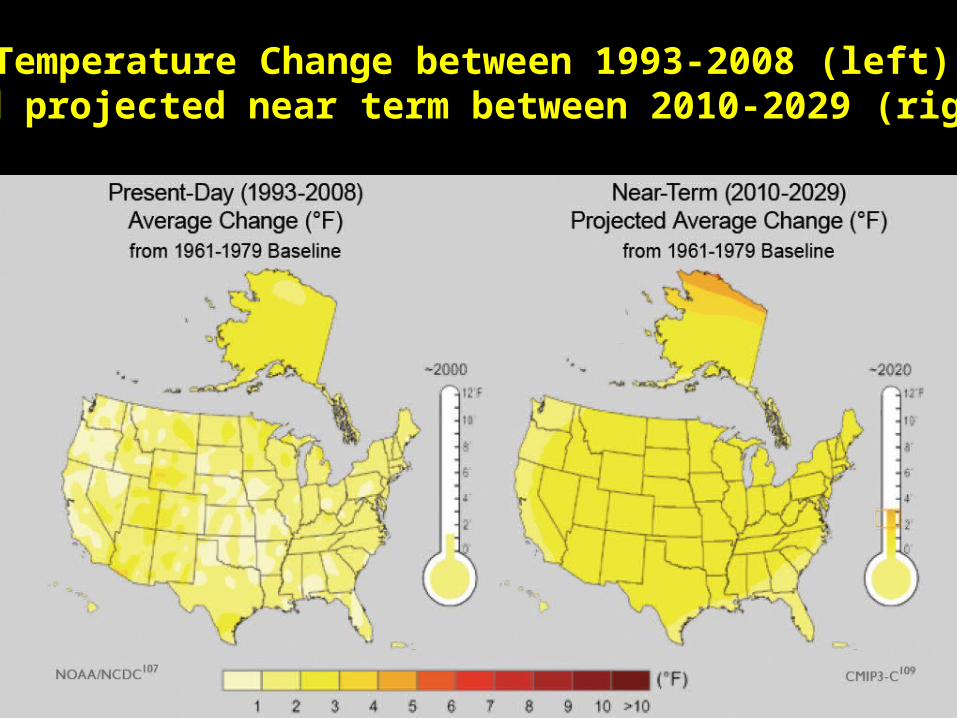
Temperature Change between 1993-2008 (left),and projected near term between 2010-2029 (right)
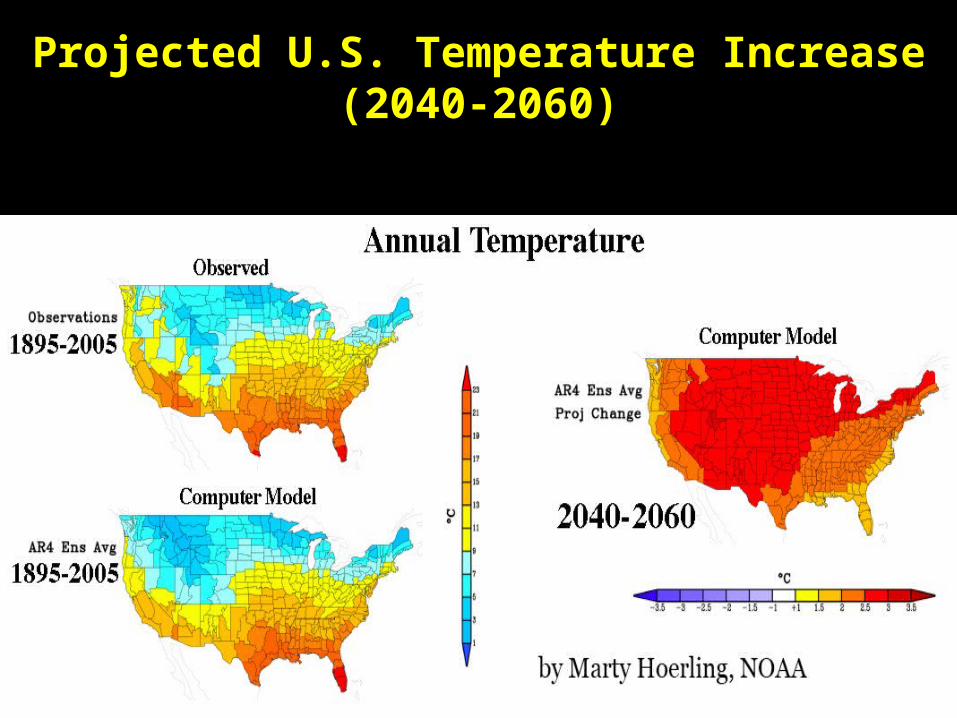
Projected U.S. Temperature Increase (2040-2060)
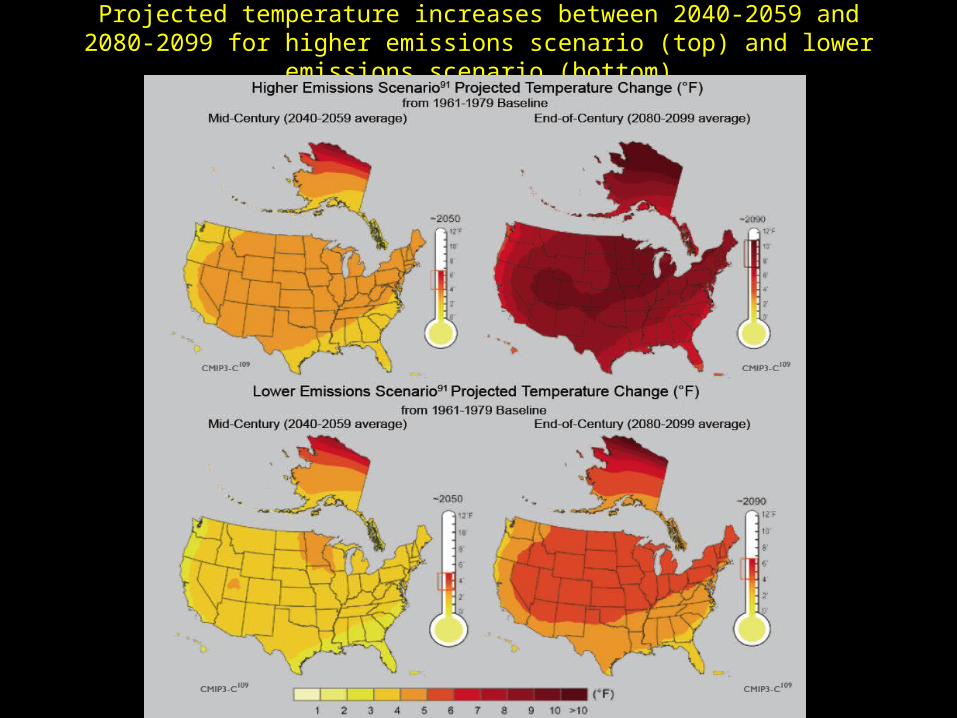
Projected temperature increases between 2040-2059 and 2080-2099 for higher emissions scenario (top) and lower emissions scenario (bottom)
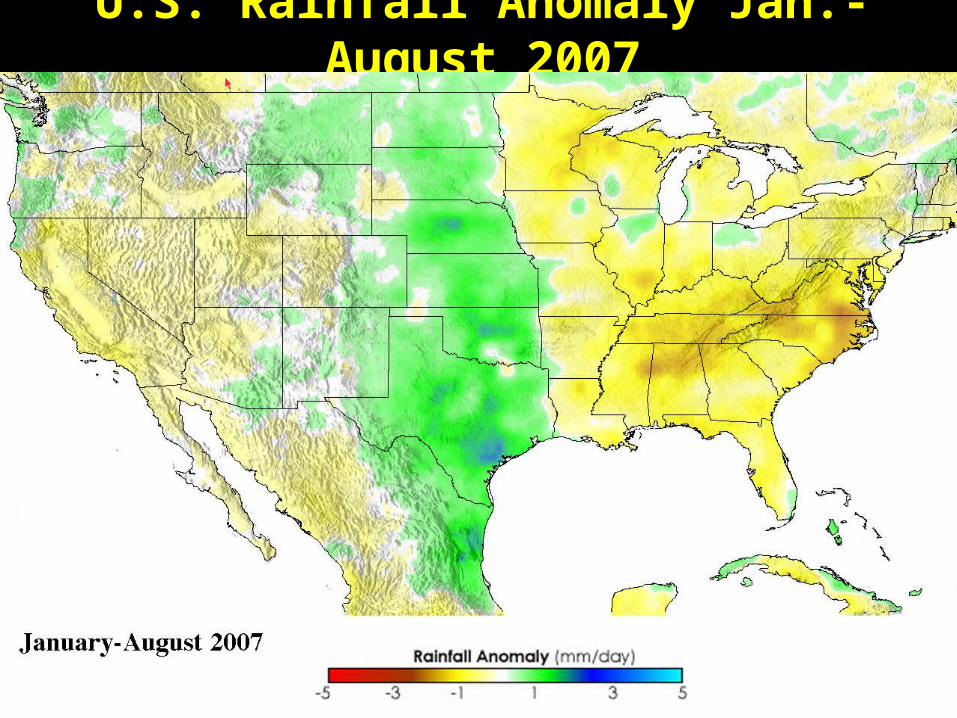
U.S. Rainfall Anomaly Jan.-August 2007
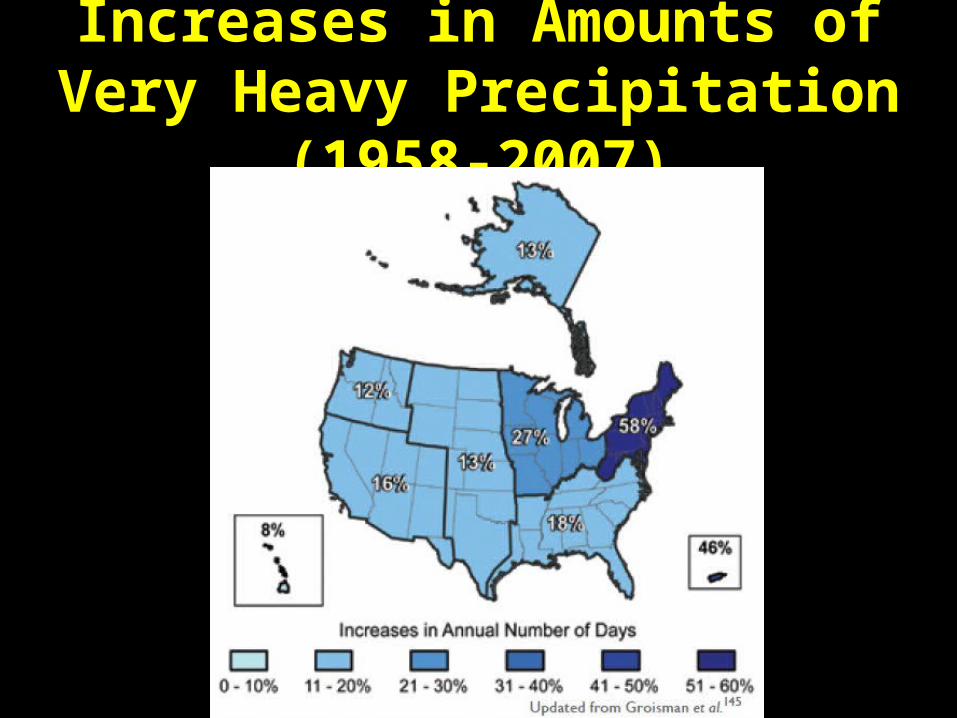
Increases in Amounts of Very Heavy Precipitation (1958-2007)
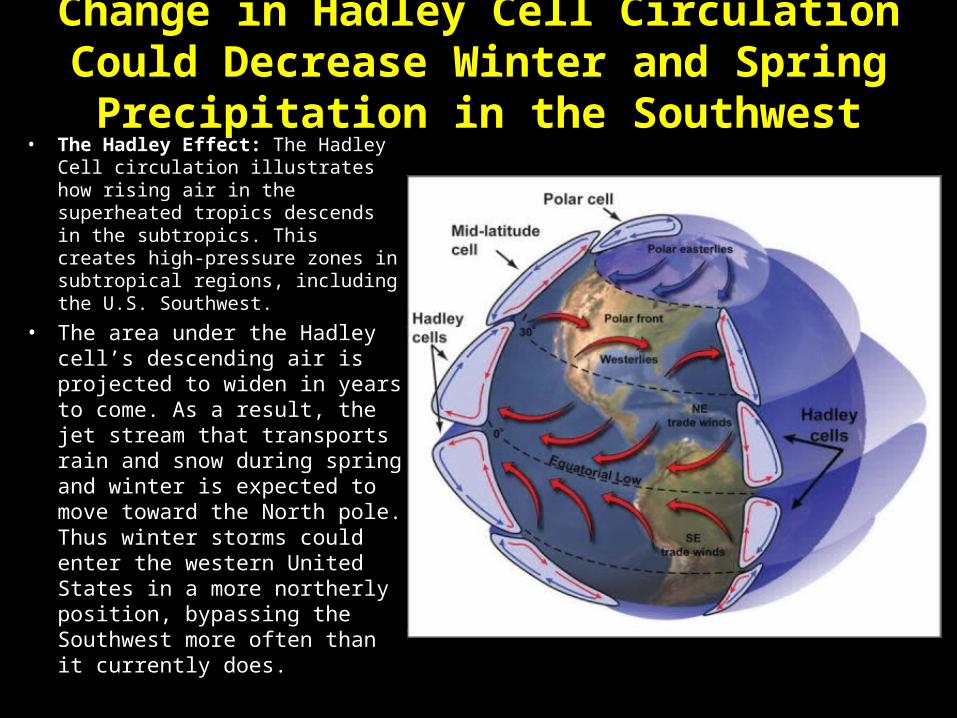
Change in Hadley Cell Circulation Could Decrease Winter and Spring Precipitation in the Southwest
• The Hadley Effect: The Hadley Cell circulation illustrates how rising air in the superheated tropics descends in the subtropics. This creates high-pressure zones in subtropical regions, including the U.S. Southwest.
• The area under the Hadley cell’s descending air is projected to widen in years to come. As a result, the jet stream that transports rain and snow during spring and winter is expected to move toward the North pole. Thus winter storms could enter the western United States in a more northerly position, bypassing the Southwest more often than it currently does.
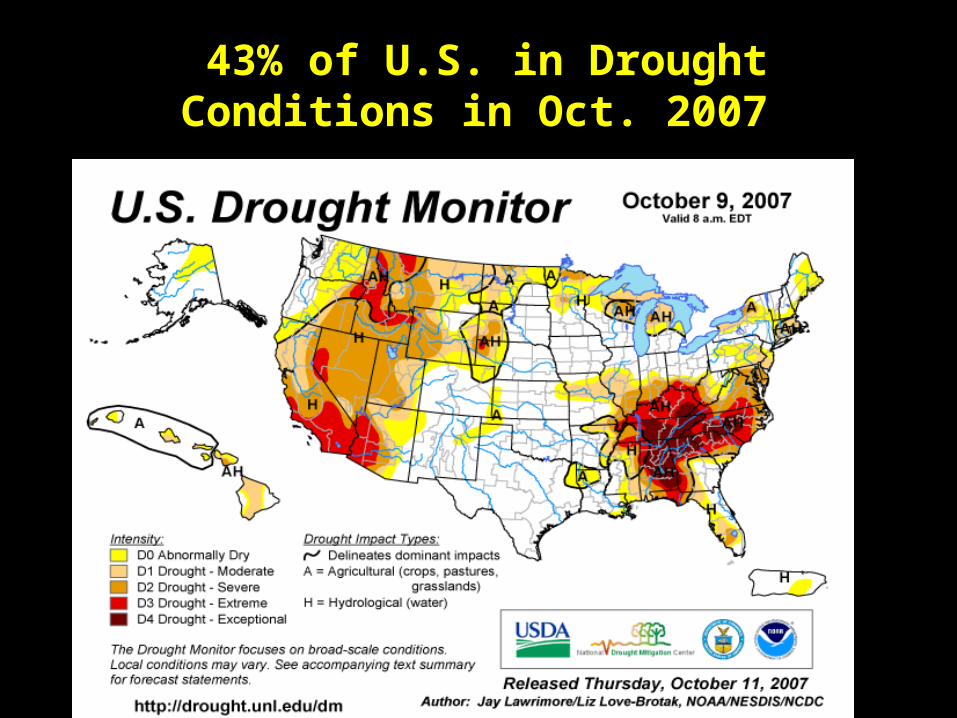
43% of U.S. in Drought Conditions in Oct. 2007
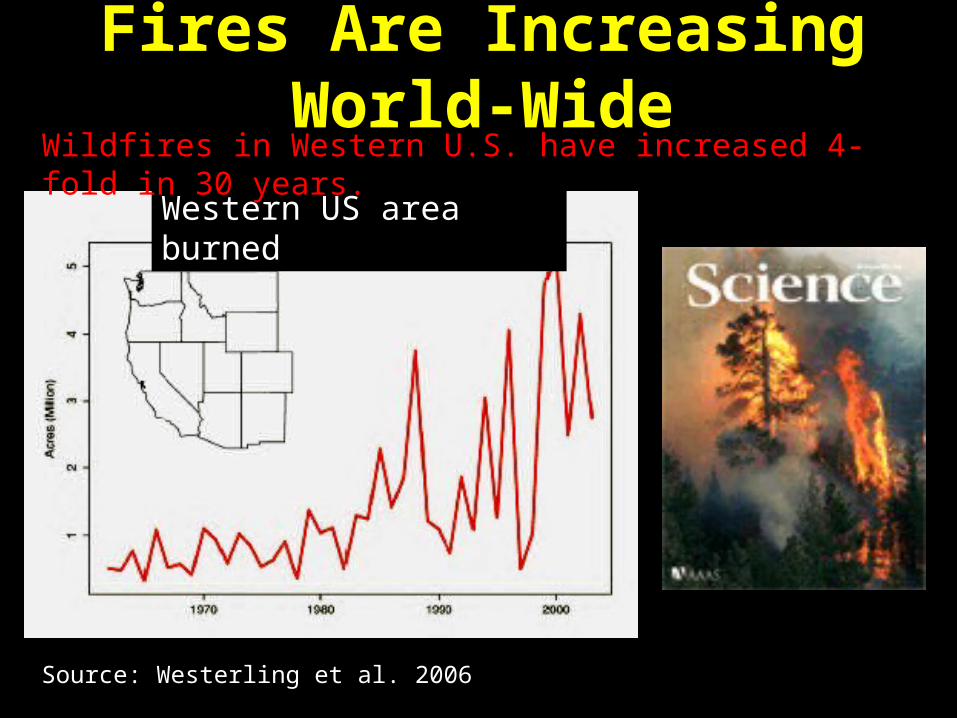
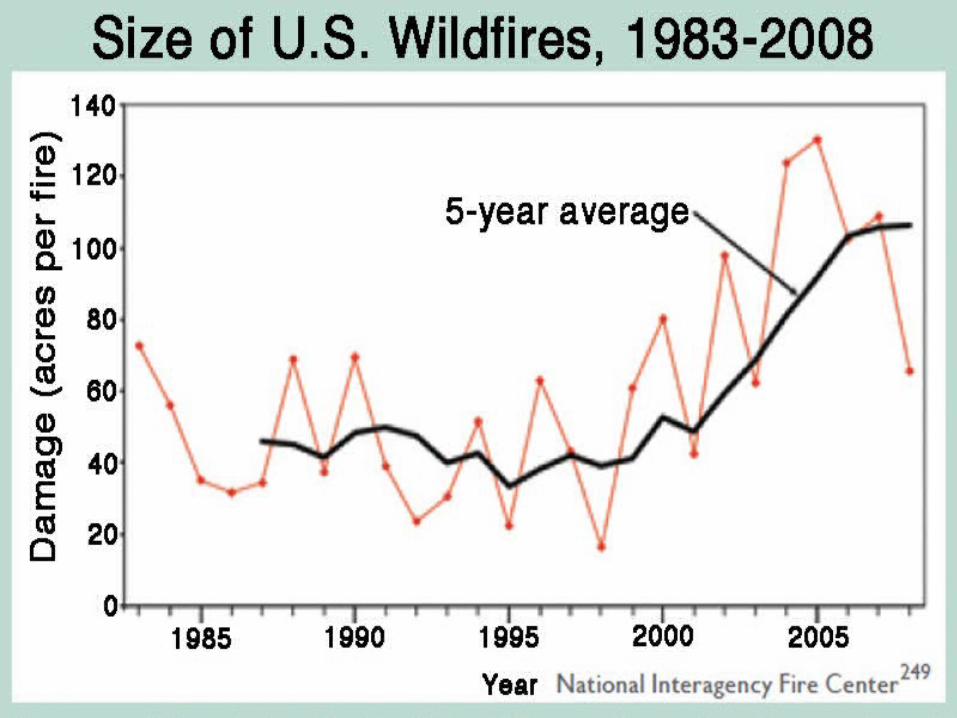
Fires Are Increasing World-Wide
Source: Westerling et al. 2006
Western US area burned
Wildfires in Western U.S. have increased 4-fold in 30 years.
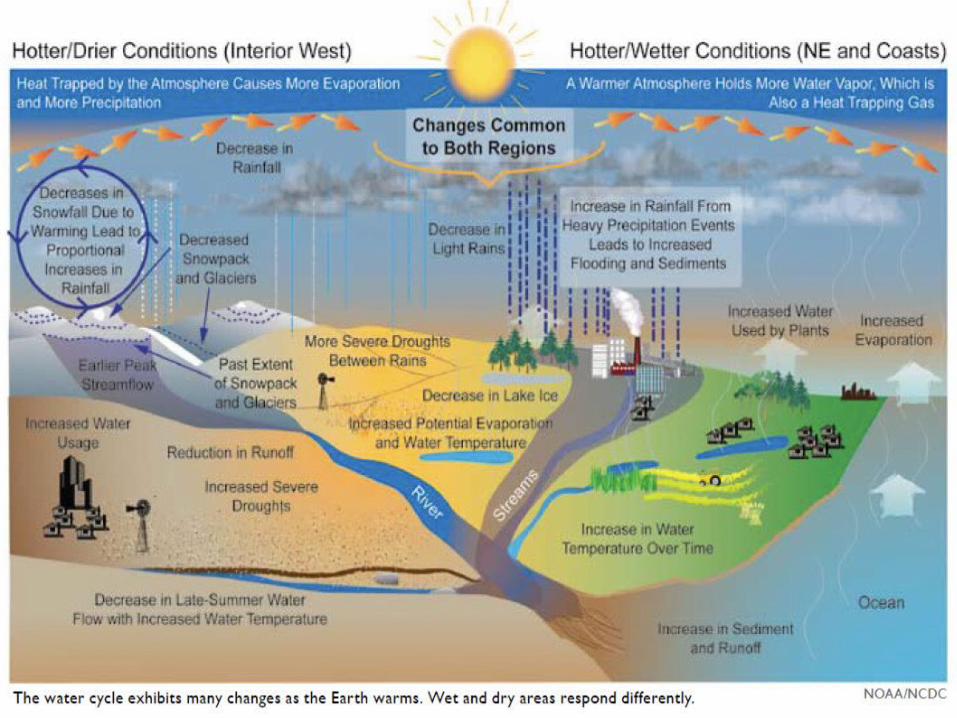
Water Resources
Key Water Resource Impacts• Climate change has already altered, and will continue to alter, the water
cycle, affecting where, when and how much water is available for all uses.• Floods and droughts are likely to become more common and more
intense as regional and seasonal precipitation patterns change, and rainfall becomes more concentrated into heavy events (with longer, hotter dry periods in between).
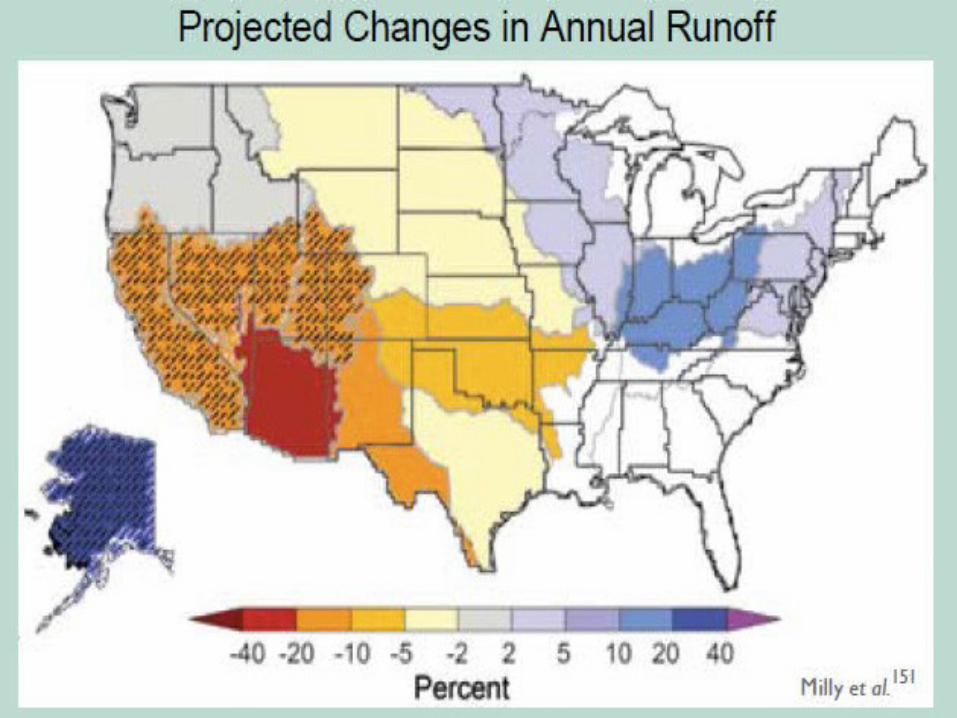
• Precipitation and runoff are likely to increase in the Northeast and Midwest in winter and spring, and decrease in the West especially the Southwest, in the spring and summer.
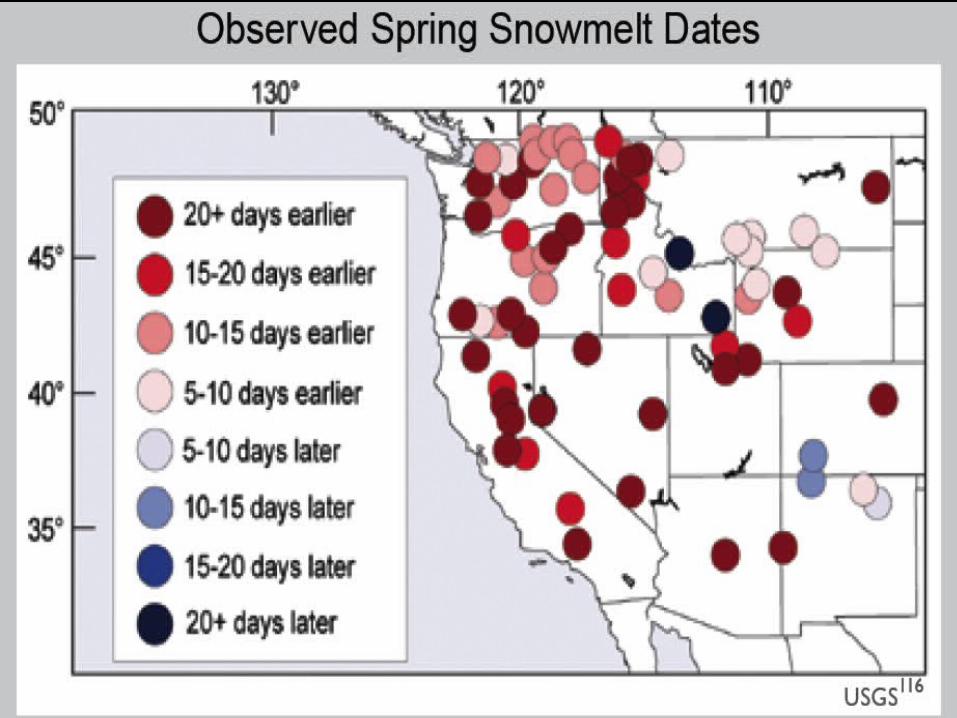
• In areas where snowpack dominates, the timing of runoff will continue to shift to earlier in the spring and flows will be lower in late summer.
• Surface water quality and groundwater quantity will be affected by a changing climate.
• Climate change will place additional burdens on already stressed water systems.
• The past century is no longer a reasonable guide to the future for water management.
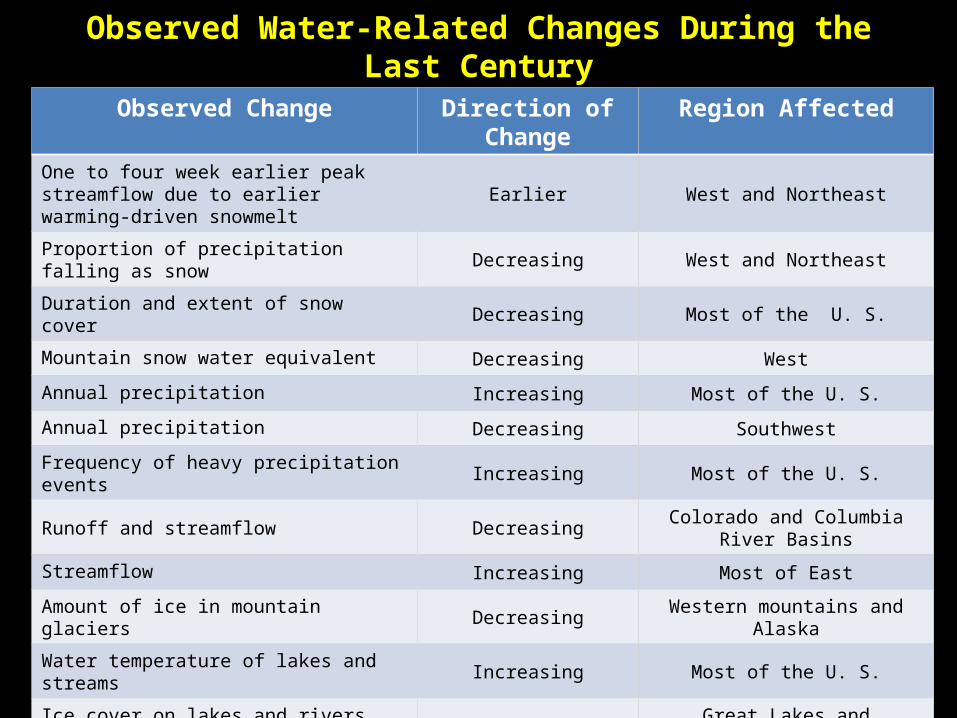
Observed Water-Related Changes During the Last Century
Observed Change Direction of Change Region AffectedOne to four week earlier peak streamflow due to earlier warming-driven snowmelt Earlier West and Northeast
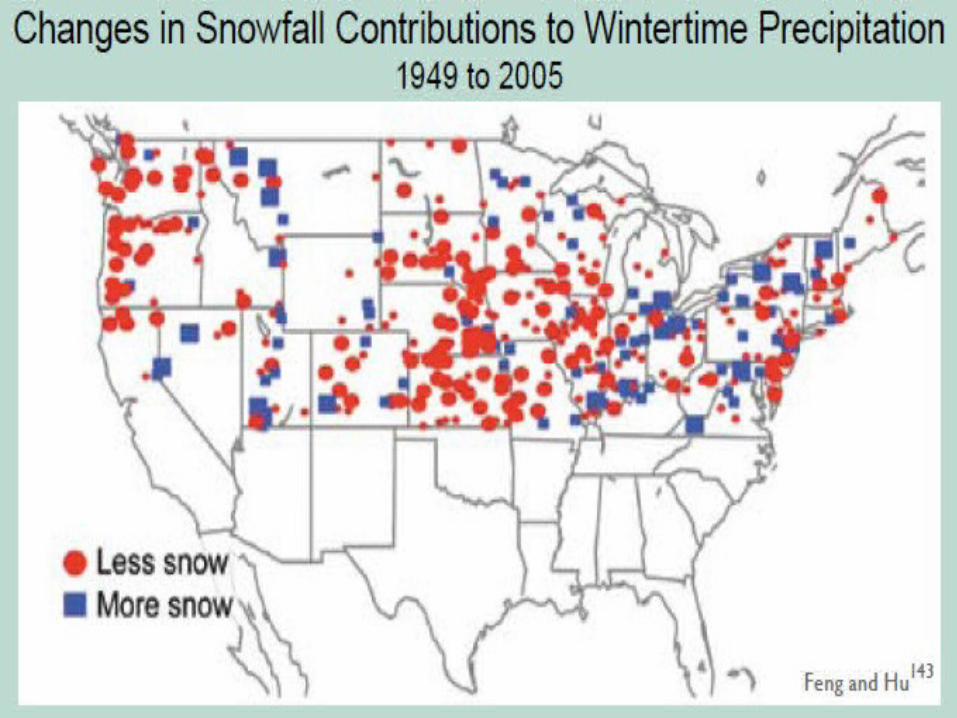
Proportion of precipitation falling as snow Decreasing West and Northeast
Duration and extent of snow cover Decreasing Most of the U. S.
Mountain snow water equivalent Decreasing West
Annual precipitation Increasing Most of the U. S.
Annual precipitation Decreasing Southwest
Frequency of heavy precipitation events Increasing Most of the U. S.
Runoff and streamflow Decreasing Colorado and Columbia River Basins
Streamflow Increasing Most of East
Amount of ice in mountain glaciers Decreasing Western mountains and Alaska
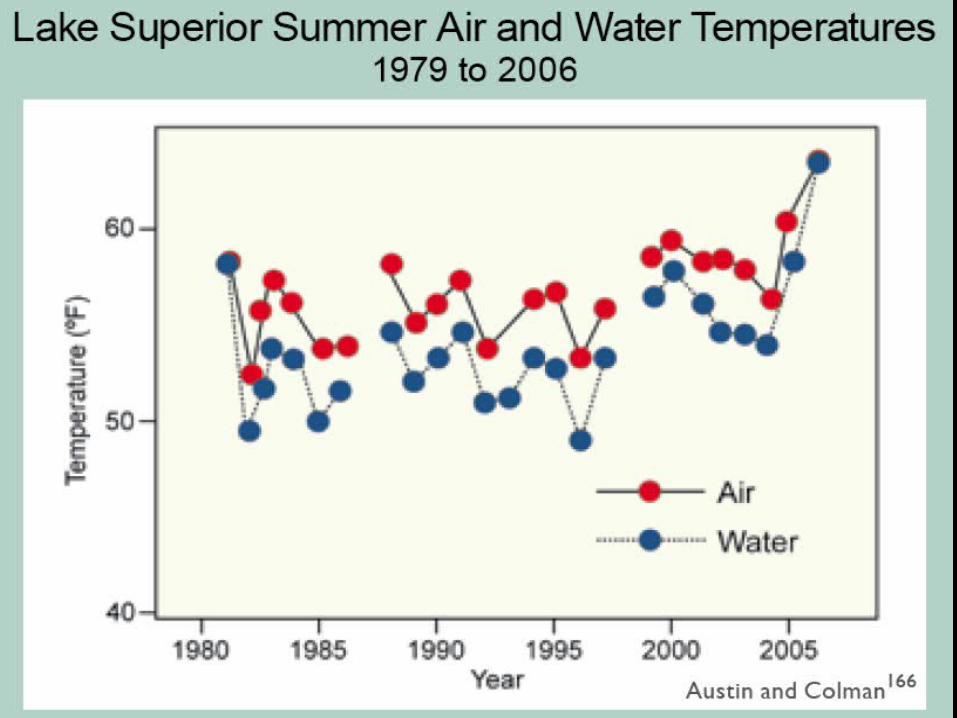
Water temperature of lakes and streams Increasing Most of the U. S.
Ice cover on lakes and rivers Decreasing Great Lakes and Northeast
Periods of drought Increasing Parts of West and East
Salinization of surface waters Increasing Florida and Louisiana
Widespread thawing of permafrost Increasing Alaska
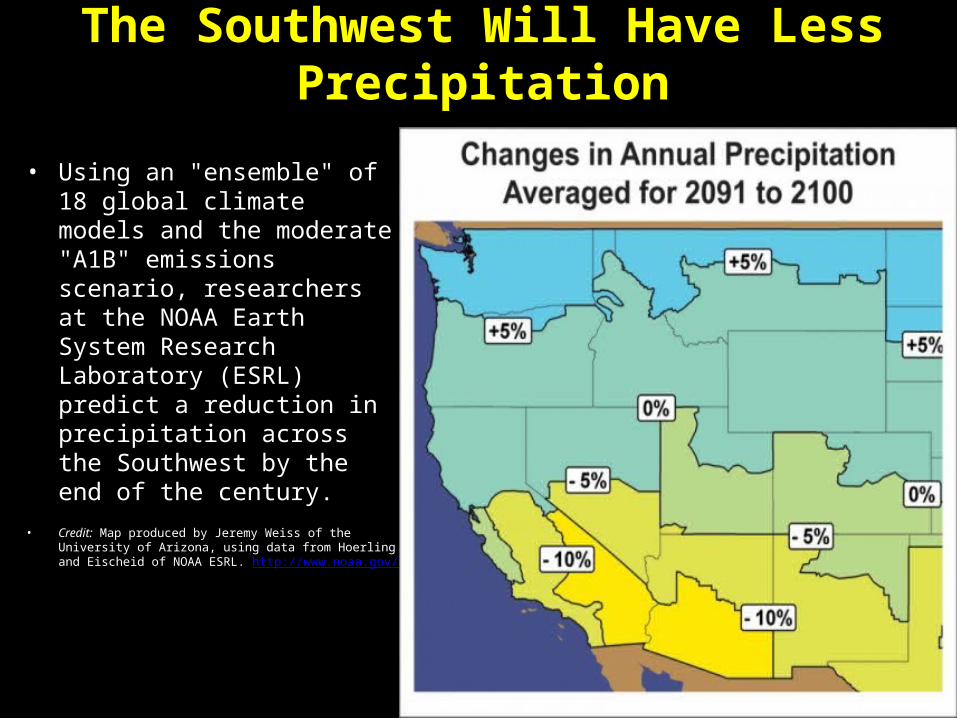
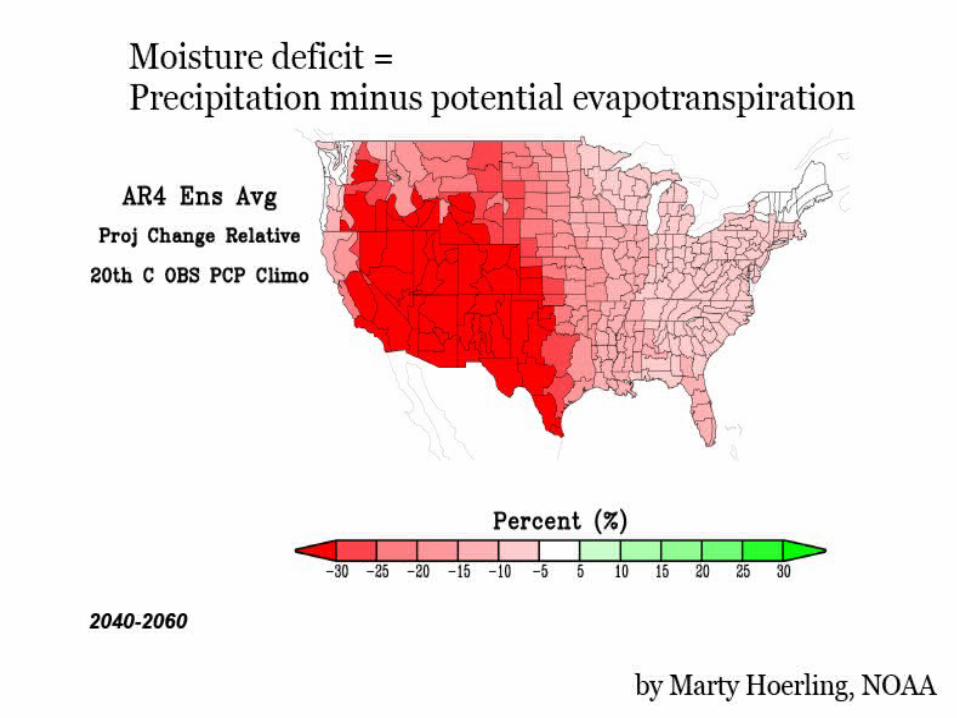
The Southwest Will Have Less Precipitation
• Using an "ensemble" of 18 global climate models and the moderate "A1B" emissions scenario, researchers at the NOAA Earth System Research Laboratory (ESRL) predict a reduction in precipitation across the Southwest by the end of the century.
• Credit: Map produced by Jeremy Weiss of the University of Arizona, using data from Hoerling and Eischeid of NOAA ESRL. http://www.noaa.gov/
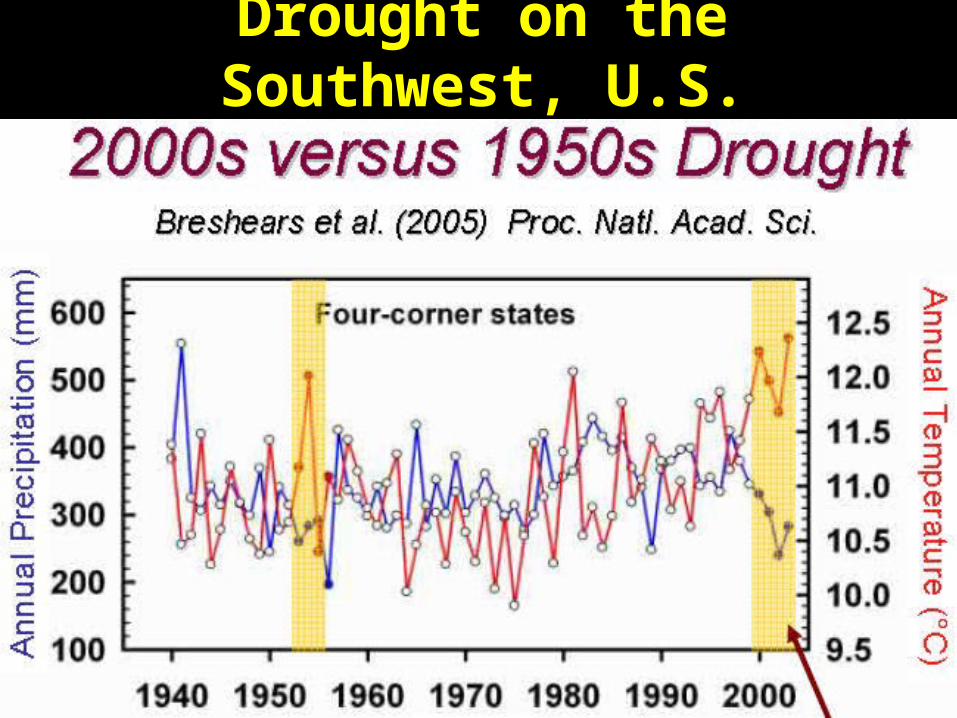
Drought on the Southwest, U.S.
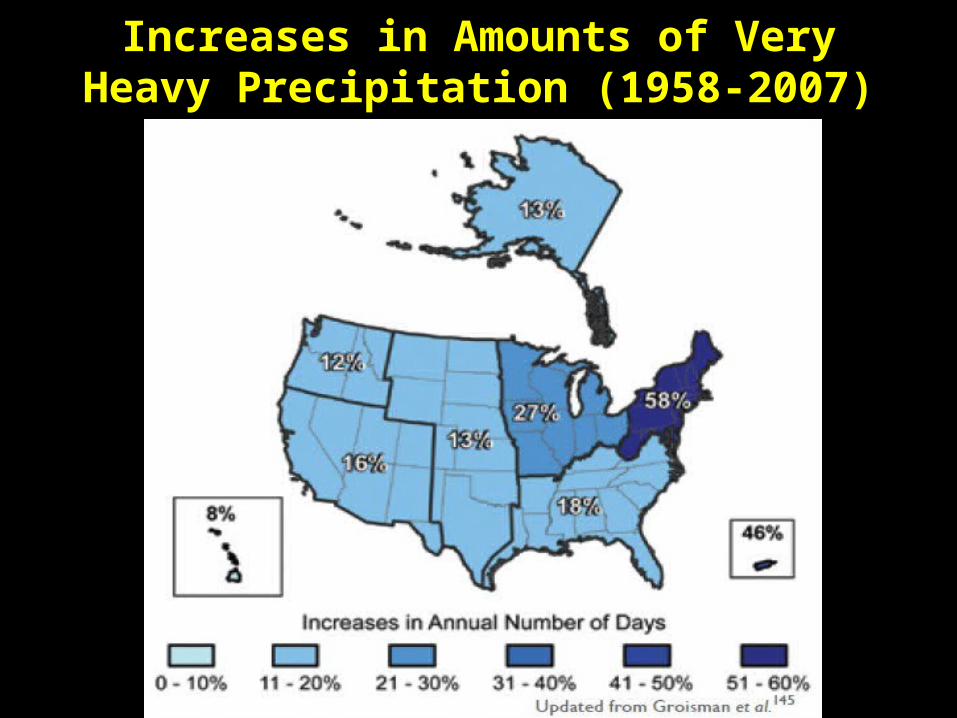
Increases in Amounts of Very Heavy Precipitation (1958-2007)
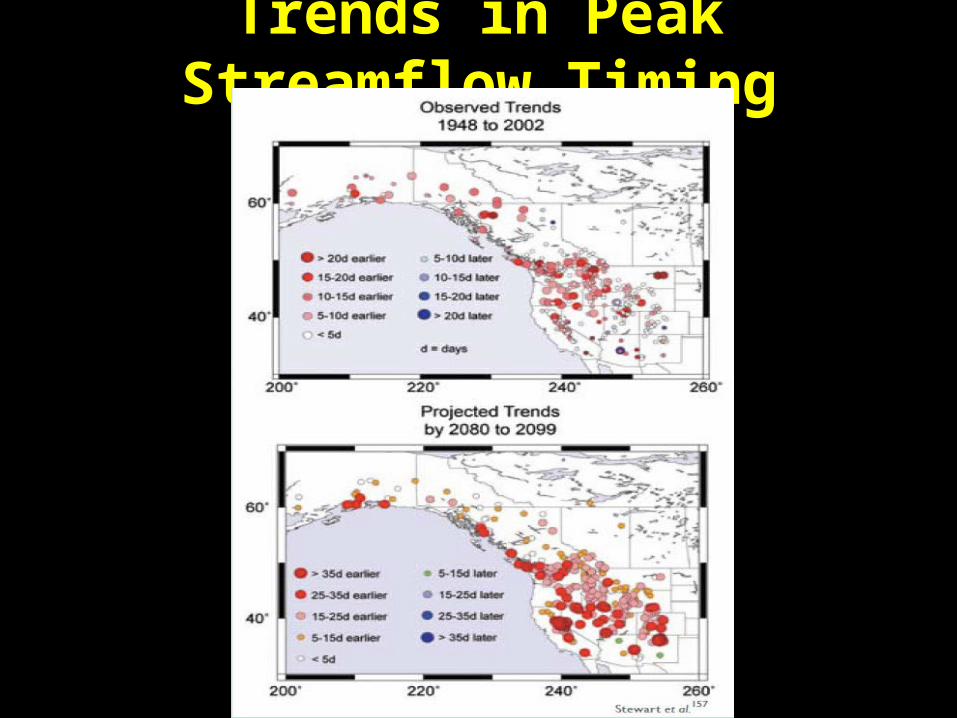
Trends in Peak Streamflow Timing
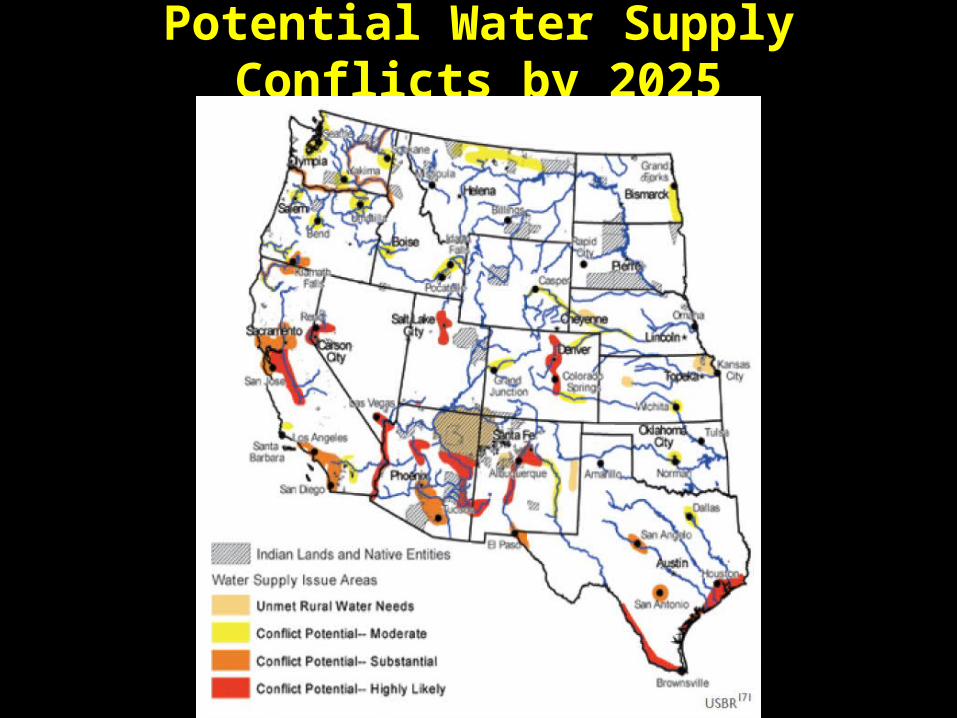
Potential Water Supply Conflicts by 2025
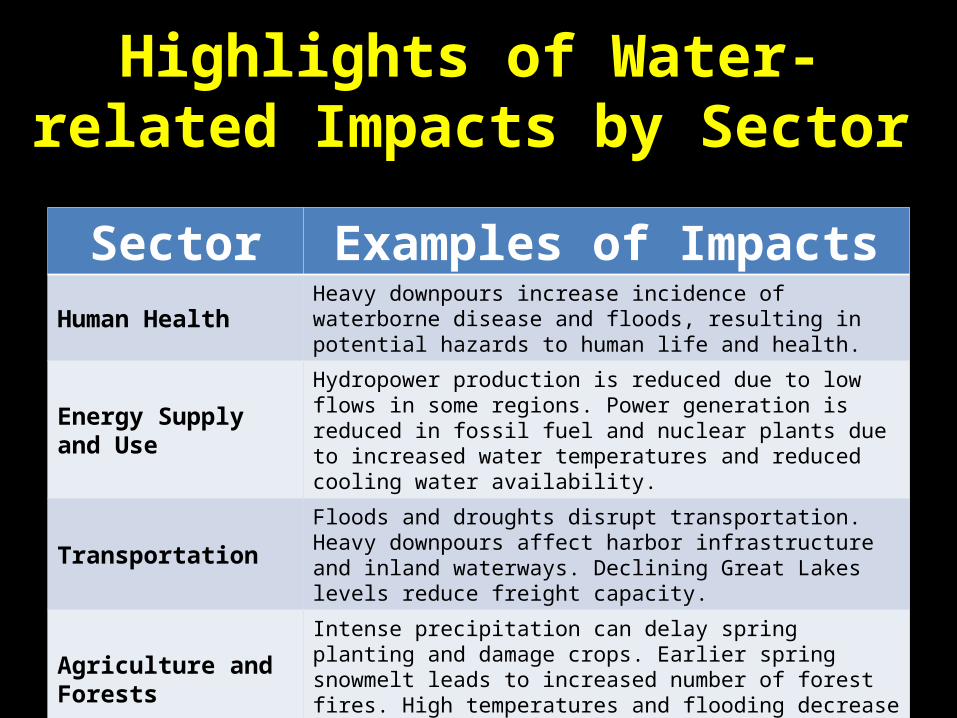
Highlights of Water-related Impacts by Sector
Sector Examples of ImpactsHuman Health Heavy downpours increase incidence of waterborne disease and
floods, resulting in potential hazards to human life and health.
Energy Supply and Use
Hydropower production is reduced due to low flows in some regions. Power generation is reduced in fossil fuel and nuclear plants due to increased water temperatures and reduced cooling water availability.
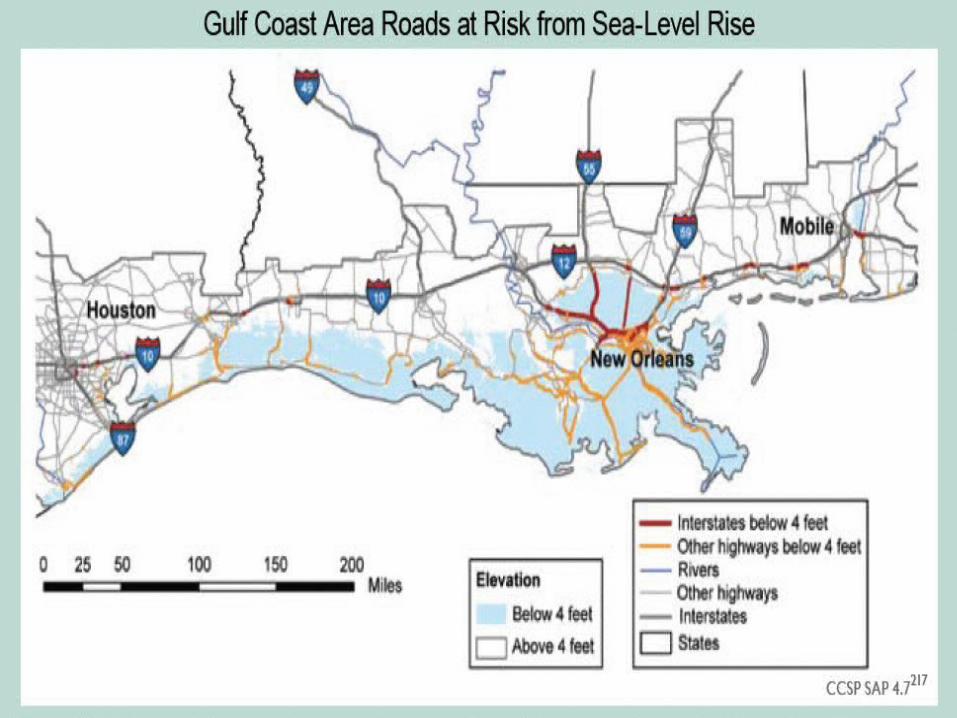
TransportationFloods and droughts disrupt transportation. Heavy downpours affect harbor infrastructure and inland waterways. Declining Great Lakes levels reduce freight capacity.
Agriculture and ForestsIntense precipitation can delay spring planting and damage crops. Earlier spring snowmelt leads to increased number of forest fires. High temperatures and flooding decrease food production.
Ecosystems Coldwater fish threatened by rising water temperatures. Some warm-water fish will expand ranges.
Energy Supply and Use
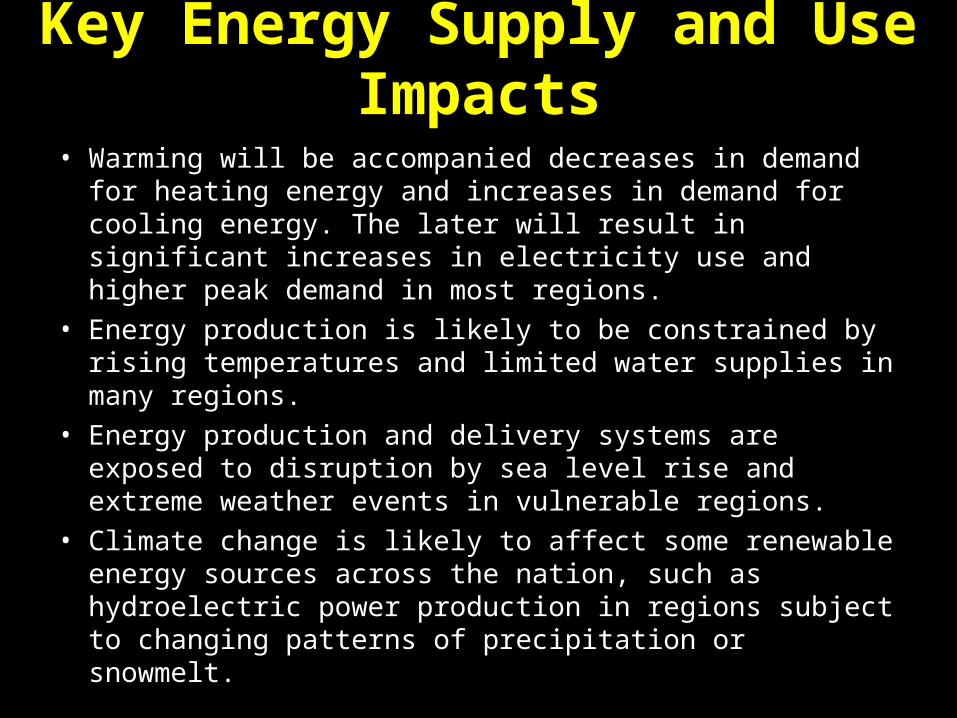
Key Energy Supply and Use Impacts
• Warming will be accompanied decreases in demand for heating energy and increases in demand for cooling energy. The later will result in significant increases in electricity use and higher peak demand in most regions.
• Energy production is likely to be constrained by rising temperatures and limited water supplies in many regions.
• Energy production and delivery systems are exposed to disruption by sea level rise and extreme weather events in vulnerable regions.
• Climate change is likely to affect some renewable energy sources across the nation, such as hydroelectric power production in regions subject to changing patterns of precipitation or snowmelt.
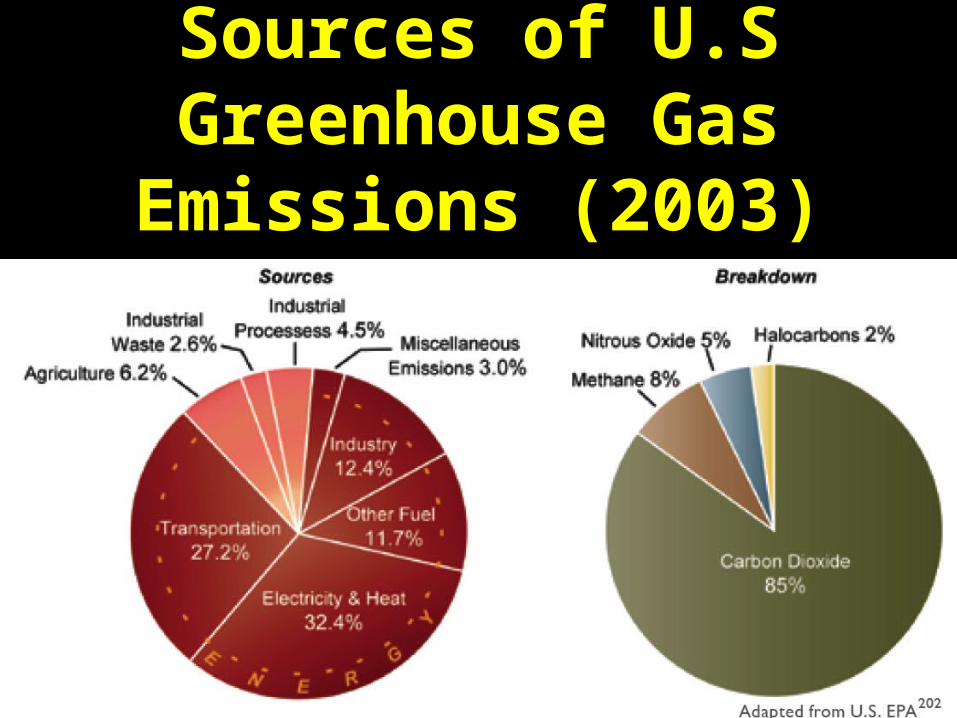
Sources of U.S Greenhouse Gas Emissions (2003)
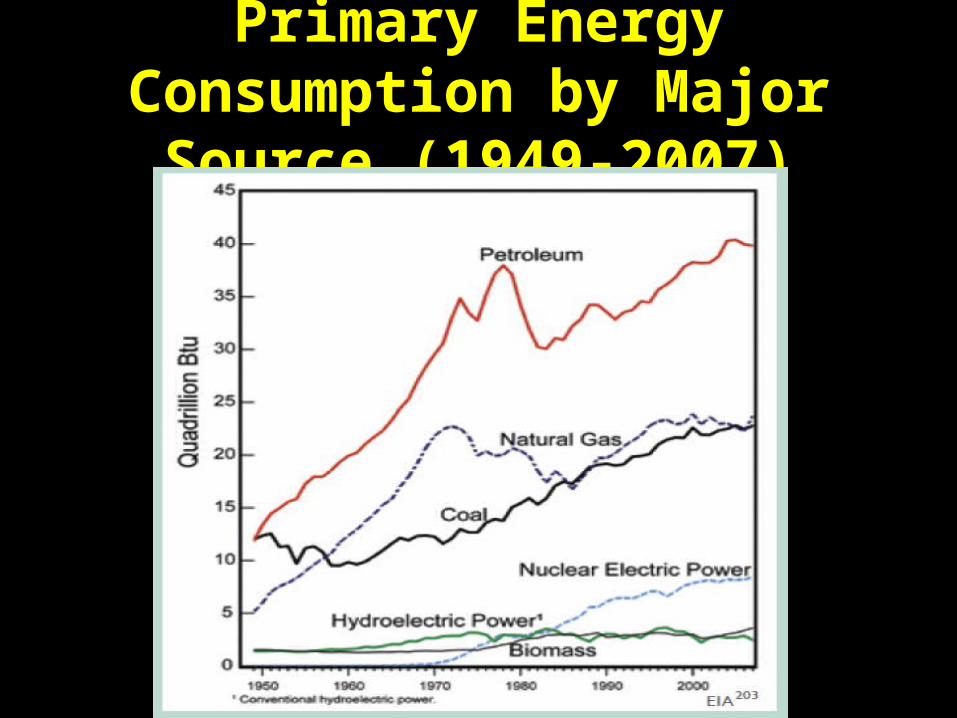
Primary Energy Consumption by Major Source (1949-2007)
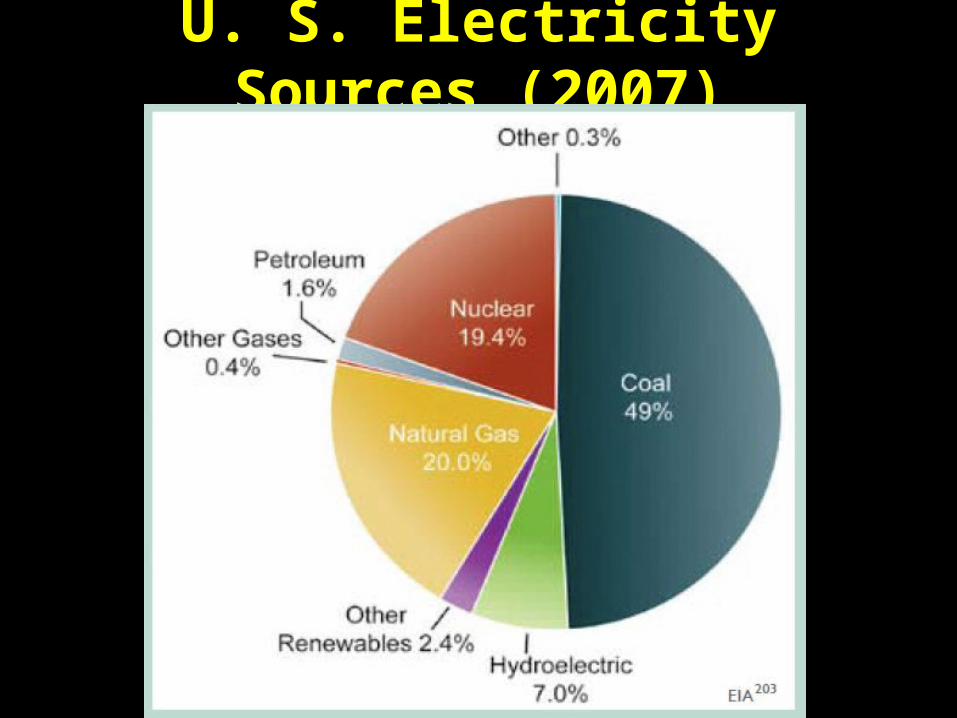
U. S. Electricity Sources (2007)
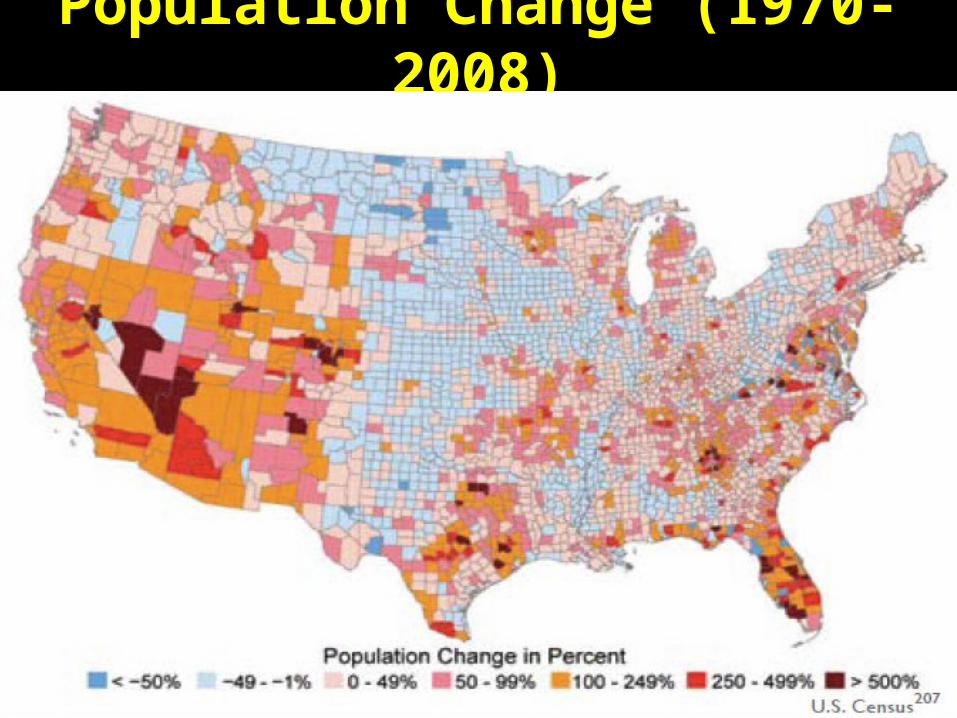
Population Change (1970-2008)
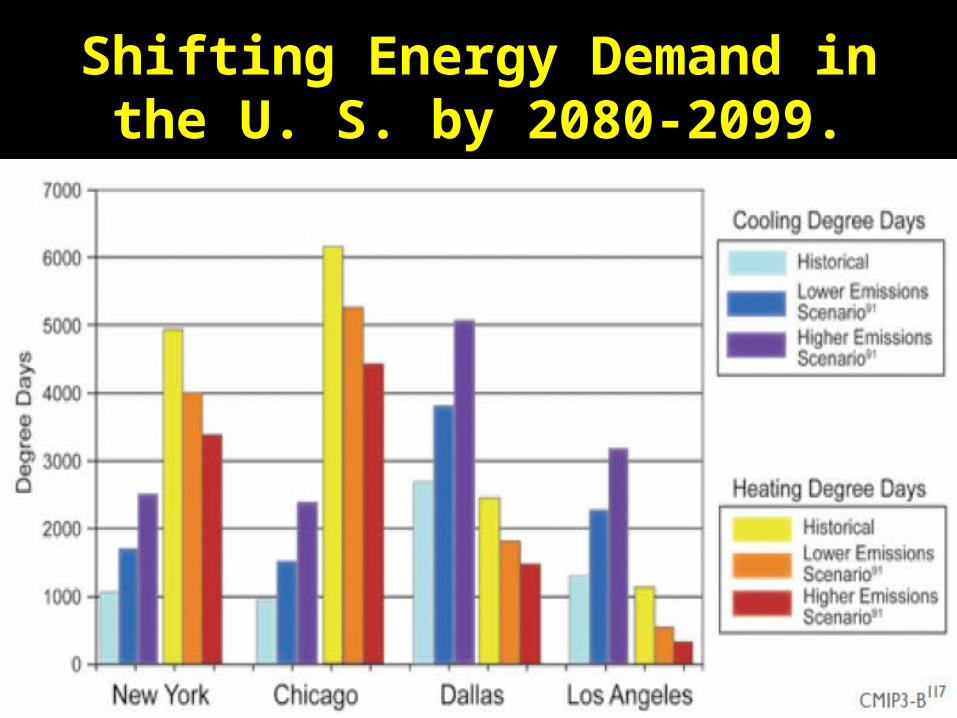
Shifting Energy Demand in the U. S. by 2080-2099.
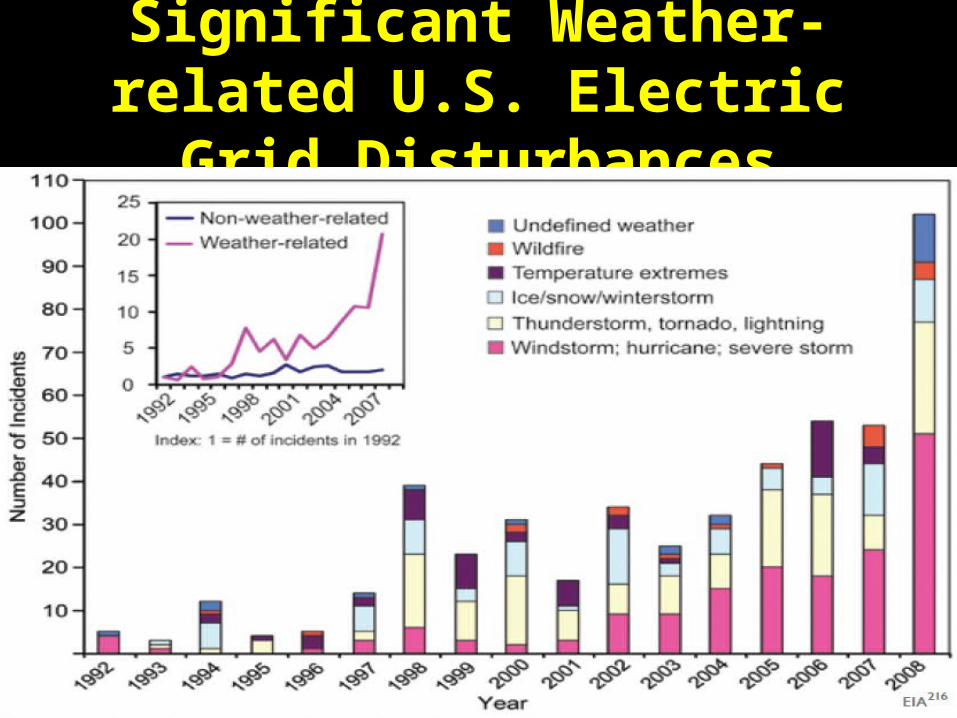
Significant Weather-related U.S. Electric Grid Disturbances
Transportation
Key Transportation Impacts• Sea level rise and storm surge will increase the risk of major coastal
impacts, including both temporary and permanent flooding of airports, roads, rail lines, and tunnels.
• Flooding from increasingly intense downpours will increase the risk of disruptions and delays in air, rail and road transportation, and damage from mudslides in some areas.
• The increase in extreme heat will limit some transportation operations and cause pavement and track damage. Decreased extreme cold will provide some benefits such as reduced snow and ice removal costs in some areas.
• Increased intensity of strong hurricanes would lead to more evacuations, infrastructure damage and failure, and transportations disruptions.
• Arctic warming will continue to reduce sea ice, lengthening the ocean transport season, but also resulting in greater coastal erosion due to waves. Permafrost thaw in Alaska will damage infrastructure. The ice road season will become shorter.
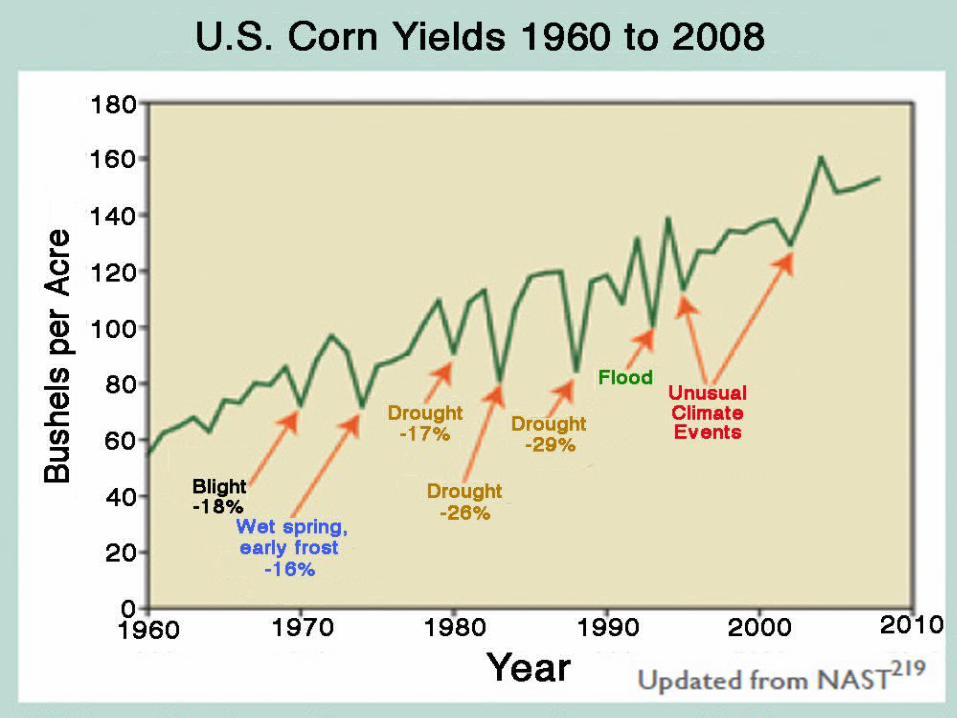
Agriculture
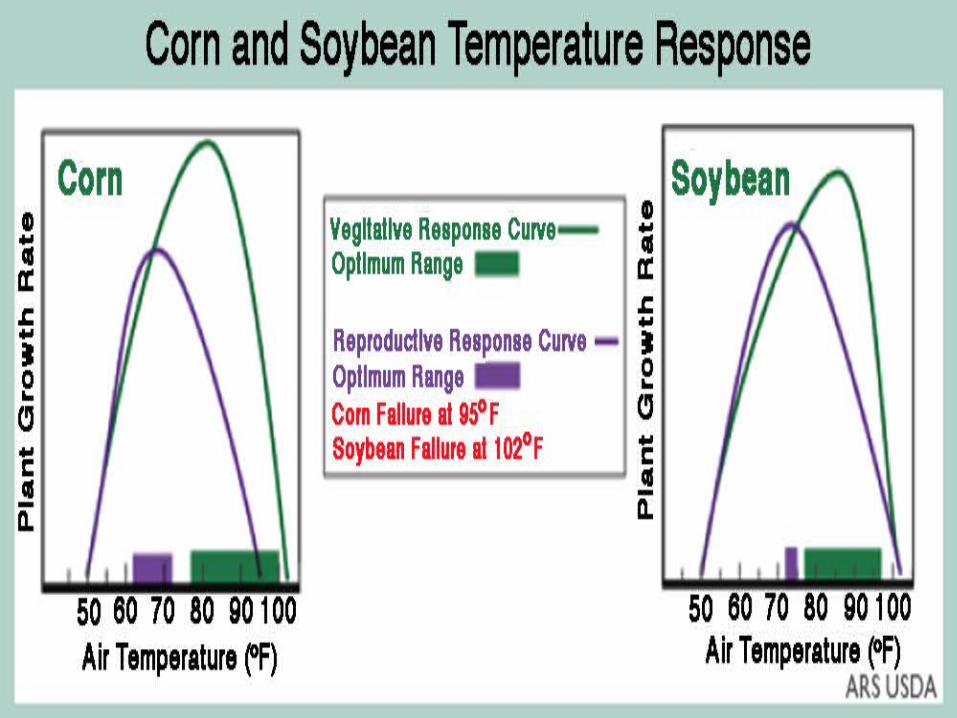
Key Agriculture Impacts• Many crops show positive responses to elevated CO2 and low levels of
warming, but higher levels of warming often negatively affect growth and yields.
• Extreme events such as heavy downpours and droughts are likely to reduce crop yields because excesses or deficits of water have negative impacts on plant growth.
• Weeds, diseases, and insect pests benefit from warming, and weeds also benefit from a higher CO2 concentrations, increasing stress on crop plants and requiring more attention to pest and weed control.
• Forage quality in pastures and rangelands generally declines with increasing CO2 concentration because of the effects on plant nitrogen and protein content, reducing the land’s ability to supply adequate livestock feed.
• Increased heat, disease, and weather extremes are likely to reduce livestock and agricultural productivity.

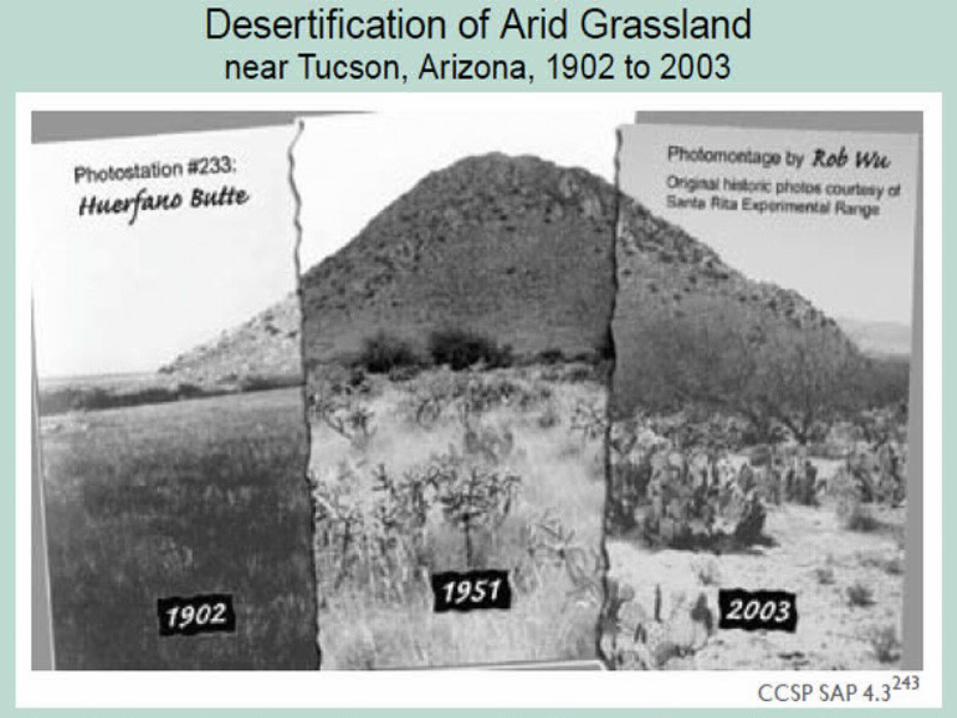
Ecosystems
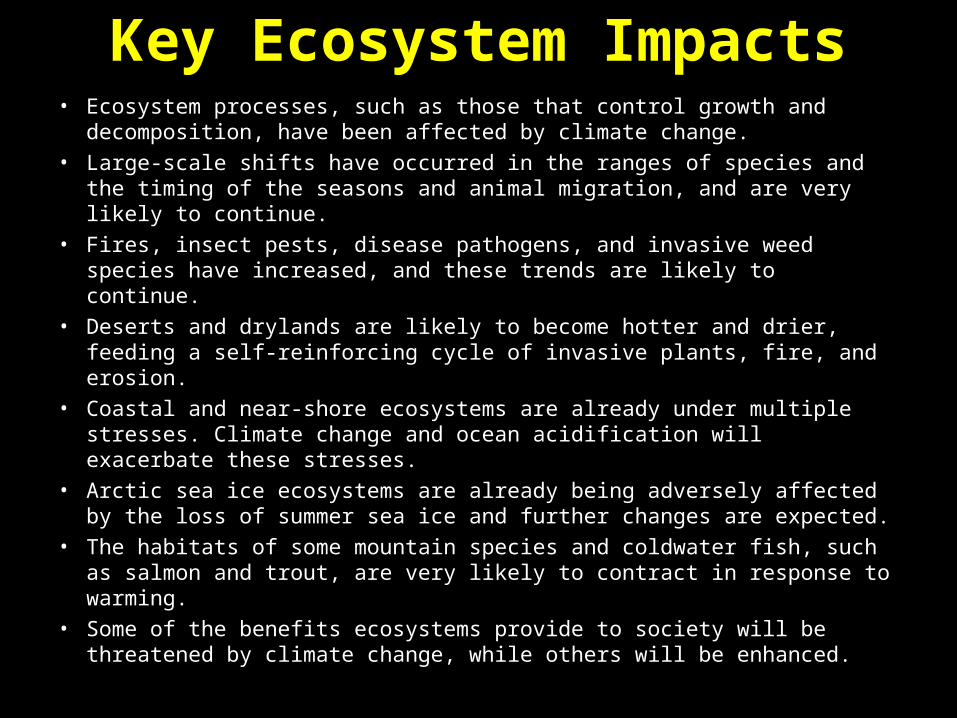
Key Ecosystem Impacts• Ecosystem processes, such as those that control growth and
decomposition, have been affected by climate change.• Large-scale shifts have occurred in the ranges of species and the timing of
the seasons and animal migration, and are very likely to continue.• Fires, insect pests, disease pathogens, and invasive weed species have
increased, and these trends are likely to continue.• Deserts and drylands are likely to become hotter and drier, feeding a self-
reinforcing cycle of invasive plants, fire, and erosion.• Coastal and near-shore ecosystems are already under multiple stresses.
Climate change and ocean acidification will exacerbate these stresses.• Arctic sea ice ecosystems are already being adversely affected by the loss
of summer sea ice and further changes are expected.• The habitats of some mountain species and coldwater fish, such as salmon
and trout, are very likely to contract in response to warming.• Some of the benefits ecosystems provide to society will be threatened by
climate change, while others will be enhanced.
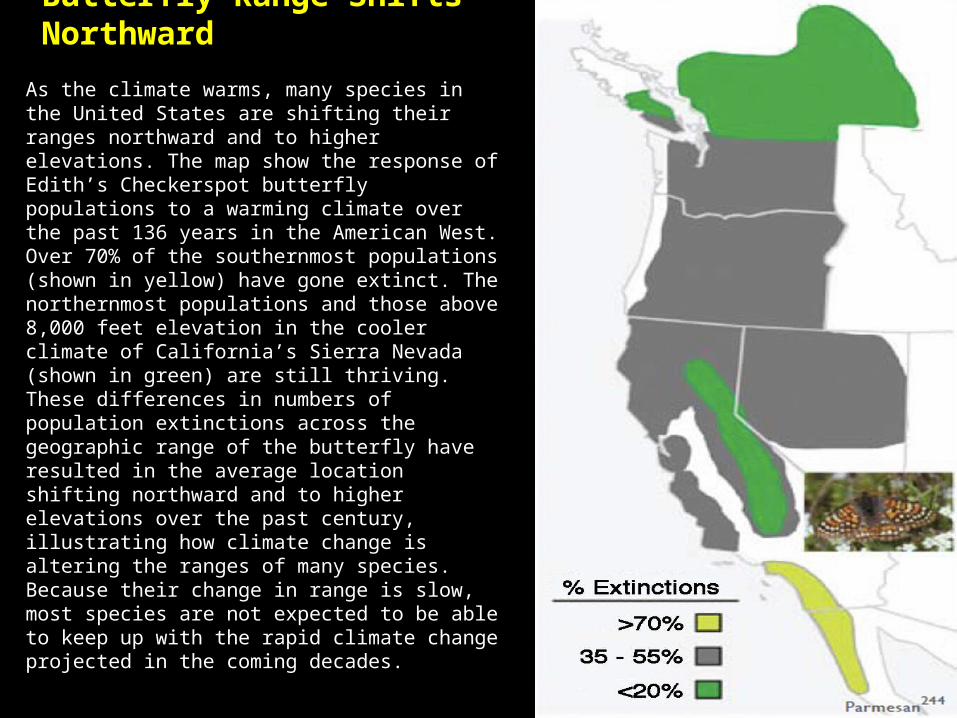
Butterfly Range Shifts Northward
As the climate warms, many species in the United States are shifting their ranges northward and to higher elevations. The map show the response of Edith’s Checkerspot butterfly populations to a warming climate over the past 136 years in the American West. Over 70% of the southernmost populations (shown in yellow) have gone extinct. The northernmost populations and those above 8,000 feet elevation in the cooler climate of California’s Sierra Nevada (shown in green) are still thriving. These differences in numbers of population extinctions across the geographic range of the butterfly have resulted in the average location shifting northward and to higher elevations over the past century, illustrating how climate change is altering the ranges of many species. Because their change in range is slow, most species are not expected to be able to keep up with the rapid climate change projected in the coming decades.

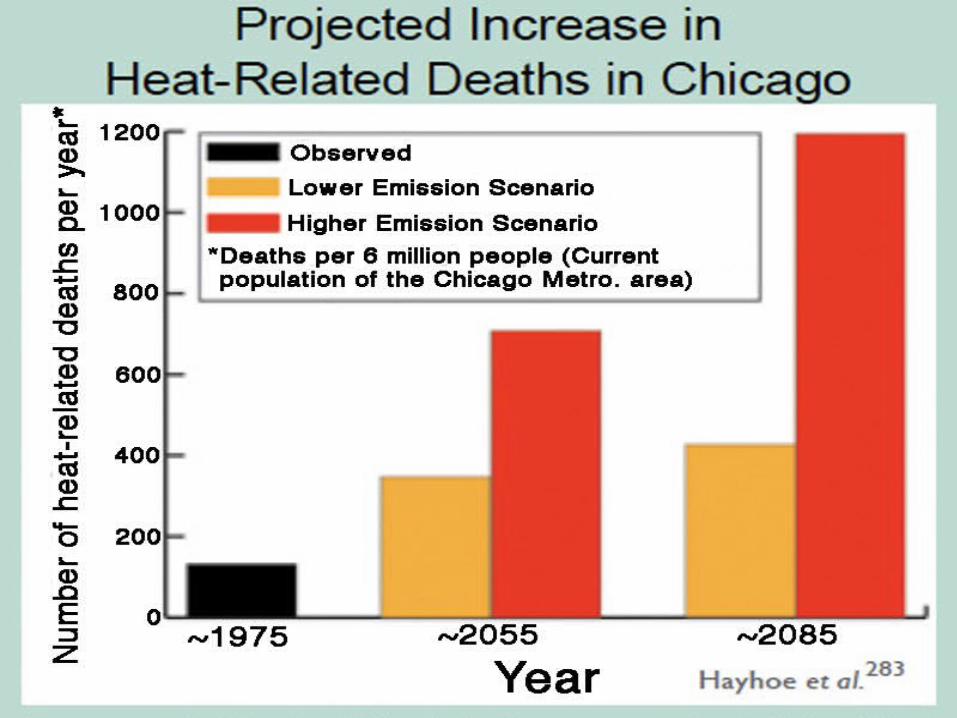
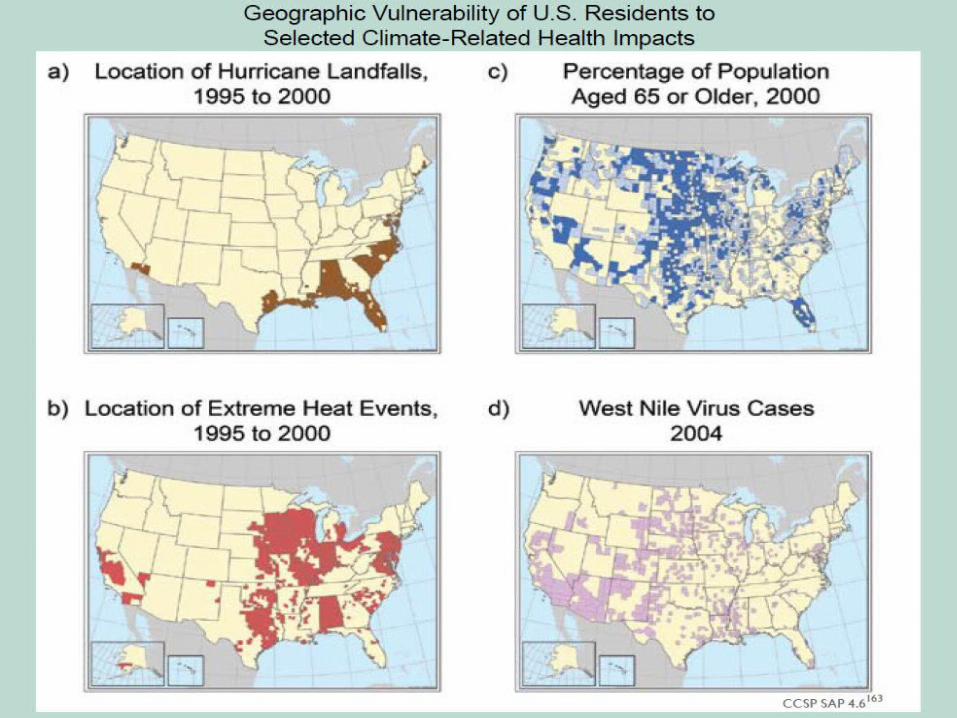
Human Health
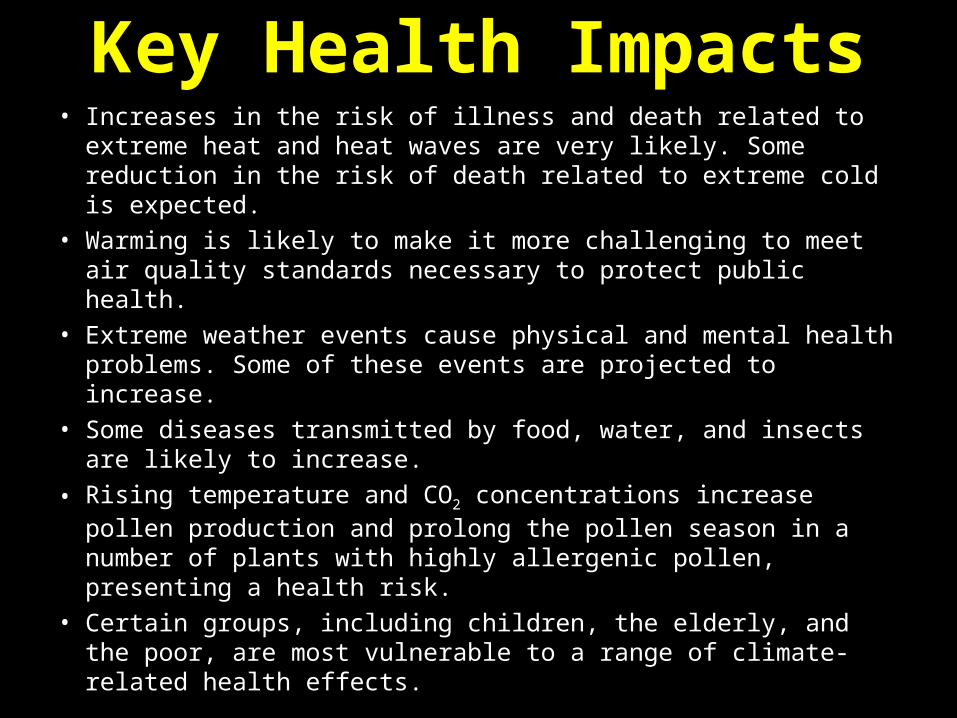
Key Health Impacts• Increases in the risk of illness and death related to extreme
heat and heat waves are very likely. Some reduction in the risk of death related to extreme cold is expected.
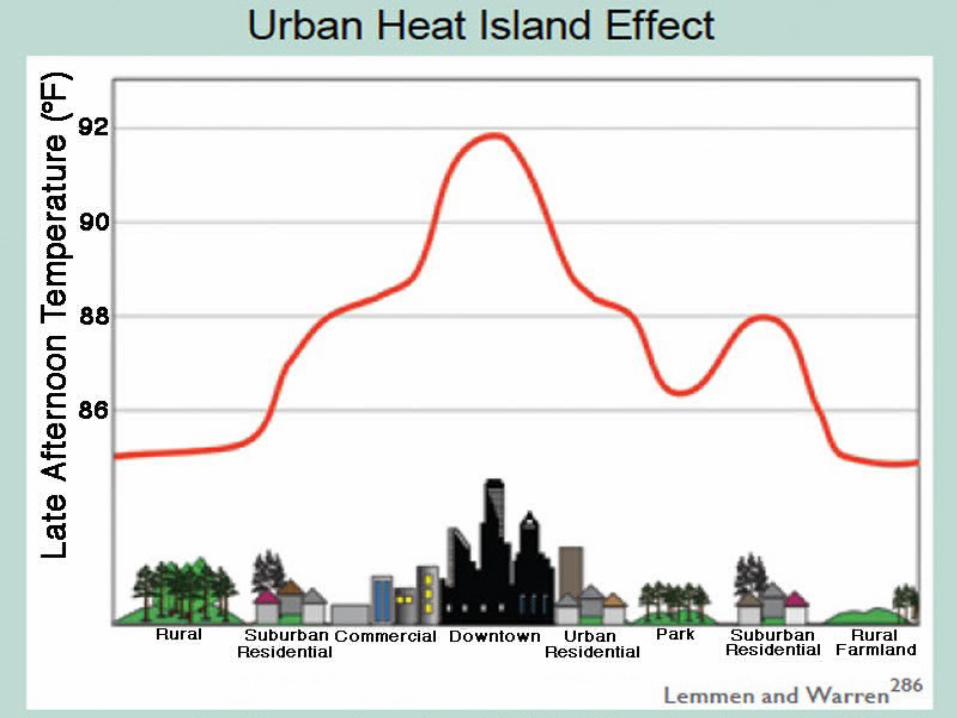
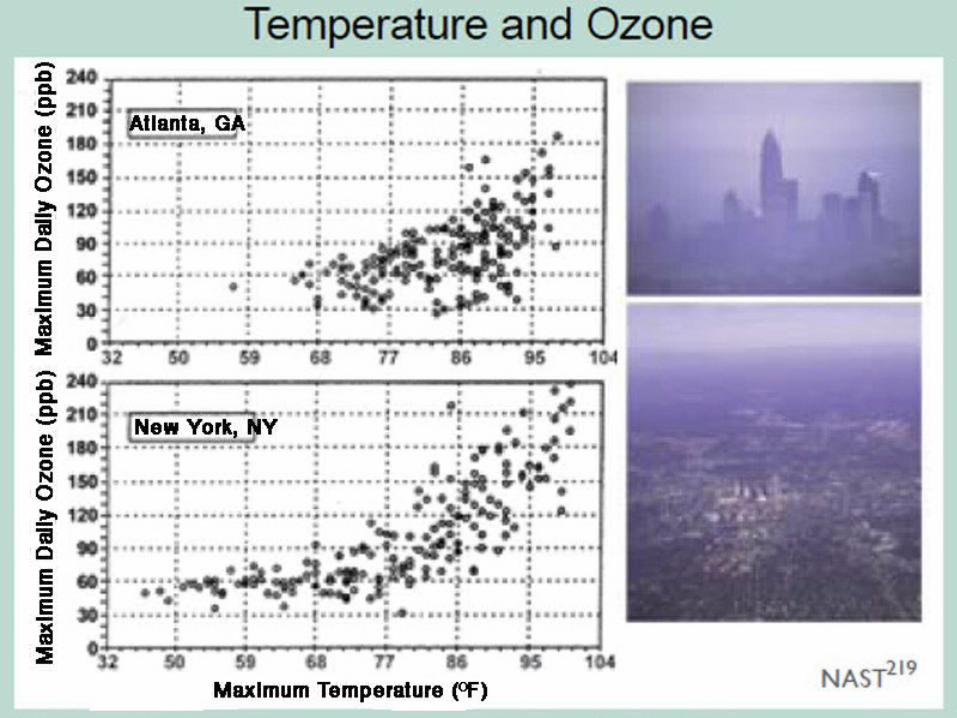
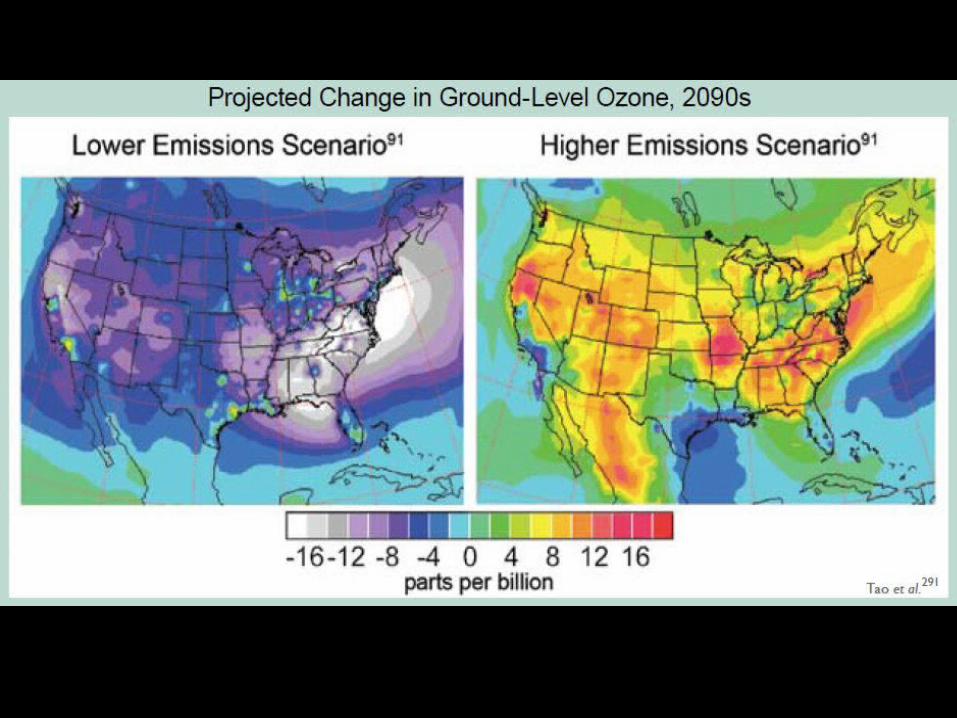
• Warming is likely to make it more challenging to meet air quality standards necessary to protect public health.
• Extreme weather events cause physical and mental health problems. Some of these events are projected to increase.
• Some diseases transmitted by food, water, and insects are likely to increase.
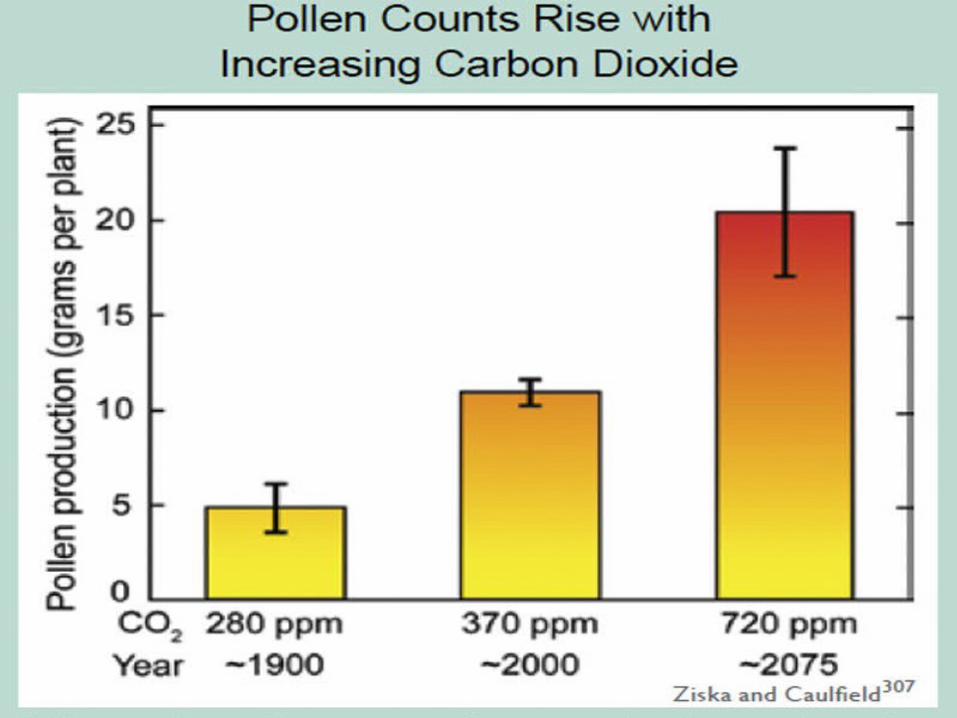
• Rising temperature and CO2 concentrations increase pollen production and prolong the pollen season in a number of plants with highly allergenic pollen, presenting a health risk.
• Certain groups, including children, the elderly, and the poor, are most vulnerable to a range of climate-related health effects.
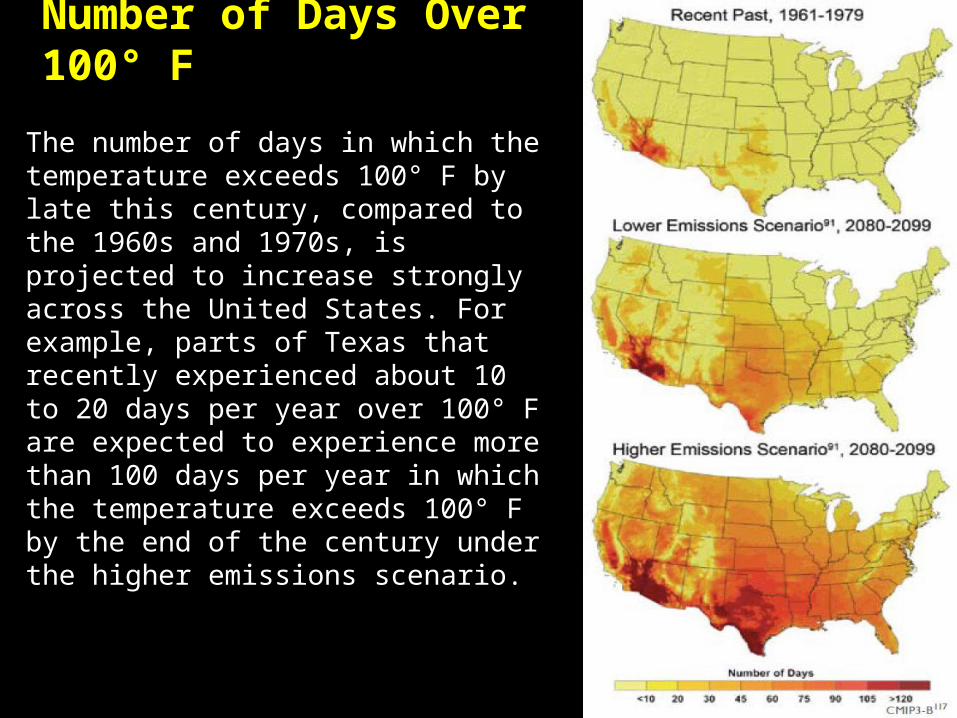
Number of Days Over 100° F
The number of days in which the temperature exceeds 100° F by late this century, compared to the 1960s and 1970s, is projected to increase strongly across the United States. For example, parts of Texas that recently experienced about 10 to 20 days per year over 100° F are expected to experience more than 100 days per year in which the temperature exceeds 100° F by the end of the century under the higher emissions scenario.
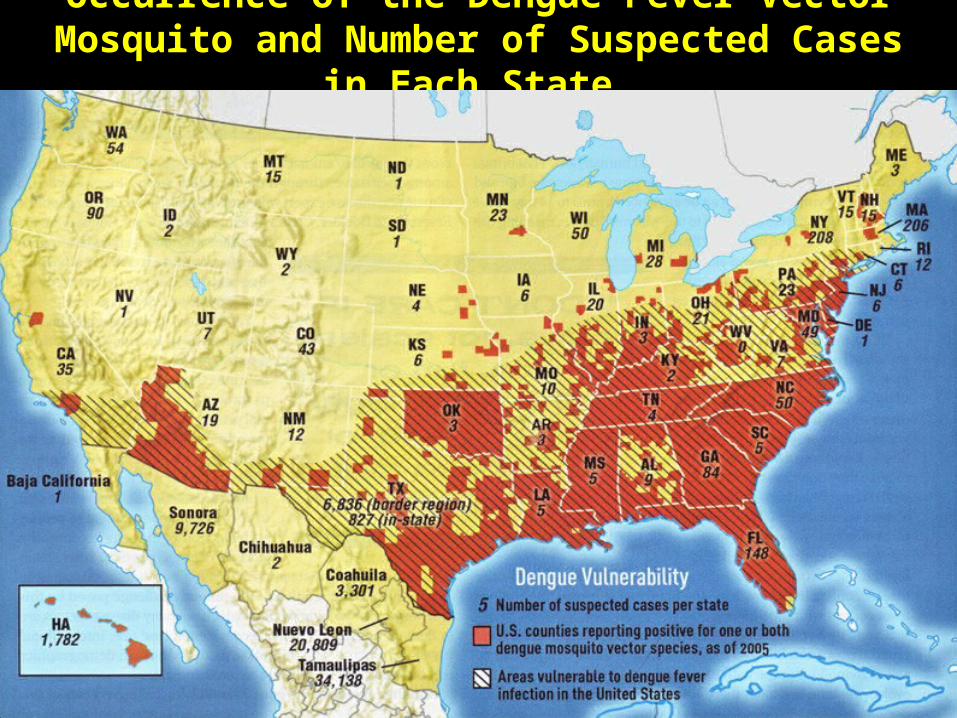
Occurrence of the Dengue Fever Vector Mosquito and Number of Suspected Cases in Each State

Society
Key Society Impacts• Population shifts and development choices are making more
Americans vulnerable to the expected impacts of climate change.• Vulnerability is greater for those who have few resources and few
choices.• City residents and city infrastructure have unique vulnerabilities to
climate change.• Climate change affects communities through changes in climate-
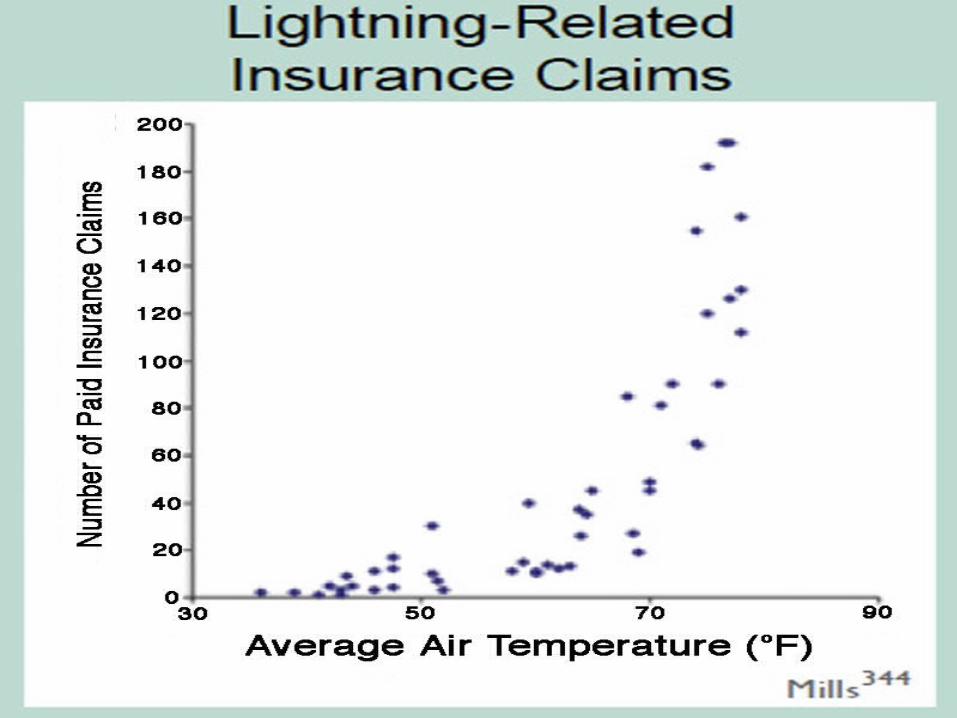
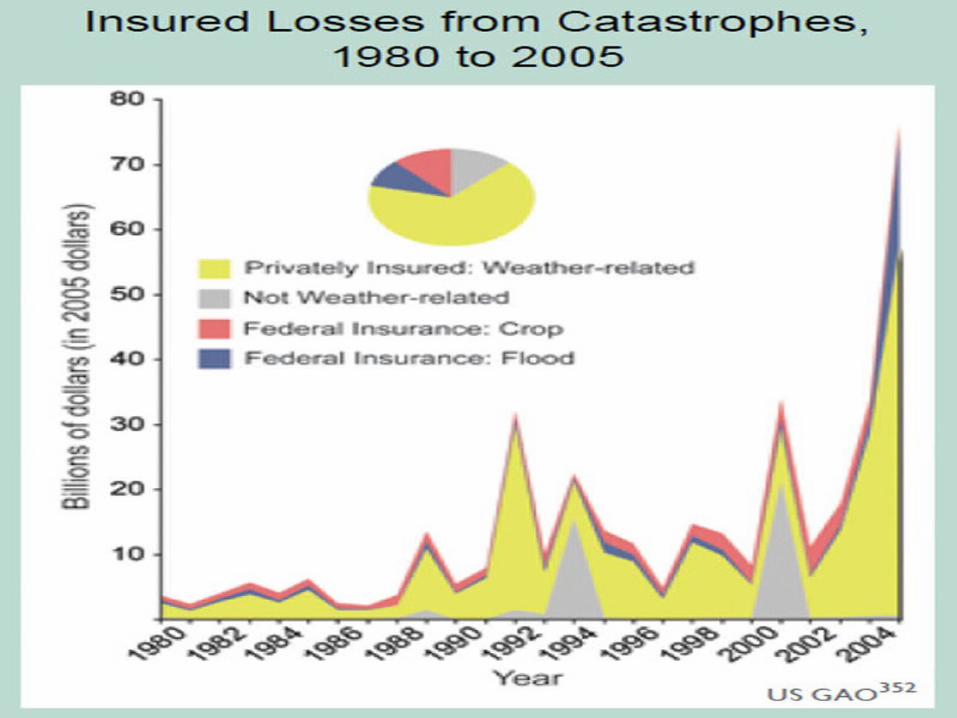
sensitive resources that occur both locally and at great distances.• Insurance is one of the industries particularly vulnerable to
increasing extreme weather events such as severe storms, but it can also help society mange the risks.
• The United States is connected to a world that is unevenly vulnerable to climate change and thus will be affected by impacts in other parts of the world.
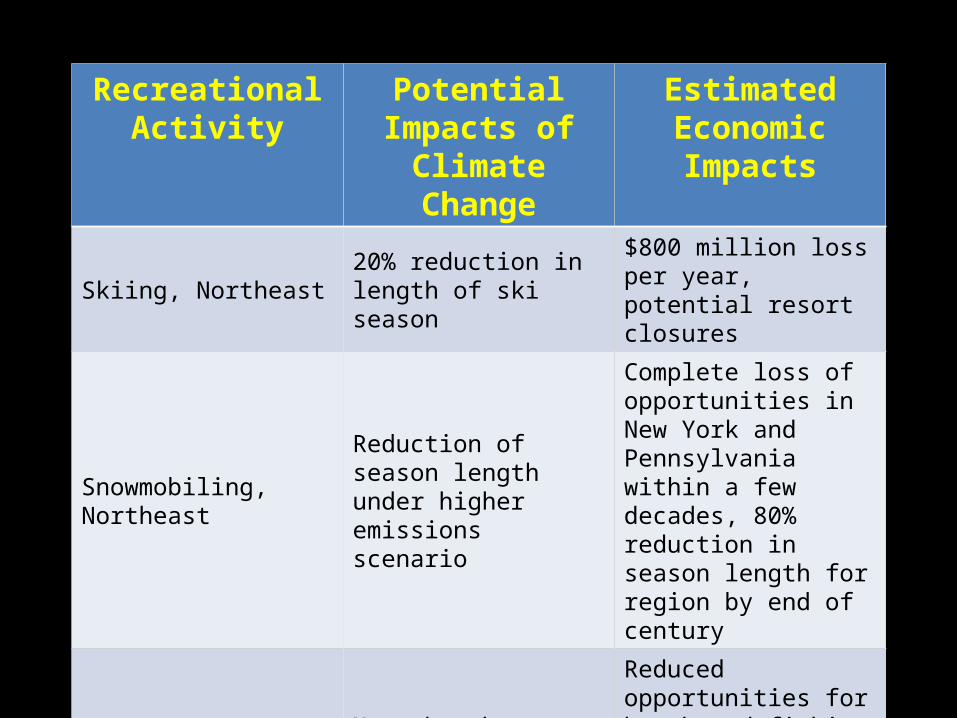
Recreational Activity
Potential Impacts of Climate Change
Estimated Economic Impacts
Skiing, Northeast 20% reduction in length of ski season
$800 million loss per year, potential resort closures
Snowmobiling, NortheastReduction of season length under higher emissions scenario
Complete loss of opportunities in New York and Pennsylvania within a few decades, 80% reduction in season length for region by end of century
Beaches, North CarolinaMany beaches are eroded, and some lost by 2080
Reduced opportunities for beach and fishing grips, without additional cost for adaptation measures