climate change and rising sea levels - university of · pdf fileclimate change and rising sea...
TRANSCRIPT

Climate Change and Rising Sea Levels: A Geographic Information Systems Analysis of the
Potential Impact on Railroad Corridors in New Castle County, Delaware
REU Program - Disaster Research Center University Transportation Center
Chance Malkin University of Delaware Civil Engineering 2010
August 7, 2009

Climate Change and Rising Sea Levels
Malkin - 1 -
1. Abstract
In the past century continued investment in infrastructure along the east coast of the United States has supported economic growth and development; unfortunately this investment also comes with a certain degree of vulnerability. The advanced infrastructure along the east coast combined with the impending threat of climate change and rising sea levels has led many people to prepare for the potential impacts. The resiliency of railroad corridors along the east coast has its limitations, one of which is its resistance to floods. The spatial representation and analysis capabilities of computer based geographical information systems (GIS) are used to develop a comprehensive visual illustration of the impact areas in which rail road corridors in New Castle County, Delaware are in danger of being either flooded or perhaps destroyed. The goal of this research is to possibly affect some policies involving raising the elevations of rail beds or even relocating the tracks to less flood prone locations. Moreover, the goal is to help prevent damage of the nation’s infrastructure along the east coast. Based on this research, there are many possible areas of impact of sea level rise for the railroad lines in New Castle County, Delaware. More specifically, the Port of Wilmington is the most likely to be affected. However, the railroad data used assumes the rail lines are on the same elevation as the ground surface in all regions of the county. Since this is not true, further research is needed using more accurate railroad elevation data.
2. Introduction/ Statement of Problem
Since the time of the Industrial Revolution, the United States has grown both in terms of
the use of technology and population. This increase, coupled with the tendency of individuals
and communities to locate near coastal regions, has produced an advanced infrastructure1 along
the east coast. The infrastructure distributed along the east coast includes several multi lane
interstates, well established cities, power plants, airports, subways, bus stations, and railroad
corridors. While this dense and established infrastructure along the east coast has supported
economic growth and development, it also comes with a certain magnitude of vulnerability2. It is
1 The basic facilities, services, and installations needed for the functioning of a community or society, such as transportation and communications systems, water and power lines, and public institutions including schools, post offices, and prisons. 2 Capable of or susceptible to being damaged or destroyed, as by a disaster; difficulty to protect

Climate Change and Rising Sea Levels
Malkin - 2 -
important to understand the level of resiliency3 of this infrastructure. This project focuses on the
railroad corridors specifically.
The resiliency of railroad corridors along the east coast has its limitations, one of which is
its resistance to floods. Since these rail lines are in such close proximity to the coast, they are
quite susceptible to water damage caused by floods. If a flood is severe enough, it could not only
stop the trains from operating, but could also damage if not destroy the rail line itself. These
concerns lead me to the topic of climate change.
The issue of climate change is that there is a gradual shift in the world’s climate over
decades and centuries. Moreover, there is going to be a shift in temperatures. This temperature
shift has been recorded over the past century in form of an increase. An increase in global
temperatures results in glaciers melting and therefore sea level rising. Another impact of climate
change is the boost in severity of storms. While the warming of the planet may be gradual, the
effects of extreme weather induced by climate change -- storms, floods, droughts and heat waves
-- will be acute and immediate (Richardson, 2008). This produces higher storm surges4 and
flooding along coastal regions. The impacts of climate change on east coast are addressed in this
report.
While this research is founded under the belief that climate change will occur, it must
also be noted that the idea of climate change and sea level rise has been very much disputed.
There is debate over the rate of climate change and some uncertainty about its impact
(Richardson, 2008). Many believe that there is no proof to back the allegations of climate change
3 The ability to recover quickly from damage; or the property of a material that enables it to resume its original shape or position after being bent, stretched, or compressed. 4 Offshore rise of water associated with a low pressure weather system. Storm surge is caused primarily by high winds pushing on the ocean’s surface. The wind causes the water to pile up higher than the ordinary sea level.

Climate Change and Rising Sea Levels
Malkin - 3 -
and global warming5. Some think that it is arrogant of humans to believe that their actions could
affect the Earth. However, as much as this issue has been argued, it has been more widely
accepted in recent years.
The advanced infrastructure along the east coast combined with the impending threat of
climate change and rising sea levels has led many to prepare for the potential impacts. But before
preparations can be executed, these potential impacts must first be understood. The goal of my
research is to use the spatial representation and analysis capabilities of computer based
geographical information systems (GIS) to explore possible impacts on rail road corridors in
New Castle County, Delaware.
3. Research Question
The question addressed is: How will the impact of climate change related to sea level rise
and/or increased intensity of storm surges affect the rail infrastructure in New Castle County,
Delaware?
4. Objectives
• Assemble information for a base map for the computer based geographical
information system (GIS). This includes the county outline, topography, etc.
• Import and develop rail line data to layer on top of the base map in GIS.
• Develop a comprehensive visual illustration of the impact areas in which railroads
are in danger of being either flooded or perhaps destroyed.
5. Literature Review
5 Global warming refers to climate change that causes an increase in the average temperature of the lower atmosphere. Global warming can have many different causes, but it is most commonly associated with human interference, specifically the release of excessive amounts of greenhouse gases (GHG).
Climate Change and Rising Sea Levels
Malkin - 4 -
For my literature review, I focus on answering two questions: Why is researching climate
change and its impacts important? What are the previous applications of GIS to disaster
research?
5.1 Why is researching climate change and its impacts important?
The first area of literature review is to understand climate change and why it is worth
researching. It has been widely accepted in recent years that climate change and global warming
are going to raise the sea level around the world. Slow and steady global temperature increases
over the next few decades will melt the ice caps, but more importantly, there will also be an
enhancement in severe storms. While the warming of the planet may be gradual, the effects of
extreme weather induced by climate change -- more storms, floods, droughts and heat waves --
will be acute and immediate (Richardson, 2008). This sense of immediacy is the reason for
preparations to be made now. Murray argues that rising sea levels and warmer oceans pose a risk
to Delaware (2006). She states that the sea level has risen about one foot over the last decade and
an increase of anywhere from two to five feet are expected in the next century.
Climate change will impact more than just the infrastructure of the east coast. The Center
for Integrative Environmental Research (CIER) in “US Economic Impacts of Climate Change:
Review & Assessment” looks at how inaction will affect our economy (2008). While the report
focuses on the impact in Maryland the findings are also generalized, recognizing that climate
change will impact the energy supply, human health, and reliability of water supply networks for
agriculture. Moreover, storms and sea level rise threaten coastal infrastructure, including the
transportation corridors (CIER 2008). The article concludes that the shoreline is not stationary
and will move inwards, therefore there is a cost for inaction that is likely to stay and/or increase
(CIER 2008).
Climate Change and Rising Sea Levels
Malkin - 5 -
The National Research Council performed studies that concluded there is a 99 percent
probability of occurrence for the sea level to rise. Globally, the rise will be from 0.18 meters (7.1
inches) to 0.59 meters (23.2 inches) by the year 2099 but will not be uniform. In the metropolitan
areas along the east coast during the time period1980 to 2080, it is estimated for the sea levels to
rise from 0.24 meters to 1.08 meters (0.8 feet to 3.5 feet). If the event of a 100 year storm is
factored in, the levels could rise up anywhere from 3.2 meters to 4.2 meters (10.5 feet to 14 feet).
The most immediate impact of climate change will be on coastal roads and rail lines. These
corridors will be permanently inundated in the next century and it will be up to the engineers to
make the preparations to deal with erosion and subsidence of road bases and rail beds (National
Research Council of the National Academies, 2008).
Since it necessary to prepare for the eventual rise in sea levels, the use of GIS is helpful
in mapping out the possible impacts. In “Methods of Disaster Research”, Dash explains what
GIS is and why it is important to use for disasters. She states that it is a valuable tool and if used
correctly can be very beneficial (Dash 2002). The use of the spatial representation and analysis
capabilities of the computer based geographical information system (GIS) will develop a clear
visual representation of the railroad corridors in possible impact areas.
5.2 What are the previous applications of GIS to disaster research?
Before performing my GIS analysis of New Castle County, Delaware, I wanted to
research and review what other regions around the world have attempted this process and their
respective results. Overall, I found that GIS was viewed as a helpful and useful tool.
GIS has been used all over the world for many different reasons. It was used for looking
into improving emergency response to blizzards and flooding in Shenandoah Valley, Virginia. It
was felt that the GIS maps and data were very helpful for emergency planning, response,

Climate Change and Rising Sea Levels
Malkin - 6 -
mitigation, and recovery efforts and that local government should view GIS as a useful tool that
can be obtained on even a small budget (Pine 1997). Another case study was used during
Hurricane Fran involving GIS models. Emergency managers used these models to make
decisions about potential flooding and identified which portions of the population needed to
evacuate given areas (Dymon 1999).
The capabilities of GIS are also illustrated through other applications. GIS has even been
used in the application of mapping tourism development (using methods of overlaying layers) in
Lombok Island, Indonesia (Minagawa 1999). In the transportation literature, GIS has been used
to determine the capabilities needed for transportation hazard analysis and incident management
(Leposfsky, 1993) using case studies of two highways in California. On a more global scale, an
extensive study was performed in developing countries around the world (South Asia, Middle
East & North Africa, Latin America & Caribbean, East Asia & Pacific, Sub-Saharan Africa)
using a one meter sea level rise. It summarized that most areas would be significantly impacted
(Dasgupta et al., 2009).
Suareza, Anderson and Mahal (2005) provide good examples (focusing on the Boston
Metro area) of why we need to pay attention to climate change and the impacts on transportation.
They used modeling scenarios (UTMS6) to look changes in the number of vehicle hours traveled
(VHT) and vehicle miles traveled (VMT) in the event of a flood. The results showed that there
were more delays and lost trips due to this flooding, but not enough to adapt to a new
infrastructure. (Suareza, Anderson and Mahal, 2005). The University of Washington and King
County also developed a GIS map of the city of Olympia and the inundation levels from current
and projected changes in high tides (2007).
6. Methodology 6 Urban Transportation Modeling System (UTMS) overlays flood maps with road networks

Climate Change and Rising Sea Levels
Malkin - 7 -
The main methodology used in this research uses the spatial representation and analysis
capabilities of the computer based geographical information system (GIS). The base map data is
the United States Geographical Survey’s (USGS) Delaware DataMIL ftp web site (Delaware
DataMIL, 2009). First, information is gathered
to create base map of New Castle County,
Delaware. The basic data includes the state and
county outline, current topography7/elevation
data (using the Delaware dataMIL Website),
and current sea level information. Once this
data is gathered, the shapefiles8 are imported
into GIS to develop a general (very basic) map
of New Castle County, Delaware in which is
referred to as “Current Conditions” (Figure 1).
In Figure 1, the state/county outline is colored in
black. The elevation data is colored coded, ranging from
dark green (lower elevation) to yellow to red (higher
elevation). The blue shown in Figure 1 represents areas
under the current sea level. Once the base map is
established, the location of the railroad lines (from the USGS Delaware DataMIL ftp web site) are added in purple.
Figure 1. Current Conditions of New Castle County, Delaware
7 the practice of graphic delineation in detail on maps of natural and man-made features of a place or region especially in a way to show their relative positions and elevation. 8 A popular data format for GIS software. A "shapefile" commonly refers to a collection of files with ".shp", ".shx", ".dbf", and other extensions on a common prefix name.

Climate Change and Rising Sea Levels
Malkin - 8 -
Now that the base map is established, the next step is to add and import different layers of
data onto the already created map. These different layers to the map include data such as the
location of the railroad lines (from the USGS Delaware DataMIL ftp web site) as well as
different scenarios of sea level elevations. After this is completed, a comprehensive visual
illustration of the impact areas in which rail lines are in danger of being either flooded or perhaps
destroyed is developed (Figure 2).
5 10 20

Climate Change and Rising Sea Levels
Malkin - 9 -
30 40
Figure 2. Predicted visual illustrations of sea level rise ranging from 5 foot increase to 40 foot increase.
Figure 2 shows the possible picture of what will happen when the sea levels rise. The
series of maps start with a 5 foot increase move to 10 foot, 20 foot, 30 foot, and finally 40 foot
increase. While most sea level predictions state anywhere from a 2 - 15 foot increase in the next
century, these maps serve as a “worst case scenario” for not only this upcoming century, but
years after.
As seen in Figure 2, as the sea level rises there are many possible impact areas for the
railroad lines in New Castle County, Delaware. More specifically, the Port of Wilmington is the
most likely to be affected.
Climate Change and Rising Sea Levels
Malkin - 10 -
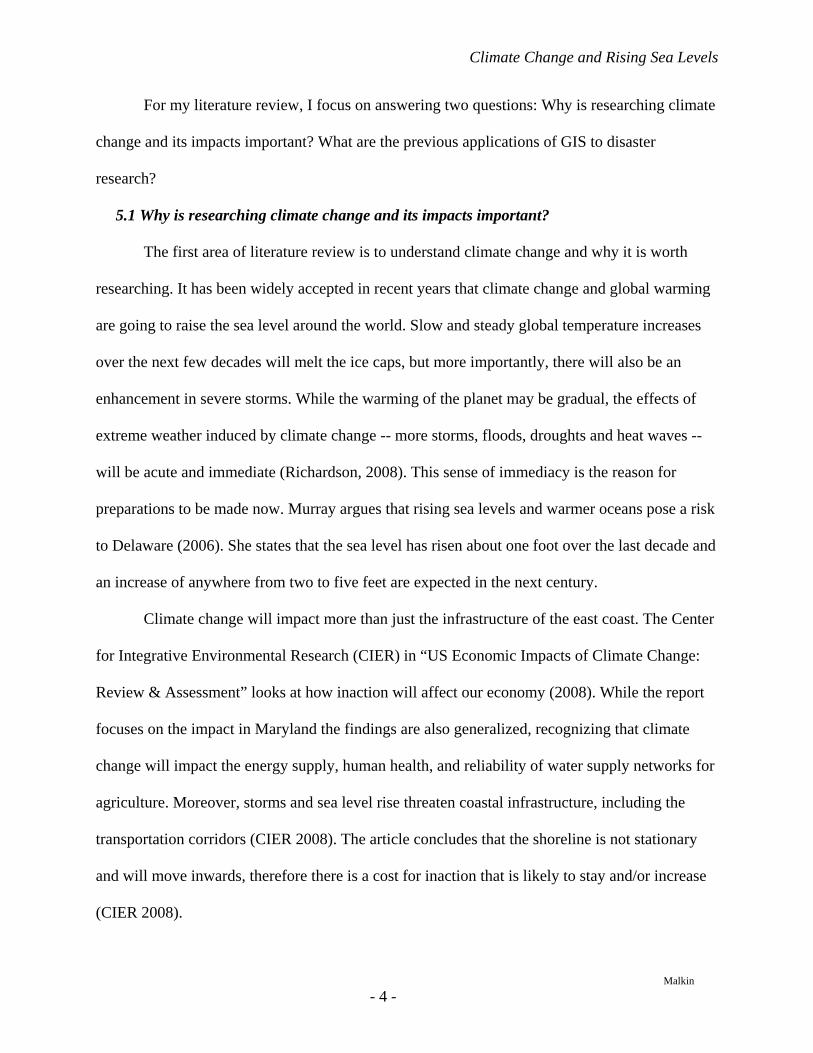
Figure 3. Current conditions highlighting the rail line south of the Port of Wilmington
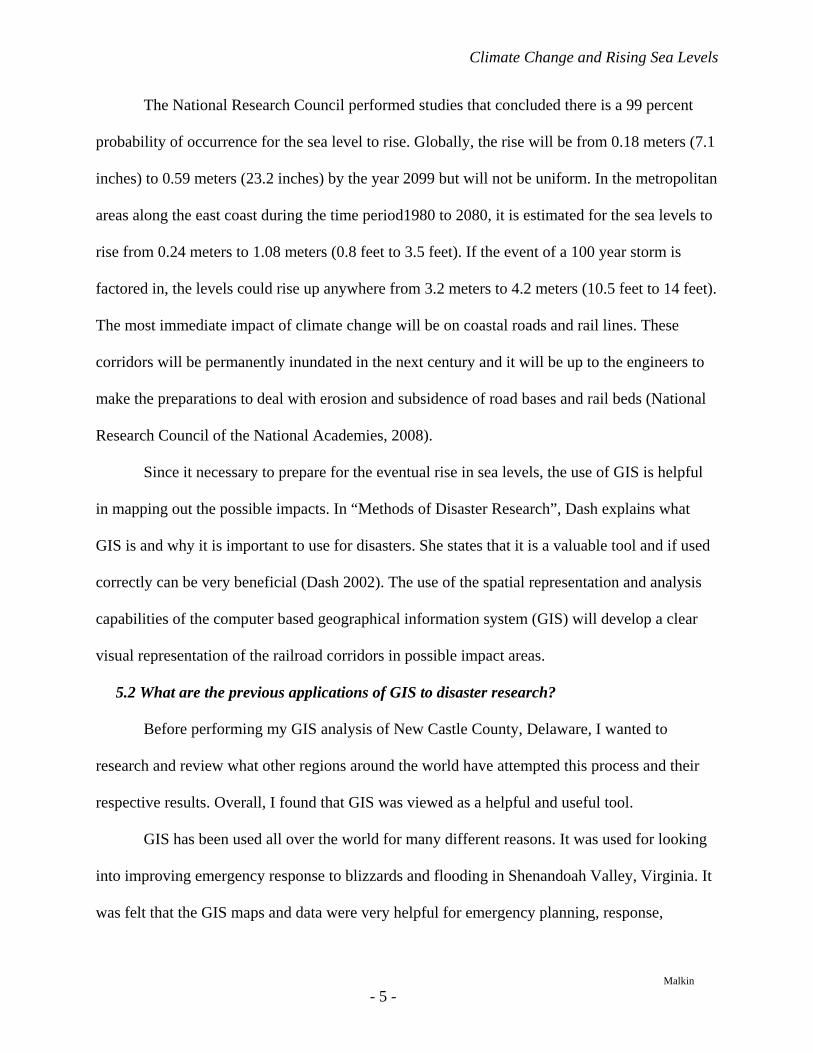
Figure 4. 20 foot sea level increase affecting the area south of the Port of Wilmington

Climate Change and Rising Sea Levels
Malkin - 11 -
While many different impact areas could be addressed, the impact area I wish to address
is the rail line located just south of the port of Wilmington (Figure 3). This rail line is located in
very close proximity to the Delaware River and is vulnerable to the rising sea levels, shown in
Figure 4 (using a 20 foot increase).This rail line is completely encompassed by the sea level rise.
This rail line is a single track owned by Norfolk Southern Corporation. Some photos of the rail
line are shown below (Figure 5). This rail line is used mainly for the transportation of industrial
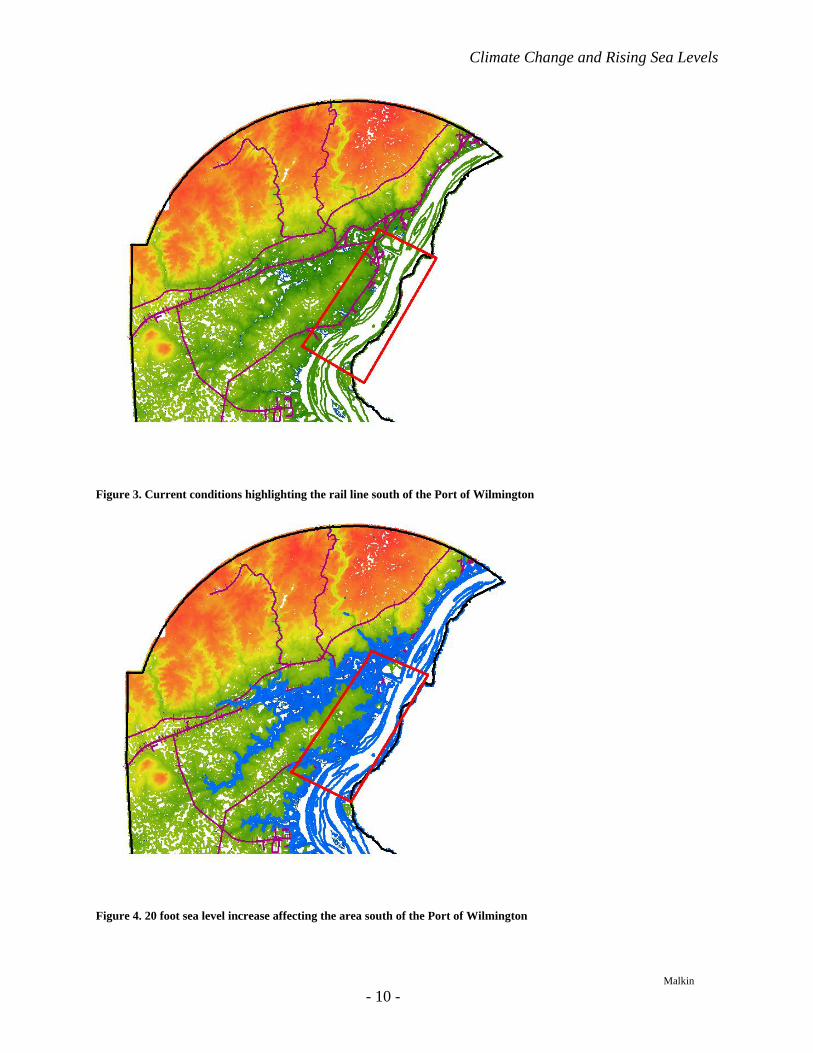
goods. Figure 6 breaks down the percent of railway operating revenue (Norfolk Southern, 2009).
According to the model in Figure 3 & 4, the rail line needs to be raised or moved in order to
prevent damage from flooding.
Figure 5. Photos of Rail line illustrated in figures 3 & 4, taken on site
Coal, coke, and iron ore 29%
Intermodal 19%
Agriculture, fertilizer, and consumer products 12%
Chemicals 12%
Metals and construction 12%
Automotive 8%
Paper, clay and forest products 8%
Climate Change and Rising Sea Levels
Malkin - 12 -
Figure 6. Percent of railway operating revenue for Norfolk Southern
7. Conclusion/ Possible Implications of Research
One possible benefit to this research would be to help railroad companies (such as
Amtrak and Norfolk Southern) who may have railroads in impact areas. These maps provide
some information that may prepare them for the future and may alter the planning and
construction of these railroads. Moreover, the rail line I addressed in Figures 3 and 4 is owned by
Norfolk Southern. Some policy implications that these companies may want to look into are to
ask for financial assistance in raising the elevations of the rail bed or relocating the tracks to less
flood prone locations.
There are many societal impacts of the sea level rise. If these rail lines are to be
inundated, travelers may not be able to get to their destinations. In addition, the transportation of
goods will be affected. It will be necessary to find alternative routes for these people and goods
to travel throughout the east coast. For more of a “big picture” aspect of the impacts of sea level
rise, it should be understood that other infrastructure (such as roads and airports) will also be
affected. Therefore, alternate routes for travelers and transportation of goods may be even more
difficult to locate.
8. Future Research
There is some difficulty with this analysis when it comes to the rail line data. The railroad
data assumes the rail lines are on the same elevation as the ground surface in all regions of the
county despite the fact this is not true. Therefore more research to find more accurate data is
needed. Rail line data with their respective elevations will give a better description of the future
sea level rise and its impacts. This research should be continued in order to prevent damage of
the nation’s infrastructure along the east coast.
9. References
Climate Change and Rising Sea Levels
Malkin - 13 -
Center for Integrative Environmental Research (CIER), University of Maryland. “US Economic
Impacts of Climate Change, A Review and Assessment.” (August 2008) <http://www.cier.umd.edu/climateadaptation/Chapter3.pdf>.
Dasgupta, Susmita, et al. “Sea-level Rise and Storm Surges: A Comparative Analysis of Impacts
in Developing Countries.” (2009). Dash, Nicole. “The Use of Geographic Information Systems in Disaster Research”. Ed. Robert
Stallings. Methods of Disaster Research. Philadelphia, PA: Xlibris, (2002). Dymon, Ute J. “Effectiveness of Geographic Information Systems (GIS) Applications in Flood
Management During and After Hurricane Fran (Quick Response Report #114)”. Boulder, CO: Natural Hazards Research and Application Information Center, (1999).
Lepofsky, Mark and Mark Abkowitz. “Transportation Hazard Analysis in Integrated GIS
Environment.” Journal of Transportation Engineering. 119.2 (1993):239-54. Minagawa, Yasunori and Nami Tanaka. “The Application of Geographic Information Systems to
Tourism Development Planning: A Case Study of Site Selection in Lombok Island, Indonesia.” Regional Development Studies. 5 (1999):139-59.
Murray, Molly. “Rising Sea Level, Warmer Oceans Pose Risk to Del.” (11 August 2006). The
News Journal. National Research Council of the National Academies. “Potential Impacts of Climate Change on
U.S. Transportation.” Transportation Research Board Special Report 290. (2008). Norfolk Southern. Corporate Profile web page. 2009. <http://www.nscorp.com/nscportal/ nscorp/Media/Corporate%20Profile/#11>. Pine, John C. “Geographic Information Systems (GIS) in Small Communities: Application of
GIS in Emergency Management (Quick Response Report #99).” Boulder, CO: Natural Hazards Research and Applications Information Center, (1997).
Richardson, Michael. “Climate Change Controversy: It’s Impacts and Opportunities.” The
Jakarta Post. (10 July 2008). <http://www.thejakartapost.com/news/2008/07/10/climate-change-controversy-its-impacts-and-opportunities.html>
Suareza, Pablo, William Anderson, and Vijay Mahal. “Impacts of Flooding and Climate Change
on Urban Transportation: A Systemwide Performance Assessment of the Boston Metro Area.” Transportation Research Part D: Transport and Environment 10, no. 3 (2005): 231-244.
United States Geographical Survey. Delaware DataMIL. ftp site. 2009.
<ftp://ftpext.usgs.gov/pub/cr/mo/rolla/datamil/>.

Climate Change and Rising Sea Levels
Malkin - 14 -
University of Washington and King County. “Preparing for Climate Change: A Guidebook for
Local, Regional, and State Governments.” (September 2007) < http://www.iclei.org/ documents/USA/download/0709climateGUIDEweb.pdf>.