climate change and california forests malcolm north sierra nevada research center, davis, ca
TRANSCRIPT

Climate Change and California Forests
Malcolm NorthSierra Nevada Research Center, Davis, CA

-5
-4
-3
-2
-1
0
1
2
3
4
5
6D
EG
RE
ES
C
1890 1900 1910 1920 1930 1940 1950 1960 1970 1980 1990 2000 2010
YEARS
October
May
June
Greatest changes are in nighttime minima
Tahoe City1875 m
Courtesy of Hugh Safford

Prec
ipita
tion
(mm
)
Tem
pera
ture
(C)
2000 2020 2040 2060 2080 2100
400
800
1600
1200
2000
0
10
14
12
16
20
18
Year
Temp-HAD
Temp-PCM
Precip-HAD
Precip-PCM
HAD = Hadley Center 2 model: Very warm-wet future
PCM = Parallel Climate Model: Warm-dry future
California future climates: alternate scenarios
Source: Electrical Power Research Institute 2003
60% of climate models predict increased ppt for California in general
23% predict decrease
17% predict no change
Courtesy of Hugh Safford

Expansion of C4 grassland
Warming benefits broad-leaved spp at expense of needle-leaved
Loss of habitat as warming drives veg-types higher
Loss in shrubland due to increase in fire (= grassland) or higher ppt (= trees)
Courtesy of Hugh Safford

Vegetation Vegetation community responsescommunity responses
Historic conditions, and predictions for 2100 based on the Hadley and PCM models
Lenihan et al. 2003. Ecol Appl 12.
Courtesy of Hugh Safford

0
200
400
600
800
1000
1200
1400
1600
-5 0 5 10 15 20
Mean annual temp (C)
Mea
n a
nn
ual
pp
t (m
m)
ABCO
PIPO
QUKE
PSME
ABMA
PIAL
Species-specific responses: species will respond based on their own physiological response and their interactions with other species. Future communities will not look
like current communities.
Chaparral and gray pine
Courtesy of Hugh Safford

Centennial-Scale Climate Trends HoloceneCentennial-Scale Climate Trends Holocene
MULTI-PROXY ANALYSIS
Early Holocene 10500 to 7500 YBP Warming
Mid-Holocene 7500 to 5000 YBP Warmest, Dry
Post Mid- Holocene
Transition 5000 to 3500 YBP Cooling, Wetter
Neoglacial 3500 to 2600 YBP Cool, Wet
Post-Neoglacial
Drought 2600 to 1600 YBP Intense Drought
Post-Drought Transition and Medieval
Warm Period 1600 to 650 YBP Dry but Summer Wet
Little Ice Age 650 to 150 YBP Cool Wet, Cool Dry
Recent < 150 YBP Warm, wetFrom Tausch et al. 2004
Courtesy Connie Millar

Giant Sequoia Glacial: Interglacial Dynamics
East Lk, 2863m, < 10kyr
Kings Cyn, 1000m, 20kyr
Central Valley, 54m, 26-22kyr
Mono Lk, 1950m, 10-11.5kyr
Current range,
W Sierra,
1370-2200m
Davis 1999a, Davis 1999b, Power 1998, Cole 1983
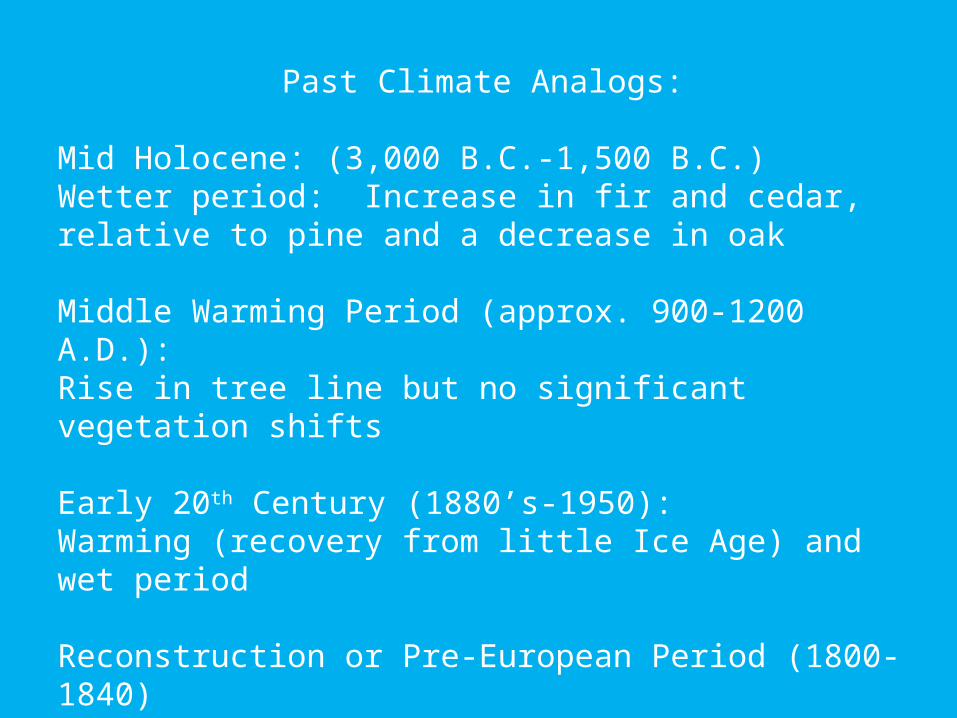
Past Climate Analogs:
Mid Holocene: (3,000 B.C.-1,500 B.C.)Wetter period: Increase in fir and cedar, relative to pine and a decrease in oak
Middle Warming Period (approx. 900-1200 A.D.):Rise in tree line but no significant vegetation shifts
Early 20th Century (1880’s-1950):Warming (recovery from little Ice Age) and wet period
Reconstruction or Pre-European Period (1800-1840)Very unusual period: end of the little Ice Age with cool, dry conditions

Historic Climate Naturally Fluctuated • Cyclically
• Nested Time Scales - Millennial - Centennial - Decadal
- Interannual • Rapid and Abrupt Transitions
Plants track climate at each scale, but respond with unexpected lags and threshold behaviors
Millar 2003

CADECADE
PIPOPIPOPIJEPIJE
ABCOABCO
Sens
itivi
ty to
air
pollu
tion
(N a
nd o
zone
)
Susc
eptib
ility
to in
sect
/dis
ease
CADECADE
PIPOPIPO
PIJEPIJE
ABCOABCO
PILAPILA
Sens
itivi
ty to
incr
ease
d te
mpe
ratu
res
ABCOABCO
PILAPILA
PIPOPIPO
CADECADE
Sens
itivi
ty to
wat
er s
tres
s
PIPOPIPOPIJEPIJE
CADECADE
ABCOABCO
Sens
itivi
ty to
fire
(adu
lt)
CADECADE
PIPOPIPOPIJEPIJE
ABCOABCO
Southern California forests: interactions of multiple stressors
Who wins?
Pollution Insects/disease Temps H2O stress Fire
Courtesy of Hugh Safford

1760 1770 1780 1790 1800 1810 1820 1830 1840 1850 1860 1870 1880 1890 1900 1910
est.date
0
6
12
27
# e
stab
lishe
d
-6
-3
0
3
6 PD
SI
abcoabmacadepijepilaPDSI
Before fire suppression (1865 on this graph), tree death and recruitment is pulsed by fire and El Nino events
North et al. 2005

Oaks were especially sensitive to temperature;
Oak species fluctuated from rare to widespread in W Sierra
Anderson & Smith, 1994

20th Century Responses: Meadow Invasion Central High Sierra Nevada Studies
Found increased colonization in diverse meadows with variable environmental, vegetative, & land-use histories

0
5
10
15
20
25
30
35
40
45
50
Class I Class II Class III Class !V
Per
cen
tag
e
High Density Classes Low
ALL
DEAD
• Mortality in the forest is now primarily driven by drought and beetles • Tree density, from fire suppression contributes to drought stress• The populations of some insects, including many bark beetles, are kept in check by cold over-wintering temperatures
*
*
* Mortality significantly higher than expected in high density and lower in low density

No Burn Burn
Snowpack: Snowpack:
Nitrogen:
None AdditionReduction
Nitrogen: None Addition Reduction
None Control +S - S None Burn only
+ S - S
Addition + N + S + N - S+ N
Addition + N + S+ N - S+ N
What may happen to mixed-conifer understory herbs and shrubs with increasing nitrogen from air pollution, an increase
or decrease in snowpack, and with and without fire?
• Herb biomass increased in shrub dominated communities when snow pack was reduced. • Nitrogen additions unexpectedly increased herbaceous species richness.
• Fire was a more important factor in post-treatment species richness and cover than either snow pack addition or reduction.
Hurteau and North. In press.
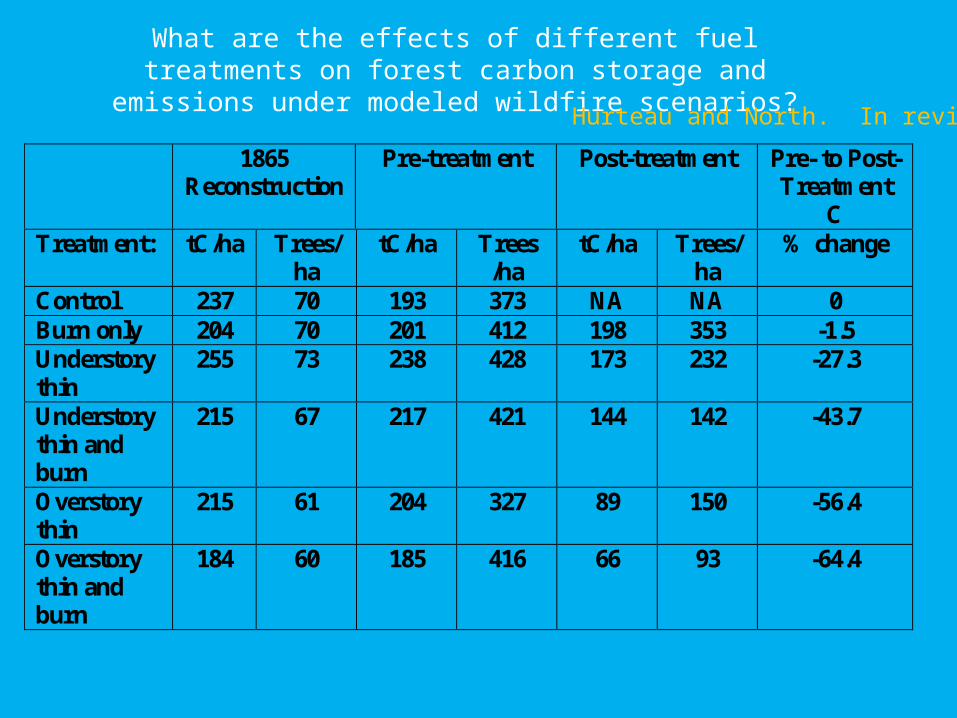
1865 Reconstruction
Pre-treatment
Post-treatment Pre- to Post-Treatment
C Treatment: tC/ha Trees/
ha tC/ha Trees
/ha tC/ha Trees/
ha % change
Control 237 70 193 373 NA NA 0 Burn only 204 70 201 412 198 353 -1.5 Understory thin
255 73 238 428 173 232 -27.3
Understory thin and burn
215 67 217 421 144 142 -43.7
Overstory thin
215 61 204 327 89 150 -56.4
Overstory thin and burn
184 60 185 416 66 93 -64.4
What are the effects of different fuel treatments on forest carbon storage and emissions under modeled wildfire scenarios?
Hurteau and North. In review.

Year
1980 2000 2020 2040 2060 2080 2100 2120
tC h
a-1
100
150
200
250
300
350Control Burn Understory ThinUnderstory Thin Burn Restoration Restoration Burn 1865 1865 Burn
Hurteau and North. In review.
Amount of carbon accumulated after 100 years without wildfire

Year
1980 2000 2020 2040 2060 2080 2100
tC h
a-1
2
4
6
8
10
12
14
16
18
20
Burn Understory Thin Burn Restoration Burn 1865 Burn
Hurteau and North. In review.
Amount of carbon released during prescribed burns over 100 years

Year
1980 2000 2020 2040 2060 2080 2100 2120
tC h
a-1
0
50
100
150
200
250
300
350
Control Burn Understory ThinUnderstory Thin Burn Restoration Restoration Burn 1865 1865 Burn
Amount of carbon accumulated after 100 years with a wildfire in 2010

Year
1980 2000 2020 2040 2060 2080 2100 2120
tC h
a-1
100
150
200
250
300
350
Control Burn Understory Thin Understory Thin Burn Restoration Restoration Burn 1865 1865 Burn
Hurteau and North. In review.
Amount of carbon accumulated after 100 years with a wildfire in 2050

Treatment 2100 Live Tree tC
Rx Fire tC Released
2040 Trees/ha
2050 Wildfire tC Released
Total Released(tC/ha)
2100 Carbon Budget
Control 200.5 NA 541 40.9 40.9 159.6Burn 303.2 55.9 322 19.5 75.4 227.8Understory Thin
240.6 NA 479 25.9 25.9 214.7
Understory Thin + Burn
161.6 46.5 244 15.1 61.6 100.0
Restoration 244.3 NA 241 24.0 24.0 220.3Restoration + Burn
232.3 41.9 89 12.6 54.5 177.8
1865 268.7 NA 215 16.9 16.9 251.81865 + Burn 277.4 27.3* 166 9.4 36.7 240.7
The amount of carbon (tC/ha) stored in live trees and the total amount released over the model’s 100 year run for all prescribed burns (Rx) and for the 2050 wildfire. The 2100 carbon budget is the amount of carbon stored in live trees in 2100 minus the total released in all prescribed fires and the 2050 wildfire for each of the eight treatments. The 2040 trees/ha is each treatment’s stand density in the nearest time step before the 2050 wildfire.

Control WF2050
Diameter Class (cm)
5 15 25 35 45 55 65 75 85 95 >100
Nu
mb
er
of I
nd
ivid
ual
s h
a-1
0
20
40
60
80
100
120
140
160
ABCO ABMA CADE PIJE PILA
Burn WF2050
Diameter Class (cm)
5 15 25 35 45 55 65 75 85 95 >100
Num
ber
of In
divi
dual
s ha
-1
0
20
40
60
80
100
120
140
160
ABCO ABMA CADE PIJE PILA
Understory Thin WF2050
Diameter Class (cm)
5 15 25 35 45 55 65 75 85 95 >100
Num
ber
of In
divi
dual
s ha
-1
0
20
40
60
80
100
120
140
160
ABCO ABMA CADE PIJE PILA
Understory Thin Burn WF2050
Diameter Class (cm)
5 15 25 35 45 55 65 75 85 95 >100
Num
ber
of In
divi
dual
s ha
-1
0
20
40
60
80
100
120
140
160
ABCO ABMA CADE PIJE PILA
Restoration WF2050
Diameter Class (cm)
5 15 25 35 45 55 65 75 85 95 >100
Num
ber
of In
divi
dual
s ha
-1
0
20
40
60
80
100
120
140
160
ABCO ABMA CADE PIJE PILA
Restoration Burn WF2050
Diameter Class (cm)
5 15 25 35 45 55 65 75 85 95 >100
Num
ber
of In
divi
dual
s ha
-1
0
20
40
60
80
100
120
140
160
ABCO ABMA CADE PIJE PILA
1865 WF2050
Diameter Class (cm)
5 15 25 35 45 55 65 75 85 95 >100
Nu
mb
er
of I
nd
ivid
ua
ls h
a-1
0
20
40
60
80
100
120
140
160
ABCO ABMA CADE PIJE PILA
1865 Burn WF2050
Diameter Class (cm)
5 15 25 35 45 55 65 75 85 95 >100
Nu
mb
er
of I
nd
ivid
ua
ls h
a-1
0
20
40
60
80
100
120
140
160
ABCO ABMA CADE PIJE PILA
Hurteau and North. In review.

Conclusions:A.Forest communities are unlikely to simply move up
in elevation or latitudeB. Tree species will respond differently, making future
forest compositions difficult to predictC. Snow pack reduction may benefit herbs, but fire is
still the strongest influence on the understoryD.Bark beetles may become a real problem in high
density forests, particularly as winter and night time minimum temperatures rise
E. A preliminary FVS model suggest fuels treatments producing a low-density stand structure dominated by large fire-resistant pines may best protect carbon sinks in wildfire prone forests