climate change – an overview - alan...
TRANSCRIPT

Climate Change –
an Overview
Dr. Alan K. BettsAtmospheric Research, Pittsford, VT 05763
[email protected]://alanbetts.com
Sustainable Development PolicyUVM, Burlington, Vermont
September 18, 2013
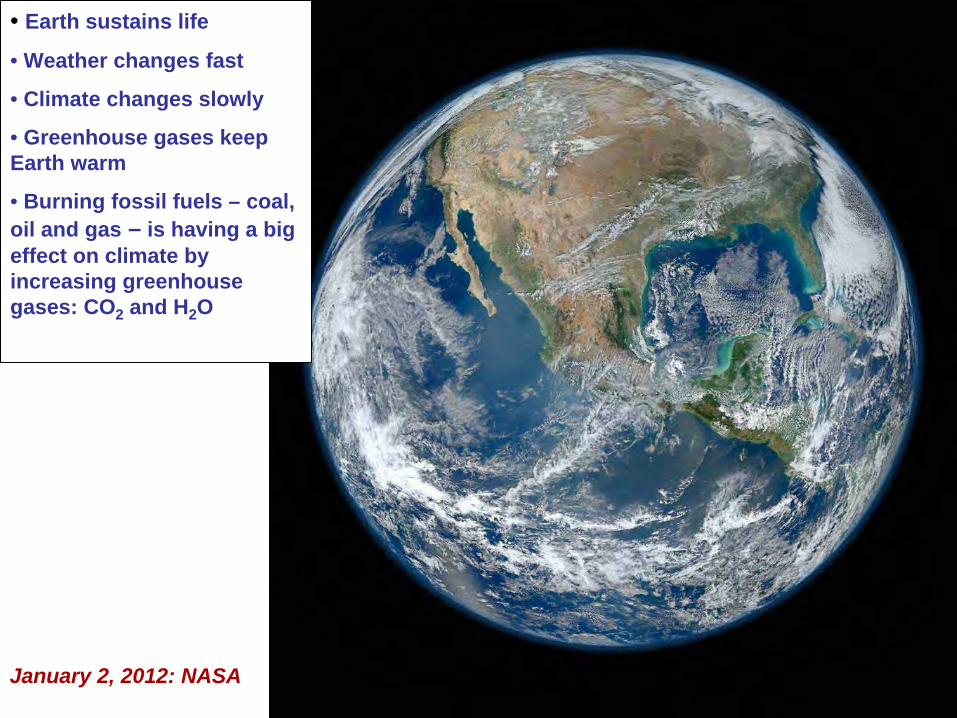
• Earth sustains life
• Weather changes fast
• Climate changes slowly
• Greenhouse gases keep Earth warm
• Burning fossil fuels –
coal, oil and gas
–
is having a big effect on climate by increasing greenhouse gases: CO2
and H2
O
January 2, 2012: NASA

Climate Change• One of the many great challenges for the 21st
century -
present path is unsustainable• We are already decades late in taking action
J. S. Sawyer (1972):
Man-made CO2
and the “greenhouse”
effectCharney
Report (1979): Carbon dioxide and ClimateUN Framework Convention on Climate Change (1992) in Rio, Brasil
- To stop “Dangerous Climate Change”
• It is a global issue & a local issuea societal issue & a personal issue
• Clash between Earth science and economic & social values

Outline• Science of climate change
• Global scale: actual and future• What is happening to Vermont
• The transition we face• Managing the earth system
• Why is it difficult?
Discussion

• Half the Arctic Sea Ice Melted in 2012– less 2013
Sept 16, 2012
End of Nov. 2011 Hudson Bay was still nearly ice-free: Open water in Oct. Nov. gives warmer Fall in Northeast
• Positive feedbacks:
• Less ice, less reflection of sunlight
• More evaporation, larger vapor greenhouse effect
• Ice thin: most 1-yr-old
http://nsidc.org/arcticseaicenews/

Sea Ice Trends
- 3%/decade
- 12%/decade
• Sea ice is thinning rapidly
• Observed September decline appears to be faster than IPCC-AR4 climate model projections
• [AR5 projections should be faster]

June 2012 snow cover minimum
• Arctic warming rapidly– Melting fast– Much faster than IPCC models
• Northeast winters– Same positive feedbacks
Steep fall since 2003
≈
500,000 km2/yr

Snowfall and Snowmelt
• Temperature falls 16F (9C) with first snowfall• Similar change with snowmelt• Snow reflects sunlight; reduces evaporation and
water vapor greenhouse – changes ‘local climate’Betts et al. 2013

Millennial Temperature Record
• “Proxy”
records from before the time of thermometers provide uncertain data, but they’re all we have
Little Ice Age
Medieval warm period0oF
-1oF
2100: +5oF

NASA-GISS, 2011
War-time data problems
+1o F
2100: +5oF
0o F
Global Temperature Rise 1880 –
Present
2012
Increasing aerosols

Global Picture 2010
• Record summer temps• Russia (100°F) Moscow fires• Pakistan
(128°F) Extreme monsoon floods
OC
oC
( 1.2°F )

Carbon Dioxide Is Increasing
Winter
Summer Upward trend + 2ppm/ year

2009 Was “Good”
for the Earth
Need 80% drop by 2050
-
4%/year
Emission
Scenarios
Back on growth: 2010, 2011

Key Diagnostic of the Carbon CycleEvolution of the fraction of total emissions
that remain in the atmosphere
Updated from Le Quéré
et al. (2009). Nature Geoscience; Data: NOAA 2010, CDIAC 2010
Total CO2
emissions
Atmosphere
CO
2Pa
rtiti
onin
g (P
gCy-
1 )
1960 20101970 1990 20001980
10
8
6
4
2
Half to oceans & forests
It takes at least a century to remove CO2
from the atmosphere, and many centuries to remove it from oceans

Rising
Ocean Acidity Threatens Organisms
• From the Tropics to the Arctic, the seas are sucking up emissions of CO2
—from burned fossil fuels
• When CO2
dissolves in water, carbonic acid is produced; the oceans are becoming more acidic
(Ruttiman, Nature,31 Aug. 2006)

Why Is More Carbon Dioxide in the Air a Problem?
• The air is transparent to sunlight, which warms the Earth
• But some gases in the air trap the Earth’s heat , reradiate down, and keep the Earth warm (30oC)
• These are “Greenhouse gases”-
water vapor, carbon dioxide, ozone, methane (H2
O, CO2
, O3
, CH4
, CFCs..)
• CO2
is rising fast: by itself only a small effect

But as CO2
Increases, Strong Water Cycle Feedbacks
• Earth warms, and evaporation and water vapor in the air increases
and this triples the warming
• As Earth warms, snow and ice decrease, so less sunlight is reflected, so winters and the Arctic are warming faster
• Doubling CO2
will warm Earth about 5°F• Much more in the North, over land, in winter• Climate change we are seeing in Vermont will
continue

Global Warming Is Unequivocal IPCC: February 2, 2007 (AR5: Sept. 26, 2013)Since 1970, a rise in:• Global surface temperature• Lower atmosphere temperatures• Global sea-surface temperatures• Global sea level• Ocean heat content• Water vapor• Rainfall intensity• Extratropical precipitation• Hurricane intensity• Drought• Extreme high temperatures• Heat waves
(www.ipcc.ch)
Decrease in:• NH snow extent• Arctic sea ice• Glaciers• Ocean pH (increasing acidity)

2020-2029
2090-2099
“Committed”
Still up to us!
[oC]
(We did nothing for the last 20
years)
(We could halve this if we act now)
Predicted Change in Temperature2020-2029 and 2090-2099, relative to 1980-1999 (oC)

Sea-level Rise Will Eventually Flood Coastal Cities
• Late 20th-century sea-level rise: 1 foot / century
• 21st
century: Likely to triple to 3 -
4 feet / century• And continue for centuries (accelerating
for business as usual)
• http://www.nature.com/news/us-northeast-coast-is-hotspot-for-rising- sea-levels-1.10880

Many Challenges Face Us
• Extreme weather: Floods, fires, & drought-
32 weather disasters >$1B in 2011
• Melting
Arctic and permafrost—methane release is positive feedback
• Ecosystem collapse,
including perhaps forest and ocean ecosystems
• Collapse of unsustainable human population

What Is Happening to Vermont?
• Local climate change indicators
past 40/50 years
• Warming twice as fast in winter than summer• Winter severity decreasing
even faster
• Lakes frozen less
by 7
days / decade• Growing season longer by 3.7 days / decade• Spring coming earlier by 2-3 days / decade
• Extremes increasing• Evaporation increases with T• More ‘quasi-stationary weather patterns’

Vermont Temperature Trends 1961-2008
• Summer +0.4°F / decade
• Winter +0.9°F / decade• Larger variability, larger trend
• Less snow (and increased water vapor) drive larger winter warming

Lake Freeze-up & Ice-out Changing Frozen Period Shrinking Fast
• Ice-out earlier
by 3 days / decade• Freeze-up later by 4 days / decade
Frozen period trend -7 days/decade

Lilac Leaf and Bloom in Spring
• Leaf-out earlier by 3 days/decade (tracks ice-out)• Bloom earlier by 1.5 days/decade• Leaf & bloom change 2.5 days/oF
(4.5 days/oC)
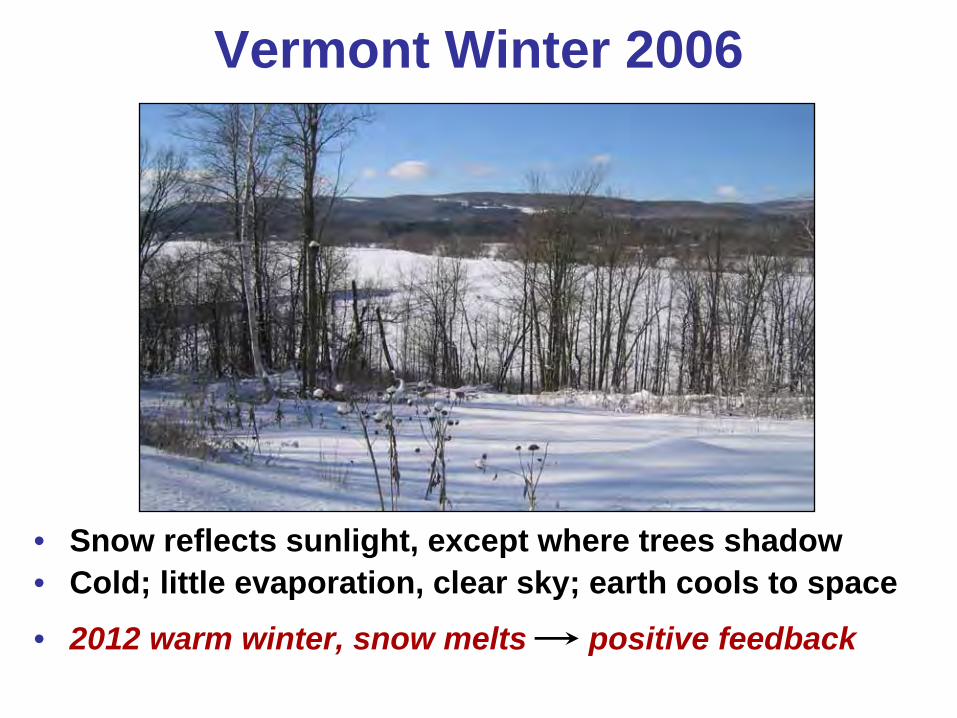
Vermont Winter 2006
• Snow reflects sunlight, except where trees shadow• Cold; little evaporation, clear sky; earth cools to space
• 2012 warm winter, snow melts positive feedback

Winter Hardiness Zones -
NortheastChange in 16 years
Minimum winter T
4: -30 to -20oF
5: -20 to -10oF
6: -10 to 0oF

• VT Hardiness Zone Map 1976-2005 – mean 1990 – South now zone 6
• Half-zone in 16 yrs = 3.1oF/ decade
– triple the rise-rate of winter mean T
– 3 zones/century
• http://planthardiness.ars.usda.g ov/PHZMWeb/
(Krakauer, Adv. Meteor. 2012)
Detailed Map (most recent)

Bennington & Brattleboro are becoming zone 6 (Tmin > -10F)
• Hardy peaches: 2012• More pests survive winter
• What is this?– Oct 1, 2012

Bennington & Brattleboro are becoming zone 6
• Hardy peaches: 2012• More pests survive winter
• What is this?– Oct 1 2012
• Avocado– Didn’t survive frost– 2100 survive in CT– Our forests?

October 2011– March 2012
• Warmest 6 months on record• My garden frozen only 67 days• No permanent snow cover
west of Green Mntns• Contrast snowy winter 2010-11
January 2, 2012 March 11, 2012
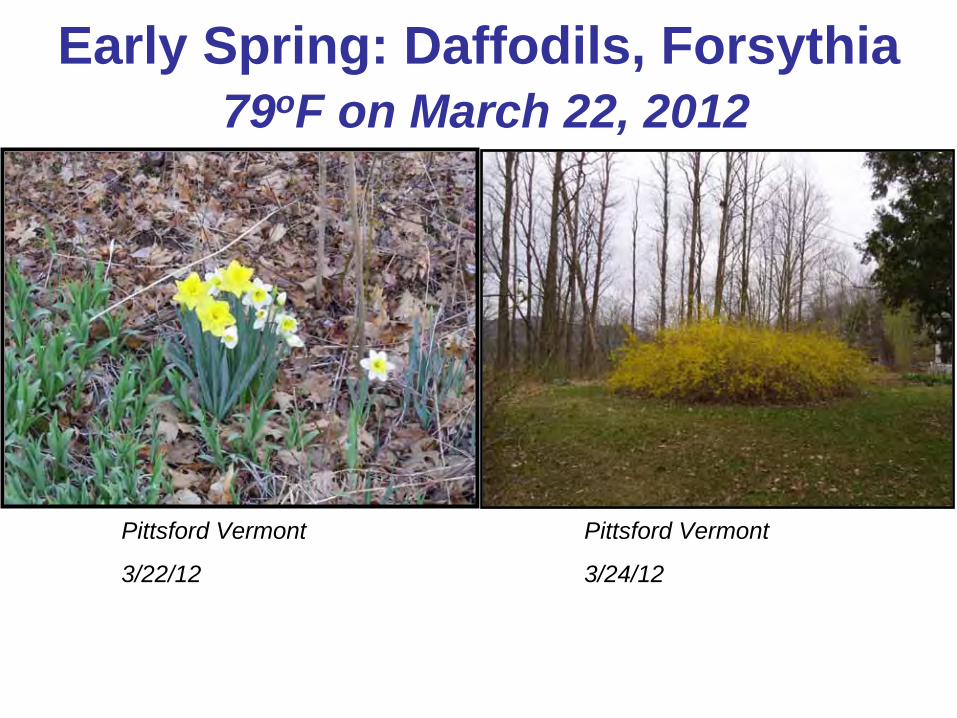
Early Spring: Daffodils, Forsythia 79oF on March 22, 2012
Pittsford Vermont
3/22/12
Pittsford Vermont
3/24/12

2012 Exceptionally
Warm• Burlington Area Extremes • Highest Average
Temperature degrees F • Days: 9/1/2011 - 8/31/2012• Length of period: 365 days • Years: 1850-2012 • Rank Value Ending Date • 1 50.4 8/31/2012• 2 48.4 8/31/2002,
8/31/1949 • 4 48.2 8/31/2010 • 5 48.0 8/31/1999 • 6 47.9 8/31/2006 • 7 47.8 8/31/1991,
8/31/1995 • 9 47.6 8/31/1899,
8/31/1903
http://www.ncdc.noaa.gov/temp-and-precip/maps.php

First and Last Frosts Changing
• Growing season for frost-sensitive plants increasing 3.7 days / decade
• A help for growing “local food”

Vermont’s Future with High
and Low
GHG Emissions
NECIA, 2007
What about tropics?
What about skiing?
Business as usual

Extreme Weather (precip.)• Precip. is condensation of atmospheric water
vapor -
larger latent heat release drives storms• Saturation vapor pressure at cloud-base
increases steeply with temperature (4%/oF)
• Quasi-stationary large-scale flow means longer rain events in low-pressure convergent regions, and longer droughts in high-pressure divergent regions
• As climate changes, quasi-stationary large- scale modes appear to be more frequent– Cause may be Arctic warming: needs more study

2011 Floods: VT and NY• Record spring flood: Lake Champlain• Record flood with tropical storm Irene
March-August, 2011
• Record wet : OH to VT• Record drought: TX & NM
• ‘Quasi-stationary’
pattern

Jet Stream Patterns Slowing Down and Amplifying, Giving More Extreme Weather
(Francis and Vavrus, 2012)

Blocking Pattern -
Unique track
• High amplitude jet-stream + blocking pattern + strong cyclone + hurricane winds + full moon high tide = record storm surge + disaster
[Greene et al., Oceanography, 2013]
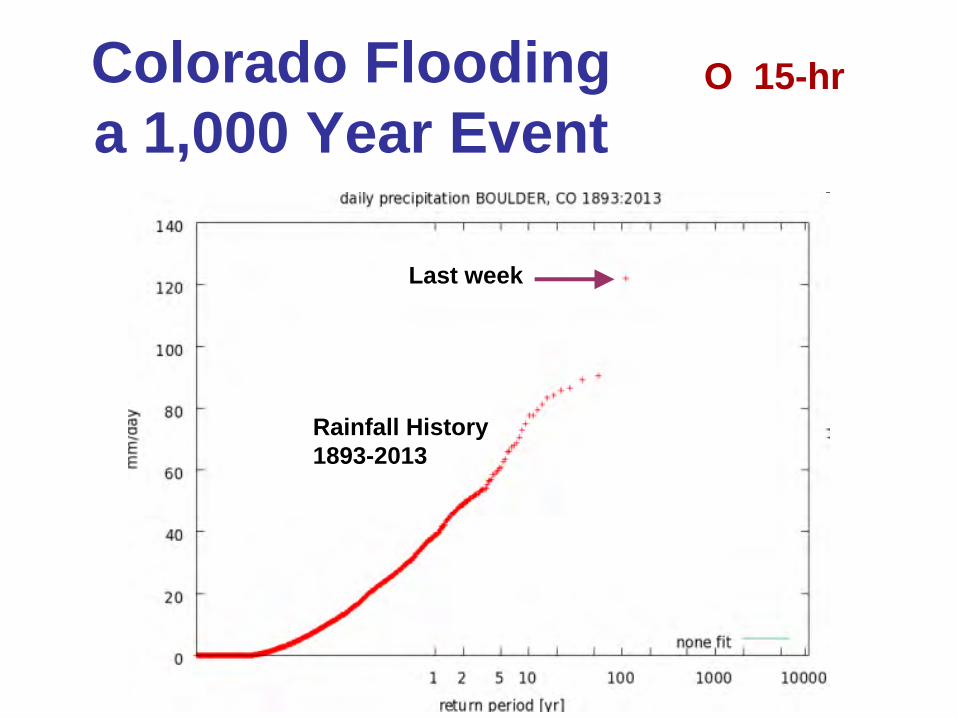
Colorado Flooding a 1,000 Year Event
Rainfall History 1893-2013
Last week
O 15-hr

Outline• Science of climate change
• Global scale: actual and future• What is happening to Vermont
• The transition we face• Managing the earth system
• Why is it difficult?
Discussion

What Lies Ahead?• Accelerating change, increasing extremes• Increasing adaptation and rebuilding costs• Environmental damage that will transform or
destroy ecosystems-
locally and globally• Freely dumping waste streams from society
into atmosphere, streams, lakes and oceans is unsustainable –
long term costs now
exceed $1000 trillion • Will need fossil carbon tax (a “waste” tax)
to incentivize mitigation and pay for the long-term costs

Can We Stop “Dangerous Climate Change”?
(UNFCCC 1992)
• Yes:
Quickly stabilize atmospheric CO2
• This means an 80% drop in CO2
emissions!
• This is very difficult• Fossil fuels have driven our industrial growth and
population growth for 200 years• Our “lifestyle”
has become dependent on fossil
fuels

Managing Our Relation to the Earth System
• Our technology and our waste-streams are having large local and global impacts on the natural world and must be carefully managed
— because we are dependent on the natural ecosystems
• We need new ‘rules’
because– Our numbers and industrial output are so large– Maximizing consumption and profit have led to
present predicament

Guidelines to Minimize Impacts• Planning a trajectory for sustainability• Minimize the lifetime of human waste
products
in the Earth system and eliminate waste with critical biosphere interactions
• Maximize recycling and re-manufacturing to minimize waste-streams and the use of non-
renewable raw materials
• Maximize the efficiency
with which our society uses energy and fresh water
• Maximize the use of renewable resources

Examples of Long-Lived ‘Waste’
• CFCs
–
refrigerants –
very stable –
lifetime centuries -
broken down by sunlight in
stratosphere –
catalyze ozone destruction, which protects earth from UV
• CO2
from fossil fuels
–
lifetime centuries –
a greenhouse gas that traps earth’s heat radiation –
pushing earth to warmer climate
• Nuclear waste
–
plutonium-239: half-life 24000 years –
nuclear weapons
Efficiency Comes First
• We need to double or triple our energy efficiency
because…
• We cannot replace current fossil fuel use with biofuels & renewable energy
• Oil and gas reserves are limited, but coal & oil shale reserves are sufficient to push CO2
to 1,000 ppm—and in time melt icecaps • Can we “sequester”
CO2
(put it back in the earth)?

Why Is It Difficult for Us?• The “American dream”
is crumbling
• “Economic growth”
based on fossil fuels, debt, and consumerism is unsustainable
— and a disaster for
the planet!
• Individual “rights”
and the needs of humanity must be balanced
against the needs of the
earth’s ecosystem
• We don’t know how to
guide and manage technology
—so the result is tremendous
successes and catastrophic failures

Why Is It Difficult for Us?
• Fossil fuels reserves are worth $20-30T• Regulating emissions of CO2
is an “unfair cost”
to the “free market”
• Real Earth system issues being ignored• Our politics are facing collapse –
becoming a fantasy disconnected from the real world

We Passed the Carrying Capacity of the Earth in the 1980s (?)
• Population is still rising• Consumption still rising• Fossil fuel use still rising
• We still ‘believe’ in Growth
• Global poverty & suffering are growing: the future looks bleak for billions
• In a finite world, growth leads to overshoot & collapse
1800 21002010
10000
1000
Population growth: 1800-2100 (UN)

Surely Technology Can Save Us?• Critical for transition but real issue is
• Our world of technology is having a global impact on the natural world, which is alive, complex and beyond our ‘control’
• So technology must be carefully managed — particularly our waste-streams — because we
are dependent on the natural world
• But this is challenging with our ideology

Technology can be Useful Trucks or lightweight..
30 mph Danish electric tricycle: with 150 mile range

Our Choices Are Bounded
• Humanity is an integral part of the earth system and dependent on its stability
• We do not have the freedom to do what we wish, whatever our economic, political or theological doctrine
• The response of the Earth system to human- centered arrogance will be sufficiently large
this century that we will rethink our doctrine
• We would be wise to rethink sooner rather than later

Can’t Avoid the Big Issues!• Regulation is good –
Reagan, G.H. Bush and
Riley (EPA) pushed through the Montreal Protocol and the Clean Air Act Amendments over business opposition and saved the Earth from an ozone catastrophe
• Technology must be managed to minimize human impacts on the Earth
• Impacts have to be fully
costed
• People need a vote, so they need to be informed

What Do We Need?• So we need honest, truthful, smart
pathways
forward • That will not frighten people
into paralysis
• That will spread hope, not anger or despair
• That sidestep ideological barriers with new language
• That develop adaptive governance• The US Constitution gives no rights to the Earth
• That respect Earth system processes & limits
• That deal with society’s fears

The Future Is Not Our Past
• Collectively, we create the future, so we need to plan for a transition to a sustainable society
• Efficient society• Renewable technologies to replace fossil fuels

What Do We Need To Do?• The transition to a sustainable society will take
decades and a community effort– www.transitionnetwork.org
• Food:
local agriculture & gardens• Energy:
Double energy efficiency ….
-
home heating –
district heating + cogen-
renewable electricity mix
-
efficient transportation system-
careful forest management
• Finance:
relocalization
in real world

What Will This Mean For You?• Society needs to rethink its relationship to the natural
environment and its ecosystems in less than one generation
• Our ‘lifestyle’
is disconnected from what the earth can sustain and the large inertia of the earth system is masking the extent of the crisis we face
• Individual can rethink priorities but societal changes are needed: from towns to global
• Ask – Is this an efficient and sustainable way of doing this?– Do I have a deep understanding and connection to Earth?

Discussion• http://alanbetts.com
- this talk http://alanbetts.com/talks-
articles at http://alanbetts.com/writings
-
papers at http://alanbetts.com/research
• Vermont Climate Change Indicators• Seasonal Climate Transitions in New England

Temperature Extremes are a Sign of Global Warming
• Frequency of occurrence (vertical axis) of local June-July-
August temperature anomalies for Northern Hemisphere land in units of local standard deviation (horizontal axis). The normal (gaussian) distribution bell curve is shown in green.
• Large increase in anomalies > +3σ
is global warming(±
3σ
includes 99.7% of data in 1951-1980 base period)
(Hansen, 2012)

Western Forest Fires: 2000s• 1,000 acre fires: twice as many as 1970s• 10,000 acre fires: seven times as many as
1970s• 100,000 acre wildfires do not appear in
records before the late 1980s.• Burn season 2.5 months longer than 1970s• Early snowmelt; warmer, drier spring &
summer and forest management practice
• Each 1oC warming quadruples area burned

CO2
is the Primary Control Knob in the Climate System
• Falls 5oC in 1 year; 35oC in 50 years• Water vapor falls 90%; cloud-cover goes to 75%; sea-ice to 50%
Remove CO2
and other ‘non-condensing’
GHG from climate model &
Global Temperature plunges
44N -28C
(Lacis
et al., Science, 2010)

Climate and Resilience• Trend to milder winters; longer growing
season; earlier spring –
variability large• Trend to more precipitation in cool season;
more wet snow and mixed in winter• Warmer summers; heavier rain
in summer;
periods of drought –
increase infiltration and water storage –
forests stabilize climate
• Agriculture issues– Build soil carbon and organic matter for water
storage and fertility– Recycle nutrients and phosphorus

Lilac Leaf-out and Ice-out Coupled
• Lilac leaf and lake ice-out both depend on Feb. Mar. and April temperatures
• Trends indicate earlier spring

Maples and Lilacs in spring
• Maple bud elongation mirrors lilac leaf• Maple leaf-out mirrors lilac bloom

Very Heavy Precipitation Is Increasing
• Most of the observed increase in precipitation during the last 50 years has come from the increasing frequency and intensity of heavy downpours.
• 67% increase in Northeast
• Little change or a decrease in the frequency of light and moderate precipitation
• Vermont streamflow
is increasing