climate change 091109f - friends of science - climate... · 3 climate change i: global warming...
TRANSCRIPT

Climate ChangeBy Dr. A. Neil Hutton
www.cspg.org
Sun
Sunspot
Relative sizeof the Earth
You are here

Climate Change
Contents
1) Global Warming Debate ..........................................................................................................................32) The World’s Historic Climate.................................................................................................................53) Carbon Dioxide ..................................................................................................................................... 114) The Greenhouse Effect ......................................................................................................................... 175) Here Comes the Sun ............................................................................................................................. 216) Fearmongering ........................................................................................................................................ 297) The Spin Cycle ........................................................................................................................................ 358) Global Circulation Models .................................................................................................................. 399) Economics ............................................................................................................................................... 4510) Afterword ............................................................................................................................................. 51
Climate Change was originally published as a ten-part series in the Canadian Societyof Petroleum Geologists’ monthly magazine, The Reservoir, between January andNovember 2009.
The CSPG thanks Dr. Neil Hutton for his work in making this series possible.
cover designed from images of the NASA/Goddard Space Flight Center Scientific Visualization Studio
The RESERVOIR is published 11 times per year by the Canadian Societyof Petroleum Geologists. This includes a combined issue for the monthsof July and August. The purpose of the RESERVOIR is to publicize theSociety's many activities and to promote the geosciences. We look for bothtechnical and non-technical material to publish. Additional informationon the RESERVOIR's submiss ion guidel ines can be found at http: / /www.cspg.org/publications/pubs-reservoir-submissions.cfm.
The contents of this publication may not be reproduced either in part orin full without the consent of the publisher.
No official endorsement or sponsorship by the CSPG is implied for anyadvertisement, insert, or article that appears in the Reservoir unlessotherwise noted. All submitted materials are reviewed by the editor. Wereserve the right to edit all submissions, including letters to the Editor.Submissions must include your name, address, and membership number(if applicable). The material contained in this publication is intended forinformational use only.
While reasonable care has been taken, authors and the CSPG make noguarantees that any of the equations, schematics, or devices discussed will
perform as expected or that they will give the desired results. Someinformation contained herein may be inaccurate or may vary from standardmeasurements.
The CSPG expressly disclaims any and all liability for the acts, omissionsor conduct of any third-party user of information contained in thispublication. Under no circumstances shall the CSPG and its officers,directors, employees, and agents be liable for any injury, loss, damage orexpense arising in any manner whatsoever from the acts, omissions orconduct of any third-party user.

3
CLCLCLCLCLIMAIMAIMAIMAIMATE CHANGTE CHANGTE CHANGTE CHANGTE CHANGE I:E I:E I:E I:E I:Global Warming Debate by Dr. A. Neil Hutton
A while ago, it came to my attention thatAPEGGA was undertaking a survey ofMembers’ views on the subject of ClimateChange. In reviewing responses to othersurveys, such as those generated by AAPG, itwas evident that the responders ranged overan entire spectrum of opinion. Many appearednot to be fully conversant with the range ofcurrent, related research or were relyingonly on the uncritical reporting by the media.On the whole, the media have done aremarkably poor job in reporting on globalwarming. Typically, the reports have been asimple regurgitation of the spin produced bythe Intergovernmental Panel on ClimateChange (IPCC).
The use of the term “spin” may seem anunusual way in which to characterizeobjective scientific reports. However theIPCC Summary for Policymakers (SPM),where the media generally obtain theirinformation, does not always reflect theopinions in the scientific report and in someinstances actually contradicts the conclusionsof the scientists. For example, the IPCCSummary for Policy makers, (IPCC 2001b, p.10) states that “there is new and strongerevidence that most of the warming observedin the last 50 years is attributable to humanactivities”. Although in the scientific reportitself, (IPCC 2001a, Chapter 1, p. 97) theconclusion is quite different: “The fact thatthe global mean temperature has increasedsince the late 19th Century and that othertrends have been observed does notnecessarily mean that an anthropogenic effecton the climate system has been identified.Climate has always varied on all time scales,so the observed change may be natural.”
In an extraordinary move last spring the IPCCreleased the 21-page SPM for the FourthAssessment Report (2007) more than threemonths ahead of the 1,600-page scientificreport. This was to ensure that the scientificreport was consistent with the SPM. In otherwords the science was not to conflict withthe politics!
The general public and the media, apparently,are quite unaware of these contradictionsand are much taken up with the emotionalaspects of the reports of melting arctic ice,glaciers, and the snows of Kilimanjaro, aswell as many other weather catastrophesappearing in the press. In the northernhemisphere there has been warming;
however warming, in itself, does not provethe hypothesis of global warming as a resultof the release of carbon dioxide in theatmosphere. Nevertheless, the manmade, or“Anthropogenic , Global Warming,Hypothesis” has been widely accepted by themedia and the public. Global warming studieshave become big business. Indeed, it hasattained near religious status among thegreen lobby, result ing in unwarrantedpersonal attacks on some scientists’credibility and integrity and attempts to placethem in the same category as holocaustdeniers. The objectivity and impartiality ofpeer review has been compromised whileresearch funding becomes more difficult toobtain for those expressing critical views.
At this point I will quote a comment bymeteorologist Piers Corbyn in the WeatherAction Bulletin, December, 2000: “Theproblem we are faced with is that themeteorological establishment and the globalwarming lobby research bodies whichreceive large funding are now apparently socorrupted by the largesse they receive thatthe scientists in them have sold theirintegrity.” It is worth mentioning here thateven under President George Bush, theUnited States has spent $29 billion on climateresearch in the last six years. This is morethan double what was spent on the ApolloSpace Program.
The SPM of the IPCC Fourth AssessmentReport made four basic points, none of whichcan be supported scientifically. In order tosupport their arguments, there has been apattern of data manipulation in a highlyunscienti f ic attempt to confirm theanthropogenic (man-made) warming theory.
The four cornerstones of the of the IPCCglobal warming hypothesis are:
1. Carbon Dioxide, the most importantanthropogenic greenhouse gas,increased markedly as a result of humanactivit ies, and its atmosphericconcentration of 379 ppmv (parts permillion by volume) in 2005 far exceededthe natural range of 180 to 300 ppmvover the last 650,000 years.
This conclusion is based entirely on proxyice core data from Antarctica withmonotonously low CO2 proxy values. Themost striking relationship is the drop in CO2
proxy values with depth. The burial pressurerange of the ice cores is from 5 bars to 15bars or 5-15 atmospheres, a maximum ofabout 220 psi. It appears that decompressionresults in CO2 depletion. Nevertheless, thisrather invariant proxy data wasinappropriately linked to observational datafrom the Mauna Loa Observatory in Hawaii.The result is a flat historic graph meldedwith the modern data scaled to provide adramatic right angle and near vertical climbin modern CO2 values.
The curve is visually dramatic but concealsan unacknowledged change of age. Theyoungest proxy from the Siple Ice Core is1890 with a value of 328 ppmv but the entiredata set was arbitrarily moved to fit MaunaLoa data for 1973. This appears to have beendone to conceal an inconveniently high pre-industrial value for CO2 of 328 ppmv.
2 Human activities have warmed theclimate since 1750.
This is an unwarranted assertion which isnot supported by facts.
3. The warmth of the last half-century isunusual. It is the highest in at least thepast 1,300 years, and is “very likely”caused by increases in anthropogenicgreenhouse gases.
This assertion is based on the infamous Mannhockey stick graph, which has been shownto be totally invalid in a number of scientificpapers and by the Wegman Commission ofthe United States Congress. Not withstandingthe scathing criticism of this work by manyauthors, it continues in widespread use bythe IPCC with minor modification in the 2007report. The IPCC has been shown to haveviolated its own rules in its 2007 attempt torebut criticisms of the “hockey stick”. Allthis to evade acknowledging worldwideevidence of the Little Ice Age, the MedievalWarm Period, and the Roman Warm Period.Both of the latter periods of warming hadtemperatures greater than our presentwarming. This was brilliantly documented byH.H. Lamb in the late 1960s but, as ischaracteristic of IPCC, inconvenient evidenceis simply ignored, manipulated, or evaded.
4. Predictions are made thatanthropogenic warming will continuefor centuries, and that by the end of the

4
21st century the global surfacetemperature will increase 1.1 to 6.4 ºC.Various global catastrophes areprophesied as a result of warming ifmanmade emissions are not curbed bydrastic political and economic decisions.
The obvious beneficial effects of warmingfor both man and the entire biosphere arediscounted. This is a curious omission whendiscussing a complex society living in whatmay be the last portion of an interglacialwarm period. Cooling will initiate far moreserious hazards to our civilization as anyone,who has considered the effects of minorcooling during the Little Ice Age, would know.Glacial onset would result in the loss ofmajor northern croplands, including thebreadbasket of the northern hemisphere, andeventually Canada would exist (once again)only as an ice-sheet.
Most of the statements from the SPM areunproven assumptions and a review of thel iterature on the basis of a trulymultidisciplinary approach involving physics,geology, history, and archaeology leads tomuch different conclusions. It is dishearteningto find that the geological profession, whichcertainly has the basic tools and knowledgeto understand that climate has always variedon all time scales, can not reach a soundscienti f ic posit ion on this subject. Inparticular, it is regrettable that AAPGvacillated and backed off their original 1999posit ion of opposing the theory ofAnthropogenic Global Warming. Thisresulted from a failure to find a consensusposition among their membership. That maybe democracy but it is not science.Conducting a survey of people’s opinionsdoes not provide a scientific conclusion –on this basis, the sun would still be revolvingaround a flat world.
In the hope of stimulating some informedscientific debate on the subject, we plan toreview the evidence set forth for the fourIPCC propositions in a series of forthcomingarticles, each considering what the sciencereally shows. Certainly, what we have inscientific terms does not support the drasticactions now being considered by ourpoliticians. Among all the potential hazardsfacing humankind, warming is the most benigncompared to other potential disasters suchas super-volcanic eruptions, asteroidcollisions, or more likely, a new ice age. Inthe long term, the failure to challenge theso-called consensus will be detrimental toscientists and our future abi l ity tolegitimately influence public policy.
REFERENCES:::::IPCC. 2001. Climate Change – The IPCC ScientificAssessment. Cambridge Univers ity Press,Cambridge.
IPCC. 2007. Climate Change: The Physical ScienceBasis , Summar y for Pol ic ymakers . Four thAssessment Report, Intergovernmental Panel onClimate Change, Geneva, Switzerland.
Jaworowski, Z. 2007. The Greatest ScientificScandal of Our Time, EIR Science, March, 2007.p. 38-53.
Lamb, H. H. 1965. The Early Medieval WarmEpoch and i ts Sequel . Palaeogeography,Palaeoclimatology, Palaeoecology. p. 13-37

5
CLCLCLCLCLIMAIMAIMAIMAIMATE CHANGTE CHANGTE CHANGTE CHANGTE CHANGE II:E II:E II:E II:E II:The World’s Historic Climate by Dr. A. Neil Hutton
Hubert H. Lamb was regarded as one of thegreatest climatologists of his time with a listof over 150 publications between 1939 and1995. He was instrumental in establishingthe Climatic Research Unit at the Universityof East Anglia. Perhaps more than any otherscientist, he convinced the world of theinconstancy of present climate. Furthermore,he utilized a broad range of observationsfrom economic, botanical, archaeological,agricultural, and historical data in order toestablish cl imatic history. In 1990 theIntergovernmental Panel on Climate Change(IPCC) published their then understandingof global climatic variability in the last 1,000years which is illustrated in Figure 2.1.
This figure was based on Lamb’s pioneeringwork and quite clearly shows medievaltemperatures higher than our presentmaxima during 1998, thus denying the claimthat the warming of the 20th Century wasgreater than at any t ime in the lastmillennium. So what scientific evidence didLamb have to actually provide an estimate oftemperature? Lamb has documented thatthere was a commercial wine-makingindustry in the South of England between1100 to about 1300 that was competitivewith producers in France. This represents anorthward latitude shift of 500 km from thecurrent grape-growing areas of France andGermany, indicating average temperatures1.0 ºC warmer than in the past decades. InGermany, during this warm period, vineyardswere found at higher elevations, about 780meters above sea level. Today the maximumelevation is about 560 m. Assuming atemperature gradient of 0.6-0.7 ºC per 100meters, then the average mean temperaturethen was 1.0-1.4 ºC warmer than our 20thand 21st Century maxima. This is quantifiableinformation since we know the climaticrequirements for viniculture.
Lamb also observed and documented adescent of the tree line in the Alps by 70-300m. The evidence being the presence ofolder peat deposits and forest remains athigher elevations. A drop of the tree line of100-200m occurred in Northern Germanywhile Iceland experienced a 300m drop topresent levels and once-productive farmswere covered by advancing glaciers. Sosevere was the climatic change experiencedby Icelanders that Denmark consideredevacuating all the islanders and settling themin Europe.
Lamb used a variety of indicators to developa temperature profile, such as economicvalues of produce, winter severity recordedin historical records, agriculturalproductivity, changes in crop type ,distribution, and other factors as discussed.Lamb produced a brilliantly detailed accountof European and north Atlantic climate that
demonstrated distinct climatic variability withthe Medieval Warm Period warmer than our20th Century Warm Period and separatedfrom it by the Little Ice Age. During the LittleIce Age, the River Thames froze 40 times,with the greatest frequency occurring duringthe seventeenth and eighteenth centuries asshown in Figure 2.2. This was no skim of ice
Figure 2.1. This figure was published without attribution by the IPCC in their 1990 report as figure 7c, but itis clear that it was based on the work of Lamb 1965 (see McIntyre, 2008 Climate Audit May 9th 2008).
Figure 2.2. The frequency of freezing of the River Thames during The Little Ice Age with the maxima occurringduring the 17th and 18th Centuries.
6
on the surface of the river but was sufficientto support the hauliers and their teams ofhorses and wagons who preferred to crossdirectly rather than use the bridges. A teamof horses with loaded wagon is in excess offive tons. Accounts indicate that it was socold that fish became trapped in pools andwere frozen into the ice. The citizens ofLondon abandoned the city for the pubs andentertainment on the ice in the legendaryFrost Fairs which are delightfully describedin Helen Humphrey’s book “The FrozenThames”. During this period sea ice wasreported impeding coastal traffic and, in 1684-1685, the English Channel was ice-coveredfrom Dover to Calais. At the same period,Iceland was totally surrounded by sea ice asfar as the eye could see from the highestmountains. Similarly, the freezing of the Balticwas such that people traveled by sleigh fromSweden to Poland. These events which areextensively reported in historical documentshave been criticized as being anecdotal andnot providing an accurate measure oftemperature variation and without globalsignificance. However they appear to providea better evaluation of historic climate thantree rings.
Since the documentation of the Little Ice Age,(LIA) and the Medieval Warm Period, (MWP)was dropped by the IPCC in 2001, there hasbeen an avalanche of papers from aroundthe world documenting the occurrence ofthe MWP and the LIA. There are some 500citations from around the world. Repeatedly
these publ ications cite the averagetemperature of the MWP as up to 1ºCwarmer than the present warm period. Anexcellent citation index is available from CO2
Science which is avai lable at www.co2science.org for both the MWP and LIA.
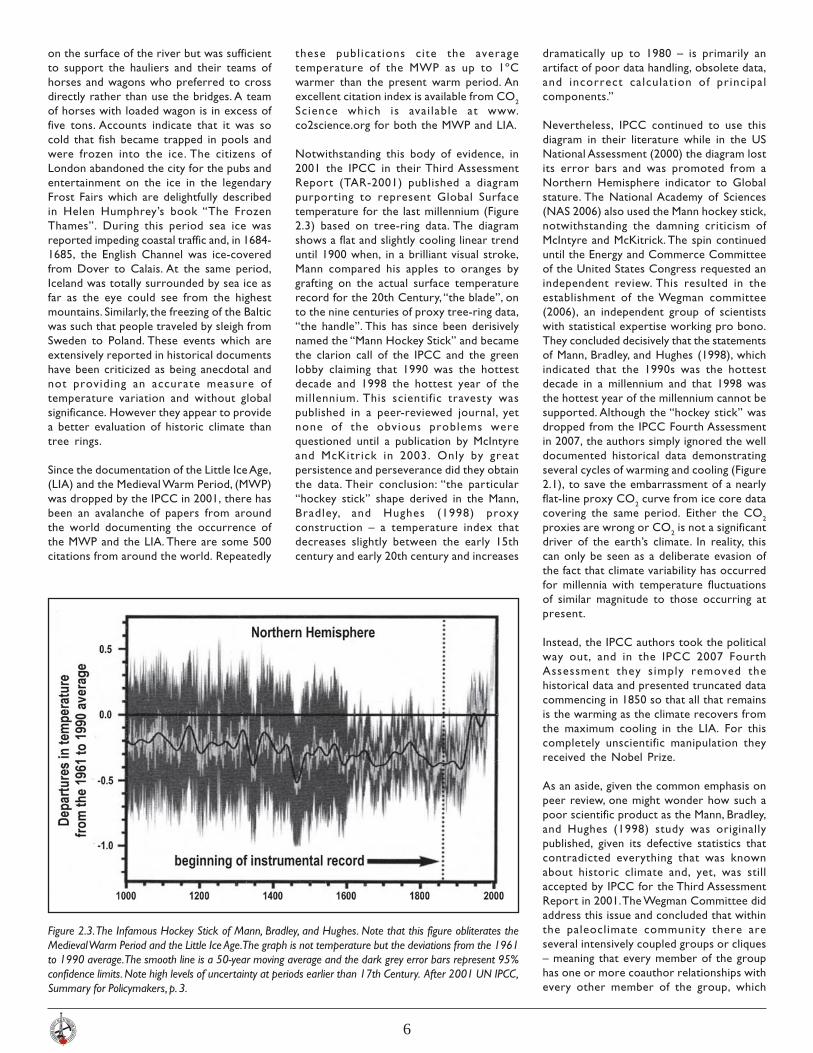
Notwithstanding this body of evidence, in2001 the IPCC in their Third AssessmentReport (TAR-2001) published a diagrampurporting to represent Global Surfacetemperature for the last millennium (Figure2.3) based on tree-ring data. The diagramshows a flat and slightly cooling linear trenduntil 1900 when, in a brilliant visual stroke,Mann compared his apples to oranges bygrafting on the actual surface temperaturerecord for the 20th Century, “the blade”, onto the nine centuries of proxy tree-ring data,“the handle”. This has since been derisivelynamed the “Mann Hockey Stick” and becamethe clarion call of the IPCC and the greenlobby claiming that 1990 was the hottestdecade and 1998 the hottest year of themillennium. This scientific travesty waspublished in a peer-reviewed journal, yetnone of the obvious problems werequestioned until a publication by McIntyreand McKitrick in 2003. Only by greatpersistence and perseverance did they obtainthe data. Their conclusion: “the particular“hockey stick” shape derived in the Mann,Bradley, and Hughes (1998) proxyconstruction – a temperature index thatdecreases slightly between the early 15thcentury and early 20th century and increases
dramatically up to 1980 – is primarily anartifact of poor data handling, obsolete data,and incorrect calculat ion of principalcomponents.”
Nevertheless, IPCC continued to use thisdiagram in their literature while in the USNational Assessment (2000) the diagram lostits error bars and was promoted from aNorthern Hemisphere indicator to Globalstature. The National Academy of Sciences(NAS 2006) also used the Mann hockey stick,notwithstanding the damning criticism ofMcIntyre and McKitrick. The spin continueduntil the Energy and Commerce Committeeof the United States Congress requested anindependent review. This resulted in theestablishment of the Wegman committee(2006), an independent group of scientistswith statistical expertise working pro bono.They concluded decisively that the statementsof Mann, Bradley, and Hughes (1998), whichindicated that the 1990s was the hottestdecade in a millennium and that 1998 wasthe hottest year of the millennium cannot besupported. Although the “hockey stick” wasdropped from the IPCC Fourth Assessmentin 2007, the authors simply ignored the welldocumented historical data demonstratingseveral cycles of warming and cooling (Figure2.1), to save the embarrassment of a nearlyflat-line proxy CO2 curve from ice core datacovering the same period. Either the CO2
proxies are wrong or CO2 is not a significantdriver of the earth’s climate. In reality, thiscan only be seen as a deliberate evasion ofthe fact that climate variability has occurredfor millennia with temperature fluctuationsof similar magnitude to those occurring atpresent.
Instead, the IPCC authors took the politicalway out, and in the IPCC 2007 FourthAssessment they simply removed thehistorical data and presented truncated datacommencing in 1850 so that all that remainsis the warming as the climate recovers fromthe maximum cooling in the LIA. For thiscompletely unscientific manipulation theyreceived the Nobel Prize.
As an aside, given the common emphasis onpeer review, one might wonder how such apoor scientific product as the Mann, Bradley,and Hughes (1998) study was originallypublished, given its defective statistics thatcontradicted everything that was knownabout historic climate and, yet, was stillaccepted by IPCC for the Third AssessmentReport in 2001. The Wegman Committee didaddress this issue and concluded that withinthe paleoclimate community there areseveral intensively coupled groups or cliques– meaning that every member of the grouphas one or more coauthor relationships withevery other member of the group, which
Figure 2.3. The Infamous Hockey Stick of Mann, Bradley, and Hughes. Note that this figure obliterates theMedieval Warm Period and the Little Ice Age. The graph is not temperature but the deviations from the 1961to 1990 average. The smooth line is a 50-year moving average and the dark grey error bars represent 95%confidence limits. Note high levels of uncertainty at periods earlier than 17th Century. After 2001 UN IPCC,Summary for Policymakers, p. 3.

7
suggests that the peer-review process failed to fully vet papersbefore they were published. In turn, the peer-review processmay result in censorship where the views expressed are contraryto the views or the agenda of the clique. Mann, Bradley, andHughes presented what the climatological community wanted tohear and so they ignored all previously published data on climatevariability.
The IPCC has relied principally on the average global surfacetemperature to support their claim of anthropogenic globalwarming (AGW); however, warming in itself is not proof of thecause. Claims that AGW is occurring that are backed by accountsof melting glaciers and disappearing Arctic sea ice are simplyconfusing the consequences of warming with the causes. Thequestion is how much of the warming can be linked to increasesin greenhouse gases.
There is a well founded concern that the surface temperaturerecord is seriously contaminated by the urban heat island effect.Therefore, rural stations are crucial to develop a baseline inorder to remove the effects of urbanization. But the number oftrue rural stations is small, accounting for only 7% of the earth’sarea. A recent survey of the US Climate Reference Network(USCRN) shows that only 4 % of the stations have appropriaterecording conditions with sensors located at least 100 metersfrom artificial heating or reflecting surfaces and parking lots. Anamazing 70% are located within 10 meters of, or adjacent to, oron top of an artificial heating source such as a building, roof top,parking lot, air conditioning exhaust, or concrete surfaces. (See:http:// wattsupwiththat.com/) These problems are not confinedto the US, the Goddard Institute for Space Studies (GISS) includestemperature stations in Canada that do not meet the requiredsiting specifications. The City Centre Airport in Edmonton is agood example which clearly demonstrates the effect of urbanheat island effects and there are many more.
The direct relationship between population growth andtemperature increase is well documented as shown in Figure 2.4showing the mean annual air temperature in Phoenix Arizona.The coincidence of the population growth with temperatureincrease is striking. While in Figure 2.5 data from 93 climatestations in California is presented by county population. Wherethe population is over one mill ion, the mean annual airtemperature shows an increase of almost 3 ºF, while in countieswith a population less than 10,000 the temperature increase isonly 0.25 ºF and, even in the latter case, it is likely that thetemperature stations have been affected by urban construction.
The last three decades of the 20th century have been a period ofvigorous economic growth and construction and expansioncoinciding with the growth in the global average temperature(McKitrick and Michaels, 2007). Meanwhile, the geographicdistribution and sampling has deteriorated over time, especiallysince the 1970s. Ideally, coverage should provide some 2,592 gridboxes at five degrees of latitude and longitude but with the declinein stations the coverage has dropped from 1,200 to 600 stations– a decline in grid station coverage from 46 to 23%! The majorityof the remaining stations tend to be located in more populatedareas. Nevertheless, the IPCC claims that their global averagesurface temperature has been deurbanized, but they have declinedto release the data or methodology so that it can be independentlyverified. Dr. Jones of the Climate Research Unit (CRU) at theUniversity of East Anglia famously responded to a request for thebasic data and methodology with, “Why should I make the dataavailable to you, when your aim is to find something wrong withit.” This does not suggest that the CRU have high confidence in
Figure 2.4. Mean annual air temperature in Phoenix, Arizona, from 1931 to 1990 andpopulation growth for the Phoenix metropolitan Area Source: After Balling, 1992.
Figure 2.5. Average annual air temperatures at 93 California climate stations from1947 to 1993 stratified by 1990 county population: over 1 million (top); between 1million and 100,000 (middle); and less than 100,000 (bottom). Source: Goodridge,1996.

8
their work or of their contribution to theIPCC. This also confirms Stephen McIntyre’spoint that there is greater due diligence doneon small public offerings on the TSX thanthere has been on Climate Science wherethe IPCC proposals could cost billions. TheWegman Committee similarly concludedthat, where massive amounts of public moniesand human lives are at stake, academic workshould have a greater level of scrutiny andreview.
Temperatures over the ocean are not takenby thermometers in the air two meters abovethe surface, but by taking the temperature ofthe sea water itself, the so-called sea surfacetemperature. (SST) Several different methodshave been used to measure SST, althoughcurrently this is done mainly by buoys andsatellites. In the past, temperatures have beentaken from a variety of depths from one mm(satellites) to two meters (ship engine waterintakes) which may not ref lect airtemperature because of variable oceancurrents temperatures and prevailing windsystems.
The merit of calculating global averagesurface temperature has been questionedsince there is not one global climate but alarge variety of climates depending onlatitude, geographic distribution of landmasses, and atmospheric dynamics. Weatheris not about homogeneities but differences.It is the redistribution of heat that generatesweather and climate. As an example, 1947was the coldest year in the UK since recordshave been kept but appears as one of thewarmest years in global records. Much hasbeen made of the potential loss of theGreenland ice cap which may causewidespread sea level rise; however,temperature records on Eastern andWestern Greenland and adjacent easternCanada show significant cooling since 1960.(Rogers, 1989 and Morgan et al., 1993).
The IPPC has depended almost exclusivelyon the rise in Global Average SurfaceTemperature as proof of anthropogenicglobal warming (AGW). The AGWhypothesis proposes that ‘greenhouse’ gasestrap heat in the upper atmosphere. Thegeneral circulation models supporting thishypothesis show an increasing warming trendwith altitude, peaking at roughly two timesthe surface value at around ten kilometers.Therefore, the diagnostic test of the validityof AGW theory is to actually measure thetemperature increase at 8-10 km in thetroposphere. Such measurements haveactually been taken in the troposphere forthe last 50 years, from 1957 to 1980, byradiosonde balloons, and since 1980 byMicrowave Sounder Units (MSU) onboardNASA satel l i tes. The accuracy and
compatibility of the MSU data has beenvalidated independently by measurementsfrom radiosonde balloons. The MSU dataprovides excellent global coverage and a highdegree of accuracy but it shows nomeaningful warming trend as shown in Figure2.6. Therefore, the AGW hypothesis is shownto be incorrect by the satellite records. Inscientific terms, the hypothesis fails.
Finally, the recent reports from the world’stemperature monitoring stations, the UK’sHadley Centre and in the US, NASA’s GISS,UAH, and RISS all show that in the last year,from January 2007 to January 2008, the globalaverage temperature has droppedconsiderably. The cooling ranges from 0.65-0.75 ºC (Figure 2.6), which is the largest singledrop ever recorded. Furthermore, theSecretary General of the WorldMeteorological Society, Michael Jarraud, hasagreed that temperatures have dropped andwill continue to do so through 2008. Thecooling is attributed to La Nina although thiswas never factored into any of the climatemodel predictions of the IPCC in any of theirassessment reports (1990, 1995, 2001, and2007). Moreover in the IPCC 2007,“Summary For Policymakers”, it was claimedthat average Northern Hemispheretemperatures during the second half of the20th Century were very likely (their italics)greater than in any other 50-year period inthe last 500 years and likely (their italics) thehighest in the last 1,300 years. The detailedwork of Hubert Lamb shows that this issimply incorrect. The Mann “Hockey Stick”incident shows a level of desperation toestablish the link to AGW and the failure toacknowledge this in IPPC 2007 reportsindicates that we are no longer dealing withscience but the politics of a belief system.
In conclusion, we can say that the World’sHistoric Climate has well documentedpronounced cycles of warming and coolingoccurring independent of CO2 levels in theatmosphere. Only in the last century can apossible link be established to CO2 when itsproduction has increased since the industrialrevolution. However, even then, thecorrelation of atmospheric CO2 with globalaverage surface temperature is relativelypoor. The rebound of temperature from theLittle Ice Age to the average temperaturehighs of the 1930s and 1940s occurs whenCO2 values lie between 290 to 310 ppmv butcooling occurred while CO2 increased from310 to 330 ppmv from the 1950s to the early1970s. The only direct correlation occurs inthe period from 1975 to 1998 when CO2
increased from 330 to 365 ppmv (Figure 2.7).While the CO2 content continues toincrease, there has been no increase intemperature this century (see Figure 2.6).Therefore, a relationship between global
average surface temperature and CO2
content can only be demonstrated for theperiod from 1975 to 1998. This has nostatistical significance on the millennial scaleof climate. Furthermore, there is very goodreason to suggest that a significant part ofthe average temperature increase is relatedto the urban heat island effect. Since surfacewarming in itsel f is not proof ofAnthropogenic Global Warming, and thereis a failure to observe any significant warmingof the troposphere, then there is clearevidence that the AGW hypothesis is wrong.
Finally it is clear that in the 2007 IPCCreports, all scientific objectivity has beenabandoned in order to establish the authors’political objectives. Unfortunately they havebeen rather successful since the media arequite happy to go along with the unsupportedscientific conclusions and appear to be blindto the unprincipled distortion of theevidence.
REFERENCESREFERENCESREFERENCESREFERENCESREFERENCESCarter, R .M. 2007. The Myth of Human CausedClimate Change. The AusIMM New LeadersConference. Brisbane, QLD, May 2-3.
Balling, R. C . Jr. 1992. The Heated Debate:Greenhouse Predictions Versus Climate Reality. SanFrancisco, Pacific Research Institute for PublicPolicy.
Goodridge, J. D. 1996. Comments on RegionalSimulations of Greenhouse Warming includingNational Variabi l i ty. Bul let in AmericanMeteorological Society, v. 77, p. 3-4.
Humphreys, Helen. 2007. The Frozen Thames.McLelland and Stewart, Toronto.
IPCC. 1990. Climate Change: The IPCC ScientificAssessment. Cambridge Univers ity Press,Cambridge.
IPCC. 2001. Climate Change 2001: The ScientificBasis. Cambridge University Press, Cambridge.IPCC. 2007. Climate Change: The Physical ScienceBasis , Summar y for Pol ic ymakers . Four thAssessment report, Intergovernmental Panel onClimate Change. Geneva, Switzerland.
Lamb, H. H. 1965. The Early Medieval WarmEpoch and Its Sequel . Palaeogeography,Palaeoclimatology, Palaeoecology, v. 1, p. 13-37.
Lamb, H. H. 1967. Britain’s Changing Climate.Geographical Journal, v. 133, p. 445-468.
Lamb, H. H. 1977. Climate – Present Past andFuture. Volume 2, Climatic History and Future.Methuen, London.
Mann, M. E., Bradley, R. S., and Hughes, M. K.1998. Global scale temperature patterns and

9
Figure 2.6. NASA Satellite Data. Lower tropospheric temperature since 1978 measured by microwave sounding units. Note the lack of any clearlydefined warming trend. The record is dominated by the Pacific Decadal Oscillations of El Nino / La Nina together with cooling resulting from majorvolcanic eruptions. The plunge in temperature from January 2007to January 2008 of 0.7 ºC has been attributed to La Nina. Thus if CO2 has any effectat all it is quite insignificant in respect to other climate drivers.
Figure 2.7. Globally averaged temperature variations between 1850 and 2007. The temperature increase to the 1940s reflects natural rebound oftemperature from the Little Ice Age independent of CO2. The cooling from 1940 to 1970 occurs while CO2 is increasing and the only correlation withrising CO2 is from 1980 to 1998. Although CO2 continues to increase global temperatures have shown no warming in the last ten years. Source:HadCRUT3 dataset from the UK Met Office and U. of East Anglia.

10
climate forcing over the past six centuries. Nature,v. 392, p. 779.
McIntyre, S. and McKitrick, R. 2003. Correctionsto the Mann et al. (1998) Proxy Data Base andNorthern Hemispheric Average TemperatureSeries. Energy and Environment, v. 14, no. 6, p.751-771.
McKitrick, R. and Michaels P. 2007. Quantifyingthe influence of anthropogenic surface processesand inhomogeneities on gridded global climatedata. Journal of Geophysical Research, v. 112,D24S09.
Morgan, M. R. et al. 1993. Temperature trends atCoastal Stations in Eastern Canada. ClimatologyBulletin, v. 27 no. 3.
NAS. 2006. Surface Temperature Reconstructionfor the Last 2,000 Years. National Academy Press,Washington DC.
National Assessment Synthesis Team (NAST).2000. Climate Change Impacts on the UnitedStates: The Potential Consequence of ClimateVariability and Change. Overview Document,USGCRP, June 2000.
Rogers, J. C. 1989. Seasonal Temperature Variabilityover the North Atlantic Arctic . 13th AnnualClimate Diagnostics Workshop. NOAANWS, p.170-178.
Wegman, E. J. et al. 2006. Ad Hoc CommitteeReport on the ‘Hockey Stick’ Global ClimateReconstruction. Report presented to the U.S. Houseof Representatives, Committee on Energy andCommerce, July 14 2006. www.uoguelph.carmckitri/researchWegmanReport.pdf.

11
CLCLCLCLCLIMAIMAIMAIMAIMATE CHANGTE CHANGTE CHANGTE CHANGTE CHANGE III:E III:E III:E III:E III:Carbon Dioxide by Dr. A. Neil Hutton
It is curious that this gas, which is thefundamental building block of l i fe, hasbecome v i l i f i ed as the cu lpr i t o f animpending Climate Catastrophe . Withvisual media, at this point, on screenwould appear a nest of stacks belchingforth great plumes of “pollution.” The factthat this is mainly water vapour, the Earth’sprimary “greenhouse gas” responsible forsomewhere between 85-95% o fa tmospher ic warming i s neveracknowledged.
What do we really know about CO2? Frommy experience, the genera l publ ic ispoorly informed. When asked to specifythe content of CO2 in the atmosphere,and given a choice of 37.9%, 3.79%, or0.0379% the great majority opts for oneof the first two values. However carbondioxide is a trace gas representing lessthan 1% of the atmosphere, currently 379parts per million by volume (ppmv). To putthis in perspective, only 38 out of every100,000 molecules of a ir are carbondioxide. Then consider that it takes up tofive years of emissions created by humansto add 1 molecule to every 100,000molecules. Moreover, in the media andother reports, it is commonplace to readthat humans emit 14.5 gigatons (GT) ofCO2 annually. This sounds enormous, butit is never stated that this represents only1.25 parts per million by volume annuallyof the total atmosphere.
To provide some perspect ive on thenumbers, i t is useful to compare therelative amounts of carbon containedglobally in the atmosphere, the surface,and the oceans. The atmosphere contains750 GT C, vegetation soils and detrituscontain 2,200 GT C, the surface oceancontains 1,000 GT C, and the intermediateand deep ocean contain 38,000 GT C.(Sch immel , 1995) These amounts , o fcourse, are not fixed and static as thereis a continuous exchange between theseg loba l carbon reser vo i r s . Thus i t i sestimated that each year the atmosphereand the surface ocean exchange 90 GT C;vegetation and the atmosphere, 60 GT C;marine biota and the surface ocean, 50GT C; and the surface ocean and theintermediate and deep oceans, 100 GT C.(Schimel, 1995). Therefore the human
contribution of 5.5 GT C represents onlya very small amount within the totality ofthe carbon cycle. However, it is the annualincrease of 3 GT of carbon annually whichdrives the hypothesis of anthropogenicglobal warming (AGW).
Carbon dioxide is significantly denser thanthe other elements of air. It is almost 60%denser than nitrogen and 40% denser thanoxygen. Happily, gases do not segregategravitationally, otherwise we would allsuffocate in a layer of CO2 some 400 to500 meters thick. Molecular activity ingases known as Brownian Motion causesrapid diffusion and mixing of the differentmolecular components. This is also aidedby convect ion as we l l a s g loba latmospheric circulation such that thecomponents of the a ir are re lat ive lyconstant globally. There are variationsregionally and – especially in the southernhemisphere – where some fluctuationsare attributed in part to La Nina and ElNino events, but the variation amounts toonly a few parts per million by volume. Ingeneral, the southern hemisphere stationshave values about 5 ppmv lower than inthe northern hemisphere.
As a medium to warm the atmosphere,CO2 seems like a very poor candidate.First, because it is a trace gas forming lessthan .0379 % by volume of the atmosphereand , second , because i t ’s therma lconductivity is extremely low. Thermalconductivity is a property which measureshow much heat per t ime un i t andtemperature difference flows in a medium.Most gases have such low conductivityvalues that they are excellent insulatorsin the absence o f convect ion . Theconductivity of CO2 (0.009) is less thanhalf that of air (0.024), and it is only 15%of the conductiv ity of water (0.058).Comparatively then, the capacity of CO2
to warm the atmosphere conductively isnegligible. Furthermore, examining theisochoric thermal diffusivity (a measureof how rapidly a temperature change willspread) demonstrates that doubling ofCO2 has a negligible effect. Based on thesefundamental physical attributes, CO2 cannot be the veh ic le o f a tmospher icwarming . (Ger l ich and Tscheuschner,2007.)
This, then, leaves only radiation heattrans fer as the pr inc ipa l veh ic le foratmospheric warming by CO2. Radiationheat transfer occurs as a result of theexchange of thermal radiat ion energybetween two or more bodies that arisesas a result of a temperature difference.No medium need exist between the twobodies for heat transfer to take place,since Photons traveling at the speed ofl i gh t are the in termed iar ies o f thee lec tromagnet i c rad i a t ion w i th awavelength range of 0.1 to 100 microns,encompassing the visible light spectrum.Atmospheric warming is believed to occuras a result of the fact that the atmosphereis essentially transparent to short waveradiation in the visible light spectrum –0.38 to 0.75 microns. However, globalwarming theory suggests that long-wavein f rared rad i a t ion i s pre ferent i a l l yabsorbed by cer ta in gases in theatmosphere, which causes it to warm. Theprincipal atmospheric gas causing warmingis water vapour and cloud with 85-95% ofthe warming attributed to it. The othergases in order of relative importance arecarbon dioxide, methane, nitrous oxide,and ozone.
However, carbon d iox ide has beenidentified in the global warming hypothesisas having the fundamental characteristicsof absorption and emission of infraredradiation (IR) and, as a result, it is claimedthat it is a potentia l driver of g lobalclimate. The carbon dioxide molecules donot have a simple single response to IRrad ia t ion . Four modes o f molecu larvibration, or spin occur in response tophoton stimulation. Carbon dioxide is al inear molecule with the carbon atomsituated in l ine between two oxygenatoms. The l inear molecular structureallows a vibrational response in which thecarbon atom osc i l l a tes between theoxygen atoms. This particular responsehas the ability not only to absorb infraredradiat ion but a lso to emit radiat ion;however, only some 5% of moleculesactually radiate at room temperatures. Theability of CO2 to radiate has been utilizedin the development of lasers and in thethermodynamics of combustion chambersbut th i s quantum s ta te depends one leva ted temperatures and e lec tro-

12
magnetic st imulation. Alfred Schack, apioneer in industrial thermodynamics, asearly as 1972 indicated that the radiativeheat t rans fer capab i l i t i e s o f CO 2 a ta tmospher ic temperatures werenegligible. The other quantum states ofCO2 are capable of absorbing infrared butdo not radiate. Carbon dioxide absorptionof IR radiation occurs in four narrowbands at 2, 3, 5, and 13-17 microns. CO2
occupies only about 8% of the infraredband and, given its levels as a trace gas,does not in itself have the capacity tochange the climate. This point is, in fact,conceded by climatologists but they relyon the concept of feedbacks to amplifythe e f fec t . Feedbacks are unprovenassumptions that the warming by CO2 willcause changes in clouds, water vapour, andprec ip i ta t ion sys tems ampl i f y ing thewarming . The pos i t i ve feedbackassumptions have been incorporated intoclimate models which are typically thema jor bas i s for g loba l warmingpredictions. All leading climate modelsforecast that warming by increasing CO2
wou ld cause an increase in c loud ,especial ly high alt itude cirrus clouds,which would then amplify the warming. Arecent publication by Spencer et al. (2007)has shown these assumpt ions to beincorrect. In fact the feedback is negativeso that as the tropical atmosphere (of thestudy area) warms, cirrus clouds decrease.That allows more infrared heat to escapefrom the atmosphere to outer space.
Because CO2 absorption occurs over alimited range of the IR spectrum it isgenera l l y accepted tha t 99% o f theradiation in the CO2 absorption bands isabsorbed wi th in on ly a few tens tohundreds of meters of the source. Inother words the absorption capacity ofCO2 is saturated within a few hundredmeters above the Earth’s surface. Thusdoubling of atmospheric CO2 will reducethe saturation distance, causing only aminor change in temperature .C l imato log i s t s accept tha t thetemperature will change by less than 1°C.Nevertheless, as was discussed above,they claim that doubling of CO2 will triggerpositive feedbacks, although – to this date– there is no measurable evidence thatthis occurs. Currently we are 40% of theway to doubling pre-industrial levels ofCO2; nevertheless, there has been nowarming this century.
If CO2 is saturated, that is to say incapableof getting any warmer by any furtherabsorption of IR radiation, then how doesthe warmed gas behave? At this pointconvective heat transfer will take over and
Figure 3.1. This figure is a plot of Historic Climate after Lamb included in the report of the IPCC, 1990 showingthe well defined Medieval Warm Period and Little Ice Age. This chart of temperature variation is comparedwith Proxy CO2 data from the Siple Dome in Antartica. What is noteworthy is the complete disconnectionbetween the proxy CO2 data and climate. Although the ice core proxies are claimed to be a direct measureof atmospheric CO2, they do not reflect well established climate trends. The decline of CO2 proxies is coincidentwith burial depth and unrelated to climate. This should be compared with the data from Siple Dome Ice Corein IPCC, 2007 Synthesis Report, p. 38, Figure 2.3., in which the horizontal scale has been unduly compressedand the data gap between Siple Dome Proxies and the real CO2 values from Mauna Loa eliminated.
the gas will rise to be replaced by coolerair molecules. Since carbon dioxide, is toa large extent, a product of combustionits vertical ascent along with water vapouri s a common fea ture o f our w interlandscape. As the warmed air ascends thepressure drops and the molecules expand,which causes a drop in temperature.When gas is compressed it generates heat,as in the inflation of a tire, and whendecompressed it loses heat, the propertyutilized in snow-making equipment. If thevolume remains the same and pressure isdecreased, then the temperature wil ldrop, which is the case in the globalatmosphere. The determining factor inatmospheric pressure is the mass andweight of the gas in that part of theatmosphere above the po in t o fmeasurement . Air pressure increasescont inuous ly f rom the top o f theatmosphere to the Earth’s surface and sodoes temperature. This behaviour of theatmosphere is descr ibed as adiabat icbecause there is no actual change in heat,but only pressure and temperature. Therate at which temperature changes in theatmosphere is called the lapse rate. Thetheoret i ca l l apse ra te for a dryatmosphere is 9.8°C per kilometer butthis is only for extremely dry atmospheresuch as in desert and arctic climates. Theeffect of high humidity and cloud is toreduce the lapse rate to an average ofabout 6.5°C per kilometer. As a result itis normal to find aircraft cruising at 10,000meters (32 ,000 feet ) exper ience a i r
temperatures of -65°C. Given an averagesea leve l temperature o f 15°C thetemperature at 2,500 meters altitude is -1.25°C, which is why mountains maintainsnow cover and glaciers. This means thatsome 80% of the lower 20 kilometers ofthe atmosphere (the troposphere) isbetween 0 and -65°C. Therefore, in thepredominantly subzero temperatures ofthe troposphere with the atmosphericpressure progress ively diminished byadiabatic expansion, the kinetic energy ofthe gases is greatly reduced. As a result,quantum molecular activity causing IRemission is reduced substantially.
Irrespective of the discussion above, theIPCC 2007: Historical Overview of ClimateChange (p. 115, Figure 1) suggests thatsome infrared radiation passes throughthe atmosphere but most is absorbed andre-emitted in all directions by greenhousegas molecules and clouds. The effect ofthis is to warm the Earth’s surface andthe lower atmosphere . This statementcon f l i c t s w i th the Second Law o fThermodynamics, which indicates thatenergy will always flow from a higher to alower energy state. Heat can not flow froma colder body (the atmosphere) to awarmer body (the Earth’s surface) withoutwork being applied. This is a fundamentalprob lem wi th the Globa l WarmingHypothesis which unaccountably neverseems to be challenged. Clouds have thecapacity to absorb infrared radiation buttheir capacity to emit is poor. Even if this

13
Figure 3.2. The “Hockey Stick Curve for CO2 from the IPCC, 2007 Synthesis Report p. 38, Figure 2.3 also fromSiple Dome in Antarctica. Note the monotonous almost flat CO2 proxy curve for the last 10,000 years, a period,during which, there was significant climatic variation. This suggests that, either the proxy data are wrong, orCO2 has no effect on climate. Also compare to Figure 3.1 the same data without the manipulation toexaggerate the post industrial increase of CO2.
were not the case, the cooler cloud cannot warm the Ear th’s surface . Cloudsgenerally, and low clouds in particular, coolthe surface. A point that is clearly made inthe weather records of the Little Ice Age(Lamb, 1965) and more specifically bySvensmark and Friis-Christensen (1997).
IPCC in the May, 2007. “Summary forPolicymakers” stated that CO2 was themost important anthropogen icgreenhouse gas, that it had increasedmarkedly as a result of human activities,and that its atmospheric concentration of379 ppmv in 2005 far exceeded the naturalrange of 180 to 300 ppmv over the last650,000 years.
This statement is based on proxy CO2
concentration data derived from ice coresand is based on the assumption that airinc lus ions in i ce are c losed systemspermanently preserving the chemical andisotopic composition of the gas. This isone of the cornerstones of the AGWhypothesis. Why should we doubt thispar t i cu l ar propos i t ion? F i r s t , whenexamined in detail the CO2 proxy valuesare remarkably invariant within a narrowrange for a period of 10,000 years, duringwhich the c l imate osc i l lated throughsevera l we l l de f ined warm and co ldperiods. Unl ike most substances, theso lub i l i t y o f CO 2 decreases astemperature increases, thus warm periodswill have elevated atmospheric CO2 valuesbecause of degassing of the oceans. In coldperiods, like the Little Ice Age, the valuesshould be lower because of increasedsolubility of CO2. As displayed in Figure3.1, there is no correspondence betweenthe plot of proxy CO2 values from SipleDome and the corresponding plot ofHistoric Temperature published by IPCC(1990) following Lamb (1965) Reproducedin Figure 3.2 is the IPPC (2007) version ofthe Siple Dome data (IPCC, Summary forPol icymakers , p. 3 F igure SPM1). Thepronounced hockey stick shape of thecurve is due primari ly to the intensecompression of the horizontal scale whichcauses the sharp bend and near verticaltrajectory where the ice core proxy curveintersects with the actual measurementsfrom Mauna Loa. It also neglects the 83-year gap between the ice cores andmodern data (Figure 3.1, lower curve).
The most significant trend in the proxydata at Siple and Taylor Domes in Antarcticais a drop in CO2 values with depth asshown in Figure 3.1 and Figure 3.3. In bothinstances there is a nearly linear declinein proxy CO2 values with depth, whichbears no relationship to historic climate.
Figure 3.3. This is a plot of proxy CO2 values versus depth from the Taylor Dome Ice Core. This data togetherwith data from Siple Dome is used to establish a pre-industrial level for CO2 of 280 ppmv in the IPCC 2007report. This core covers an age range from the 17th Century into the Holocene, 8,992BP covering four welldocumented warm periods, and yet, shows no variability in concert with the climatic cycles. The most strikingfeature of the proxy CO2 values is the progressive decrease with depth suggesting depletion by diffusion fromdecompression and mechanical fracturing of the core during drilling.
The depth corresponds to burial pressurein the ice where each 100 meters isequivalent to roughly one atmosphere ofpressure. The burial depth at Taylor Dome
is some 350 meters so that the pressureat the base of the core is 3 bars, or about50 ps i . When the core is recovered,decompression and drilling stress causes

14
from 8400-8100 BP. The atmospheric CO2
content decreases concurrent w i thincreased solubility in the cooling ocean.In comparison the ice cores at Taylor Domedemonstrate nearly flat values. (Figure 3.4,lower curve).
Further evidence of the variability of CO2
values has been provided in a review byBeck (2007) of some 90,000 analyticalmeasurements conducted before 1958 anddating back to the nineteenth century. TheCO2 show rather large var iat ions, incontrast to the ice core data’s flat andinvariant CO2 proxy data. Beck’s summaryof the analytical data documents a largeincrease in CO2 values co-incident withthe warming observed from 1920 to 1940(F igure 3 .5) . In genera l , th i s data i srejected by IPCC but not on grounds ofanalytical accuracy, which is excellent, butbecause the va lues d id not f i t the i rpreconceived concepts. Beck’s review isthorough and comprehens ive , andconvincing ly demonstrates s igni f icantvariability in atmospheric CO2 in contrastto ice core data.
Although a great deal has been made ofthe dangers of CO2 emissions, much of itis nothing more than fear mongering. Thetruth is that CO2 is highly beneficial tothe planet . The measurements at theMauna Loa record ing s ta t ion aredemonstrating an increase in amplitudeof the seasonal CO2 cycle (high in winter,low in summer), which indicates that CO2
fertilization is expanding the biosphereand, in fact, creating a negative feedback.Plants use CO2 to produce the organicmolecules which forms their t issues .Higher levels of CO2 in the air allowsplants to grow bigger, produce morebranches and leaves, expand their rootsystems, and produce more flowers andfruit (Idso, 1989). There is an extensiveamount of published data indicating thegrowth enhancement provided by a 300ppmv increase in a tmospher ic CO 2.(Poorter, 1993; Ceulmans and Mousseau,1994; Wullschleger et al., 1995 and 1997).Fert i l izat ion by CO2 causes plants toproduce fewer stomatal pores per unitarea of leaf and the pores are narrower.This change reduces most plants’ rate ofwater loss by transpiration allowing themto withstand drought conditions moreeffectively (Tuba et al. , 1998; Idso andQuinn, 1983).
Similarly in the oceans, CO2 fertilizes theorganisms at the base of the food chain.The high solubility of CO2 in cold waterexplains the rich organic life of the cold
Figure 3.4. The number of stomatal pores in plant leaves respond to atmospheric CO2. The greater the CO2
the fewer pores develop. The upper curve then is a proxy CO2 curve based on stomatal indices in Birch leavesafter Wagner et al. 2002. Note the consistently higher proxy values based on stomatal indices and the clearresponse to the well known Holocene cooling event. In contrast, the ice core data is invariant with a steadydecline in proxy values with depth and shows no response to the Holocene cold period. Data from noaa.gov/pub/paleo/ice core/ antartica/taylordome.
Figure 3.5. A comparison of Proxy CO2 ice core data with CO2 derived by analytical chemical methods from1850-1958. The results are displayed against the average temperature in the northern hemisphere fromGISS. The chemical analyses are displayed as five-year averages and show significant variation associatedwith cooling and warming of the climate, while the proxy ice core data is flat and invariant. The atmosphericCO2 content after 1958 is from Mauna Loa observatory. Figure modified after Beck 2007.
a network of fine cracks which attract andabsorb bipolar molecules such as CO2 andH2O. The cracks become diffusion pathsfor trapped gases to leave the ice, or forsome atmospheric gas to enter, thuscausing a depletion of the original CO2
content of the core. (Jaworowski, 2007;Hurd, 2006). There is also strong evidence
indicating that the CO2 values in ice coresare depleted. Stomatal frequency analysisin foss i l b irch leaves (Wagner, 1998;Wagner et al., 2002) show a much greatervariation in CO2 values from 270 ppmv upto 323 ppmv (Figure 3.4, top curve).Fur thermore , there i s a s i gn i f i cantresponse to the Holocene cooling event

15
Arctic and Antarctic waters. Alarms havebeen raised concerning acidification ofocean waters. However, much of this isunfounded as sea water is not inorganicbrine but is dominated by organic l i fewhich interacts with the oceans chemistry.Surface waters in particular are teemingwith microorganisms. Cyanobacteria at thebase o f the ocean ic food cha inphotosynthesis CO2 to provide sugars andg ive up oxygen . These ver y anc ientorganisms are believed to have providedthe oxygen in the ancient atmosphere,wh ich or i g ina l l y was dominated bynitrogen and carbon dioxide, which hashad concentrations ranging up to 5,000ppmv in the Palaeozoic. These values areup to 13 times higher than present daynumbers. During the early part of thePalaeogene Period, from 65 to 34 millionyears ago, global cl imates were muchwarmer than today with very little ice atthe poles, and CO2 levels up to 5 timesgreater than today at 1,889 ppmv. (Pagani,2005). The richness and diversity of lifeat this time does not indicate any injuriouseffects to the biosphere of significantlyhigher CO2.
Finally, the IPCC claim that the reportedwarming since 1979 is very likely causedby the human emission of greenhousegases (mainly CO2) can not be supportedbecause it places an undue reliance onproxy CO2 values from ice cores. The icecore data, because of the low and invariantvalues would indicate a prolonged coldperiod. This is not supported by welldocumented cycles of warming and coolingsince the Holocene. Therefore, one hasto conclude that the ice core data is wrongor CO2 has no obvious connection withcl imate change . The only coincidentalcorrelation of CO2 with warming climatehas occurred in the decades from the1980s to 1990s. This correlation no longerappears relevant since there has been nowarming since 1998 and the climate hascooled significantly since 2007. The failureto demonstrate a link between CO2 andclimate change indicates that the policiesbeing called for to fight climate changecan not be justified and are unnecessary.To fo l low th is path wi l l resu l t in anenormous misuse of capital that divertsf rom deve lop ing more e f fec t i ve andefficient methods of energy use. The publicdebate over climate change has strayedfar from objective science and has beenextremely distorted by the errors andexaggerations in the reports of the IPCC.It is a profound embarrassment to sciencethat hype and spin have replaced reasonin such an important issue.
REFERENCESREFERENCESREFERENCESREFERENCESREFERENCESBeck, E. G. 2007. 180 years of CO2 gas analysisb y chemica l me thods . Ene rgy andEnvironment, v. 18, no. 2, p. 258-282.
Ceulmans, R. and Mousseau. M. 1994. Effectsof e levated CO2 on woody p lants . NewPhysiologist v. 127, p. 425-446.
Friedli, H. et al. 1986. Ice core record of the13C/12C ratio of atmospheric CO2 in the pasttwo centuries. Nature, v. 324, p. 237-238.
Gerlich, G. and Tscheuschner, R. D. 2007. Falsification of the atmospheric CO2 greenhousee f f e c t s w i th i n the f rame o f phy s i c s .arXiv:0707.1161v1[Physics.ao-ph] 8 July2007.
Hurd, B. 2006. Analyses of CO2 and otheratmospheric gases. AIG News, no. 86, p. 10-11.
Idso, S. B. and Quinn, J. A. 1983. Vegetationalredistribution in Arizona and New Mexico inresponse to doubling of the atmospheric CO2
concentration. Laboratory of Climatology,Arizona State University, Tempe , Arizona.Climatological Publications Scientific Paper no.17.
Indermuhle et al. 1999. Holocene carboncycledynamics based on CO2 trapped in ice atTaylor Dome, Antarctica. Nature, v. 398, p. 121-126.
Intergovernmental Panel on Climatic Change.1990. Climate Change – The IPCC ScientificAssessment. Cambridge Univers ity Press,Cambridge.
Intergovernmental Panel on Climatic Change.2001. Climate change 2001: The scientificbasis. Cambridge University Press, Cambridge.
Intergovernmental Panel on Climatic Change.2007. Climate change: The physical sciencebasis. IPCC Summary for Policymakers. FourthAssessment Report. Geneva, Switzerland.
Jaworowski, Z. 1994. Ancient atmosphere -validity of ice core records. EnvironmentalScience and Pollution Research v. 1, pt. 3, p.161-171.
Jaworowski, Z. 2007. The greatest scientificscandal of our time. EIR, Science. March 16.
Lamb, H. H. 1965. The Early Medieval WarmEpoch and i ts sequel . Pa laeogeography,Palaeoclimatology, Palaeoecology. v. 1, p. 13-37.
Neftel, A. et al. 1985. Evidence from polar ice
cores for the increase in atmospheric CO2 inthe past two centuries. Nature, v. 315, p. 45-47.
Pagani, M. 2005. Deep sea algae connectanc i en t c l ima te , ca rbon d i ox i de andvegetation. Yale University, June 27 2005.
Poorter, H. 1993. Interspecific variation in thegrowth response of plants to an elevatedambient CO2 concentration. Vegetation 104/105: p. 77-97.
Schack, A. 1929. Industrial Heat Transfer. (inGerman) Stahleissen m.b.H., Dusseldorf, FirstPublished 1929, 8th Edition 1983.
Schack, A. 1972. The influence of the carbondioxide content of the air on the climate ofthe world. (in German) Physikalische Blatterv. 28, p. 26-28.
Schimel, D. S. 1995. Global Change Biology. v.1, p. 77-91.
Spencer, R. 2008. Climate confusion: Howglobal warming hysteria leads to bad science,pandering politicians, and misguided policiesthat hurt the poor. Encounter Books, New York.
Spencer, R. W., Braswell, W. D., Christy, J. R.,and Hnilo, J. 2007. Cloud and radiation budgetchanges associated with tropical intraseasonaloscillations. Geophysical Research Letters, v.34L15707, doi: 10.1029/2007 GL 029628.
Svensmark, H., and Friis-Christensen, E. 1997.Variation of cosmoc ray flux and global cloudcoverage – A missing link in solar c limaterelationship. Journal of Atmospheric and Solar-Terrestrial Physics, v. 59, no. 11, p. 1225- 1232.
Tuba e t a l . 1998 . Carbon ga in s bydesiccationtolerant plants at elevated CO2.Functional Ecology. v. 12, p. 39-44.
Wagner, F. et al. 1999. Century-scale shifts inEa r l y Ho locene a tmosphe r i c CO 2
concentrations. Science, v. 284, p. 1971-1973.
Wagner,T., Aaby, B ., and Visscher, H. 2002.Rapid atmospheric CO2 changes associatedw i th the 8200-year s -BP coo l i ng even t .Proceedings of the National Academy ofSciences, v. 99, no. 19, p. 12011-12014.
Wullschleger, et al. 1997. Forest trees and theirresponse to atmospheric CO2 enrichment: Acompilation of results . In: Advances in CarbonDioxide Effects Research. L.H. Allen et al (eds.).American Society of Agronomy, Madison, WI.p. 79-100.
Wullschleger et al. 1995. On the potential for

16
a CO2 fertilization effect in forests: Estimatesof biotic growth factor based on 58 controlledexposure Studies. In: Biotic Feedbacks in theGlobal Climatic System. G.M. Woodwell andF.T. MacKenzie (eds.). Oxford University Press,New York. p. 85-107.

17
CLCLCLCLCLIMAIMAIMAIMAIMATE CHANGTE CHANGTE CHANGTE CHANGTE CHANGE IVE IVE IVE IVE IV:::::The Greenhouse Effect by Dr. A. Neil Hutton
Let us discuss the ‘greenhouse effect’, whichmust be the most misused term ever inscientific literature. Planetary atmospheresdo not remotely resemble the warming airinside a greenhouse. The warming effect in agreenhouse results from the fact that thereis no source of cooler air to circulate byconvection. This, of course, can be remediedby opening doors or vents in the roof.
There is a historic misconception that theglass of a greenhouse traps infrared radiation.In 1909, R. W. Wood showed that thegreenhouse effect did not result from trappedradiation. He created an enclosure with awindow of rock salt (NaCl), which istransparent to visible light as well as infrared,and compared it with a second enclosureusing glass as a window. The enclosure withthe rock-salt window became warmer thandid the enclosure with glass because it wastransparent to almost the entire spectrumwhile the glass was not. If glass was placed infront of the salt- faced enclosure, thetemperatures equalized. Wood concludedthat trapping of infrared radiation within aglass enclosure is of minimal importance incomparison to the lack of convectivecirculation.
The atmosphere is a veritable “mixmaster”in terms of circulation as warm tropical airis driven to the poles and, under the influenceof the Coriolus force, causes the trade windsand westerlies of the northern and southernhemispheres. In addit ion, local ly andregionally, convection drives the weathersystems to draw up water vapor generatedby evaporation into the atmosphere, whichis then returned as precipitation. Thesesystems act to redistribute heat in theatmosphere and maintain a degree of climaticequilibrium. Thus, it is clear that the Earth’satmosphere is not remotely like the air in agreenhouse.
A fundamental hypothesis of the so-called“greenhouse effect” is that if there were noatmosphere the average temperature of theEarth would be -18ºC (255ºK). This is a totallytheoretical construct, or thoughtexperiment, since it is probable that neverin Earth’s history has this condition occurred.Moreover, the Earth has a radioactive corewhich continuously generates heat, currentlyat a rate of 87 milliwatts per square meter,which is neither seasonal nor diurnal. Thegeneration of heat along ocean-spreading
centres is believed to average up to 120milliwatts per square meter. The failure torealize this resulted in Kelvin’s erroneousestimate of the age of the Earth as 100 millionyears. Therefore , the relevance of thetheoretical temperature of theatmosphereless Earth to the greenhouseeffect is questionable.
Furthermore, the Earth is 70% ocean. Is itpossible to have an atmosphere-less Earthwith oceans (see Gerlich and Tscheuschner,2007)? The oceans have a fundamentalinfluence on climate and the atmosphere. Theglobally averaged near-surface temperatureamounts to 15ºC (288ºK). The difference inthese values, 288ºK – 255ºK is 33ºK, whichis attributed to the effect of the atmosphere(“greenhouse effect”). In a recent paper,Essex et al., (2006) have questioned theentire concept of an average globaltemperature. They argue, “while the statisticis nothing more than an average overtemperatures, it is regarded as “thetemperature ,” as i f an average overtemperatures is actually a temperature initself, and as if the out-of-equilibrium climatesystem has only one temperature. But anaverage of temperature data sampled from anon-equilibrium field is not a temperature.Moreover, it hardly needs stating that theEarth does not have just one temperature. Itis not in global thermodynamic equilibrium– neither with itsel f nor with itssurroundings.” And finally, “The temperaturef ield of the Earth as a whole is notthermodynamically representable by a singletemperature.”
Unfortunately the terms ‘greenhouse effect’and ‘greenhouse gases’ have stuck in theclimatological literature and in the popularpress. Because infrared radiation is nottrapped in a greenhouse and convection isnot constrained in the atmosphere, the termis an oxymoron. It is misleading since itimplies some sort of boundary layer in theatmosphere and is far from descriptive ofthe dynamic role of the gases in theatmosphere. It has become established asclimatological jargon but tends to confuseeven those who should know better. Ofmore than 20 descriptions of the greenhouseeffect that I have reviewed, many of them aresimply wrong or misleading. Although it isnow acknowledged that the greenhouseanalogy is incorrect, nevertheless, evensupposedly authoritative works, such as the
Encyclopedia of Astronomy and Astrophysics(2001) has the following definition (myemphasis below):
“The greenhouse effect is the radiativeinfluence exerted by the atmosphere of aplanet which causes the temperature atthe surface to rise above the value it wouldnormally reach i f it were in directequilibrium with sunlight (taking intoaccount the planetary albedo). This stemsfrom the fact that certain gases have theability to transmit most of the solarradiation and to absorb the infraredemission from the surface. The thermal(i.e., infrared) radiation intercepted by theatmosphere is then partially reemittedtowards the surface, (in some texts thisis referred to as back radiation) thuscontributing additional heating to thesurface. Although the analogy is notentirely satisfactory in terms of physicalprocesses involved, it is easy to see theparallels between the greenhouse effectin the atmospheresurface system of aplanet and a horticultural greenhouse: theplanetary atmosphere plays the roleof the glass cover that lets sunshinethrough to heat the soil while partlyretaining the heat that escapes fromthe ground.”
Even in the IPCC, 2007. Historical Overviewof Climate Change (p. 115), “Much of thisthermal radiation emitted by land and oceanis absorbed by the atmosphere includingclouds, and re-radiated back to Earth. This iscalled the ‘the greenhouse effect.’ The glasswalls in a greenhouse reduce airflow andincrease the temperature of the air inside.Analogously, but through a differentphysical process the Earth’s greenhouseeffect warms the surface of the planet.”This is not an analogue since the physicalprocesses present a complete contrast infunction.
There is obviously a serious reluctance togive up the greenhouse analogy although itis well recognized that it is incorrect. Bothdescriptions above introduce the conceptof back radiation, suggesting that somehowlong-wave infrared radiation is interceptedand radiated back to warm the Earth’s surface.This concept held by climatologists has beenchallenged by theoretical physicists andothers (Thieme, 2003; Gerl ich andTscheuschner, 2007; Kramm, 2008). If the
18
outgoing thermal radiation from the Earth’ssurface is absorbed then the warmed air willexpand and rise convectively so that theabsorbed warmth is taken away by air massexchange as well as cooling from theadiabatic pressure drop. Most people willbe familiar with the heat of gas compressionwhen inflating a tire or the cooling effect ofdecompression in snow-making equipment.
As pressure drops with elevation, so doestemperature – reaching -65ºC at the top ofthe troposphere at about 10,000 meters. TheSecond Law of Thermodynamics states thatwarmth can never spontaneously pass froma body of low temperature to a body of hightemperature without the application ofwork. Thus according to our understandingof the ideal gas laws and thermodynamic laws,back radiation is not possible. The conceptimplies reflection but there is no suchboundary layer. The cooler atmosphere cannot warm the surface. Nevertheless, this is abasic tenet of global warming theory.
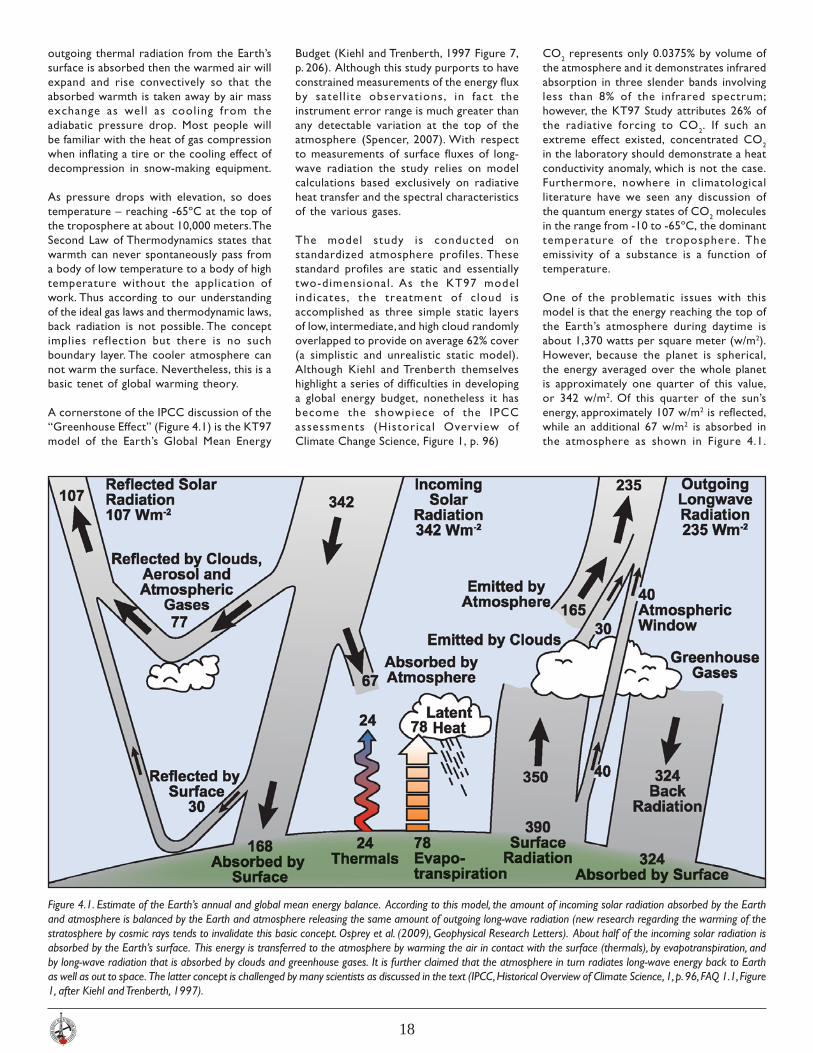
A cornerstone of the IPCC discussion of the“Greenhouse Effect” (Figure 4.1) is the KT97model of the Earth’s Global Mean Energy
Figure 4.1. Estimate of the Earth’s annual and global mean energy balance. According to this model, the amount of incoming solar radiation absorbed by the Earthand atmosphere is balanced by the Earth and atmosphere releasing the same amount of outgoing long-wave radiation (new research regarding the warming of thestratosphere by cosmic rays tends to invalidate this basic concept. Osprey et al. (2009), Geophysical Research Letters). About half of the incoming solar radiation isabsorbed by the Earth’s surface. This energy is transferred to the atmosphere by warming the air in contact with the surface (thermals), by evapotranspiration, andby long-wave radiation that is absorbed by clouds and greenhouse gases. It is further claimed that the atmosphere in turn radiates long-wave energy back to Earthas well as out to space. The latter concept is challenged by many scientists as discussed in the text (IPCC, Historical Overview of Climate Science, 1, p. 96, FAQ 1.1, Figure1, after Kiehl and Trenberth, 1997).
Budget (Kiehl and Trenberth, 1997 Figure 7,p. 206). Although this study purports to haveconstrained measurements of the energy fluxby satel l i te observations, in fact theinstrument error range is much greater thanany detectable variation at the top of theatmosphere (Spencer, 2007). With respectto measurements of surface fluxes of long-wave radiation the study relies on modelcalculations based exclusively on radiativeheat transfer and the spectral characteristicsof the various gases.
The model study is conducted onstandardized atmosphere profiles. Thesestandard profiles are static and essentiallytwo-dimensional . As the KT97 modelindicates, the treatment of cloud isaccomplished as three simple static layersof low, intermediate, and high cloud randomlyoverlapped to provide on average 62% cover(a simplistic and unrealistic static model).Although Kiehl and Trenberth themselveshighlight a series of difficulties in developinga global energy budget, nonetheless it hasbecome the showpiece of the IPCCassessments (Historical Overview ofClimate Change Science, Figure 1, p. 96)
CO2 represents only 0.0375% by volume ofthe atmosphere and it demonstrates infraredabsorption in three slender bands involvingless than 8% of the infrared spectrum;however, the KT97 Study attributes 26% ofthe radiative forcing to CO2. If such anextreme effect existed, concentrated CO2
in the laboratory should demonstrate a heatconductivity anomaly, which is not the case.Furthermore, nowhere in climatologicalliterature have we seen any discussion ofthe quantum energy states of CO2 moleculesin the range from -10 to -65ºC, the dominanttemperature of the troposphere . Theemissivity of a substance is a function oftemperature.
One of the problematic issues with thismodel is that the energy reaching the top ofthe Earth’s atmosphere during daytime isabout 1,370 watts per square meter (w/m2).However, because the planet is spherical,the energy averaged over the whole planetis approximately one quarter of this value,or 342 w/m2. Of this quarter of the sun’senergy, approximately 107 w/m2 is reflected,while an additional 67 w/m2 is absorbed inthe atmosphere as shown in Figure 4.1.

19
Consequently, 168 w/m2 reaches and isabsorbed by the surface; however, thisradiated energy is not sufficient to heat thesurface to +15ºC. In the KT97 model, theproblem is solved by the atmosphere – bysome unknown means – producing 324 w/m2 that are “back radiated” down to theEarth’s surface. That this violates the firstand second laws of thermodynamics appearsto be of no consequence to climatologists.It is clear that attempting to explain theEarth’s energy solely from radiative heattransfer presents significant problems andthat the radiative-heat-transfer greenhousetheory is seriously flawed.
On the right side of Figure 4.1 are two fluxes– one from the surface producing 350 w/m2
and the other ‘back radiation’ yielding 324w/m2 to the surface. This appears to be acompletely circular energy flow with noactual source. In order to back radiate thisenergy flux, the atmosphere would berequired to have a temperature higher thanthe surface. The adiabatic nature of theatmosphere dictates a decrease oftemperature with elevation. The drop intemperature is typically about 6.5ºC perki lometer, so that at a height of f iveki lometers (mid-troposphere) thetemperature is -32.5ºC, which can notpossibly initiate a down-going energy flux ofthis magnitude. Furthermore, as Thieme(2007) argues, radiant fluxes are definable asto magnitude and direction as vectors. Thesum of vectors will produce a new vectormodified in magnitude and direction, but withthe proviso that two exactly equal vectorsof opposite direction will sum to zero. Thereality (Figure 4.1) is that, in fact, only 40 w/m2 are radiated from the surface. The outgoing350 w/m2 and back radiation of 324 w/m2 areimaginary, again contradicting physical lawssince this is in reality a perpetual motionmachine of the second kind (Kramm, 2007;Gerlich and Tscheuchner, 2007; and Thieme,2003).
Much is made of the impact of trace gases inthe atmosphere, but what of the effect ofthe other 99% which can neither absorb noremit infrared. Nitrogen and oxygen, theprincipal components of air, are heatedduring the day by conduction as groundtemperature exceeds that of the air. The airwarmed by conduction and convection cannot efficiently transmit this energy becausethe nitrogen and oxygen of the air canneither absorb nor emit infrared radiation.The energy absorbed by the air can not betransmitted to space but will be retained towarm the ground as the temperature of thesurface falls below that of the air. The thermalconductivity of oxygen and nitrogen is verylow so that in the absence of convection, airis an excellent insulator. Is it possible ,
although never discussed in the literature,that the atmosphere in itself is actually anefficient insulator?
Gerlich and Tscheuschner (2007), twotheoretical physicists, published on theinternet an extensive article challenginggreenhouse theory and reviewing all of themathematical and thermodynamic principlesinvolved. They challenged the notion of anEarth with no atmosphere, as well as theconcept of global average temperature as anindication of global emmisivity, because inreality each square meter of the Earth’ssurface has a unique characteristic dependingon its composition – forest, meadow, asphalt,water, snow, desert, tundra, and so on. Sothat as Essex et al. (2006) argue, there is noglobal average temperature and it has novalidity within the energy balance concept,and they question the abi l ity of thetroposphere at -65ºC to warm the surfaceat +15ºC.
The greenhouse theorists, argue that everysubstance radiates if it is above absolutezero. But does this apply to gases? Thefundamental argument is that oxygen andnitrogen are transparent to long-waveradiation. Gerlich and Tscheuschner arguethat the Plank and Stefan-Boltzman equationsused in calculations of radiative heat transfercan not be applied to gases in the atmospherebecause of the highly complex multi-body
Figure 4.2. The concept developed by Spencer of the effects of thermal redistribution in the atmosphere.Atmospheric air gets continuously recycled through precipitation systems, which then directly or indirectlycontrol water vapour and cloud properties, and thus the Earth’s greenhouse effect. Spencer and hiscolleagues have now shown that the handling of clouds in atmospheric circulation models is incorrect(Spencer, R. W., 2008).
nature of the problem.
The orthodoxy on the other hand arguesthat photons are emitted in all directions atall times within the quantum realm. Twobodies at di f ferent temperatures wil lcontinue to radiate since the colder bodydoes not recognize the adjacent warmerbody. However, in the observable realm thenet transfer of energy is still from the warmobject to the colder object until equilibriumis achieved, which is never in the out-ofequilibrium climate system. The argumentmay be valid in terms of solid objects butpresents enormous difficulty in a gaseousatmosphere where molecular diffusion isintense and the atmosphere is in constantnon-equilibrium motion. Therefore, althoughphotons may be emitted towards the surface,the net energy flow will always be from thewarm surface to the atmosphere. So that,unless climatology has developed some newthermodynamic principle, back radiation isdenied by fundamental thermodynamic laws.
The development of greenhouse theory isexclusively developed around radiative heattransfer because the imperative of itsauthors was to establish CO2 as the causativemechanism in climate change to the exclusionof anything else. This perspective ignores thefact that climate is subject to other drivers,and while it continuously moves towardequilibrium it never achieves this state.

20
Spencer (2007) argues that precipitationsystems act as the Earth’s thermostat (Figure4.2) and states: “I bel ieve it can bedemonstrated that precipitation systemsultimately control most of the Earth’s naturalgreenhouse effect. The air in our atmosphereis continuously recycled throughprecipitation systems (see Figure 4.2), on atimescale of days to weeks. Wind picks upwater vapour that has been evaporated fromthe surface, and then transports this vapourto precipitation systems. Those systems thenremove some of that vapour in the form ofrain or snow.”
This view is general ly understood byclimatologists, but what are not understoodare the myriad microphysical processeswithin clouds. The or thodox viewincorporated into all General CirculationModels is that the very small effect of CO2
will be amplified by an increase in cloudthereby increasing the warming – a positivefeedback. Spencer (2009) and his colleagues(Spencer and Braswell, 2008; Spencer et al.,2007), have been able to document fromdetailed analysis of satellite data that theclimate system is much less sensitive togreenhouse gas emissions than has beenclaimed by the IPCC. This body of researchhas profound implications for the theoreticalbasis of Anthropogenic Global Warming sinceinstead of relying on theoretical assumptionsunconstrained by measurement andobservation, Spencer and his colleagues havedone exactly the opposite by examiningsatel l ite data in great detai l and thendetermining which aspects of the climatesystem best explain the observations. Theresults are salutary; the detai ledobservations indicate that net feedbacks inthe real climate system on both short- andlong-term time frames are negative.Misinterpretation of cloud behaviour has ledmodelers to build models in which cloud
feedbacks are posit ive . The models,therefore, predict too much warming inresponse to anthropogenic greenhouse gasemissions. That this is correct is welldemonstrated by the last 10 years wherethe IPCC projections for the thermalresponse of the atmosphere consistentlyoverstate the case.
In conclusion, the greenhouse theory ofanthropogenic global warming is seriouslyflawed and certainly provides no scientificbasis to introduce policy measures. This willcause a serious misapplication of scarcecapital to projects that will have no influenceon climate. The amount of capital alreadysquandered to this date on this fruitlessendeavour will, without doubt, emerge asone of the greatest scientific scandals of the20th and 21st Centuries. The almostevangelical need to save the planet hasoverridden any scientific objectivity.
REFERENCESREFERENCESREFERENCESREFERENCESREFERENCESEssex, C., McKitrick, R., and Andresen, B. 2007.Does a global temperature exist? Journal Non-Equilibrium Thermodynamics, v. 32, no. 1, p.1-27.
Gerlich, G . and Tscheuschner, R. D. 2007.Falsification of the CO2 greenhouse effects withinthe frame of physics. arXiv: 0707.1161 v.1[Physics.ao-ph] 8 July 2007.
Intergovernmental Panel on Climate Change.2007. Climate change: the physical science basis,Summary for Policymakers. Fourth AssessmentReport, Geneva, Switzerland.
Intergovernmental Panel on Climate Change.2007. Climate change: historical overview ofclimate change science. Fourth Assessment Report,Geneva, Switzerland.
Kiehl, J. T. and Trenberth, K. 1997. Earth’s annualmean global energy budget. Bulletin of the
Meteorological Society, v.78, no. 2, p.197- 208.
Kramm, G. 2008. Contribution to discussion ofGerlich and Tscheuschner paper. Falsification ofthe CO2 greenhouse effects within the frame ofphysics. Rabett.blogspot.com/2008/02/all-younever- wanted-to-know.html. Items 180, 457, 735,770, and 844.
Murdin, P. (Ed.). 2001. Encyclopedia of astronomyand astrophysics. Nature Publishing Group, NewYork. http://eaa.crcpress.com.
Spencer, R. W. 2008. Climate Confusion: How globalwarming hysteria leads to bad science, panderingpoliticians and misguided policies that hurt thepoor. Encounter Books.
Spencer, R. W. In press. Satellite and climate modelevidence against substantial man-made climatechange. Journal Climate.
Spencer, R. W., Braswell, W. D., Christy, J. R., andHnilo, J. 2007. Cloud and radiation budgetchanges associated with tropical intra-seasonaloscillations. Geophysical Research Letters, 34,L15707, doi: 1029/2007GL029698.
Spencer, R. W. and Braswell, W. D. 2008. Potentialbiases in cloud feedback diagnosis: A simple modeldemonstration. Journal Climate, Nov 1.
Thieme, H. 2003. On the phenomenon ofatmospheric backradiation. http//www.geocities.com/atmosco2/backrad.htm.
Wood, R. W. 1909. Note on the theory of thegreenhouse. Philosophical Magazine v. 17, p. 319-320. www.mconol ley .org.uk/sc i /wood_rw.1909.html.
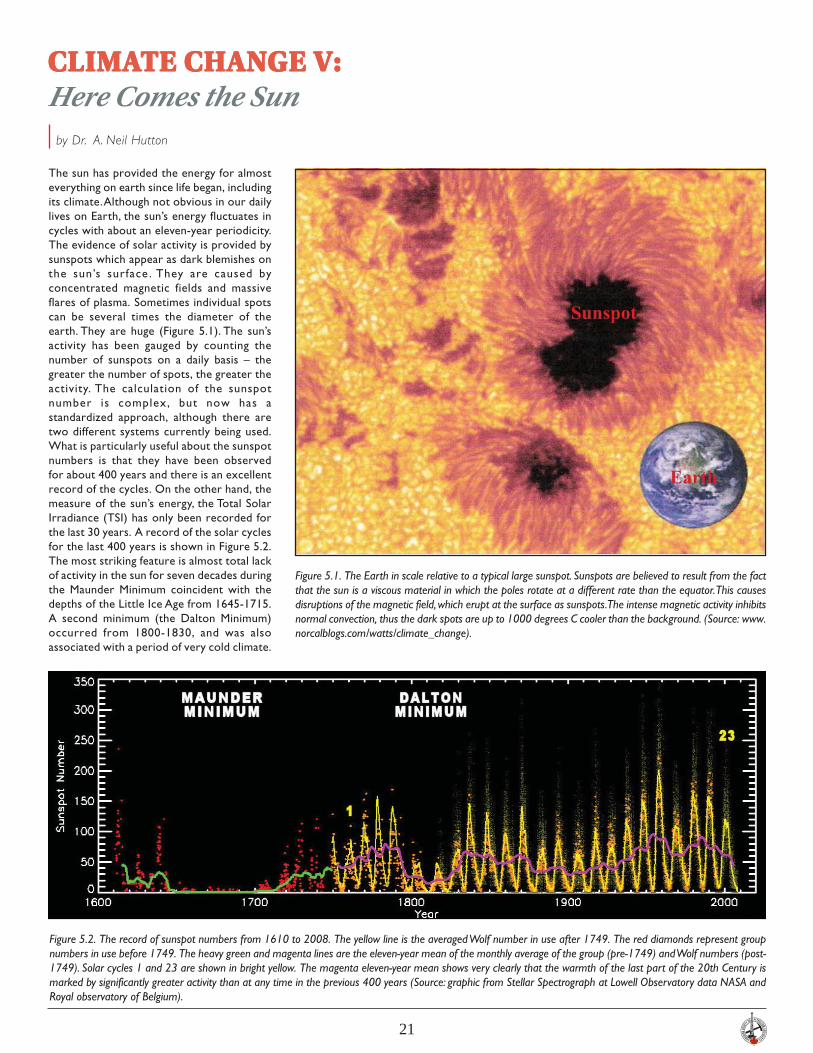
21
CLCLCLCLCLIMAIMAIMAIMAIMATE CHANGTE CHANGTE CHANGTE CHANGTE CHANGE VE VE VE VE V:::::Here Comes the Sun by Dr. A. Neil Hutton
The sun has provided the energy for almosteverything on earth since life began, includingits climate. Although not obvious in our dailylives on Earth, the sun’s energy fluctuates incycles with about an eleven-year periodicity.The evidence of solar activity is provided bysunspots which appear as dark blemishes onthe sun’s surface . They are caused byconcentrated magnetic fields and massiveflares of plasma. Sometimes individual spotscan be several times the diameter of theearth. They are huge (Figure 5.1). The sun’sactivity has been gauged by counting thenumber of sunspots on a daily basis – thegreater the number of spots, the greater theactivity. The calculation of the sunspotnumber is complex, but now has astandardized approach, although there aretwo different systems currently being used.What is particularly useful about the sunspotnumbers is that they have been observedfor about 400 years and there is an excellentrecord of the cycles. On the other hand, themeasure of the sun’s energy, the Total SolarIrradiance (TSI) has only been recorded forthe last 30 years. A record of the solar cyclesfor the last 400 years is shown in Figure 5.2.The most striking feature is almost total lackof activity in the sun for seven decades duringthe Maunder Minimum coincident with thedepths of the Little Ice Age from 1645-1715.A second minimum (the Dalton Minimum)occurred from 1800-1830, and was alsoassociated with a period of very cold climate.
Figure 5.1. The Earth in scale relative to a typical large sunspot. Sunspots are believed to result from the factthat the sun is a viscous material in which the poles rotate at a different rate than the equator. This causesdisruptions of the magnetic field, which erupt at the surface as sunspots. The intense magnetic activity inhibitsnormal convection, thus the dark spots are up to 1000 degrees C cooler than the background. (Source: www.norcalblogs.com/watts/climate_change).
Figure 5.2. The record of sunspot numbers from 1610 to 2008. The yellow line is the averaged Wolf number in use after 1749. The red diamonds represent groupnumbers in use before 1749. The heavy green and magenta lines are the eleven-year mean of the monthly average of the group (pre-1749) and Wolf numbers (post-1749). Solar cycles 1 and 23 are shown in bright yellow. The magenta eleven-year mean shows very clearly that the warmth of the last part of the 20th Century ismarked by significantly greater activity than at any time in the previous 400 years (Source: graphic from Stellar Spectrograph at Lowell Observatory data NASA andRoyal observatory of Belgium).
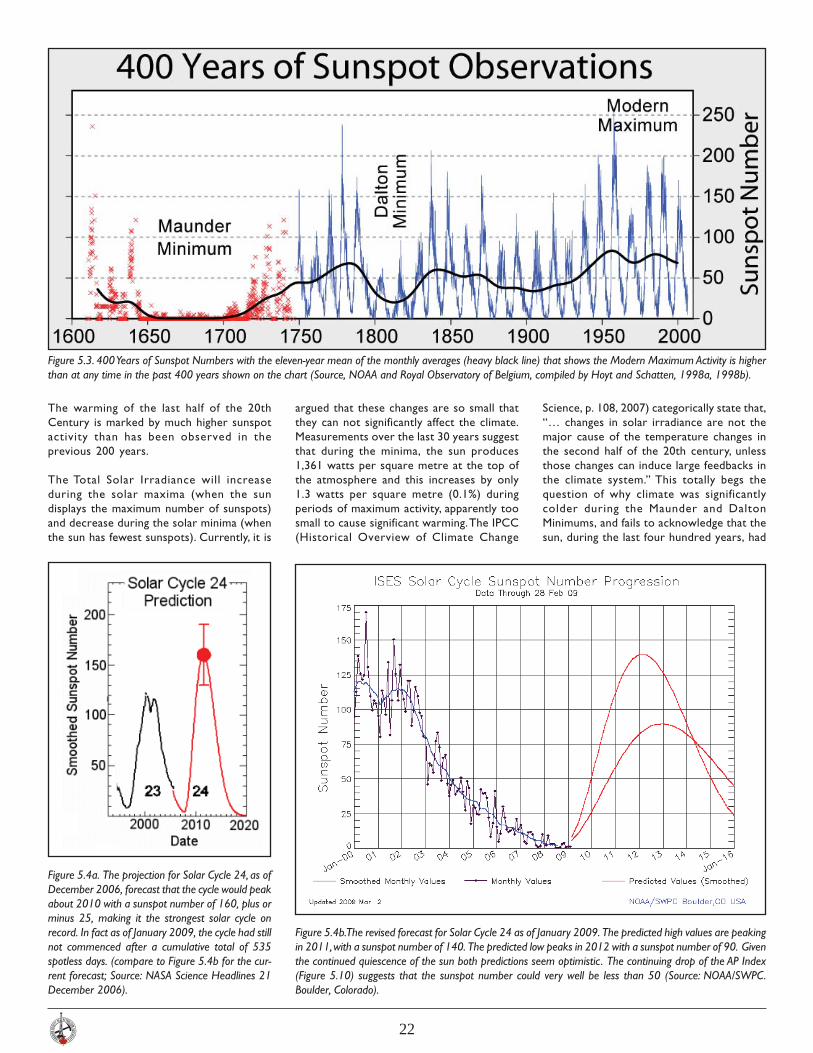
22
The warming of the last half of the 20thCentury is marked by much higher sunspotactivity than has been observed in theprevious 200 years.
The Total Solar Irradiance will increaseduring the solar maxima (when the sundisplays the maximum number of sunspots)and decrease during the solar minima (whenthe sun has fewest sunspots). Currently, it is
Figure 5.3. 400 Years of Sunspot Numbers with the eleven-year mean of the monthly averages (heavy black line) that shows the Modern Maximum Activity is higherthan at any time in the past 400 years shown on the chart (Source, NOAA and Royal Observatory of Belgium, compiled by Hoyt and Schatten, 1998a, 1998b).
Figure 5.4a. The projection for Solar Cycle 24, as ofDecember 2006, forecast that the cycle would peakabout 2010 with a sunspot number of 160, plus orminus 25, making it the strongest solar cycle onrecord. In fact as of January 2009, the cycle had stillnot commenced after a cumulative total of 535spotless days. (compare to Figure 5.4b for the cur-rent forecast; Source: NASA Science Headlines 21December 2006).
Figure 5.4b. The revised forecast for Solar Cycle 24 as of January 2009. The predicted high values are peakingin 2011, with a sunspot number of 140. The predicted low peaks in 2012 with a sunspot number of 90. Giventhe continued quiescence of the sun both predictions seem optimistic. The continuing drop of the AP Index(Figure 5.10) suggests that the sunspot number could very well be less than 50 (Source: NOAA/SWPC.Boulder, Colorado).
argued that these changes are so small thatthey can not significantly affect the climate.Measurements over the last 30 years suggestthat during the minima, the sun produces1,361 watts per square metre at the top ofthe atmosphere and this increases by only1.3 watts per square metre (0.1%) duringperiods of maximum activity, apparently toosmall to cause significant warming. The IPCC(Historical Overview of Climate Change
Science, p. 108, 2007) categorically state that,“… changes in solar irradiance are not themajor cause of the temperature changes inthe second half of the 20th century, unlessthose changes can induce large feedbacks inthe climate system.” This totally begs thequestion of why climate was significantlycolder during the Maunder and DaltonMinimums, and fails to acknowledge that thesun, during the last four hundred years, had

23
its most active period in the last half of the20th Century (Figure 5.3).
Moreover, in order to justify the warmingeffect of traces of CO2 in the atmosphereIPCC (ibid.) have appealed to the unprovenassumption of positive cloud feedback tocause warming. Otherwise the traces ofatmospheric CO2 are incapable of having asignif icant effect. The cloud feedbackassumptions have recently been shown tobe incorrect, essentially invalidating allprevious results from computer-generatedclimate models, all of which assume positivefeedbacks. Spencer et al. (2007) and Spencer(2009) documented from satellite dataanalysis that cloud feedbacks are negative –basically invalidating the CO2-warminghypothesis.
On December 21st, 2006, Dr. DavidHathaway of the Marshall Space Flight Centerannounced that Solar Cycle 24 would be oneof the most intense cycles sincerecordkeeping began 400 years ago. Theprediction was for a maximum sunspotnumber (SSN) peaking about the year 2010,at an SSN of 160, plus or minus 25. (Figure5.4a) By April 2007 it appeared that SolarCycle 24 was running late. It was thenpredicted to peak in mid-2011 or 2012 withan SSN of 90-125. Finally, in January, 2008 thearrival of Solar Cycle 24 was announcedbased on the appearance of a small sunspotof reverse polarity to that seen in previousSolar Cycle 23. Nevertheless, one year later,the sun remained quiescent with the fewestsunspot days recorded in the last century.(Figure 5.4b) There was a total of 266sunspot-free days for the year, resulting in2008 being the least active solar year since1900 (Figure 5.5).
New data from the Solar Data and ClimateExperiment (SORCE) shows that Total SolarIrradiance is now at its dimmest since recordsof TSI were establ ished in 1978. Theimplications of these observations are thatthe climate should be cooling and, indeed,this has been observed. An abrupt coolingtook place between January 2007 and January2008, recorded by all of the world’s globalclimate stations. Furthermore, the GloballyAveraged Temperature recorded by HadleyClimate Centre (Figure 5.6) has declinedsignificantly concurrently with the failure ofSolar Cycle 24 to appear. If the sun remainsin this dormant state, the world could beheading into a period of significant coolinganalogous to the Dalton Minimum in theearly 1800s.
There has been extreme reluctance on thepart of IPCC to acknowledge a sun / climateconnection, notwithstanding thedocumentation of many signi f icant
Figure 5.5. Chart showing the cumulative number of sunspot-free days in 2007 and 2008. The number ofsunspot free days in 2008 is the highest since 1913. For most of the last century, cycles 16-23 have shownfewer spotless days as they reached their minima.
Figure 5.6. The Global Average Temperature 1850-2008. This data set shows that there has been no warmingsince 2000 and that there has been a significant temperature drop since 2007. The temperature decline isoccurring in concert with the changes observed in the sun’s energy output, both in sunspot number and in theAP energy index. The latter index shows a marked decrease as of October 2006 (source: Met Office HadleyCentre for Climate Change).
correlations, such as the correspondence ofsunspot cycle length with global average landtemperature. The IPCC principle dogma isthat the variations in TSI are too small tohave any influence on climate, although theTSI measurements have only existed for 30years. This dogma is maintained despite thefact that the Maunder Minimum and DaltonMinimum are associated with periods ofsubstantial and well documented cooling of
the world’s climate. The fact that the precisemechanism is not understood does notnegate the influence of the sun. When Friis-Christensen, a leading solar researcher,attended the initial IPCC meetings he wassurprised to find that the committees refusedto consider the sun’s influence on climate asa topic worthy of investigation! Thejustification was that the IPCC mandate wasto investigate man-made causes of climate

24
change. In other words, they wanted toconfirm that human-released CO2 was thecause of warming.
So far we have discussed the decadal andcentennial effects of the sun’s variability onclimate as a result of the sunspot cycle andassociated changes in TSI. What we will tryto demonstrate next is that the sun’sinfluence is complex and multifaceted, andthat there are a variety of complexmechanisms altering the impact of the sun’senergy on Earth. In the search for amechanism that could explain the profoundchanges in climate resulting in the Earth’sextensively documented glacial cycles, aSerbian astrophysicist, Milutin Milankovitch,developed a hypothesis that states that, asthe Earth travels through space around thesun, cyclical variations in the axial attitudeand orbit combine to produce variations inthe amount of solar energy reaching theEarth. Milankovitch recognized three specificaspects of the Earth’s attitude to the sun(Figure 5.7):
1). The shape of the Earth’s orbit changesfrom elliptical (high eccentricity) toalmost circular (low eccentricity) in acycle that takes between 90,000-100,000years. When the orbit is highly ellipticalthe amount of insolation (the totalenergy of the sun reaching the Earth) atthe closest approach (perihelion) wouldbe in the order of 20-30% greater thanat the most distant point (aphelion),resulting in a much different climate thanwe experience today since the orbit isnow almost circular.
2). The axis of the Earth’s rotation is tiltedand this tilt causes the changes inseasons from summer to winter. Thetilt, however, changes over a period ofabout 40,000 years from approximately22.1 to 24.5 degrees. Increased tiltmeans more severe seasons wthwarmer summers and colder winterswhile less tilt means colder summersand milder winters. The colder summers
Figure 5.8. A diagram summarizing the effect of the Milankovitch Cycles in the last million years. The bottomcurve plots the stages of glaciation which have a rather regular 100-year periodicity, corresponding, in turn,to the peak eccentricity of the Earth’s orbit. Just as striking, however, are the regular 15-20,000-year warmperiods. Most observers looking at this periodic cycle would conclude that we may very well be reaching theend of the current warm cycle although presently the Earth’s orbit has low eccentricity (nearly circular)(Source: Orbital data - Quinn et al. 1991; glacial cycles - Lisiecki and Raymo, 2005).
Figure 5.7. Diagrammatic representation of the orbital parameters of the Earth. The eccentricity of the orbit,the tilt of the axis of rotation, and the circle of precession as described in points 1, 2, and 3 in the text. (Source:http://www.open.ou.nl//dja/klimaat/System/solar_radiation_and_milank.htm).
are believed to allow snow and ice toaccumulate in high latitudes building intomassive ice sheets. The albedo(reflectivity) of the snow and ice causesmore of the sun’s energy to be directedback to space accelerating the cooling.
3). In addition to the tilt of the Earth’saxis, it also has a wobble or eccentricity,not unlike the wobble of a spinning topas the spin decreases. This is known asprecession and it changes the attitudeof the Earth in its orbit. If a hemisphereis pointed toward the sun at perihelion,that hemisphere will be pointed awayat aphelion, resulting in a more extremedifference in seasons. This seasonal
effect is reversed for the oppositehemisphere. Presently our northernsummer occurs near aphelion.
From these relationships Milankovitchcalculated a link between global ice volumeand insolation resulting from variations inthe Earth’s orbit. He focused his analysis onsummer insolation at 65 degrees north,reasoning that cooler summers might reducesummer snow melt, which would result in apositive accumulation of snow and ice andthe development of ice sheets. Milankovitch’swork was ignored for about 50 years and histheory was strongly criticized in the 1950sand 1960s by meteorologists, who arguedthat variations in insolation were insufficientto cause the changes he predicted. In 1976his work was vindicated by the discoverythat deep sea sediment cores did in factcorrespond to periods of climate change asMilankovitch had theorized (Figure 5.8). In1982 the US National Academy of Sciencescommended the Milankovitch Cycle modelas follows:
“…orbital variations remain the mostthoroughly examined mechanism of climaticchange on time scales of tens of thousandsof years and are by far the clearest case of adirect effect of changing insolation on thelower atmosphere of the earth.” (NationalResearch Council, 1982).

25
Figure 5.9. Solar activity from 1700 with Abdussamatov’s projections beyondthe year 2000. According to the author, the sun is at the end of a 200-yearsolar cycle. The continuation of warming is attributed to the thermal inertia ofthe oceans as a result of warming during the 20th Century. Beyond 2000, theauthor forecasts a sharp decline in solar activity. The peak at the year 2000is Sunspot Cycle 23 and that Abdussamatov’s forecast for Cycle 24 (made in2006) is lower than the most recent projection from NOAA in January 2009.On this basis, the analysis of the solar radius has greater predictive ability forthe variability of the solar cycle (Source: Solomon, 2008).
Figure 5.10. This graph shows the progression of the Average Planetary Mag-netic Index which is a measure of the solar particle radiation by its magneticeffects. The Index shows a significant decline with a distinct step in October 06to values ranging from 7-8. Since then, there has been a further sharp declineto values of 3 or 4, the lowest ever recorded. All of this suggests that the sun hasmade a transition from a very active cycle to an inactive period. This mayhave the characteristics of a Dalton Minimum of the 1800s (Source: NOAA/SWPC. Boulder, Colorado).
Nevertheless, Milankovitch’s work has fallenout of favour once more, since climatologistsare reluctant to concede a role for the sunand prefer to discount variat ions ininsolation as having a material effect onclimate. Most of the current criticisms arebased on lack of an ideal perfect fit to thepredicted cycles. This assumes, of course, thatthere are no other factors influencing thecl imate during the periodicity of theMilankovitch Cycles which, as we will discuss,is not the case . The sunspot cycleundoubtedly has an influence but this occursover a shorter time frame than the majorglacial cycles.
A number of researchers have studiedlongterm patterns of sunspot cycles in orderto detect longer-term trends. Commonly theapproach is to run an autocorrelation analysisto detect statistically significant cycles. (e.g.,Cole, 1973; Neftel, Oeschger, and Suess,1981). Typically such studies identify a 200-year cyclicity in minima to maxima of thesun’s 11-year sunspot cycle.
Khabibullo Abdussamatov (2007), a Russianspace researcher, also determined that sunspots occur in 200-year cycles. For example,he regards the period of the Medieval WarmPeriod to the conclusion of the Little IceAge (LIA) as the first 200-year cycle. Thesecond cycle is from the end of the LIA untilthe present. (Figure 5.9). Abdussamatovattributes the lag in cooling to the thermalinertia of the oceans, which have an immenseheat capacity, and have been warmedsignificantly during the 20th Century. AsFigure 5.9 suggests, Abdussamatov’sprojections may prove to be accurate sincehe records a sharp dropoff in the year 2000,with a minima at or before the year 2040.The current behaviour of the sun is actuallylower than the Abdussamatov forecast andindicates that we may be entering a periodof global cooling. The projections are notbased on analysis of individual sunspot cycles,but on observations of the solar radius,which is directly related to solar activity. Itwas noticed during the Maunder minimumof the LIA, that the quiescent sun’s radiusdecreased significantly, thus the measure ofsolar radius and its behaviour provides aguide to broader cycles of the solar activity.Recently released data indicates that the TotalSolar Irradiance and the Average PlanetaryMagnetic Index (AP) are declining, and arenow at the lowest levels since the 1930swhen recording started (Figure 5.10).
The AP index is designed to measure solarparticle radiation by its magnetic effects andprovides a measure of the sun’s magneticfield, the heliosphere. The heliosphere is theresult of a constant stream of chargedparticles, the solar wind, emanating from the
sun, which extends thesun’s magnetic field farinto space. The solarwind was discovered in1958, and space probesnow show that itextends far beyond thesun and the solar systeminto interplanetaryspace. To provide somemeasure of the scale ofthe heliosphere, lightor any unimpededcosmic particle will takesome 20 hours to travelfrom the outer limit ofthe heliosphere intothe centre of the solarsystem, compared toeight minutes for lightfrom the sun to reachthe earth. So, not onlydoes the sun provide uswith its energy, but theheliosphere is l ike agiant umbrel laprotecting us from apotentially devastatingrain of cosmic energy(Figure 5.11, page 26).The boundary of theheliosphere fluctuatesaccording to surges ofcosmic energy and thecompeting energy ofthe solar wind.
Approximately 50-70%of incoming cosmicradiation is deflected bythe heliosphere, withthe remaining cosmicenergy reaching theEarth, where it is, inpart, deflected by themagnetic field. In theatmosphere, primaryparticles are to a largeextent brought to haltin collisions. The releaseof energy yieldsmillions to billions ofsecondary particles thatdissipate steadi lytowards sea level .Measurements indicatethat cosmic rays show a25-30% decreasefollowing periods of high sun-spot countswhen the solar wind is strong. Therefore,there is a link between the sun’s TSI and itsdeflection of cosmic energy, which hassignificant effects on Earth’s climate.
This new scientific field of cosmo-climatologywas started by a pioneering paper in 1991 by
Friis-Christensen and Lassen in which theydocumented a close relationship betweensolar activity and the surface temperature ofthe earth (Figure 5.12, page 26).Subsequently, in 1997, Svensmark and Friis-Christensen, in a landmark paper,documented a relationship between globalcloud coverage and cosmic ray flux. These

26
f indings were expanded by Marsh andSvensmark in 2000, describing the manner inwhich low cloud properties, in particular,are influenced by cosmic rays. Figure 5.13shows a quite remarkable correlationbetween the changes in the cloud cover inthe troposphere and the associated variationin cosmic radiation intensity in the periodfrom 1984-1994. One can readily see thatthe more cosmic rays enter the troposphere,the more cloud develops. Cosmic rays ionizethe molecules of the atmospheretransforming them into condensation nucleifor water vapour.
I think we can saythat these findingswere greeted byhostility from thepromoters ofA n t h r o p o g e n i c(man-made) GlobalWarming theory. Itwould be fair to saythat there was adeliberate attemptto discreditS v e n s m a r k ’ sresearch and toforestall approvalof funds tod e t e r m i n eexperimentally thenucleation ofclouds by cosmicrays. It was,therefore, not until2006 thatSvensmark and histeam was able toembark on anexperiment inwhich a reaction
chamber the size of a small room wasconstructed in the basement of the DanishNational Space Center. The gases in thechamber mimicked the chemistry of thelower atmosphere. Naturally occurringcosmic rays entered through the ceiling. Theresult demonstrated quite conclusively thatcosmic rays induced and catalyzed cloudcondensation nuclei. The intensity of thereaction surprised the investigators who hadexpected only a moderate response. Thisconfirmed Svensmark and his collaborators’interpretation that quite small changes incosmic radiation could have a significant
effect on climate through the promotion ofcloud cover (see Svensmark and Calder 2007,“The Chilling Stars” for an excellent reviewon cosmoclimatology).
So now it is apparent that there is a feedbackmechanism associated with the sun’s drop inenergy output and the production ofaerosols, the precursors for the formationof cloud droplets, by interaction of cosmicrays in the troposphere. Although the declinein observed TSI may be small, it signals a dropin the energy of the solar wind and a greaterinflux of cosmic rays. This in turn producesmore cloud and lowered temperatures.Climate models only include the effects ofthe small variations in the direct solarradiation without the feedback effects ofcosmic rays on clouds. Also, as alreadydiscussed in an earlier article, the work ofSpencer (2009) demonstrates that the modelfeedback assumptions are wrong in the firstplace,
The other element in this great clash ofcosmic energy is the variability and intensityof cosmic rays. The greatest generation ofcosmic rays comes from stellar explosionscalled supernovae which occur about onceevery 50 years in a galaxy such as the MilkyWay. They cause a brilliant luminous burst ofradiation which briefly may outshine anentire galaxy before fading in a few weeksor months. During this brief interval, asupernova can radiate as much energy as thesun in its entire life span (Giaccobe, 2005).The explosion expels most of the stellarmaterial at a velocity at up to one-tenth ofthe speed of light, driving a shock wavethrough the interstellar medium.
Nir Shaviv, an Israeli physicist, working on
Figure 5.11. An illustration of the Heliosphere in relation to the solar planetarysystem and interstellar space. Variations in the sun’s activity will result in expansionor contraction of the Heliosphere which is also modulated by the strength of thecosmic flux of the interstellar wind (Source: NASA Basics).
Figure 5.12. A plot of the sunspot cycle length versus the Northern Hemisphereland temperature that shows a remarkably good correlation over the last 130years. On average, cycles are eleven years but it is known that the cycles areshorter when activity is strong and are longer when activity is weak. Although thiscorrelation is convincing that there is a sun-Climate link it has been systematicallyignored by IPCC (Source: Friis-Christensen and Lassen, 1991).
Figure 5.13. This diagram was developed by observing the changes in cloudinessas observed by geostationary satellites and comparing this with the variations incosmic radiation. The coincidence of the changes in the cloud cover with thechanges in cosmic radiation intensity is remarkable and provides compellingevidence of the sun’s role in the cosmic ray cloud feedback system (Source:Marsh and Svensmark, 2000).

27
iron meteorites noticed that some samplesdisplayed extensive cosmic ray damage whileothers were l itt le af fected. What hedetermined was that meteorites sustained2-5 times the damage, while traveling throughthe spiral arms of the Milky Way Galaxy, asthey did in the relatively empty spacebetween the spiral arms (Shaviv, 2002).
This seemed logical since the supernovae,the source of cosmic rays, are most likely tobe located in the spiral arms. Our Milky WayGalaxy is a disc-like body with curved armsradiating from its centre and, through time,the solar system travels through the galaxy.The solar system revolves around thegalaxy’s centre so that every 135 millionyears (plus or minus 25 million years) weshould expect a colder climate as the solarsystem passes through a spiral arm. Withinthe spiral arm, the cosmic ray density wouldbe sufficient to change Earth’s cloud coverby 15% – more than enough to change thestate of the Earth from a hothouse withtemperate climates extending to the polarregions, to an ice house with extensive polarice caps. Shaviv argues that cosmic rayfluctuations explain more than two-thirdsof Earth’s temperature variations, and ongeological time scales, are the most dominantclimate drivers. This conclusion is based onthe comparison of cosmic ray flux variationscompared to a reconstruction oftemperature derived from studying oxygenisotope in the shells of fossils from tropicaloceans (Veizer, 2000; Shaviv and Veizer, 2003).The results of this comparison are presentedin Figure 5.14 where the match of cosmicray flux with reconstructed temperature isclose to a 100% correlation, leaving littleroom for other potential climate drivers suchas CO2. Furthermore, when comparison ofreconstructed CO2 values (GeocarbIII;Berner and Kothvala, 2001; Berner and Streif,2001; Rothman, 2002) is made with
Figure 5.14. A comparison of the Cosmic Ray Flux(CRF) constructed from iron meteorite exposure data(Shaviv, 2002b). The blue line depicts the nominalCRF, while the yellow shading delineates the errorrange. The other curves denote other CRF recon-structions leading to the final fine-tuned blue recon-struction. The bottom black curve depicts a statisti-cally smoothed curve of temperature spanning500m.y. (Veizer et al., 2000). The red line is themodel reconstruction for temperature based on theCRF flux (red line upper). The blue bars at the toprepresent cool climate modes with established polarice caps (icehouses) while the white bars representtimes of warmth (greenhouses) as developed fromsedimentological criteria (Frakes and Francis, 1998;Frakes et al., 1992). The figure demonstrates thatthe ‘icehouses’ and oxygen isotope cold intervals co-incide with times of high CRF production, while thegreenhouse intervals are characterized by low CRFepisodes (Source: Shaviv and Veizer, 2003).
Figure 5.15. Climate indicators for Phanerozoic geological epochs derived from oxygen isotope ratios plottedwith the reconstructed partial pressure of CO2. (pCO2) levels. The bottom set of curves are the running meansfor various filters as indicated bottom left and yield a proxy for temperature. The shading on the bottomcurves reflects the distribution of glacial deposits (OGD) and the paleolatitudinal deposits of ice-rafted debris(PIRD). The blue and white bars are as described in Figure 5.14 reflecting cold or warm climates. The upperset of curves outlines the reconstructed histories of past pCO2 variations (data from Geocarb III by Bernerand Kothvala, 2001; Berner and Streif, 2001; and Rothman, 2002). Cross-hatching reflects error range in thereconstructions. It is clear on the basis of this data set that CO2 has no significant correlation with Phanerozoicclimate (Source: Shaviv and Veizer, 2003).
Phanerozoic climate trends, the correlationis poor (Figure 5.15). Possibly CO2
reconstructions can be improved, but the
high correlation with celestial driversindicates that CO2 can not have a significantrole in climate variability over geological

28
time scales. The fundamental problem is thatthere is no natural system that can act overgeological time scales to add or remove CO2
from the atmosphere. The oceans are themain reservoir of CO2 so that in cold cyclesatmospheric CO2 should be reduced, andincreased as the ocean warms. Thereforechanges in atmospheric CO2 follow climatechange.
What emerges from this review is thatclimate is subject to a series of cyclesoperating on different time scales butmodulated by the activity of the sun and itsinterplay with the Cosmic Ray Flux. On shorttime scales of decades and centuries, the sunspot activity, together with negative feedbackfrom cosmic ray flux, are the principal climatedrivers inducing the modulation of ourcurrent warm period, and the historicvariation indicated by the Little Ice Age,Medieval Warm Period, Dark Ages Cooling,Roman Warm Period, etc.. On the scale ofmillennia are the Milankovitch Cycles wherechanges in insolation related to the attitudeand proximity to the sun cause glaciationwith a distinct 100,000 year or 40,000 yearperiodicity. Finally there is the millionarycelestial cycle with a period of 143 (plus orminus 10 million years) as the sun travelsthrough the Milky Way Galaxy, changing theEarth’s climate from icehouse to greenhousewith the modulation of the Cosmic Ray Flux.If CO2 has any role in this cosmic journey itis very minor and probably co-incidental.
REFERENCESAbdumassatov, K. I. 2007. Optimal Prediction ofthe Peak of the Next 11-year Cycle and of thePeaks of Several Succeeding Cycles on the Basisof Long-Term Variations in the Solar Radius orSolar Constant. Kinematika i Fisika Nebesnykh,Tel 23, no. 3.
Berner, R. A. and Kothvala, Z. 2001. GEOCARB III:A revised model of atmospheric CO2 overPhanerozoic time. American Journal of Science, v.301 p. 182-204.
Berner, U. and Streif, H. 2001. Klimafakten DerRuckblick Ein Schlussel fur die Zukunft. Stuttgart,Science Publishers, 238 p.
Cole, T. W. 1973. Periodicities in Solar Activity. SolarPhysics, v. 30.
Frakes, L. A. and Francis, J. E. 1988. A guide toPhanerozoic cold polar climates from high latitudeice rafting in the Cretaceous. Nature, v. 33, p.547-549.
Frakes, L. A., Francis, J. E., and Syktus, J. I. 1992.Climate modes of the Phanerozoic; The history ofthe Earth’s climate over the past 600 million years.Cambridge, Cambridge University Press, 286 p.
Friis-Christensen, E. and Lassen, K. 1991. Lengthof Solar Cycle: An Indication of Solar ActivityClosely Associated with Climate. Science, v. 254,no. 5032, p. 698-700.
Giaccobe, F. W. 2005. How a Type II SupernovaExplodes. Electronic Journal of Theoretical Physicsv. 2, no. 6, p. 30-38.
Intergovernmental Panel on Climate Change.2007. Climate Change: Historical Overview ofClimate Change Science. Fourth AssessmentReport. Geneva, Switzerland.
Lisiecki, L. E. and Raymo, M. E. 2005. A Pliocene-Pleistocene stack of 57 globally distributed benthicOxygen 18 records. Paleoceanography, v. 20,PA1003.
Marsh, N. D. and Svensmark, H. 2000. Low CloudProperties Influenced by Cosmic Rays. PhysicalReview Letters, v. 85, p. 5004-5007. Milankovitch,M. (see: www.earthobservatory. nasa.gov/Features/Milankovitch).
Neftel, A. Oeschger, H. and Suess, H. E. 1981.Secular Non-random Variations of CosmogenicCarbon 14. Earth and Planetary Science Lettersv. 56, no. 12, p. 127-137, 141-147.
Quinn, T. R., et al. 1991. A Three Million YearIntegration of the Earth’s Orbit. The AstronomicalJournal, v. 101, p. 2287-2305.
Rothman, D. H. 2002. Atmospheric carbon dioxidelevels for the past 500 million years. Proceedingsof the National Academy of Sciences, v. 99, p.4167-4171.
Shaviv, N. J. 2002a. Cosmic ray diffusion from thegalactic spiral arms, iron meteorites and a possibleclimate connection? Physical Review Letters, v. 89,051102.
Shaviv, N. J. 2002b. The spiral structure of theMilky Way, cosmic rays, and ice age epochs onEarth. New Astronomy, v. 8, p. 39-37.
Shaviv, N. J. and Veizer J. 2003. Celestial Driver ofPhanerozoic Climate. GSA Today, v. 13 no. 7, p. 4-10.
Spencer, R. W. 2009. Satellite and Climate ModelEvidence against Substantial Man Made ClimateChange. In Press. Journal of Climate, also atwww.drroyspencer.co.
Svensmark, H. 1998. Influence of cosmic rays onEarth’s climate. Physical Review Letters, v. 81, p.5027-5030.
Svensmark, H. and Calder, N. 2007. The ChillingStars: A Cosmic View of Climate Change, Icon BooksLtd. U.K.
Svensmark, H. and Friis-Christensen, E. 1997.Variations in Cosmic Ray Flux and Global CloudCoverage – a Missing Link in Solar ClimateRelationships. Journal of Atmospheric and Solar-Terrestrial Physics, v. 59 p. 1225-1232.
Veizer, Jan. 2003. Celestial climate driver : aperspective from four billion years of the Carboncycle. Geoscience Canada, v. 32, p. 32-3
29
CLCLCLCLCLIMAIMAIMAIMAIMATE CHANGTE CHANGTE CHANGTE CHANGTE CHANGE VE VE VE VE VI:I:I:I:I:Fearmongering by Dr. A. Neil Hutton
There is an endless litany of misinformationdisseminated by those espousing humaninduced warming. So much so that it will notbe possible to refute all of the erroneousclaims within this article. The list is long:melting icecaps, retreating glaciers, rising sealevel, and ocean acidification; “the spin cycle”of more hurricanes, tornadoes, and cyclones;desertification and droughts; floods andtorrential rains; animal extinction; and finally,spreading disease and death. The worstoffenders in all of this are our media, (print,wireless, and visual) who happily regurgitateevery sensationalized and exaggerated claimattributed to the cause of anthropogenicglobal warming.(AGW) The data, if the mediawas alert and competent, is only a few mouseclicks away, so that, with very little effort,the facts can be easily checked. Much of theinformation is a matter of public record, andthe vast majority of the claims can easily bediscredited. The remainder is grosslyexaggerated.
Perhaps one of the most egregious sourcesof misinformation is the Gore documentary,“An Inconvenient Truth.” Very recently, theBritish High Court decided that the film wasunsuitable to be shown in the British Schoolsbecause of at least nine errors of fact, andthe high level of misleading and exaggeratedstatements. Nonetheless, our publ icbroadcaster, CBC, has this year seen fit toscreen the Gore film without disclaimer orany presentation of balance to theexaggerated claims. In the plethora ofmisleading hype in the media, Gore’s moviehit on all of them, no fewer than 35 false orerroneous claims documented by Moncton(2007) following the High Court case.
The National Geographic Magazine is a finepublication but it is equally as guilty as Gorein producing seriously misleading articles onClimate Change. An article in the June 2007issue is a case in point. Entitled “The BigThaw,” the ar ticle retreads al l of theunwarranted claims contained in the Goremovie:
“A Global Retreat: Ice is on the run inits mountain and polar strongholds. Asthe ice sheets on Greenland andAntarctica shrink in the next fewcenturies, seas could rise 20 ft. (6.1 m).The shrinkage of mountain glaciers willdry up rivers and alter landscapes.”
The first problem is the assumption thatclimate should not change when in reality itis continuously cycl ical , with welldocumented historic warm periods in whichtemperatures matched or signif icantlyexceeded our current warmth. The kind ofapocalyptical claims made above simply arenot supported by the evidence.
Also, the cyclical advance and retreat ofglaciers with climate is well documentedfrom historical and archaeological records.It is very clear that the Earth has been in awarming cycle since the end of the Little IceAge in the middle of the nineteenth Century.We should expect that glaciers will retreatafter 150 years of warming – this is naturaland cyclical, and is well illustrated by theSchnidejoch Glacier in the Swiss Alps(Svensmark and Calder, 2007). Artifacts havebeen recovered in the pass as the Glacierretreats indicating that during warm periodsthe Schnidejoch Pass was used by travelersto cross the Swiss Alps. The earliest artifactis a birch quiver dated to the close of theHolocene Climate Optimum (4,700 yearsago), and more than 300 items indicatingextensive use of the pass in the Roman andMedieval Warm Periods. Warming andassociated glacial retreat are naturalprocesses and are not in themselves anindication of adverse or human-inducedclimate change.
The history of the Schnidejoch Glacier’sadvance and retreat is replicated for glaciersthroughout the world. While people arebeing told that they are responsible for glacialretreat, consider the dread of people in thepath of advancing glaciers during the LittleIce Age:
“The year was 1645, and the glaciers inthe Alps were on the move. InChamonix at the foot of Mont Blanc,people watched in fear as the Mer deGlace glacier advanced. In earlier yearsthey had seen the slowly flowing iceengulf farms and crush entire villages.”
The people turned to the Bishop of Genevafor help, and, at the ice front a rite ofexorcism was performed. Little by little theflow ceased and, the glacier receded. Similardramas unfolded throughout the Alps,Scandinavia and Iceland during the late 1600sand early 1700s” (Smithsonian Archives).
Nevertheless, the hype continues. The NewYork Times, 19th February, 2001 edition hadan article stating:
“The icecap atop Mount Kilimanjaro,which for thousands of years floatedlike a cool beacon over the shimmeringplain of Tanzania is retreating at such apace that it will disappear in less thanfifteen years, according to new studies.”
This is a classic overstatement from thepress. What the study actually showed wasthat between 1912 and 1953, when surveyswere completed, the snow cap lost 45% ofits areal extent. This snow loss occurredduring a period of warming before theindustrial output of CO2 could have had anysignificant role (Thompson et al., 2002). Atthis rate of loss (10% per decade) it wouldbe fair to say that by the year 2000 the snowcap would be gone. However, the snows ofKilimanjaro remain and the rate of loss hasdeclined considerably. Satellite data, since1979, indicate that the mountain temperatureas recorded by accurate satellite data hasdeclined by 0.22°C. Nevertheless, the glacierscontinue to retreat. In order to maintain aglacier’s areal extent, there has to be abalance between winter precipitation suchthat added snow cover will equal summermelt. The decline in Kilimanjaro’s ice cap isthe result of a s igni f icant decl ine inprecipitation in the last Century, not globalwarming.
The Great Arctic Meltdown, as reported inthe National Geographic Magazine quotedabove and also in the New York Times states,“Arctic Ice is Melting at Record Levels,Scientists Say”. Of course all of this isattributed to AGW. There is abundant datato demonstrate that the reported conditionsare not without precedent. Arctictemperatures were significantly warmer inthe 1930s and 1940s as shown by Polykov etal. 2003 (Figure 6.1, page 30). Although ArcticIce cover has been decreasing in recentdecades, especially in the summer of 2006,there has been a signi f icant reboundsubsequently. It is difficult to explain thisbehaviour on the basis of Arctic airtemperature, which has shown no significantvariation in summer temperatures since1958 (Polykov et al., 2003). A mild trend ofwarming has been identified in the winterbut this has no effect since it is much too

30
cold at that time for ice to melt. To achievethis rapid melt of Arctic pack ice requireschanges in oceanic circulation.
Polykov and Johnson (2000) identify severaloscillatory modes in Arctic Climate. Thedecadal Arctic Oscillation and an associatedLow Frequency Oscillation with a time scalein the range of 60-80 years are both stronglylinked to the North Atlantic Oscillation.These cl imate osci l lat ions result influctuations in the thermohaline circulation
Figure 6.1. The bold line is the six-year running mean of Arctic temperature (after Polykov et al. 2003). Thedashed line is the annual temperature. Two distinct warming periods are clearly evident from approximately1915 to 1945 and from 1970 to 2000. Compared to the global and hemispheric temperatures, the Arctictemperature increase was stronger in the late 1930s and early 1940s than in recent decades. The warmingof the 1930s occurred at a time before greenhouse gases could have caused significant warming.
Figure 6.2. A graphical presentation of the areal extent of sea ice in the Arctic Ocean. The maximum thiscentury occurred in 2003 and the minimum in 2007. The sea ice area has been increasing since 2006, and2009 appears on trend likely to exceed all years since 2004. As of April 2009, the sea ice extent matched thelevels of 2002 and 2003 (data summarized from NASA Earth Observatory).
between the Arctic basin and the NorthAtlantic with a strong impact on Arctic icepack variability. In the winter of 2008-2009,the Arctic Ice pack returned to the samelevels observed in 2001.
The threat of losing the Polar Ice Pack wasraised in the Gore Film and was also made inthe Third Assessment Report of IPCC, whereit was claimed that there had been a 40%decline in the thickness of polar pack ice.This conclusion was based on a profile of 29
measurements taken by US NuclearSubmarines (Rothrock et al., 1999). As itturned out, the profile, through the centralArctic, was conducted at a time whenprevailing winds and ocean currents hadmoved the ice out of the profile areas suchthat the extrapolation of the limited data tothe entire Arctic grossly exaggerated the iceloss. Subsequent research by Holloway andSu in The Journal of Climate (2002),demonstrated that because of the biasedsampling the ice loss was not 40%, astrumpeted by the media, but only 15%. Thisremarkable recovery of the Arctic Ice massreceived no media coverage whatsoever.Meantime, the Gore documentary continuesto be shown – claiming a 40% ice loss. It isnot stated, but implied, that this wouldelevate sea level. The fact is that even if theArctic Ice disappeared entirely it would notaffect sea level.
In order to change sea level, to any significantdegree, it is necessary to actually melt theland-fast ice caps of Greenland andAntarctica. For both of these land masses,the temperature records show that they arenot warming. A very thorough study byHanna and Cappelin (2003) shows that thesurface records in southern Greenland,potentially the most sensitive area of the IceCap, have been cooling since 1958, and thesea surface temperature demonstrates asimilar trend. In fact, the southern coastalstations of Greenland show a drop of 1.27°C.Nevertheless, in the June 2007 NationalGeographic article, it is claimed that icesheets covering Greenland are shrinkingunexpectedly fast and the outlet glaciers thatcarry ice to the sea are accelerating.Shrinking and accelerating are contradictoryterms so far as glaciers are concerned. Theoutflow from a glacier is not dependant onair temperature but on the accumulation ofsnow pack at the highest elevation of theglacier. Krabill, in 1980, indicated a thickeningof up to seven feet on the Greenland ice capand, again in 2000, with a number ofcoauthors, reported that the main mass ofthe glacier above 6,500 feet is rising at about0.2 inches per year. Part of this may beattributable to isostatic rebound, due to theunloading of the continental ice sheet, ofwhich Greenland was a part. But theconclusions of Krabill and his colleagues wasthat the whole region has been in balance.
Glaciers flow under their gravitational loadso that the flow rate is a function of theaccumulation of the snow pack. I fprecipitat ion is high the glacier wil laccelerate but if it decreases then the glacierf low wil l s low. At its termination themovement of the glacier is a function of theambient air temperature. I f summertemperatures are high, and glacial advance is

31
slow, then the glacier will retreat. If theglacier advances, it implies that the load ofthe snow pack at high elevations is greaterthan the rate of melting. Therefore, theGreenland Ice Sheet would appear to be in ahealthy balance. Also, warming can have acontrary effect on an ice cap, since it mayactually increase the amount of precipitationas warmer air encounters subzerotemperatures of the ice cap at highelevations.
The suggestion in the National Geographicarticle is that, during summer melt, the highlevels of surface water – temporary pondsand surface lakes – will fracture the ice anddrain down through to the glacier base andlubricate its flow. The authors of this idea donot seem very familiar with the erosivepower and characteristics of an active glacier.The base of a glacier is charged with rocksand debris stripped from its base and frozeninto the ice mass so that it resembles a giantrasp constantly tearing, grinding, and erodingits base and the sides of the valley. Meltwatersimply can not reach the frozen base of theglacier before becoming so charged withdebris and rock flour that it flows within theice-forming internal stream deposits abovethe rock floor.
As glaciers retreat they leave extensivedeposits of fluvio-glacial material, eskers(stream deposits), kames (internal deltas),and terminal and lateral moraines. The U-shaped valleys and the mass of these depositsis a testament to the erosive power of theglacier. The downward motion of the glacieris the result of the relentless power ofgravity which comes from the elevation ofthe snowfield accumulation area over theexit point, which, in this case, is sea level.Moreover, the base of the glacier is a zoneof permafrost extending into the underlyingsoil and rock. There is no potential slip orglide plane that can lubricate the glacier’smovement. The actual glacier flow velocity isstill controlled by the vertical mass of iceabove the glacier’s baseline. If the velocity offlow of the terminal portion of the glaciersomehow exceeds the normal gravitationalflow rate, it should result in a large crevasseor series of major crevasses at the transitionfrom the natural upper glacier flow, to theso-called accelerated water-lubricated zone.This has never been reported.
The entire thrust of the claims of GreenlandIce Cap accelerated melting are advanced inorder to support extremely exaggeratedclaims of sea level rise – 20 feet (6.1 meters)in the National Geographic article above.Greenpeace has trumpeted levels of 5-7meters (16-23 feet), potentially correct ifthe entire ice sheet were to disappear, buteven the IPCC do not subscribe to this level
of loss. The Third Assessment Reportattributes only -0.02 to 0.09 meters (-0.78to 3.5 inches) in the next 100 years,Therefore, IPPC recognized the possibilitythat melting of the Greenland Ice Cap mayactual ly reduce sea level . As Krabi l l ’sresearch indicates, the ice loss on Greenlandis a mere 0.13mm/year or only 1.3centimeters (0.5 inches) after 100 years. Thisis a very far cry from the Greenpeace andNational Geographic exaggerated claims of20ft (6.1m), which would require 4 millenniato achieve at present melt rates.
In Antarctica, a very similar picture exists –temperatures have been declining since the1960s as reported by Doran (2002), Jones(1995), and Sansom (1989). Since 1979 themicrowave sounder units on NASA satellitesrecord decl ining temperatures.Nevertheless, Gore and others have mademuch exaggerated claims regarding glacialcalving in blocks the size of Rhode Islandfrom the west Antarctic Peninsula. Thepeninsula is like a thumb trending northwesttowards Argentina. Because of past sea levelrise, the ice is anchored only on a smallnumber of islands. It is underlain by oceanand so is less stable than the main mass ofAntarctica. The west peninsula does not showthe same range of cooling as east Antarcticabut, as we have discussed, air temperaturein itself, does not determine glacial behaviour.It is a simple matter to review the ice arealextent maps showing the ice is expandingand thickening (Figure 6.3, page 32).Currently, the ice mass is at record levels(see http://arctic.atmos. uiuc.edu/cryosphere/). What is the evidence for the NationalGeographic statement: “If vulnerable partsof the ice that blankets Greenland andAntarctica succumb, rising sea levels couldflood hundreds of thousands of square miles– much of Florida, Bangladesh, theNetherlands – and displace tens of millionsof people”. What credibility can be given tothis extraordinary claim? The critical wordis “if ” but what is the real probability? TheGreenland Ice Cap has survived the previouswarming cycles and is still well beyond itsposit ion at the t ime of the Danishsettlements in the Medieval Warm Period(Tkachuck, 1983, p. 2). The evidence showsthat Antarctica is cooling but it seems thatthe less evidence there is, the more shrilland exaggerated are the claims. A case inpoint is the fact that Michael Mann (the authorof the now-discredited temperature hockeystick) and colleagues are now attempting toshow, by statist ical manipulation, thatAntarctica is actually warming, a premise ofwhich even other global-warming activistsare skeptical.
Sea level rise is always a good subject to getpeople’s attention, especial ly with the
number of heavily populated coastal cities.Aside from the hysteria of improbablesevenmeter increases, what is really known?In 1990, the IPCC predicted that man-madewarming would result in an increase of 30 to100 cm, (12 to 39 inches) but by 2001 thisestimate was lowered to 9-88 cm, (3.5 to34.6 inches) and by 2007 in the IPCC fourthassessment, given the oceans’ lack ofresponse, was reduced to 18 and 59 cm, (7to 23.2 inches), an approximately 50%reduction in the estimate from 1990.However, these estimates are not actuallybased on real observations, but on unverifiedmodel results – in other words, guesswork!
What do scientists report who actuallyspecialize in sea level? According to thesespecialists there is no way to predict,scientifically, any sea level rise in the 21stCentury. The International Union forQuaternary Research (INQUA) is a 75-year-old scientific organization dedicated toresearching global environments and climaticchanges over the last two million years.INQUA has harshly criticized the IPCC forits handling of sea level forecasts: ignoringthe scientists who produce most of the dataand observations related to sea level andrelying instead on unproven model results.Nils Axel Morner, who until recently wasthe president of INQUA’s Sea LevelCommission, states that sea level shows notrend at all over the past three hundred years,and satellite telemetry shows virtually nochange in the last decade. Therefore, the IPCCmodels are total ly without scienti f icobjectivity or relevance . According toMorner, there is no fear of any massive futureflooding as claimed in most global warmingscenarios.
A constant drumbeat of alarmism ismaintained in the media, and once again, asan example we can turn to the NationalGeographic Magazine in the November, 2007issue (The Acid Threat, p. 113). Havingattempted to convince us that we will drownin a new Noah’s flood, this article suggestthat by the end of the next century the oceanswill be so acidic they will be devoid of life.The IPCC argue that only a trivial amount ofCO2 can be dissolved in the oceans, but, onthe other hand, maintain this is enough tocause a catastrophe by dissolving all thecalcium carbonate in the sea! The IPCChypothesis requires very long residencetimes for CO2 in the atmosphere of 50-200years, although there are numerouspublications of isotopic analyses that indicatean average residence time of only 5-6 years(Segalstad, 2009).
The National Geographic article is based onpseudo-science lacking any propercomprehension of physicochemical or

32
biochemical nature of the oceans. In a verycrude experiment, ocean water was acidifiedby adding carbon dioxide unti l t iny,calcareous shells of dead copepods becamecorroded. This was then presented asevidence that the oceans would be totallyacidified if no steps were taken to curb theemission of CO2. The fact that this was totallywithout relevance to the real world’s oceans,even as illustrated in this particular issue ofNational Geographic, was ignored. Warmingoceans give up CO2 as it becomes lesssoluble, not the opposite as implied by the“Acid Threat” article. Even when the errorswithin the article were identified in detail,there was no response from NationalGeographic, nor any correctiveacknowledgement. This is a classic form ofcensorship exerted by media generally, inwhich only alarmist material is presentedand those of us who retain our criticalfaculties are ignored.
On page 109 of the November 2007 articleis an absolutely superb photograph of a livingpteropod. This very tiny planktonic organismappears with its calcareous shell completelysurrounded by ectoplasm, the living tissueof the organism. It is within the ectoplasmthat the pteropod secretes its supportiveshell, not in contact with the sea water. In
the biochemistry of these organisms, thef ixing of carbonate ions comes fromabsorption of carbonic acid. The article alsoillustrates the incredible biological richnessof a drop of sea water, representing only atiny fraction of the zooplankton andphytoplankton in ocean waters. Thei l lustrations demonstrate the greatabundance of cyanobacteria that, at the baseof the food chain, fix carbon dioxide byphotosynthesis, converting it to oxygen andsugars required to construct and nourish theorganism. Even more astonishing, in the lightof the “Acid Threat Article,” are satelliteimages of extensive coccolithophore bloomsoff the coast of Ireland (Figure 6.4). Herewe have another example of the tremendouscapacity of the live ocean to fix carbondioxide and deliver the calcium carbonate toocean sediments. Coccolithophore bloomsare not rare. They are widespread in theworld’s oceans and now, because of satelliteimagery, we have evidence of their extentand capacity to fix CO2. Blooms in the NorthAtlantic are recorded covering areas of200,000 square miles, and this is only one ofa rich variety of planktonic microorganismswhich have the capacity for photosynthesisand incorporation of carbon dioxide, oftenin the form of carbonic acid, to constructtheir internal carbonate structure. A visual
assessment of world photosynthesis byphytoplankton is illustrated in Figure 6.5showing chlorophyll concentration in theworld’s oceans.
The approach of the IPCC is to consider theoceans as if they were dealing with a beakerof lifeless brine lacking any biological orsedimentological content. The live oceanshave an almost infinite buffering capacity as aresult of biological and sedimentologicalprocesses. We can show that all of the calciumcarbonate, as calcite or aragonite, depositedin the oceans is mediated by organic activitywith an immense capacity to bufferatmospheric CO2. There are other extensiveoceanic buffers result ing fromsedimentological diagenesis which will resultin the stabilization of oceanic pH. Forexample, anorthite felspar is typical lyreduced to kaolinite, releasing aqueouscalcium ions available for absorption withCO2 into exoskeletons of mollusks andcrustaceans of the ocean shorefaces. In clayrich waters, CO2 is absorbed releasing silicawhich may result in chert diagenesis but alsoprovides si l ica for the endoskeletalstructure of diatoms and silicoflagellates. Theformer are very abundant planktonicorganisms forming extensive deposits insome deep marine environments. They
Figure 6.3. Figures documenting increasing sea ice around Antarctica after Parkinson (2002). The left-hand figure illustrates the length of the sea ice season for a periodof 21years (1979-1999). Purple areas indicate annual cover, while light blue are limits of winter ice. The right-hand panel indicates trends where ice days are increasing(blues) and locations where they are decreasing. Parkinson points out that this is inconsistent with global warming theory.

33
current atmospheric levels have beenreported (1,885 parts per million – Pagani,2005) without injury to ocean life. Accordingto the ocean acidification theory, life couldnever have evolved on earth! That this isnonsense is obvious, but the constantunquali f ied repetit ion in the media ofunsubstantiated claims of disaster raisesunwarranted concern among the generalpublic. This is particularly so when it occursin respected mainstream media outlets.
REFERENCESREFERENCESREFERENCESREFERENCESREFERENCESAppenzeller, Tim. 2007. The Big Thaw, Ice on theRun, Seas on the Rise. National Geographic , June2007.
Doran, P. T., et al. 2002. Antarctic climate coolingand terrestrial ecosystem response. Nature,advance online publication.
Gore, Al. 2006. An Inconvenient Truth. Movie.
Hanna, E. and Cappelin, J. 2003. Recent coolingin coastal Southern Greenland and relation withthe Nor th Atlantic oscil lation. GeophysicalResearch Letters, v. 30, 32-1 to 32-3.
Holland, Jennifer S. 2007. The Acid Threat. NationalGeographic Magazine, November, 2007,Photography by David Liitschwager.
Holloway, G. and Sou, T. 2002. Has Arctic sea icerapidly thinned? Journal of Climate, v. 15, p. 1691-1701.
Intergovernmental Panel on Climate Change.1990. Climate Change 1990: The IPCC ScientificAssessment. Cambridge Univers ity Press,Cambridge.
Intergovernmental Panel on Climate Change.2001. Climate Change 2001: The Physical ScienceBasis. Cambridge University Press, Cambridge.
Intergovernmental Panel on Climate Change.2007. Climate Change: The Physical Science Basis.Summary for Policymakers, Fourth AssessmentReport. Geneva, Switzerland.
Jones, P. D. 1995. Recent variations in meantemperature and the diurnal temperature rangein the Antarctic . Geophysical Research Letters, v.20 p. 1345-48.
Krabill, W., et al. 1994. Greenland Ice SheetThickness Changes Measured by Laser Altimetry.Geophysical Research Letters, v. 22, p. 2341-2344.
Krabill, W., et al. 2000. Greenland Ice Sheet: Highelevation balance and peripheral thinning.Science v. 289, p. 428-430.
Moncton, C. W. 2007. 35 Inconvenient Truths, TheErrors in Al Gore’s Movie. Science and Public PolicyInstitute. www.scienceandpublicpolicy.org.
Figure 6.4. A major phytoplankton bloom off the west coast of Ireland covering thousands of squarekilometers. It is probable that this bloom is caused by the coccolithophore, Emiliani huxleyi, one of the mostprolific forms in the modern oceans. Conservative estimates suggest that coccoliths are one of the largestcalcite producers in modern oceans. Very conservative estimates suggest that they contribute calciumcarbonate in excess of 1.5 million tons per annum. In light of the chlorophyll distribution in the world’s oceans(Figure 6.5) the estimate seems very low. However, it provides another indication of the capacity of the world’soceans to buffer CO2.
Figure 6.5. Contrary to the “Acid Threat” promoted in National Geographic, here is an actual observedmeasurement of the life in our oceans. This is an image from a satellite sensor indicating the distribution ofchlorophyll in the world’s oceans. This is a measure of the distribution of phytoplankton, which use chlorophyllin the same manner as terrestrial land plants. At least half the Earth’s source of oxygen is generated byphytoplankton in the oceans, and not, as one might expect, the equatorial rain forests. Chlorophyll is shownin milligrams / cubic meter with the greatest concentrations in yellow while the deep blue indicates wherenutrients are too scarce to promote phytoplankton growth, in contrast to the cold CO2-rich polar oceans.
absorb CO2 during photosynthesis andcontribute to the very large buffering capacityof the oceans. Since the oceans have thecapacity to absorb approximately 50 timesthe amount of CO2 contained in theatmosphere, not including the immensecontribution of the l iv ing biological
communities, it is apparent that the oceansby controlling the amount of atmosphericCO2 play a vital part in maintaining stableconditions suitable for organic life on earth.It is well known that atmospheric CO2 hasbeen at much higher levels in the past. Duringthe Palaeogene, values up to five times

34
Morner, Nils Axel. 2004. Estimating Future SeaLevel Changes from Past Records. Global andPlanetary Change, v. 40, issues 1-2, January, p.49-54 New York Times, December 8, 2002
Polykov, I. V., et al. 2003. Trends and variations inArctic climate systems. EOS. Transactions ofAmerican Geophysical Union, v. 83 p. 547-48.
Polykov, I. V. and Johnson, M. A. 2000. Arctic decadaland interdecadal var iabi l i ty . GeophysicalResearch Letters, v. 27, p. 4097-4100.
Rothrock, D. A., Yu, Y., and Maykut, G. A. 1999.Thinning of the Arctic sea ice cover. GeophysicalResearch Letters, v. 26, p. 3469-72.
Segalstad, Tom. 2009. Carbon Isotope MassBalance vs . Oceanic CO2. Internat ionalConference on Climate Change, New York.www.hear t land.org/event s /NewYork09/proceedings.html.
Sansom, J. 1989. Antarctic surface temperaturetime series. Journal of Climate, v. 2, p. 1164- 72.
Thompson, L. G. 2002. Kilimanjaro ice core records:evidence of Holocene climate change in tropicalAfrica. Science 298, p. 589-93.
Tkachuk, R. D. 1983. The Little Ice Age. GeoscienceResearch Institute, v. 10, issue 2, p. 56-65 orwww.grisda.org/origins/10051.html.

35
CLCLCLCLCLIMAIMAIMAIMAIMATE CHANGTE CHANGTE CHANGTE CHANGTE CHANGE VE VE VE VE VII:II:II:II:II:The Spin Cycle by Dr. A. Neil Hutton
It was not possible to correct the totality ofmisinformation on Climate Change in onearticle so – in reality – this is a continuationof “Fearmongering” in which I endeavor tocover the most outstanding issues. The SpinCycle I refer to is not related to laundry butto the wildly exaggerated claims that globalwarming is responsible for an increase incyclonic storms – that is to say, hurricanes,tornadoes, typhoons, and other tropicalcyclones as well as other extreme weatherevents.
Here are the facts: in none of the IPCCassessments was it ever claimed that globalwarming would result in the developmentof more violent cyclonic storms. On thecontrary, the reports indicated that no globalwarming signal could be detected in thehurricane record. Dr. Christopher Landsea,a contributing author for IPCC, and an experton cyclonic activity has stated clearly that, “Ifglobal warming is influencing hurricaneactivity, than we should be seeing a globalchange in the number and strength of thestorms. Yet, there is no evidence of a globalincrease in the strength and frequency ofhurricanes, typhoons, and tropical cyclonesover the past several years.” In Figure 7.1,the measured wind strength for hurricanesis shown from 1940-2000; in the AtlanticBasin, the trend is clearly downward.
Nevertheless, leading members in IPCC,principally Kevin Trenberth, (head of theClimate Analysis section at the NationalClimate Research Center and lead author ofthe 2007 IPCC report) could not resist theopportunity to use the 2004 hurricaneseason to engender the dangers of globalwarming, whether there was any evidenceor not. In a press conference, which Landseahad attempted to prevent, Trenbeth arguedthat, “Human activities are changing thecomposition of the atmosphere and globalwarming is happening as a result. Globalwarming is manifested in many ways, someunexpected… (especially for Dr Landsea).The environment in which hurricanes formis changing. The result was a hurricane offthe coast of Brazil ; the first and onlyhurricane in that region (a highly improbableassumption which could be readily refutedby examination of Portuguese navigators’logs in the region). Several factors go intoforming hurricanes and where they track. Butthe evidence, (none was ever cited becausethere are no studies supporting this
Figure 7.1. Mean Annual Wind Speed in Atlantic Hurricanes. Contrary to thealarmist claims, the maximum wind velocity for hurricanes between 1940-1993has decreased by five km/hour (approximately 12%). The dotted line shows thebest fit linear trend (Source: C.W. Landsea, et al. 1996).
Figure 7.2. The diagram presents the annual number of hurricanes making landfall in the United States from1900-2008. It is clear that hurricane activity was much higher prior to the 1950s than it has been subse-quently. This is a pattern that also appears in measures of storminess, hail, and thunderstorms and is exactlythe opposite of what has been claimed by the global warming activists. Furthermore, it is apparent that stormsare largely a function of the periodicity of major oceanic oscillations, not changes in atmospheric temperature.
statement) stronglysuggests moreintense storms andrisk of greaterflooding events, sothat the NorthAtlantic hurricaneseason of 2004 maybe a harbinger of thefuture .” (E-mail :Landsea to Trenberth,from Solomon, 2008,p. 38)
The press went wildwith this story and itechoed round theworld. Trenbeth waslooking good afterKatrina in 2005 but insubsequent seasonshurricane frequency and violence havecontinued to decline (Figure 7.2). Landseawas sufficiently incensed that he wrote toIPCC officials asking, “Where is the science,the refereed publications that substantiatethese pronouncements? What studies arebeing al luded to that have shown aconnection between observed warmingtrends on the Earth and long term trends intropical cyclone activity?” The IPCC officialsignored Landsea’s questions and even
defended Trenbeth. As a result, Landsearesigned as a contributing author to the IPCC2007 Fourth Assessment. Here is a primeexample of the political nature of IPCC andtheir lack of scientific integrity. (http://chge.med.harvard. edu/media/releases/hurricanepress.html)
Hurricane Katrina was too good anopportunity to miss, and so, Kerry Emmanuelof MIT argued that global warming is
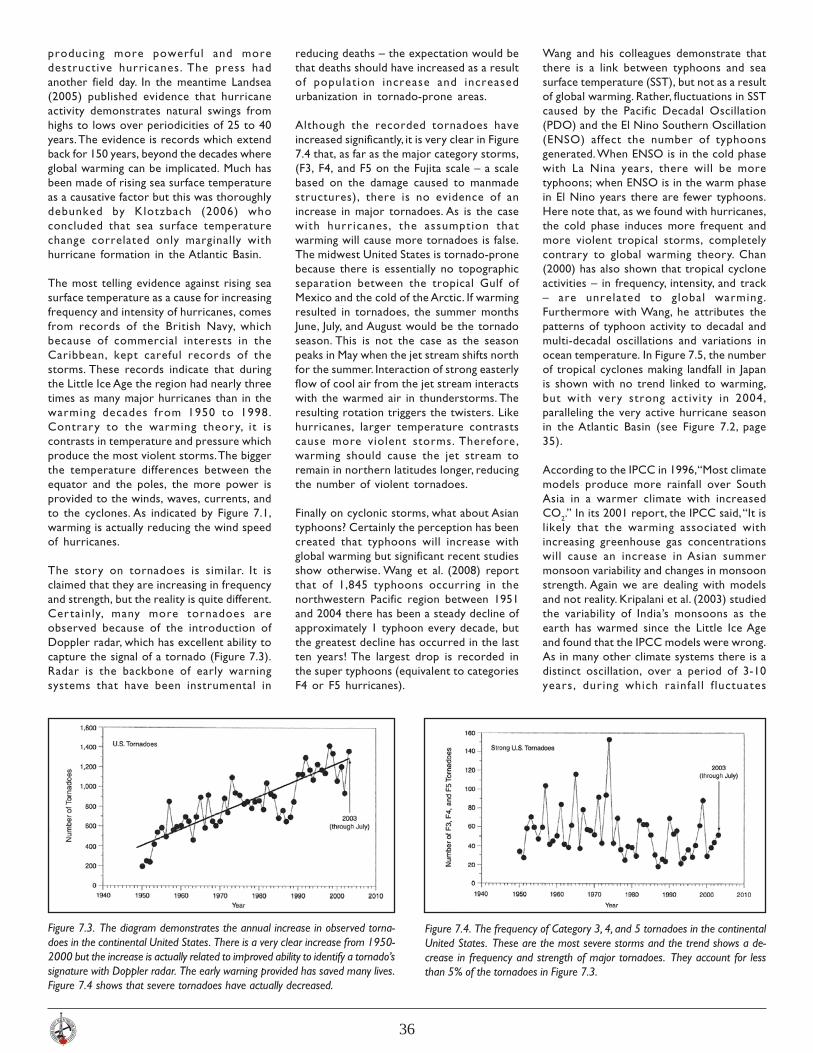
36
producing more powerful and moredestructive hurricanes. The press hadanother field day. In the meantime Landsea(2005) published evidence that hurricaneactivity demonstrates natural swings fromhighs to lows over periodicities of 25 to 40years. The evidence is records which extendback for 150 years, beyond the decades whereglobal warming can be implicated. Much hasbeen made of rising sea surface temperatureas a causative factor but this was thoroughlydebunked by Klotzbach (2006) whoconcluded that sea surface temperaturechange correlated only marginally withhurricane formation in the Atlantic Basin.
The most telling evidence against rising seasurface temperature as a cause for increasingfrequency and intensity of hurricanes, comesfrom records of the British Navy, whichbecause of commercial interests in theCaribbean, kept careful records of thestorms. These records indicate that duringthe Little Ice Age the region had nearly threetimes as many major hurricanes than in thewarming decades from 1950 to 1998.Contrary to the warming theory, it iscontrasts in temperature and pressure whichproduce the most violent storms. The biggerthe temperature differences between theequator and the poles, the more power isprovided to the winds, waves, currents, andto the cyclones. As indicated by Figure 7.1,warming is actually reducing the wind speedof hurricanes.
The story on tornadoes is similar. It isclaimed that they are increasing in frequencyand strength, but the reality is quite different.Cer tainly, many more tornadoes areobserved because of the introduction ofDoppler radar, which has excellent ability tocapture the signal of a tornado (Figure 7.3).Radar is the backbone of early warningsystems that have been instrumental in
Figure 7.3. The diagram demonstrates the annual increase in observed torna-does in the continental United States. There is a very clear increase from 1950-2000 but the increase is actually related to improved ability to identify a tornado’ssignature with Doppler radar. The early warning provided has saved many lives.Figure 7.4 shows that severe tornadoes have actually decreased.
Figure 7.4. The frequency of Category 3, 4, and 5 tornadoes in the continentalUnited States. These are the most severe storms and the trend shows a de-crease in frequency and strength of major tornadoes. They account for lessthan 5% of the tornadoes in Figure 7.3.
reducing deaths – the expectation would bethat deaths should have increased as a resultof population increase and increasedurbanization in tornado-prone areas.
Although the recorded tornadoes haveincreased significantly, it is very clear in Figure7.4 that, as far as the major category storms,(F3, F4, and F5 on the Fujita scale – a scalebased on the damage caused to manmadestructures), there is no evidence of anincrease in major tornadoes. As is the casewith hurricanes, the assumption thatwarming will cause more tornadoes is false.The midwest United States is tornado-pronebecause there is essentially no topographicseparation between the tropical Gulf ofMexico and the cold of the Arctic. If warmingresulted in tornadoes, the summer monthsJune, July, and August would be the tornadoseason. This is not the case as the seasonpeaks in May when the jet stream shifts northfor the summer. Interaction of strong easterlyflow of cool air from the jet stream interactswith the warmed air in thunderstorms. Theresulting rotation triggers the twisters. Likehurricanes, larger temperature contrastscause more violent storms. Therefore,warming should cause the jet stream toremain in northern latitudes longer, reducingthe number of violent tornadoes.
Finally on cyclonic storms, what about Asiantyphoons? Certainly the perception has beencreated that typhoons will increase withglobal warming but significant recent studiesshow otherwise. Wang et al. (2008) reportthat of 1,845 typhoons occurring in thenorthwestern Pacific region between 1951and 2004 there has been a steady decline ofapproximately 1 typhoon every decade, butthe greatest decline has occurred in the lastten years! The largest drop is recorded inthe super typhoons (equivalent to categoriesF4 or F5 hurricanes).
Wang and his colleagues demonstrate thatthere is a link between typhoons and seasurface temperature (SST), but not as a resultof global warming. Rather, fluctuations in SSTcaused by the Pacific Decadal Oscillation(PDO) and the El Nino Southern Oscillation(ENSO) affect the number of typhoonsgenerated. When ENSO is in the cold phasewith La Nina years, there will be moretyphoons; when ENSO is in the warm phasein El Nino years there are fewer typhoons.Here note that, as we found with hurricanes,the cold phase induces more frequent andmore violent tropical storms, completelycontrary to global warming theory. Chan(2000) has also shown that tropical cycloneactivities – in frequency, intensity, and track– are unrelated to global warming.Furthermore with Wang, he attributes thepatterns of typhoon activity to decadal andmulti-decadal oscillations and variations inocean temperature. In Figure 7.5, the numberof tropical cyclones making landfall in Japanis shown with no trend linked to warming,but with very strong activity in 2004,paralleling the very active hurricane seasonin the Atlantic Basin (see Figure 7.2, page35).
According to the IPCC in 1996, “Most climatemodels produce more rainfall over SouthAsia in a warmer climate with increasedCO2.” In its 2001 report, the IPCC said, “It islikely that the warming associated withincreasing greenhouse gas concentrationswill cause an increase in Asian summermonsoon variability and changes in monsoonstrength. Again we are dealing with modelsand not reality. Kripalani et al. (2003) studiedthe variability of India’s monsoons as theearth has warmed since the Little Ice Ageand found that the IPCC models were wrong.As in many other climate systems there is adistinct oscillation, over a period of 3-10years, during which rainfal l f luctuates

37
0
2
4
6
8
10
12
1960 1965 1970 1975 1980 1985 1990 1995 2000
Year
Number
between higher than average and lower thanaverage conditions. There is no evidence thatthis is related to rising temperatures.Moreover during the 1990s – which IPCCclaim to be the warmest decade of themillennium – Indian monsoon variabilitydeclined sharply. Wang et al. in their 2008study indicated that the frequency oftyphoons is closely linked to the summermonsoons in East Asia, and not related toglobal warming.
Notwithstanding the well documentederrors in the Gore documentary, AnInconvenient Truth, it continues to be airedby CBC. Not only that, it is introduced by ascientifically unwarranted introduction onthe website as follows:
“Humanity is sitting on a ticking timebomb. If the vast majority of the world’sscientists are right, we have just tenyears to avert a major catastrophe thatcould send the entire planet into atailspin of epic destruction involvingextreme weather, floods, droughts,epidemic and killer heat waves beyondanything we have ever experienced.”
This statement is nothing more than climateevangelism threatening climate Armageddoncompletely unsupported by any scientificstudy. It is doubtful if any scientist, even thosewho support human-caused climate change,would agree with this apocalypticalstatement. As we will see, there is in fact nopublished evidence to support such claims.For a start, although there has been littlechange in the increase in CO2 entering theatmosphere, there has been no warmingduring the 21st century. What does the peer-reviewed literature really say? The journal,
“Natural Hazards”published a specialissue on extremeweather events andglobal warming.None of thepubl ished articlesindicated increasedstorminess due toincreases intemperature or CO2.
Balling and Cerveny(2003), writing in theNatural Hazardsspecial issue,observed that thepublic is three timesmore likely to see anarticle on severeweather today thanonly thirty years ago:this despite the lackof any increase in
storminess. One might argue that the mediais a greater problem than global warming. Asdiscussed above there has been no increasein hurricanes, tornadoes, typhoons, ortropical cyclones, but what aboutthunderstorms or other severe weather?Changnon and Changnon (2001), by checking“thunder days” from 300 US weatherstations, demonstrated that from 1896 to1955 thunder days increased but have showna moderate decrease since that date. Insimilar fashion these authors found anincrease in hailstorms from 1916 until 1955after which there was a general decline inhail activity. Similarly in Canada, Khandekar,(2002) reports that there has been noincrease in extreme weather events (heatwaves, f loods, winter bl izzards,thunderstorms, hai l , or tornadoes)anywhere in Canada. Extreme weatherevents have been on the decline for the last40 years. Khandekar noted that the hottestsummers wereactually during thedust bowl years ofthe 1920s and 1930s,not in the 1990s. Inother words,contrary to the hype,warming has actuallyproduced fewerextreme weatherevents.
Many claims aremade that floods anddroughts wil l bemore extreme,s o m e t i m e ssimultaneously! Thisno doubt derivesfrom the rather
extraordinary statement of IPCC, Summaryfor Policymakers, Climate Change, 1995,“Warmer temperature will lead to prospectsfor more severe droughts and/ or floods insome places and less severe droughts and/or floods in other places.” In effect, anyanomalous occurrence in moisture, positiveor negative, can be attributed to globalwarming. Warming in theory should increaserainfall since it will increase the water vapourtaken up by the atmosphere . This issupported by the fact that rainfall hasincreased gradually since the 1980s (Figure7.6), but not to the extent to produce anyhazards. On the contrary, it has clearly beena benefit in improved hydrological conditionson agricultural lands. There have beensignif icant droughts in Africa and thesouthwestern United States but here theevidence suggests that the control ofprecipitation is more directly attributableto the major oceanic cycles such as the PacificDecadal Oscillation (PDO), and El NinoSouthern Oscillation (ENSO). Fouchereau(2003) has shown that African droughts aremore sensitive to the ENSO cycles ratherthan temperature variation. In the years from1979 to 1988, the four driest years coincidedwith peaks of the ENSO cycle.
Similarly when we consider available datafor the Prairie regions of North America,droughts of varying intensity and durationhave occurred for many centuries long beforeinstrument records were available. Tree ringdata suggest that some of the worst droughtsoccurred during the thirteenth and sixteenthcenturies. Droughts have occurredthroughout the 20th Century with some ofthe severest droughts occurring during the1920s and 1930s, the so-called dustbowlyears. Recent droughts of the 1980s and1990s are comparable to those of the dustbowl years. According to Khandekarlargescale atmospheric circulation patternsover the central equatorial Pacific as well as
Figure 7.5. The annual frequency of tropical cyclones making landfall in Japan.There is no clear trend associated with warming. In fact, the most activetyphoon seasons are associated with the La Nina cold phase of the ENSO cycle.Note the very active cycle in 2004, which corresponds with a similar period inthe Atlantic basin as shown in Figure 7.2 (from Chan, 2000).
Figure 7.6. Average US average rainfall per decade. There has been a gradualincrease of about 10% in precipitation in the 20th century but there is no clearcorrelation between temperature and precipitation. The increase in precipita-tion in latter decades results from an increase in light rains not storm events.

38
over the central and eastern north Pacific,appear to be the main drought-driving forces.The cold La Nina phase of the ENSO cycleover the equatorial Pacific, and its continuedpresence, appears to be the most importantprecursor for drought occurrence. The warmEl Nino phase of the ENSO cycle is usuallyassociated with surplus precipitation duringthe grain-growing season. Khandekarconcludes that there does not appear to beany linkage between recent droughts andwarming of the Earth’s atmosphere.
With droughts come fire and, of course, theusual media claims of a fiery apocalypsedriven by global warming (Herbert, 2002New York Times). By now it should be nosurprise that the statistics show otherwise,at least for the United States. Figure 7.7,shows that the average acreage burned inthe United States has decreased andessentially remained stable for the last fortyyears. No doubt more sophisticated fire
suppression techniques have played a role.On the other hand, it is argued that, firesuppression has been counterproductive,resulting in denser undergrowth and deadfallproviding fuel for uncontrollable wild fires.In fact the climateinfluencing droughts andrainfall are more intimately associated withmajor oceanic cycles such as PDO, ENSO,and the cyclonic oscillations in the AtlanticBasin. The role of warming in itself can notbe detected in regional climate variations.
We find no basis for the claims of an increasein extreme weather events, but what ofclaims, such as those of CBC and others, thatwarming will result in species extinction,epidemics, and killer heat waves. Suffice tosay that the basis for these claims is alsobased on poor research, lack of historicalperspective, and poor analysis and statisticaltreatment of results. It would be beyond thescope of this article to provide a ful ltreatment of the issues but excel lentcoverage is provided in the following texts:
Figure 7.7. The average acreage burned annually in the United States bydecade. Contrary to the press, there has been a distinct decline with stabilitythrough the last four decades.
Meltdown, The Predictable Distortionof GLOBAL WARMING by Scientists,Politicians, and the Media. Patrick J.Michaels, 2004, Cato Institute,Washington, DC, p. 73-109, and 179-194.
Unstoppable Global Warming, S. FredSinger and Denis Avery, 2007, revised2008, Rowman and Littlefield Publishers,Chapter 9, p. 163-185 and Chapter 12, p.213-219.
Both of these books are highly recommendedfor anyone who wishes to filter the hypeout of Global Warming, especially that bythe Media.
There is no doubt that the IPCC have veryskillfully manipulated the platform providedby their UN mandate, with the very ableassistance of the media. As each major IPCCConference rolls around the press releases
become moreextreme: TheAssociated Press,March 12, 2009,“Hundreds ofScientists warnedtoday that globalwarming isaccelerating beyondthe worstpredictions andthreatening tot r i g g e r“ i r r e v e r s i b l e ”climate shifts on theplanet.” There is notone single piece ofevidence to justifysuch claims. None of
the IPCC climate scenarios have evermatched the climate data even at the lowend. There has been no warming this century;the climate feedbacks assumed in GlobalClimate Models are incorrect; and satellitemicrowave measurements of thetroposphere have never observed thewarming predicted by the IPCC ClimateModels. Finally the Sun is in a quiescent modewith 620 sunspotfree days versus an averageof 336 days in the recent 20th Century. Aminimum of this scale has not been observedsince the 19th Century. Indeed, we mayexperience an “irreversible” climate shift butentirely in the opposite direction from thebold statements of the hundreds of scientistsin Copenhagen.
REFERENCESBalling, R. C ., Jr. and Cerveny R. S . 2003.Compilation and Discussion of Trends in SevereStorms in the United States: Popular Perceptionor Climate Reality? Natural Hazards v. 29, no. 2,p. 103-112.
Chan, J. C. L. 2000. Frequency of Typhoon Landfallin Guangdong Province of China during the period1470-1931. International Journal of Climatology,v. 20 no. 2, p. 183-190.
Changnon, S. and Changnon, D. 2001. Long-TermFluctuations in Thunderstorm Activity in the UnitedStates. Climatic Change, v. 50, p. 489-583.
Changnon, S. and Changnon D. 2000. Long-TermFluctuations in Hail Incidences in the UnitedStates. Journal of Climate, v. 13, p. 658-664.
Emmanuel, K. 2005. Increasing Destructivenessof Tropical Cyclones over the past 30 Years. Nature,v. 436, p. 686-688.
Fauchereau, N., et al. 2003. Rainfall Variabilityand Changes in Southern Africa during the 20thCentury in the Global Warming Context. NaturalHazards v. 29, p. 139-154.
Herbert, R. 2002. New York Times, June 24th issue.Khandekar, M. L. 2004. Canadian Prairie Drought,a Climatological Assessment. Alberta Environment,http://www.gov.ab.ca/env/.
Khandekar, M. L. 2002. Comment on (worldMeteorological Organization) Statement onExtreme Weather Events. EOS Transactions,American Geophysical Union, v. 84, p. 428.
Klotsbach, P. J. 2006. Trends in global cycloneactivity over the past twenty years (1986-2005).Geophysical Research Letters, v. 33, L010805,doi:10. 1029/2006GL025757.
Kripilani, R.H., et al. Indian Monsoon Variability ina Global Warming Scenario. Natural Hazards v.29, p. 189-206.
Landsea, C . 2005. Hurricanes and GlobalWarming. Nature, 438, December.
Landsea, C., et al. 1996. Downward Trends in theFrequency of Intense Atlantic Hurricanes in theLast Five Decades. Geographical Research Lettersv. 23, no. 13, p. 1697-1700.
Michaels, Patrick J. 2004. The Predictable Distortionof GLOBAL WARMING by Scientists, Politicians,and the Media. Cato Institute, Washington, DC.
Singer, S . Fred, and Avery, Dennis T. 2007.Unstoppable Global Warming. Rowman andLittlefield Publishers, Lanham, Maryland, revised2008.
Wang, Y. Li, C. Ren, F., And Wang X. 2008. Study onClimatic Characteristics of China-InfluencingTyphoons and the Interrelations between themand their Environmental Factor. Journal ofTropical Meteorology v. 14, no. 1 p. 24-27.

39
CLCLCLCLCLIMAIMAIMAIMAIMATE CHANGTE CHANGTE CHANGTE CHANGTE CHANGE VE VE VE VE VIII:III:III:III:III:Global Circulation Models by Dr. A. Neil Hutton
Edward Lorenz was a pioneeringmathematician meteorologist at MIT. Hebegan to study weather patterns bydeveloping a series of simplified equationsthat he ran on an early, primitive computer.He had some success in representingweather patterns, but in a classic piece ofscientific serendipity he decided to rerunone of his programs and continue it over alonger period. He was amazed to find thatthe rerun initially matched the first run butthen diverged completely (Figure 8.1). Lorenzat first believed the problem was with thecomputer, but when everything wasreexamined, it turned out that the problemwas a rounding error. The computeroperated to six decimal places but, tofacilitate data entry, Lorenz had rounded thedata to three decimal places. According toconventional thinking, small initial changesof one / ten thousandth to one / millionthshould have commensurate consequences,but as Lorenz eventually deduced, evenalthough the change was tiny, it had profoundeffects. This phenomenon is known assensitive dependence on initial conditionsor, more popularly, the butterfly effect. Thename deriving from Lorenz’s 1979 addressto the American Association for theAdvancement of Science entit led,“Predictability: Does the Flap of a Butterfly’sWings in Brazil set off a Tornado in Texas.”Lorenz concluded that since it wasimpossible to assess initial conditions to theaccuracy required, then there was no meansto provide weather forecasts for more thana few days. Lorenz suggested it required agrid of one-meter-square sensorsthroughout the globe, otherwisedeterministic forecasts were impossible.Currently – even with satellite observation,radar, infrared, and other coverage – weatherforecasts are l imited to five days, butcommonly decay within 48 hours. Thus, evennow, when we predict the weather even 24hours before it arrives, accuracy is limited. Areasonable conclusion is that, if not possibleto forecast the weather a week forward, howcan it be possible to forecast climate 100years forward?
There is an argument presented byclimatologists that weather and climate differ.That is to say that weather is an initial valueproblem (“the butterfly effect”) limitingreliable forecasts to 5-10 days. Climate onthe other hand is a “boundary valueproblem”! In cl imate forecasting, an
Figure 8.1. The Lorenz Experiment: The Father ofChaos Theory’s first experiment indicating sensitivitydependence on initial conditions. The difference inthe starting values of the two curves is only 0.000127.Nevertheless, this very small departure results in avery large change in the end result: the butterflyeffect (after Stewart, I., 2002, Figure 57, page 128;source: http://www.imho.com/grae/chaos/chaos.html).
Figure 8.2. Phanerozoic CO2: CO2 concentrations for the last 600 million years, in parts per million on the leftaxis and as multiples of current concentrations on the right. The past 400,000 years is highly contracted onthe left. It is perfectly clear that the current CO2 concentrations are at the lowest levels in geological history. Onthis basis, current levels of only 385 ppmv do not present any particular hazard to human existence (afterSinger, S. F. 2008. Figure 24, page 24; source: http://www.heartland. org/custom/semod_policybot/pdf/22835.pdf).
examination is made of how changes in therules by which climate systems operate canchange the average weather. There appearsto be a non sequitur here, since climate is aniteration through time of weather. Weaverage over time conditions to classifyclimates into major zones and subzones, suchas equatorial, tropical, dry (arid and semi-arid), Mediterranean, maritime temperate(oceanic), and so on. Climate, therefore, isfundamentally a derivation of the weathercontinuum over time. Furthermore, the onlychange in the “rules” that has been examinedis the addition of CO2 since the industrialrevolution. The f irst problem incomprehending the rules is that CO2
represents such a tiny fraction of theatmosphere that it, in itself, can not exert asignificant influence. This problem is generallyconceded by climatologists. They, thereforeappeal to an unproven assumption that thetiny amount of warmth generated by CO2
molecules will induce more cloud in apositive feedback cycle which the alarmistssuggest could result in a runaway greenhouseeffect destroying the planet. That this is the
most arrant nonsense is easily demonstratedby the fact that at the present time CO2
levels are at their lowest levels in the Earth’shistory (Figure 8.2). If the alarmist theorieswere correct life would never have evolvedon the planet.

40
What then are the climate models attemptingto show? Climate models are simply stringsof computer code or algorithms whichattempt to simulate the behaviour of theatmosphere. If the model does not matchreality, they require modification. From ascientific perspective, a climate model is ahypothesis in search of val idation byobserved data. Normally, in developingatmospheric climate models, it would be astandard procedure to hindcast the modelperformance against historic climate data. Ifa good match was attained for historicclimate, the reliability of forecasts would bemore credible. In fact, this has never beendone. This is because climate models dependentirely on CO2 as their climate changedriver. However, according to the orthodoxglobal warming theory, preindustrial levelsof CO2 were monotonously low andconstant, as indicated by several ice coresfrom the Antarctic (Hutton, 2009a, Figures1-5). This presents a serious problem to themodelers because there is a vast publishedl iterature (www.co2science .org)documenting cycles of warming and coolingcoeval with the ice core data (Figure 8.3).The incontrovertible conclusion is either theice core data is wrong, or CO2 has no rolewhatsoever in climate variability. We haveargued previously that the proxy CO2 valuesin ice core data are depleted, and are notrepresentative of contemporaneousatmospheric CO2 (Hutton, 2009a, p. 40).Here, fundamentally, is the disproof of theentire global warming by CO2 theory. If theice core proxy atmospheric CO2 values wereplugged into current climate models it wouldshow continuous cooling from the Little IceAge (1650-1750) to the Holocene, some10,000 years ago. From a wide range ofgeological, archaeological, and historical datain literally hundreds of peer-reviewed papers,this is wrong. The climate was cyclical througha series of warm and cold periods (Figure8.4) with many instances of temperatureexceeding our current maximum.
How is it that Global Circulation Models(GCM) have become the super stars ofclimate research and are presented asevidence for the effects of warming evenwhen contradicted by real data observations?The GCM are three-dimensional computermodels that attempt to integrate and projectinto the future all of the major influences ofclimate. The list is extensive and the problemis so complex and massive that programscan only be run on supercomputers, whichmeans that only wealthy nations can affordto run them. The major centers are Britain’sHadley Centre, NASA, Goddard Institute forSpace Studies (GISS), the National Centrefor Atmospheric Research (NCAR), and theNational Oceanic and AtmosphericAdministration’s (NOAA) Geophysical Fluid
Figure 8.3. Global Temperature Anomalies: This figure is based on the Loehleand McCulloch study of eighteen 2,000-year-long proxy studies from aroundthe world, excluding tree ring studies (which have inherent problems). Theevidence for these climatic cycles is of very high quality with the MedievalWarm Period recording higher average temperatures than the Modern Warm-ing (after Loehle and McCulloch, 2008, Figure 2, page 97).
Figure 8.4. Post-Pleistocene Climate Cycles since the end of the last glaciation.There are 16 climate oscillations, with the warm cycles shown in pink and cold inblue (source: http://www.co2science.org/articles/V11/N5/C1.php).
D y n a m i c sLaboratory. Themodels attempt towork from f irstprinciples usingfundamental physicallaws, thermody-namics, fluid dyna-mics, the carboncycle, the watercycle, and so on. Inturn, the f irstprinciples areconverted tom a t h e m a t i c a lequations or moree m p i r i c a lalgorithms for a vastthree dimensionalarray of grid boxesrepresenting theglobal surface andatmosphere . Thecomputer generatesnew values for eachgrid box as themodel stepsforward in time byan assigned interval– 0.5-1.0 hour –again and againthrough thesimulated t imeperiod. Theprojected climatechange is assessedby re-running themodels withdifferent levels ofgreenhouse gases,aerosols, or otherfactors assumed tobe involved inclimate change. Thecomplexity of suchan undertaking isc e r t a i n l yoverwhelming. Onthe other hand,what is astonishingis the data (listed below) fundamental toclimate analysis that is not included. Whatthis is analogous to is having a gigantic toy inwhich fundamental parts, like the batteriesat Christmas, are not included.
In fine print on the side of the GCM toy boxwe find:
• The Sun spot cycle – Not Included;• The dimensions and strength of the
Heliosphere – Not Included;• The AP progression Index (a measure
of solar wind) – Not Included;• The strength of cosmic ray flux – Not
Included;
• The experimentally demonstrated andobservationally recorded nucleationof low cloud by cosmic rays – NotIncluded;
• The natural heat flux of the Earth – NotIncluded;
• The heat flux through the oceans ofsome 64,000kms of spreading centresand unrecorded subsea volcanoes andfumaroles – Not Included;
• Ability to understand the cause andeffect of the major oceanic cycles,such as the North Atlantic Oscillation,the Pacific Decadal Oscillation, or –the most profound of these – the El

41
Nino Southern Oscillation – NotIncluded.
Would you be prepared to buy this toy andrely on its forecasts? Unfortunately wealready have. But what is the track record offorecasts developed by the GCMs. We havealready described forecasts which arecontradicted by observed data, such as thepredicted increase in Asian Monsoonvariability and strength contradicted byKripilani’s (2003) study, (Hutton, 2009d, p.3), and IPPC models of predicted sea levelchange not supported by observed satellitedata (Hutton, 2009c, p. 5).
The most recent Intergovernmental Panelon Climate Change reports depend almosttotally on computer modeling, and theprojections are presented as validatedscience, rather than poorly constrainedprojections for which the assumptions areobscure and cer tainly inadequate . Afundamental projection of theAnthropogenic Global Warming Hypothesisis that the addition of CO2 to the atmospherewill result in an increasing warming withaltitude, peaking at roughly 10km at abouttwice the surface value. The model resultsare presented in Figure 8.5 as shown in theIPCC report (IPCC-AR4, 2007, p. 675). If thetheory is valid, then measured observationaldata should confirm the model simulation.They do not. Satellite data have neverconfirmed the projection illustrated inFigure 8.5. In contrast, observed temperaturetrends from the analysis of radiosonde datashow the reverse, a slight cooling trend withaltitude (Figure 8.6). If we were dealing withobjective scientific analysis, this result woulddefinitively falsify the theory. It has not. TheIPCC cling grimly to one single line ofevidence, the weak correlation betweenatmospheric CO2 and the global averagesurface temperature and that only since 1850,while the planet was recovering from thedepths of the Little Ice Age. The inconvenientcyclical nature of the entirety of Earth’sprehistory is ignored.
The situation is similar if we consider theprojections for future climate from IPCCmodels in each of the assessments reports(First Assessment Report, 1990; SecondAssessment Report, 1996; and ThirdAssessment Report, 2001) as shown in Figure8.7 (page 42) (IPPC, 2007, HistoricalOverview of Climate Science, p. 98, Figure1.1). Most observers would conclude thatthe IPPC projections do not correlate verywell with the observed data. It gets worsewhen future scenarios are added. In Figure8.8 (page 42), the same data from Figure 8.7is repeated, but now includes IPPC forecastsout to 2025. These forecasts, now designatedas scenarios, are essentially straight line
Figure 8.5. Greenhouse-model-predicted temperature trends versus latitude andaltitude presented in IPCC-AR4, (2007, p. 675). The figure shows a predictedincreased temperature trend in the tropical mid-troposphere of 1.2°C. In thirtyyears of satellite observations, this trend has never been observed (source: http://www.heartland.org/custom/semod_policybot/ pdf/22835.pdf).
Figure 8.6. Actual data observations from radiosonde balloons versus latitudeand altitude. The trends are derived from the Hadley Centre, Climate ResearchUnit and are an excellent match for similar US analyses. Notice that there is nowarming trend in the tropical mid-troposphere but a slight cooling (source: http://www.heartland.org/custom/semod_policybot/pdf/22835.pdf).
projections of theearl ier observedtrend and theprojected increasein CO2. Thecomputer modelsused lack anycl imate variableother than CO2 sothey can accom-modate no othertrend. The orangetrend signi f ies atheoretical climatevariability with noa d d i t i o n a lgreenhouse gases(CO2) or aerosols.The observedt e m p e r a t u r eprojection (heavyblack) extends to2005 and shows aflattening curve. Thefurther cooling ofabout 0.15°C from2005 to 2009 willcause the exten-sion of observeddata to intersect thepredicted orangecurve . The con-clusion is clear: theIPCC scenarios arewrong. Dr. SyunAkafosu of theUniversity of Alaskahas made ananalysis in which hedocuments thecontrol of them u l t i - d e c a d a loscillation on 20thcentury climate. Hisprojection isillustrated with thecurrent downwardcooling trend ofobserved data(Figure 8.9, page42). The IPCC scenarios are clearlyunsupportable as scientific evidence.
At this point it would be reasonable toconsider i f forecasts, scenarios, orstorylines, as they have been variouslytermed in IPCC reports, are science. Thestandard for an acceptable scienti f ichypothesis, over the last 300 years ofscienti f ic enquir y, requires that thehypothesis makes predictions that can besubsequently tested. Hendrik Tennekes hasargued, following Edward Lorenz of the“butterfly ef fect ,” that meteorology washeading into an unsolvable dilemma since thenature of the atmosphere and the complexity
of the climate system could not be resolved.No matter the refinement of the observationnetwork, or the increase in power ofcomputers, the average useful forecast is stillin the range of a few days.
In addition to the sensitivity to initialconditions issue, is the fact that computermodeling is about the incrementallinearization of a nonlinear dynamic system– one that is not in global thermodynamicequilibrium either within itself or with itssurroundings. The linear modeling negatesthe reality of unconstrained turbulent flow.In an attempt to overcome these difficultiesthe approach is to use ensemble forecasting

42
Figure 8.8. Compares the data from Figure 8.7 with the addition of predictedscenarios derived from IPCC-AR4 (Ch. 10, Figure 10.4) to the year 2025. Multi-model mean projections from the report are shown from 2000-2025 with thescenarios B1 in blue, A1B in green, and A2 in red with the range of uncertaintydisplayed in bars to the right. The orange (commitment) scenario reflects aprojection of temperature with no further greenhouse gases or aerosols. The heavyblack is the observed temperature, but extends only to 2005, since which time therehas been 0.15°C of cooling. This will cause the observed trend to drop and intersectthe orange projection assuming no CO2 or aerosols. This result invalidates the IPCCprojections completely, demonstrating that CO2 is not the primary climate driver(source: http://rankexploits .com/musings/wp-content/uploads/2008/07/ar4tarsar.gif).
Figure 8.9. This diagram based on a critique by Dr. Syun Akafosu againillustrates the inadequacy of IPPC computer model scenarios, which are es-sentially straight line projections into the future based on increasing atmo-spheric CO2. The reality is quite different. The red dot with the green arrowis where the observed temperature currently stands. From variations in thetemperature record such as the decline from 1940-1975, when CO2 wasactually increasing, Akafosu interprets a multi-decadal oscillation which showsthe climate now entering a cooling period (source: http://wattsupwiththat.com/2009/03/20/dr-syun-akasofu-on-ipccs-forecast-accuracy).
and multi-model forecasting. The samedifficulties exist within the models, andwhether any one of the ensemble reflects arepresentation of the real world can not beestablished as there is no means to confirmits reliability or accuracy. Karl Popper, oneof the 20th Century’s leading scientificphi losophers, takes issue with thisdeterministic approach, which he regardedas false, dangerous, and leading to arrogant,undisciplined, and (worst of all) unfalsifiablepredictions masquerading as science – astatement which fairly describes the entiretyof the IPCC case for global warming.
Popper’s philosophy is that a scientificproposit ion or hypothesis must be“falsifiable.” This restraint requires thatevery scientif ic claim include, at leastimplicitly, a clear notion of what evidencewould be required to prove that theproposition is untrue. This requires somescientific rigor and integrity that the IPCCclearly has not shown, preferring to ignorecontrary data as we have described above.
The realizable danger, as we see in climatestudies now, is that we are presented withunfalsifiable theories that seem like science.According to Tennekes in a speech in 1986,“No forecast is complete without a forecastof Forecast Skill.” In other words the modelsmust be able to reproduce a known data setwithin a defined level of accuracy withoutwhich the forecast is simply a guess. Climate
Figure 8.7. Yearly average global surface temperature observations versus the projections fromthe First (1990 FAR in blue), Second (1996 SAR in orange), and Third Assessment Reports(2001 TAR in green vertical stripes) as shown in the IPCC-AR4,2007, “Historical Overview ofClimate Science,” p. 98, Figure1.1. The best estimates for FAR and SAR are in solid lines, but thisestimate was not provided in the TAR. The annual mean observations are provided by theheavy black dots which show little or no relationship to the model projections. The observed datais dominated by cooling from the Pinatubo volcanic eruption in 1992, and the very strong ElNino warming in 1998. The heavy black line is a smoothed version of the decadal variationwhich shows a poor correspondence with any of the forecasts (source: http://www.ipcc.ch/pdf/assessmentreport/ar4/wg1/ar4-wg1/chapter1.pdf).
is such a complex,dynamic , nonlinear,out-of -equi l ibr iumsystem with so manya p p r o x i m a t i o n srequired that models,based on theiro b s e r v e dperformance, areuseless as predictivedevices. Tennekes haspointed out thatwithout the ability topredict changes inprecipitat ion wecannot possiblypredict future climate.In f igure 8.10 arepresented someforecasts fromvarious models ofp r e d i c t e dprecipitation. Thereare huge differencesin the models, notonly in magnitude butalso sign such thatsome areas could be either a desert or aswamp. The models are inadequate insimulating regional effects, particularly whenit comes to precipitation.
General circulation models necessarilyignore fundamental issues, partly out ofcomplexity and partly out of lack of
understanding of systems such as cloudbehaviour or Sun cycles. As a result, modelsin ensemble forecasts lacking properparameterization of fundamental processesare compared with models that necessarilyignore the same issues. If several such modelsthat are incomplete in fundamental ways areseen to show some agreement, then this

43
Figure 8.11. Here is clear proof of the dangers of computer modeling even when itincludes the requisite estimate of forecast skill. The figures compare observations ofthe past twelve sunspot cycles (upper figure in blue) with computer simulation ofsolar processes developed by NCAR scientists (lower panel in red). The fit is almostperfect (98%) and from this a forecast was made for cycle 24 that it would be 30-50% more intense than cycle 23, peaking in 2012 with a sunspot number of 160 plusor minus 25%. In fact, cycle 23 is still in a minimum phase with minimal cycle 24activity. Far from being more intense, we are now at 637 sunspot-free days, a mini-mum not seen since the 19th Century, and it is unlikely that cycle 24 will peak before2014 with a sunspot number less than 50 (source: http://wattsupwiththat.com/2009/05/30/scientists-issue-unprecedented-forecast-of-next-sun-spot-cycle).
Figure 8.10. The inadequacy of Computer Climate models is demonstrated by anexample from the U.S. National Assessment of Climate Change (NACC, 2000).The diagram shows the predicted rainfall for 18 regions of the U.S. These resultscome from two models. Note the huge differences between model results in mag-nitude and even sign. For example, the Dakotas (Souris-Red-Rainy) is either aswamp or a desert depending on which model is used. It demonstrates howremoved from reality the modelers are when they present results from which theonly conclusion is that the models are worthless (source: http://ww..heartland.org/custom/semod_policybot/pdf22835.pdf).
deemed to be an acceptable result, whichwe are expected to believe.
Supposedly highly sophisticated climatemodels have been running for twenty yearsnow at tremendous expense. It has becomeevident that they have no predictive valuewhatsoever. In this regard, even when thereappears to be a forecast skill of 98%, theoutcome can still be wrong. The NationalCenter for Atmospheric Research produceda model which replicated the last 12 sunspotcycles from 1880-2006 (Figure 8.11). Onthis basis, cycle 24 was predicted to be themost active in recorded history, 30-50% moreintense than the current cycle 23. Not onlyis this forecast wrong, it could be majorlywrong if the Sun continues in its quiescentstate. So far cycle 23 has the lowest minimumsince the 19th Century and is likely to have avery weak maximum: less than 50 sunspotsversus a forecast by NASA of greater than160. Clearly the assumptions that went intothe model neglected a fundamental cyclicalelement in the generation of sunspots.
Here the comments of Freeman Dyson, oneof the world’s outstanding physicists, seemparticularly prescient, “The models are full
of fudge factors that are fitted to the existingclimate, so the models agree more or lesswith the observed data. But there is noreason to believe that the same fudge factorswould give the right behaviour in a worldwith different chemistry, for example withincreasing CO2 in the atmosphere. Modelsdo not begin to describe the real world welive in nor have they been able to describeour climate history.”
It might appear that we have regressed to asituation analogous to the oracle at Delphiwhere the ululating sound emanating fromthe rock were interpreted by the high priestsas they prophesied the future of the citizensand the country. Are the General CirculationModelers now the oracular priestsprophesying global warming?
REFERENCESREFERENCESREFERENCESREFERENCESREFERENCESAkasofu, Syun-Ichi. 2008. Is the Earth StillRecovering from the ‘Little Ice Age’. InternationalArctic Research Center, University of AlaskaFairbanks, http://people.iarc .uaf.edu/sakasofu/pdf/Earth_recovering_from_LIA_R.pdf.
Dyson, Freeman J. 2005. Winter CommencementAddress, University of Michigan. U. of Michigan
News Service, www.umich.edu/news/index.html?Dyson WinCom05.
Essex, C., McKitrick, R., and Andresen, B. 2007.Does a global temperature exist? Journal of Non-Equilibrium Thermodynamics, v. 32, no. 1, p. 1-27.
Hutton, A. Neil. 2009a. CLIMATE CHANGE III:Carbon Dioxide. Canadian Society of PetroleumGeologists, The Reservoir, v. 36, issue 3, p. 38-43,Figs. 1-5.
Hutton, A. Neil. 2009b. CLIMATE CHANGE V:Here Comes the Sun. Canadian Society ofPetroleum Geologists, The Reservoir, v. 36, issue 5,p. 31-39.
Hutton, A. Neil. 2009c. CLIMATE CHANGE VI:Fearmongering. Canadian Society of PetroleumGeologists, The Reservoir, v. 36, issue 6, p. 24-28.
Hutton, A. Neil. 2009d. CLIMATE CHANGE VII:The Spin Cycle. Canadian Society of PetroleumGeologists, The Reservoir, v. 36, issue 7, p. 21-25.
Intergovernmental Panel on Climate Change –AR4. 2007. Climate Change: The Physical ScienceBasis, Contribution of the Working Group 1 to theFourth Assessment Report. Geneva Switzerland

44
IPPC-TAR, 2001, Climate Change: The ScientificBasis. Contribution of Working Group 1 to theThird Assessment Report. Cambridge UniversityPress, Cambridge.
Intergovernmental Panel on Climate Change –SAR. 1996. Climate Change: The Science of ClimateChange. Contribution of Working Group 1 to theSecond Assessment Report. Cambridge UniversityPress, Cambridge.
Intergovernmental Panel on Climate Change –FAR. 1990. Scientific Assessment of ClimateChange. Contribution of Working Group 1 to theFirst Assessment. Cambridge University Press,Cambridge.
Kripilani, R. H., et al. 2003. Indian MonsoonVariability in a Global Warming Scenario. NaturalHazards, v. 29, p. 189-206.
Loehle, C. L. and McCulloch, J. H. 2008. Correctionto: A 2000-year g lobal temperaturereconstruction based on non-tree ring proxies.Energy and Environment, v. 19, no. 1, p. 93-100.
Lorenz, Edward, N. 1963. Deterministic NonPeriodic Flow. Journal of Atmospheric Sciences, v.20, p. 130-141.
Lorenz, Edward, N. 1979. Predictability: Does theFlap of a Butterfly’s Wings in Brazil set off a Tornadoin Texas . American Associat ion for theAdvancement of Science , Annual Meeting,December, 29th 1979.
Michaels Patrick, J . 2007. Meltdown, ThePredictable Distortion Of GLOBAL WARMING byScientists, Politicians, and the Media. Cato InstituteWashington, D.C.
Pieser, Benny. 2007. The Scientist As Rebel: AnInterview With Freeman Dyson. CCNet, March14 2007.

45
CLCLCLCLCLIMAIMAIMAIMAIMATE CHANGTE CHANGTE CHANGTE CHANGTE CHANGE IE IE IE IE IXXXXX:::::Economics by Dr. A. Neil Hutton
In the tide of human affairs, perhaps there isnothing more dangerous than a consensus,a point eloquently expressed bySchopenhauer in the 18th Century, “Thereis no opinion, however absurd, which menwill not readily embrace as soon as they canbe brought to the conviction that it isgenerally adopted.” The legitimate concernsregarding the environmental health of theplanet have been totally distorted by anevangelistic media and the neo-religiousmoral ity of the green environmentalactivists, who claim that warming will be adisaster. In human history warming neverhas been a disaster, but the economic effectsof attempting to mitigate warming certainlywill be disastrous.
By now, in this series of articles, it shouldbe clear that there is no substance to theglobal warming theory. This is after 20 yearsof research, four major IPPC assessmentreports, and the expenditure of untoldbillions of dollars in North America andEurope. Estimates indicate expenditures inthe region of $30 billion in the United States,and some $15 billion in the United Kingdom(Lawson, 2008). Certainly, with somehindsight, this has been an extraordinarymisapplication of capital. However, it palesin comparison to what is contemplated inthe misguided approaches to saving theplanet by reducing CO2 emissions. In someinstances it seems like ‘Alice in Blunderland’for some of the ideas are really farcical, butpoliticians are taking this seriously sincethey believe that is what the public wishes.Nevertheless, in their political hearts andminds they realise that the task is essentiallyimpossible but they must make the gestureswith as little real action as possible.
Let us consider the Kyoto accord whichCanada ratified in 2002 and in which thesignatories undertook to reduce CO2
emissions by 5.2% below 1990 levels by2012.
The agreement called for stabilization ofCO2 emissions by the year 2000. However,the road to hel l is paved with goodintentions (or obfuscations). By 2003,although the Canadian Government hadallotted $3.7 Billion for climate changerelated programs; the end result was thatCO2 emissions had grown by 24% above1990 levels and, by 2006, this had grown to35%.
Assuming that all of the signatories of theKyoto accord had actually adhered to theircommitment, although none have, with thepossible exception of Sweden anddeindustrialized Russia, this would haveresulted in a reduction in the World’stemperature of 0.1°C by the year 2100. Thisis an insignificant amount to which Canada’scontribution would be so small that it barelymattered. In the real world there has been adrop in global average satellite temperatureof 0.5°C. Therefore, the climate has achieveda level five times better than the Kyoto target,while atmospheric CO2 continues to risesignificantly. One might think that this wouldbe a wake-up call, if not for the green lobby,at least for the Canadian Government, butthey continue to make announcements ofadditional climate change initiatives as thoughnothing had changed.
Other than preserving an international highprofi le as responsible World cit izens,Canada’s actual abi l ity to impact CO2
reduction is negligible. While on a per capitabasis, Canadian emissions are relatively high(19 tons per capita, Figure 9.1, page 46) thisis a cold country, and we are a majorproducer of hydrocarbons and coal. We rankfourth in the world on a per capita basis(Figure 9.1, page 46) but, on an overall worldbasis, Canada accounts for only 2% of totalemissions (Figure 9.2, page 47). It is perfectlyclear that Canada’s commitment is simply tootrivial to be of relevance without theparticipation of the World community. Moreimportantly, the costs of attemptingincreased mitigation are formidable and willsignificantly damage the standard of living andeconomic activity of the nation.
Perhaps one of the most extraordinaryfeatures of the global-warming frenzy is thefact that governments have committed hugeamounts of taxpayers money to investigateand develop technology for carbon captureand sequestration (CCS), but have not spenta penny on any level of due diligence toexamine and verify the global warming theoryitself. An estimate of funds so far committedto pilot projects and research follows:Canada through the Federal and AlbertaGovernments – $3 billion, the Departmentof Energy in Unites States on one project –$2.4 billion, Australia – $4 billion, EU – $12billion on eight projects, Norway – $600million, and so on. In new measures beforeCongress there is a commitment to spend
$75 bill ion over the next 25 years. InAustralia, a staggering $22.2 bil l ion isallocated to budgetary assistance for carbonemission-related measures for the next fouryears.
Initially some studies suggested relativelymodest costs per ton for CO2 sequestration(David and Herzog, 2001). A recent study bythe Harvard Business School indicatesformidable costs of $150.00 per ton to scrub,compress, liquefy, and inject CO2. This didnot include costs for pipeline distributionor storage facilities. This amounted to anaddit ional consumer premium of 10¢/kilowatt-hr, about 2-3 times costs in earlierstudies. The U.S. national average for poweris 10¢/kilowatt-hr so that CCS includingdistribution and storage will more thandouble consumer’s electricity costs.
So we now have commitments bygovernments, to spend at least $100 billionon CCS, lacking any scientific evidence of theaccuracy of anthropogenic Global Warming,other than a series of increasingly inaccurateIPCC forecasts based only on computerclimate models. Moreover, the total lack oflogic in the whole endeavour is that the CO2
that we are trying to dispose of originatedin the atmosphere in the first place, and wassequestered naturally through geologicaltime to the point that the Quaternary periodwe now live in has an atmosphere with thelowest CO2 levels of all past GeologicalHistory. If atmospheric CO2 up to seventimes the current levels were not harmfulto life in the past, there is no reason tobelieve that current levels will be now.
The notion that coal and tar sands are dirtyenergy sources is based on the completelyerroneous and completely unproven ideathat CO2 will warm the atmosphere. If thishad any real scientific basis and the dangersof warming were real, then CCS may havesome merit. Beyond CCS we plunge into aseries of murky strategies whose benefitsare highly questionable and certainly highlysusceptible to economic fraud and scams.
Here we refer to the system of Cap andTrade, nicely defined as the tax that daresnot speak its name. The concept is that thegovernment will set an absolute cap onnational CO2 production, after whichcompanies buy, sell, or are allocated permitsto emit CO2. Over time the cap is reduced

46
Figure 9.1. National carbon dioxide (CO2) emissions per capita. This shows Canada in fourth place calculated in 2004 at 14.5 million metric tonnes per capita, butcurrently calculated to be 19 million metric tonnes per capita. Emissions are not usually monitored directly, but are generally estimated using models. Some emissionscan be measured with only limited accuracy. Emissions from energy and industrial processes are the most reliable while emissions from agricultural activities presentmajor uncertainties. Source: World Bank online data base: UNEP/GRID Arendal (http://maps.grida.no/go/graphic/national_carbon_dioxide_co2 _emissions_per_capita).

47
to reduce carbon emissions. The US CongressionalBudget Office has calculated that the “TAX” wouldamount to only $175.00 a year for a family of four, butthis is in the years up to 2020 and then things reallyget serious. When our current politicians are drawingtheir comfortable pensions, the average family of fourare facing $1,870 additional electric bills per family.Under the new US Waxman Markey Bill this will riseto $6,800 by 2025. This is an energy price tsunami thatthe economy simply can not sustain. Furthermore,the pain will not be shared evenly as it is relative tothe reliance of states and countries on energy sourceswith different CO2 emission potentials such as coal,natural gas, hydro, nuclear, and oil. The poor, however,who have to devote proportionately more of theirdisposable income to energy, have the most to lose.
Although “Cap and Trade” is presented as a marketsolution to the CO2 emission problem, in practice itis a government-rationing scheme in which the rationscan be subsequently traded. The nature of the systemis that rations will become scarcer and permits moreexpensive. This will no doubt result in intensecommodity price shocks in the future. From a morerealistic and pragmatic perspective, the funds mightbetter be allocated to mitigating and adapting to theeffects of warming should they actually occur.
For the “Cap and Trade” market-makers and othermiddlemen, trading in CO2 emission permits it is anunprecedented bonanza, with no economic valueadded, which will come with the usual unintendedconsequences of entrepreneurial schemes and scams.The administrative allocation system does not scorehighly on transparency, and will lend itself to lobbying,corruption, and abuse of one kind or another. Capand trade is distortionary, covering mainly emissionscoming from the generation of electrical energy andrefining and production of hydrocarbons, but notothers, such as the entire personal and householdsector, including automobiles.
The EU has some experience of such a scheme, theEmissions Trading Scheme (ETS) that was initiated in2005 and in its first three years resulted in no drop inemissions. Instead, the faci l i t ies under ETSadministration, emissions actually increased by 8%. Inthe first phase, the embarrassing revelation was thatmore permits had been issued than there was‘pollution’. Although the ETS administration declaresthat they have learned their lesson and will tighten upon permit allocations, this can probably not be policed,since member States can ‘import’ external ‘Kyotocredits’ from developing countries in order to meettheir target for reductions. This might be acceptable ifthese represented real emission cuts. However, inmany instances, the credits have been shown to beflawed or simply fraudulent, yielding no true emissionreduction. As well, many credits are purchased fromdeveloping countries that would have credits theydon’t need so that there is no reduction but an increasein emissions. The opportunities for malfeasance areendless, while the financial incentives to do so areconsiderable for both parties. In general, with theexception of those who made money, the ETS is widelyregarded as a farce. In order to provide greater
Figure 9.2. This shows the list of countries by emissions in metric tonnes. The world’s total emissionsof CO2 are 28 billion tonnes, of which the United States and China produce 42%. These countries,together with the European Union, Russia, India, and Japan account for 71% of the world’semissions. Canada’s production of only 545 million tonnes accounts for only 2% of the world’stotal CO2 emissions. Therefore, Canada’s ability to influence total emissions is negligible. Source:United Nations, Energy Emission Administration.

48
transparency it was recommended that all ofthe permits should be auctioned. The result?The EU decided that 98.5% of the permitsshould be allocated and a massive 1.5%auctioned. Here a cynic might well concludethat politicians are unwilling to give up theperk of being lobbied so that campaign fundswill be contributed.
Another arrangement under the Kyotoagreement is the Clean DevelopmentMechanism (CDM) under which, a country, thatis unable to meet its emissions target, can buy‘certified emission reductions’ (CERs) fromdeveloping countries instead. The certificationof the reductions is, in theory, done by theUnited Nations, but in reality the system isimpossible to police. Various newspaperinvestigations have shown the CDM did notreduce emissions and were little more than amassive scam (Davies, 2007, The Guardian, UK).In this same philosophy was the JointImplementation mechanism in which countrieswith emissions below their Kyoto targets cansell ‘carbon credits’ to developed countriesunable to meet emission targets. As it happens,Russia is the only developed country in thisposition. Indeed, it has been suggested thatRussia’s late ratification of Kyoto wasmotivated by the prospect of earning billionsof dollars selling ‘carbon credits’, not becauseof any innovation, but because of the collapseof the old Soviet Military Industrial machine inthe 1990s. Now Russia’s emissions are wellbelow the Kyoto 1990 benchmark. DoesRussia’s ability to sell credits now really changethe level of CO2 emissions?
It is unlikely that any of these schemes willmake any difference to the climate, but thepoliticians and scientist have created aclimate of anxiety and guilt. And like themedieval church selling indulgences you cannow purchase ‘carbon credits’ in order toassuage your guilt by reducing your carbonfootprint. This is a private sector responseto the emission issue. It has both a personaland corporate dimension: corporations canclaim to be ‘carbon neutral’ by claiming tohave purchased ‘offsets’ in the form ofemission reductions elsewhere, or of CO2
absorption through the of planting trees. Onan individual basis the schemes availableusually revolve around the planting of trees.Once again investigative journalism suggeststhat there is a high level of fraud involved.The trees allegedly planted, may not havebeen; if they have been, it was not on thebasis of new offsets, or the credit has beendouble dipped. Either way their carbonabsorption is notional, unverified, and at bestsome years into the future.
Descending further into the realm of farceis the revelation that researchers at theUniversity of Alberta are developing cattle
that produce significantly less methane perbodyweight than regular cattle. Thus theowners of fart-less herds will be able to sellcarbon credits to owners of regular fart-a-lot cattle herds. One wonders what can beachieved here on a personal basis if you havethe correct metabolism? The concerns aboutthe use of fossil fuels has spawned a widerange of alternative energy proposals. Tothis date none can compete with the use offossil fuels and without heavy subsidizationby government would never be undertaken.First up is wind power, which at first sightwould seem like a natural contender and hasreceived considerable attention andinvestment. The fundamental problem is thatthe wind does not blow consistently. As wellthere are physical attributes of wind whichare unfavourable. The kinetic energy of windis determined by the specific mass of air (verylight at 1.18 kg/m3) times the cube of thevelocity times a constant. That is to sayE=C*M*V3. The final term is the one thatcreates the major problem since velocitycubed creates a variability that makes itimpossible to estimate the number ofkilowatts that will be generated at any givenmoment, or the number of kilowatt hours ina given period. Thus it is impossible toprovide a production factor / capacity factorfor a wind turbine. It wil l a lways beguesswork. An additional problem in practicaloperations is that turbines are shut off fromthe grid at wind speeds less than 20-30km/hr, while for safety reasons the units areshut down at speeds over 60km/hr. Maximumefficiency usually occurs in the 50-60km/hrwind speeds (Halkema, 2006).
An excellent illustration of the problem isshown in Figure 9.3, which shows variationsin the power of a single wind turbine. Thereis clearly seasonality in the wind power buteven in the winter months, fluctuations froma maximum 600kw to under 200kw can occurwithin a few minutes or hours. This iscertainly not a reliable supply of consumerelectricity. Building of a large number ofturbines does not resolve the problem.Figure 9.4 illustrates the power spectrumfrom 7,000 wind turbines spread over severalthousand square kilometres from the Northand Baltic Seas to the Austrian-Swiss border.Variations occur between 0.2 and 38.0of thegrids daily peak load, creating real problemsin establishing a stable electrical grid. It alsodemonstrates that distributing wind turbinesover a wide area does not prevent extremeand random variations in wind power. Thefundamental issue is that for every kilowattof generation by wind requires an equivalentbackup of conventional generation. So whyincrease your capital costs by building windturbines in the first place?
Shell announced in March this year that they
would no longer invest in renewable energyprojects such as wind since they are noteconomic (Tim Webb, The Guardian, UK. 17March, 2009). Denmark has also indicatedthat their experience with wind turbines isthat, in fact, they increase emissions becausethey require equivalent backup inconventional generation and provide pooreconomies in capital costs.
In the United States, Boone Pickens hasbacked off a major investment in a proposedplan to build the world’s largest wind farmin the Panhandle of Texas. Pickens cites thedrop in oil and natural gas prices, difficultcredit markets, lack of access to transmissionlines, and uncertainties regarding governmenttax credits. The American Wind EnergyAssociation (AWEA) reported the industryinvested $17 billion on new wind energycapacity to create roughly 8,545 megawattsof electricity. This would have the ‘potential’to meet the needs of 6.8 million Americanhomes provided there is equivalent backupcapacity! There has been a major drop inconstruction as the industry awaitsclarification of new tax credit rules by theObama administration.
The story on renewable energytechnologies is rather similar to wind power.Perhaps wishful thinking together withgovernment subsidies is the driving force inthese enterprises. The IPCC claimed in itsClimate Change 2001 report that “knowntechnological options could achieve a broadrange of atmospheric CO2 stabilizationlevels, such as 550ppm, 450ppm or belowover the next 100 years or more…”. Theknown technological options refer totechnologies that exist in operation or pilotstage today. It does not include technologiesthat will require fundamental technologicalbreakthroughs.
One of the most thorough reviews of theworld’s possible energy future appeared in anarticle by a team of energy scientists drawnfrom academia, government, and industry:“Advanced Technology Paths to Global ClimateStability” in Science’s Compass Feature inNovember 2002. The lead author was Martin JHoffert, a New York University physicist. Theconclusion of Hoffert and his team was thatcutting CO2 would require Herculean efforts,since CO2 is a key element of modern societythat “can not be regulated away.” Furthermore,contrary to IPCC, they conclude that theavailability of CO2 emission-free powerrequirements is not supported by the team’sassessment. In other words, the IPCC has madea supposedly scientific statement that is totallyat odds with the realities of energygeneration.
The problems of renewable energy sources,

49
according to the Hoffert team, are that theyhave very low power densities, as we havediscussed above in the case of wind. Theproblem becomes one of land use. Theaverage coal-f ired plant of 680-1,500megawatts requires only a few acres for itsconstruction and production. On the otherhand, wind turbines to produce the equivalentpower need up to 1,000 turbines on a spacingof between 50 and 100 acres per turbine,requiring some 100 to 150 square miles ofland to produce on an essentially intermittentbasis only about 1.5% of the required annual
increase to the grid. Wind power is simplyfeel good window-dressing meeting none ofthe requirements for CO2 emission-freeenergy. The backup requirement of windpower together with the capital cost causesa complete nullification of the supposedbenefit in emissions and economics.
At the present t ime global powerconsumption is about 12 trillion kilowatt-hours per year, of which 85% is fossil-fuelled.Future demand by 2052 could be in the rangeof 10 to 30 trillion kilowatt-hours per year.
The problems for the other renewableenergy sources are very similar to wind. TheHoffert team suggests that to produce 10tri l l ion ki lowatt-hours per year frombiofuels would require 15 million squarekilometres of cropland, which is simply notavailable. For example the use of America’shigh-yielding cornfields to produce ethanol,instead of food, produces a net of only 50gallons per acre per year after subtractingup front costs for seed, fertilizer, fuel, andprocessing. Thus in order to meet anysignificant volume of the US consumption of134 billion gallons of gasoline per yearthrough the use of corn ethanol, Americawould have to clear up to 100 million acresof forest land. The recent run-up in worldfood prices creating a crisis in the developingnations has demonstrated the failure ofsubsidised ethanol production policy.
The Hoffert team also points out that, withcurrent solar panel technology to produce10 trillion kilowatt-hours of electricity,another 220,000 square kilometres or so ofland to accommodate the photovoltaic arraystogether with the land for the associatedtransmission l ines, service roads,maintenance roads, and so on is required. Ifone adds up the land requirements for thelow-density renewable energy technologies,we are looking at continental land areasequivalent to South America (22 millionsquare kilometres), China (10 million squarekilometres), and India (3 million squareki lometres). It is clear that currentalternative energy are not feasible withoutmajor technological breakthroughs in solarpanel design and efficiency and in biofueltechnology, while wind power is simply noteconomically viable.
Although, probably an unpopular view withthe green lobby, the Hoffer t team’sconclusion was in support of more intensivetechnological solutions. In particular, theyconclude that the way forward is throughnuclear energy. Specifically, these expertswant nuclear fission and breeder reactorswith the ultimate goal of achieving fusion.Breeder reactors are currently illegal in theUnited States because of concerns regardingwaste disposal and production ofweaponsgrade material . However, thebenefits are that breeder reactors canproduce more fuel than they consume, andcan, after initial start-up, use thorium whichoccurs in the earth’s crust at a level fourtimes that of uranium. Some believe that thefuture lies with reprocessing spent fuel andthe use of breeder reactors in such a waythat fission reactors could be effective forthousands of years.
Unfortunately, an ill-informed public, anirresponsible media, and vote-seeking
Figure 9.3. The figure demonstrates the variations in wind power of a single 600 kW wind turbine situatedvery close to the North Sea coast in the Netherlands, as measured over a full year (8,070 hours). Note thehighly irregular pulsating nature of the output. It is clear that the kinetic energy of wind makes the predic-tion of output / production of a wind turbine impossible. It is always guesswork. Source: Halkema, 2006, p. 6,Figure 1.
Figure 9.4. This figure bears a striking resemblance to Figure 9.3, which shows output variations for a singlewind turbine. However, the figure shows the same pulsatory behaviour despite the fact that in this case theoutput is from 7,000 wind turbines distributed from the North Sea and Baltic Sea to the German Swiss border.Distributing large numbers of wind turbines over a wide area does not help to prevent random and extremevariations in total wind power. Therefore, it can never provide a reliable supply of consumer electricity. Source:German Eon Netz Wind Report, 2005, after Halkema, 2006, p. 7, Figure 2.

50
politicians are diverting public attention andmajor capital investment from the realpriorities for the future. Greater energyefficiencies at all stages of our activities arenecessary so that we optimize the use offossil fuels, abandon the rash uneconomicinvestments in so-called CO2 emission-freerenewable energy, and invest in research intoenergy solutions that are economic and canmeet our future needs for energy. Thediversion of intellectual energy and capitalinvestment into the global warming scare willbe viewed with astonishment and disbeliefin the future. It also stands as a monumentto the need for intellectual freedom and theability to sustain open scientific debate.
REFERENCES:Barnes, Greg. 2009. Climate Change IndustryHelp a Bottomless Pit. Business The Age, May 30,2009. http://business.theage.com.au.
David, Jeremy and Herzog, Howard. 2001. TheCost of Carbon Capture. Massachusetts InstituteTechnology, Cambridge, MA, USA. Presented at5th International Conference on Greenhouse GasControl Technologies.
Halkema, J. A. 2006. Critique of Windpower andthe UK Wind Resource. Energy and Environment,v. 17, no. 4.
Hoffert, M. I. 2002. Science Compass: AdvancedTechnology Paths to Global Climate Stability:Energy for a Greenhouse Planet. Science, v. 298,p. 981-87.
Lawson, Nigel. 2008. An appeal to reason – a coollook at global warming. Overlook Duckworth, PeterMayer Publishers Inc. New York, Woodstock, andLondon.
Malone, Scott. 2009. Pickens’ pullback could signalshift in the wind. Globe and Mail, Globe Investor,July 08, 2009, www.globeinvestor.com.
Singer, S . Fred and Aver y, Denis T. 2008.Unstoppable global warming. Rowman andLittlefield Publishers Inc, Lanham, Maryland.

51
CLCLCLCLCLIMAIMAIMAIMAIMATE CHANGTE CHANGTE CHANGTE CHANGTE CHANGE XE XE XE XE X:::::Afterword by Dr. A. Neil Hutton
One might wonder how a society that couldsend men to the moon, explorers to Mars,and develop amazing remote sensingtechnology is unable to develop anappropriate scientific evaluation of climate.The answer is probably that there was anarrogant underestimation of the complexityof climate, together with a naive attempt toreduce climate to the variability of one minortrace gas – ignoring all prior history ofclimate variability and atmospheric CO2
content.
The IPPC has created, with the cooperationof the media, the impression of thousandsof committed objective scientists ofimpeccable integrity. Supposedly, theseexperts, reinforced by extensive peerreview, have a high moral intent to save theworld from the potential Armageddon ofwarming. The reality is totally different! TheIPCC gathered together manymeteorologists, climatologists, environ-mentalists, and political activists. These arethe people claimed to be the 2,500 leadingscientific experts constituting the consensus.In fact, in IPCC’ s Fourth Assessment, a headcount shows that there were 1,656 authors;some of whom were involved in many partsof the report using given names in someparts, initials in others, and an abbreviationin another. If one goes to the trouble ofexamining the author’s biographies, itemerges that of the some 1,190 separateindividuals who wrote the scientific part ofthe report, many were not scientists butwere political and environmental activists.For example, those who authored thepublication of the chapters on the healtheffects of global warming had no formalexpertise in the chapters’ subject material(Lindzen, 1992). Indeed the published expertopinions of tropical disease scientists wereignored in a recurring and constant patternof IPCC reports. There was never amultidisciplinary effort to determine theoscillatory nature of climate change, itshistory, and its principal drivers.
A proper understanding of climate requiresan amalgamation of disciplines such asastronomy, astrophysics, solar physics,geology, geochronology, geochemistry,sedimentology, tectonics, palaeontology,palaeocology, glaciology, cl imatology,meteorology, oceanography, ecology,archaeology, history (of plagues, famines,economic data on agricultural commodities,
land use, crops, etc.), and, last but certainlynot least, statistical analysis. The problem, inthe beginning, was that this was neverintended to be an objective analysis, and otherdisciplines were deliberately excluded. Ledby the apocalyptical vision of Maurice Strong,the IPCC was formed under the UnitedNations with the specific objective of provingthat man-made emissions of Carbon Dioxidewould wreak havoc on the world’s climate.This was achieved through the mastermindingof conferences in Stockholm, Rio, Kyoto,Johannesburg, Bali, and the coming Kyoto IIin Copenhagen in December.
The World Meteorological Associationthrough the auspices of the United Nationsbecame the driving force in the process ofestablishing that global warming was theresult of human activities. While one mightconclude that the WMA were exactly theright people for the assignment, there is aproblem. Philosophically, the meteorologicalprofession is in the business of forecastingweather, and, therefore , take aforwardlooking approach to weather, and,in turn, climate. Yesterday’s forecast is nolonger relevant. This philosophy arrived at atime of tremendous developments intechnology, satellite imagery, Doppler radar,and – perhaps worst of all – supercomputers.Despite the work of Edward Lorenz, (TheButterfly Effect, 1979), and the cautions ofoutstanding scientists such as HenrikTennekes (1986, 1992), Freeman Dyson(2005), and others (Hutton, 2009d) climateresearch has rel ied exclusively oncomputergenerated climate models whosepredictions prove nothing and are evidenceof nothing.
Science requires evidence derived fromobservation, measurement, and experiment.Only two measurements have beenpresented by IPCC, the rise of atmosphericCO2 versus the ground-based global averagetemperature curves, as presented by theGoddard Institute for Space Studies (GISS)and Hadley Climate Research Unit(HADCRUT). The ground-based temperatureobservation stations were neverconstructed for the purpose of climateresearch. Apart from the fact that a majorityof the thermometers are improperly locatedadjacent to heat sources (Hutton, 2009a),they also exhibit an extreme geographicalbias as the majority of the thermometerrecords are located within the industrialized
nations of the Northern Hemisphere andare so strongly influenced by the Urban HeatIsland effect that the bias can not be removed.Although it is claimed that the data has beencorrected effectively, the confidence in thisassertion has been profoundly shaken, firstby Steve McIntyre’s work, which showed thatthe GISS data contained errors such that theThirties were the hottest decade not theNineties and, second, the persistent refusalof Dr. Phillip Jones of the Climate ResearchUnit, University of East Anglia, to release theraw data, which was the basis for theHADCRUT3 global average temperaturecurve. This is a completely unacceptablesituation preventing analysis and replicationby independent researchers and makes acomplete mockery of peer review. But thisis not the only incident where a refusal torespect normal scientific protocols andtransparency has occurred. The exposure ofthe Mann, Bradley, and Hughes hockey stickoccurred only because, over the refusal ofthe authors to release the data, they werefinally legally forced to provide the data bythe terms of their government researchgrant. Furthermore, the fact that thisinfamous graph was published and acceptedby the IPCC, and continued to be used yearsafter it had been completely discrediteddemonstrates conclusively the complete lackof integrity and scientific objectivity in theIPCC.
The totally political nature of IPCC wasclearly demonstrated in the FourthAssessment report (AR4) in 2007 where,having been forced to relinquish the ‘hockeystick’ – which was done without explanation– they then produced a curve starting in 1850(Hutton, 2009a). This was as if God createdthe world in 1850 and before that there wasno climate. Of course, this extraordinarymanipulation was done in order to avoidacknowledgement that there were climateoscillations comparable to and warmer thanthose of the 20th Century. In Figure 10.1(page 52) are documented no fewer than 15climate oscillations since the last ice age. Theselection of 1850 in the Little Ice Age waschosen only so that they could show risingatmospheric CO2 along with a temperaturerecovering from the cold of the Little IceAge. But what of the climate of the last 500million years? Was it not cyclical? Were therenot warm periods and cool periods – evengreenhouses and icehouses and was thiscaused by atmospheric CO2? The answer is
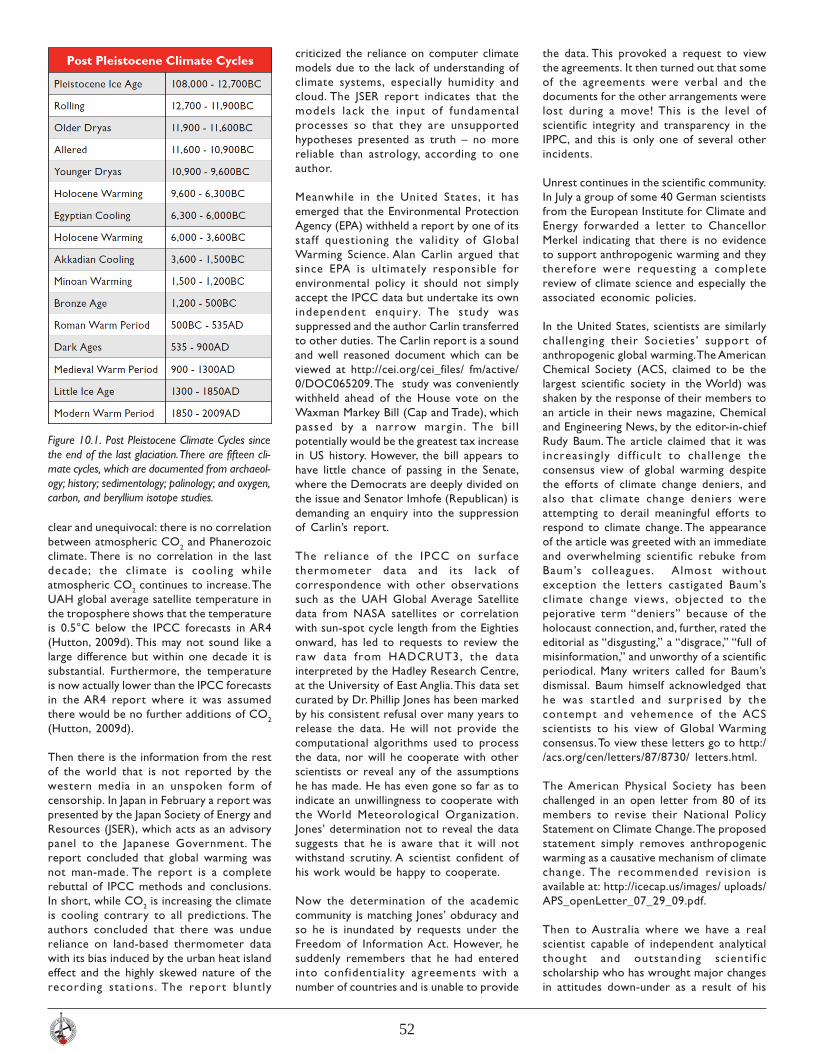
52
Figure 10.1. Post Pleistocene Climate Cycles sincethe end of the last glaciation. There are fifteen cli-mate cycles, which are documented from archaeol-ogy; history; sedimentology; palinology; and oxygen,carbon, and beryllium isotope studies.
clear and unequivocal: there is no correlationbetween atmospheric CO2 and Phanerozoicclimate. There is no correlation in the lastdecade; the cl imate is cooling whileatmospheric CO2 continues to increase. TheUAH global average satellite temperature inthe troposphere shows that the temperatureis 0.5°C below the IPCC forecasts in AR4(Hutton, 2009d). This may not sound like alarge difference but within one decade it issubstantial. Furthermore, the temperatureis now actually lower than the IPCC forecastsin the AR4 report where it was assumedthere would be no further additions of CO2
(Hutton, 2009d).
Then there is the information from the restof the world that is not reported by thewestern media in an unspoken form ofcensorship. In Japan in February a report waspresented by the Japan Society of Energy andResources (JSER), which acts as an advisorypanel to the Japanese Government. Thereport concluded that global warming wasnot man-made. The report is a completerebuttal of IPCC methods and conclusions.In short, while CO2 is increasing the climateis cooling contrary to all predictions. Theauthors concluded that there was unduereliance on land-based thermometer datawith its bias induced by the urban heat islandeffect and the highly skewed nature of therecording stations. The report bluntly
criticized the reliance on computer climatemodels due to the lack of understanding ofclimate systems, especially humidity andcloud. The JSER report indicates that themodels lack the input of fundamentalprocesses so that they are unsupportedhypotheses presented as truth – no morereliable than astrology, according to oneauthor.
Meanwhile in the United States, it hasemerged that the Environmental ProtectionAgency (EPA) withheld a report by one of itsstaff questioning the validity of GlobalWarming Science. Alan Carlin argued thatsince EPA is ultimately responsible forenvironmental policy it should not simplyaccept the IPCC data but undertake its ownindependent enquiry. The study wassuppressed and the author Carlin transferredto other duties. The Carlin report is a soundand well reasoned document which can beviewed at http://cei.org/cei_files/ fm/active/0/DOC065209. The study was convenientlywithheld ahead of the House vote on theWaxman Markey Bill (Cap and Trade), whichpassed by a narrow margin. The bi l lpotentially would be the greatest tax increasein US history. However, the bill appears tohave little chance of passing in the Senate,where the Democrats are deeply divided onthe issue and Senator Imhofe (Republican) isdemanding an enquiry into the suppressionof Carlin’s report.
The rel iance of the IPCC on surfacethermometer data and its lack ofcorrespondence with other observationssuch as the UAH Global Average Satellitedata from NASA satellites or correlationwith sun-spot cycle length from the Eightiesonward, has led to requests to review theraw data from HADCRUT3, the datainterpreted by the Hadley Research Centre,at the University of East Anglia. This data setcurated by Dr. Phillip Jones has been markedby his consistent refusal over many years torelease the data. He will not provide thecomputational algorithms used to processthe data, nor will he cooperate with otherscientists or reveal any of the assumptionshe has made. He has even gone so far as toindicate an unwillingness to cooperate withthe World Meteorological Organization.Jones’ determination not to reveal the datasuggests that he is aware that it will notwithstand scrutiny. A scientist confident ofhis work would be happy to cooperate.
Now the determination of the academiccommunity is matching Jones’ obduracy andso he is inundated by requests under theFreedom of Information Act. However, hesuddenly remembers that he had enteredinto confidential ity agreements with anumber of countries and is unable to provide
the data. This provoked a request to viewthe agreements. It then turned out that someof the agreements were verbal and thedocuments for the other arrangements werelost during a move! This is the level ofscientific integrity and transparency in theIPPC, and this is only one of several otherincidents.
Unrest continues in the scientific community.In July a group of some 40 German scientistsfrom the European Institute for Climate andEnergy forwarded a letter to ChancellorMerkel indicating that there is no evidenceto support anthropogenic warming and theytherefore were requesting a completereview of climate science and especially theassociated economic policies.
In the United States, scientists are similarlychallenging their Societies’ support ofanthropogenic global warming. The AmericanChemical Society (ACS, claimed to be thelargest scientific society in the World) wasshaken by the response of their members toan article in their news magazine, Chemicaland Engineering News, by the editor-in-chiefRudy Baum. The article claimed that it wasincreasingly di f f icult to chal lenge theconsensus view of global warming despitethe efforts of climate change deniers, andalso that climate change deniers wereattempting to derail meaningful efforts torespond to climate change. The appearanceof the article was greeted with an immediateand overwhelming scientific rebuke fromBaum’s col leagues. Almost withoutexception the letters castigated Baum’sclimate change views, objected to thepejorative term “deniers” because of theholocaust connection, and, further, rated theeditorial as “disgusting,” a “disgrace,” “full ofmisinformation,” and unworthy of a scientificperiodical. Many writers called for Baum’sdismissal. Baum himself acknowledged thathe was startled and surprised by thecontempt and vehemence of the ACSscientists to his view of Global Warmingconsensus. To view these letters go to http://acs.org/cen/letters/87/8730/ letters.html.
The American Physical Society has beenchallenged in an open letter from 80 of itsmembers to revise their National PolicyStatement on Climate Change. The proposedstatement simply removes anthropogenicwarming as a causative mechanism of climatechange . The recommended revision isavailable at: http://icecap.us/images/ uploads/APS_openLetter_07_29_09.pdf.
Then to Australia where we have a realscientist capable of independent analyticalthought and outstanding scienti f icscholarship who has wrought major changesin attitudes down-under as a result of his

53
recently published book, “Heaven and Earth,Global Warming, the Missing Science”. Theauthor Professor Ian Plimer, from theUniversity of Adelaide is twice winner ofAustralia’s highest scientific honour, theEureka prize. The book is a masterly pieceof scholarship of multidisciplinary range andbreadth, fully documented by 2,300 peer-reviewed references. This book is requiredreading for anyone who really wants tounderstand climate science and understandthe inadequate and scienti f ical lyunsupportable claims made by IPPC reports.
As a result of Plimer’s book, the AustralianSenate refused to pass the Cap and Tradelegis lat ion proposed by the RuddGovernment in August. Now the Bill mustbe amended through negotiation with theSenate. If the legislation is again defeated thenRudd would be required to call a generalelection.
Coming home is somewhat disappointingsince it appears from correspondence thatthe Federal and Provincial Governments fullysupport the IPPC 2007 AR4 Assessment. Thiscould be viewed simply as a move to appeasethe environmental vote. on the other hand,we should be concerned because Canada,along with the G8, signed on for the proposalthat the Nations would work to maintain aglobal average temperature no more than2°C above pre-industrial levels. Using theGlobal Average Temperature from the HadleyCentre which extends back to 1850 (Figure10.2), there is a trend of warming from 1850unti l the 1998 El Nino, after whichtemperatures have been decl iningapproximately 0.5°C below 1998 maximum.This would indicate that we have leeway ofabout 1.5°C over pre-industrial levels andsince the climate is cooling there appears tobe no urgency to rush into the so-calledmitigation strategies of cap and trade (CT),carbon capture and sequestration, (CCS),carbon credits for offset reductions, and acompletely unnecessary bureaucracy. one candetect the vultures wheeling in the skyreadying to feed off the new carbon economy,essentially the carcass of the taxpayers. Lawfirms and consultants are busying themselvesto lead you through the maze of carbonregulation so that you can establish andmaximize the carbon assets in your business– and none more so than Al Gore.
In 1998 Fortune Magazine derisively declaredthat Gore’s financial acumen, “Ain’t Worth aBucket of Warm Spit” at the time his networth was l itt le more than the vicePresidential income. Now since leavingpolitics he has a net worth in excess ofUS$100 million. It appears that many expecthim to become the first carbon billionairethrough his stakes in a global-warming hedge
Figure 10.2. 400 Years of Sun-spot Cycles. The heavy black line is the eleven-year mean of the monthlyaverages of the sun-spot numbers. The general correspondence of this average with known climate isexcellent. The Little Ice Age coincides with the extent of the Maunder and Dalton Minimums and in factextends to 1350 as a result of the Sporer Minimum. The increased activity in the later part of the 20thCentury is striking and it even includes the cooling from the late Forties to the mid-Seventies. This cooling is notreflected in the atmospheric CO2 content. Source: http:// en.wikipedia.org/wiki/File:Sunspot_Numbers.png. Thisfigure was prepared by Robert A. Rohde and is part of the Global Warming Art project.
Figure 10.3. The Global Average Temperature from 1850-2008. This data set is in doubt because of thesudden sharp increase in temperature starting in the Eighties, which is not shown on the satellite temperaturecurves. Furthermore, data plotting the sun-spot cycle length versus global average temperature (Hutton,2009c; p.36, Fig. 12) show a near perfect correlation for 130 years until the 1980s. The global-warmingfaction point to this as evidence of the influence of atmospheric CO2, but now there is a strong suspicion thatit is not properly corrected for the urban heat island effect. The suspicion is strongly reinforced by Dr. Jones’refusal to release the data. Source: http://hadobs.metoffice. com/hadcrut3/diagnostics/global/nh+sh/.
fund, a carbon-offset business, a renewable-energy investment business, and other global-warming-related ventures according toLawrence Solomon (National Post, 2009).Gore’s objective is to make fossil fuelsuncompetitive by convincing governments topunishingly tax fossil fuel technologiesthrough the mechanisms of CT and CCS.Meantime, Gore and his fellow vultures willmake money at every stage of this
transformation. This is no time to be takenin with naive altruistic ideas about saving theplanet because the plan is to enrichthemselves on the average taxpayer’s dollar.
Perhaps the most astonishing feature of theGlobal Warming Hysteria is the fact that thehuge ball of energy in space, which supportsthe life and energy of the planet, has beenreduced to a bit player behind a trace gas
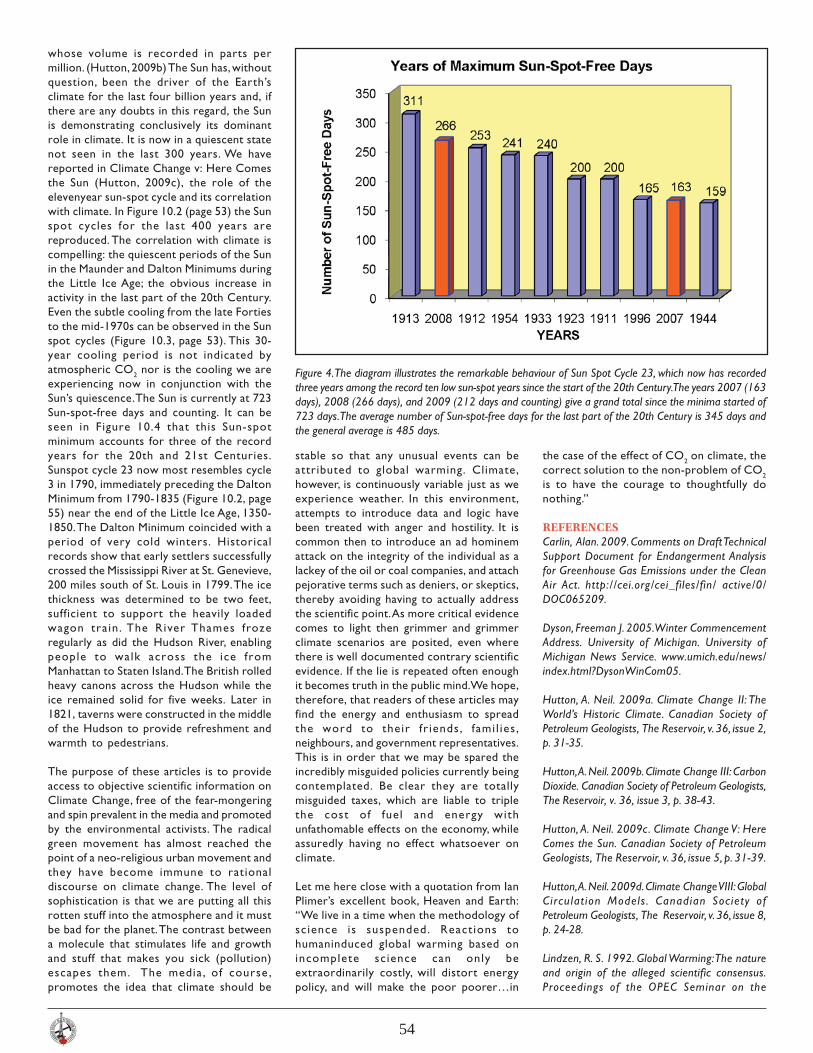
54
whose volume is recorded in parts permillion. (Hutton, 2009b) The Sun has, withoutquestion, been the driver of the Earth’sclimate for the last four billion years and, ifthere are any doubts in this regard, the Sunis demonstrating conclusively its dominantrole in climate. It is now in a quiescent statenot seen in the last 300 years. We havereported in Climate Change v: Here Comesthe Sun (Hutton, 2009c), the role of theelevenyear sun-spot cycle and its correlationwith climate. In Figure 10.2 (page 53) the Sunspot cycles for the last 400 years arereproduced. The correlation with climate iscompelling: the quiescent periods of the Sunin the Maunder and Dalton Minimums duringthe Little Ice Age; the obvious increase inactivity in the last part of the 20th Century.Even the subtle cooling from the late Fortiesto the mid-1970s can be observed in the Sunspot cycles (Figure 10.3, page 53). This 30-year cooling period is not indicated byatmospheric CO2 nor is the cooling we areexperiencing now in conjunction with theSun’s quiescence. The Sun is currently at 723Sun-spot-free days and counting. It can beseen in Figure 10.4 that this Sun-spotminimum accounts for three of the recordyears for the 20th and 21st Centuries.Sunspot cycle 23 now most resembles cycle3 in 1790, immediately preceding the DaltonMinimum from 1790-1835 (Figure 10.2, page55) near the end of the Little Ice Age, 1350-1850. The Dalton Minimum coincided with aperiod of very cold winters. Historicalrecords show that early settlers successfullycrossed the Mississippi River at St. Genevieve,200 miles south of St. Louis in 1799. The icethickness was determined to be two feet,sufficient to support the heavily loadedwagon train. The River Thames frozeregularly as did the Hudson River, enablingpeople to walk across the ice fromManhattan to Staten Island. The British rolledheavy canons across the Hudson while theice remained solid for five weeks. Later in1821, taverns were constructed in the middleof the Hudson to provide refreshment andwarmth to pedestrians.
The purpose of these articles is to provideaccess to objective scientific information onClimate Change, free of the fear-mongeringand spin prevalent in the media and promotedby the environmental activists. The radicalgreen movement has almost reached thepoint of a neo-religious urban movement andthey have become immune to rationaldiscourse on climate change. The level ofsophistication is that we are putting all thisrotten stuff into the atmosphere and it mustbe bad for the planet. The contrast betweena molecule that stimulates life and growthand stuff that makes you sick (pollution)escapes them. The media, of course ,promotes the idea that climate should be
stable so that any unusual events can beattributed to global warming. Climate,however, is continuously variable just as weexperience weather. In this environment,attempts to introduce data and logic havebeen treated with anger and hostility. It iscommon then to introduce an ad hominemattack on the integrity of the individual as alackey of the oil or coal companies, and attachpejorative terms such as deniers, or skeptics,thereby avoiding having to actually addressthe scientific point. As more critical evidencecomes to light then grimmer and grimmerclimate scenarios are posited, even wherethere is well documented contrary scientificevidence. If the lie is repeated often enoughit becomes truth in the public mind. We hope,therefore, that readers of these articles mayfind the energy and enthusiasm to spreadthe word to their fr iends, fami l ies ,neighbours, and government representatives.This is in order that we may be spared theincredibly misguided policies currently beingcontemplated. Be clear they are totallymisguided taxes, which are liable to triplethe cost of fuel and energy withunfathomable effects on the economy, whileassuredly having no effect whatsoever onclimate.
Let me here close with a quotation from IanPlimer’s excellent book, Heaven and Earth:“We live in a time when the methodology ofscience is suspended. React ions tohumaninduced global warming based onincomplete science can only beextraordinarily costly, will distort energypolicy, and will make the poor poorer…in
Figure 4. The diagram illustrates the remarkable behaviour of Sun Spot Cycle 23, which now has recordedthree years among the record ten low sun-spot years since the start of the 20th Century. The years 2007 (163days), 2008 (266 days), and 2009 (212 days and counting) give a grand total since the minima started of723 days. The average number of Sun-spot-free days for the last part of the 20th Century is 345 days andthe general average is 485 days.
the case of the effect of CO2 on climate, thecorrect solution to the non-problem of CO2
is to have the courage to thoughtfully donothing.”
REFERENCESCarlin, Alan. 2009. Comments on Draft TechnicalSupport Document for Endangerment Analysisfor Greenhouse Gas Emissions under the CleanAir Act. http://cei.org/cei_files/fin/ active/0/DOC065209.
Dyson, Freeman J. 2005. Winter CommencementAddress. University of Michigan. University ofMichigan News Service. www.umich.edu/news/index.html?DysonWinCom05.
Hutton, A. Neil. 2009a. Climate Change II: TheWorld’s Historic Climate. Canadian Society ofPetroleum Geologists, The Reservoir, v. 36, issue 2,p. 31-35.
Hutton, A. Neil. 2009b. Climate Change III: CarbonDioxide. Canadian Society of Petroleum Geologists,The Reservoir, v. 36, issue 3, p. 38-43.
Hutton, A. Neil. 2009c. Climate Change V: HereComes the Sun. Canadian Society of PetroleumGeologists, The Reservoir, v. 36, issue 5, p. 31-39.
Hutton, A. Neil. 2009d. Climate Change VIII: GlobalCirculat ion Models . Canadian Society ofPetroleum Geologists, The Reservoir, v. 36, issue 8,p. 24-28.
Lindzen, R. S. 1992. Global Warming: The natureand origin of the alleged scientific consensus.Proceedings of the OPEC Seminar on the

55
Environment, 13-15 April 1992.
Lorenz, Edward M. 1979. Does the Flap of aButterfly’s Wings in Brazil Set off a Tornado inTexas. American Association for the Advancementof Science, Annual Meeting. Dec. 29th 1979.
McIntyre Steve. 2007. Hansen then and Now,Climate Audit. www.climateaudit.org/?p=1175.
Orlowski, Andrew. 2009. Global Warming Ate MyData, We lost the numbers: CRU responds toFreedom of Information Requests. http://www. thereg i s te r . co .uk/2009/08/13/c ru_missing_data.
Orlowski, Andrew. 2009. Japanese Scientists havemade a dramatic break with the UN and Western-backed hypothesis of Climate Change. The Register,25th February. http://www. theregister.co.uk/2009/02/25/jstor_climate_ report_translation/.
Plimer, Ian. 2009. HEAVEN AND EARTH, globalwarming, the missing science. First published,Australia by Connor Court Publishing Pty. Ltd.,Ballan Victoria. Also by Taylor Trade Publishing,Rowman and Littlefield Publishing Group Inc .Lanham Maryland 20706.
Solomon, Laurence. 2009. Carbon Baron Gore,Climate Profiteers. National Post, Wednesday,August 26, 2009.
Tennekes, Hendrik. 1986. No Forecast is Completewithout a Forecast of Forecast Skill. EuropeanCentre for Medium Range Weather Forecastsw w w . s e p p . o r g / A r c h i v e / N e w S E P P /Climate%20models-Tennekes.htm.
Tennekes , Hendrik. 1992. Karl Popper andaccountability of Numerical Weather Forecasting.Weather v. 47 p. 343-346. http:// c limatescience.org/files/Popper.pdf.