climate cha nge: f or cings , f eedback s, a nd f or...
TRANSCRIPT

Climate Change:Forcings, Feedbacks, and Forecasts
Some of these slides are taken from the IPCC’s recently released Fourth Assessment.
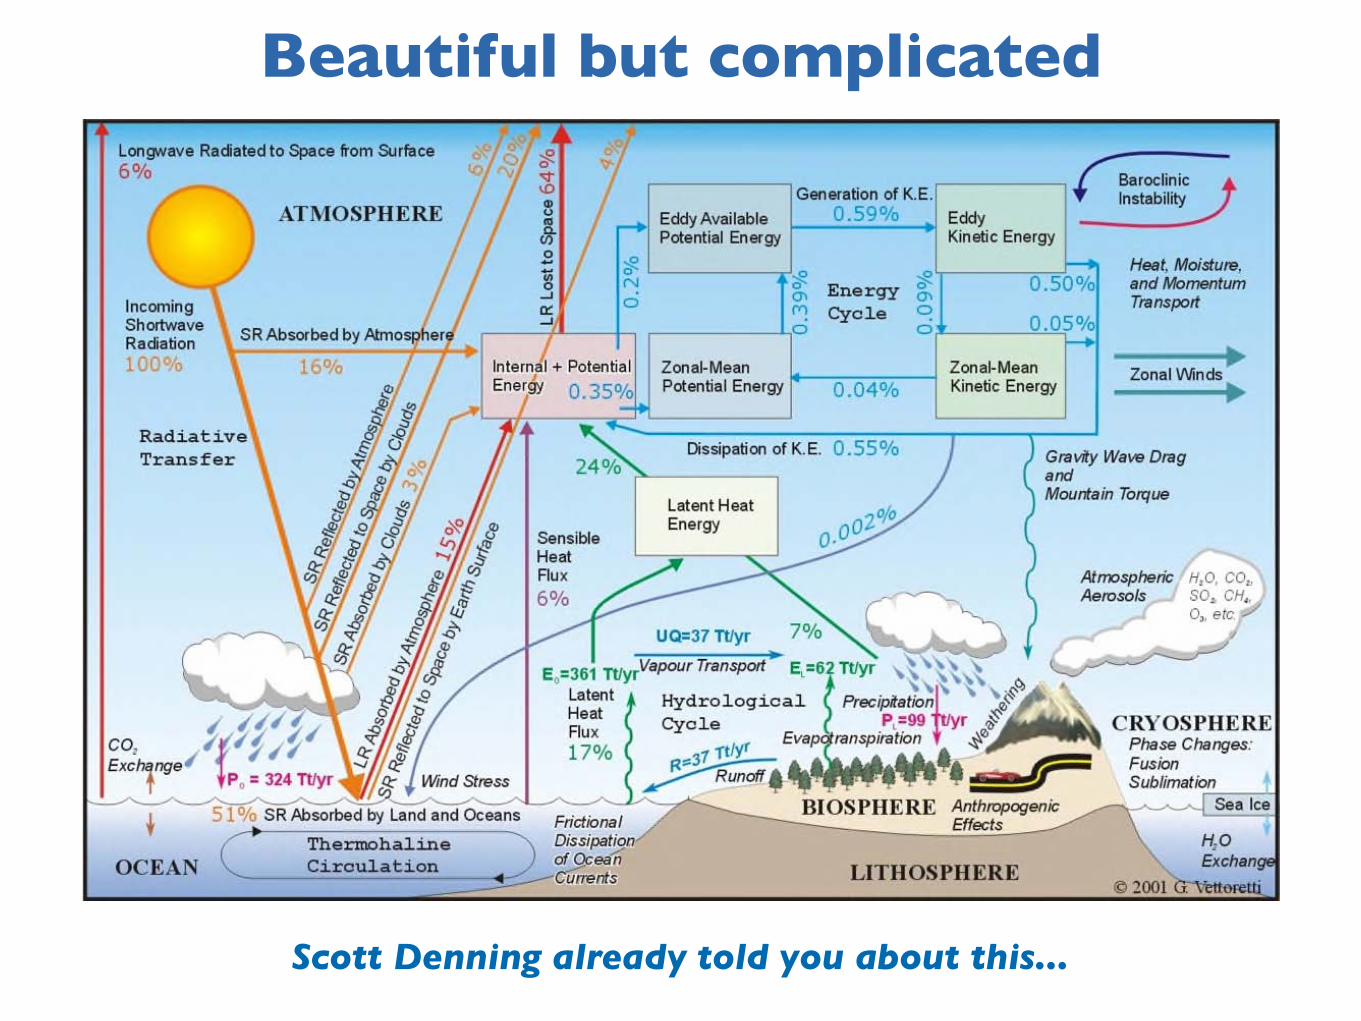
Beautiful but complicated
Scott Denning already told you about this...

Climate is what you expect.Weather is what you get.
So let’s start by asking:

Why can’t those turkeyspredict the weather?
Small errors in the initial conditions lead to large errors in forecasts.
This “sensitive dependence on initial conditions” limits the range of useful forecasts to about two weeks.
Limited predictability is a property of the atmosphere, and so cannot be eliminated even if we had a perfect forecast model.
“Dr. Chaos,” Ed Lorenz

Changes in the average weather are often “forced” by changing external influences, e.g.:
The day-night cycle
The seasonal cycle
Ice ages
Anthropogenic changes in the composition of the atmosphere
Climate change can be forced.
A long-range forecast:July 2008 will be warmer, in Fort Collins, than January 2008.
This will be a forced change.The change in the forcing is itself predictable.
The seasonal cycle
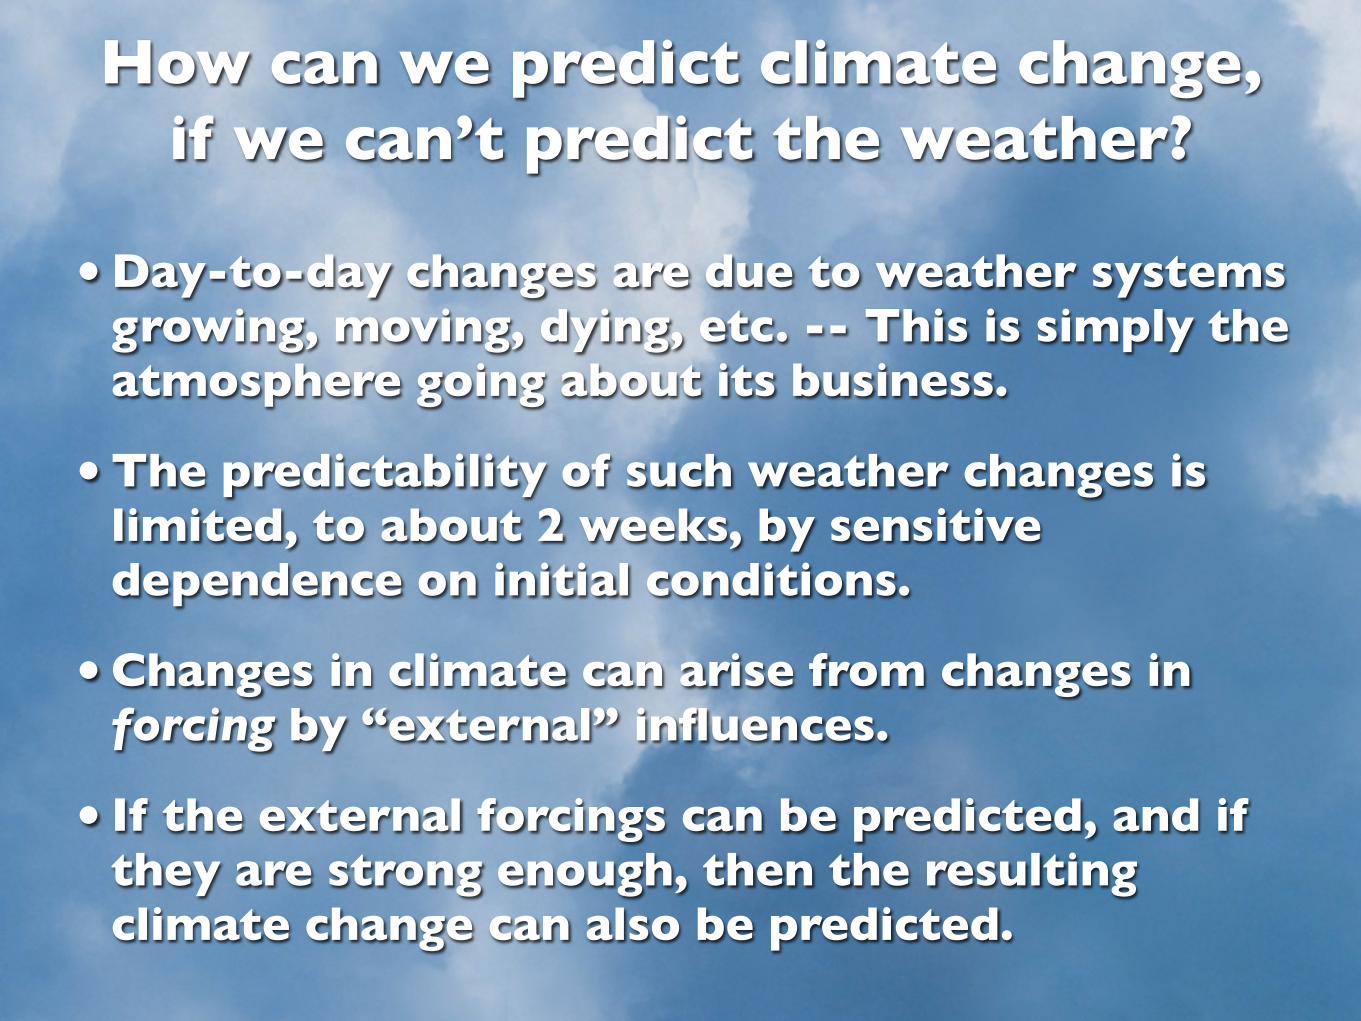
How can we predict climate change,if we can’t predict the weather?
•Day-to-day changes are due to weather systems growing, moving, dying, etc. -- This is simply the atmosphere going about its business.
•The predictability of such weather changes is limited, to about 2 weeks, by sensitive dependence on initial conditions.
•Changes in climate can arise from changes in forcing by “external” influences.
• If the external forcings can be predicted, and if they are strong enough, then the resulting climate change can also be predicted.

So, we need to talk about forcings.

Kinds of Forcings
•Anthropogenic changes in the gaseous composition of the atmosphere
•Anthropogenic changes in atmospheric aerosols
•Changes in land use
•Volcanic eruptions
•Changes in solar output
•Changes in the Earth’s orbital parameters (on very long time scales)


Here “radiative forcing” refers to the effects of a perturbation on the radiation at the top of the atmosphere.


Feedbacks
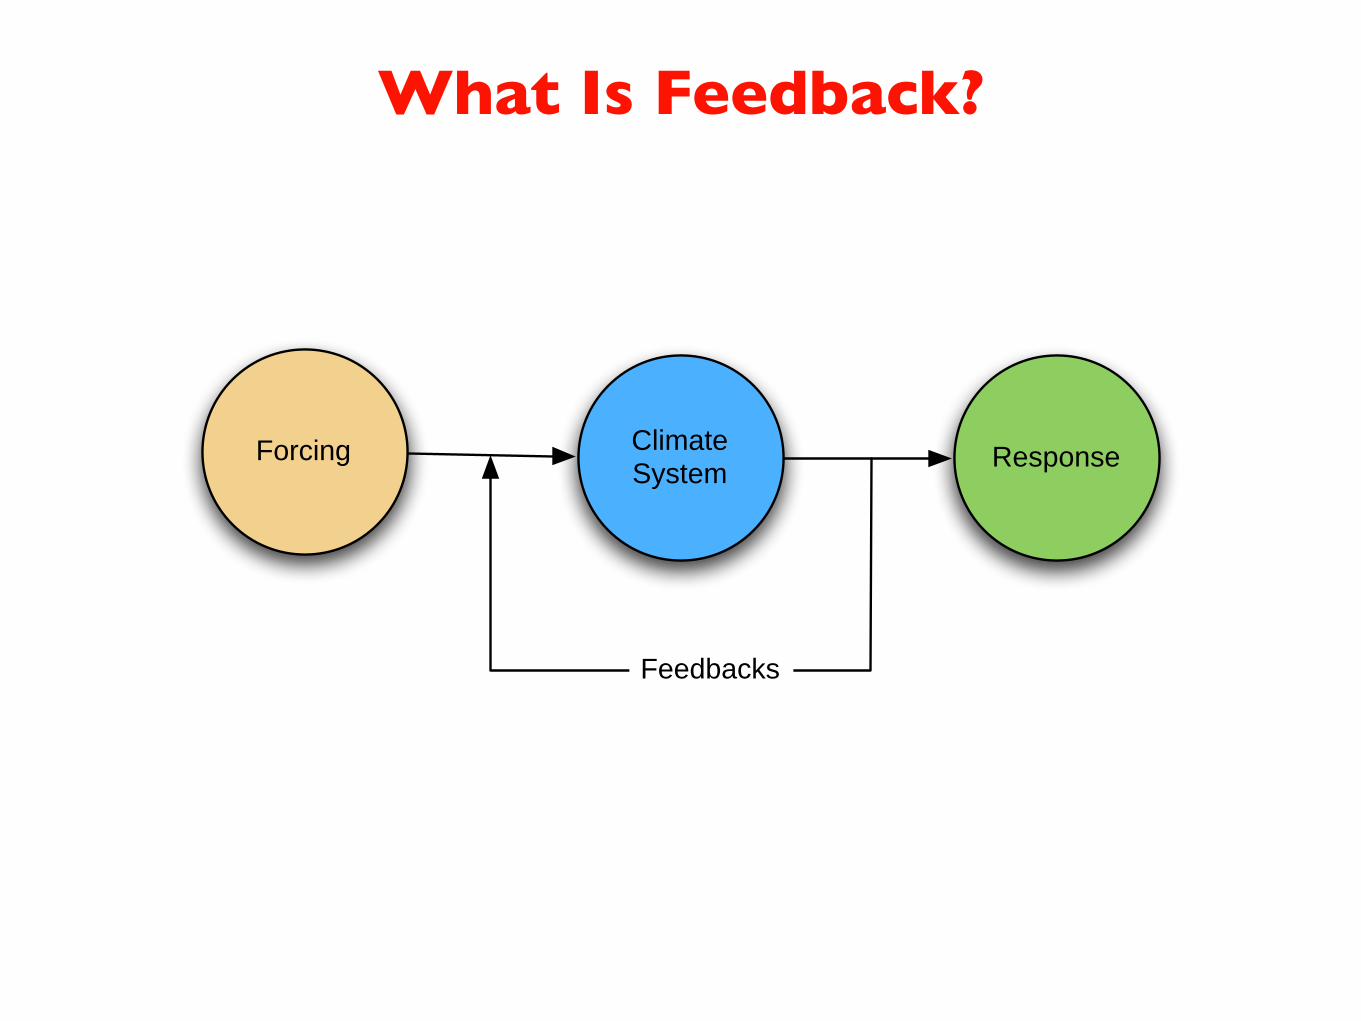
What Is Feedback?
Climate System
Forcing Response
Feedbacks

Kinds of Feedbacks
Albedo Feedback
Water vapor feedback
Lapse-rate feedback
Cloud feedback(s)
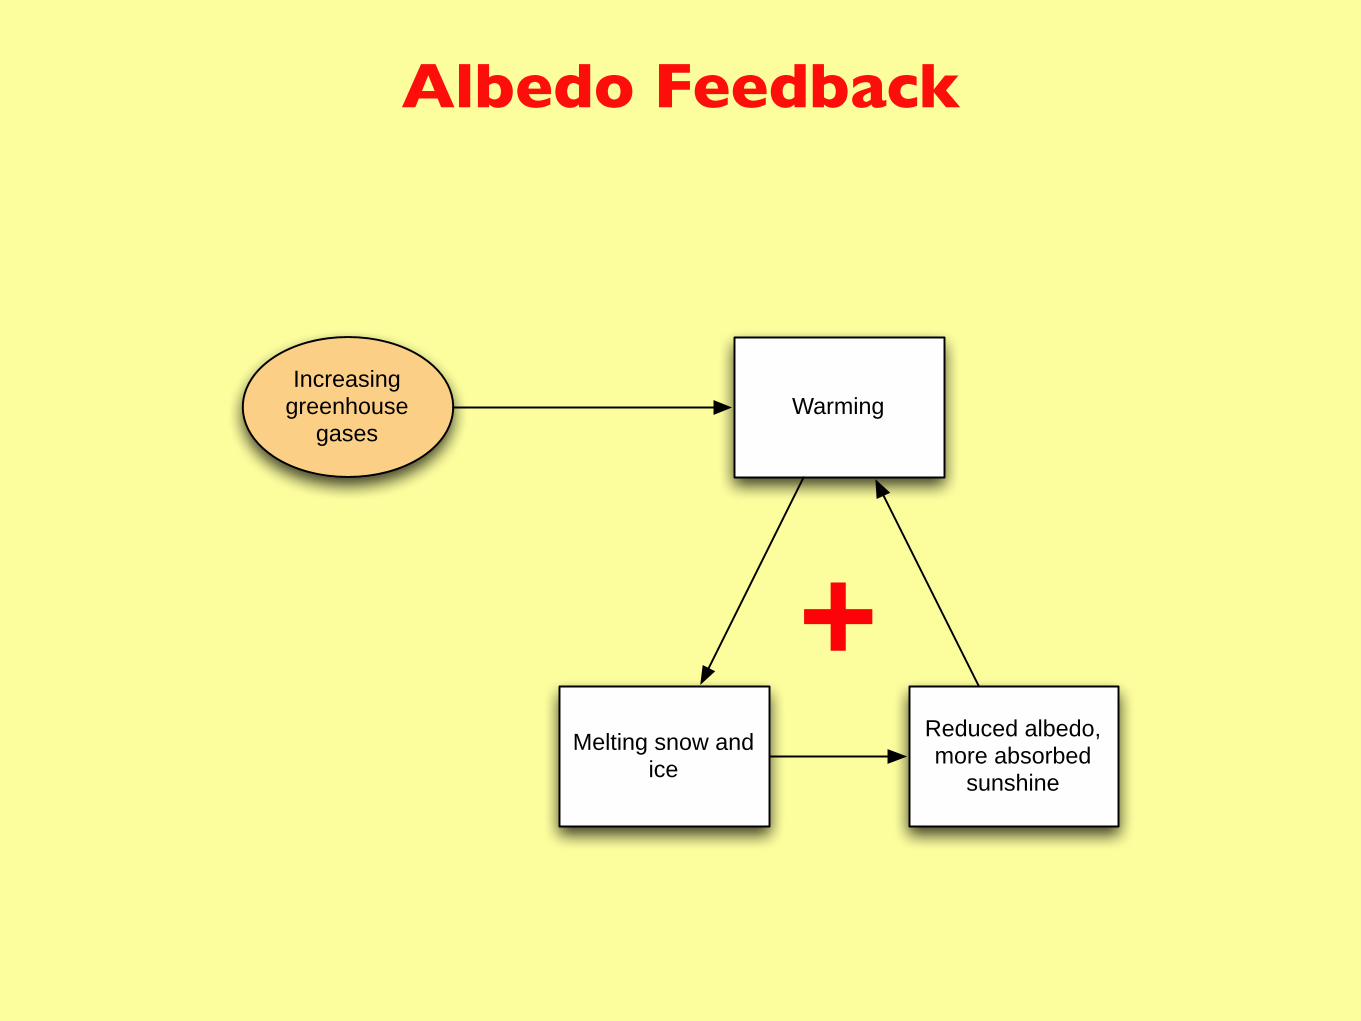
Albedo Feedback
Reduced albedo, more absorbed
sunshine
Warming
Melting snow and ice
Increasing greenhouse
gases
+

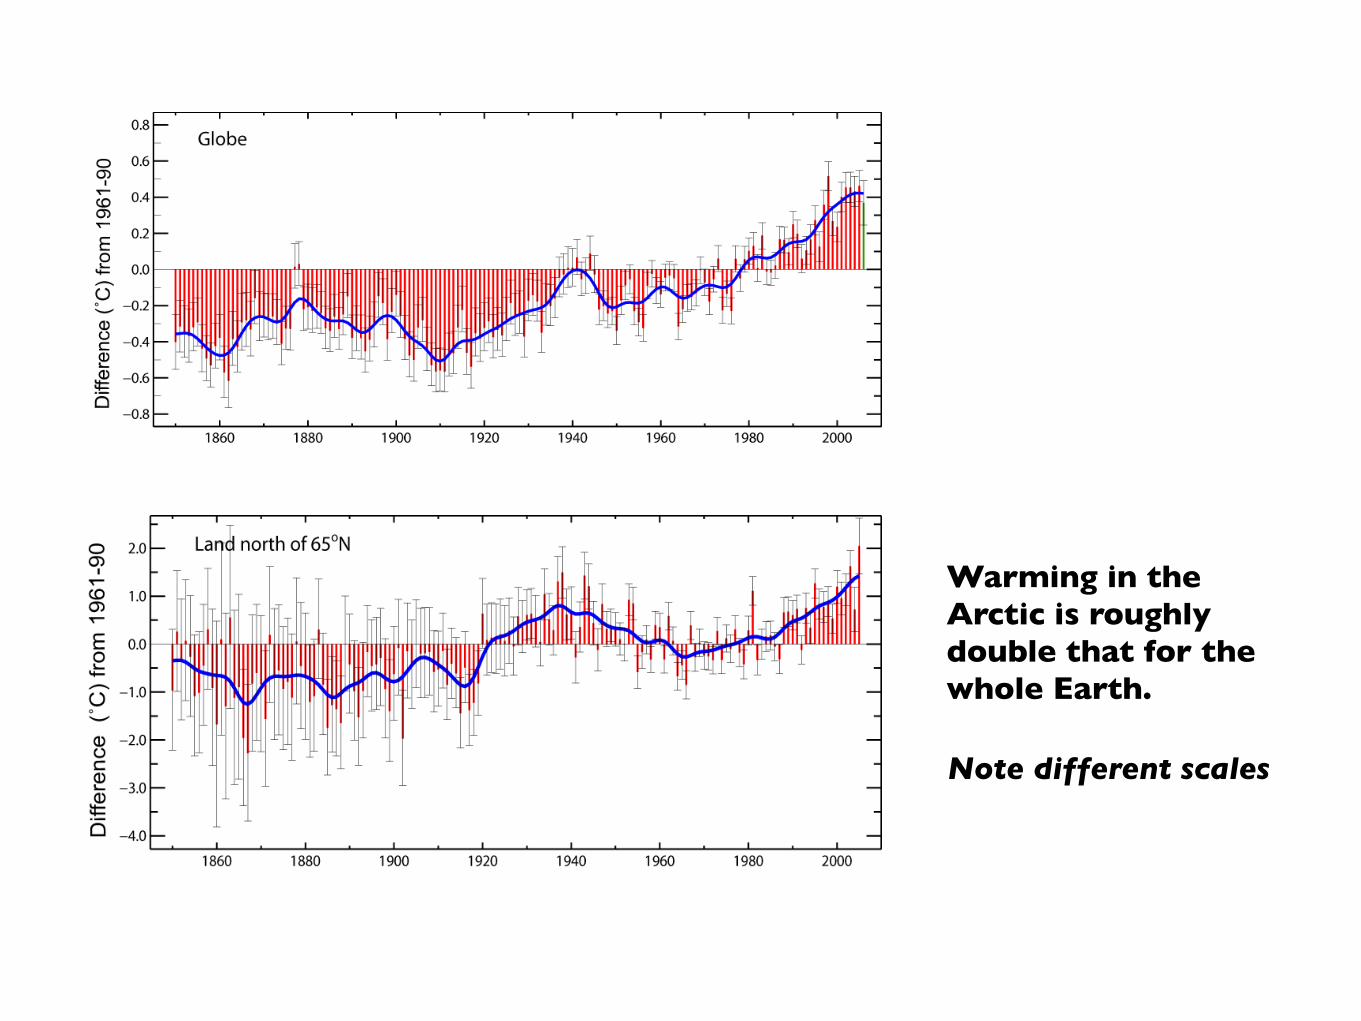
Warming in the Arctic is roughly double that for the whole Earth.
Note different scales

Water Vapor Feedback
Water-vapor greenhouse strengthens
Warming
Increased atmospheric water vapor
Increasing greenhouse
gases
+
As water vapor increases, precipitation and evaporation also increase.

Changes in Water Vapor
To produce the red curve, a global atmospheric model was forced with the observed sea-surface temperatures for the years shown.

What is the “lapse rate?”
Temperature
Height
−∂T∂z
The “lapse rate” is the rate at which temperature decreases upward.
In the future climate, the temperature is predicted to increase throughout the troposphere, but it increases more aloft than near the surface. The lapse rate is, therefore, said to decrease.

How the lapse rate can feed back:
Temperature
Height
−∂T∂z
Warmer air up high can radiate heat away to space more easily than warmer air near the ground.

Lapse-Rate Feedback
More cooling to space
Warming
Decreased lapse rate
Increasing greenhouse
gases
-

Cloud Feedback(s)
• Cloud amount
• Cloud top height
• Cloud optical properties

Low-Cloud Feedback
Less absorbed sunshine
Warming
More bright, low clouds
Increasing greenhouse
gases
-
Note: This feedback can be either positive or negative.

High-Cloud Feedback
Increased cloud greenhouse effect
Warming
More high cloud
Increasing greenhouse
gases
+
Note: This feedback can be either positive or negative.

So, let’s see what we’ve got...

Final Draft Chapter 8 IPCC WG1 Fourth Assessment Report
1
2 3 4 5 6 7 8 9
10 11 12 13
Figure 8.14. Comparison of GCM climate feedback parameters for water vapour (WV), cloud (C), surface
albedo (A), lapse rate (LR) and the combined water vapour + lapse rate (WV+LR) in units of W m–2 K–1.
"ALL" represents the sum of all feedbacks. Results are taken from Colman (2003a) (blue, black), Soden and
Held (2006) (red) and Winton (2006a) (green). Closed blue and open black symbols from Colman (2003a)
represent calculations determined using the partial radiative perturbation (PRP) and the radiative-convective
method (RCM) approaches respectively. Crosses represent the water vapour feedback computed for each
model from Soden and Held (2006) assuming no change in RH. Vertical bars depict the estimated
uncertainty in the calculation of the feedbacks from Soden and Held (2006).
Do Not Cite or Quote 8-114 Total pages: 19
Feedbacks in Real Climate Change Simulations

The positive feedbacks are stronger than the negative feedbacks.
The combined effect of all feedbacks is to increase the warming by about a factor of two.
The Bottom Line:

Forecasts

First, a reality check:Can we “predict” past changes?

The climate of the 20th century
However, these results are not completely convincing, because:
Many of the prescribed forcing components are uncertain,
The forcings have not been “standardized,” and
Inspection of the model results shows that model-sensitivity is inversely correlated with the strength of the forcing used.
The observed changes are shown by the black curves.
Results from about 20 models are shown in red (upper panel) and blue (lower panel).
Observations
All forcing
Solar+volcanic

The sky is falling.IPCC
Warming of ~3 K for doubling CO2
Rising sea level ~ 1 m in 21st centuryStronger stormsMore droughts
All based on simulations with complicated computer models.
But before we get to that...

Climate ModelingOn the Back of an Envelope

Warning:The next two slides have equations.

(1−α)Sπa2 = ε(σTS4 )4πa2
(1−α)S = 4ε(σTS4 )
0 = 4(Δε)(σTS4 )+ 4ε(4σTS
3ΔTS )
ΔTS = −TS
4Δεε
Assumptions: 1) Only CO2 is perturbed; 2) No feedbacks.
Increasing CO2 Perturbs the Earth’s Radiation Budget

Let’s put in some numbers:
ε(σTS4 ) = 240 W m−2
(Δε)(σTS4 ) = −4 W m−2
∴Δεε= −
4240
TS = 288 K
ΔTS = −TS
4Δεε
ΔTS = −288 K4
(− 4240
) =1.2 K
~2%
~0.5%

Lessons Learned
• We don’t need no stinking computer models!
• Feedbacks are important.

IPCC, Paris, Early 2007


Predicted Warming
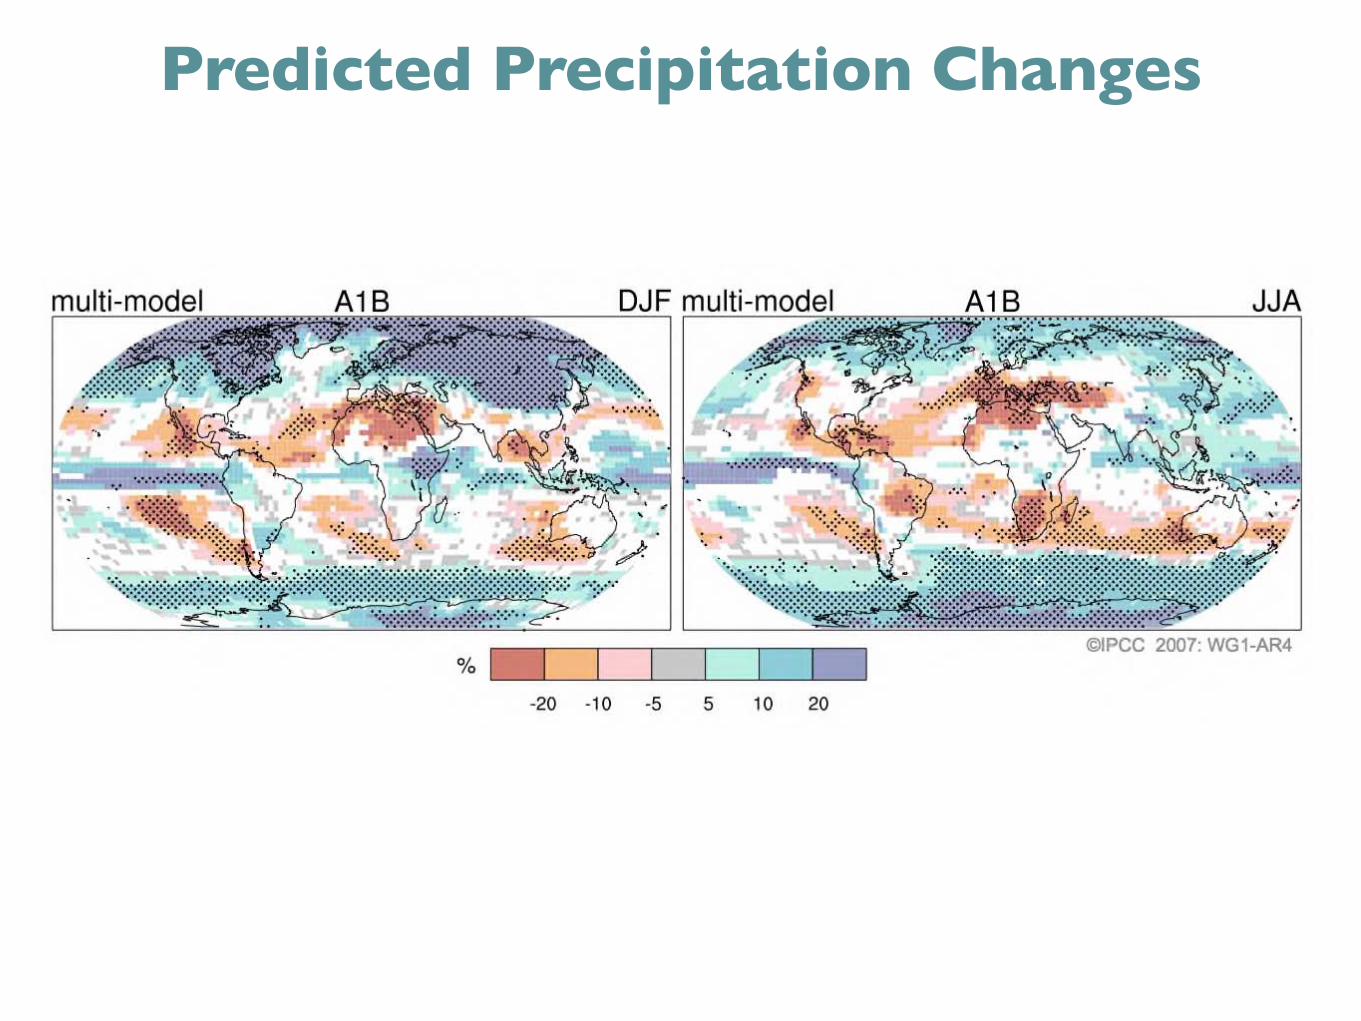
Predicted Precipitation Changes


Conclusions
• Long-term climate change can be predicted when it is due to predictable changes in external forcing.
• Feedbacks are expected to amplify the response to the forcing.
• A simple estimate of surface temperature change due to increasing CO2 (without feedbacks) can be made on the back of an envelope.
• Predictions for the 21st century show warming of the troposphere especially in the Arctic, an increase in precipitation extremes, a decrease in snow and ice cover, and an increase in sea level.

Recommended Reading
Climate Change 2007 - The Physical Science Basis: Working Group I Contribution to the Fourth Assessment Report of the IPCC
“Chaos: The Making of a New Science,” by James Gleick
“The Two-Mile Time Machine: Ice Cores, Abrupt Climate Change, and Our Future,” by Richard Alley