climate change adaptation strategy for the water …. cc water... · 2013-03-31 · proposed...
TRANSCRIPT
Joint Programme for Climate Change Risk Management in Egypt
Proposed CLIMATE CHA NGE ADAPTATION STRATEGY for the Ministry of Water Resources & Irrigation EGYPT (2013)
Filename;\MhmdNour\CC Final Submitted 12-Feb2103 AdptStrtgy .docx
Ministry of Water Resources and Irrigation
Climate Change Risk Management in Egypt
Proposed Climate Change Adaptation Strategy
for the
Ministry of Water Resources & Irrigation in Egypt
Prepared for UNESCO-Cairo Office
By
Dr. Mohamed M Nour El-Din
January 2013
Joint Programme for Climate Change Risk Management in Egypt
Proposed CLIMATE CHANGE ADAPTATION STRATEGY for the Ministry of Water Resources & Irrigation EGYPT (2013)
Filename;\MhmdNour\CC Final Submitted 12-Feb2103 AdptStrtgy .docx page ii
Ministry of Water Resources and Irrigation
Climate Change Risk Management in Egypt
Proposed Climate Change Adaptation Strategy
for the
Ministry of Water Resources & Irrigation in Egypt
Prepared for
UNESCO - Cairo
By: Mohamed M. Nour El-Din
January 2013

Joint Programme for Climate Change Risk Management in Egypt
Proposed CLIMATE CHANGE ADAPTATION STRATEGY for the Ministry of Water Resources & Irrigation EGYPT (2013)
Filename;\MhmdNour\CC Final Submitted 12-Feb2103 AdptStrtgy .docx page iii
Table of Contents page
1. Introduction 1 P A R T ONE 2.0 Egypt Overview 4 2.1 Geography 4 2.2 Population 6 2.3 Climate Profile 6 2.4 The Nile River 9
2.4.a Historical Observed Records of the Nile Stations 11 2.4.b Infrastructure Development in the Blue Nile 12 2.4.c Land and “Water” Grabbing 12 2.4.d Expected Impacts on Egypt's Water Resources 14
2.5 Groundwater 15
3.0Water Resources, Demands, Quality and Management in Egypt 16 3.1 Water Supply 16 3.2 Water Demands 17 3.3 Water Quality 19 3.4 Water Management in Egypt 21
3.4.a River Regulation, Infrastructures, and the High Aswan Dam 21 3.4.b Water Management in Egypt: Policies, Strategies, and Constraints 24
3.5 The Existing Iinstitutional and Organizational Climate Change Framework in Egypt 27
4.0 The Coastal Zones of Egypt 31 4.1 The Mediterranean Coast 31 4.2 The Red Sea Coast 33 4.3 The Northern Lakes 34 P A R T TWO 5.0 Climate Change Projections and Impacts on the Water Sector in Egypt 35 5.1 Projections and Impacts of Climate Change on the Nile Flows 36 5.2 Projections & Impacts of Climate Change on Water Demands 39 5.3 Projections of Sea Level Rise and Impacts on the Coastal Zones 41 5.4 Sea Water Intrusion in the Nile Delta 46 5.5 Climate Change Impacts on the Northern Lakes 46
6.0 Water Resources Management and Planning under Uncertainty 48 6.1 Assumptions used in developing the Water Budget Trends 50
6.2 The developed Water Budget Trends (2025, 2050, 2075 & 2100) 51 6.2.a Estimated trends at year 2025 51 6.2.b Estimated trends at year 2050 53 6.2.c Estimated trends at year 2075 55 6.2.d Estimated trends at year 2100 58
6.3 Vulnerability Assessment under Projected Drought and Wetting Scenarios 60
7.0 The Climate Change Adaptation Strategy 64 7.1 Identified General Adaptation Measures 64
7.1-a Review of adaptation measures for the water sector in Egypt 65 7.1-b Adaptation measures for the Coastal zones 66 7.1-c Adaptation measures for Sea Water Intrusion and Protection of the Northern Lakes 66
7.2 Specific Adaptation Measures 66 7.2-a Specific Adaptation Measures for Water Sector 67 7.2-b Specific Adaptation Measures for the Coastal Zones 70
7.3 Classification of the Adaptation Measures 71 7.4 The Proposed Adaptation Strategy 76 P A R T THREE 8.0 Mainstreaming the Climate Change Adaptation Strategy 82 8.1 Guidelines for Mainstreaming Climate Change Adaptation in the Water Sector 84
8.1.a STEP 1: Situational Analysis of the Policy and Legislative Framework 85 8.1.b STEP 2: Creating Enabling Environment to mainstream Adaptation into IWRM plans & Policies 90 8.1.c STEP 3: Planning and Policy Structures 93 8.1.d STEP 4: Develop Institutional Structures Conducive to Mainstreaming Climate Change into IWRM 94
8.1.e Mainstreaming climate change considerations into sectoral policies, plans, and programs through strategic assessment 94 8.2 Mainstreaming Climate Change Adaptation into the Egyptian Water Sector 95
Bibliography 97 Annexes Annex (A1) Population Projections and Distribution on Governorates Annex (A2) DHI Review on Climate Change Modeling and Projections of Future Nile Flows Annex (A3) Graphical presentation of Estimated Water Management Vulnerability Trends Annex (A4) Summary Review of Previous Adaptation Strategies in Egypt

Joint Programme for Climate Change Risk Management in Egypt
Proposed CLIMATE CHANGE ADAPTATION STRATEGY for the Ministry of Water Resources & Irrigation EGYPT (2013)
Filename;\MhmdNour\CC Final Submitted 12-Feb2103 AdptStrtgy .docx page iv
List of Tables page TABLE (1-1) Impacts of Climate Change on Water Resources in Various Sectors 2 TABLE (2.1-a)
Basic statistics of flow data at key stations on the Nile basin
11
TABLE (2.1-b) Decadal flow average (bcm/year) at key stations on the Nile 11 TABLE (2.1-c) Percentage of the flow of each station to flow of the Nile at Dongola station 12 TABLE (2-2) Proposed Hydropower Projects on the Blue Nile (Abbay-Ethiopia) 12 TABLE (2-3) The Nile Basin: Irrigation, irrigation potential & leased land - 14 TABLE (3.1)
Current Water Budget of Egypt (2010), and all Sources and Allocation/Usage
16
TABLE (4-1)
Length and percentage of protected shores to the total length of delta shores
33
TABLE (5-1) Sensitivity of Nile flow to uniform change of rainfall in Nile sub-basins 37 TABLE (5-2 ) Model-simulated flow of the Blue Nile at Diem (BCM) 38 TABLE (5-3) Summary of assumptions used in developing the water budget trends 39 TABLE (5-4) projected changes in crop production of some major crops in Egypt 40 TABLE (5-5 ) Projected Averaged direct & indirect impacts of climate change on water demands 41 TABLE (5-6) Temperature Change and Sea Level Rise According to B1 & A1FI Scenarios 43 TABLE (5-7) Vulnerable areas in the Nile Delta, under A1FI scenario, the case of protected lakes’ borders 43 TABLE (5-8) Physical & Socio-Economical Vulnerability to inundation due to SLR at 2030 & 2060 44 TABLE (5-9.a) Vulnerability and potential harm caused under SLR scenario (50cm) 45 TABLE (5-9.b) Vulnerability and potential harm caused under SLR scenario (100cm) 45 TABLE (6-1)
Projections for Nile Water Availability, Population and in Evapo-Transpiration
48
TABLE (6-2) the current water budget of 2010 as given in the water strategy of 2050. 49 TABLE (6-3) Adjusted Water budget 49 TABLE (6.4-a) Estimated trends at year 2025 under –ve Nile Flow 52 TABLE (6-4.b) Estimated trends at year 2025 under +ve Nile Flow 53 TABLE (6-5.a) Estimated trends at year 2050 under –ve Nile Flow 54 TABLE (6-5.b) Estimated trends at year 2050 under +ve Nile Flow 55 TABLE (6-6.a) Estimated trends at year 2075 under –ve Nile Flow 56 TABLE (6-6.b) Estimated trends at year 2075 under +ve Nile Flow 57 TABLE (6-7.a) Estimated trends at year 2100 under –ve Nile Flow 58 TABLE (6-7.b) Estimated trends at year 2100 under +ve Nile Flow 60 TABLE (6-8.a) Vulnerability Assessment for Water Sources and Demands under Projected Drying (Drought)
Water Budget Trends 62
TABLE (6-8.b) Vulnerability Assessment for Water Sources and Demands under Projected Wetting (Flooding) Water Budget Trends
63
TABLE (7-1)
Examples for types of decisions aiming at different time scales
65
TABLE (7-2) Classification of the adaptation measures 73-75 TABLE (7-3.a) Implementation Plan for the proposed CC Adaptation Measures (Risk-: Droughts & Water
Scarcity) 77
TABLE (7.3-b) Implementation Plan for the proposed CC Adaptation Measures (Risk-2: Increased Floods) 78 TABLE (7-3.c) Implementation Plan for the proposed CC Adaptation Measures (Risk-3: Higher Water
Consumption) 79
TABLE (7-3.d) Implementation Plan for the proposed CC Adaptation Measures (Risk-4: Sea Level Rise) 80 TABLE (7-4) Summary of climate change adaptation budget 81 TABLE (8-1)
Roles and Responsibilities of Stakeholders
89
TABLE (8-2) Institutional Functions for Adaptation 89 TABLE (8-3) Examples for Policy Instruments for Adaptation 90
Joint Programme for Climate Change Risk Management in Egypt
Proposed CLIMATE CHANGE ADAPTATION STRATEGY for the Ministry of Water Resources & Irrigation EGYPT (2013)
Filename;\MhmdNour\CC Final Submitted 12-Feb2103 AdptStrtgy .docx page v
List of Figures
page Figure (2.1) The Nile Valley and Nile Delta Maps showing main water control structures 5 Figure (2-2) Average annual temperatures (°C) in Egypt 7 Figure (2-3) Average annual precipitation in Egypt (mm/yr) 8 Figure (2-4) Monthly average potential evapo- transpiration (mm/day) in the 8 agro-climatic regions 9
Figure (2-5) Map of the Nile Basin showing the drainage network, basin states, and major dams 10 Figure (2-6) Leased out lands by foreign investors in the Nile Basin Countries 13 Figure (2-7) the major aquifer system in Egypt 15 Figure (3.1) Main Structures and Typical Water Distribution in the Nile System 22 Figure (3.2) Average monthly flow of the Nile at Aswan before & after construction of HAD 23
Figure (4-1) Protected and unprotected areas along the shoreline of the Nile Delta 32 Figure (5-1) Scenarios, data, models and adaptation strategies 35
Figure (7-1) The different types of adaptation measures (the safety chain) 64
Figure (7-2) The Dynamic nature of climate change adaptation strategies 76 Figure (7-3) The proposed Climate Change adaptation budget until 2050 82 Figure (7-4a) The estimated allocated climate change adaptation budgets for the defined 4 risks 82 Figure (7-4b) Percentage of the estimated climate change adaptation budgets for the defined 4 risks 83
Figure (8-1) Flow Diagram of mainstreaming adaptation into IWRM 86 Figure (8-2) The adaptation processs 95

Joint Programme for Climate Change Risk Management in Egypt
Proposed CLIMATE CHANGE ADAPTATION STRATEGY for the Ministry of Water Resources & Irrigation EGYPT (2013)
Filename;\MhmdNour\CC Final Submitted 12-Feb2103 AdptStrtgy .docx page vi
List of Abbreviations
APMAU Adaptation Policy Monitoring and Assessment Unit ARCA Alexandria research Center for Adaptation BOD Biological Oxygen Demand CDCC Central Department for Climate Change under MSEA. CCU Climate Change Unit CDM Clean Development Mechanism CIF Climate Investment Funds CoRI Coastal Research Institute EEAA Egyptian Environmental Affairs Authority ECRI Environment & Climate Research Institute ESPA Egyptian Shore Protection Authority FAO Food & Agricultural Organization GRED Grand Renascence Ethiopian Dam GWH Giga Watt Hour GCMs Global Climate Models HAD High Aswan Dam IWRM Integrated Water Management IPCC Inter-Governmental Panel on Climate Change ICZM Integrated Coastal Zone Management LDCF Least Developed Countries Fund MoALR Ministry of Agriculture and Land Reclamation MoH Ministry of Health MoSEA Ministry of State for Environmental Affairs MoTI Ministry of Trade and Industry MEE Ministry of electricity and energy MoT Ministry of Transportation MoP Ministry of planning MSEA Ministry of State for Environmental Affairs MWRI Ministry of Water Resources and Irrigation NWRC National Water Research Center NWRP National Water Resources Plan NSACC Egypt’s National Strategy for Adaptation to Climate Change NARSSS National Authority of Remote Sensing and Space Science NOAA National Oceanic and Atmospheric Administration NFC Nile Forecast Center NEEDS National Environmental, Economic and Development Study for Climate Change NAC National Adaptive Capacity RCMs Regional Climate Models RIGW Research Institute of Ground Water SLR Sea Level Rise SNC Second National Communication Report SEC Supreme Energy Council SPOT French Earth Observation Satellites SPA Strategic Priority on Adaptation SCCF Special Climate Change Fund TDS Total Dissolved Salts UNFCCC United Nations Framework Convention on Climate Change (WMRI-NWRC) Water Management Research Institute of the National Water Research Center WUOs Water Users Organizations UNESCO United Nations Education and Science Organization UNDP United Nations Development Program UNEP United Nations Environmental Program

Joint Programme for Climate Change Risk Management in Egypt
Proposed CLIMATE CHANGE ADAPTATION STRATEGY for the Ministry of Water Resources & Irrigation EGYPT (2013)
Filename;\MhmdNour\CC Final Submitted 12-Feb2103 AdptStrtgy .docx page vii
Proposed Climate Change Adaptation Strategy for the Ministry of Water Resources & Irrigation in EGYPT
Executive Summary Egypt as an arid country relying on the Nile River which provides 95% of its water resources is suffering water stress due to the limited supplies and growing population, and increased competition on water from the upper Nile basin countries. The uncertain climate change impacts on the Nile flow add another challenge for water management in Egypt. Besides, the projected high temperature would increase the local water demands especially on the agricultural sector. In addition to that, the coastal zones are severely vulnerable to the threats of sea level rise. It is the national level that the most important decisions need to be made, and adaptation strategies developed. This report presents an adaptation strategy for the water sector in Egypt under the foreseen changes affecting water resources management and climatic conditions. The report is divided into 3 main parts; the first part describes the physical setting of the country in terms of geography, population, climate profile, the Nile River, and the coastal zones. Then it presents the characteristics of the water sector in terms of resources, demands, quality, and water management including policies, strategies and constraints. The second part focuses on climate change projections and impacts on water supplies represented by the Nile flow regime, the demands from different sectors, and the coastal zones. It reviewed and discussed the Nile flow predictions and its associated uncertainty by different models and scenarios, and then defined or assumed a range for the extreme wetting and drying future predictions up to 2100. This assumption was utilized to develop two sets of future water budget trends (wetting and drying) at each of the years 2025, 2050, 2075, and 2100. These water budget trends enabled assessing the volumes of water required to balance the future shortage in water supplies under the expected demands. Consequently, we could estimate some adaptation measures in terms of timing and quantities needed from different sources (conventional and non-conventional). This also enabled assessing the vulnerability of water allocation to different sectors under both the drying and wetting scenarios. This part also included a review of the previous national climate change water adaptation strategies which enabled defining 4 main risks that are induced by climate change in Egypt. These risks are drought and water scarcity (high risk), increased floods (low risk), high water consumption (high risk), and sea level rise (high risk). Besides, the review of other international adaptation strategies and feedback from the meetings and discussions held with the officials of the ministry of water resources and irrigation lead to further defining the consequences of these risks as well as general and specific adaptation measures. These measures were classified according to several criteria which resulted in formulating the proposed climate change adaptation strategy. The adaptation strategy includes several infrastructural projects as well as technical and soft interventions, where most of them are either no-regret or low-regret. Examples of the proposed measures are: desalination of brackish and sea water, increased ground water abstraction that will require extensive monitoring and modeling studies to evaluate its sustainability and vulnerability, water harvesting projects from rainfall and flash floods, water recycling from agricultural drainage water and treated waste water, modernizing water control and irrigation systems, upgrade municipal infrastructures, regional cooperation, sea water agriculture, in addition to capacity building, awareness raising, participatory management, scientific research and technology development. It also includes other measures to safeguard coastal zones against seal level rise and apply integrated coastal zone management concepts. The total estimated budget for implementing this strategy is about 180 billion LE until 2050 (unequally distributed over three-5 years plans and two-10 years plans). The estimated budget allocated for adaptation measures of risk 1 (droughts and water scarcity) constitutes about 55% of the total budget, while the budget allocated for risk 2 (increased floods) constitutes about 5% of the total adaptation budget. The budgets allocated for adaptation to risk 3 (higher water consumption) and risk

Joint Programme for Climate Change Risk Management in Egypt
Proposed CLIMATE CHANGE ADAPTATION STRATEGY for the Ministry of Water Resources & Irrigation EGYPT (2013)
Filename;\MhmdNour\CC Final Submitted 12-Feb2103 AdptStrtgy .docx page viii
4 (sea level rise) are almost equal and constitute about 20% of the total budget. In fact, since, most of the measures used in formulating this strategy are of no-regret or low-regret nature, the allocated budget would serve achieving the targeted sustainable development as well as adaptation for the future climate change impacts. It is to be emphasized that, adaptation strategies are of dynamic nature and always subject to updating according to the acquired knowledge, advances in technology, and signals regarding future predictions. This proposed strategy is not an exception, and should be regularly updated. In addition to that adaptation should not be understood as simply implementing the correct technology or practice. It should be part of a coherent, inter-sectoral strategy to ensure sustainable water resources development. The third part of this report is concerned by mainstreaming climate change adaptation into national development plans, which is an iterative process to be integrated into policy making, financing, implementation and monitoring processes at national, sectoral and sub-national level. Based on the existing institutional and organizational climate change framework in Egypt and its gaps, this part presented guidelines for mainstreaming climate change adaptations into the national development plans. The implementation of these guidelines at the Egyptian national level and ministerial levels requires legal, financial and institutional setup, in addition to high level and strong political support.

Joint Programme for Climate Change Risk Management in Egypt
Proposed CLIMATE CHA NGE ADAPTATION STRATEGY for the Ministry of Water Resources & Irrigation EGYPT (2013)
Filename;\MhmdNour\CC Final Submitted 12-Feb2103 AdptStrtgy .docx
1. Introduction It is a scientifically proven fact that the earth will face increased temperatures and changes in precipitation in the coming decades. In the last 100 years the global climate has gotten 0.5°C warmer due to greenhouse gas emissions partially caused by human activities. Climate models envisage a temperature increase between 1.4° and 5.8°C in the next hundred years unless measures are taken to critically reduce emissions. These changes will render the globe’s hydrological cycle unstable to a great extent, will cause bigger changes in precipitation and water flow and will increase the intensity of extreme hydrological events. The Fourth Assessment Report (2007) of the Inter-governmental Panel on Climate Change (IPCC) identified Africa as one of the most vulnerable regions to climate changes. It also identified the water sector as the most vulnerable. The extreme water stress and related conflict-risk are likely to affect the Nile River Basin. Current findings indicated that most of northern and southern Africa will be water stressed and the risk of water related conflict is a real one. On the contrary, eastern, central and western Africa is projected to receive heavy rainfall resulting in increased flooding. Therefore, adequate and timely action to adapt to climate change in the water sector is of crucial importance for the riparian countries of the Nile Basin and for Africa in general. Climate change is likely to increase the stress on currently stressed resources, especially in the developing world. Studies have shown that most systems are sensitive to both of the magnitude and the rate of climate change (e.g. Gleick, 1998). However, the vulnerability of a system to the expected change depends on economic strength and existing infrastructure (IPCC, 1998) as well as overall country resilience to cope with different risks. Most developing countries, such as Egypt, are generally more vulnerable and less able to adapt.
In order to reduce the expected impacts of climate change, it is necessary to both reduce (mitigate) emissions of heat-trapping pollution and build resilience (adapt) to the impacts of climate change. However, even with strong programs to reduce greenhouse gas emissions (which proved to be a very difficult process), the effects of climate change will persist due to the longevity of certain greenhouse gases in the atmosphere and the absorption of heat by the oceans. Therefore, adaptation has a major role to play in reducing the impacts of climate change on people, businesses and society at large.
Climate change adaptation means adjusting to a changing climate to reduce the negative impacts already occurring and taking advantage of new opportunities. In general, developing climate change adaptation plans and strategies will help avoid disruptions to governmental operations and allow to design and implement programs that are capable of achieving their missions across a range of future climate conditions. Although the onset of more significant impacts is likely many years away, this is not a justification for inaction. Instead, it calls for effective planning now while good options still exist. The longer communities wait, the greater the cost of the impacts and the cost to react to those impacts. Climate change adaptation strategies are vital for a country like Egypt, especially in the water sector which affects; in one way or another, all other sectors. The following table summarizes the relation between climate change impacts on the water sector and agriculture, health, industry, energy, education, and tourism sectors.
Egypt is located in a semi-arid zone and its climate is characterized by hot dry summers, moderate winters with very little rainfall. Egypt relies on the Nile River as its main and almost exclusive resource of fresh water to meet the increasing demands of agricultural, industrial, and domestic sectors. With about 95% of the population (84 millions in 2012) living along the Nile Delta, any changes in water supply due to climate change; with the certainty of increased demographic pressure, would pose a serious risk to the whole country. In addition, sea level rise (SLR) threatens settlements and agriculture in the Nile Delta as well as in the Red Sea. Besides, higher temperatures alone would evaporate more water, increase the need for water supplies, create more heat stress, exacerbate already high levels of air pollution, and may drive away tourists.

Joint Programme for Climate Change Risk Management in Egypt
Proposed CLIMATE CHANGE ADAPTATION STRATEGY for the Ministry of Water Resources & Irrigation EGYPT (2013)
Filename;\MhmdNour\CC Final Submitted 12-Feb2103 AdptStrtgy .docx page 2
Table (1-1) Impacts of Climate Change on Water Resources in Various Sectors
Source: (TearFund, 2010)
Impacts Sector - Drought-affected areas are likely to increase and extreme precipitation events, which are very likely to increase in frequency and intensity, will increase flood risk.
- Higher water temperatures, increased precipitation intensity and longer periods of low flows exacerbate many forms of water pollution, with impacts on ecosystems, human health, and water System reliability and operating costs.
- Climate change reduces the predictability of water availability and increases the likelihood of Damage and disruption to drinking water and sanitation infrastructure. Current water management practices are very likely to be inadequate to reduce the negative impacts of climate change on water supply reliability, flood risk, health, energy and aquatic ecosystems. With less runoff and water for sewage treatment, the effectiveness of sewage treatment may be reduced.
WATER RESOURCES MANAGEMENT AND WATER SUPPLY & SANITATION
- An increased frequency of droughts and floods negatively affects crop yields and livestock. Impacts of climate change on irrigation water requirements may be great, with the potential for higher water needs.
- Sea-level rise, reduced recharge rates and higher evaporation rates will extend areas of salinisation of groundwater and estuaries, resulting in a decrease in freshwater availability. This will affect crop yields and ultimately the type of crops cultivated (as a shift to more drought-resistant varieties may be necessary). Added to this, water sources used for irrigation are likely to become more saline, and this will increase salt concentrations of groundwater.
AGRICULTURE
- Infrastructure, such as urban drinking water supply and sanitation, is vulnerable to sea-level rise and reduced regional precipitation, especially in coastal areas. Projected increases in extreme precipitation events have important implications for infrastructure: design of storm drainage, road culverts and bridges, levees and flood control works, including the sizing of flood control detention reservoirs.
INDUSTRY
- In some populations, climate change is expected to exacerbate problems of access to (safe) water at the household level, thus increasing the negative health impacts of drinking unsafe water. An increase in food-insecurity due to the impact of climate change on crop yields will also have negative health impacts. Flooded sanitation facilities can result in distribution of human excreta across neighborhoods and communities, with clear health impacts. Habitats may change, which consequently alters the spread of vector-borne diseases such as dengue fever and malaria, as mosquitoes spread to new areas.
HEALTH
- In some rural areas, greater distances walked to collect water due to a lack of availability and quality more locally mean children have less time at school, particularly girls who are most commonly required to undertake this task.
EDUCATION
- There will be impacts on existing and planned hydropower due to changes in water availability and flow, damage to infrastructure due to flooding, and reduced potential from increased siltation. This is especially valid for those countries, which receives most of their renewable water resources across their borders. This is compounded by water scarcity in Arab region, raising regional concerns about shared water resources and its implications on the energy system. The significant amounts of water that are needed to cool thermal power facilities make them vulnerable to fluctuations in water supplies.
- Oil refining is also a large water consumer that is affected by water shortage. Water demand in oil refineries can rise as a result of high temperatures & use in cooling units.
- North Africa’s countries have been identified as well placed to provide huge amount of solar electricity using CSP technology enough to meet the region’s electricity demand as well as Europe's. Climate-induced water scarcity would severely impact these plans.
- The Energy-water-climate nexus should be paid special attention in the region.
ENERGY
- Tourism sectors demanded a reliable water supply. Increasing tourism will also increase demand on wastewater treatment, increase the demand for safe and high-value agricultural products, and encourage recreational uses of water. Thus climate induced water shortages would definitely severely affect tourism activities.
TOURISM

Joint Programme for Climate Change Risk Management in Egypt
Proposed CLIMATE CHANGE ADAPTATION STRATEGY for the Ministry of Water Resources & Irrigation EGYPT (2013)
Filename;\MhmdNour\CC Final Submitted 12-Feb2103 AdptStrtgy .docx page 3
Several studies showed that the Nile is very sensitive to temperature and precipitation changes (e.g. Conway and Hulme; 1993 and Gleick; 1991) mainly because of its low runoff/rainfall ratio (4%) (IPCC; 1998). Being the most downstream country on the Nile, Egypt is affected by climate change impacts; not only within its borders, but also within the whole Nile basin, El-Raey et al. (1995) identified water resources, coastal zones and agricultural resources as the three most vulnerable sectors to climate change in Egypt.
This report aims at dealing with the Egyptian water-related risks and uncertainties which are critical for adapting the water sector to reduce the vulnerability of societies and people to the effects of this increased variability and change. The report is divided into three main parts; the first one is concerned with the physical setting of the country. It describes the geography, the current and projected population, the climate profile, the Nile River, its water resources, water demands, water balance, the current strategies of water resources and its management. It also describes the Mediterranean and Red sea coastal zones.
The second part starts with the climate change projections and impacts on the water sector and coastal zones in Egypt. Then it introduces an approach for including adaptation measures into water resources planning and assessing its vulnerability to the uncertain expected impacts of climate change. This approach enabled quantitative estimation of trends of adaptation measures for balancing future water budget under the uncertainty of climate change predictions and impacts. Part two also includes the required adaptation measures to protect the coastal zones against risks of sea level rise. This part classified the climate change risks into 4 ones: droughts and scarcity, increased demands, flooding, and sea level rise. The consequences of each of these risks are addressed and quantified under the proposed adaptation strategy.
The third part is concerned by mainstreaming the climate change adaptation strategy in order to set up a road map for implementing and continuously updating the proposed strategy. Chapter 8 presents a review of the current situation of the existing climate change framework in Egypt and guidelines for mainstreaming the climate change adaptation strategy.

Joint Programme for Climate Change Risk Management in Egypt
Proposed CLIMATE CHANGE ADAPTATION STRATEGY for the Ministry of Water Resources & Irrigation EGYPT (2013)
Filename;\MhmdNour\CC Final Submitted 12-Feb2103 AdptStrtgy .docx page 4
P A R T ONE
2.0 Egypt Overview This part gives a brief overview of the physical setting of the country and the current situation of different parameters that affect the Egyptian water resources management system. This overview briefly presents the geography, current and projected population, climate profile, and the Nile River. All these elements will affect or will be affected by climate change which will impact the Egyptian water resources and its vulnerability. 2.1 Geography Egypt covers an area of about one million square kilometers, and is located between 22° to 32° North and 24° to 37° East. Most of the country lies within the wide band of desert that stretches eastwards from Africa's Atlantic Coast across the continent and into southwest Asia. The Nile Valley and Delta; the most extensive oasis on earth, was created by the sediments and deposits of the Nile along thousands of years until the construction of the High Aswan Dam in 1968. Only 35,000 km2 of the total land area is cultivated and permanently settled. Egypt's geological history has produced four major physical region: the Nile Valley and the Nile Delta, the Western Desert, the Eastern Desert , and Sinai Peninsula. The Nile Valley and Nile Delta are the most important regions, being the country's only cultivable regions supporting about 95% of the population. The Nile valley extends approximately 900 km from Aswan to the outskirts of Cairo. The Nile Valley is also known as Upper Egypt, while the Nile Delta region is known as Lower Egypt. Steep rocky cliffs rise along the banks of the Nile in some stretches, while other areas along the Nile are flat, with space for agricultural production. The Nile delta consists of flat, low-lying areas, where most areas are used for agriculture. It is about 200 km from south to North, and the coastline is about 300 km long, with an area of about 25,000 km². It is considered among the most densely populated agricultural areas in the world. It contains 10 governorates within which there are about 25 large cities, and 4 brackish lagoons or lakes. The delta has been formed through annual supply of nutrients and sediment deposits for thousands of years by the Nile, forming a topsoil of about 20 meters in depth over the original shallow sea bed. Intensive farming has been going on in the delta for 5,000 to 6,000 years. With the construction of the High Aswan Dam, the delta no longer receives nutrients and sediments, and heavy fertilization is used instead. In addition to that the outer edges of the delta are eroding, in some places as much as 90-100 meters a year. Besides, some coastal lagoons have seen increasing salinity levels. Most of the Nile delta is used for agriculture, where perennial irrigation allows two or three crops a year. Industry is another important activity distributed over the whole area. An intricate system of irrigation canals provides water to the intensive agriculture taking place in the Delta. Figure (2-1) presents an overview of the Nile valley and Delta where the irrigation network and main structures are pointed out. The irrigation and drainage system is complicated, and there is a large portion of the agricultural drainage water is re-used to supplement shortage of the fresh water especially in the low reaches of the canals. Water quality in the irrigation and drainage canals are deteriorating as we move downstream due to the increased pollution load form the heavy agricultural activities and high population density. The Egyptian coastlines stretch for more than 3,500 km along the Mediterranean Sea, the Red Sea and south Sinai. The Northern coastal zone of Egypt is about 1200 km long which was developed mainly for recreational tourism. The Red Sea and South Sinai coasts are international tourism zones, with diving being the main activity. In addition to increased tourism activities, a move towards building new industrial complexes is in progress in the northern and eastern coasts. The coastal zones of Egypt

Joint Programme for Climate Change Risk Management in Egypt
Proposed CLIMATE CHANGE ADAPTATION STRATEGY for the Ministry of Water Resources & Irrigation EGYPT (2013)
Filename;\MhmdNour\CC Final Submitted 12-Feb2103 AdptStrtgy .docx page 5
suffer from a number of serious problems including: unplanned development, land subsidence, excessive erosion rates, water logging, salt water intrusion, soil salinization and ecosystem degradation. The Nile delta coast, hosts a number of highly populated cities such as Alexandria, Port-Said, Rosetta, and Damietta. An international road connecting the most eastern and western towns in Egypt was constructed parallel to the Northern coast. The wetlands of the Nile delta constitute about 25% of the total area of wetlands in the Mediterranean region, and produce about 60% of the fish catch of Egypt. The Mediterranean shoreline is most vulnerable to sea level rise due to its relative low elevation. Sea level rise will likely reduce areas of the Nile delta due to its relative low elevation. About 12-15% of the existing agricultural land in the delta is under inundation threats; in addition to losses of huge urban and economic centers in the coastal cities.
Figure (2.1) The Nile Valley and Nile Delta Maps showing main water control structures source (NWRP – 2005) The Western Desert covers an area of some 700,000 km2, thereby accounting for around two-thirds of Egypt's total land area. This immense desert to the west of the Nile occupies the area from the Mediterranean Sea southwards to the Sudanese border. The Great Sand Sea lies within the desert's plain, and there is no rivers or streams drain into or out of this area. There are seven important depressions, and all are considered oases except the largest one “Qattara depression”, which includes the country's lowest point at 133 meters below sea level. The Fayoum Oasis which lies 60 kilometers southwest of Cairo, fed from the Nile and has extensive cultivation in an irrigated area that extends over 1,800 square kilometers. The Eastern Desert covers an area of approximately 220,000 km2, and is relatively mountainous and uninhabited. The elevation rises abruptly from the Nile, and an upward-sloping plateau of sand gives way within 100 km to arid rocky hills running north and south between the Sudan border and the Delta. The hills reach elevations of more than 1,900 m. The region's most prominent feature is the easterly chain of rugged mountains; the Red Sea Hills, which extend from the Nile Valley eastward to the Gulf of Suez and the Red Sea. This elevated region has a natural drainage pattern that rarely functions because of insufficient rainfall. It also has a complex of irregular, sharply cut Wadis that extend westward toward the Nile. The desert environment extends all the way to the Red Sea coast.
Joint Programme for Climate Change Risk Management in Egypt
Proposed CLIMATE CHANGE ADAPTATION STRATEGY for the Ministry of Water Resources & Irrigation EGYPT (2013)
Filename;\MhmdNour\CC Final Submitted 12-Feb2103 AdptStrtgy .docx page 6
There are no oasis cultivation centers, but it has some petroleum resources in the north. Excluding the settlements on the Red Sea coast, there are no permanent towns or villages in the area at all. The Red Sea coast had experiences extensive touristic activities since mid 1990s.
The Sinai Peninsula is a triangular-shaped peninsula, about 61,100 km2. Similar to the desert, the peninsula contains mountains in its southern sector that are a geological extension of the Red Sea hills, the low range along the Red Sea coast that includes Catherine mountain, the country's highest point; at 2,642 m above sea-level. The southern side of the peninsula has a sharp escarpment that subsides after a narrow coastal shelf that slopes into the Red Sea and the Gulf of Aqaba. The elevation of Sinai's southern rim is about 1,000 m, moving northward, the elevation of this limestone plateau decreases. The northern third of Sinai is a flat, sandy coastal plain, which extends from the Suez Canal into the Gaza Strip. El-Salam canal project is planned to feed about 200,000 feddans in North Sinai using mixed drainage and fresh water.
2.2 Population Egypt is the most populous country in the Middle East and the third-most populous on the African continent. Nearly 97% of the country's 82.5 million (2012 estimate) people live in three major regions of the country: Cairo & Alexandria and elsewhere along the banks of the Nile valley and the Nile delta, and along the Suez Canal. These regions; which occupy about 4% of the country’s area, are among the world's most densely populated regions, where the population density is about 1,500 inhabitants per km².
Small communities spreading throughout the desert regions of Egypt are clustered around oases and historic trade and transportation routes. The government has tried with mixed success to encourage migration to newly irrigated land reclaimed from the desert. However, the proportion of the population living in rural areas has continued to decrease as people move to the cities in search of employment and a higher standard of living. In this respect, a plan to construct several new cities in desert areas aims to increase the populated area in Egypt to about 25%. The construction in these new cities is expected to follow the green building code, and this can therefore be considered as part of the adaptation activities to climate change in Egypt.
Projected population for Egypt is estimated as 104 million by 2025 and 146 million by 2050, and 237 million in 2100. Annex (A1) shows the current population distribution on the different governorates and future estimates. It is estimated that about 57% of Egypt's population as rural, including those residing in agricultural areas in the Nile valley and delta, as well as the much smaller number of persons living in desert areas. Rural areas differ from the urban in terms of poverty, fertility rates, and other social factors. Agriculture is a key component of the economy in rural areas, though some people are employed in the tourist industry or other non-farm occupations. The percentage of Egypt's population employed in agriculture is estimated as 30%. The agricultural industry is mainly dependent on irrigation activities.
2.3 Climate Profile Egypt’s climate is hot, dry, deserted and is getting warmer. During the winter season (December– February), Lower Egypt’s climate is mild with some rain, primarily over the coastal areas, while Upper Egypt’s climate is practically rainless with warm sunny days and cool nights. During the summer season (June- August), the climate is hot and dry all over Egypt. Summer temperatures are extremely high, reaching 38°C to 43°C with extremes of 49°C in the southern and western deserts. The northern areas on the Mediterranean coast are much cooler, with a maximum of about 32°C.
The average daily temperature ranges from 17°C to 20°C along the Mediterranean to more than 25°C in Upper Egypt along the Nile (SNC-2010). Figure (2-2) displays average annual temperatures across

Joint Programme for Climate Change Risk Management in Egypt
Proposed CLIMATE CHANGE ADAPTATION STRATEGY for the Ministry of Water Resources & Irrigation EGYPT (2013)
Filename;\MhmdNour\CC Final Submitted 12-Feb2103 AdptStrtgy .docx page 7
Egypt. From 1961 to 2000, the mean maximum air temperature increased 0.34°C/decade, while the mean minimum air temperature increased 0.31°C/decade (SNC-2010).
Figure (2-2) Average annual temperatures (°C) in Egypt Source: SNC-2010 The Met-Office Hadley Centre (2011), projected temperature increases over Egypt in 2050 around 1-1.5°C by 2050 and around 3-3.5°C by 2100 with a general good consistent agreement between the models over the Middle East region. Rainfall in Egypt is very low, irregular and unpredictable. Annual rainfall ranges between a maximum of about 200 mm in the northern coastal region to a minimum of nearly zero in the south, with an annual average of 51 mm. Similar to temperature, seasonal precipitation including the timing, intensity, and form of precipitation, are projected to change. Precipitation differs from temperature in that it has greater spatial variability and is more difficult to predict (IPCC, 2007). In general, changes in precipitation and temperature interact. Higher temperatures increase evaporation, which can result in a drier climate. According to Stratus (2012), precipitation trends for Egypt are unavailable, some studies found that wet season precipitation in the Mediterranean has generally decreased since the mid-1960s. He referred the drying of the region partly to changes in the atmosphere caused by humanity (greenhouse gas concentrations and aerosols). Figure (2-3) shows average annual precipitation in Egypt (mm/yr).
The Met-Office of Hadley Centre (2011), expected a decrease in precipitation in common with the wider Mediterranean and majority of the Middle East. Decreases of over 20% are projected in the west of the country, with strong ensemble agreement. Smaller changes are projected towards the southeast.

Joint Programme for Climate Change Risk Management in Egypt
Proposed CLIMATE CHANGE ADAPTATION STRATEGY for the Ministry of Water Resources & Irrigation EGYPT (2013)
Filename;\MhmdNour\CC Final Submitted 12-Feb2103 AdptStrtgy .docx page 8
Figure (2-3) Average annual precipitation in Egypt (mm/yr) Source: NWRP 2005 Current Evaporation rates in Egypt range between 7 mm/day in Upper Egypt to about 4 mm/day in the Northern Mediterranean coast. The following table illustrates monthly average annual potential evapo-transpiration in the 8 main agro-climatic regions of Egypt as given by the Water Management Research Institute of the national Water Research Center, (WMRI-NWRC) in 2002. The following Figure (2-4) illustrates the annual potential evapo-transpiration rates for these agro-climatic regions in mm/day.
Agro-Climatic Region
Mean Annual ETo (mm/year)
South Upper Egypt 1722 North Upper Egypt 1610 Middle Egypt 1531 South Delta 1485 East Delta 1522 West Delta 1457 Middle Delta 1417 North Delta 1266
source: WMRI – NWRC (2002) It is recognized that increased temperature and changes in wind and humidity will affect these values. As reported by Eid (2001), a temperature rise of 1oC may increase the evapo-transpiration rate by about 4-5%, while a rise of 3oC may increase the evapo-transpiration rate by about 15%. This indicates that, if Egypt is consuming 41 Billion cubic meters by the agricultural sector, an increase of 1o C, would lead to additional amount of about 2.0 billion cubic meters to maintain same level of productivity. Besides, it was reported that 10% increase in the annual evapo-transpiration rate, can result in 6% decline in groundwater recharge (Eid et.al, 2006).

Joint Programme for Climate Change Risk Management in Egypt
Proposed CLIMATE CHANGE ADAPTATION STRATEGY for the Ministry of Water Resources & Irrigation EGYPT (2013)
Filename;\MhmdNour\CC Final Submitted 12-Feb2103 AdptStrtgy .docx page 9
Figure (2-4) Monthly average potential evapo-transpiration (mm/day) in the 8 agro-climatic regions source: WMRI–NWRC (2002) As reported in the Second National Communication Report (SNC- 2010), major crops in Egypt are subject to reduced production with rising temperature, except cotton. This reduction varies from 11% to 36% in response to temperature change of 2oC to 4oC respectively. Both hot and cold temperature extremes can place negative socio-economic impacts on almost all sectors such as health, agriculture, livestock, environment, and tourism. While seasonal changes in temperature are normal and indeed important for a number of societal sectors. Similarly, precipitation extremes, either excess or deficit, can be hazardous to human health, societal infrastructure, and livestock and agriculture. Importantly, what is ‘normal’ for one region may be extreme for another region that is less well adapted to such ‘normal’ conditions. The Second National Communication Report (SNC-2010) pointed out the variability of frequency and severity of extreme weather events in Egypt during the last three decades (1973-2002) which had been monitored based on the meteorological data of 32 stations distributed all over Egypt. The events of rising sand, sand storms, haze, thunder storms and flash floods are taken as an indicator of climatic changes. The number of days of maximum temperature equal to or exceeding 45 °C has increased in Upper Egypt from 50 days in the first decade to 52 days in the second decade, reaching 69 days in the third decade. In addition, the extremely hot days in the Western Desert amounted to 37 days in the third decade, compared to 22 days in each of the prior decades. The rest of Egypt did not experience increase in the number of days with a peak temperature of 45 °C or more. The Mediterranean coast of Egypt experienced successive increases in the amount of annual rainfall during the last three decades. The mean trend over the area is + 0.76 mm per year. 2.4 The Nile River The Nile River runs from its origins in the equatorial plateau and the Ethiopian heights for a distance of about 6,500 kilometres, along which it crosses 5 different climatic regions until it reaches its final destination in the Mediterranean. Its catchment’s area covers 10% of Africa’s landmass and is shared by 11 riparian countries. Figure (2-5) shows a map for the Nile River and its tributaries and their sub-basins.
0.00
1.00
2.00
3.00
4.00
5.00
6.00
7.00
8.00
9.00
Jan Feb Mar Apr May Jun Jul Aug Sep Oct Nov Dec
North Delta Middel Delta West Delta East Delta
South Delta Middel Egypt North of upper Egypt South of upper Egypt

Joint Programme for Climate Change Risk Management in Egypt
Proposed CLIMATE CHANGE ADAPTATION STRATEGY for the Ministry of Water Resources & Irrigation EGYPT (2013)
Filename;\MhmdNour\CC Final Submitted 12-Feb2103 AdptStrtgy .docx page 10
Figure (2-5) Map of the Nile Basin showing the drainage network, basin states, and major dams, (Source: World Bank, 2011b)
An estimated 180 million people live in the basin while 330 million (40% of Africa’s population) live in the riparian countries. Assuming average population increase basin wide at 2%, the expected Nile basin population by 2050 may reach 300 million, and the accumulated riparian countries population is expected to reach 700 million by 2050. This risk of population increase and the climate change uncertainty reduce the resilience of the basin to face the impacts of climate change.
The climate and vegetation cover in the Nile basin are highly related to the amount of precipitation. Precipitation increases southward and with altitude. The common area with average high precipitation of about 1200-1600mm/years is on the highlands of Ethiopia and the Equatorial lakes plateaus. The potential Evaporation over the basin increases as one move downstream which show opposite trend to the precipitation

Joint Programme for Climate Change Risk Management in Egypt
Proposed CLIMATE CHANGE ADAPTATION STRATEGY for the Ministry of Water Resources & Irrigation EGYPT (2013)
Filename;\MhmdNour\CC Final Submitted 12-Feb2103 AdptStrtgy .docx page 11
The watershed of the White Nile at Khartoum is 1.7 million km2. It contains Lake Victoria and comprises a complex of channel, lakes, swamps and wetlands. The streams which feed the White Nile River are seasonal. The average annual precipitation in Lake Victoria is about 1221mm with a bimodal seasonal distribution with peaks in March-May and November-December. After leaving Lake Victoria the White Nile flows into the Equatorial Lakes (Lake Kyoga and Lake Albert) and then northward into Sudd sub-basin of Bahr el Jebel. The precipitation falls mostly in one season from April to October. In this part of the sub-basin there is more evaporation than rainfall and consequently the total flow in the river is decreased after it leaves the sub-basin exposed to loss rather than gain due to the topographic nature of the area.
The Blue Nile River starts at the outlet of Lake Tana and flows to Khartoum where it meets the White Nile with basin area of about 324,530 km2. The Blue Nile contributes about 80% of the flow of the Main Nile. The topography of the Blue Nile composed of highlands, hills, valleys and occasional rock peaks. Most of the streams feeding the Blue Nile are perennial and includes the Dinder and Rahad tributaries. The average precipitation over the Blue Nile sub-basin is 1394mm and is higher than the other sub-basin of the Nile basin. The precipitation over the Blue Nile basin varies from 1000mm in the north-eastern part to 1450-2100mm over the south-western part of the sub-basin.
The Atbara River originates in the Northern Ethiopia and Eritrea and joins the Nile after the lowland in eastern Sudan with a basin area of 112,400 km2. The discharge of the river is extremely torrential. Generally the average annual precipitation of Atbara is lowest among the other Nile sub-basins.
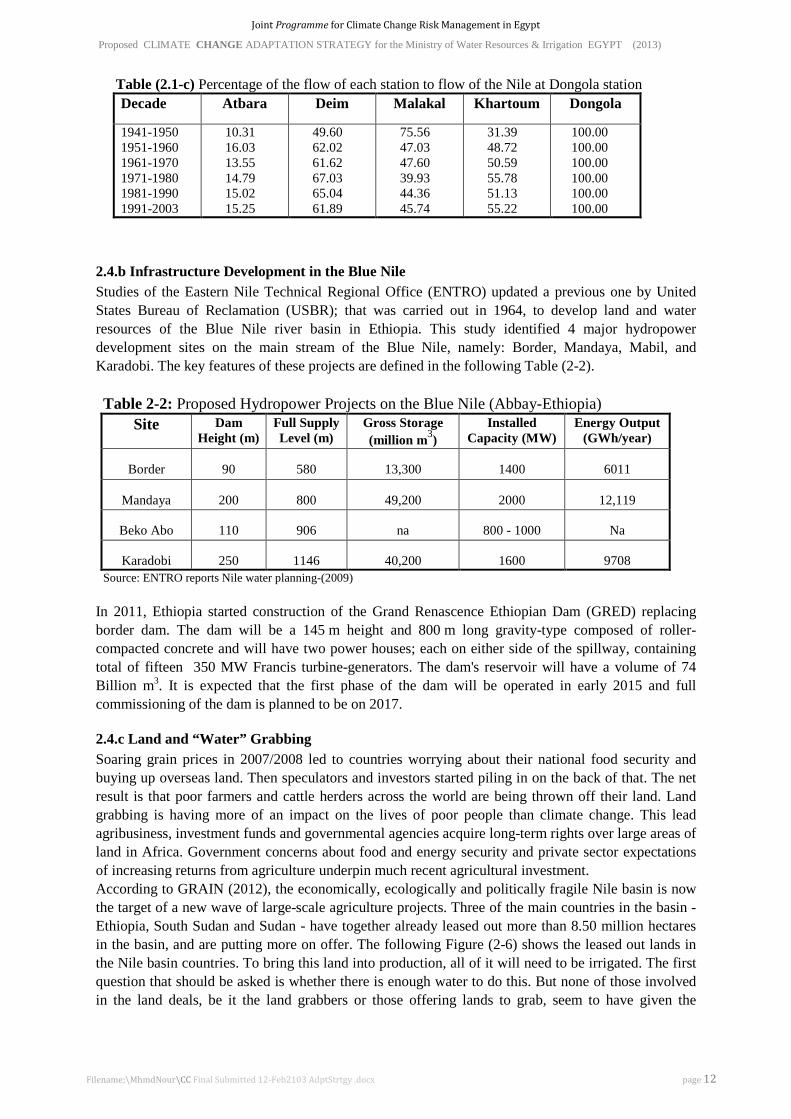
2.4.a Historical Observed Records of the Nile Stations The observed monthly flow data since 1940 till 2003 were used to compare the contribution of each tributary to the annual flow of the Nile and the trend of decadal change of flows at each station. Table (2.1-a) shows the basic statistics of the observed monthly flow data, since 1940, at the five key locations on the Nile. Table (2.1-b) shows the decadal flow average (in Billion m3/year), and Table (2.1-c) shows the percentage of the flow of each station to the flow of the Nile at Dongola station. These tables indicate that the contribution of the White Nile to the flow of the Nile is much higher in dry years than in wet years, while Atbara River has the lowest contribution. It also shows that the overall flow of the Nile has increased by 20% during the last decade (1990-2003). Table (2.1-a) Basic statistics of flow data at key stations on the Nile basin (in Billion m3/year)
Atbara Deim Dongala Kharb Malakal Mean 10.10 43.89 70.63 35.67 34.06 Standard Deviation 4.46 15.57 20.16 16.08 7.40 Range 19.37 69.22 94.97 68.11 30.02 Minimum 1.95 11.68 23.49 5.24 21.04 Maximum 21.33 80.91 118.46 73.34 51.06
Table (2.1-b) Decadal flow average (bcm/year) at key stations on the Nile (in Billion m3/year)
Decade Atbara Deim Malakal Khartoum Dongola
1941-1950 1951-1960 1961-1970 1971-1980 1981-1990 1991-2003
5.10 11.54 11.47 11.85 9.36
11.34
24.54 44.64 52.14 53.69 40.50 46.03
37.38 33.85 40.28 31.98 27.62 34.01
15.53 35.07 42.81 44.68 31.84 41.07
49.48 71.98 84.62 80.10 62.27 74.37
Joint Programme for Climate Change Risk Management in Egypt
Proposed CLIMATE CHANGE ADAPTATION STRATEGY for the Ministry of Water Resources & Irrigation EGYPT (2013)
Filename;\MhmdNour\CC Final Submitted 12-Feb2103 AdptStrtgy .docx page 12
Table (2.1-c) Percentage of the flow of each station to flow of the Nile at Dongola station Decade Atbara Deim Malakal Khartoum Dongola
1941-1950 1951-1960 1961-1970 1971-1980 1981-1990 1991-2003
10.31 16.03 13.55 14.79 15.02 15.25
49.60 62.02 61.62 67.03 65.04 61.89
75.56 47.03 47.60 39.93 44.36 45.74
31.39 48.72 50.59 55.78 51.13 55.22
100.00 100.00 100.00 100.00 100.00 100.00
2.4.b Infrastructure Development in the Blue Nile Studies of the Eastern Nile Technical Regional Office (ENTRO) updated a previous one by United States Bureau of Reclamation (USBR); that was carried out in 1964, to develop land and water resources of the Blue Nile river basin in Ethiopia. This study identified 4 major hydropower development sites on the main stream of the Blue Nile, namely: Border, Mandaya, Mabil, and Karadobi. The key features of these projects are defined in the following Table (2-2). Table 2-2: Proposed Hydropower Projects on the Blue Nile (Abbay-Ethiopia)
Site Dam Height (m)
Full Supply Level (m)
Gross Storage (million m3)
Installed Capacity (MW)
Energy Output (GWh/year)
Border 90 580 13,300 1400 6011
Mandaya 200 800 49,200 2000 12,119
Beko Abo 110 906 na 800 - 1000 Na
Karadobi 250 1146 40,200 1600 9708 Source: ENTRO reports Nile water planning-(2009) In 2011, Ethiopia started construction of the Grand Renascence Ethiopian Dam (GRED) replacing border dam. The dam will be a 145 m height and 800 m long gravity-type composed of roller-compacted concrete and will have two power houses; each on either side of the spillway, containing total of fifteen 350 MW Francis turbine-generators. The dam's reservoir will have a volume of 74 Billion m3. It is expected that the first phase of the dam will be operated in early 2015 and full commissioning of the dam is planned to be on 2017.
2.4.c Land and “Water” Grabbing Soaring grain prices in 2007/2008 led to countries worrying about their national food security and buying up overseas land. Then speculators and investors started piling in on the back of that. The net result is that poor farmers and cattle herders across the world are being thrown off their land. Land grabbing is having more of an impact on the lives of poor people than climate change. This lead agribusiness, investment funds and governmental agencies acquire long-term rights over large areas of land in Africa. Government concerns about food and energy security and private sector expectations of increasing returns from agriculture underpin much recent agricultural investment. According to GRAIN (2012), the economically, ecologically and politically fragile Nile basin is now the target of a new wave of large-scale agriculture projects. Three of the main countries in the basin - Ethiopia, South Sudan and Sudan - have together already leased out more than 8.50 million hectares in the basin, and are putting more on offer. The following Figure (2-6) shows the leased out lands in the Nile basin countries. To bring this land into production, all of it will need to be irrigated. The first question that should be asked is whether there is enough water to do this. But none of those involved in the land deals, be it the land grabbers or those offering lands to grab, seem to have given the

Joint Programme for Climate Change Risk Management in Egypt
Proposed CLIMATE CHANGE ADAPTATION STRATEGY for the Ministry of Water Resources & Irrigation EGYPT (2013)
Filename;\MhmdNour\CC Final Submitted 12-Feb2103 AdptStrtgy .docx page 13
question much thought. The assumption is that there is plenty of water and the newcomers can withdraw as much as they need.
Figure (2-6) Leased out lands by foreign investors in the Nile Basin Countries source : www.GRAIN.org “Squeezing Africa dry: behind every land grab is a water grab-” (2012) Note : Egypt could cancel about 40% of the indicated area after the revolutin of 25-Jan2011) Ethiopia is the source of some 80% of the Nile water. In its Gambela region on the border with South Sudan, corporations such as Karaturi Global and Saudi Star are already building big irrigation channels that will increase Ethiopia's withdrawal of water from the Nile enormously. These are only two of the actors involved. One calculation suggests that if all the land that the country has leased out is brought under production and irrigation, it will increase the country's use of freshwater resources for agriculture by a factor of nine. Further downstream, in South Sudan and Sudan, some 4.9 million hectares of land has been leased out to foreign corporations since 2006. That is an area greater than the entire Netherlands. To the north, Egypt is also leasing out a small area of about 100,000 hectares and implementing its own new irrigation projects. It remains to be seen how much of all this will actually be brought into production and put under irrigation, but it is difficult to imagine that the Nile can handle this agression. Reliable figures on how much irrigation is actually possible and sustainable are difficult to find. The FAO, in various publications and in its Aquastat database, gives figures on 'irrigation potential' and actual irrigation by country and river basin. The table (2-3) below presents the figures for the major countries in the Nile basin, and compares them with the amount of land already leased out.

Joint Programme for Climate Change Risk Management in Egypt
Proposed CLIMATE CHANGE ADAPTATION STRATEGY for the Ministry of Water Resources & Irrigation EGYPT (2013)
Filename;\MhmdNour\CC Final Submitted 12-Feb2103 AdptStrtgy .docx page 14
Table (2-3): The Nile Basin: Irrigation, irrigation potential & leased land - figures in numbers of hectares
Country Irrigation potential
Already irrigated
Leased out since 2006
Surplus /Deficit
Comments
Ethiopia 1,312,500 84,640 3,600,000 -2,372,140
The irrigation potential refers here to the 'economic potential' of the Nile Basin in Ethiopia, which does not take into account the availability of water. According to FAO the whole of Ethiopia has an irrigation potential of 2.7 million hectares taking into account water and land resources. The vast majority of the leased out land in the Nile basin.
Sudan & South Sudan
2,784,000 1,863,000 4,900,000 -3,979,000
Virtually all of the water is from the Nile. FAO-Aquastat states that in 2000, the total area equipped for irrigation was 1,863,000 hectares, but only about 800,000 hectares, or 43 percent of the total area, are actually irrigated owing to deterioration of the irrigation and drainage infrastructures.
Egypt 4,420,000 3,422,178 140,000 857,822
Virtually all of the water is from the Nile. FAO Aquastat states that plans are underway for new irrigation of 150,000 hectares in Sinai, as part of the al-Salam project, and 228,000 hectares in Upper Egypt at Toshky, amongst others. This would bring the country quickly to its irrigation potential – or over it.
Total for all four countries
8,516,500 5,369,818 8,640,000 -5,493,318 FAO, commenting on its own figures, states that the irrigation potential figures should be considered with caution and are probably much lower. It puts the overall irrigation potential of all countries in the Nile basin at around 8 million hectares, but 'even these 8 million hectares are still a very optimistic estimate and should be considered as a maximum value'
source: Irrigation figures from FAO Aquastat and FAO: 'Irrigation potential in Africa: A basin approach' Land lease figures from GRAIN dataset on land grabbing 2012 and other sources.
These huge grabbed lands if developed for agriculture will have serious implications on water availability for Egypt, and this issue should be taken seriously and to be solved at the highest level; regionally and internationally, and must be considered in future planning. Also, these figures should alert us regarding the real functions of the Ethiopian dams: are they really for non-consumptive use of water by Hydropower production or for heavy water consumption by irrigated agricultural activities.
It is obvious now that, these land grabbing projects are going to add serious additional risk to that of climate change on downstream countries. In the current developed strategy, it is assumed that, the share of Egypt in the Nile water will be affected by these cuts. Optimistic cuts are assumed, but it can be updated when reliable information becomes available.
2.4.d Expected Impacts on Nile Water Supplies to Egypt The climate change combined with population increase, very intensive land grabbing in the Nile basin, temperature increase and dams’ construction either in the Blue Nile or other tributaries of the Nile or in the main Nile will add more stress on the renewable water resources of Egypt. All these will be reflected on agriculture productivity, ground water recharge, hydropower production, and municipal water supply. These impacts will require rigorous adaptation actions either at the regional or at national level to deal with these multiple impacts. Sayed et al. (2004), Attia (2009), SNC (2010), NSACC (2011), and Stratus (2012) presented climate change direct and indirect impacts on the Nile flows, and proposed general adaptation measures under optimistic (increased Nile flows) and pessimistic (decreased Nile flows) scenarios.

Joint Programme for Climate Change Risk Management in Egypt
Proposed CLIMATE CHANGE ADAPTATION STRATEGY for the Ministry of Water Resources & Irrigation EGYPT (2013)
Filename;\MhmdNour\CC Final Submitted 12-Feb2103 AdptStrtgy .docx page 15
The worst scenario would result from adding the recently developed upstream abstractions (in both Ethiopia and Sudan) to the drying climate change scenario. This leads to the need for detailed and innovative adaptation measures that will be discussed in the following sections in part 2 of this report.
2.5 Groundwater The major groundwater system in Egypt consists of several aquifers as shown in figure (2-7). These are: the Nile aquifer, the Nubian sandstone aquifer, the fissured carbonate aquifer, the Moghra aquifer, the coastal aquifer, and the hard-rock aquifer.
Figure (2-7) the major aquifer system in Egypt Source: National Water Resources Plan – 2017 (NWRP-MWRI, 2005) The Nile aquifer is a shallow one that is recharged mainly by infiltration of excess irrigation water (i.e. originally Nile water), so it is not an additional source, and is considered as a reservoir. However, in terms of abstractions, it provides about 85% of total groundwater abstractions in Egypt. It is composed of a thick sand and gravel layer covered by a clay cap of varying depth up to 50 meters. The Nubian sandstone aquifer covers an area of about 2 million km2, and extends into Libya, Chad and Sudan. The aquifer is pheriatic in the southern part Egypt and is confined elsewhere. The thickness of the fresh layer ranges from 200 meters in East Owinat to 3500 meters North West of El-Farafra Oasis. The aquifer is of fossil origin and flows are in a North direction. The total potential volume stored in this aquifer exceeds 150,000 billion cubic meters, but most of it is very deep and still not economically feasible to abstract. The fissured carbonate rock aquifer occupies more than 50% of the Egypt’s area and acts as a confining layer on top of the Nubian sandstone aquifer. It extends from Sinai to Libya, and has many natural springs. The aquifer recharge is unknown and there is no reliable information regarding its potential. The Moghra aquifer is located in the North western desert and groundwater is directed towards Qattara Depression. It is recharged by rainfall and lateral inflow from the Nile aquifer. It contains fresh groundwater only with salinity increases towards North and West. The water quality and sustainability of this aquifer is at risk due to the rapid development of land reclamation in this area. The coastal aquifer system is recharged by rainfall, and the abstractions are limited due to the presence of saline water underneath the fresh water lenses. Similarly, the fissured hard rock aquifer system in the Eastern desert and Southern Sinai is also recharged by small quantities of infiltrating rainwater.

Joint Programme for Climate Change Risk Management in Egypt
Proposed CLIMATE CHANGE ADAPTATION STRATEGY for the Ministry of Water Resources & Irrigation EGYPT (2013)
Filename;\MhmdNour\CC Final Submitted 12-Feb2103 AdptStrtgy .docx page 16
3.0 Water Resources, Demands, Quality and Management in Egypt The Nile supplies Egypt by about 95% of its total water needs, including water intensive irrigated agriculture confined to the narrow corridor along the river and its delta. The rest of the country is desert and does not support much population or economic activity except for a narrow strip along the Suez Canal and Red sea Coast and a few oases in the Western desert. With the growing population, Egypt currently became a water stressed country and water is becoming a limiting factor for development. This is because the major source of water (the Nile) is fixed by 55.5 billion cubic meters since 1959; according to the Nile Water Treaty, when the population was about 25 millions. Any reduction in flow of the Nile River (due to climate change or competition on water resources among the riparian countries) would put additional stress on water resources throughout Egypt. In order to understand the vulnerability of the water sector in Egypt to climate change, it is important to know the water resources and water demands in Egypt and how this sector is managed. The following Table (3-1) shows the current water budget of Egypt 2010; as given in the 2050 water strategy of the Ministry of Water Resources and Irrigation (MWRI-2010). It includes conventional and non-conventional sources as well as water allocation or usage and consumption at the national scale. From this water budget, it is clear that Egypt's water demand for irrigation, industry, and domestic consumption already exceeds the supply of the Nile. This is substituted by recycling fresh water more than once, which imply that there is shortage in the fresh water resources, and also reflects the high efficiency of the system as well as the sensitivity of the system to deterioration in water quality problems that may arise. Table (3.1): Current Water Budget of Egypt (2010), and all Sources and Allocation/Usage
Source: Egypt’s Strategy for Development & Management of water resources 2050 (MWRI – 2010) The following paragraphs describe the items of the water budget and present the existing policies and strategies of water management.
3.1 Water Supply Conventional water resources in Egypt are the Nile water, rainfall, deep groundwater, and desalinated water. The non-conventional water resources are the shallow groundwater in the Nile delta, the re-used agricultural drainage water, and re-used treated waste water. The Nile water supplies are extremely limited by the 55.5 billion cubic meters at High Aswan Dam (HAD), and projected to become even more limited due to the increased competition on water resources among the Nile basin countries. Annual water share of Nile water per capita in Egypt has decreased from 2500 m3/capita/yr in the 1950s to about 680 m3/capita/yr in 2012, and is projected to drop to about 350 m3/capita/yr in 2050. The High Aswan Dam (HAD) is the major regulatory facility on the river. It started operation in 1968 ensuring Egypt’s control over its share of water and guiding its full utilization. Downstream HAD, the
80 millionsVolume Consumption Usage/Allocation
(billion m3/year) (billion m3/year) (billion m3/year)
Drinking (Fresh W only) 1.80 9.00Nile (HAD) 55.50 Industry 1.40 2.00Deep Groundwater 2.00 Agriculture 40.40 67.00Rainfall & Flash Floods 1.30 Drainage to Sea 12.20Desalination 0.20 Evap. losses 3.00 3.00TOTAL Supply conventional 59.00 Env. Balance 0.20 0.20
TOTAL Consumption 59.00Shallow Groundwater (Delta) 6.20Re-Use of Ag. Drainage Water 16.00TOTAL Supply non-conventional 22.20TOTAL Water Supply 81.20 81.20
2010 Water Budget (Sources&Usage) , Population =
Water Supply Demand by Sector
Conventional Water Sources
Unconventional Sources
TOTAL Water Usage or Allocation

Joint Programme for Climate Change Risk Management in Egypt
Proposed CLIMATE CHANGE ADAPTATION STRATEGY for the Ministry of Water Resources & Irrigation EGYPT (2013)
Filename;\MhmdNour\CC Final Submitted 12-Feb2103 AdptStrtgy .docx page 17
Nile water is diverted from the main stream into an intensive network of canals through several types of control structures. Attia (2009), reported that rainfall in Egypt is very scarce except in a narrow band along the northern coastal areas, where an insignificant rain-fed agriculture is practiced. Rainfall occurs in winter in the form of scattered showers along the Mediterranean shoreline. The total amount of rainfall does not exceed 1.5 billion cubic meters (BCM) per year. Flash floods occurring due to short-period heavy storms are considered a source of environmental damage especially in the Red Sea area and Southern Sinai. It is estimated that around 1.3 billion cubic meters can be harvested every year. Shallow groundwater in the Nile aquifer is not an additional source of water as it gets its water from percolation of the irrigated lands and seepage from irrigation canals. Therefore, its yield is considered as a reservoir in the Nile River system with about 6.2 BCM per year of rechargeable live storage, which is about 7.60% of the total water supplies. Its contribution is related to water availability and the efficiency of water use in the irrigation system. Non-renewable groundwater exists in the deep aquifers of the Western Desert region and Sinai with the current total abstraction estimated at 2.0 BCM per year. It is worth mentioning that most of this non-renewable available groundwater in the desert is associated with a high pumping cost. Desalination is mainly used to supply remote areas with municipal water, especially in the touristic sector. The cost of desalination is still high, and the annual contribution of this source (in 2010) in the water budget is estimated as 0.35% of the renewable water supplies (according to the 2050 Water Strategy). Its contribution is going to increase in future with advanced technology and availability of relatively cheaper energy sources, as well as the increased economical value of the desalinated water under the expected water scarcity conditions.
The agricultural drainage network carries annual discharge of relatively good water quality, from which a large amount (about 16 billion cubic meters) is reused (officially and unofficially) and returns again to the drainage system from which there is 12.0 BCM are delivered to the sea or the Northern lakes. Reuse of agricultural drainage water in the Nile Delta has been adopted as an official policy since the late seventies. The policy calls for recycling agricultural drainage water by pumping it from main and branch drains and mixing it with fresh water in main and branch canals. There has been a decreasing trend in the amounts of water pumped into the sea with a significant increase in the amounts of drainage water reused recently. The increased need for recycling would necessitate stronger legislations to protect the water bodies. There is a significant volume of primary treated wastewater that is being used in irrigation at specific locations outside most large cities all over the country. The contribution of treated wastewater is expected to increase with the growing production of drinking water and expansion plans of waste water treatment facilities, and under growing water shortage.
3.2 Water Demands Egypt is experiencing water stress under the increasing demands on water due to the population growth and rising standards of living. Agriculture, drinking and industrial sectors are the highest water consumers. The competition among these demands will intensify under climate change, but drinking water will always have the highest priority. Drinking water supplies and waste water treatment plants have increased significantly in the last few decades. The percentage of people receiving sanitary drinking water increased from 75% in 2006 to 88% in 2010, and current plans are to have 100% coverage.

Joint Programme for Climate Change Risk Management in Egypt
Proposed CLIMATE CHANGE ADAPTATION STRATEGY for the Ministry of Water Resources & Irrigation EGYPT (2013)
Filename;\MhmdNour\CC Final Submitted 12-Feb2103 AdptStrtgy .docx page 18
The agricultural sector is the largest user and consumer of water in Egypt, with its current allocation (in 2010) exceeds 68% of the total fresh water supplies or 82% of the total used water (after recycling). The agricultural land base consists of old land in the Nile Valley and Delta, rain fed areas, several oases, and reclaimed lands in the desert. This includes both the old fertile lands of the Nile valley and Delta, and the reclaimed lands in the deserts. Irrigation water is commonly applied to the old lands using surface flooding or gravity methods, while water is applied in almost all new lands in the deserts by modern pressurized drip or sprinkler systems. The total area of irrigated land in the year 2010 (according to the Agricultural Strategy 2030) is approximately 8.80 million feddan, with a cropped area of approximately 15.50 million feddan. The consumed amount of water by Evapo-Transpiration is about 40.5 billion cubic meters. This means an annual overall average consumption rate (ET) of about 4600 cubic meter per feddan. The amount of water used by the agricultural sector in 2010 water budget is about 67 billion cubic meters which include leaching requirements, deep percolation to shallow groundwater and other losses. This means that the annual overall average irrigation water allocation per feddan (water duty) is about 7610 cubic meter per feddan. This implies an overall irrigation efficiency of about 73%; which is relatively high with respect to the prevailing flood irrigation system in the old lands. Several measures are taken to raise the efficiency of the existing irrigation system in the old lands, to raise water productivity and save some water that can be used for agricultural expansion projects. Climate change is expected to raise water requirements for the most agricultural crops as well as affecting the duration and dates of the growing seasons. In addition, it may limit the planned expansion projects. Compared to the agricultural water demands, municipal water demands are relatively small; but given the health aspects involved, the municipal supply receive priority over all other uses. The municipal consumption of 2010 water budget is 1.80 billion m3, while the corresponding allocated amount is 9 billion m3 (according to the Water Strategy 2050). These high losses may be attributed to the aging of the infrastructures and lack of awareness and the low water tariffs. However, these amounts are lost mainly from the distribution network and recycled into the system as part of the water budget. But it means waste of energy and resources in the treatment process. The allocation of municipal water is higher in urban area than that in rural areas. The overall country average per capita usage of drinking water is about 300 lit/day, which is very high under any standards, and especially for a country under water poverty and threats of water scarcity. Huge efforts are needed to use municipal water supplies in a conservative manner. According to the above mentioned consumed amount of drinking water, the overall daily average consumption per capita is about 60 liters. About 80% of the drinking water supplies use surface water sources from the Nile or the main canals, and 20% rely on groundwater, while the desalination is limited to remote areas on the coasts. This adds another challenge in protecting surface water bodies from potential pollution sources either from residential areas or from industries. Industry is a growing sector in the Egyptian national economy. There is no accurate estimate for the current industrial water requirement. However, the 2050 water strategy estimated the industrial water consumption in 2010 by about 1.40 billion cubic meters and the total usage by about 3.80 billion. It also estimated that 1.80 billion are taken from the drinking water networks, and the remaining from Nile and canals, and groundwater. These estimated amounts do not take into account the water used for cooling and returning back to the system as those used in thermal power generation plants. The Navigation sector uses water and does not consume it. The construction of the HAD as well as the rehabilitation of the grand barrages on the main Nile (Esna and Nag Hammady) improved the Navigation conditions in the Nile stream and other main canals. However, the expected reduced flows of the Nile; due to climate change and increasing demands on water from upstream countries, would lead to lower water levels that may affect the drafts of sailing units.
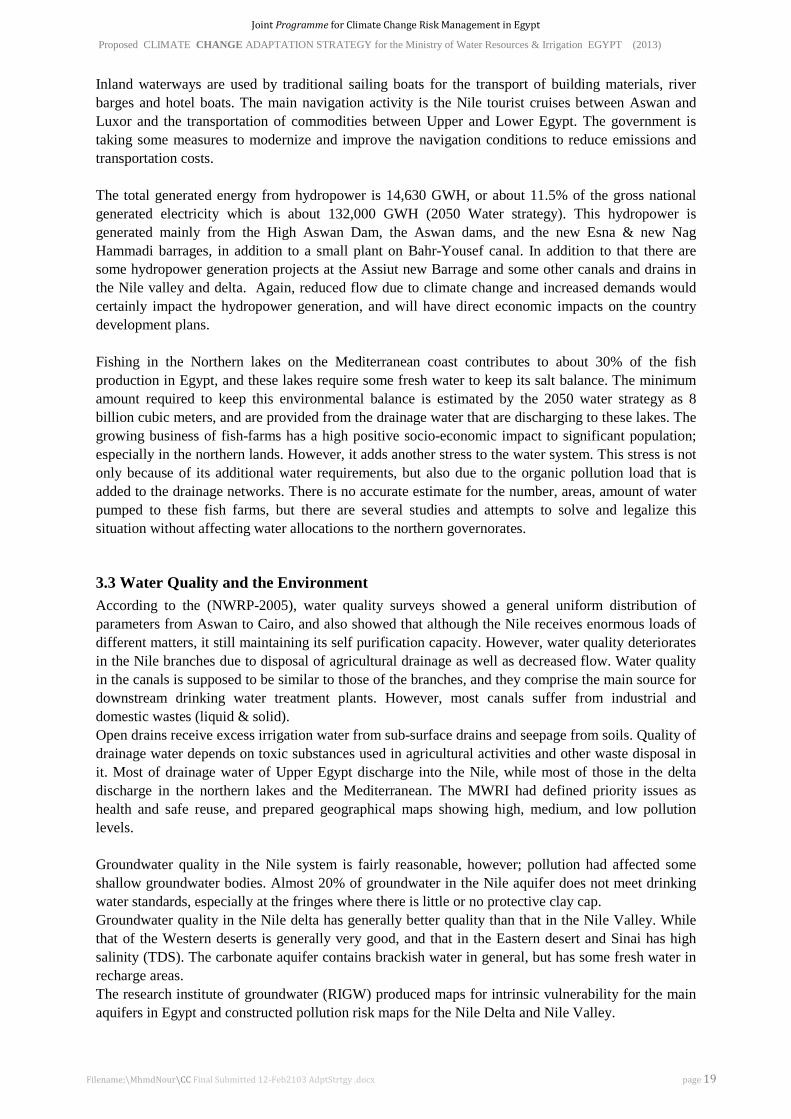
Joint Programme for Climate Change Risk Management in Egypt
Proposed CLIMATE CHANGE ADAPTATION STRATEGY for the Ministry of Water Resources & Irrigation EGYPT (2013)
Filename;\MhmdNour\CC Final Submitted 12-Feb2103 AdptStrtgy .docx page 19
Inland waterways are used by traditional sailing boats for the transport of building materials, river barges and hotel boats. The main navigation activity is the Nile tourist cruises between Aswan and Luxor and the transportation of commodities between Upper and Lower Egypt. The government is taking some measures to modernize and improve the navigation conditions to reduce emissions and transportation costs. The total generated energy from hydropower is 14,630 GWH, or about 11.5% of the gross national generated electricity which is about 132,000 GWH (2050 Water strategy). This hydropower is generated mainly from the High Aswan Dam, the Aswan dams, and the new Esna & new Nag Hammadi barrages, in addition to a small plant on Bahr-Yousef canal. In addition to that there are some hydropower generation projects at the Assiut new Barrage and some other canals and drains in the Nile valley and delta. Again, reduced flow due to climate change and increased demands would certainly impact the hydropower generation, and will have direct economic impacts on the country development plans. Fishing in the Northern lakes on the Mediterranean coast contributes to about 30% of the fish production in Egypt, and these lakes require some fresh water to keep its salt balance. The minimum amount required to keep this environmental balance is estimated by the 2050 water strategy as 8 billion cubic meters, and are provided from the drainage water that are discharging to these lakes. The growing business of fish-farms has a high positive socio-economic impact to significant population; especially in the northern lands. However, it adds another stress to the water system. This stress is not only because of its additional water requirements, but also due to the organic pollution load that is added to the drainage networks. There is no accurate estimate for the number, areas, amount of water pumped to these fish farms, but there are several studies and attempts to solve and legalize this situation without affecting water allocations to the northern governorates.
3.3 Water Quality and the Environment According to the (NWRP-2005), water quality surveys showed a general uniform distribution of parameters from Aswan to Cairo, and also showed that although the Nile receives enormous loads of different matters, it still maintaining its self purification capacity. However, water quality deteriorates in the Nile branches due to disposal of agricultural drainage as well as decreased flow. Water quality in the canals is supposed to be similar to those of the branches, and they comprise the main source for downstream drinking water treatment plants. However, most canals suffer from industrial and domestic wastes (liquid & solid). Open drains receive excess irrigation water from sub-surface drains and seepage from soils. Quality of drainage water depends on toxic substances used in agricultural activities and other waste disposal in it. Most of drainage water of Upper Egypt discharge into the Nile, while most of those in the delta discharge in the northern lakes and the Mediterranean. The MWRI had defined priority issues as health and safe reuse, and prepared geographical maps showing high, medium, and low pollution levels. Groundwater quality in the Nile system is fairly reasonable, however; pollution had affected some shallow groundwater bodies. Almost 20% of groundwater in the Nile aquifer does not meet drinking water standards, especially at the fringes where there is little or no protective clay cap. Groundwater quality in the Nile delta has generally better quality than that in the Nile Valley. While that of the Western deserts is generally very good, and that in the Eastern desert and Sinai has high salinity (TDS). The carbonate aquifer contains brackish water in general, but has some fresh water in recharge areas. The research institute of groundwater (RIGW) produced maps for intrinsic vulnerability for the main aquifers in Egypt and constructed pollution risk maps for the Nile Delta and Nile Valley.
Joint Programme for Climate Change Risk Management in Egypt
Proposed CLIMATE CHANGE ADAPTATION STRATEGY for the Ministry of Water Resources & Irrigation EGYPT (2013)
Filename;\MhmdNour\CC Final Submitted 12-Feb2103 AdptStrtgy .docx page 20
Deterioration of water quality is one of the major issues facing Egypt’s water resources and management. In fact, increased population and the economic activities in addition to increased temperature due to climate change would negatively affect water quality. Some examples for these effects are: the increased runoff and soil erosion may leach more ions, nutrients and suspended particles into the water bodies. Agriculture can benefit from the added nutrients but will be adversely affected by salinization. Drinking water quality will deteriorate due to increased suspended particles, organic matter and pollutants. The added nutrients will lead to excessive growth of algae-eutrophication which will further increase the organic load and oxygen demand, leading to further deterioration in water quality. Water salinization will also increase due to higher temperatures of water surface and to accelerated evaporation. Higher water temperature can also impact oxygen demand as well as oxygenation of organic wastes. The fertility and the quality of the old lands are severely affected by poor water management and agricultural practices. Approximately 2.0 million acres of the irrigated areas suffer from salinization and water logging problems. The majority of salt-affected soils are located in the northern-central part of the Nile Delta and on its eastern and western sides. Fertilizers are a large source of pollution for soil and water resources. Egyptian farmers consume more than 1.8 Million ton of fertilizers annually (Food and Agriculture Organization, 2006), mainly using nitrogen, phosphorus and potassium in different forms. Industrial wastewater constitutes 39% of the environmental problems of the industrial sector, as (SNC-2010). It contains dissolved industrial organic and inorganic wastes, solids and metals, all having negative and hazardous impacts with direct reflection on human health (EEAA, 2003). Industrial wastewater treatment plants have been introduced in 116 major industrial establishments, and funds were allocated for the remaining 25 major polluting industrial establishments to treat 19.6 million m3 of industrial wastewater (EEAA, 2010). The Holding Company of Water and Wastewater estimated that in year 2009, 100% of the population in Egyptian cities and 11% of village population will be served by sanitary networks (SNC-2010). El-Ganzory (2012), reported that poor water quality has a direct impact on health and the environmental conditions. Reduction of pollution loads entering the water system will improve the water-related public health conditions, improve the sustainable use of groundwater resources, and contributes to meeting the water quality requirements of the various functions of the water system. As the quality of water gets worse, its scope of use narrows; thereby reducing supplies and intensifying shortages. Improvement of water quality requires prevention of pollution, treatment of polluted water, and if neither is possible, control of pollution. The Egyptian Environmental Affairs Authority (EEAA) has the responsibility of implementing national environmental policies and of setting up environmental standards for cases of conflicting interests. Strong coordination is required to reach comprehensive and integrated environmental activities are significant because of the cross-sectoral nature of environmental issues. According to the SNC-2010), the most significant constraint to effective environmental policy making and implementation in Egypt is the lack of reliable and timely information indicating how various sectors of society impact the environment and whether development is becoming more sustainable or not. Various constraints related to the processes of environmental information collection, production and dissemination are evident in Egypt. These include uncoordinated institutional set-ups for monitoring activities, the absence of a common information system, the absence of comprehensive systematic methodologies for monitoring, the absence of valuation, and/or the undervaluation of many natural resources, and the lack of financial resources for maintaining monitoring processes. The MWRI, in coordination with other involved ministries and authorities, is implementing a long-term strategy to protect the water quality of the Nile and all water bodies. The Ministry of
Joint Programme for Climate Change Risk Management in Egypt
Proposed CLIMATE CHANGE ADAPTATION STRATEGY for the Ministry of Water Resources & Irrigation EGYPT (2013)
Filename;\MhmdNour\CC Final Submitted 12-Feb2103 AdptStrtgy .docx page 21
Infrastructures and utilities; recently established in 2012, became in charge of producing drinking and industrial water and taking care of sewage collection and treatment and disposal in order to protect and improve the water quality in recipient streams and environmental conditions in general. These efforts will be combined with enforcing environmental protection laws that deal with water quality and pollution control in addition to public awareness rising.
3.4 Water Management in Egypt There are six main challenges facing water management in Egypt. The first and most important challenge is the growing population and the related increased water demand for public water supplies and economic activities, in particular agriculture (population increased from 38 million in 1977 to 63 million in 2000, and to about 84 million in 2012, and expected to be 104 million in 2025, and to reach 237 million in 2100). The second challenge is the expected Nile flow reduction which has emerged recently due to the rapid implementation plans of the Ethiopian Dams that represent serious direct and immediate threat to the Egyptians basic water needs. The third challenge stems from the expected impacts of climate change on the Nile flows and the different demands of the water sector. The fourth challenge is the water quality in the canals’ network due to the interaction with the domestic, industrial and agricultural activities of the increased population, in particular in the Nile Delta. The fifth challenge is the institutional setting of water management which is a governmental one and central by nature. The management of the water sector should be effective and able to deal with the recent rapid expected changes. And finally the sixth one is sea level rise that is threatening the coastal zones and the Nile delta in particular, where a significant area is subject to inundation as well as impacting the quality of the coastal fresh water aquifers due to sea water intrusion. Most of these challenges; except that of climate change, are certain and interacting, and there are measures, plans and policies being prepared or under preparation to avoid its negative consequences. On the other hand, the challenges of the climate change are uncertain in terms of impacts, magnitude, spatial distribution, and the onset. Being recognized recently, the older strategies did not include sufficient actions to face its serious consequences which cannot be ignored. Only recent strategies and publications [e.g. Sayed et al. (2004), NWRP (2005), Attia (2009), El-Raey (2007 & 2010), Second National Communication (SNC-2010), El-Shennawy (2008&2011), Egypt’s National Strategy for Adaptation to climate change (NSACC-2011), Stratus (2012), El-Ganzory (2012) and Blanken (2012)] focused on climate change impacts and adaptations, and highlighted relatively general policies and measures in addressing related water risks and adaptations. Since this report is mainly concerned with climate change adaptation strategy for the water sector, the focus will be on developing necessary specific and quantified adaptation measures in terms of timing and size of the required works. The developed strategy will be developed in such a way that enables including these measures within the strategy of the MWRI that aims at achieving sustainable development. The following paragraphs review and highlight the river regulation and infrastructures, the High Aswan Dam, and water management: policies and strategies in Egypt.
3.4.a River Regulation, Infrastructures, and the High Aswan Dam The Nile is completely controlled by the High Aswan Dam and a series of barrages along its course to the Mediterranean Sea. Water released from the dam is distributed among the whole country through a network of major and branch canals, lateral and distributary canals and field channels. This large extensive irrigation network delivers water mainly under gravity through large number of hydraulic structures. Beside the gravity diversion, water is also delivered via pumping stations to lift water at some control points.

Joint Programme for Climate Change Risk Management in Egypt
Proposed CLIMATE CHANGE ADAPTATION STRATEGY for the Ministry of Water Resources & Irrigation EGYPT (2013)
Filename;\MhmdNour\CC Final Submitted 12-Feb2103 AdptStrtgy .docx page 22
The following Figure (3.1) shows the main structures on the Egyptian Nile and presents a typical spatial distribution of the 55.5 billion cubic meters all over the country. The allocated water includes all uses (drinking, industrial, and agricultural water). The Egyptian irrigation system is complicated but robust, and have an overall efficiency of more than 70%, which is relatively high in spite of the wide spread use of surface irrigation, because water is recycled and used several times. The irrigation system distributes water among main canals and regions based on volumetric quota defined according to served area, soil and climate conditions and cropping patterns. However, inside the main canals, control over branch canals is mainly by levels, which leads to mismatching allocated supplies from the upstream side with demands from the downstream. This results into unequal water distribution along the canals, which forces downstream users to lift water from the nearest drains to irrigate their lands. Other relevant infrastructures include the drainage system, the hydropower generation, and the irrigation and drainage pumping stations. The drainage system protects the irrigated soils against salt accumulation and enables recycling of the irrigation water. It consists of extensive drainage network of field drains, sub-collectors, and collectors and main drains, which either convey the drainage water back to the Nile, or discharge into coastal or inland lakes, or directly to the sea. The drainage system is mainly a gravity flow, except for a number of pumping stations in the Northern delta. To cope with water shortage in irrigation canals, re-use pumping stations mix drainage water with fresh water in the irrigation canals for further downstream use, especially in Fayoum and the Nile Delta. As mentioned above, there is significant hydropower generation from the HAD, Aswan Dam, and the main Barrages on the main Nile stream. The major problems facing the irrigation system can be summarized in the weak control on water distribution at the branch canal level, the absence of the cropping pattern, and the lack of maintenance funding. Therefore, the MWRI had introduced a series of irrigation improvement projects to overcome the problems of the aging irrigation systems and maximize the returns from the water units.
Figure (3.1) Main Structures and Typical Water Distribution in the Nile System source: NAWQAM project as presented in NWRP-2005
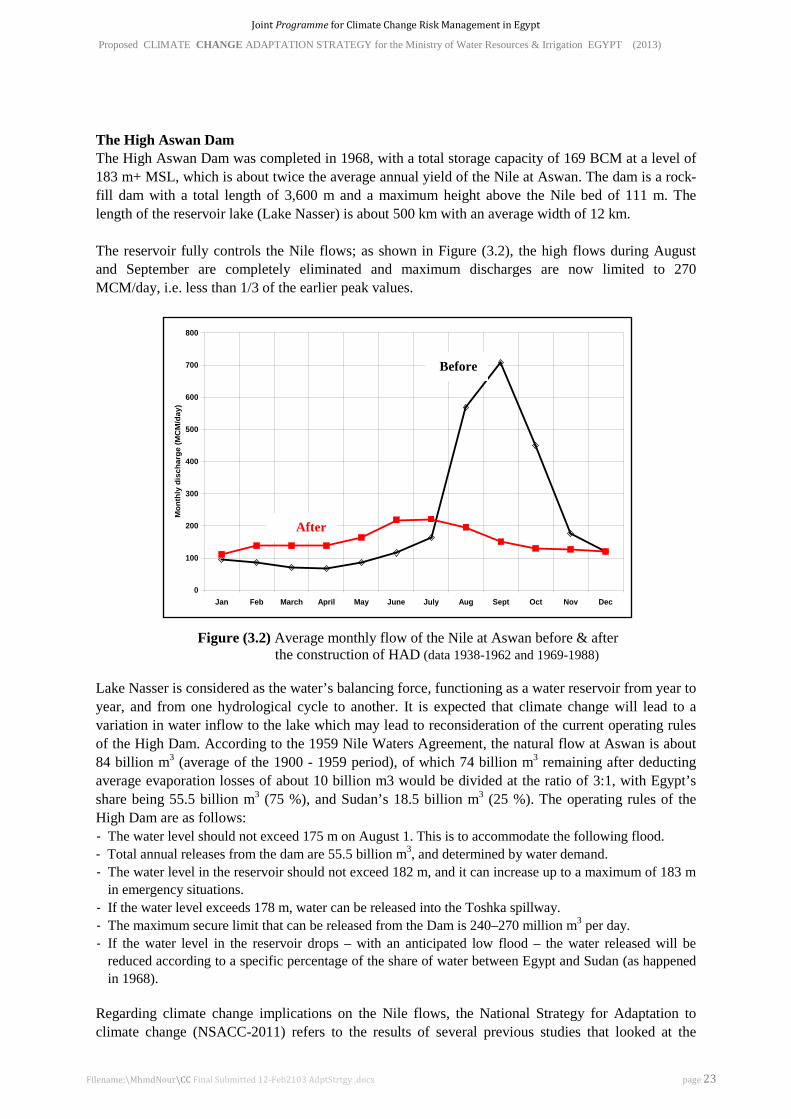
Joint Programme for Climate Change Risk Management in Egypt
Proposed CLIMATE CHANGE ADAPTATION STRATEGY for the Ministry of Water Resources & Irrigation EGYPT (2013)
Filename;\MhmdNour\CC Final Submitted 12-Feb2103 AdptStrtgy .docx page 23
The High Aswan Dam The High Aswan Dam was completed in 1968, with a total storage capacity of 169 BCM at a level of 183 m+ MSL, which is about twice the average annual yield of the Nile at Aswan. The dam is a rock-fill dam with a total length of 3,600 m and a maximum height above the Nile bed of 111 m. The length of the reservoir lake (Lake Nasser) is about 500 km with an average width of 12 km. The reservoir fully controls the Nile flows; as shown in Figure (3.2), the high flows during August and September are completely eliminated and maximum discharges are now limited to 270 MCM/day, i.e. less than 1/3 of the earlier peak values.
Figure (3.2) Average monthly flow of the Nile at Aswan before & after
the construction of HAD (data 1938-1962 and 1969-1988) Lake Nasser is considered as the water’s balancing force, functioning as a water reservoir from year to year, and from one hydrological cycle to another. It is expected that climate change will lead to a variation in water inflow to the lake which may lead to reconsideration of the current operating rules of the High Dam. According to the 1959 Nile Waters Agreement, the natural flow at Aswan is about 84 billion m3 (average of the 1900 - 1959 period), of which 74 billion m3 remaining after deducting average evaporation losses of about 10 billion m3 would be divided at the ratio of 3:1, with Egypt’s share being 55.5 billion m3 (75 %), and Sudan’s 18.5 billion m3 (25 %). The operating rules of the High Dam are as follows: - The water level should not exceed 175 m on August 1. This is to accommodate the following flood. - Total annual releases from the dam are 55.5 billion m3, and determined by water demand. - The water level in the reservoir should not exceed 182 m, and it can increase up to a maximum of 183 m
in emergency situations. - If the water level exceeds 178 m, water can be released into the Toshka spillway. - The maximum secure limit that can be released from the Dam is 240–270 million m3 per day. - If the water level in the reservoir drops – with an anticipated low flood – the water released will be
reduced according to a specific percentage of the share of water between Egypt and Sudan (as happened in 1968).
Regarding climate change implications on the Nile flows, the National Strategy for Adaptation to climate change (NSACC-2011) refers to the results of several previous studies that looked at the
0
100
200
300
400
500
600
700
800
Jan Feb March April May June July Aug Sept Oct Nov Dec
Mon
thly
dis
char
ge (M
CM
/day
)
After
Before

Joint Programme for Climate Change Risk Management in Egypt
Proposed CLIMATE CHANGE ADAPTATION STRATEGY for the Ministry of Water Resources & Irrigation EGYPT (2013)
Filename;\MhmdNour\CC Final Submitted 12-Feb2103 AdptStrtgy .docx page 24
implications of a change in the River Nile’s output, the deviations in water demand, and the share of the country’s water resources, and thus, the alteration in the economic situation, particularly with regard to the agricultural sector. Assuming that the current allocation ratio between Egypt and Sudan will be utilized to share the River Nile waters under climate change conditions, the National Strategy for Adaptation to climate change (NSACC-2011) foresees dividing deficit (under drying scenarios) or surplus (under wetting scenarios) according to same current ratios between the Sudan and Egypt.
3.4.b Water Management in Egypt: Policies, Strategies, and Constraints Attia (2009); in his review on water management in Egypt, pointed out that older water management strategies had always focused on developing new supplies to satisfy the ever increasing demand for all sectors, and focused on implementing infra-structure to convey and distribute these supplies among various users. Recently, more attention is given to reduction of demands, improvement of water quality, and consideration of the interests of all stakeholders. Traditionally, the MWRI’s role has chiefly been to ensure that all users (irrigation, domestic and industrial needs, navigation, energy production) receive enough and timely water resources to address their needs. Although the MWRI has always played the roles of policy formulator, system developer, system manager, system operator, and regulator, other ministries are to some extent involved in managing water resources with indirect roles with respect to law development and enforcement, monitoring and inspection, e.g. the Ministry of Health (MoH), the Ministry of State for Environmental Affairs (MoSEA), incorporating the Egyptian Environmental Affairs Agency EEAA. In addition to other the ministries who define their water demands and requirements, such as the ministry of Agriculture and Land Reclamation (MoALR), the ministry of Trade and Industry (MoTI), the ministry of electricity and energy (MEE), the ministry of transportation (MoT) the Ministry of planning (MoP), and the ministry of local development (LoD). The recently established Ministry of Infrastructures and utilities; (in 2012), became in charge of supplying or producing drinking and industrial water and sanitation instead of the Ministry of Housing. The responsibility of distributing domestic and industrial water and collection and treatment of sanitary water is given to local companies at the governorates’ level in order to foster business-like water management strategies. The MWRI is ultimately dependent on the State for its budget which restricts the resources available for improvements, modernization and rehabilitation. In fact, managing water resources has over the past 50 years become a more complex task: drainage and water quality issues have now significant impacts, while modern agriculture has much higher requirements regarding water supply. As a consequence, the MWRI has over the years diversified the technical capacity of its staff in order to tackle new responsibilities, such as drainage construction and maintenance, water quality monitoring, groundwater development and management, coastal protection, operation & maintenance of pump stations, etc. Specific units, departments or entities have also been established. The MWRI is divided into several departments, authorities, sectors and units. The main ones are:
• The Irrigation Department, which manages irrigation and subdivides into several sectors: the Irrigation Sector, the Irrigation Improvement Sector, the Ground Water Sector, and the Planning Sector
• The Egyptian Public Authority for Drainage Projects, responsible for implementing drainage projects and O&M of drains;
• The Mechanical & Electrical Department (MED), in charge of the maintenance and operation of all pump stations (irrigation, drainage, drainage reuse);
• National Water Research Center (NWRC), with its twelve specialized research institutes, which conducts applied research on irrigation and water management; and

Joint Programme for Climate Change Risk Management in Egypt
Proposed CLIMATE CHANGE ADAPTATION STRATEGY for the Ministry of Water Resources & Irrigation EGYPT (2013)
Filename;\MhmdNour\CC Final Submitted 12-Feb2103 AdptStrtgy .docx page 25
• The High Aswan Dam Authority (HADA), which operates and maintains the Aswan dam and reservoir.
• The Nile Water Sector, takes care of the upper Nile Water development In addition to these large entities, there are a number of small units with specific responsibilities and functions, such as the Central Directorate for Irrigation Advisory Service (CD-IAS), the Integrated Water Management Unit (IWMU), the Institutional Reform Unit (IRU), the Water Quality Unit (WQU), … etc. At central level, each main agency reports only to the Minister and thus operates quite independently. The yearly planning of activities of each entity is carried out based on sound technical criteria but social, environmental and cost-efficiency criteria are marginally considered. There is also limited, if any, consideration for the planning of other entities, and consequently limited cross-sectoral or geographic integration. At regional level, the country is divided into central directorates, each headed by an undersecretary. This MWRI undersecretary has nominal supervision over all MWRI activities. The various MWRI central departments, sectors and authorities function however separately with their own local delegations such as general directorates, inspectorates and districts. The boundaries of these do not generally match (at directorate level or below) from one sector/department/agency to another. The Ministry of Water Resources and Irrigation (MWRI) took important steps towards applying an Integrated Water Resources Management (IWRM) approach that is oriented towards the socio-economic development goals, and is considering all interests of agriculture, ecology, industrial development, transportation, fisheries, recreation, and public water supplies. The new policy elaborates further institutional reform in water management to improve the performance of the irrigation and drainage systems by transferring operational tasks to regional public entities or companies who perform multiple tasks with participation of the private sector and water users organizations (WUOs) at various administrative/division levels (participation and decentralization approach). In 2002, the MWRI cooperated with USAID started establishment of four Integrated Water Management Districts (IWMDs) as a pilot activity. The idea was to consolidate all water management functions at district level (about 20,000 hectares) into one sole MWRI entity. Simultaneously, Branch Canal Water User Associations (BCWUAs) were to be established to involve stakeholders in the management of water resources. This integrated water management at the district requires integration of staff, facilities, stakeholders, information, users, and water resources. The IWMD represents a unique venue to coordinate all water management activities and implement water projects, thus resulting in more appropriate decisions, more sustainable implementation and significant economies of scale. In 2004, the MWRIs and USAID started the LIFE-IWRM Project, targeting 5 entire directorates in Egypt having total area over 1 million feddan, with three main tasks: Establishment of new 23 IWMDs, Formation of Branch Canal Water User Associations (BCWUAs) in all IWMDs:, and Equitable allocation of water resources in all these districts. According to the NWRP (2005), the water conservation culture is among the essential elements of Egypt’s policy in the period 1997-2017. Conservation should include water use for domestic purposes, in irrigated agriculture, and in industry. The general long-term objectives for water resources development are: increasing inhabited space outside the Nile Valley and Delta by developing new cities and communities under industrial and touristic activities. Protect the Nile and other fresh water bodies from pollution. Promote integrated pest control and limitation of the use of agro-chemicals, extension of sewage networks and waste water treatment plants, and promotion of

Joint Programme for Climate Change Risk Management in Egypt
Proposed CLIMATE CHANGE ADAPTATION STRATEGY for the Ministry of Water Resources & Irrigation EGYPT (2013)
Filename;\MhmdNour\CC Final Submitted 12-Feb2103 AdptStrtgy .docx page 26
water conservation in domestic use, in agriculture, and in industry. These long-term objectives are transferred into five-year plans that are included in the policies of relevant ministries or stakeholders. The National Water Resources Plan (NWRP-2017 “Facing the Challenge” issued in 2005) has developed a national policy with three major pillars that are 1) increasing water use efficiency; 2) water quality protection; and 3) pollution control and water supply augmentation. The National Water Resources Plan describes how Egypt will use its water resources in a sustainable and responsible way from a socio-economic and environmental point of view. The planning horizon covers a period of 20 years since the start of the project in 1997 i.e. the year 2017. With the rapid growth of population and new land development for agriculture, there is a threat of more pollution. There is a need therefore to (i) reduce water use (demand management), (ii) optimize the supply (supply management), and (iii) abate water pollution (pollution control). This plan aims to develop new supplies (e.g., through deep groundwater abstraction, joint 'water conservation' projects in upstream countries, or seawater desalination), and to strengthen measures for demand management by different sectors (e.g., through re-use, improved irrigation efficiency, cultivation of less water-intensive crops, or import of food as 'virtual water') as well as water quality control. It is also trying to support and implement Non-technological demand management policies (e.g., the shift in cropping patterns towards less water-intensive crops, legal and economic regulatory instruments). It is suggested that the Egyptian strategy should consider an integrated approach to cope with this increasing pressure on the water resources system and contains a wide range of measures and policy changes up to the year 2017. It is a real challenge to implement this strategy. Further development of the system after 2017 may require that some drastic policy decisions are made at the national level, e.g. accepting some limitations in growth of the agricultural sector and increasing the developments and corresponding employment in the industrial and services sectors. An increase in the Nile water supply will ease the situation somewhat and should be pursued. In fact, a limited increase is not unrealistic, either as a result of water conservation projects in Sudan, changes in reservoir operation of Lake Nasser or (in the very long run) as a result of climate change. As mentioned in the NWRP (2005), the available climate change predictions are uncertain and were considered as insufficient as a base for policy decision. Accordingly, the NWRP did not pay enough attention for specific adaptation measures regarding the impacts of climate change. However, the introduced Integrated Water Management (IWRM) approach implicitly includes measures that can cope with the some climate change consequences. The 2050 water strategy of the MWRI (2010), aimed at ensuring long term water security for Egypt through some policies balancing supply and demand which recognize the limited water resources and the expected move from water poverty to water scarcity. It is based on six pillars: (1) reduce water losses in the upper Nile and develop groundwater resources, (2) water conservation in all sectors, (3) Rehabilitation of the national infrastructure of the irrigation and drainage networks, (4) combating water pollution, (5) adaptation to climate change impacts on water resources including sea level rise, and (6) targeting advanced and effective water resources management that create ownership feeling for all stakeholders. This 2050 strategy is intended to be reviewed and updated. It was developed using optimistic and pessimistic scenarios based on economical development and population increase and the expected change in demand for all sectors as well as the external stresses on the water system such as climate change impacts. The strategy briefly considered possible climate change impacts and presented some adaptation measures for the Nile flows, on the coastal zones, on precipitation rates at the coasts, and

Joint Programme for Climate Change Risk Management in Egypt
Proposed CLIMATE CHANGE ADAPTATION STRATEGY for the Ministry of Water Resources & Irrigation EGYPT (2013)
Filename;\MhmdNour\CC Final Submitted 12-Feb2103 AdptStrtgy .docx page 27
on the increased evapo-transpiration rates and changes in agricultural seasons. It also presented some possible adaptation measures to overcome these impacts. The strategy did not include vulnerability assessment for the mentioned impacts. As noticed from the above, the application of the Integrated Water Resources Management approach is an essential element in facing the future challenges to the water sector. However, as pointed out in the Egypt’s National Strategy for Adaptation to Climate Change (NSACC-2011), there are several constraints facing the successful application of IWRM in Egypt. The main constraints can be summarized in the following:
- Population increase; - Social and economic factors; - Fragmentation of agricultural tenure; - Free crop structure; - Lack of financial resources; - Water pollution; and - Lack of harmonized legislations
In fact, the legal framework is considered as one of the limitations hampering the application of the principles of integrated water resource management as a result of overlapping jurisdictions, weak penalties and fines related to water violations and slow litigation process. Moreover, centralized laws and decision making require the amendment of such laws in a manner that is suitable for the new variables in water resource management, and give more space to the private sector to participate in investments in this important service sector. At the same time, an institutional reform of the different state organizations is necessary, in a way that is commensurate with the requirements of integrated water management. According to the NWRP (2005), water management needs the support of an adequate framework that provides the water managers with guidelines and instruments for planning of new developments, for the allocation of water, for the operational management and maintenance of the irrigation and drainage systems, for the management of water quality and for financing all these activities. The most important laws in this regard are: Law 12 (1982)’ “Concerning issues of law on irrigation and drainage”, Law 213 (1994) “regarding farmers’ participation”, Law 48 (1982) “Concerning the protection of River Nile and water ways from pollution”, which is implemented by the Decree 8/1982 of the MWRI, and law 4 (1994) “law of the environment”. 3.5 The existing institutional and organizational climate change framework in Egypt This section reviews the existing institutional framework and related arrangements with regard to supporting the integration of climate change priorities into national development policies, strategies and programs, as given in the NSACC (2011) and Blanken (2012).
The Egyptian Environmental Affairs Agency (EEAA) has been established in 1982 as the highest authority responsible for promoting and coordinating all efforts related to environmental protection. In 1992, a Climate Change Unit (CCU) was established within EEAA, representing the focal point of the United Nations Framework Convention on Climate Change (UNFCCC) and Kyoto Protocol. The main task assigned to the CCU is the coordination and integration of all national and international activities relevant to climate change. Since July 1997, the EEAA is under the authority of the specifically appointed Ministry of State for Environmental Affairs (MSEA), and the CCU administratively has been upgraded and became a Central Department for Climate Change (CDCC) under MSEA.
An inter-ministerial National Committee of Climate Change (NCCC) was established in 1997, which comprised members representing a rather wide range of governmental and non-governmental stakeholders including private sector, scientific community and international organizations. The NCCC was assigned the following specific mandates: (1) coordinating the participation of Egypt in the
Joint Programme for Climate Change Risk Management in Egypt
Proposed CLIMATE CHANGE ADAPTATION STRATEGY for the Ministry of Water Resources & Irrigation EGYPT (2013)
Filename;\MhmdNour\CC Final Submitted 12-Feb2103 AdptStrtgy .docx page 28
UNFCC on the national level; (2) developing an overall policy for dealing with the issue of climate change; (3) reviewing the National Action Plan for Climate Change; and (4) following up on the implementation of the UNFCC. In 2007, the NCCC was restructured by a Prime Ministerial Decree, and since then is directly headed by the Minister of State for Environmental Affairs. However, this restructuring hardly changed the composition of the committee’s membership and also did not lead to any major revision of its key mandates.
In addition, a National Authority for the Clean Development Mechanism (CDM) has been established in 2005, which is also headed by the Minister of State for Environmental Affairs, and composed of high level governmental representatives from different relevant sectors, including the business and scientific communities as well as NGOs.
A New and Renewable Energy Agency was created in 1986 in the Ministry of Electricity with the aim of promoting renewable energy projects and schemes in Egypt. A Supreme Energy Council (SEC) was established in 2007 with the mandate of supervising and coordinating energy policies on the national level. This Council is composed of relevant ministers and headed by the Prime Minister. A Regional Center for Renewable Energy and Energy Efficiency was established in 2009, and is located within the Ministry of Electricity, and it aims at promoting renewable energies and energy efficiency in the MENA countries.
The Ministry of Water Resources and Irrigation had established the Nile Forecast Center (NFC) since mid 1990s as well as the Environmental and Climate Research Institute (ECRI) of the National Water Research Center (NWRC) since 1997. The NFC is working actively in forecasting Nile flows at different levels, and had built high capacity in climate modeling. While ECRI is more concerned with environmental and climate change impact assessment as well as adaptations. In addition to that, the Coastal Research Institute (CoRI) is working on assessment of sea level rise impacts on the coastal zones and is involved in developing an integrated coastal zones management plan (ICZM).
The ministry of Agriculture and land reclamation also established the Climate Laboratory Agricultural Center since mid 1990s. Recently, a ministerial committee for climate change has been established within the Ministry of Agriculture and Land Reclamation (MALR), its mandate is to supervise mainstreaming of climate change policies into the national plans. Similarly, the Ministry of Water Resources and Irrigation has established another ministerial committee for climate change headed by the Minister, overseeing the mainstreaming of climate change policies into national plans. The National Authority of Remote Sensing and Space Science (NARSSS) had also created a climate change department. In addition NARSSS has been monitoring the earth since 2007 and has also set up a station to receive data coming from satellites of the U.S. National Oceanic and Atmospheric Administration (NOAA), the French earth observation satellites (SPOT), and others. Furthermore, the Institute for Higher Studies for Environment of the University of Alexandria monitors the shores of the Mediterranean Sea, while the National Institute of Oceanography and Fisheries monitors the shores of the Red Sea, and the Faculty of Science in Ain Shams University controls the quality of samples analyzed by both agencies. Besides, there are several valuable research activities by individuals, e.g. in the faculty of science of Cairo University and the Egyptian Authority of Meteorology.
The Alexandria Research Centre for Adaptation to Climate Change (ARCA) was established recently and supported by the International Development Research Centre (Ontario-Canada). ARCA will support multidisciplinary, policy oriented research on climate change adaptation. It will help building capacity in climate change adaptation through scholarships, training workshops and mentorship. It will work with policymakers to draw up a policy-relevant research agenda, and then support that agenda by means of a small grants competition.
From the foregoing, it can thus be concluded that over the past few years, Egypt has made quite significant progress in establishing the institutional framework and in building national capacity in the field of climate change. At present, several organizations are extensively involved at the national level

Joint Programme for Climate Change Risk Management in Egypt
Proposed CLIMATE CHANGE ADAPTATION STRATEGY for the Ministry of Water Resources & Irrigation EGYPT (2013)
Filename;\MhmdNour\CC Final Submitted 12-Feb2103 AdptStrtgy .docx page 29
in climate change related activities. These include environmental and energy organizations, research centers, universities, governmental organizations and laboratories, and about 200 non-governmental organizations.
These multi-layer climate change institutional arrangements can be employed to play a leading role in integrating climate change issues into the national development agendas. However, for research related to the science of climate, there is a need to upgrade the National capacity to better understand climate change and the exact nature of its impact, aiming at the development of a regional climate change model, specifically through the combined efforts from both the remote sensing and meteorological research authorities. For research dealing with the likely impacts of climate change, there is a strong need for integrated research that assesses climate change impacts on coastal zones, water resources and human health at the same time, with specific emphasis on the potential impact on water resources. As for policy oriented research, the following were among the areas identified: mitigation modeling of GHGs emissions in the agricultural sector is needed, especially the estimation of Carbon fraction in Egyptian rice fields. In the petroleum sector, a comprehensive study for measuring and monitoring CH4 emissions from exploration, transmission, and distribution is needed.
As far as coastal zones and the specific problem of climate change and sea level rise (SLR) are concerned, the NSACC-2011 stresses the fact that recent efforts have led to the establishment of the National Committee for the Integrated Management of Coastal Zones, under the umbrella of EEAA. All the ministries, authorities, bodies, and individuals relevant to coastal zones are represented in this committee in order to determine an effective mechanism to put an end to competition among stakeholders, and to develop the best way of exploiting coastal zones in an integrated manner rather than a competitive one. In this particular regard, the NSACC also observed that, in light of the anticipated negative impacts of climate change and SLR on the coastal zones, it is necessary to enhance the established institutional entity or to create a mechanism to maximize the use of coastal resources, and to reduce conflicting and overlapping prerogatives. According to the National Environmental, Economic and Development Study for Climate Change (NEEDS), dated April 2010, there are, however, several opportunities for improving the currently existing institutional framework related to climate change issues. In this regard, the NEEDS particularly points out that adaptation issues together with the need to develop capacities for adequately addressing them are of particular significance. Among the options briefly outlined and proposed in the NEEDS, we can cite the suggested establishment of an independent National Scientific and Technological Committee, which would complement the currently existing set-up and whose main task would be to offer advisory support to top level decision makers. Furthermore, the opportunity of establishing a National Research Center focusing on the different aspects of climate change was to be considered according to the NEEDS. This center would allow networking with existing research institutes in sectors relevant to climate change, as well as represent a think tank for decision makers to determine and prioritize climate change needs and the policy instruments for meeting these needs. The institutional needs identified in the frame of the NEEDS with regard to coastal and SLR (at an estimated total cost of 20 million US$) mainly comprise:
- Establishing and promoting an institutional capacity for “adaptation”, through initiating the establishment of a National Center for Climate Change, with the following main responsibilities: (i) integrating activities and outputs of various vulnerability assessments of coastal zones (as well as other vulnerable sectors); (ii) integrating already existing results; (iii) building up a geographic database for vulnerability indices; (iv) integrating success stories; and (v) advising various sectors on proper policy and measures of adaptation;
Joint Programme for Climate Change Risk Management in Egypt
Proposed CLIMATE CHANGE ADAPTATION STRATEGY for the Ministry of Water Resources & Irrigation EGYPT (2013)
Filename;\MhmdNour\CC Final Submitted 12-Feb2103 AdptStrtgy .docx page 30
- Upgrading environmental regulations through adopting Strategic Environmental Assessment for large scale and national projects in coastal zones, including a component for climate change in project environmental impact assessments (EIA);
- Development of a national strategic action plan for adaptation to sea level rise with recommended policies for each sector in the coastal zones;
- Establishment of an Adaptation Policy Monitoring and Assessment Unit (APMAU);
- Building institutional capacities and carrying out training.
According to the NSACC-2011, there is also some room for improving the current institutional framework relating to climate change issues. However, it clearly states that reforming and adjusting institutional frameworks does not necessarily mean establishing new ones. Accordingly, priority should be given to enhancing the existing institutions as necessary, e.g. by implementing the following measures: (i) including the issue of adaptation to climate change in their list of assignments; (ii) amending the terms of reference and staff job descriptions in order to comply with the adaptation requirements. In this context, it was recognized that in addition to institutional reforms and amendments, the existing legislative and regulatory framework also needs to be amended and further developed, building on and starting from the currently prevailing legislations. Finally, strengthening the national information exchange system on climate change related issues is identified as one of the key determinants of implementing the national adaptation strategy. Given that climate change is an all-embracing issue that intersects with several national activities and systems, the NSACC-2011 considers essential that the various sectors stop acting individually and in a fragmented manner. The need for establishing a common database that all can have access to, in order to exchange information and utilize its content, is clearly recognized. One of the key elements of the strategy is to define the main structure of the proposed national climate change information system, and how individuals, groups, and institutions can make use of this system.

Joint Programme for Climate Change Risk Management in Egypt
Proposed CLIMATE CHANGE ADAPTATION STRATEGY for the Ministry of Water Resources & Irrigation EGYPT (2013)
Filename;\MhmdNour\CC Final Submitted 12-Feb2103 AdptStrtgy .docx page 31
4.0 The Coastal Zones of Egypt Many areas along the Egyptian coasts are at risk from natural and man-made impacts, created by geological (e.g. land subsidence) and meteorological disturbances of sea surface and human interventions to the coasts. These risks are of two kinds (i) short term risks associated with storms, swells, reclamation pollution, etc., and (ii) long-term risks related to climate change, sea level rise, damming of the river, coastal protection measures, etc. Often, it is a mixture of these two effects. The coastal zones of Egypt are classified according to their vulnerability and the potential harm resulting from rising sea level and extreme events. The criteria or standards used to classify the coastal zones can be summarized in: (1) the surface elevation which distinguishes the high and low areas relative to the average sea level, (2) the subsidence rate which is a result of compression of subsurface sediments, (3), the erosion rates (resulting from regression) and sedimentation (resulting from transgression), (4) relative sea level rise, (5) the presence of natural coastal protection, whether natural or manmade, (6) the permeability and porosity of rocks and subsurface sediments in terms of allowing seawater intrusion, and (7) the presence of active torrential rain spillways or those which may become active after flash-floods (which is the case in the Red Sea and Arish Valley).
4.1 The Mediterranean Coast The Mediterranean Coast is divided into 4 parts: the first one is the North-West coast stretching from Alexandria to Salloum, which has an average level 10 to 110 meters above sea level, is considered safe against the impact of rising sea levels, with the exception of few low-lying areas located at wadis outlets. This safety is also due to the presence of continuous and parallel groups of ridges, and rocky lime hills near the coast, with heights ranging from +5 and +10 meters above sea level. Emerged or submerged lime barriers function as natural barriers to sea water intrusion. Besides, there is no subsidence or erosion rates have been registered. However, local erosion results from protection construction activities in the coastal zone. The 2nd part is the coast of the city of Alexandria which is characterized by its diverse topography. Surveys and recent assessment indicated that about 60 km or 67% of Alexandria’s seafront; represented by a narrow coastal strip extending from Abu Qir to Al-Agamy, lays on a hill or a raised barrier of limestone, with an average elevation of +4 meters above sea level , which provides natural safety against sea level rise, with exception of some low-lying areas. There are engineered protection measures for about 8.2 km or 20% of the total length of the coast. Finally, the vulnerable areas represent about 13% of the total length of the Alexandria coast. The 3rd part is the Nile Delta shoreline which extends from Alexandria in the west to Port Said in the east, with a total length of about 240 kilometers. This zone consists of sandy and silty shores of greatly varying lateral configurations, depending on where the old branches of the Nile have had their outlets. The coastline has two promontories, Rosetta and Damietta, and three brackish lakes—Idku, Burullus, and Manzala—are connected to the sea. There are five harbors located on the coast: Idku, New Burullus, and El Gamil for fishing; while Damietta and Port Said are commercial ports. This part represents the major industrial, agricultural, and economic resource of the country. It is home to over 40 percent of Egypt’s population of 80 million and to about 50 percent of the nation’s industrial and commercial activities. The region is characterized by relatively low land elevation, which leaves it severely exposed to rising sea levels. In addition, it suffers from local land subsidence, compounding the effects of rising seas. Some estimates indicate that the northern delta region is subsiding at a rate that varies from about 0.60 mm/yr at Alexandria to about 3.5 mm/yr at Port Said. Alexandria and Port Said are the main economic centers of the coastal zone. These cities are vulnerable to sea level rise as a result of the low elevation of adjacent land below sea level. The Mohamed Ali Seawall; built in 1830, protects the lowland area southeast of Alexandria against

Joint Programme for Climate Change Risk Management in Egypt
Proposed CLIMATE CHANGE ADAPTATION STRATEGY for the Ministry of Water Resources & Irrigation EGYPT (2013)
Filename;\MhmdNour\CC Final Submitted 12-Feb2103 AdptStrtgy .docx page 32
inundation by water from Abu Qir Bay, and narrow strips of elevated land protect the southern area of Port Said. Many smaller towns and villages on the northern coast are also vulnerable to sea level rise. Like other deltaic regions worldwide, the Nile Delta is subject to shoreline changes resulting from erosion and accretion, subsidence, and sea level rise resulting from climate change. Several studies indicated that a large percentage of the Nile Delta is directly vulnerable to inundation and saltwater intrusion that could drive millions from their homes. The Nile delta had been exposed to serious erosion after the construction of the High Aswan Dam since 1968, when the sedimentation rates from the Nile floods had decreased significantly. The Egyptian Shore Protection Authority (SPA) was established in 1981; under the Ministry of Water resources and irrigation, to monitor, plan, coordinate, and implement all necessary works for shore protection projects in consistency with the socio-economical plans of the country. In addition to that, the Coastal Research Institute (CoRI) of the National Water Research Center is providing technical support and essential studies required for SPA. Since that time, the SPA had implemented several protection projects along the Nile Delta shore line that helped to secure several vulnerable areas along e Nile Delta coast line. The cost of these projects reached about one billion Egyptian pound. These projects used a variety of protection works according to the site specific natural conditions, the objectives of the protection works and its cost, the amounts of moving sands and its movement, and its impacts on neighboring areas. The SPA in coordination with CoRI and several international agencies are about to launch an integrated coastal zone management plan (ICZM) to further secure and sustainably develop the coastal zones of Egypt taking into account expected sea level rise. The 2012-2017 plan of the SPA has several projects of a total value of about 770 million Egyptian pounds. These projects include: enhancement of Rashid protection wall, protecting the beaches of Alexandria, Port Saied and Al-Arish, Damietta, Kafr E-Shikh, and El-Malaha area east of Port Saied. The Nile Delta coast is divided into three sub zones depending on the degree of exposure and vulnerability to the risk of erosion and sea level rise. The following Figure (4-1) shows the naturally protected areas in green (accretion beaches, sand dunes, and long limestone ridges), the unprotected areas in blue, and the artificially protected areas in red crossing lines (protective sea walls and barriers). It also shows low lying risk areas (in pink) with an elevation ranging between 0 to -3 meters below sea level, as well as the lakes, and the low area with elevations ranging between 0 to +1 , +1 to +2, and +2 to +3 meters above sea level. It also shows the more vulnerable areas requiring future measures of adaptation (areas indicated with the arrows).
Figure (4-1) Protected and unprotected areas along the shoreline of the Nile Delta
source: Egyptian Authority for Coastal protection & Information and Decision Support Center– Advisory Committee for Crisis/ Disaster Management and Disaster Risk Reduction.

Joint Programme for Climate Change Risk Management in Egypt
Proposed CLIMATE CHANGE ADAPTATION STRATEGY for the Ministry of Water Resources & Irrigation EGYPT (2013)
Filename;\MhmdNour\CC Final Submitted 12-Feb2103 AdptStrtgy .docx page 33
The following Table (4-1) shows the length and percentage of naturally and artificially protected shores to the total length of the Delta shores, from Abu Qir up to Sahl El Tina, which is estimated at about 301.57 km. Table (4-1) Length and percentage of protected shores to the total length of delta shores
Length of Delta
Coasts (Km)
Length of Naturally and Artificially Protected Coasts Length of Unprotected Coasts Natural Protection Artificial Protection
Km % Km % Km % 301.57 128.3 42.54 52.61 17.45 120.66 40.01
Source: Information and Decision Support Centre – Advisory Committee for Crisis/ Disaster Management and Disaster Risk Reduction.
The 4th part is the Sinai Coast which is characterized by some natural features that protect it against the impacts of sea level change, as they are + 3 to +5 meters above sea level. In addition, the presence of scattered groupings of sand dunes along the coast and accretion shores act as a natural defense line against sea encroachment or sea level rise with the exception of some areas that are below sea level. It should be mentioned that there is no subsidence rates have been recorded for these areas.
4.2 The Red Sea Coast The coastal zone of the Red Sea on the Egyptian side is generally narrow because a mountain chain runs relatively close to the shoreline. The coast is composed of a large number of small bays or gulfs, and small beaches. Fragmented and extended coral reef communities, with their rich marine life, extend over large areas of the coast. The tidal range varies between 110 and 130 centimeters. The population is concentrated in a number of cities along the coast and a few scattered villages in between them. In the north, the Suez Canal connects the Red Sea with the Mediterranean, providing a vital international waterway and important source of income to Egypt. Further south, the area has a large number of well-known diving sites because of its rich and highly diversified coral and mangrove communities. Major resort cities such as Dhahab, Hurghada, Nuweiba, and Sharm El-Shikh on the Red Sea employ a significant portion of the local population. The Red Sea coral reefs are among the most spectacular in the world, supporting a high level of biodiversity with over 1000 named species and many more yet to be identified. Nevertheless, coral reefs usually have a relatively high growth-rate. It is not known whether sea level will rise slowly enough to allow the corals to grow upward and to what extent the coral reef will not be instrumental in coast protection. In addition, these coral reefs are especially sensitive to variation in sea surface temperatures, and when physiologically stressed, corals may lose symbiotic algae, which supply nutrients and colors. At this stage, corals appear white and are referred to as bleached. In 2006, two phenomena of coral reefs bleaching had been monitored in Egypt. The first occurred in the extreme low tide exposing coral reefs to direct air causing a loss of vitality. This phenomenon continued for a few days during spring season, where some areas remained affected and has not recovered. Sea level rise will not extensively inundate the Red Sea coast of Egypt because of the steep drop of the coastal sea bed, and also because the coast does not subside due to its rocky formation. However, there is exception in some shores where coral reefs were removed to construct artificial lakes, and also low shores where beaches are leveled at elevations 0 to +1 meters above sea level are subject to inundation.

Joint Programme for Climate Change Risk Management in Egypt
Proposed CLIMATE CHANGE ADAPTATION STRATEGY for the Ministry of Water Resources & Irrigation EGYPT (2013)
Filename;\MhmdNour\CC Final Submitted 12-Feb2103 AdptStrtgy .docx page 34
It is worth mentioning that, the local parts of the coastal plain - extending landwards from the shoreline to the back of the mountains’ area – are threatened by the risk of torrential rains, which flow downwards through spillways which become occasionally active as a result of sudden seasonal rainfall (flash floods). Although sandy beaches in the Red Sea are limited in area, and are found in the winding coastal areas, they are of great environmental and tourism importance. Leveling at 0 to +3m above sea level, it is expected that the low shores with levels ranging between 0 and + 1 meter will be inundated in case of a sea level rise as a result of climate change. 4.3 The Northern Lakes The Egyptian Northern coastal lakes (i.e. mainly Lake Mariout, Lake Manzala, Lake Edku, Lake Burullus, and Lake Bardaweel) are among the most productive natural systems in Egypt, and they are internationally renowned for their abundant bird life. They are estimated to provide 65 % of the country’s total fish production. The Northern part of the Nile Delta is subject to severe coastal erosion as well as the expected SLR, which is further aggravated by land subsidence of the Nile Delta, thus resulting in a higher relative SLR by the end of the century. Blanken (2012); summarized the problems facing these lakes and their vulnerability to climate change according to the information provided by the National communication reports (INC-1999 & SNC-2010) and the National Strategy for Adaptation to climate change (NSACC-2011) in the following:
• A continuing decrease in the open water area, due not only to land reclamation, but also to the increase in aquatic vegetation. The latter problem is a result of the common practice of building Hoshas, basins to isolate water bodies to catch fish, a local custom of isolating water bodies to catch fish.
• A high level of lake water pollution, due to the industrial, agricultural and sewage wastes poured into the lakes through the drains.
• A deterioration of the fisheries in the lakes, due to over fishing and the use of illegal fishing methods.

Joint Programme for Climate Change Risk Management in Egypt
Proposed CLIMATE CHANGE ADAPTATION STRATEGY for the Ministry of Water Resources & Irrigation EGYPT (2013)
Filename;\MhmdNour\CC Final Submitted 12-Feb2103 AdptStrtgy .docx page 35
P A R T TWO
5.0 Climate Change Projections and Impacts on the Water Sector in Egypt Adaptation of water management to climate change implies balancing water demands and resources under an uncertain and changing situation. Scenarios and models handle this uncertainty by providing information on possible futures; these in turn depend on policy choices. These predictions are build on available information and feed into the vulnerability assessments. Figure (5-1) provides an overview of how data, scenarios and models are used to develop an adaptation strategy to climate change. Scenarios are alternative images of how the future might unfold and are an appropriate tool for analyzing how driving forces may influence future emissions and for assessing associated uncertainties. Climate scenarios are developed to describe different possible futures, based on certain choices and assumptions about greenhouse gas emissions. Based on the different climate scenarios, climate models can be run to provide information on possible future climate conditions in a certain region. Global climate models (GCMs) estimate the effect that emissions have on global climate. GCMs describe important physical elements and processes in the atmosphere and oceans and on the land surface that make up the climate system. To conceptualize and investigate the link between climate and water resources, it is necessary to combine GCMs and hydrological models. The main issue of coupling these models, as stated below, is that climate scenarios should be compatible with the catchment scale. Typically, a GCM has a resolution of a few hundred km, which makes it difficult to represent local basin-scale features and dynamics. Therefore, there is a need to convert the GCM outputs into at least a reliable daily precipitation and temperature time series at the basin scale (downscaling). Regional climate models (RCMs) provide similar information, only at a smaller resolution, which is more suitable for developing adaptation strategies at the river basin level.
Figure (5-1) Scenarios, data, models and water adaptation strategies (source: WHO - 2008)
Observed hydro meteorological
data
Climate scenarios
GCM
Statistical downscaling / RCM
E + ET Temperature
Precipitation
Hydrological Modelling
Observed
hydrological data
Storage Run-off
GW recharge
Water Resources
Development scenarios
Water Demand
Multi-Stakeholder approach
Forecasted data
Forecasted data

Joint Programme for Climate Change Risk Management in Egypt
Proposed CLIMATE CHANGE ADAPTATION STRATEGY for the Ministry of Water Resources & Irrigation EGYPT (2013)
Filename;\MhmdNour\CC Final Submitted 12-Feb2103 AdptStrtgy .docx page 36
The process of downscaling GCMs into daily meteorological variables which is appropriate for hydrologic impact studies can be done in two basic ways:
• Dynamically (simulating physical processes at sub-grid level), leading to RCMs; or • Statistically (transforming coarse-scale climate projections to a smaller scale based on
observed relationships between climate at the two spatial resolutions, and comparing forecasted data from the GCM with observed meteorological data).
The choice of the most appropriate downscaling technique partly depends on the variables, seasons and regions of interest. Demographic changes, economic and socio-economic developments influence the hydrological cycle and at the same time have impacts on water demands. Based on the current and future social and economic goals set out by countries, demographic and economic scenarios have to be developed that will be very different in various regions and have to be combined with different climate scenarios. The developed scenarios, together with the forecasted data from the climate models, are the basic input for hydrological models. These models calculate the hydrological responses to rainfall based on local characteristics such as soil characteristics, the type and density of vegetation cover, and land-use characteristics. The models provide output on the future hydrological conditions in a river basin. The model output includes information on available water resources as well as water demands, thus providing background information for assessing the vulnerability in a basin. 5.1 Projections and Impacts of Climate Change on the Nile Flows Being the most downstream country on the Nile, Egypt is affected by climate change impacts, not only within its borders, but also due to changes within the whole basin, which is shared with 10 other countries. Economic developments in upstream countries and the measures they might take to adapt to climate change are likely to put more pressure on water resources in Egypt. The rapid development of the Ethiopian dams is a clear example of these development effects. Despite the inter-annual storage in Lake Nasser behind the High Aswan Dam, the vulnerability of Egypt to changes in river flows due to climate change is acute and high. El-Raey et al, (1995) identified water resources as one of the three most vulnerable sectors to climate change in Egypt; the others being coastal zones and agricultural resources. In addition to that, the rapid increase in population and urbanization will aggravate this vulnerability, given the strong linkages of the Nile River, Nile Delta, Coastal resources, and surrounding deserts.
Regarding future impacts of climate change on the Nile flows, there is some disagreement between the general circulation models (GCMs) about whether the Blue Nile; which contributes more than 75% of the Nile flows, will get wetter or drier. Roughly two-thirds of the general circulation models (GCMs) project an increase in precipitation in East Africa, while the others expect reduced precipitation. This means that the future climate changes in East Africa is uncertain. One thing is virtually certain: the Nile Basin has become warmer and the warming will in all likelihood continue. Therefore, this uncertainty should not paralyze policy makers and water managers and stop them from rethink and re-evaluate current policies. The Second National Communication (SNC-2010) report stated that associated potential impacts would be both significant and severe, and that any decrease in the total supply of water, coupled with an expected increase in consumption due to continuing high population growth rates and rising incomes and living standards, would have drastic impacts, thus making water management one of the most important sectors for adaptation measures.
The impact assessment of the SNC-2010 addressed the sensitivity of Nile river waters to CC. As far as uniform changes in rainfall of different Nile basins are concerned, the main results from previous studies are presented in the following Table (5-1). It clearly shows that the Eastern Nile (Atbara and the Blue Nile) is extremely sensitive to rainfall changes (both positive and negative), while the

Joint Programme for Climate Change Risk Management in Egypt
Proposed CLIMATE CHANGE ADAPTATION STRATEGY for the Ministry of Water Resources & Irrigation EGYPT (2013)
Filename;\MhmdNour\CC Final Submitted 12-Feb2103 AdptStrtgy .docx page 37
Equatorial Nile flow (Lake Victoria at Jinja) has a low sensitivity and the Bahr El Ghazal Basin (White Nile at Malakal) a moderate sensitivity to such changes in rainfall.
Table (5-1): Sensitivity of Nile flow to uniform change of rainfall in Nile sub-basins
Sub-basin
Change in rainfall (%) -50 -25 -10 +10 +25 +50
Corresponding change in water flow (%) Atbarra (Atbara) -93 -60 -24 +34 +84 +187 Blue Nile (Diem) -92 -62 -24 +32 +78 +165 Blue Nile (Khartoum) -98 -77 -31 +36 +89 +149 Lake Victoria (Jinja) -20 -11 -4 +6 +14 +33 White Nile (Malakal) -41 -28 -11 +19 +48 +63 Main Nile (Dongla) -85 -63 -25 +30 +74 +130
Source: Sayed et al.., 2004. The sensitivity of Nile water flows is also affected by temperature changes, causing corresponding changes in evaporation and evapo-transpiration. Accordingly, an increase of 4 % in evapo- transpiration was estimated to result in a reduction of Blue Nile and Lake Victoria flows by 8 % and 11 %, respectively (Hulme M., 1994). Recently, Stratus (2012) briefly reviewed the literature on potential climate change impacts on Egypt’s water resources and pointed out the high sensitivity of the Nile flow to changes in climate as it crosses arid and semi-arid climate zones. In such areas, runoff is typically very sensitive to changes in climate. As mentioned in the Second National Communication report (SNC-2010), a 10% decrease in precipitation over the sources of the Nile can result in a 31% decrease in flow of the river at Khartoum, whereas a 10% increase in precipitation is estimated to result in a 36% increase in flow at the same location. Flow is also very sensitive to changes in temperature. This apparent uncertainty is mainly due to the imperfect knowledge regarding future emissions and concentrations of greenhouse gases in the atmosphere which depend on socio-economic pathway, which; in turn, depends on factors such as population, economic growth, technology development, energy demand and methods of supply, and land use. This is in addition to the different imbedded assumptions used in the GCMs. There is significant improvement in climate modeling that aiming to reduce this uncertainty. Climate models may be classified according to the approach used in obtaining future predictions under 4 categories: sensitivity studies, impact studies (direct use of GCM scenarios), statistically downscaled scenarios, and dynamically downscaled scenarios. Different studies on climate change impacts have shown the potential for very significant changes in the flow of the Nile due to its sensitivity to changes in temperature and precipitation; Sayed et. al (2004). Conway and Hulme (1996) estimated that future flow in the Blue Nile in 2025 could range from an increase of 15% to a decrease of 9%. Strzepek et al. (2001) estimated the 2020 flow coming into the HAD could decrease by 10 to 50%. El-Shamy et al, (2009c) used bias-corrected statistical downscaling of 17 GCMs to estimate an average reduction in flow of the Blue Nile of 15% by the end of the century, and a range of change from a decrease of 60% to an increase of 45%. Table (5-2) shows the results of simulated flows of the blue Nile at El-Diem as given by El-Shamy (2009). In fact, this wide range seems to be unrealistic, and may be attributed to the high uncertainty in far future predictions. Beyene et al, (2009) also used bias-corrected statistical downscaling of 11 GCMs and found a change in flow at the HAD ranging from a decrease of 32% to an increase of 15%. These researchers used the estimates of change in flow from El-Shamy et al, (2009) in their calculations of change in water supplies.

Joint Programme for Climate Change Risk Management in Egypt
Proposed CLIMATE CHANGE ADAPTATION STRATEGY for the Ministry of Water Resources & Irrigation EGYPT (2013)
Filename;\MhmdNour\CC Final Submitted 12-Feb2103 AdptStrtgy .docx page 38
Table (5-2 ) Model-simulated flow of the Blue Nile at Diem (BCM) GCM 1961–1990 2081–2100 % Change BCM 48.96 37.34 -24 CGCM 50.57 20.70 -59 CGCM63 50.82 20.38 -60 CNRM 52.24 44.80 -14 CSIRO30 47.99 34.96 -27 CSIRO35 46.66 34.96 -25 CM20 46.45 28.85 -38 CM21 47.46 34.31 -28 AOM 48.44 49.33 2 GOAL 47.65 50.68 7 INMCM 42.82 56.45 32 MIROCH 47.74 47.74 0 MIROCM 46.93 68.25 45 ECHAM 44.18 35.74 -19 MRI 50.30 33.00 -34 CCSM 32.84 40.15 22 PCM 48.60 35.38 -27 Mean 47.10 39.82 -15
source: El-Shamy et al, (2009) , Nile Forecast Center The SNC (2010) reported that lower flows in the Nile would negatively affect Egypt’s economy through impacts on agriculture, industry, tourism, hydropower generation, navigation, fish farming, and the environment. High flows, while increasing total water supply, would also necessitate more expenditure on infrastructure to control flooding and to accommodate required storage. Annex (A2) contains the summary of a distinguished literature review written by DHI (2011) for climate change and the river Nile under a UNEP project for assessing impacts of climate change on water resources in the Nile Basin. The objective of this project is to provide the MWRI with state of the art of climate change information and build capacity in regional climate modeling so as to assess the large scale uncertainties associated with climate projections over the Nile basin. It reviewed previous key studies of climate change over the Nile Basin, and methods of combining climate change modeling and hydrological modeling for key hydrologic characteristics of the Nile Basin, reviewed also methods of combining climate change modeling and hydrological modeling of water resources impact assessment. This review emphasized the use of multi-model ensembles means to derive average climate projections, to give better understanding of the inherent uncertainties and the discrepancy of the GCMs, because it is insufficient to assess impacts of climate change using a single model. This is addressed by either using statistical or dynamical downscaling methods. Statistical methods are simpler and less-time consuming than dynamical methods. It enables improving the GCMs projections by applying correction or change factors that account for systematic biases. Dynamical downscaling refers to the use of GCM-RCM combinations to improve the resolution of the important climate processes as it employs a physical-based approach to downscaling. However, there are limits to how far the resolution should be improved. Due to the few number of available regional climate models of the Nile, this review recommended the importance of establishing RCM-based scenarios to provide new information for future work towards probabilistic climate modeling and eventually risk-based decision-making. Under this project, a set of 5 GCM ensemble members was initially selected from the available 17 transient runs. The selection was made to represent both the most likely/plausible as well as the largest possible range in results to give an indication of uncertainty.

Joint Programme for Climate Change Risk Management in Egypt
Proposed CLIMATE CHANGE ADAPTATION STRATEGY for the Ministry of Water Resources & Irrigation EGYPT (2013)
Filename;\MhmdNour\CC Final Submitted 12-Feb2103 AdptStrtgy .docx page 39
The current adaptation strategy should include these future climate change uncertainties of the Nile flows, as well as the certain growing population and the expected reductions of the Nile water due to competition among the eastern Nile countries. Therefore, this adaptation strategy considers both wetting and drying predictions under increasing demands due to raised temperature as well. Accordingly, both extremes will be used to develop two sets of water budget trends (drying and wetting) along future times, 2025, 2050, 2075, and 2100. This would enable configuring the situation in terms of supplied volumes and required demands under wetting and drying situations. Accordingly the developed water management strategies will implicitly define some climate change adaptations measures. The Water strategy should be dynamic and to be continuously revised and updated according to progress in science, knowledge, and acquired capacity in dealing with climate change impacts. The following Table (5-3) presents the estimated percentage change for the assumed wetting and drying scenarios of Nile flows that will be used in developing water budget trends for the years 2025, 2050, 2075, and 2100. It is worth mentioning here that, the 2075 and 2100 percentages are rough assumptions based on very little information and knowledge in the literature. But, as mentioned before, these are subject to updating according to future events and developments. Table (5-3) Summary of assumptions used in developing the water budget trends
2025 2050 2075 2100 Estimated % change in Nile Flows Drying Scenario -6% -15% -20% -31% Estimated % change in Nile Flows Wetting Scenario +10% +21% +24% +27 Water Cuts due to Upstream Dams (billion m3/yr) 5 8 10.50 13
5.2 Projections & Impacts of Climate Change on Water Demands Expected rising temperatures due to climate change will certainly increase water demands for agriculture and municipal use. In addition to that, climate change alters seasonal temperature patterns. Effects can include changes in average temperature, the timing of agricultural seasons, and the degree of cooling that occurs in the evening. In addition to new seasonal temperature patterns, extreme events such as heat waves are projected to occur more frequently and/or last for longer periods of time. Changes in average temperature, when evaluated on large scales (national, regional, or global), have a fairly high level of certainty with consistency among various models (Stratus; 2012 and Attia; 2009). However, at the local level, specific changes to seasonal temperature profiles are more difficult to project precisely, due to the interaction with other factors such as cloud cover, moisture presence, topography, and regional air mass circulation that can lead to inversions (IPCC, 2007). Similar to temperature, seasonal precipitation patterns; including the timing, intensity and form of precipitation are projected to change. Precipitation differs from temperature in that it has greater spatial variability and is more difficult to predict (IPCC, 2007). In general, changes in precipitation and temperature interact. Higher temperatures increase evaporation, which can result in a drier climate. The changes in temperature and precipitation predicted by GCM models will affect water availability, resource management, critically shaping the patterns of future crop production. The expected impacts of climate change on agriculture could be summarized as follows:
• Increase of temperature and frequency of extreme events will reduce crop yield. • Change of average temperature will induce alteration of the distribution of crops. • Increased temperature will negatively affect marginal land and force farmers to abandon it. • Shortage of water resources will also affect marginal lands, and increase desertification. • Socio-economic impacts associated with loss of jobs and unemployment, and loss of income may
lead to socio-political unrest.

Joint Programme for Climate Change Risk Management in Egypt
Proposed CLIMATE CHANGE ADAPTATION STRATEGY for the Ministry of Water Resources & Irrigation EGYPT (2013)
Filename;\MhmdNour\CC Final Submitted 12-Feb2103 AdptStrtgy .docx page 40
Appropriate measures such as improvement of land and water management and adapted crops must be taken seriously to reduce the negative impacts on agricultural production. Egypt is producing only about half of its food supplies and food imports reached about $ 10 billion in 2012 (AL-Ahram news paper, 16-Nov 2012), and food demand is expected to increase with the growing population. Intensive and multiple cropping agricultural practices are common in Egypt. More than 16 million feddan of crops are cultivated annually on about 8.80 million feddan of land, giving an intensity index of about 1.8. The impacts of climate change on crop water requirements, planting dates, and agriculture production will have direct and indirect effect on a wide range of institutional, economic and social factors. In addition to that, reduction of irrigation water availability is an indirect impact of climate change on crop yields. As a result of the limited resources and climate change, the country is vulnerable to deficits in food production. Higher temperatures will likely decrease productivity of many crops as well as increase its demand for water [although higher atmospheric concentrations of carbon dioxide (CO2) without a change in climate will reduce water demand by crops]. The impact and vulnerability assessments presented in the SNC of 2010 concentrated to a very large extent on analyzing and discussing the results available from several CC impact studies on crop production and cropping systems, as summarized by Blanken (2012) in Table (5-4) below. The changes in crop productivity are mainly attributed to the projected temperature increases, which affect the grain filling periods and also have detrimental effects on sensitive development stages such as flowering, thereby reducing grain yield and quality. Table (5-4) projected changes in crop production of some major crops in Egypt under climate change Crop
Change % References 2050s 2100s
Wheat -15 -36 Abou- Hadid ,2006 Rice -11 Eid and El-Marsafawy,2002
Maize -19 Eid, El-Marsafawy, Ainer, EI- Mowelhi, El-Kholi, 1997 -14 -20 Hassanein and Medany, 2007
Soybeans -28 Eid and EL-Marsafawy, 2002 Barley -20 Eid, El-Marsafawy, Ainer, EI- Mowelhi, El -Kholi, 1997 Cotton +17' +31** Eid, El-Marsafawy, Ainer, EI- Mowel hi, El-Kholi, 1997 Potatoes -0.9 to -2.3 +0.2 to +2.3 Medany and Hassanein, 2006 source: Second National Communication on Climate Change (SNC-2010)
In addition, crop water stress is identified as the other main factor causing reduced productivity under climate change. However; in this context the SNC-2010 clearly states that despite the effects of projected long term changes in temperature, agriculture in Egypt is less sensitive to climate variability, due to its reliance on irrigated agriculture systems for some 95 % of the total cultivated area (compared to rain-fed agriculture)
Eid et al (2001) reported results of simulation studies which showed possible effect from climate change on field crop ET and water needs by the year 2050 compared to their values under current conditions. Results indicated that climate change may increase crop water demand for summer crops (up to +16%) while it could decrease slightly water demand for winter crops (up to 20%) by the year 2050.
The (SNC-2010) report cited several studies that project a 5 to 13% increase in irrigation requirements by Egyptian crops (EEAA, 2010a). The study of AlTaher and Medany (2009) concluded that the crop-water requirements of the important strategic crops are going to increase under all IPCC SRES socioeconomic scenarios by a range of 5 to 13 % during the 2100s. This increase in the reference crop evapo-transpiration (ETo) is projected to augment the national reference irrigation-demands by 7–12

Joint Programme for Climate Change Risk Management in Egypt
Proposed CLIMATE CHANGE ADAPTATION STRATEGY for the Ministry of Water Resources & Irrigation EGYPT (2013)
Filename;\MhmdNour\CC Final Submitted 12-Feb2103 AdptStrtgy .docx page 41
% during the 2100s. The following table concludes the projected population and temperatures and averaged estimate for percentage increase of future reference evapo-transpiration. On the other hand, current on-farm irrigation systems in Egypt are found to be highly vulnerable, mainly due to low irrigation system efficiency levels and inadequate irrigation management practices. Projected future temperature rises under CC conditions are likely to increase crop-water requirements thereby directly decreasing crop-water use efficiency and increasing the irrigation demands of the agriculture sector. Municipal water supplies have a primary priority under the Egyptian water policy. Projections of future municipal water supplies are related to expected population growth, and this is most probably be on the expense of the agricultural water allocations. The following Table (5-5) shows projections for the future population and water supply production according to the estimates of the water holding company until 2050. The projected values for 2075 and 2100 are roughly estimated according to the expected population and assuming similar consumption rates to those of 2010.
Table (5-5 ) Projected Averaged direct & indirect impacts of climate change on water demands year 2010 2025 2050 2075 2100 Population (million) 79 104 146 191 237 Mean air Temperature increase (°C) 1.0 1.7 2.5 3.5 ETo and Irrigation Water Requirements % -- 2% 4.5% 8 % 12% Municipal Water (million m3/yr) 9.0 9.6 12.55 14.75 17.2 Industrial Water (million m3/yr) 2.0 2.20 3.4 4.0 4.9
5.3 Projections of Sea Level Rise and Impacts on the Coastal Zones Sea level has risen about seven inches over the last century due to global melting of land-based ice and thermal expansion due to water warming (IPCC, 2007). As with other climate impacts, there is variation in the value of the rise, but there is general agreement among the various models (IPCC, 2007). As a result, coastal communities are facing direct impacts due to sea level rise (SLR) causing inundation of low elevation areas. Coastal zones will also suffer from indirect impacts such as salt water intrusion and contamination of ground water resources, exacerbating soil salinity and affecting food security. In addition, the increase in frequency and severity of storm surges will definitely impact coastal structures. The impacts of sea level rise will not be globally uniform, because of local variations in vertical crustal movements, topography, wave climatology, long shore currents, and storm frequencies. Low gradient coastal landforms most susceptible to inundation include deltas, estuaries, beaches and barrier islands, and coral reefs. The predicted changes are based largely on trends observed from direct measurements. However, the spatial and temporal variations of sea level complicate interpolation from global to local changes. According to Met Office Hadley Centre, (2011) report several studies concluded that Egypt is highly vulnerable to sea level rise (SLR). In one study that considered the impact of a 1.0 m SLR for 84 developing countries, Egypt was ranked the 2nd seriously impacted country with respect to the coastal population affected and 5th highest for proportion of urban areas affected. The Nile Delta region is presently subject to changes, including shoreline changes, due to erosion and accretion, subsidence and sea level rise due to climate changes. Agrawala et al., (2004) surveyed specific large economic centers of Alexandria, Rosetta and Port Said and obtained quantitative estimates of vulnerable areas and expected loss of employment in case of no action. They concluded that the Nile Delta coastal zone is highly vulnerable to the impacts of sea level rise through direct
Joint Programme for Climate Change Risk Management in Egypt
Proposed CLIMATE CHANGE ADAPTATION STRATEGY for the Ministry of Water Resources & Irrigation EGYPT (2013)
Filename;\MhmdNour\CC Final Submitted 12-Feb2103 AdptStrtgy .docx page 42
inundation and salt water intrusion. Low elevation coastal zones constitute high risk areas due to sea level rise. El-Raey, M. (1994), assessed the vulnerability of Alexandria city to expected sea level rise. A scenario involving a Sea Level Rise (SLR) ranges between 0.5m and 1.0m over this century is assumed. He found that if no action is taken, an area of about 30% of the city will be lost due to inundation, almost 2 million people will have to abandon their homes, 195,000 jobs will be lost and an economic loss of over $ 35.0 billion can be expected over the next century. Rosetta City and Port-Said City are also vulnerable to the expected sea level rise. The NSACC-2011 emphasized the importance of taking special adaptation measures to reduce the impacts of climate change risks, disasters and crises on both the Mediterranean and Red Sea coastal zones. Regarding the Mediterranean coastal zone, the gradual sea level rise may possibly lead to increased erosion rates of the low lying coastal zone (0 to 1m above sea level over a period of 100 years), particularly in the endangered zones. This may cause beach erosion at the narrow and low-level sand barrier - which separates the sea from the northern lakes – which will result in the gradual merging of those lakes with the sea, as is foreseen for Lake Manzala. In such cases, the environmental aspects of marine life and the natural and chemical characteristics of the lake will alter. If the shoreline recedes inwards towards agricultural land, this may increase the salinity of the groundwater, thus leading to the salinization of the agricultural land. It is also probable that seawater will surround some locations by inundating low-lying areas, unless the engineered protection constructions are strengthened. These constructions function efficiently with the current sea level. Special measures should also be taken in order to anticipate the predicted climate change, given the multiple negative effects of the increasing frequency and severity of storms, hurricanes and tsunamis. The presence of the Mohamed Ali Sea Wall substantially reduces potential loss of land to sea level rise (El-Raey, 2010). It is estimated that a sea level rise of 50 cm combined with local Nile Delta subsidence present serious impacts on low land Delta regions and adjacent highly populated cities such as Alexandria and Port Said. Furthermore, coastal areas below sea level constitute high risk areas. Direct and indirect impacts are expected to lead to the immigration of millions. According to the Second communication National report (SNC-2010), the results of IPCC fourth Assessment Report indicated that a global sea level rise of 18-59 cm is expected by the end of this century, based on the prevailing scenario. The Coastal Research Institute; 2008, used these values and took into consideration the land subsidence rates in West, Middle, and East delta to estimate the vulnerable areas that will be affected by Sea level rise under two cases of lake borders. The first case assumed zero levels for lake borders, while the second one assumed protecting lake borders. In both cases, Mohamed Ali wall is assumed to be there. For each model, three scenarios were considered; namely the two IPCC scenarios B1and A1FI as well as a new CoRI scenario which assumes a linear increase rate of sea level till 2100. The following Table (5-6) shows the temperature projection values of mean air temperatures and expected sea level rise; at 2000-2100, for the low scenario (B1) and for the high scenario A1FI of SRES; as given by the First IPCC first Assessment Report as given by El-Shinnawy (2008) in the West, Middle, and East Delta regions. Table (5-7) presents the vulnerable areas in the Nile Delta under the high scenario A1FI for the case of protected lakes’ borders. In fact, most of the lakes’ borders are actually above zero level (from 0.50m to 2.50m on average) and the low lands of Abu-Quir Bay are protected by Mohamed Ali sea wall).

Joint Programme for Climate Change Risk Management in Egypt
Proposed CLIMATE CHANGE ADAPTATION STRATEGY for the Ministry of Water Resources & Irrigation EGYPT (2013)
Filename;\MhmdNour\CC Final Submitted 12-Feb2103 AdptStrtgy .docx page 43
Table (5-6) Temperature Change and Sea Level Rise According to B1 & A1FI Scenarios Predicted Temperature & Sea Level Rise for Years 2025, 2050, 2075 and 2100 (oC)
2025 2050 2075 2100
Scen
ario
B1
Temperature (oC) 0.9 1.3 1.8 1.8 SLR West Delta (cm) 7.0 16.0 27.0 28.0 SLR Middle Delta (cm) 8.75 29.50 32.25 35.00 SLR East Delta (cm) 18.12 39.50 64.30 72.50
Scen
ario
A
1FI
Temperature (oC) 1.2 2.2 3.2 4.0 SLR West Delta (cm) 13.0 34.0 55.0 72.0 SLR Middle Delta (cm) 14.75 37.50 60.30 79.0 SLR East Delta (cm) 27.90 68.80 109.60 144.00
Table (5-7) Vulnerable areas in the Nile Delta, under A1FI scenario, the case of protected lakes’ borders
As cited in EL-Ganzory (2012), recent studies by CoRI used flow models in estimating the vulnerable areas due to SLR on the Nile Delta Mediterranean coast. These estimates were compared with previous results based on GIS techniques only, and they found that flow modeling techniques are more accurate in estimating the flooding extent due to considering mass conservation and the momentum in the governing equations of the flow model. The results of the flow modeling techniques produced relatively less vulnerable areas than the previously published ones that were based on GIS only. This study recommended using flow modeling techniques to accurately estimate the flooding impacts of sea level rise, and added that the estimated damage for the Nile Delta from previous GIS techniques are likely to be significantly conservative (high). The CoRI valued the Vulnerable Land to Sea Level Rise at the Northern Nile Delta. This was done on 6 governorates that are subject to inundation. They are subdivided into smaller administrative local areas and used an optimistic scenario (B) and a pessimistic one (A) in order to identify the affected localities within these areas. Based on the illustration of spatial extent of areas vulnerable to SLR in 2025, 2050, and 2075, an adaption of the years 2030 and 2060 according to three different scenarios was used to fit with modeling results. The 3 scenarios are based on the expected impact of SLR on the coastal zones according to tide gauges measurements carried out by CoRI over the last three decades. This assumed same increase rate of air temperature till 2100, and the expected impact of SLR according to IPCC B1 & A1FI scenarios. A geo-database for the inundated area was developed and employed to quantify roughly the magnitude of inundation impacts in the vulnerable area according to the three scenarios. The following Table (5-8) shows the total vulnerable areas, number of localities, cultivated areas, size of population, lengths of canal and drains length and value roads, number and value of housing units vulnerable to inundation in 2030 and 2060 according to this study. The study calculated losses due to annual impact assuming all the housing units and roads are inundated and the value is completely amortized over 30 years. The losses would be between 1 and 2 billion EGP in 2030 and between 2 and 16 billion EGP in 2060. It is worth mentioning here that these figures estimated only physical losses, but did not consider costs of resettlement of the departing population.
YearRegion W. M. E. W. M. E. W. M. E. W. M. E.
SLR (cm) 13.0 14.8 27.9 34.0 37.5 68.8 55.0 60.3 109.6 72.0 79.0 144.0
Affected Area (km2) 29.7 63.7 59.5 38.7 140.7 76.9 80.1 284.0 85.7 104.5 565.8 91.0
% of the Nile Delta Area 0.12% 0.25% 0.24% 0.16% 0.56% 0.31% 0.32% 1.14% 0.34% 0.42% 2.26% 0.36%
Total Affected Area (km2)% of the Nile Delta Area
W: West Delta (Alex.) M: Middle Delta (AL-Burullus) E: East Delta (Port Said)
449.801.80%
761.303.04%
152.850.61%
256.291.03%
2025 2050 2075 2100

Joint Programme for Climate Change Risk Management in Egypt
Proposed CLIMATE CHANGE ADAPTATION STRATEGY for the Ministry of Water Resources & Irrigation EGYPT (2013)
Filename;\MhmdNour\CC Final Submitted 12-Feb2103 AdptStrtgy .docx page 44
Table (5-8) Physical & Socio-Economical Vulnerability to inundation due to SLR at 2030 & 2060
2030 2060 CoRI B1 A1FI CoRI B1 A1FI
Total area vulnerable to Inundation (km2) 3401 3600 3611 3466 3662 6946
No. of localities vulnerable to inundation 73 79 82 81 97 254
Cultivated area vulnerable to inundation (km2) 1352 1432 1442 1419 1615 3958
Current population vulnerable to inundation 1224622 1312973 1340657 1224622 1312973 1340657 Projected population vulnerable to inundation Under Scenario (A) 2448584 2584856 2627781 31451328 31686161 31761332
Projected population vulnerable to inundation Under Scenario (B) 1317515 1422030 1450614 1568977 1798217 1826908
Length of canals Vulnerable to inundation (km) 1525 1622 1641 1588 1747 4236
Length of drains Vulnerable to inundation (km) 1387 1496 1500 1412 1560 3644
No. of housing units vulnerable to inundation 260505 276748 281905 273118 338178 1110793
Current value of vulnerable house (bil. EGP) 16 18 18 18 22 66
Adjusted value to income (pessimistic) (bil. EGP) 26 28 28 51 65 193
Adjusted value to income (Optimistic) (bil. EGP) 38 41 42 116 147 436
Length of Roads Vulnerable to inundation (km) 3180 3360 3386 3259 3460 8891
Current value of vulnerable Roads 2 2 2 2 3 8.0
Adjusted value to income (Pessimistic) (bil. EGP) 4 4 4 7 8 24
Adjusted value to income (Optimistic) (bil. EGP) 5 6 6 15 17 53
source: El-Ganzory (2012) Coral reefs, in the Red Sea, are projected to be among the most sensitive ecosystems to long term climate change. Corals are especially sensitive to elevated sea surface temperatures. When physiologically stressed, corals may lose much symbiotic algae, which supply nutrients and colors. In this stage corals appear white and are referred to as bleached. Corals can recover from short term bleaching. However, prolonged bleaching can cause irreversible damage and subsequent mortality. The coastal zone of the Red Sea is likely to be affected by the sea level rise, in particular in the low-lying areas, wetland, and beaches. This sea level rise may also affect coral reefs, especially if the rising rate is higher than that of coral growth. The rate of coral bleaching may also increase as a result of environmental pressures. However, the rock formation of the coast - which characterizes the Red Sea, and which is slightly above sea level, 2 - 5m – is considered a natural barrier against rising sea levels in these areas. It is worth noting that frequent hurricanes and tsunamis are expected, which may cause many negative impacts. Egypt’s’ National Strategy for Adaptation Climate Change (NSACC-2011), classified the vulnerability of the Egyptian coastal zones and potential harm caused under two scenarios of sea level rise (one for rise of 50 centimeters rise, and 100 centimeters rise. The following Tables (5-9.a) and (5-9.-b) show the classifications of the expected vulnerabilities under 5 degrees: Severe harm (+++), Moderate harm (++), Low harm (+), Extreme events (#), and Safe (*). The proposed means and programs for adaptation to disaster risks of sea level rise are also covered in details in this strategy.
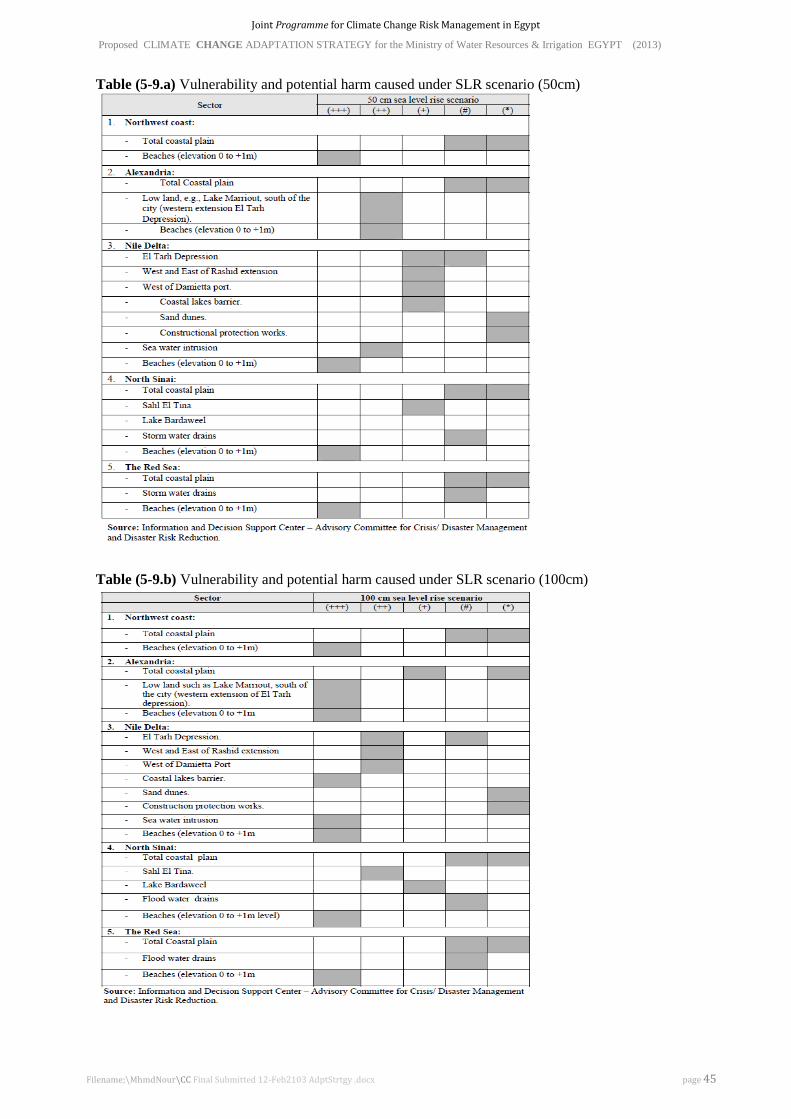
Joint Programme for Climate Change Risk Management in Egypt
Proposed CLIMATE CHANGE ADAPTATION STRATEGY for the Ministry of Water Resources & Irrigation EGYPT (2013)
Filename;\MhmdNour\CC Final Submitted 12-Feb2103 AdptStrtgy .docx page 45
Table (5-9.a) Vulnerability and potential harm caused under SLR scenario (50cm)
Table (5-9.b) Vulnerability and potential harm caused under SLR scenario (100cm)

Joint Programme for Climate Change Risk Management in Egypt
Proposed CLIMATE CHANGE ADAPTATION STRATEGY for the Ministry of Water Resources & Irrigation EGYPT (2013)
Filename;\MhmdNour\CC Final Submitted 12-Feb2103 AdptStrtgy .docx page 46
5.4 Sea Water Intrusion in the Nile Delta A large number of coastal aquifers are threatened by saltwater intrusion. Saltwater intrusion may occur due to human activities and by natural events such as sea level rise. Over abstraction of groundwater due to high demands for domestic water supply is the main cause of saltwater intrusion in coastal aquifers. Also the rise in sea level due to the climate change accelerates the saltwater intrusion into the aquifers and reduces the fresh groundwater resources. Few centimeters rise in sea level could have a great effect on saltwater intrusion. With the impact of sea level rise and over-pumping combined together the problem becomes even more serious and requires fast solutions. The rise in sea level will shift the saltwater interface further inland. As a result, pumping wells that were originally in fresh groundwater may then be located in brackish water or saline water and up-coning may occur. Consequently, the abstraction rates of these wells may have to be reduced or the wells abandoned. This is considered one of the most serious impacts of sea level rise. Therefore, saltwater intrusion due to sea level rise should be predicted and prevented (or at least controlled) to protect groundwater resources. Stratus (2012); stated that, the coastal zone of the Nile Delta in Egypt is perceived as vulnerable to the impacts of climate change, not only because of the impact of sea level rise, but also because of the impacts of salt water intrusion on water resources, agricultural resources, tourism and human settlement. Ground water aquifers and low land areas along the Mediterranean coast of Egypt are exposed to severe deterioration and salinization from salt water intrusion due to SLR. This will lead to deterioration of crop quality and productivity. In turn, expected increased health problems and loss of tourism. This phenomenon is considered of utmost importance and warrant full investigation. Fresh groundwater is found in the central and southern Nile Delta. The salinity increases in northward direction (excess of 10,000 ppm), which is attributed to the subsurface intrusion of seawater, where the interface is found near the surface at Kafr El-Sheikh Town and is located at approximately 300 m below the surface near Tanta Town. Sea level rise is expected to push this interface further to the south, which will increase the impacts of salt water intrusion on ground water quality in the coastal zone of the Nile Delta. The Second National Communication (SNC-2010) identified these phenomena as very important especially for low land areas along the Mediterranean coast. However, it did not provide detailed impact and vulnerability assessment. 5.5 Climate Change Impacts on the Northern Lakes The northern Egyptian lakes, which constitute about 25% of the total Mediterranean wetlands and produce about 60% of the fish products, are also highly vulnerable to the impacts of climate change. Since the lakes are relatively shallow, climate change can lead to an increase in water temperature, which could result in changes in the lake ecosystems as well as changes in yield. The regions that are most likely to be affected are areas that lie between Alexandria and Damietta, covering a length of about 200 km along the coast.
The impact of Sea Level Rise (SLR) on different parts of the lakes may be influenced by various inter-related factors such as land reclamation, reduction of drainage water inflows, change in fishing practices, infrastructure works, erosion of the coasts and various other human activities).
According to Blanken (2012), the major expected impacts of SLR on the Northern lakes were identified as follows:
- saline sea water will penetrate far into the Northern Delta, turning the current lakes into shallow saline lagoons and bays;
- weed swamps will disappear, but instead large areas of salt marshes might be created; - the proper functioning of infrastructure facilities directly exposed to the sea will be disrupted; - the water balance in the lakes will be affected, causing a possible extension of the lake boundaries
southwards;

Joint Programme for Climate Change Risk Management in Egypt
Proposed CLIMATE CHANGE ADAPTATION STRATEGY for the Ministry of Water Resources & Irrigation EGYPT (2013)
Filename;\MhmdNour\CC Final Submitted 12-Feb2103 AdptStrtgy .docx page 47
- a slight to moderate SLR may be quite beneficial for fish production due to an increase in lake area and in more valuable marine fish species; however, serious negative effects on birds are expected;
- the expected submerged wetland will form grounds for an increase in rooted aquatic plants, will increase the wintering grounds for migrating birds and can also be used for aquaculture activities;
- the increased salinity of lake water will also result in the dying off and decomposition of aquatic plants which play an important role in decreasing the heavy metal concentration of the water coming in from the drains;
- deterioration of coastal water quality that attracts marine fry to the direction of the lakes will affect natural supply for the aquaculture activity in Egypt.
Climate change is expected to increase sea temperature causing fish distribution to shift northwards and to move to deeper water. Aquaculture projects may suffer from water shortages due to increased scarcity of fresh water supply that might affect the country as a result of CC induced temperature increases, which might also affect the production of some fish species.
In addition; as observed in the NSACC-2011 report, fish farms will face competition over the redistribution of water usage, with a direct impact of temperature on the productivity of some varieties of fish. The likelihood of increased water salinity in the north Delta will negatively affect the productivity of fresh water fish, and increase the productivity of salt-water fish, despite the fact that many social classes rely on fresh water fish as a primary source of animal protein. The NSACC also expects that the rise in atmospheric and water temperature will lead to an increase in the growth rate of fish and their vulnerability in fish farms and small waterways, which are more vulnerable than fish in the sea and large water bodies. The fish ecosystem will change as the rate of nutritional assimilation rises. This will lead to a higher need for nutrition, and increased competition between different species, thus raising the Biological Oxygen Demand (BOD).

Joint Programme for Climate Change Risk Management in Egypt
Proposed CLIMATE CHANGE ADAPTATION STRATEGY for the Ministry of Water Resources & Irrigation EGYPT (2013)
Filename;\MhmdNour\CC Final Submitted 12-Feb2103 AdptStrtgy .docx page 48
6.0 Water Resources Management and Planning under Uncertainty Climate change predictions of the Nile Flow regime has high uncertainty due to the assumptions used in developing the different climate models and the nature and scope of regional and local impacts. This uncertainty is translated into a wide range of future predictions of possible droughts and wetting situations that complicates the planning process. On the other hand, the demand side is relatively certain and increasing due the growing population and the recent implementation of the Ethiopian dams and upstream developments, as well as the expected rising temperature. To simplify this complicated planning process, it is assumed that the range of average future annual Nile flows may vary by 2100 between -31%; under the drought scenarios, to about +27%; under the wetting scenarios (based on the above assumptions after reviewing the Nile flow predictions presented in chapter 5). Since we do not know which of these climate scenario would prevail in future, we will use both of them in developing two sets of future water budgets to be called “water budget trends” for each of the years 2025, 2050, 2075, and 2100. These two estimated trends; which are based on the extreme positive and negative predictions in the Nile flows as well as including all foreseen demands, would enable having quantified insights in future situations and get prepared. The following table (6-1) presents the assumptions used in developing these two sets. Table (6-1) Projections for Nile Water Availability, Population and in Evapo-Transpiration
Year 2010 2015 2025 2050 2075 2100 Reduced Flows due to Upstream abstraction (Billion m3)
0.0 -3.0 -5.0 -8.0 -10.5 -13.0 Estimated Population in Egypt (million)
80 86 104 146 191 237
% Decrease of Nile Flows at Aswan due to climate change
- - -6 % -15 % -20% -31 %
% Increase of Nile Flows at Aswan due to climate change
- - 10 % 21% 24% 27 % % Change in Evapo-Transpiration
1.1% 2% 4.5% 8 % 12%
Accordingly, proposed adaptation measures are already built in while balancing supplies and demands in these two extreme water budget trends. These measures will guide the adaptation strategy in the short-, medium-, and long-terms (i.e. 2025, 2050, 2075, and 2100 respectively). Therefore, the developed adaptation strategy would implicitly contain or accommodate the range of variations; or uncertainty, in supplies under the projected increasing demands. Although this approach may be criticized for its simplicity and assumptions, but in dealing with such a complex system under obvious uncertainty, we believe that it is better to be approximately right than precisely wrong. The developed future water budget trends approach will provide valuable guidance for the adaptation strategy which should be a dynamic one, and will be updated periodically with increased knowledge from signals of monitoring programs and gained credibility in future predictions. Besides, this approach can be seen as a simple model visualizing the future general trends. Consequently, the water planners and managers can decide on when and how much deficit (or floods) is there and what actions and preparations are needed to face these situations in terms of size and timing of needed water from different potential source (or protection works). The Table below (6-2) shows the current water budget of 2010 as given in the water strategy of 2050. The left columns show the supplied water from conventional and non-conventional sources, while the right ones show the demands (consumed and used/allocated) for different sectors.

Joint Programme for Climate Change Risk Management in Egypt
Proposed CLIMATE CHANGE ADAPTATION STRATEGY for the Ministry of Water Resources & Irrigation EGYPT (2013)
Filename;\MhmdNour\CC Final Submitted 12-Feb2103 AdptStrtgy .docx page 49
Table (6-2)
Same as Table (3-1): from Egypt’s Strategy for Development & Management of water resources 2050 (MWRI–2010)
This baseline situation of 2010 is first adjusted to 2015 situation as shown below in Table (6-3) to include the impact of short–term consequences of reduction in the Nile flows (by 3.0 billion m3) after completion of the first stage of Ethiopian Grand Renaissance dam which is planned to start operating 2 turbines at that time. According to this table, where Nile flows are reduced to 52.50 billion m3, the impacts on water supply and adjustments made to balance the water budget lead to the following:
- Total fresh water supplies from all sources become 56.05 billion m3 instead of 59.0 billion m3, and re-used drainage water is slightly reduced. Shallow groundwater and desalination are expected to increase slightly within this very short interval. The total available water estimated to be 77.80 billion m3 instead of 81.20 billion m3.
- Most of the reduction in allocated water is going to be on the expense of the allocated water for
agriculture that is estimated to be 63.30 billion m3 instead of 67 billion m3. Farmers will suffer and complain against this sudden reduction in irrigation water supplies, and there might be some tension among users competing on water in irrigation canals.
- Drinking and industrial water allocations are assumed to increase slightly during this short
interval due to the ongoing projects, because it is very difficult to change consumption and production rates suddenly.
- Disposal of drainage water to the sea is assumed to decrease by about 1.50 billion m3.
Table (6-3)
80 millionsVolume Consumption Usage/Allocation
(billion m3/year) (billion m3/year) (billion m3/year)
Drinking (Fresh W only) 1.80 9.00Nile (HAD) 55.50 Industry 1.40 2.00Deep Groundwater 2.00 Agriculture 40.40 67.00Rainfall & Flash Floods 1.30 Drainage to Sea 12.20Desalination 0.20 Evap. losses 3.00 3.00TOTAL Supply conventional 59.00 Env. Balance 0.20 0.20
TOTAL Consumption 59.00Shallow Groundwater (Delta) 6.20Re-Use of Ag. Drainage Water 16.00TOTAL Supply non-conventional 22.20TOTAL Water Supply 81.20 81.20
2010 Water Budget (Sources&Usage) , Population =
Water Supply Demand by Sector
Conventional Water Sources
Unconventional Sources
TOTAL Water Usage or Allocation
2015 Adjusted Water Budget, estimated popultaion = 86 millions
Upstraem Abstractions = -3.00 Billion m3Volume Consumption Usage/Allocation
(billion m3/year) (billion m3/year) (billion m3/year)
Drinking (Fresh W only) 2.00 9.20Nile (HAD) 52.50 Industry 1.50 2.10Deep Groundwater 2.00 Agriculture (Adjusted) 38.67 63.30Rainfall & Flash Floods 1.30 Drainage to Sea 10.68Desalination 0.25 Evap. losses 2.90 2.90TOTAL Supply 56.05 Env. Balance 0.30 0.30
TOTAL Consumption 56.05Shallow Groundwater (Delta) 6.25Re-Use of Ag. Drainage Water 15.50TOTAL 21.75TOTAL Water Available 77.80 77.80
Water Supply Demand by Sector
Conventional Water Sources
TOTAL Water Usage or Allocation
Unconventional Sources

Joint Programme for Climate Change Risk Management in Egypt
Proposed CLIMATE CHANGE ADAPTATION STRATEGY for the Ministry of Water Resources & Irrigation EGYPT (2013)
Filename;\MhmdNour\CC Final Submitted 12-Feb2103 AdptStrtgy .docx page 50
Then two sets of future water budget trends for years 2025 until 2100 are developed in such a way to keep balance between the fresh water sources and the consumption, as well as balancing all available water (including recycled water) with the used or allocated water to different sectors. Balancing supplies and demands was done through several iterations taking into account initial simplifying assumptions based on scientific knowledge, logical assessment, and experience.
6.1 Assumptions used in Developing the Water Budget Trends These initial assumptions enabled quantifying the consequences of the changes in the Nile flows on water allocation to satisfy the demands of different sectors as well as on the possible alternatives of required additional water resources (conventional and non-conventional). These assumptions are subject to modification and/or confirmation from acquired knowledge, simulation studies, and signals from monitoring programs that are needed to continuously update the adaptation strategy. The following paragraphs summarize these assumptions:
• The water supply components include both conventional and non-conventional water resources. Conventional water resources are the current Nile water, deep groundwater abstractions in the deserts, the rainfall flash-floods, desalination of brackish and sea water, potential upper Nile projects aiming at augmenting the average flows at Aswan. The development of upper Nile projects is still negotiable and not clear for the moment, but still there is a potential for achieving successful achievement in cooperation for the benefit of all basin countries. The non-conventional water resources are the shallow groundwater in the Nile delta, the re-used agricultural drainage water, the treated waste water, and sea water that can be used to grow specific salt tolerant crops of high value, (e.g. Quinoa and Amaranth).
• The estimates of the Nile water reductions at Aswan due to the Ethiopian dams; as shown in the above Table (6-3), are based on little available information from non-documented sources and assuming that Egypt and Sudan (North & South) will split these water cuts.
• The estimated future Egyptian population of the above Table (6-1) is based on information of the
Egyptian Water Holding Company till 2050, and that for 2075 and 2100 are based on linear regression commonly used equations.
• The range of climate change impacts on the Nile flows at Aswan (drought or wetting) is based on assumed averaged values from the published results of several climate models under different emission scenarios.
• The deep groundwater in the deserts is non-renewable and to be used carefully according to sustainable plans. It is abstracted when there is great need for it, and where there are no other available water sources. Therefore, in the developed drought trends it is not used heavily until near 2050, and is usually used in the remote areas, where there are no other water sources.
• Harvesting of rainfall and flashfloods is expected to progress with the increased demand on water. Although predictions indicate reduced rainfall, it also indicates that there will be increased extreme events such as flashfloods. With advancing technology and increased water stress, it is assumed that recent effective rainfall harvesting techniques will enable relatively little contribution to the water supplies at some locations. This little contribution is due to its uncertainty in terms of location, timing and quantity.
• Desalination is considered the most promising reliable adaptation tool for future drinking water; however, its use is limited in Egypt due to the high energy requirement that leads to high cost. However, with advancing technology and when other energy sources become available at economical cost, and when the value of scarce water becomes economical, desalination will provide a significant volume of the fresh water supplies on the long-term.

Joint Programme for Climate Change Risk Management in Egypt
Proposed CLIMATE CHANGE ADAPTATION STRATEGY for the Ministry of Water Resources & Irrigation EGYPT (2013)
Filename;\MhmdNour\CC Final Submitted 12-Feb2103 AdptStrtgy .docx page 51
• Shallow groundwater in the delta is renewable and is recharged from seepage from Nile, irrigation canals as well as irrigated fields, so, it is considered as portion of the recycled Nile water. Its volume is expected to decrease with Nile flow reductions as well as increased irrigation efficiency.
• Re-Use of agricultural drainage water forms a significant portion of the water usage in the agricultural sector (around 25% of agricultural drainage water is reused). This is also subject to reduction with reduced Nile flows and increased irrigation efficiency.
• Treated waste water will be a potential source for irrigating specific crops in future especially with the increased production of drinking water.
• Sea water agriculture is still at the research stage (2012), but it is a promising adaptation tool that will enable overcome water scarcity problems on the long-term to grow certain crops.
• It is also assumed that all possible measures will be taken to protect water bodies against potential pollution from different sources.
Regarding the demand side, the following assumptions are taken into account when developed the future trends:
• Municipal water (including drinking water) has the first priority, followed by industrial water or agricultural water according to the prevailing regional criteria. Therefore, future cuts or shortage will be mainly taken from the amount allocated to the agricultural sector which is using about 80% of the current water budget (2010).
• According to data of the consumed and used drinking water, there are high losses in the distribution networks. However, this leaking water is part of the water budget and returns to the groundwater system, but at a high cost. Although, the consumption rate and the population are going to increase with time, the produced amounts per capita are expected to be reduced in case of negative Nile flows.
• The amounts of drainage water disposed to the sea that maintains the salt balance is going to decrease with reductions in the Nile flow and reduced amounts allocated to the agricultural sector.
• Water released to keep the environmental balance and to reduce pollution loads are expected to be relatively increased under drought conditions and relatively reduced under wetting conditions.
• Evaporation losses are expected to be less under reduced Nile flows as water levels in the Nile
and canals will drop.
6.2 The developed Water Budget Trends (2025, 2050, 2075 & 2100) 6.2.a Estimated trends at year 2025; when population reaches about 104 millions and the upstream demands may cut about 5 billion m3 from Egypt’s share, and climate change impacts on the Nile flows vary between -6% and +10%, the estimated water budget trends under these scenarios of 2025 are shown in Tables (6.4-a, and 6.4-b). According to these estimated trends, the Nile flows in 2025 are estimated to be 47.50 billion m3 under the low flow scenario (drought) and 55.55 billion m3 under the wetting scenario (wetting). The annual per capita share of the Nile water is going to drop to 460 m3 for the low flows scenario and 523 m3 for the high flows scenario. This means that the trend of annual per capita share of Nile water is decreasing during this period; even under the high flows scenario. This is mainly due to the growing population.

Joint Programme for Climate Change Risk Management in Egypt
Proposed CLIMATE CHANGE ADAPTATION STRATEGY for the Ministry of Water Resources & Irrigation EGYPT (2013)
Filename;\MhmdNour\CC Final Submitted 12-Feb2103 AdptStrtgy .docx page 52
Since we are not certain about future climate impacts; in terms of wetting or drying, it is appropriate to take sufficient actions (or measures) to cope with the worst consequences that are estimated under these two scenarios. According to the above estimated trends, the following measures are to be considered:
• Under the drought scenario, additional water resources of about 1.70 billion m3 have to be prepared prior to 2025 (compared to current 2010 figures). The additional resources are from deep groundwater, rainfall harvesting, desalination, and upper Nile projects that have to be reactivated.
Table (6.4-a)
• It is important to recognize that the lower Nile flows are going to reduce the shallow groundwater by about 0.70 billion m3, as well as reduce the amounts of re-used agricultural drainage water by about 2.5 billion m3 (relative to the current amounts of 2010). The treated waste water will contribute by an amount of 0.20 billion m3. Accordingly, the total annual available water supplies; including recycled water, is going to be 72.07 billion m3 instead of 81 billion m3 in 2010. It should be emphasized that, strict environmental regulations should be followed and applied.
• The agricultural sector is going to suffer from cutting about 10 billion m3 under the drought scenario in 2025, where the allocated water for agriculture is estimated to be 57.26 million m3, which represent 79% of the total water supplies. In addition to that, the expected higher temperature will raise the current average annual evapo-transpiration rate (4590 m3/fed) and the current average annual irrigation water duty (7613 m3/fed) by about 2%. The assumed corresponding increased values in 2025 are 4681 and 7765 m3/fed respectively. This leads to 2 alternatives, the first is to reduce the irrigated area by about 1.43 million feddan; which is very difficult to apply politically, and socially and will have severe economical implications. The second alternative is to reduce the average annual water duty to be about 6506 m3/fed (or about 84% of assumed optimum one) in order to maintain the current area of 2010 (8.8 million feddan). The latter is most likely to happen, but will have an expensive cost for distributing water shortage equally and raise irrigation efficiency, as well as possible reductions in yields of most crops.
• Regarding the municipal water sector, the allocated (produced) amount of drinking water is estimated to be increased by about 0.50 billion m3 to be 9.50 billion m3 in 2025, which is about 13% of the total water supplies. This means that the average per capita usage will be 250 lit/day instead of the current rate of 293 lit/day in 2010. These figures assume that the average consumption rate is going to be 57.8 lit/day instead of 61.78 lit/day in 2010, which is almost the
2025 Water Budget under -ve Nile Flow & estimated Population = 104.3 millions
Upstraem Abstractions = -5.00 Bil.m3 & CC impact on the Nile flow is -6%Volume Consumption Usage/Allocation
(billion m3/year) (billion m3/year) (billion m3/year)
Drinking (Fresh W only) 2.20 9.50Nile (HAD) 47.47 Industry 1.62 2.11Deep Groundwater 2.30 Agriculture (Adjusted) 35.35 57.26Rainfall & Flash Floods 1.45 Drainage to Sea 10.30Desalination 0.95 Evap. losses 2.80 2.80Others (Upper Nile Projects) 0.50 Env. Balance 0.40 0.40TOTAL Supply 52.67 TOTAL Consumption 52.67
Shallow Groundwater (Delta) 5.50Re-Use of Ag. Drainage Water 13.50Re-Use of Treated W Water 0.40TOTAL 19.40TOTAL Water Available 72.07 72.07
Water Supply Demand by Sector
Conventional Water Sources
Unconventional Sources
TOTAL Water Usage or Allocation

Joint Programme for Climate Change Risk Management in Egypt
Proposed CLIMATE CHANGE ADAPTATION STRATEGY for the Ministry of Water Resources & Irrigation EGYPT (2013)
Filename;\MhmdNour\CC Final Submitted 12-Feb2103 AdptStrtgy .docx page 53
same. This needs additional efforts from the water supply companies to control high consumption and reduce losses in the distribution networks and urge people to use water more efficiently.
• Regarding the wetting scenario up to 2025; as shown in the following Table (6.4-b), the estimated trends do not show need for taking major actions against neither droughts nor floods. This is because the estimated cuts are balance with assumed increased flows, resulting in having the fresh water supplies almost same as those in 2010. Water allocated to agriculture is almost the same, but due to the higher evapo-transpiration, the water duties have to be slightly less than the current rates. The estimated water supply amounts are slightly increased and the average per capita rate is actually decreased to 235 lit/day, but still sufficient. However, conservation measures and efforts are needed to reduce network losses in order to maintain reasonable per capita rates.
• Although there are no flooding threats according to this wetting or flooding assumptions and estimates, it is appropriate to start enhancements for the Toshka spillway in parallel with the progress of the Ethiopian dams to accommodate any sudden floods. In fact, the rapid implementation of the Ethiopian dams, and the non-availability of designs and studies for these enormous dams should alert us; as a downstream country, against any sudden failure or break in any of these dams. The enhancement of the spillway, may also secure the country against any up-normal floods that might happen in the near or far future.
Table (6-4.b)
6.2.b Estimated trends at year 2050: when population reaches about 146 millions and the growing upstream demands may cut about 8 billion m3 from Egypt’s share, and climate change impacts on the Nile flows vary between -15% and +21%. The 2050 estimated water budget trends are presented in Tables (6-5.a & 6-5.b). Under the drought scenario estimates, the Nile flows in 2050 are going to be 40.38 billion m3, while it reaches 57.48 billion m3 under the wetting scenario. The annual per capita share of the Nile water is going to drop to 290 m3 for the drought scenario and to 399 m3 for the high flows scenario. These low values would create a difficult situation for managing the water resources. This means that the trend of annual per capita share of the Nile water is falling during this period; even under the wetting or high Nile flow scenario. Again, since we do not know now (2012) what will happen in 2050, it will be necessary to take sufficient measures to be ready for coping with the estimated consequences; from both drought and wetting scenarios that are properly compatible with the national development plans. However, monitoring programs have to be established soon to update our knowledge and expectations regarding the estimated water budget trends. In case we find that the drought scenario signals are going to prevail, serious and stricter measures to be used. If wetting scenario signals are showing up, some
2025 Water Budget under +ve Nile Flow & estimated Population = 104.3 millions
Upstraem Abstractions = -5.00 Bil.m3 & CC impact on the Nile flow is + 10%Volume Consumption Usage/Allocation
(billion m3/year) (billion m3/year) (billion m3/year)
Drinking (Fresh W only) 2.40 9.70Nile (HAD) 55.55 Industry 1.75 2.30Deep Groundwater 2.00 Agriculture (Adjusted) 41.58 66.50Rainfall & Flash Floods 1.30 Drainage to Sea 10.47Desalination 0.40 Evap. losses 2.90 2.90Others (Upper Nile Projects) 0.00 Env. Balance 0.15 0.15TOTAL Supply 59.25 TOTAL Consumption 59.25
Shallow Groundwater (Delta) 6.30Re-Use of Ag. Drainage Water 16.00Re-Use of Treated W Water 0.00TOTAL 22.30TOTAL Water Available 81.55 81.55
Unconventional Sources
TOTAL Water Usage or Allocation
Water Supply Demand by Sector
Conventional Water Sources

Joint Programme for Climate Change Risk Management in Egypt
Proposed CLIMATE CHANGE ADAPTATION STRATEGY for the Ministry of Water Resources & Irrigation EGYPT (2013)
Filename;\MhmdNour\CC Final Submitted 12-Feb2103 AdptStrtgy .docx page 54
other types of precautions are to be followed. The following paragraphs outline the consequences of continuation of both of the drought and wetting scenarios according to the above estimated trends. Under the drought scenario, additional water resources of about 6.30 billion m3 have to be prepared prior to 2050 (relative to those of the current figures of 2010). These additional resources are from deep groundwater, rainfall harvesting, desalination, and upper Nile projects which has to be effective. • It is important to recognize that the low Nile flows are going to reduce the shallow groundwater
abstractions by about 1.20 billion m3 (to be only 5.0 billion m3), as well as reducing the amounts of re-used agricultural drainage water by about 5.70 billion m3 (to be 10.30 billion m3). More contribution from treated waste water is expected and will reach about 1.50 billion m3. Accordingly, the total annual available water supplies; including recycled water, is going to be 68.88 billion m3 instead of 81 billion m3 in 2010.
• An equivalent amount of 1.90 billion m3 of sea water used for agriculture is assumed to be part of the water budget in 2050. It is expected that by this time (after about 40 years) advanced research and technology would enable using sea water for cultivating some crops that can contribute in reducing the food security gap when production become available at a commercial scale.
Table (6-5.a)
• The agricultural sector is going to suffer more cuts as the allocated water will be further reduced to be 49.75 billion m3 by 2050, instead of the 67 billion m3 in 2010. This represents 72% of the total water supplies. In addition to that, the average annual evapo-transpiration rate in 2050 are assumed to be about 4796 m3/fed, which is about 4.5% higher than that of 2010. While the allocated average annual irrigation water duty in 2050 is expected to reach (7955 m3/fed) in order to maintain same productivity of the agricultural lands. This will lead to reduction in the irrigated area by about 2.55 million feddan, which is very difficult to implement either politically or socially. The other alternative in dealing with these cuts in agricultural water allocation is to distribute this shortage equally on the whole lands, and accept some level of reduced yield. This is more likely to be acceptable, but again, there is high cost for raising the irrigation efficiency and to implement measures for rehabilitating the irrigation control system and soft interventions to distribute water on volumetric basis at the branch canal levels. in such case, the reduced average irrigation water duty will be about 5656 m3/fed, which is about 71% of the optimum one.
• Regarding the municipal water sector, the allocated (produced) amount of drinking water is estimated to be 12.50 billion m3 in 2050 (instead of 9.0 billion m3 in 2010) which is about 18% of the total water supplies. This means that the average per capita usage will be 235 lit/day instead of
2050 Water Budget under -ve Nile Flow & est. Population = 145.8 millionsUpstraem Abstractions = -8.00 Bil.m3 & CC impact on the Nile flow is -15%
Volume Consumption Usage/Allocation(billion m3/year) (billion m3/year) (billion m3/year)
Drinking (Fresh W only) 3.30 12.50Nile (HAD) 40.38 Industry 2.43 3.33Deep Groundwater 3.40 Agriculture (Adjusted) 32.05 49.75Rainfall & Flash Floods 1.70 Drainage to Sea 9.10Desalination 2.70 Evap. losses 2.70 2.70Others (Upper Nile Projects) 2.00 Env. Balance 0.60 0.60TOTAL Supply 50.18 TOTAL Consumption 50.18
Shallow Groundwater (Delta) 5.00Re-Use of Ag. Drainage Water 10.30Re-UseTreated W Water 1.50Others (e.g. Sea water Agr) 1.90TOTAL 18.70TOTAL Water Available 68.88 68.88
Water Supply Demand by Sector
Conventional Water Sources
Unconventional Sources
TOTAL Water Usage or Allocation

Joint Programme for Climate Change Risk Management in Egypt
Proposed CLIMATE CHANGE ADAPTATION STRATEGY for the Ministry of Water Resources & Irrigation EGYPT (2013)
Filename;\MhmdNour\CC Final Submitted 12-Feb2103 AdptStrtgy .docx page 55
the current rate of 293 lit/day in 2010. These figures assume that the average consumption rate is going to be 62 lit/day instead of 61.78 lit/day in 2010, which is almost the same. This will need efforts from the water supply companies to control high consumption and reduce losses in the distribution networks and urge people to use water more efficiently.
• The industrial water allocation is expected to increase to 2.33 billion m3 (5% of total water supplies) instead of 2.0 billion m3 in 2010.
• Disposal of drainage water to the sea is assumed to be 9.10 billion m3, which is less than that of 2010 by 3.1 billion m3.
Regarding the wetting scenario (increased Nile flows) up to 2050; as shown in the following table, the estimated trends show slight increase in fresh water supplies with respect to 2010 amounts. But the annual per capita share of the Nile water drops to about 400 m3 due to the increased population. Shallow ground water and re-use of agricultural drainage water are almost same as those of 2010. Under this wetting scenario, there might not be need to extract large amounts of the deep groundwater or to invest in rainfall harvesting. The need for desalinated water is estimated as 0.60 billion m3 and the amounts from upper Nile projects develop more water from the upper Nile projects. Table (6-5.b)
• Under this wetting scenario, the water allocated for the agricultural sector is almost same as that of 2010, but the evapo-transpiration rate will be higher in 2050, which means less agricultural area can be irrigated (only 8.43 million feddan), or the optimum water duty cannot be satisfied for the whole area (8.8 million feddan). The drainage water disposed to the sea is about 10.04 billion m3 to keep salt balance.
• The allocated amount for the water supply sector is sufficient to maintain an average per capita rate of about 236 lit/day. More effort will be needed for conserving water use and reducing network losses in order to maintain these rates.
• Again, it is recommended to enhance the Toshka spillway to secure the country against high floods that might happen under the climate change wetting scenario that might also threaten the safety of the Ethiopian dams.
6.2.c Estimated trends at year 2075 : The population is projected to reach about 191 millions and the upstream demands would cut about 10.50 billion m3 from Egypt’s share, and climate change impacts on the Nile flows vary between -20% and +24%. According to the estimated water budget trends in 2075; as given in Tables (6-6.a & 6-6.b) the Nile flows at Aswan are going to be 36 billion m3 under the drought scenario, while it reaches 55.80 billion m3 under the wetting scenario. The
2050 Water Budget under +ve Nile Flow & estimated Population = 145.8 millionsUpstraem Abstractions = -8.00 Bil.m3 & CC impact on the Nile flow is + 21%
Volume Consumption Usage/Allocation(billion m3/year) (billion m3/year) (billion m3/year)
Drinking (Fresh W only) 3.30 12.60Nile (HAD) 57.48 Industry 2.40 3.50Deep Groundwater 2.20 Agriculture (Adjusted) 43.16 67.00Rainfall & Flash Floods 1.40 Drainage to Sea 10.04Desalination 0.60 Evap. losses 2.90 2.90Others (Upper Nile Projects) 0.75 Env. Balance 0.63 0.63TOTAL Supply 62.43 TOTAL Consumption 62.43
Shallow Groundwater (Delta) 6.00Re-Use of Ag. Drainage Water 17.20Re-UseTreated W Water 0.50Others (e.g. Sea water Agr) 0.50TOTAL 24.20TOTAL Water Available 86.63 86.63
Water Supply Demand by Sector
Conventional Water Sources
Unconventional Sources
TOTAL Water Usage or Allocation

Joint Programme for Climate Change Risk Management in Egypt
Proposed CLIMATE CHANGE ADAPTATION STRATEGY for the Ministry of Water Resources & Irrigation EGYPT (2013)
Filename;\MhmdNour\CC Final Submitted 12-Feb2103 AdptStrtgy .docx page 56
annual per capita share of the Nile water is expected to drop during this period to 206 m3 under the drought scenario, and to 301 m3 under the wetting scenario. Under the drought scenario, the required amount of fresh water resources to be prepared prior to 2075 (in addition to the Nile water) is about 14.5 billion m3. These additional resources are to be developed from deep groundwater (4.5 billion m3), rainfall harvesting (1.75 billion m3), desalination (4.75 billion m3), and upper Nile projects (3.5 billion m3) which has to be effective. Table (6-6.a)
• It is important to recognize that the low Nile flows are going to reduce the shallow groundwater abstractions to 4.50 billion m3, as well as reducing the amounts of re-used agricultural drainage water to 9.0 billion m3. More contribution from treated waste water is expected to be about 2.25 billion m3. Accordingly, the total annual available water supplies; including recycled water, is going to be 69.75 billion m3 in 2075.
• It is expected that by that time, sea water agriculture would be well established and will be a reliable source, and is estimated to contribute by an amount equivalent to 3.50 billion m3 in 2075.
• The agricultural sector is going to suffer more cuts due to the increased demand on drinking and industrial waters. Agricultural allocation is estimated to drop to about 48.10 billion m3 by 2075, which represents 64% of the total available water supplies. In addition to that, the average annual evapo-transpiration rate in 2075 is assumed to rise by 8% , and consequently the average overall irrigation water duty will also increase to about 8222 m3/fed in order to maintain same current productivity of the agricultural lands. This will lead to reduction in the current irrigated area by about 2.95 million feddan, which is very difficult to implement either politically or socially. The other alternative in dealing with these cuts is to distribute this shortage equally on the whole lands (8.8 million feddan), and accept some level of reduced yield. This is more likely to be acceptable, but there is high cost for raising the irrigation efficiency and to implement measures for rehabilitating the irrigation control system and soft interventions to distribute water on volumetric basis at the branch canal levels. In such case, the reduced average irrigation water duty will be about 5465 m3/fed which is about 66.5% of the optimum one.
• Regarding the municipal water sector, the allocated amount of drinking water is estimated to be 14.50 billion m3 in 2075 which is about 23% of the fresh water supplies. This means that the average per capita usage will be 205 lit/day, and the average consumption rate is going to be 61 lit/day. These rates are reasonable and sufficient for basic needs. The ration of consumption to usage is about 29%.
2075 Water Budget under -ve Nile Flow & est. Population = 191 millionsUpstraem Abstractions = -10.50 Bil.m3 & CC impact on the Nile flow is -20%
Volume Consumption Usage/Allocation(billion m3/year) (billion m3/year) (billion m3/year)
Drinking (Fresh W only) 4.25 14.50Nile (HAD) 36.00 Industry 3.00 4.00Deep Groundwater 4.50 Agriculture (Adjusted) 31.50 48.10Rainfall & Flash Floods 1.75 Drainage to Sea 8.60Desalination 4.75 Evap. losses 2.55 2.55Others (Upper Nile Projects) 3.50 Env. Balance 0.60 0.60TOTAL Supply 50.50 TOTAL Consumption 50.50
Shallow Groundwater (Delta) 4.50Re-Use of Ag. Drainage Water 9.00Re-UseTreated W Water 2.25Others (e.g. Sea water Agr) 3.50TOTAL 19.25TOTAL Water Available 69.75 69.75
Unconventional Sources
TOTAL Water Usage or Allocation
Water Supply Demand by Sector
Conventional Water Sources

Joint Programme for Climate Change Risk Management in Egypt
Proposed CLIMATE CHANGE ADAPTATION STRATEGY for the Ministry of Water Resources & Irrigation EGYPT (2013)
Filename;\MhmdNour\CC Final Submitted 12-Feb2103 AdptStrtgy .docx page 57
• The industrial water allocation is expected to increase to 4.0 billion m3 which is about 6% of total available water supplies.
• Disposal of drainage water to the sea is in 2075 is assumed to be 8.60 billion m3, which represents about 17% of the consumed water. This ratio is lower than those of 2010, 2025, and 2050, which may lead to deterioration in the salt balance of the soils.
• Regarding the wetting scenario (increased Nile flows) at 2075, the estimated trends show reductions in the annual per capita share of the Nile water which may drop to about 301 m3 which is mainly due to the increased population.
• Shallow ground water abstraction are estimated to be 5.50 billion m3 which is almost same as that
of 2010, and the re-used volume of agricultural drainage water is projected to be 17.85 billion m3. The latter contributes to about 19.7% of the total available water supply. The extraction from deep groundwater and rainfall harvesting are estimated to slightly increase over those values of 2050 without heavy exploitation. However, it is estimated to obtain 1.50 billion m3 from desalinated. Finally, the estimated amounts from the upper Nile projects are 1.70 billion m3. The total available annual water supplies under this wetting scenario reached 90.50 billion m3 in 2075.
Table (6-6.b)
• Under this wetting scenario, water allocated for the agricultural sector is 67.70 billion m3, and the annual evapo-transpiration rate is estimated to be 8% higher than that of 2010 (or about 4957 m3/fed), with an overall average annual water duty of about 8600 m3/fed. This means that the irrigated agricultural area is going to be reduced to only 7.87 million feddan instead of the current 8.8 million feddan). The other alternative (most likely) is to use lower water duty and accept some kind of yield reduction to be able to irrigate the whole current area and avoid political and socio-economical problems. The reduced annual water duty is estimated to reach 7693 m3/fed, which is about 90% of the assumed optimum one.
• The amount of drainage water disposed to the sea is estimated to be about 9.65 billion m3 to keep
salt balance. • The allocated amount for municipal water supply in 2075 would maintain an average per capita
rate of about 214 lit/day, to satisfy average per capita consumption of about 63 lit/day.
2075 Water Budget under +ve Nile Flow & est. Population = 191 millionsUpstraem Abstractions = -10.50 Bil.m3 & CC impact on the Nile flow is + 24%
Volume Consumption Usage/Allocation(billion m3/year) (billion m3/year) (billion m3/year)
Drinking (Fresh W only) 4.41 15.00Nile (HAD) 55.80 Industry 3.20 4.00Deep Groundwater 2.50 Agriculture (Adjusted) 41.95 67.70Rainfall & Flash Floods 1.50 Drainage to Sea 9.65Desalination 1.50 Evap. losses 3.00 3.00Others (Upper Nile Projects) 1.70 Env. Balance 0.80 0.80TOTAL Supply 63.00 TOTAL Consumption 63.01
Shallow Groundwater (Delta) 5.50Re-Use of Ag. Drainage Water 17.85Re-UseTreated W Water 2.00Others (e.g. Sea water Agr) 2.15TOTAL 27.50TOTAL Water Available 90.50 90.50
Conventional Water Sources
Unconventional Sources
TOTAL Water Usage or Allocation
Water Supply Demand by Sector

Joint Programme for Climate Change Risk Management in Egypt
Proposed CLIMATE CHANGE ADAPTATION STRATEGY for the Ministry of Water Resources & Irrigation EGYPT (2013)
Filename;\MhmdNour\CC Final Submitted 12-Feb2103 AdptStrtgy .docx page 58
6.2.d Estimated trends at year 2100: The population reaches about 237 millions and the growing upstream demands would cut about 13 billion m3 from Egypt’s share, and climate change impacts on the Nile flows vary between -31% and +27%. According to the following estimated water budget trends in 2100, the Nile flows at Aswan in 2100 are going to be 29.33 billion m3 under the drought scenario, while it reaches 53.98 billion m3 under the wetting scenario. The annual per capita share of the Nile water is falling rapidly during this period to reach to 149 m3 under the drought scenario, and 240 m3 under the wetting scenario. These are very low values that would lead to severe and critical situation for managing the water resources especially under the drought scenario. Again, due to the obvious uncertainty in projecting the Nile flows after about 90 years, it is important to continuously monitor and update these estimates. However, it serves to give guidelines for the adaptation strategy and help in estimating the size of the required measures. It will be wise to seriously take the necessary measures that would serve the development plans, especially under the growing population which impose significant stress on the water sector. It is to be emphasized here the importance of establishing forecasting and monitoring programs as soon as possible to update our capacity and knowledge for predictions and expectations regarding the consequences of the climate change on the estimated water budget trends. In case of prevalence of the drought scenario signals, serious and strict measures should be activated. The following paragraphs outline the consequences of continuation of both of the drought and wetting scenarios according to the above estimated trends. Under the drought scenario, the required additional amounts of fresh water resources to be prepared prior to 2100 (in addition to the Nile water) is about 16.85 billion m3. These additional resources are from deep groundwater (4.0 billion m3), rainfall harvesting (0.55 billion m3), desalination (6.5 billion m3), and upper Nile projects (6.0 billion m3) which has to be effective.
• It is important to recognize that the low Nile flows are estimated to reduce the shallow groundwater abstractions to 4.10 billion m3, as well as reducing the amounts of re-used agricultural drainage water to 8.68 billion m3. More contribution from treated waste water is expected and will reach about 3.75 billion m3. Accordingly, the total annual available water supplies; including recycled water, is going to be 71.71 billion m3 in 2100.
• The amount of sea water to be used for agriculture is estimated to be equivalent to 5.50 billion m3 in 2100. It is expected that by that time, sea water agriculture would be well established and can be a reliable source.
Table (6-7.a)
2100 Water Budget under -ve Nile Flow & est. Population = 237 millionsUpstraem Abstractions = -13.00 Bil.m3 & CC impact on the Nile flow is -31%
Volume Consumption Usage/Allocation(billion m3/year) (billion m3/year) (billion m3/year)
Drinking (Fresh W only) 4.70 16.30Nile (HAD) 29.33 Industry 3.30 4.70Deep Groundwater 6.00 Agriculture (Adjusted) 30.80 47.03Rainfall & Flash Floods 1.85 Drainage to Sea 7.20Desalination 6.50 Evap. losses 2.68 2.68Others (Upper Nile Projects) 6.00 Env. Balance 1.00 1.00TOTAL Supply 49.68 TOTAL Consumption 49.68
Shallow Groundwater (Delta) 4.10Re-Use of Ag. Drainage Water 8.68Re-UseTreated W Water 3.75Others (e.g. Sea water Agr) 5.50TOTAL 22.03TOTAL Water Available 71.71 71.71
Conventional Water Sources
Unconventional Sources
TOTAL Water Usage or Allocation
Water Supply Demand by Sector

Joint Programme for Climate Change Risk Management in Egypt
Proposed CLIMATE CHANGE ADAPTATION STRATEGY for the Ministry of Water Resources & Irrigation EGYPT (2013)
Filename;\MhmdNour\CC Final Submitted 12-Feb2103 AdptStrtgy .docx page 59
• The agricultural sector is going to suffer cuts as the allocated water will be further reduced to
about 47 billion m3 by 2100, which represents 66% of the total water supplies. In addition to that, the average annual evapo-transpiration rate in 2100 is assumed to be about 5141 m3/fed, which is about 12% higher than that of 2010 (4590 m3/fed). While the allocated average annual irrigation water duty in 2100 is expected to increase to (8526 m3/fed) in order to maintain same current productivity of the agricultural lands. This will lead to either reduction in the current irrigated area by about 3.00 million feddan, which is very difficult to implement either politically, economically or socially, or to reduce the average annual water duty to be 4344 m3/fed in order to maintain the whole area (8.8 mil. feddan). This is equivalent to about 63% of the assumed optimum water duty.
The other alternative in dealing with these cuts of agricultural water allocation is to distribute this shortage equally on the whole lands, and accept some level of reduced yield. This is more likely to be acceptable, but again, there is high cost for raising the irrigation efficiency and to implement measures for rehabilitating the irrigation control system and soft interventions to distribute water on volumetric basis at the branch canal levels. In such case, the reduced average irrigation water duty will be about 5529 m3/fed which is about 65% of the optimum one.
• Regarding the municipal water sector, the allocated (produced) amount of drinking water is estimated to be 16.30 billion m3 in 2100 (instead of 9.0 billion m3 in 2010) which is about 23% of the total water supplies. This means that the average per capita usage will be 188 lit/day instead of the current rate of 293 lit/day in 2010. These figures assume that the average consumption rate is going to be 54 lit/day instead of 61.78 lit/day in 2010. Although, the rates are reduced, it still needs huge efforts from the water supply companies to reduce losses in the distribution networks and urge people to use water more efficiently.
• The industrial water allocation is expected to increase to 4.70 billion m3 (7% of total water supplies) instead of 2.0 billion m3 in 2010.
• Disposal of drainage water to the sea is assumed to be 7.20 billion m3, which is less than that of 2010 by 3.1 billion m3.
Regarding the wetting scenario (increased Nile flows) at 2100, the estimated trends show similar fresh water supplies with respect to 2010 amounts. But the annual per capita share of the Nile water drops to about 240 m3 due to the increased population. Shallow ground water abstraction are 5.30 billion m3 which is almost same as that of 2010, and the re-use of agricultural drainage water is higher than that of 2010 (18.5 billion m3 instead of 16 billion m3). Also, extraction from deep groundwater and rainfall harvesting are estimated to increase slightly. However, there is still need for desalinated water of about 2.50 billion m3, while the estimated amounts from the upper Nile projects are 2.83 billion m3. The total available annual water supplies under this wetting scenario reached 94.21 billion m3 in 2100. Under this wetting scenario, the water allocated for the agricultural sector is about 66.65 billion m3, which is almost same as that of 2010, but the population is almost tripled and the evapo-transpiration rate will be 12% higher than that of 2010. This means less agricultural area can be irrigated (only 7.82 million feddan instead of the current one of 2010 which is 8.8 million feddan). The other alternative (most likely) is to use lower water duty (about 7574 m3/fed/yr which is 89% of the optimum one) and accept some yield reduction to be able to irrigate the same current area. The drainage water disposed to the sea is about 9.35 billion m3 to keep salt balance.

Joint Programme for Climate Change Risk Management in Egypt
Proposed CLIMATE CHANGE ADAPTATION STRATEGY for the Ministry of Water Resources & Irrigation EGYPT (2013)
Filename;\MhmdNour\CC Final Submitted 12-Feb2103 AdptStrtgy .docx page 60
Table (6-7.b)
• The allocated amount for municipal water supply in 2100 would maintain an average per capita rate of 202 lit/day to satisfy average per capita consumption of about 54 lit/day. More effort will be needed for conserving water use and reducing network losses in order to maintain these rates.
6.3 Vulnerability Assessment under the Projected Drought and Wetting Scenarios The WHO (2008) defined vulnerability as a function of the character, magnitude and rate of climate variation to which a system is exposed, its sensitivity and its adaptive capacity. The vulnerability of a system to climate change consequently includes both an external dimension, represented by its exposure to climate variations, and an internal dimension; represented by its sensitivity to climate variations and its adaptive capacity. A highly vulnerable system is one that is very sensitive to modest changes in climate, where the sensitivity includes the potential for substantial harmful effects, and for which the ability to cope is limited.
The vulnerability of the water sector to climate change is determined by the magnitude and nature of changes that are expected, the natural ability of the hydrological system to adapt to these changes, and the capacity of the relevant institutions and infrastructure to respond to the anticipated changes. The ability of a nation to adapt its water sector depends on the institutional set-up, the regulations, the water management practices and the state of the water system at present in terms of infrastructure age and its ability to cope with present climatic conditions.
Vulnerability assessment (VA) delineates the places, human groups, sectors, and ecosystems that are at highest risk, the sources of their vulnerability, and how the risk can be diminished or eliminated. Therefore, identifying the regions and people at greatest risk and assessing the sources and causes of the vulnerability is critical for designing and targeting adaptation. This effort guides the prioritization of intervention and adaptation action and provides decision makers with information on where and when interventions are needed.
Vulnerability assessment should be predictive, conceptualizing what might happen to an identifiable population or ecosystem under conditions of particular risk and hazards. They should therefore be capable of seeking ways to protect and enhance peoples’ livelihoods, assist vulnerable people in their own self-protection, and support institutions in their role of adaptation.
The WHO (2008) added that , there is no ”one size fits all” VA methodology. VAs should be tailor-made for the water resources management or water services of a particular basin. Typically, a VA
2100 Water Budget under +ve Nile Flow & est. Population = 237 millionsUpstraem Abstractions = -13.00 Bil.m3 & CC impact on the Nile flow is + 27%
Volume Consumption Usage/Allocation(billion m3/year) (billion m3/year) (billion m3/year)
Drinking (Fresh W only) 5.30 17.70Nile (HAD) 53.98 Industry 3.90 5.25Deep Groundwater 2.75 Agriculture (Adjusted) 40.50 66.65Rainfall & Flash Floods 1.60 Drainage to Sea 9.35Desalination 2.50 Evap. losses 3.21 3.21Others (Upper Nile Projects) 2.83 Env. Balance 1.40 1.40TOTAL Supply 63.66 TOTAL Consumption 63.66
Shallow Groundwater (Delta) 5.30Re-Use of Ag. Drainage Water 18.50Re-UseTreated W Water 3.00Others (e.g. Sea water Agr) 3.75TOTAL 30.55TOTAL Water Available 94.21 94.21
Water Supply Demand by Sector
Conventional Water Sources
TOTAL Water Usage or Allocation
Unconventional Sources
Joint Programme for Climate Change Risk Management in Egypt
Proposed CLIMATE CHANGE ADAPTATION STRATEGY for the Ministry of Water Resources & Irrigation EGYPT (2013)
Filename;\MhmdNour\CC Final Submitted 12-Feb2103 AdptStrtgy .docx page 61
includes; Scoping and structuring the assessment, and identifying the vulnerable groups, areas and sectors. Identifying key vulnerabilities contain the magnitude and impacts, timing, persistence and reversibility of impacts, potential for adaptation, and importance of the systems at risk. The above developed water budget trends enabled predicting the following Tables (6-8.a & 6-8.b) which summarize the above mentioned discussions regarding the estimated adaptation measures as represented by projections of supplied water and its consequences on the allocated water to different sectors under the drying and wetting climate change scenarios. Besides, it present some calculated indicators “or vulnerability trends” showing the consequences of the above developed trends in the years 2025 to 2100 as well as the base years of 2010 and the adjusted one of 2015. These indicators show the decrease of per capita share of available water resources, and the projected increase of evapo-transpiration and water duties and the corresponding reduction in the irrigated areas or water duties to keep same area. It also, shows the per capita average allocation of municipal water and consumption. The estimated required additional water volumes from different sources (conventional and non-conventional) as obtained from balancing the future water budget trends, are also presented as mentioned in the above discussions. These vulnerability trends and indicators are also presented graphically in Annex (A4).
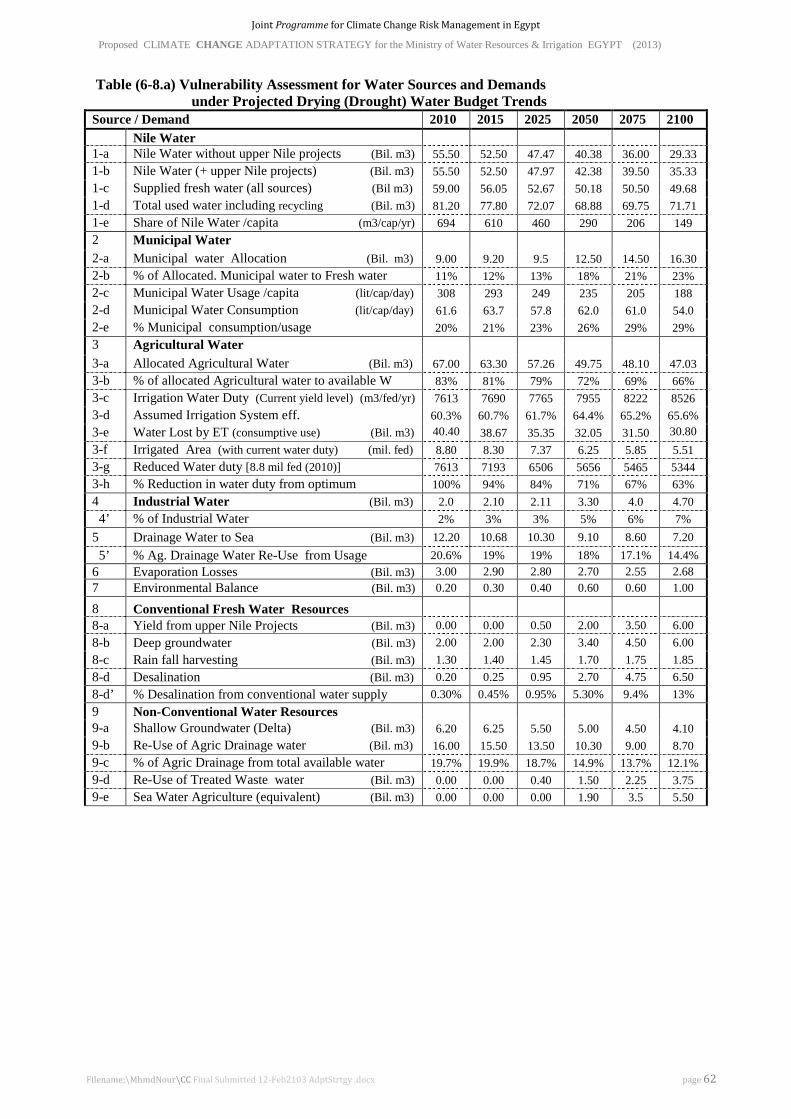
Joint Programme for Climate Change Risk Management in Egypt
Proposed CLIMATE CHANGE ADAPTATION STRATEGY for the Ministry of Water Resources & Irrigation EGYPT (2013)
Filename;\MhmdNour\CC Final Submitted 12-Feb2103 AdptStrtgy .docx page 62
Table (6-8.a) Vulnerability Assessment for Water Sources and Demands under Projected Drying (Drought) Water Budget Trends
Source / Demand 2010 2015 2025 2050 2075 2100 Nile Water 1-a Nile Water without upper Nile projects (Bil. m3) 55.50 52.50 47.47 40.38 36.00 29.33 1-b Nile Water (+ upper Nile projects) (Bil. m3) 55.50 52.50 47.97 42.38 39.50 35.33 1-c Supplied fresh water (all sources) (Bil m3) 59.00 56.05 52.67 50.18 50.50 49.68 1-d Total used water including recycling (Bil. m3) 81.20 77.80 72.07 68.88 69.75 71.71 1-e Share of Nile Water /capita (m3/cap/yr) 694 610 460 290 206 149 2 Municipal Water 2-a Municipal water Allocation (Bil. m3) 9.00 9.20 9.5 12.50 14.50 16.30 2-b % of Allocated. Municipal water to Fresh water 11% 12% 13% 18% 21% 23% 2-c Municipal Water Usage /capita (lit/cap/day) 308 293 249 235 205 188 2-d Municipal Water Consumption (lit/cap/day) 61.6 63.7 57.8 62.0 61.0 54.0 2-e % Municipal consumption/usage 20% 21% 23% 26% 29% 29% 3 Agricultural Water 3-a Allocated Agricultural Water (Bil. m3) 67.00 63.30 57.26 49.75 48.10 47.03 3-b % of allocated Agricultural water to available W 83% 81% 79% 72% 69% 66% 3-c Irrigation Water Duty (Current yield level) (m3/fed/yr) 7613 7690 7765 7955 8222 8526 3-d Assumed Irrigation System eff.
60.3% 60.7% 61.7% 64.4% 65.2% 65.6%
3-e Water Lost by ET (consumptive use) (Bil. m3) 40.40
38.67 35.35 32.05 31.50 30.80 3-f Irrigated Area (with current water duty) (mil. fed) 8.80 8.30 7.37 6.25 5.85 5.51
3-g Reduced Water duty [8.8 mil fed (2010)]
7613 7193 6506 5656 5465 5344 3-h % Reduction in water duty from optimum 100% 94% 84% 71% 67% 63% 4 Industrial Water (Bil. m3) 2.0 2.10 2.11 3.30 4.0 4.70 4’ % of Industrial Water 2% 3% 3% 5% 6% 7% 5 Drainage Water to Sea (Bil. m3) 12.20 10.68 10.30 9.10 8.60 7.20 5’ % Ag. Drainage Water Re-Use from Usage 20.6% 19% 19% 18% 17.1% 14.4% 6 Evaporation Losses (Bil. m3) 3.00 2.90 2.80 2.70 2.55 2.68 7 Environmental Balance (Bil. m3) 0.20 0.30 0.40 0.60 0.60 1.00
8 Conventional Fresh Water Resources 8-a Yield from upper Nile Projects (Bil. m3) 0.00 0.00 0.50 2.00 3.50 6.00 8-b Deep groundwater (Bil. m3) 2.00 2.00 2.30 3.40 4.50 6.00 8-c Rain fall harvesting (Bil. m3) 1.30 1.40 1.45 1.70 1.75 1.85 8-d Desalination (Bil. m3) 0.20 0.25 0.95 2.70 4.75 6.50 8-d’ % Desalination from conventional water supply 0.30% 0.45% 0.95% 5.30% 9.4% 13% 9 Non-Conventional Water Resources 9-a Shallow Groundwater (Delta) (Bil. m3) 6.20 6.25 5.50 5.00 4.50 4.10 9-b Re-Use of Agric Drainage water (Bil. m3) 16.00 15.50 13.50 10.30 9.00 8.70 9-c % of Agric Drainage from total available water 19.7% 19.9% 18.7% 14.9% 13.7% 12.1% 9-d Re-Use of Treated Waste water (Bil. m3) 0.00 0.00 0.40 1.50 2.25 3.75 9-e Sea Water Agriculture (equivalent) (Bil. m3) 0.00 0.00 0.00 1.90 3.5 5.50
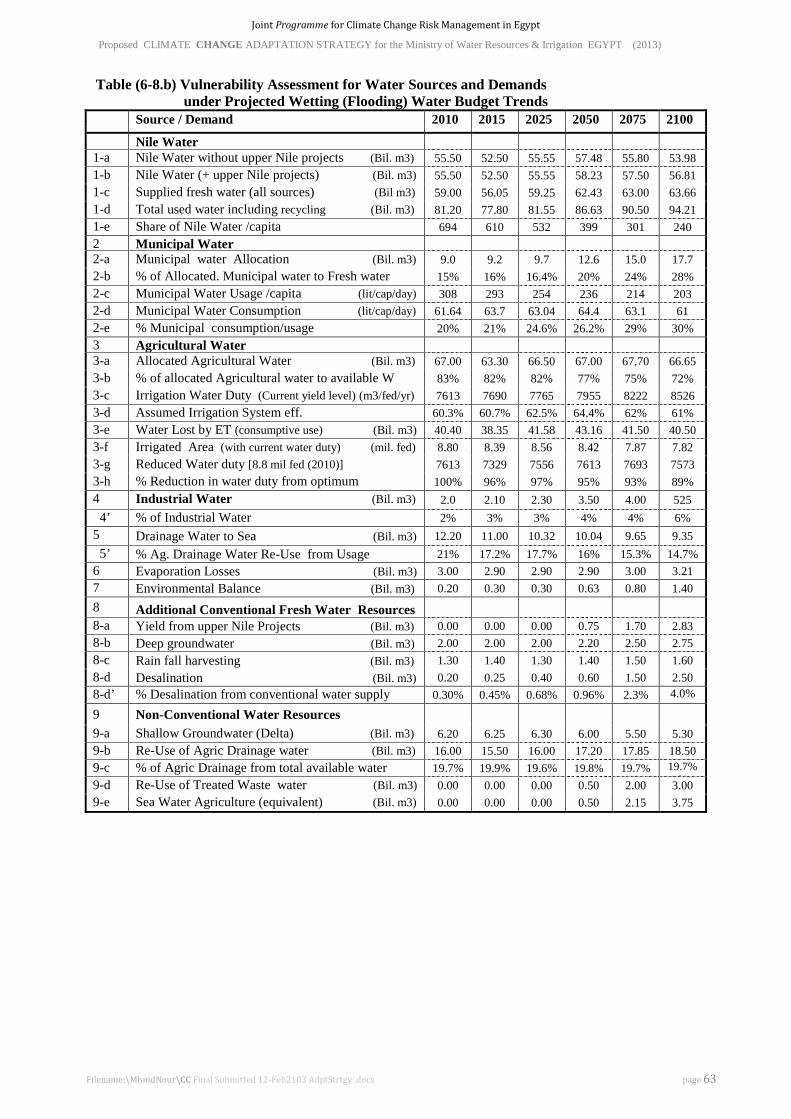
Joint Programme for Climate Change Risk Management in Egypt
Proposed CLIMATE CHANGE ADAPTATION STRATEGY for the Ministry of Water Resources & Irrigation EGYPT (2013)
Filename;\MhmdNour\CC Final Submitted 12-Feb2103 AdptStrtgy .docx page 63
Table (6-8.b) Vulnerability Assessment for Water Sources and Demands under Projected Wetting (Flooding) Water Budget Trends Source / Demand 2010 2015 2025 2050 2075 2100 Nile Water 1-a Nile Water without upper Nile projects (Bil. m3) 55.50 52.50 55.55 57.48 55.80 53.98 1-b Nile Water (+ upper Nile projects) (Bil. m3) 55.50 52.50 55.55 58.23 57.50 56.81 1-c Supplied fresh water (all sources) (Bil m3) 59.00 56.05 59.25 62.43 63.00 63.66 1-d Total used water including recycling (Bil. m3) 81.20 77.80 81.55 86.63 90.50 94.21 1-e Share of Nile Water /capita
694 610 532 399 301 240
2 Municipal Water 2-a Municipal water Allocation (Bil. m3) 9.0 9.2 9.7 12.6 15.0 17.7 2-b % of Allocated. Municipal water to Fresh water 15% 16% 16.4% 20% 24% 28% 2-c Municipal Water Usage /capita (lit/cap/day) 308 293 254 236 214 203 2-d Municipal Water Consumption (lit/cap/day) 61.64 63.7 63.04 64.4 63.1 61 2-e % Municipal consumption/usage 20% 21% 24.6% 26.2% 29% 30% 3 Agricultural Water 3-a Allocated Agricultural Water (Bil. m3) 67.00 63.30 66.50 67.00 67.70 66.65 3-b % of allocated Agricultural water to available W 83% 82% 82% 77% 75% 72% 3-c Irrigation Water Duty (Current yield level) (m3/fed/yr) 7613 7690 7765 7955 8222 8526 3-d Assumed Irrigation System eff.
60.3% 60.7% 62.5% 64.4% 62% 61%
3-e Water Lost by ET (consumptive use) (Bil. m3) 40.40 38.35 41.58 43.16 41.50 40.50 3-f Irrigated Area (with current water duty) (mil. fed) 8.80 8.39 8.56 8.42 7.87 7.82 3-g Reduced Water duty [8.8 mil fed (2010)]
7613 7329 7556 7613 7693 7573
3-h % Reduction in water duty from optimum 100% 96% 97% 95% 93% 89% 4 Industrial Water (Bil. m3) 2.0 2.10 2.30 3.50 4.00 525 4’ % of Industrial Water 2% 3% 3% 4% 4% 6% 5 Drainage Water to Sea (Bil. m3) 12.20 11.00 10.32 10.04 9.65 9.35 5’ % Ag. Drainage Water Re-Use from Usage 21% 17.2% 17.7% 16% 15.3% 14.7% 6 Evaporation Losses (Bil. m3) 3.00 2.90 2.90 2.90 3.00 3.21 7 Environmental Balance (Bil. m3) 0.20 0.30 0.30 0.63 0.80 1.40 8 Additional Conventional Fresh Water Resources 8-a Yield from upper Nile Projects (Bil. m3) 0.00 0.00 0.00 0.75 1.70 2.83 8-b Deep groundwater (Bil. m3) 2.00 2.00 2.00 2.20 2.50 2.75 8-c Rain fall harvesting (Bil. m3) 1.30 1.40 1.30 1.40 1.50 1.60 8-d Desalination (Bil. m3) 0.20 0.25 0.40 0.60 1.50 2.50 8-d’ % Desalination from conventional water supply 0.30% 0.45% 0.68% 0.96% 2.3% 4.0%
9 Non-Conventional Water Resources 9-a Shallow Groundwater (Delta) (Bil. m3) 6.20 6.25 6.30 6.00 5.50 5.30 9-b Re-Use of Agric Drainage water (Bil. m3) 16.00 15.50 16.00 17.20 17.85 18.50 9-c % of Agric Drainage from total available water 19.7% 19.9% 19.6% 19.8% 19.7% 19.7%
% 9-d Re-Use of Treated Waste water (Bil. m3) 0.00 0.00 0.00 0.50 2.00 3.00 9-e Sea Water Agriculture (equivalent) (Bil. m3) 0.00 0.00 0.00 0.50 2.15 3.75

Joint Programme for Climate Change Risk Management in Egypt
Proposed CLIMATE CHANGE ADAPTATION STRATEGY for the Ministry of Water Resources & Irrigation EGYPT (2013)
Filename;\MhmdNour\CC Final Submitted 12-Feb2103 AdptStrtgy .docx page 64
7.0 The Climate Change Adaptation Strategy
This chapter presents the proposed climate change adaptation strategy to water resources management and the coastal zones in Egypt. The proposed strategy was developed by first reviewing the general adaptation measures of the previous strategies and several studies as well as from the conclusions of meetings and discussions with the officials of the ministry of water resources and irrigation. Then, specific measures were defined for water resources management based on the estimated water budget trends as presented in chapter 6. While those related to the coastal zones and sea level rise are based on reviewed studies and meetings with SPA and CoRI officials. These specific measures were grouped climate change induced risks and their associated consequences, and further classified according to several criteria. Finally, the most effective measures are used in formulating the proposed adaptation strategy in terms of the size and timing of the required measures as well as an estimate for the required budget.
7.1 General Adaptation Measures Adaptation measures aim to counteract negative effects of too much water, too little water, deterioration of water quality and effects on health. WHO-2008 defined five different types of measures that form an adaptation chain: prevention, improving resilience, preparation, response, and recovery (figure 7-1). Measures for prevention and improving resilience are related both to the gradual effects of climate change. Preparation, response, and recovery measures are relevant to extreme events. In fact, it is not always feasible to categorize certain measures as one specific type.
Figure (7-1) the different types of adaptation measures (the safety chain) source: WHO- (2008) Measures can be developed at different time scales depending on their characteristics. The following table (7-1) provides some examples of different types of decisions at the strategic, tactical and operational levels. The Strategic measures are related to decisions addressing long-term (decadal) climate changes and are based on long-term projections. They usually exceed the scope of water sector planning, because they affect the development model and the socio-economic background through institutional and legal changes. Tactical measures relate to decisions aiming at addressing medium-term (within one or two decades) climate trend forecasts, introducing the required corrections in the framework through hydrological planning measures such as risk management. While the operational measures relate to decisions addressing identified problems under the current climate. They correspond to measures that can be adopted in the current institutional, legal and infrastructural frameworks, and usually refer to risk assessment, preparedness and vulnerability reduction.
Prevent
Respond
ImproveResilience
Prepare
RecoverExtreme Events
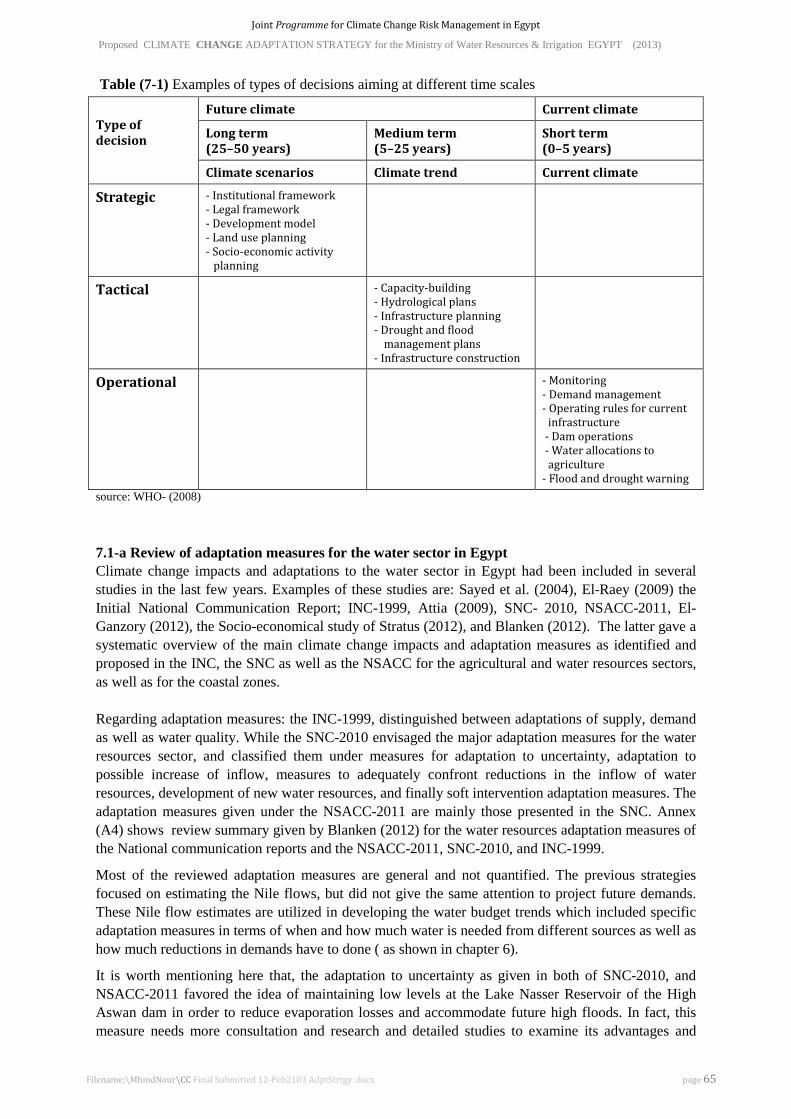
Joint Programme for Climate Change Risk Management in Egypt
Proposed CLIMATE CHANGE ADAPTATION STRATEGY for the Ministry of Water Resources & Irrigation EGYPT (2013)
Filename;\MhmdNour\CC Final Submitted 12-Feb2103 AdptStrtgy .docx page 65
Table (7-1) Examples of types of decisions aiming at different time scales
Type of decision
Future climate Current climate
Long term (25–50 years)
Medium term (5–25 years)
Short term (0–5 years)
Climate scenarios Climate trend Current climate
Strategic - Institutional framework - Legal framework - Development model - Land use planning - Socio-economic activity
planning
Tactical - Capacity-building - Hydrological plans - Infrastructure planning - Drought and flood
management plans - Infrastructure construction
Operational - Monitoring - Demand management - Operating rules for current
infrastructure - Dam operations - Water allocations to
agriculture - Flood and drought warning
source: WHO- (2008) 7.1-a Review of adaptation measures for the water sector in Egypt Climate change impacts and adaptations to the water sector in Egypt had been included in several studies in the last few years. Examples of these studies are: Sayed et al. (2004), El-Raey (2009) the Initial National Communication Report; INC-1999, Attia (2009), SNC- 2010, NSACC-2011, El-Ganzory (2012), the Socio-economical study of Stratus (2012), and Blanken (2012). The latter gave a systematic overview of the main climate change impacts and adaptation measures as identified and proposed in the INC, the SNC as well as the NSACC for the agricultural and water resources sectors, as well as for the coastal zones. Regarding adaptation measures: the INC-1999, distinguished between adaptations of supply, demand as well as water quality. While the SNC-2010 envisaged the major adaptation measures for the water resources sector, and classified them under measures for adaptation to uncertainty, adaptation to possible increase of inflow, measures to adequately confront reductions in the inflow of water resources, development of new water resources, and finally soft intervention adaptation measures. The adaptation measures given under the NSACC-2011 are mainly those presented in the SNC. Annex (A4) shows review summary given by Blanken (2012) for the water resources adaptation measures of the National communication reports and the NSACC-2011, SNC-2010, and INC-1999.
Most of the reviewed adaptation measures are general and not quantified. The previous strategies focused on estimating the Nile flows, but did not give the same attention to project future demands. These Nile flow estimates are utilized in developing the water budget trends which included specific adaptation measures in terms of when and how much water is needed from different sources as well as how much reductions in demands have to done ( as shown in chapter 6).
It is worth mentioning here that, the adaptation to uncertainty as given in both of SNC-2010, and NSACC-2011 favored the idea of maintaining low levels at the Lake Nasser Reservoir of the High Aswan dam in order to reduce evaporation losses and accommodate future high floods. In fact, this measure needs more consultation and research and detailed studies to examine its advantages and

Joint Programme for Climate Change Risk Management in Egypt
Proposed CLIMATE CHANGE ADAPTATION STRATEGY for the Ministry of Water Resources & Irrigation EGYPT (2013)
Filename;\MhmdNour\CC Final Submitted 12-Feb2103 AdptStrtgy .docx page 66
disadvantages and evaluate the long term impacts as well as considering other options to reduce evaporation losses. The other alternative regarding uncertainty of floods is to enhance the Toshka spillway and establish efficient early warning systems.
Also, the NSACC-2011; when talked about adaptation to increased flow of the Nile, pointed out the construction of reservoirs in the upstream countries under the Nile Basin Initiative. We believe that these actions are not appropriate now after the recent developments and the fast implementation of the Ethiopian dams. The issues of high floods are becoming less critical than those of water shortage, especially during the filling stage of these dams. In the same time, it may be important to enhance the Toshka spillway to provide sufficient protection in case of emergency regarding the safety of any of the upstream dams or releasing unexpected volumes for any reasons. 7.1-b Adaptation measures for the Coastal zones El-Raey et al. (1999) identified the most important adaptation options in the vulnerable areas of coastal zones and evaluated their environmental impacts and costs. These main options are: beach nourishment and groins, breakwaters, legal development regulations, integrated coastal zone management (ICZM), land use change, and finally no action. The second National Communication (SNC-2010) confirmed the critical importance of the ICZM approach and - referring to the approval of the Egyptian National Assembly of new regulations to include ICZM into development plans needed for better management of coastal resources and protection against climate change impacts – asked for the National Coastal Zone Management Committee to be activated for the effective formulation of such ICZM plans. The National Strategy for Adaptation to climate change (NSACC-2011) clarifies that Egypts’ strategy primarily adopts accommodation and protection as the basis for adaptation to the risks resulting from climate change, taking into account that retreat as an additional option would be implemented in the event that the coastal areas are exposed to storms and hurricanes or any extreme event, based on plans prepared in advance.
7.1-c Adaptation measures for Sea Water Intrusion and Protection of the Northern Lakes A number of different measures have been used to control seawater intrusion and to protect the groundwater resources. The main principle of protection is to increase the volume of fresh groundwater and reduce the volume of saltwater. Todd (1976) discussed various means of preventing saltwater from contaminating groundwater sources including: (1) reduction of the abstraction rates, (2) relocation of abstraction wells, (3) subsurface barriers, (4) natural recharge, (5) artificial recharge, (6) abstraction of saline water, (7) combination of injection and abstraction systems, (8) Creating a trough (interceptor drain) parallel to the coast by excavating encroaching saltwater from wells, and (9) Re-injecting wastewater near the saltwater interface to aid in maintaining a sufficient head of freshwater. All these methods have their own advantages and limitations and are site specific. Examples of adaptation measures for protecting the northern lakes may are enforcement of Al-Salam canal banks south of Manzala Lake, and that of the international road which lies between the El-Burullus North boundary and the shore line. Other measures are mentioned in the SNC-2010 and NSACC-2011 are mainly to protect water quality and aquatic life in these lakes.
7.2 Specific Adaptation Measures In fact, most of the adaptation measures mentioned in the literature are general and descriptive without quantification or setting onset. Besides, demand projections are not given same attention as supply predictions; e.g. Nile Flow forecasting. The presented water budget trends took into account the projected demands and some adaptation measures; such as developing additional conventional and non-conventional water resources, to balance the growing demands. These measures included

Joint Programme for Climate Change Risk Management in Egypt
Proposed CLIMATE CHANGE ADAPTATION STRATEGY for the Ministry of Water Resources & Irrigation EGYPT (2013)
Filename;\MhmdNour\CC Final Submitted 12-Feb2103 AdptStrtgy .docx page 67
abstractions from the non-renewable deep ground water, more water harvesting from rainfall and flashfloods (which is non-reliable), and more reliance on desalination (which is expensive). Also, it assumed some measures to reduce demands in order to cope with decreasing water availability, such as using less water consuming crops and/or modifying the cropping, reducing the irrigated areas, or reducing irrigation water duties, and adjusting consumption of municipal water. These trends would guide planners on specific adaptation measures regarding when and how much water is needed from different potential sources.
These trends defined the range of exposure as it enabled estimating the future reduction of per capita share of Nile water which might have serious and drastic implications on the development plans if no actions are not taken [even under the wetting scenario and the assumption of successful upper Nile projects] as shown on Table (6-8.b). The use of these water budget trends would enable estimating the type and size of required adaptation measures, when they are needed, as well as providing basis for estimating financial budgets which are subject to regular updating. Recalling that the developed strategy is dynamic and flexible and should be adjusted in future according to improved knowledge and the prevailing conditions, it will also serve in stimulating a proactive dialogue between decision makers and stakeholders and get their feedback.
7.2-a Specific Adaptation Measures for the Water Sector The average per capita share (from all possible fresh water resources) is estimated at 505 to 568 m3/year in 2025, and about 344 to 428 m3/year in 2050, and about 264 to 329 m3 in 2075, and finally may reach 213 to 281 m3/year in 2100. All these are far below the water poverty limit even with the optimistic climate change wetting conditions. This means that there will be growing dependence and need for using recycled water from agricultural drainage water and treated waste water, which implies the need for high public awareness and very conservative environmental measures and regulations to maintain minimum water quality standards. - Municipal Water Requirements
The municipal water; including drinking water, has the first priority under Egyptian water allocation policy. The current per capita water allocation is extremely high; both on the international scale and for a country living under water poverty limit and is going to witness water scarcity in the near future. Therefore it is important to apply strong conservative measures in order to partially contribute in alleviating risks of municipal water shortage. This needs extensive effort and resources and will take some time to improve infrastructures to raise the efficiency of the distribution networks and change consumers’ behavior and habits. Accordingly, although the total production of municipal water supplies is increasing, the future situation necessitates gradual reduction of the municipal water usage rates as shown in tables (6-8.a & 6-8.b).
- Agricultural Water Requirements Although the growing population requires more food production, which logically means more expansion on agricultural lands and more water for agriculture, the developed trends indicates less water being allocated for agriculture. This is a direct result of the limited water supplies under the increased demands for municipal water, which is most probably are going to be on the expense of water allocated to irrigation canals. This would lead to reducing either the irrigated areas; which is politically, economically, and socially not possible, or reducing the water duty of the irrigated fields. The latter is the most likely and practically possible in spite of its serious consequences of yield reduction under the growing population and the need for more food production. In addition to that, such reduced allocations will indirectly decrease both the recharge to the shallow groundwater in the Delta and the available amounts of agricultural drainage water for reuse. Tables (6-8.a & 6-8.b) show estimates of the projected reduction in water duties under both drying and wetting scenarios for the years 2025, 2050, 2075, and 2100 as developed from the above mentioned water budget

Joint Programme for Climate Change Risk Management in Egypt
Proposed CLIMATE CHANGE ADAPTATION STRATEGY for the Ministry of Water Resources & Irrigation EGYPT (2013)
Filename;\MhmdNour\CC Final Submitted 12-Feb2103 AdptStrtgy .docx page 68
trends. These serious threats should be thoroughly considered for a country like Egypt which imports now (2012) about 50% of its food supplies at a cost of about 10 billion US$. Additionally, and according to these estimates, it is not clear how much water can be provided to irrigate the planned horizontal expansion projects in the new lands (which are supposed to use modern irrigation systems). In fact, reduced water duties means the need for more equitable and transparent water distribution at all levels of the irrigation network. This implies huge investments in upgrading the water control structures and devices up to the head regulators of the branch canals, which should be considered in developing the adaptation strategy. Adaptation measures also include expansion in using both modern pressurized water application methods and low pressure pipeline systems to replace the earth mesqas and marwas in the old lands. These will lead to significant reductions in water losses and improve irrigation efficiency. In addition to that expansion on installing controlled drainage systems will enable reducing deep percolation loosed especially in rice fields. This will lead to significant reductions in rice water requirements.
- Reduced Drainage Water Disposal to the Sea Drainage water disposal to the sea is essential to keep salt balance in the irrigated soils. Although
more recycled drainage water should be used for agricultural purposes, its volume is expected to decrease due to the reduced supplies of fresh water and the raised irrigation efficiency. The current (2010) percentage of drainage water disposal is about 21% of the total consumed water. Its average amount is estimated to decrease gradually to be about 14% of the total consumption by 2100 under the drying scenario, as shown in table (6-8.a). This might create adverse environmental implications on shallow groundwater and soil salinity.
- Increased Deep Groundwater Abstractions Deep groundwater in the deserts is a conventional water source. Being non-renewable source, it
must be used with caution in order to sustain it for future generations. However, if the drying Nile flow scenario prevails in future, there may be a need to slightly exceed the safe yield limits. This requires extensive monitoring and modeling studies to decide on the locations and amounts and to evaluate the sustainability and vulnerability of this precious resource. The projected estimates of required deep groundwater abstractions under both the drying and wetting scenarios are shown in tables (6-8.a & 6-8.b) for the years 2025, 2050, 2075 and 2100. These figures are used in developing the proposed adaptation strategy.
- Rainfall and Flashfloods Harvesting Precipitation in Egypt is relatively a minor water resource with respect to the total water supplies.
Climate change predictions indicated that its trends are going to decrease and there will be more chances for flash floods. Accordingly, rainfall is not expected to play an effective role in the water strategy planning, but there might be chances to recharge groundwater aquifers from the flashfloods. However, advanced technology may help in sustaining the current utilized amounts, and hopefully slightly increase it under the growing needs for any drop of water. Current (2010) annual harvested amount of rainfall is estimated to be 1.30 Billion m3. The estimated amount to be utilized in 2025, 2050, 2075 and 2100 are shown in tables (6-8.a) & (6-8.b) under the drying and wetting scenarios.
- Desalination of brackish and sea water Desalination is considered as a reliable conventional water source; however, its energy demand is
high and expensive. Therefore, desalinated water is mainly used for drinking purposes. Effective contribution from desalination in the water budget will be possible under the promising advanced
Joint Programme for Climate Change Risk Management in Egypt
Proposed CLIMATE CHANGE ADAPTATION STRATEGY for the Ministry of Water Resources & Irrigation EGYPT (2013)
Filename;\MhmdNour\CC Final Submitted 12-Feb2103 AdptStrtgy .docx page 69
technologies regarding renewable energy, and/or the national plans to generate Nuclear energy. The current (2010) use of desalination is about 0.20 billion m3 and mainly in the coastal touristic area who can afford its high cost. The estimated annual desalination production according to the estimated water budget trends for the drying and wetting Nile flows are given in tables (6-8.a) and (6-8.b) respectively. The large amounts of required desalinated water reflect the need for huge budgets to implement this expensive measure under the adaptation strategy.
It is worth mentioning here that, it is expected that future advanced technology for both desalination industry and power generation would enable providing the estimated requirements at reasonable cost, as well as avoiding the environmental hazards resulting from these large desalinated amounts.
- Shallow Groundwater (in the Nile Delta) Shallow groundwater is a renewable water source recharged from water seeping from the Nile,
canals, and irrigation water in the Nile delta. Reduction in Nile flows and water allocated for agriculture would reduce the availability of this source in both quantity and quality. The current (2010) amounts extracted from shallow groundwater is about 6.20 Billion m3. Tables (6-8.a) and (6-8.b) show the estimated annual abstractions from shallow groundwater according to the developed trends under the drying and wetting Nile flow scenarios in 2025, 2050, 2075, and 2100.
- Agricultural Drainage Water Re-Use Agricultural drainage water of relatively good quality is used extensively in Egypt to satisfy about
20% of irrigation water demands. Unfortunately, reductions in the Nile flows will significantly reduce this important source. The projected estimates of annual re-use of agricultural drainage water show gradual decreasing trends until 2100 according to the developed water budgets under the drying Nile flows scenario as shown in tables (6-8.a). While under the wetting scenario, the estimated annual agricultural drainage water re-use up to year 2100 are estimated to remain similar to the current rate of 2010. However; under both scenarios, it is essential to follow strict and efficient environmental regulations to safeguard all uses and water quality of all water bodies (irrigation canals, drains, lakes, and groundwater)
- Treated Waste Water The amounts of treated waste water are increasing with the growing municipal water production and
the scarcity of water resources, especially under the drying Nile flows scenario. The projected estimates of the annual amounts of treated waste water according to the developed trends under the drying and wetting Nile flows scenario in 2025, 2050, 2075 and 2100 are given in tables (6-8.a) and (6-8.b) respectively. These amounts are used in formulating the water strategy as one of the important adaptation measures. Again, strict and efficient environmental regulations are needed as well to safeguard all uses and water quality of all water bodies.
- Sea Water Agriculture Using sea water for agriculture is becoming a reality and would provide an effective tool for future
food security. New cereal crops with high nutrition value like Quinoa and Amaranth which are drought and salinity tolerant need to be introduced and encouraged to be used at large scale in Egypt. The need for spreading and up scaling growing such crops is essential all over the world to secure food supply against water scarcity situations. The dependence and publicity of these crops is still not commercial, but it is promising and is expected to spread on the long-term. Tables (6-8.a) and (6-8.b) show the equivalent or virtual amounts of the assumed sea water amounts in the water budget that can be used for agriculture. These are rough estimates, but give an indication for the size of this measure.
Joint Programme for Climate Change Risk Management in Egypt
Proposed CLIMATE CHANGE ADAPTATION STRATEGY for the Ministry of Water Resources & Irrigation EGYPT (2013)
Filename;\MhmdNour\CC Final Submitted 12-Feb2103 AdptStrtgy .docx page 70
- Regional Cooperation and Coordination Changes in supply due to climate change will occur alongside the certainty of demographic trends
and potential abstractions by upstream riparian countries which means that Egypt already faces massive water management challenges.
There is a need for strengthening the dialog and cooperation among the Nile Basin states to address both technical issues such as sharing of data, as well as more political and sensitive ones such as water allocation. Over the long term a co-operative mechanism to resolve water usage issues is important to reduce the risks of uncertainty and surprise. A co-operative regime might also engender exploration of linked adaptations across the boundaries of the riparian countries whereby water allocation is linked to trade in water intensive commodities such as hydroelectricity and food products.
The regional cooperation has to consider bilateral one; to build capacities, and also invest in agricultural development outside Egyptian borders. At basin wide cooperation, e.g. the Eastern Nile, the cooperation should consider basin wide planning and development as well as water management and hydropower production.
- Agricultural Expansion Outside Borders To meet the targeted food production, the future strategy for agricultural development would
consider expansion outside borders where abundance of water and land are available. However, this should be done under sustainable manner that guarantees mutual benefits for the Egyptian and the other parties without harming natural resources. This should create a faire model rather than the existing land grabbing situation that should be avoided because of its adverse impacts. A priority should be given to expansion in the Nile basin and African neighboring countries having abundance of water resources, and may include investment in regional infrastructures (e.g. roads and railways).
- Soft interventions: Awareness Rising, Research & Development and Capacity Building
Awareness rising, research and development tied with capacity building in relation to climate change is a vital element to effective adaptation strategy. It is closely intertwined with Egypt’s development choices and pathways. Research is needed to adapt with increased demographic pressures (the national population is growing at a rate of about 2%) as well as the potential increases in Nile water abstractions by the upstream riparian countries. Living with water scarcity and implementation of water demand management strategies requires capacity building and awareness rising across institutions and society. Research is needed also to improve early warning and forecasting, climate change modeling, rainfall-harvesting techniques, sustainable extraction of ground water, water recycling, desalination, and improving water efficiencies, salt and drought tolerant crop varieties, sea water agriculture, solar energy applications, modern irrigation techniques, agro-industries, long-term forecasting to cope with prolonged drought,… etc.
7.2-b Specific Adaptation Measures for the Coastal Zones and the Northern Lakes Most of the required adaptation measures for formulating the adaptation strategy are revealed from the review of the NSACC-2011, NSC-2010, El-Raey (2009), El-Shinnawy (2011), Stratus (2012), and Blanken (2012), as well as discussions and meetings with the officials of SPA and CoRI which enabled defining the following major adaptation categories:
- Construction of necessary protection works - Rehabilitation, enforcement and enhancement of existing Protection works - Enhancement of naturally protected areas - Regular maintenance of break water & sand nourishment - Monitoring & Evaluation & research - Reduce threats of sea water intrusion - Soft interventions

Joint Programme for Climate Change Risk Management in Egypt
Proposed CLIMATE CHANGE ADAPTATION STRATEGY for the Ministry of Water Resources & Irrigation EGYPT (2013)
Filename;\MhmdNour\CC Final Submitted 12-Feb2103 AdptStrtgy .docx page 71
It is understood that SPA is consulting CoRI and other international firms to evaluate the effectiveness of the recently implemented protection works in order to define and optimize the types of required protection works. The following paragraphs highlight some specific adaptation measures. However, most of them are under studies and research to decide on type and size of protection which is going to be based on extensive studies.
a. Enhancing Mohamed Ali sea wall to protect the low-lying areas in Abu-Qir Bay. This requires enforcement of a portion of about 3 to 5 kilometers.
b. Provide further protection for the international road in the portion extending along the North side of El-Burullus Lake as well as protecting and creating wetlands and/or fish farms in the low-lying strip that is located between this road and the shore line. This strip is about 30 to 40 kilometers.
c. Define and install appropriate protection works for the low-lying area of EL-Malaha East of Port Said (Shark El-Tafreaah) which is under high risk of flooding. Studies indicated that a sea wall of about 3 kilometers can be the most effective intervention to protect this area.
d. Strengthening and raising the banks of AL-Salam canal in the reach between Damietta and Port Said for a length of about 14 kilometers.
e. Completing the protection works in Alexandria shore line by installing submerged rocky hills or another appropriate intervention(s) for a length of about 15 kilometers.
f. Completing protection works at the Eastern port of Alexandria near the Courts’ complex.
g. Install about 10 km of detached break water north of Gmasa to protect the industrial area.
h. Regular maintenance of break waters and sand nourishment at different locations along the coastline.
i. Enhancement of the Nile banks and sea walls East and West of Rashid, and the Eastern bank of Damietta outlet to the sea.
j. Protect Beaches and break waters at Baltim and Port Said beaches
7.3 Classification of the Adaptation Measures under Climate Change Induced Risks The high sensitivity of the water sector to climate change and its critical importance to public health and livelihoods in Egypt justify classifying the above mentioned adaptation measures under climate–induced risks and their associated consequences. The following paragraphs highlight the four key climate-induced risks and their consequences in Egypt:
R1. Droughts and water scarcity, with the following consequences: R1.a Reduced Water supply R1.b Conflicts among competing users & sectors on scarce resources R1.c Increased pollution in streams R1.d Cross cutting issues with the Health, Agriculture, Energy and Transportation Sectors
R2. Higher water consumption (due to increased temperature), with the following consequences: R2.a Decreased water availability for agriculture R2.b Decreased water availability for the municipal sector R2.c Decreased water availability for the industrial sector
R3. Increased risk of floods, with the following consequences: R3.a Inundation or submergence of low-lying lands R3.b Erosion in main Nile & canals R3.c More Frequent and higher intensity of flash floods
R4. Sea Level Rise, with the following consequences: R4.a Inundation of the low-lying regions of the Nile Delta R4.b Sea Water Intrusion to groundwater aquifers in the Nile Delta R4.c Damage of the natural system and communities in the Northern Lakes

Joint Programme for Climate Change Risk Management in Egypt
Proposed CLIMATE CHANGE ADAPTATION STRATEGY for the Ministry of Water Resources & Irrigation EGYPT (2013)
Filename;\MhmdNour\CC Final Submitted 12-Feb2103 AdptStrtgy .docx page 72
Each of these associated consequences needs adaptation options or measures that to be integrated and harmonized with the national goals for economic development, food security and poverty reduction.
These measures have to be taken into account at different scales, both in space and in time. Regarding the spatial component, measures should account for local issues as well as regional and basin-wide issues. Regarding the time component, distinctions should be made between the strategic, tactical and operational levels. The setting of time horizons should be considered when defining a strategy, policy, or measure, and also for monitoring the implementation of an adaptation strategy.
Generally, strategies would be of long-term nature, and policies are targeted at the medium to long term. Measures may have an implementation time of any length, but are expected to have sustained results. Prioritization – mostly of measures, but in some cases also of (alternative) policies – should take the whole period into account. The Table below presents this climate induced risks with their consequences and corresponding proposed adaptation measures which are classified according to the following criteria:
• Category (or type): whether the adaptation measure is technical (T); like changing operating rules or cropping patterns, or managerial (M); like institutional, legal actions & awareness rising, or infrastructural (I).
• Scale (or size): whether the adaptation measure would be implemented at a regional zone level (R) , national sector level (N), or local community; i.e. rural & urban areas (L).
• Adaptive Capacity: Adaptive capacity is the ability to design and implement effective adaptation strategies or to react to negative climate impacts. The capacity to adjust and readjust as climate conditions change and as new climate change knowledge emerges is more important than any responsive efforts to a particular climate risk. Therefore, there is a need to place climate change and its impacts into the mainstream of economic policies, development projects, and international aid efforts On the basis of national capabilities for implementation in terms of resources, technological knowledge and experience; whether the required capacity for coping to climate hazards is low (L), moderate (M) or high (H).
• Technical Feasibility: based on effectiveness to reduce the expected impacts under prevailing conditions and testing. This is ranked as low (L), moderate (M) or high (H).
• Potential Economic Cost for budgeting: prior to any precise costing, an indicative value of low (L), moderate (M) or high (H) is given for each measure.
• Duration or Time span: whether the required implementation period is short-term or Operational (S), medium-term or Tactical (M), or long-term or Strategic (L).
• Response: whether this measure is proactive (P) or reactive (R); and
• No Regret & Low-Regret options should be considered as a priority. No-regret options (N) are measures or activities that will prove worthwhile even if no (further) climate change occurs. For example, early-warning systems for floods and other extreme weather events will be beneficial even if the frequency of the events does not increase as expected. Low-regret options (L) are low-cost options that can potentially bring large benefits under climate change and will have only low costs if climate change does not happen. One example is accounting for climate change at the design stage for new drainage systems, through making pipes wider.
• Success Chances: this takes into account an evaluation of the above mentioned ranks to exclude certain measure or to consider it and give high or low priority. It is ranked as expected success (S), Probable success (P), or (F) if it is going to fail and will be excluded.
The following Table (7-2) shows an initial classification; based on personal views of the author, and may need revision under full participation from all relevant stakeholders to achieve complete and efficient measures, policies strategies. However, this classification enabled defining priorities of the proposed adaptation strategy, as well as excluding some of them.

Joint Programme for Climate Change Risk Management in Egypt
Proposed CLIMATE CHANGE ADAPTATION STRATEGY for the Ministry of Water Resources & Irrigation EGYPT (2013)
Filename;\MhmdNour\CC Final Submitted 12-Feb2103 AdptStrtgy .docx page 73
Table (7-2) Classification of the adaptation measures
Risks and Consequences Adaptation Measures
Cat
egor
y Sc
ale
Ada
ptiv
e C
apac
ity
Fea
sibi
lity
Pote
ntia
l C
ost
Tim
e Sp
an
Res
pons
e
Reg
ret
Succ
ess C
hanc
e
R1.Droughts and water scarcity R1.a Reduced Water supply -Development of deep groundwater I L H H H M P N S
-Increased Agricultural Drainage water re-use I N H H M S P L P -Construct & encourage Desalination plants I L M H H S P N S -Resolve conflicts with Nile Basin countries M R L H M L R N P -Increase regional-level rainfall harvesting T R L L L L R N P - Research &applications on Demand Management M L L M L M P N S -Local use of Treated Waste Water I L H H H M P N S -Enhance research to develop new resources T R M M M L P N P -Enhance research on saline & sea water usage I L M L M M P N S -Reduce evaporation losses from Lake Nasser I L M M H M P N S -Reduce water disposal to the Mediterranean T N H L L S R L P -Optimize operating rules of the HAD M N H M L S R L S -Regional cooperation & enhance prediction tools M R M M L S P N S
R1.b Conflicts among competing users & sectors on scarce resources -Distribute water on Volumetric Basis I N L M H M P N S
-Activate Role & Laws of Water User Associations M N M H L M P N S -Issue new Rules and standards for Water Rights M N M M L M P N S -Efficient Awareness programs M N M M L L P N S
R1.c Increased pollution in streams -Strict Environmental Regulation M N M M L S P N S -Effective Monitoring & treatment systems T N M H H M P N S -Efficient Awareness programs (same as above) M N M M L L P N S -Active role of Communities and participation M N M H L M P N S
R1.d Cross cutting issues i. Public health deterioration -Related to Health sector ii. Soil salinity & land use changes -Related to Agricultural sector iii. Less hydropower generation -Related to Energy Sector iv. Less inland navigation activities -Related to Transportation Sector

Joint Programme for Climate Change Risk Management in Egypt
Proposed CLIMATE CHANGE ADAPTATION STRATEGY for the Ministry of Water Resources & Irrigation EGYPT (2013)
Filename;\MhmdNour\CC Final Submitted 12-Feb2103 AdptStrtgy .docx page 74
Table (7-2 . … cont) Classification of the adaptation measures
Risks and Consequences Adaptation Measures
Cat
egor
y Sc
ale
Ada
ptiv
e Fe
asib
ility
Po
tent
ial
Cos
t Ti
me
Span
R
espo
nse
Reg
ret
Succ
ess C
hanc
e
R2. Increased Floods R2.a Inundation of low-lying lands -Protection works in exposed areas (banks, …) I L H H M S R L S -Enhance Toshka spillway I L H H M M P N S -Adjust HAD operating rules M N H M L S R L S -Enhance early warning and prediction tools T R H H L M P N S -Building capacity to deal with flood risk T R M M L M P N S -Monitoring & Evaluation programs T N M H L L P N S
R2.b Erosion in main Nile & canals -Protect exposed reaches of water streams I L H H M M R L S
R2.c More Frequent and high intensity of flash floods
-Construct protection works in exposed areas & to recharge groundwater from flashfloods I L M M M M R L P
-Improve forecasting systems T R M H L S P N P -Building capacity to make use of flash floods M N H H L S P N S
Table (7-2 . … cont) Classification of the adaptation measures
Risks and Consequences Adaptation Measures
Cat
egor
y Sc
ale
Ada
ptiv
e C
apac
ity
Feas
ibili
ty
Pote
ntia
l C
ost
Tim
e Sp
an
Res
pons
e R
egre
t Su
cces
s Cha
nce
R3. Higher water consumption R3.a Decreased water availability for
agriculture -Investment in efficient irrigation equipment (piped mesqas-marwas,& trickle irrigation….) I N H H H M P N P
-Develop & Apply volumetric water quota system I N M M H L P N P -Enhance role of water user associations M R M M L M P N S -Strict rules on high water consumption crops M N L M L M P N P -Reduce irrigated areas & seasons M N L L L S R R F -Reduce Water Duty for irrigated lands M N M M L S P N S -Generalize controlled drainage in rice areas I R M H M L P N P -Efficient water quality protection programs M N M H M S P N P -Wide Use of drought and salt tolerant crops M R H M L L P N S -Create incentives to conserve irrigation water M N L M L L P N P -Activate fair & social water tariff system M N M H L S P N P -Efficient Awareness programs (same as above) M N M M L L P N P
R3.bDecreased water availability for the municipal sector
-Effective Awareness & educational programs among users to use conservative practices M N M M L L P N P
-Reduce leakage from public networks T L M H H L P N S -Develop tariffs leading to water conservation M N H H L S P N S -Install meters for all users I N H H M M P N S -Apply conservative water regulations M N M M L S p N P -Construct & encourage Desalination plants I L M H H S P N S
R3.c Decreased water availability for industrial sector Apply strict regulations for effluent quality M N H M L S P N S
Enhance water recycling & offer incentives T L M H M S P N P

Joint Programme for Climate Change Risk Management in Egypt
Proposed CLIMATE CHANGE ADAPTATION STRATEGY for the Ministry of Water Resources & Irrigation EGYPT (2013)
Filename;\MhmdNour\CC Final Submitted 12-Feb2103 AdptStrtgy .docx page 75
Table (7-2 … cont) Classification of the adaptation measures
Risks and Consequences Adaptation Measures
Cat
egor
y
Scal
e
Ada
ptiv
e C
apac
ity
Feas
ibili
ty
Pote
ntia
l C
ost
Tim
e Sp
an
Res
pons
e
Reg
ret
Succ
ess C
hanc
e
R4. Sea Level Rise
R4.a Inundation of low-lying lands - Conduct detailed studies on the effectiveness of the proposed measures T N M H L M P N S
-Creating wetlands in vulnerable low lying areas (e.g. Lake Manzala & Lake Burullus) I L M H L M P N S
-Periodic beach nourishment and groins T L H H H S R N S -Reinforcing natural protection by sand dunes I L H H M S P N S -Protection & enforcement existing protection works I L H H H M P N S - Construct breakwaters and/or sea walls I L M H H M P N S -Reinforcing the international road along the
Mediterranean coast, as second defense line I N H H M M P N S
- Using Al-Salam Canal banks as first protection line I N H H M M P N P -Apply the integrated coastal zone management plan M N M H M L P N S -Create additional rules for coastal development,
covering CC impact M N M H M L P N S
R4.b Sea Water Intrusion -Conduct more research to update effectiveness of the proposed measures M L H H L S P N S
-Increased rice areas on Northern regions T L H M L M P N S -Regulate pumping at coastal areas I L M M M M P N P - Excavate interceptor drains parallel to the coast I L M H H M P N P - Create hydrodynamic barrier by line of injection
wells parallel to the coast I L M M M M P N P -Extracting/injecting combination I L L M H M R L P
-Constructing impermeable subsurface barriers I L L M M M R L P
R4.c Damage to Northern Lakes and communities
-building dikes with wide banks (20 meters) and sufficient height 2.5 to 3.0 meters) to protect the lakes and store water inside lakes.
I L H H H M P N S
-more studies are needed to identify vulnerability and potential adaptations T N M H L M P N S
R4.d Coral reefs near the Red Sea shore line
-Reinforce natural protection to the rocky coral reefs adjacent to the Red Sea shore I L L M H M P L S

Joint Programme for Climate Change Risk Management in Egypt
Proposed CLIMATE CHANGE ADAPTATION STRATEGY for the Ministry of Water Resources & Irrigation EGYPT (2013)
Filename;\MhmdNour\CC Final Submitted 12-Feb2103 AdptStrtgy .docx page 76
7.4 The Proposed Adaptation Strategy Climate change adaptation strategy should be considered as a dynamic process that must be periodically evaluated and updated; while implementing, according to acquired knowledge regarding revealing uncertainties as well as advances in technology and sciences regarding enforcing adaptive capacity. In addition to that, the implementation of the strategy may be as much important as formulating the strategy. The successful implementation does not mean only the appropriate methodology and policies and sufficient funds, but it also needs awareness, strong political will, institutional framework, information and capacity. Figure (7-2) illustrates the cycle or the dynamic nature of any adaptation strategy, and the following chapter will handle the mainstreaming of the proposed climate change adaptation strategy.
Figure (7-2) The Dynamic nature of climate change adaptation strategies source: WHO (2008) The proposed strategy is based on the above general and specific adaptation measures and policies that are classified in the previous section under the identified 4 major induced risks and their associated consequences. Some measures were excluded because of their low chance for success. The proposed plan is presented in Tables (7-3.a) to (7-3.d) is formulated to provide feasible, efficient and no-regret adaptation measures until 2100. Budget “trends” are included for the main items of the proposed plans until 2050, under three-5 year plans (2015 to 2030), and two-10 year plans (2030 to 2050). These were based on preliminary cost estimates according to the current costs (of 2012), without consideration for inflation or changes in monetary value. We think that it does not make sense to project budget trends beyond 2050 because of uncertainty of both impacts and costs. The given budget trends are useful for better visualizing the required efforts, size of measures, and budgets of adaptation which would reflect the corresponding losses if no actions are taken. It also helps in raising awareness for risks of climate change and brings the attention of the community and decision makers towards the necessity of the soft interventions. More efforts are required to project better estimates for the required budget while updating this strategy. The following Table (7-4) presents a summary for the estimated budget of the proposed adaptation strategy that covers the 4 defined risks. The total estimated budget for the adaptation strategy is 181 billion LE over 35 years (between 2015 and 2050).
Information needs
Impact assessment
Vulnerability assessment
Financial arrangements
Evaluate
Policy, legal and institutional framework
Understand the vulnerability
Development of measures
Information needs
Impact assessment
Vulnerability assessment
Financial arrangements
Evaluate
Policy, legal and institutional framework
Understand the vulnerability
Development of measures
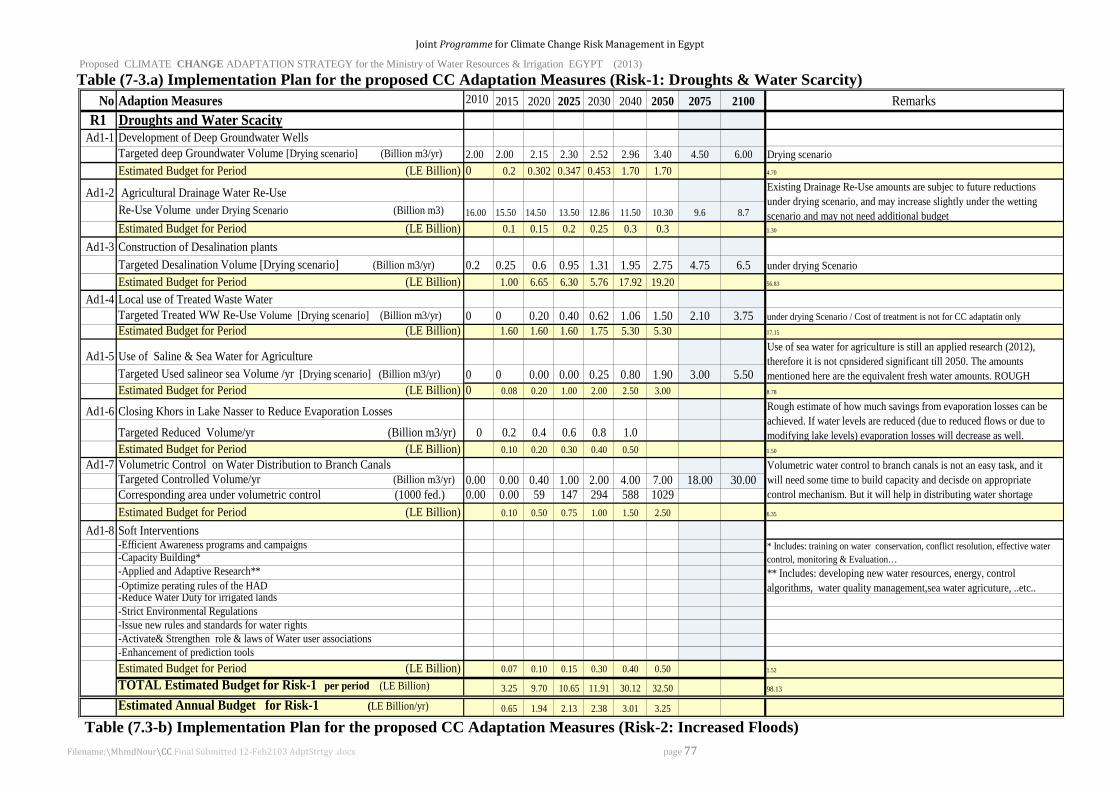
Joint Programme for Climate Change Risk Management in Egypt
Proposed CLIMATE CHANGE ADAPTATION STRATEGY for the Ministry of Water Resources & Irrigation EGYPT (2013)
Filename;\MhmdNour\CC Final Submitted 12-Feb2103 AdptStrtgy .docx page 77
Table (7-3.a) Implementation Plan for the proposed CC Adaptation Measures (Risk-1: Droughts & Water Scarcity)
Table (7.3-b) Implementation Plan for the proposed CC Adaptation Measures (Risk-2: Increased Floods)
No Adaption Measures 2010 2015 2020 2025 2030 2040 2050 2075 2100 Remarks R1 Droughts and Water Scacity
Ad1-1 Development of Deep Groundwater WellsTargeted deep Groundwater Volume [Drying scenario] (Billion m3/yr) 2.00 2.00 2.15 2.30 2.52 2.96 3.40 4.50 6.00 Drying scenarioEstimated Budget for Period (LE Billion) 0 0.2 0.302 0.347 0.453 1.70 1.70 4.70
Ad1-2 Agricultural Drainage Water Re-UseRe-Use Volume under Drying Scenario (Billion m3) 16.00 15.50 14.50 13.50 12.86 11.50 10.30 9.6 8.7Estimated Budget for Period (LE Billion) 0.1 0.15 0.2 0.25 0.3 0.3 1.30
Ad1-3 Construction of Desalination plantsTargeted Desalination Volume [Drying scenario] (Billion m3/yr) 0.2 0.25 0.6 0.95 1.31 1.95 2.75 4.75 6.5 under drying ScenarioEstimated Budget for Period (LE Billion) 1.00 6.65 6.30 5.76 17.92 19.20 56.83
Ad1-4 Local use of Treated Waste WaterTargeted Treated WW Re-Use Volume [Drying scenario] (Billion m3/yr) 0 0 0.20 0.40 0.62 1.06 1.50 2.10 3.75 under drying Scenario / Cost of treatment is not for CC adaptatin onlyEstimated Budget for Period (LE Billion) 1.60 1.60 1.60 1.75 5.30 5.30 17.15
Ad1-5 Use of Saline & Sea Water for AgricultureTargeted Used salineor sea Volume /yr [Drying scenario] (Billion m3/yr) 0 0 0.00 0.00 0.25 0.80 1.90 3.00 5.50Estimated Budget for Period (LE Billion) 0 0.08 0.20 1.00 2.00 2.50 3.00 8.78
Ad1-6 Closing Khors in Lake Nasser to Reduce Evaporation Losses
Targeted Reduced Volume/yr (Billion m3/yr) 0 0.2 0.4 0.6 0.8 1.0Estimated Budget for Period (LE Billion) 0.10 0.20 0.30 0.40 0.50 1.50
Ad1-7 Volumetric Control on Water Distribution to Branch CanalsTargeted Controlled Volume/yr (Billion m3/yr) 0.00 0.00 0.40 1.00 2.00 4.00 7.00 18.00 30.00Corresponding area under volumetric control (1000 fed.) 0.00 0.00 59 147 294 588 1029Estimated Budget for Period (LE Billion) 0.10 0.50 0.75 1.00 1.50 2.50 6.35
Ad1-8 Soft Interventions-Efficient Awareness programs and campaigns -Capacity Building*-Applied and Adaptive Research**-Optimize perating rules of the HAD-Reduce Water Duty for irrigated lands-Strict Environmental Regulations-Issue new rules and standards for water rights -Activate& Strengthen role & laws of Water user associations-Enhancement of prediction toolsEstimated Budget for Period (LE Billion) 0.07 0.10 0.15 0.30 0.40 0.50 1.52
TOTAL Estimated Budget for Risk-1 per period (LE Billion) 3.25 9.70 10.65 11.91 30.12 32.50 98.13
Estimated Annual Budget for Risk-1 (LE Billion/yr) 0.65 1.94 2.13 2.38 3.01 3.25
Existing Drainage Re-Use amounts are subjec to future reductions under drying scenario, and may increase slightly under the wetting scenario and may not need additional budget
Use of sea water for agriculture is still an applied research (2012), therefore it is not cpnsidered significant till 2050. The amounts mentioned here are the equivalent fresh water amounts. ROUGH
Rough estimate of how much savings from evaporation losses can be achieved. If water levels are reduced (due to reduced flows or due to modifying lake levels) evaporation losses will decrease as well.
Volumetric water control to branch canals is not an easy task, and it will need some time to build capacity and decisde on appropriate control mechanism. But it will help in distributing water shortage
* Includes: training on water conservation, conflict resolution, effective water control, monitoring & Evaluation…** Includes: developing new water resources, energy, control algorithms, water quality management,sea water agricuture, ..etc..
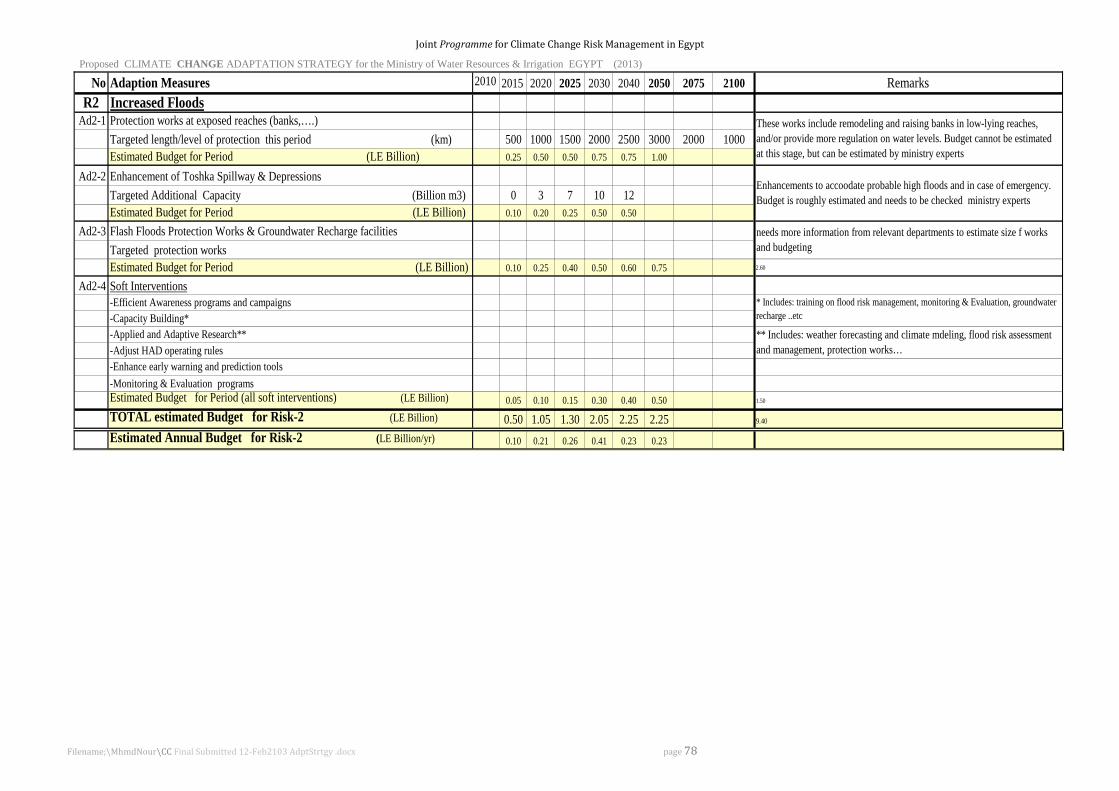
Joint Programme for Climate Change Risk Management in Egypt
Proposed CLIMATE CHANGE ADAPTATION STRATEGY for the Ministry of Water Resources & Irrigation EGYPT (2013)
Filename;\MhmdNour\CC Final Submitted 12-Feb2103 AdptStrtgy .docx page 78
No Adaption Measures 2010 2015 2020 2025 2030 2040 2050 2075 2100 Remarks R2 Increased Floods
Ad2-1 Protection works at exposed reaches (banks,….)Targeted length/level of protection this period (km) 500 1000 1500 2000 2500 3000 2000 1000Estimated Budget for Period (LE Billion) 0.25 0.50 0.50 0.75 0.75 1.00
Ad2-2 Enhancement of Toshka Spillway & DepressionsTargeted Additional Capacity (Billion m3) 0 3 7 10 12Estimated Budget for Period (LE Billion) 0.10 0.20 0.25 0.50 0.50
Ad2-3 Flash Floods Protection Works & Groundwater Recharge facilities Targeted protection works Estimated Budget for Period (LE Billion) 0.10 0.25 0.40 0.50 0.60 0.75 2.60
Ad2-4 Soft Interventions-Efficient Awareness programs and campaigns -Capacity Building*-Applied and Adaptive Research**-Adjust HAD operating rules-Enhance early warning and prediction tools-Monitoring & Evaluation programsEstimated Budget for Period (all soft interventions) (LE Billion) 0.05 0.10 0.15 0.30 0.40 0.50 1.50
TOTAL estimated Budget for Risk-2 (LE Billion) 0.50 1.05 1.30 2.05 2.25 2.25 9.40
Estimated Annual Budget for Risk-2 (LE Billion/yr) 0.10 0.21 0.26 0.41 0.23 0.23
These works include remodeling and raising banks in low-lying reaches, and/or provide more regulation on water levels. Budget cannot be estimated at this stage, but can be estimated by ministry experts
needs more information from relevant departments to estimate size f works and budgeting
Enhancements to accoodate probable high floods and in case of emergency. Budget is roughly estimated and needs to be checked ministry experts
* Includes: training on flood risk management, monitoring & Evaluation, groundwater recharge ..etc
** Includes: weather forecasting and climate mdeling, flood risk assessment and management, protection works…

Joint Programme for Climate Change Risk Management in Egypt
Proposed CLIMATE CHANGE ADAPTATION STRATEGY for the Ministry of Water Resources & Irrigation EGYPT (2013)
Filename;\MhmdNour\CC Final Submitted 12-Feb2103 AdptStrtgy .docx page 79
Table (7-3.c) Implementation Plan for the proposed CC Adaptation Measures (Risk-3: Higher Water Consumption)
No Adaption Measures 2010 2015 2020 2025 2030 2040 2050 2075 2100 Remarks R3 Higher Water Consumption
Ad3-1 Install modern irrigation systems at reasonable locations in old landsTargeted area with piped systems (million fed) 0.05 0.10 0.25 0.50 0.90 1.50 2.20 3.00Estimated Budget for Period (LE Billion) 0.30 0.90 1.50 2.40 3.60 4.20 12.60
Ad3-2 Install low presure pipe systems (mesqa & marwa) in old landsTargeted area with piped systems (million fed) 0.10 0.25 0.50 0.75 1.10 1.45 1.90 2.40Estimated Budget for Period (LE Billion) 0.00 1.50 2.50 2.50 3.50 3.50 13.50
Ad3-3 Generalize installation of Controlled Drainage in Rice areasTarget area coverage (million fed) 0.1 0.25 0.40 0.70 1.10 1.50 1.75Costs of Controlled drainaeg/fed (LE/feddan) 3500 3500 3500 3500 3500 3500Estimated Budget for Period (LE Billion) 0.18 0.53 0.53 1.05 1.40 1.40 4.90
Ad3-4 Volumetric Control on Water Distribution to Branch Canals same as Ad1-7
Ad3-5 Enhancing and fixing water supply distributin networks (LE Billion)0.2 0.5 0.75 1 1.25 1.5
Ad3-6 Soft Interventions-Efficient Awareness programs and campaigns `-Capacity Building*-Applied and Adaptive Research**-Enhance role and supporting laws for water user associations-Wide Use of drought and salt tolerant crops -Efficient water quality protection programs-Create incentives to conserve irrigation water -Activate fair & social water tariff system-Rreduce or eliminate high water consumption crops-Reduce Water Duty for irrigated lands-Enhancement of prediction toolsEstimated Budget (all soft interventions) (LE million) 0.07 0.10 0.15 0.30 0.40 0.50 1.52
TOTAL estimated Budget for Risk-3 (LE million) 0.75 3.53 5.43 7.25 10.15 11.10 38.20
* Includes: training on water conservation, conflict resolution, effective water control, monitoring & Evaluation…** Includes: developing new water resources, energy, control algorithms, water quality management, etc..

Joint Programme for Climate Change Risk Management in Egypt
Proposed CLIMATE CHANGE ADAPTATION STRATEGY for the Ministry of Water Resources & Irrigation EGYPT (2013)
Filename;\MhmdNour\CC Final Submitted 12-Feb2103 AdptStrtgy .docx page 80
Table (7-3.d) Implementation Plan for the proposed CC Adaptation Measures (Risk-4: Sea Level Rise)
No Adaption Measures 2010 2015 2020 2025 2030 2040 2050 2075 2100 Remarks
R4 Sea Level RiseAd4-1 Construct Necessary Protection works
- Sea Wall protecting EL-Malaha [East Port Said] (about 3km sea wall)- Sea walls or breakwater along Alexandria coast (about 15 km)- Protection works for Baltim and Port Said Shore Lines- Submerged detached break water north Gmasa to protect industrial area-Protect area West of Raas El-Bar & Borg Al-Burullus, East Port Said & AlArish- Protect beaches of Matrouh (e.g. Agiba, Al-Obaied , Lido, Romil & Celiopatra)- Protect Coastal roads in South Sinai and Suez on the Red SeaEstimated Budget for Period (LE Billion) 0.75 1.00 1.75 2.00 2.50 2.75 10.75
Ad4-2 Rehabilitation and Enforcement of Existing Protection works - Enhancing Mohamed Ali sea wall for about 4 km- Complete protection of Alexandria Eastern Port near the court's complexEstimated Budget for Period (LE Billion) 0.25 0.50 0.75 1.50
Ad4-3 Enhancement of naturally protected areas - Enhancement of the Nile banks and sea walls East & West of Rossetta outlet - Enhancement of Nile banks and sea walls of Damtietta outlet - Protect North of El-Burullus lake & utilize the low-lying strip (@40 km)- Raising banks of AL-Salam canal for (14 km between Damietta & Port Said) - Complete protection works in the area between Raas EL-Bar & Demietta- Stabilize and strengthen sand dunes at North-Middle delta - Reinforce the rocky coral reefs adjacent to the Red Sea shoreEstimated Budget for Period (LE Billion) 0.25 0.50 1.00 1.50 1.75 2.00 7.00
Ad4-4 Regular Maintenance of break water & Sand Nourishment- Construct rock hills at Rossetta coast and sand nourishment- Sand Nourishment and maintainance for groins in Alxandria beachesEstimated Budget for Period (LE Billion) 0.25 0.50 0.75 0.75 2.25
Ad4-5 Monitoring & Evaluation & Rresearch- Regular monitoring of the coast line and sea levelmonitor A39- Evaluating the effectiveness of current protection works- propose appropriate protection worksEstimated Budget for Period (LE Billion) 0.20 0.40 0.40 0.60 0.80 0.80 3.20
Ad4-6 Reduce threats of Sea Water Intrusion - More research & monitoring programs to define appropriate measures- Allow more rice areas at Northern regions- Regulate pumping at coastal areas- Implement several pilot projects to test different measures- Define plans and effective methods in dealing with sea water intrusion- Implemntation of succesful mesauresEstimated Budget for Period (LE Billion) 0.25 0.50 1.00 1.50 1.75 2.00 7.00
Ad4-7 Soft Interventions Activating the National Coastal Zone Management CommitteeApply the integrated coastal zone management planCreate additional rules for coastal development, covering CC impact Land use plans to Redirect growth away towards less vulnerable areas More research to identify vulnerability and potential adaptationsEstimated Budget (all soft interventions) (LE million) 0.15 0.25 0.50 0.75 1.00 1.00 3.65TOTAL estimated Budget for Risk-4 (LE million) 2.10 3.65 6.15 7.10 7.80 8.55 35.35

Joint Programme for Climate Change Risk Management in Egypt
Proposed CLIMATE CHANGE ADAPTATION STRATEGY for the Ministry of Water Resources & Irrigation EGYPT (2013)
Filename;\MhmdNour\CC Final Submitted 12-Feb2103 AdptStrtgy .docx page 81
Tables (7-4) Summary of the Estimated Climate Change Adaptation Budget No Adaption Measures 2010 2015 2020 2025 2030 2040 2050 Total: 2050 2075 2100
R1 Droughts and Water ScacityAd1-1 Development of Deep Groundwater Wells 0.20 0.30 0.35 0.45 1.70 1.70 4.70
Ad1-2 Agricultural Drainage Water Re-Use 0.10 0.15 0.20 0.25 0.30 0.30 1.30Ad1-3 Construction of Desalination plants 1.00 6.65 6.30 5.76 17.92 19.20 56.83Ad1-4 Local use of Treated Waste Water 1.60 1.60 1.60 1.75 5.30 5.30 17.15Ad1-5 Use of Saline & Sea Water for Agriculture 0.08 0.20 1.00 2.00 2.50 3.00 8.78Ad1-6 Closing Khors in Lake Nasser to Reduce Evaporation Losses 0.10 0.20 0.30 0.40 0.50 1.50Ad1-7 Volumetric Control on Water Distribution to Branch Canals 0.10 0.50 0.75 1.00 1.50 2.50 6.35Ad1-8 Soft Interventions 0.07 0.10 0.15 0.30 0.40 0.50 1.52
TOTAL Estimated Budget for Risk-1 per period (LE Billion) 3.25 9.70 10.65 11.91 30.12 32.50 98.13
Estimated Annual Budget for Risk-1 (LE Billion/yr) 0.65 1.94 2.13 2.38 3.01 3.25
R2 Increased FloodsAd2-1 Protection works at exposed reaches (banks,….) 0.25 0.50 0.50 0.75 0.75 1.00 3.75Ad2-2 Enhancement of Toshka Spillway & Depressions 0.10 0.20 0.25 0.50 0.50 0 1.55Ad2-3 Flash Floods Protection Works & Groundwater Recharge facilities 0.10 0.25 0.40 0.50 0.60 0.75 2.60Ad2-4 Soft Interventions 0.05 0.10 0.15 0.30 0.40 0.50 1.50
TOTAL Estimated Budget for Risk-2 per period (LE Billion) 0.50 1.05 1.30 2.05 2.25 2.25 9.40Estimated Annual Budget for Risk-2 (LE Billion/yr) 0.10 0.21 0.26 0.41 0.23 0.23
R3 Higher Water ConsumptionAd3-1 Install modern irrigation systems at reasonable locations in old lands 0.30 0.90 1.50 2.40 3.60 4.20 12.90
Ad3-2 Install low presure pipe systems (mesqa & marwa) in old lands 0.00 1.50 2.50 2.50 3.50 3.5 13.50Ad3-3 Generalize installation of Controlled Drainage in Rice areas 0.18 0.53 0.53 1.05 1.40 1.40 5.08Ad3-4 Volumetric Control on Water Distribution to Branch Canals same as Ad1-7Ad3-5 Enhancing and fixing water supply distributin networks (LE Billion) 0.2 0.5 0.75 1 1.25 1.5 5.20Ad3-6 Soft Interventions 0.07 0.10 0.15 0.30 0.40 0.50 1.52
TOTAL Estimated Budget for Risk-3 per period (LE Billion) 0.75 3.53 5.43 7.25 10.15 11.10 38.20Estimated Annual Budget for Risk-3 (LE Billion/yr) 0.15 0.71 1.09 1.45 1.02 1.11
R4 Sea Level RiseAd4-1 Construct Necessary Protection works 0.75 1.00 1.75 2.00 2.50 2.75 10.75Ad4-2 Rehabilitation and Enforcement of Existing Protection works 0.25 0.50 0.75 0.00 0.00 0.00 1.50Ad4-3 Enhancement of naturally protected areas 0.25 0.50 1.00 1.50 1.75 2.00 7.00Ad4-4 Regular Maintenance of break water & Sand Nourishment 0.25 0.50 0.75 0.75 0.00 0.00 2.25Ad4-5 Monitoring & Evaluation & Rresearch 0.20 0.40 0.40 0.60 0.80 0.80 3.20Ad4-6 Reduce threats of Sea Water Intrusion 0.25 0.50 1.00 1.50 1.75 2.00 7.00Ad4-7 Soft Interventions 0.15 0.25 0.50 0.75 1.00 1.00 3.65
TOTAL Estimated Budget for Risk-4 per period (LE Billion) 2.10 3.65 6.15 7.10 7.80 8.55 35.35Estimated Annual Budget for Risk-4 (LE Billion/yr) 0.42 0.73 1.23 1.42 0.78 0.86
6.60 17.93 23.52 28.31 50.32 54.40 181.08Estimated Annual Budget for the 4 Risks (LE Billion/yr) 1.32 3.59 4.70 5.66 5.03 5.44
GRAND TOTAL Estimated Budget for All 4 Risks (LE Billion)

Joint Programme for Climate Change Risk Management in Egypt
Proposed CLIMATE CHA NGE ADAPTATION STRATEGY for the Ministry of Water Resources & Irrigation EGYPT (2013)
Filename;\MhmdNour\CC Final Submitted 12-Feb2103 AdptStrtgy .docx
The above Table (7-5) shows the estimated allocated budget required to cover each measure as well as that required for each risk. It also shows the estimated required annual budget for all risk and for each one as well. From these tables, it is clear that risk 1 has the highest allocated budget due to the desalination plants is the most expensive item (which comprises about 56.8 billion LE or 33% of the total budget until 2050). Second to desalination, is the adaptation measures relevant to agricultural water is estimated to be 38 billion LE (including modernizing water conveyance and application methods, using controlled drainage, an applying volumetric control as mentioned earlier. Figure (7-3) shows the distribution of the total estimated budget along the period 2015-2050, which has average annual expenses of about 5 billion LE per year over this entire period. The estimated budgets allocated for each adaptation measure as defined under the above mentioned 4 induced risks are presented in figures (7-4.a), while figure (7-4.b) shows its percentage.
Figure (7-3) the proposed Climate Change adaptation budget until 2050
Figure (7-4.a) the estimated allocated climate change adaptation budgets for the defined 4 risks It is to be emphasized here that these adaptation costs are not assigned for climate change adaptation only, these are going to cover all requirement s for sustainable development under the growing population pressure as well as increased demands from the upstream countries. Besides, some of these measures may not be fully needed on the long run upon updating the strategy according to the acquired knowledge regarding trustful signals that would confirm the actual trends of the changing climate.
0.0
10.0
20.0
30.0
40.0
50.0
60.0
2015 2020 2025 2030 2040 2050
Estimated Climate Change Adaptation Budget till 2050for the 4 Defined Rrisks (Billion LE)
R1
R4
R3
R4
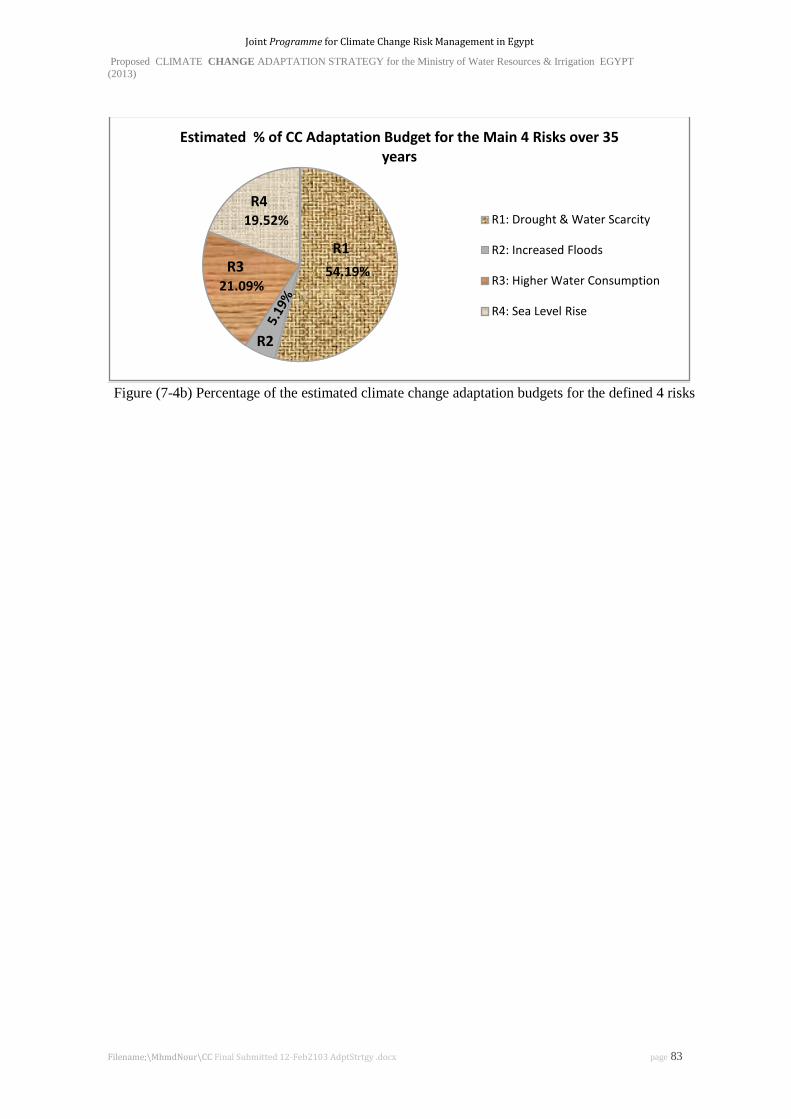
Joint Programme for Climate Change Risk Management in Egypt
Proposed CLIMATE CHANGE ADAPTATION STRATEGY for the Ministry of Water Resources & Irrigation EGYPT (2013)
Filename;\MhmdNour\CC Final Submitted 12-Feb2103 AdptStrtgy .docx page 83
Figure (7-4b) Percentage of the estimated climate change adaptation budgets for the defined 4 risks
54.19%21.09%
19.52%
Estimated % of CC Adaptation Budget for the Main 4 Risks over 35 years
R1: Drought & Water Scarcity
R2: Increased Floods
R3: Higher Water Consumption
R4: Sea Level Rise
R1R3
R4
R2

Joint Programme for Climate Change Risk Management in Egypt
Proposed CLIMATE CHANGE ADAPTATION STRATEGY for the Ministry of Water Resources & Irrigation EGYPT (2013)
Filename;\MhmdNour\CC Final Submitted 12-Feb2103 AdptStrtgy .docx page 84
P A R T THREE 8.0 Mainstreaming the Climate Change Adaptation Strategy Adaptation should not be understood as simply implementing the correct technology or practice. It should be part of a coherent, inter-sectoral strategy to ensure sustainable water resources. Integrated Water Resource Management (IWRM) could be an overall decision-making framework for climate change adaptation in water resources through mainstreaming climate adaptation into its plans. However, adaptation measures in water management are often under-represented in many national plans. Therefore, significant policy shifts are needed. These should be guided by mainstreaming adaptations within the broader development context, strengthening water governance, enhancing data collection and knowledge management on climate and adaptation measures, building long-term resilience through stronger institutions, and leveraging additional funds through both increased national budgetary allocations and innovative funding mechanisms. The existing institutional and organizational climate change framework in Egypt was reviewed; in section (3.5) of this report, where gaps were defined. Several publications have recently outlined practical tools and guidance for integrating climate change adaptation into development plans, e.g. UNFCCC (2008), OECD (2009), TearFund (2010), UNDP-UNEP (2011), and Abd ElGelil (2012). The following part contains guidelines on how to mainstream no-regret adaptation measures into IWRM plans (as given by the latter). This process can be applied in our Egyptian situation to foster the implementation of the proposed climate change adaptation strategy.
8.1 Guidelines for Mainstreaming Climate Change Adaptation in the Water Sector These guidelines started by reviewing the most updated literature on climate change adaptation plans and water resources management strategies within the South Mediterranean Countries (including Egypt) and revealed that the water-related legislations in the region are often inadequate, technically inappropriate and/or economically unaffordable, and they are not effectively enforced. Stakeholders’ involvement and participatory management approaches have been facing many constraints and challenges in the region due to lack of coordination amongst major water-related institutions. Several water institutions in the region are suffering from inadequate technical, institutional and legal capacities due to severe shortage of skilled Multi-discipline human resources. Another constraint has been the lack of data and information exchange that impedes the implementation of IWRM. Additional factors were indentified that constrain the development of water institutions include inadequate equipment, overlapping in the roles and responsibilities among different institutions, ambiguous mandates, poor governance, and underfunding. Abd ElGelil (2012) added that vulnerability and adaptation of water resources to climate change in the region was generally conducted as part of the preparation of the national communications to the UNFCCC. These reports provided qualitative and/or quantitative information on the impacts of climate change on their water resources. All the reports stated that they already experience severe water supply problems caused by a rapid increase in population, growing demands from agriculture and industry, expanding urbanization, unabated pollution of water bodies and the effects of climatic variability and extreme events.
Some of the adaptation options described in the national communications included introduction of water policy reforms focusing on water conservation, desalination, flood management, development of drought-tolerant crops, improvement of early warning systems, enhancement of erosion control, training and assisting farmers, integrated coastal zone management, and

Joint Programme for Climate Change Risk Management in Egypt
Proposed CLIMATE CHANGE ADAPTATION STRATEGY for the Ministry of Water Resources & Irrigation EGYPT (2013)
Filename;\MhmdNour\CC Final Submitted 12-Feb2103 AdptStrtgy .docx page 85
strengthening of environmental legislation. Additional adaptation measures include recycling water or upgrading water networks, reducing water pollution, changing cropping schedules to reduce demand for irrigation, improving of monitoring and forecasting systems and promoting awareness of climate change impacts. It is noticeable that large number of the reported adaptation measures is from the “non-regret” type such as management and dissemination of climate information, early warning systems, water conservation, water use efficiency, and modern irrigation systems. Countries also highlighted some barriers to implementation of adaptation strategies and measures. These included technological, financial and human resource constraints in addition to inadequate information, which are prevalent in most developing countries. Many countries emphasized their needs for adaptation research, particularly to address key vulnerable sectors, such as water resources management, including use of groundwater resources and development of drought-tolerant and disease-resistant crops. Many countries also reported on plans to incorporate or integrate climate change concerns and issues into their planning processes as a strategy for adaptation to climate change over the long term. Most of the South Mediterranean Countries have instituted multi-sectoral committees to coordinate climate change related activities at the national level. An inter-ministerial committee for climate change was often chosen as the forum to discuss, and as the means to coordinate, climate change policies and activities with those of development, in many cases, water institutions were represented in those committees. The committees were designed to institutionalize the exchange of information and coordination among key stakeholders. This new institutional arrangement started to play a leading role in integrating climate change issues into national public policy agendas. However, horizontal coordination between different players is still in the early stages. The process of mainstreaming adaptation measures into IWRM plans is illustrated in figure (8-1) under the following four major steps: STEP (1) Situational analysis aiming to assess the current national level institutional setup
STEP (2) Creating an enabling environment for mainstreaming adaptation in IWRM plans.
STEP (3) Planning and policy structure to secure integration of the climate change adaptation into the national public policy process.
STEP (4) Developing institutional structure to mainstream adaptation into IWRM.
8.1.a STEP 1: Situational Analysis of the Policy and Legislative Framework The overall national approach to dealing with climate change across sectors and the water sector policy itself provide the context and the platform from which actors make their implementation decisions. As a development challenge, climate change adaptation needs to be mainstreamed into the national governance structure and processes. This will require adjustments to the national governance framework (its structures, policy formulation processes, systems and procedures) to make it responsive to the new challenges of climate change. It is about putting in place a more flexible and forward-looking process whereby policies are formulated and investment decisions are taken bearing in mind the risks posed and opportunities offered by the changing climate. i- Institutional Analysis The first step to form a mainstreaming team and to secure mainstreaming of no-regret options is to conduct an institutional analysis in order to collect needed information on the current institutional structure (UNDP-UNEP, 2011). Institutional analysis may also provide a valuable tool for clarifying the roles and relationships between the key agencies, government and non-government, which have an interest in water management.
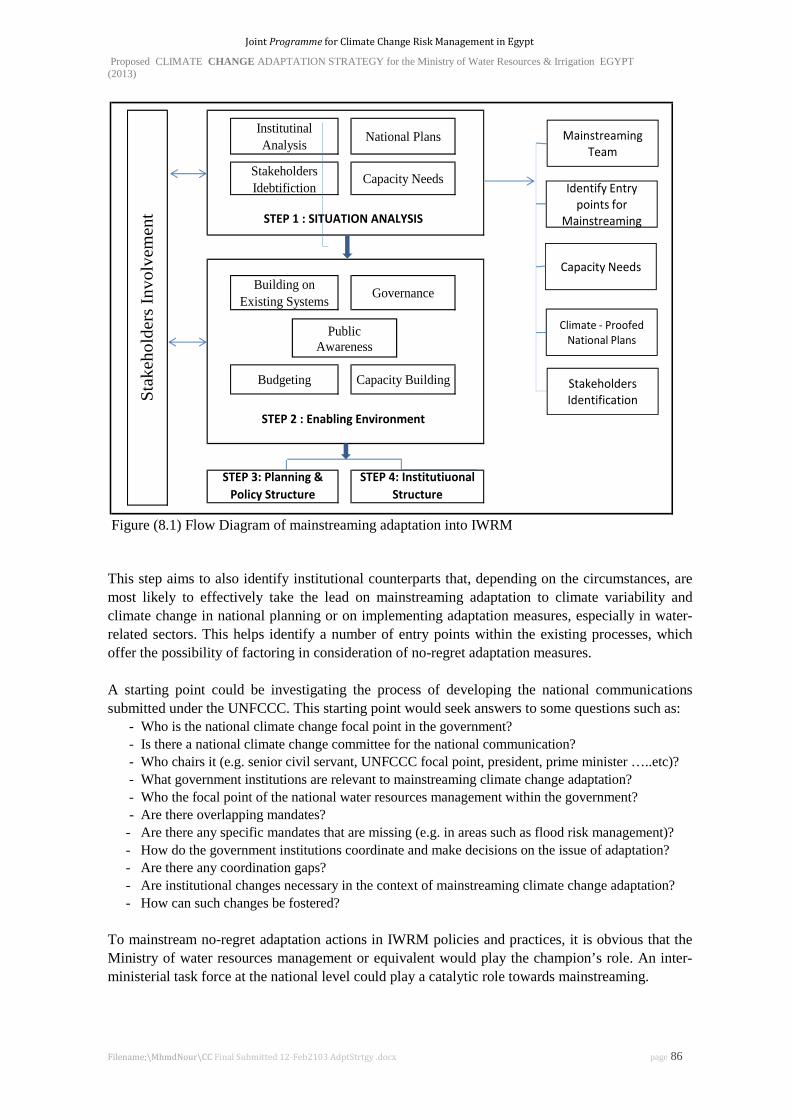
Joint Programme for Climate Change Risk Management in Egypt
Proposed CLIMATE CHANGE ADAPTATION STRATEGY for the Ministry of Water Resources & Irrigation EGYPT (2013)
Filename;\MhmdNour\CC Final Submitted 12-Feb2103 AdptStrtgy .docx page 86
Figure (8.1) Flow Diagram of mainstreaming adaptation into IWRM This step aims to also identify institutional counterparts that, depending on the circumstances, are most likely to effectively take the lead on mainstreaming adaptation to climate variability and climate change in national planning or on implementing adaptation measures, especially in water-related sectors. This helps identify a number of entry points within the existing processes, which offer the possibility of factoring in consideration of no-regret adaptation measures. A starting point could be investigating the process of developing the national communications submitted under the UNFCCC. This starting point would seek answers to some questions such as:
- Who is the national climate change focal point in the government? - Is there a national climate change committee for the national communication? - Who chairs it (e.g. senior civil servant, UNFCCC focal point, president, prime minister …..etc)? - What government institutions are relevant to mainstreaming climate change adaptation? - Who the focal point of the national water resources management within the government? - Are there overlapping mandates? - Are there any specific mandates that are missing (e.g. in areas such as flood risk management)? - How do the government institutions coordinate and make decisions on the issue of adaptation? - Are there any coordination gaps? - Are institutional changes necessary in the context of mainstreaming climate change adaptation? - How can such changes be fostered?
To mainstream no-regret adaptation actions in IWRM policies and practices, it is obvious that the Ministry of water resources management or equivalent would play the champion’s role. An inter-ministerial task force at the national level could play a catalytic role towards mainstreaming.
Institutinal Analysis National Plans
Stakeholders Idebtifiction
Capacity Needs
Building on Existing Systems Governance
Budgeting Capacity Building
Stak
ehol
ders
Invo
lvem
ent STEP 1 : SITUATION ANALYSIS
STEP 2 : Enabling Environment
STEP 3: Planning & Policy Structure
STEP 4: Institutiuonal Structure
Public Awareness
Mainstreaming Team
Identify Entry points for
Mainstreaming
Capacity Needs
Climate - Proofed National Plans
Stakeholders Identification
Joint Programme for Climate Change Risk Management in Egypt
Proposed CLIMATE CHANGE ADAPTATION STRATEGY for the Ministry of Water Resources & Irrigation EGYPT (2013)
Filename;\MhmdNour\CC Final Submitted 12-Feb2103 AdptStrtgy .docx page 87
ii- Review of national development plans to identify areas for coordination Adaptation measures, in general, should be systematically incorporated into the design and implementation of national development plans, poverty reduction strategies, rural development plans, and sectoral policies and strategies (water, agriculture, health, ..etc). Because adaptation to climate change risks is still in its early stage of development, it is no surprise that most of the national development plans, poverty reduction strategies, sectoral strategies and project documents in climate-sensitive sectors generally pay little or no attention to climate change. Even when climate change is mentioned, specific operational guidance on how to take it into account is generally lacking. Adaptation should not be viewed as a separate ‘sector’ with separate frameworks, tools and approaches. Currently, water resources’ planning is implicitly only tackling climate variability and operating on a response-led basis. There is also a need to support the development of legal and regulatory structures that support adaptive change. To secure mainstreaming of no-regret options, adaptation, at the macro-level, should be incorporated at several stages of the national policy making cycle. Climate change, especially in most vulnerable countries, should find its way to the top of the public policy agenda; a climate lens should be applied at the policy formulation stage to national visions, strategies and policies. The application of a climate lens to national policies and to planning and regulatory frameworks can allow the identification of particularly vulnerable geographical zones or sectors. In addition, a climate lens can be applied at the planning stage to bottom-up sectoral proposals, which would lead to better “climate-proofed” plans (OECD, 2009a). Mainstreaming adaptation in these early stages of national development policy formulation would facilitate and catalyze introducing no-regret adaptation practices in climate sensitive sectors. For the mainstreaming adaptation team, it is necessary to undertake a review of the existing national plans and water related sectors in order to find answers to some basic questions such as: - Is there a national climate change strategy in place? - Is there any reference to climate change adaptation needs in the national development plans, poverty
reduction strategies, rural development strategies, water management strategies,...etc? - What are the planning and programming mechanisms in place? What are the operating procedures of
the government institutions? - Do the mechanisms and procedures need to be strengthened? How? - What are the institutional needs in terms of technical capacities (e.g. monitoring expertise)? - What are the budget allocations of these institutions?
The answers of these questions would identify the existing gaps in different national strategies/plans that need to be bridged. The team should then focus on the water related sectors to identify whether no-regret practices are integrated in their strategies/plans/programs/ projects. For example, does the agriculture sector use modern irrigation techniques, and/or other practices that make it resilient to climate risks?, does the urban planning or tourism planning programs take into consideration flood control measures, which would be justified under all climate change scenarios?, is wastewater reused in public buildings, commercial buildings, etc?.
iii- Stakeholders identification and analysis Stakeholder analysis is a methodology used to facilitate institutional and policy reform processes by accounting for and often incorporating the needs of those who have a ‘stake’ or an interest in the reforms under consideration. Information on stakeholders, their interests and their capacity to influence outcomes will help to assure processes of change are politically realistic and sustainable (AMCOW, 2012).

Joint Programme for Climate Change Risk Management in Egypt
Proposed CLIMATE CHANGE ADAPTATION STRATEGY for the Ministry of Water Resources & Irrigation EGYPT (2013)
Filename;\MhmdNour\CC Final Submitted 12-Feb2103 AdptStrtgy .docx page 88
As stakeholders in the water sector act to manage water resources to achieve their own objectives, their actions have consequences on other sectors, for example agriculture, health and energy. Through its impacts upon water resources, climate change also affects related sectors. Due to the connections between sectors, stakeholders’ response to climate change impacts on the water sector will have consequences for development more generally, even if the response is that no action should be taken. The above table (1-1) in chapter 1 (Introduction) provides a clear indication of the interconnectivity between climate change, water and a wide range of different sectors. Developing an adaptation strategy in the water sector, without considering agriculture, health or energy sectors, for instance, is not really feasible or valid due to the relationship between them all. No-regret measures should be integrated in the plans/programs/projects of those sectors. It is essential to clearly identify major stakeholders, and have them engaged from the early beginning of the mainstreaming efforts. Crucial stakeholders to be involved include relevant water-related government bodies, ministries of finance, planning and development, members of parliament, to help the legislative and regulatory processes, and strengthening NGOs and civil society organizations concerned with IWRM. All of the actors given in Table (8-1) will have a role to play to facilitate the integration of adaptation at the national level. Ministries of Planning and Finance will be central to the mainstreaming of climate change adaptation into the policy planning process, as well as the management of public finances to support adaptation. An active engagement by members of parliament on adaptation policy debates will be essential to the drafting of an appropriate regulatory framework. Civil society organizations can play a vital role in strengthening public awareness on the need for adaptation and in bridging gaps between scientific research and policy making. Donor agencies can contribute by mainstreaming adaptation into their development co-operation programs (e.g. their country assistance strategies), by screening their funded operations for climate risks, by providing access to new adaptation technologies and by channeling new resources to help national governments absorb the additional costs of adaptation. iv- Capacity needs assessment The Situational analysis is also inevitable step to undertake capacity needs assessment of different government institutions and other relevant stakeholders. A SWOT analysis could be undertaken to identify weakness and strengths of the current enabling environment and gauge whether it is conducive to mainstreaming. The SWOT analysis would form the basis of using the strengths to improve or overcome the weaknesses. It is worth to note that adaptive capacity at the national level will increasingly affect whether and how communities are able to respond to climate risks. Adaptive capacity is the ability to design and implement effective adaptation strategies or to react to negative climate impacts. The capacity to adjust and readjust as climate conditions change and as new climate change knowledge emerges may be more important than any effort to respond to a particular climate risk. One useful tool to assess adaptive capacity of institutions is the National Adaptive Capacity (NAC) framework launched by the World Resources Institute (WRI) in 2008. The NAC framework provides a straightforward approach to assess how well national institutions are performing a core set of critical functions that underpin adaptation. These functions are introduced in Table (8-2).
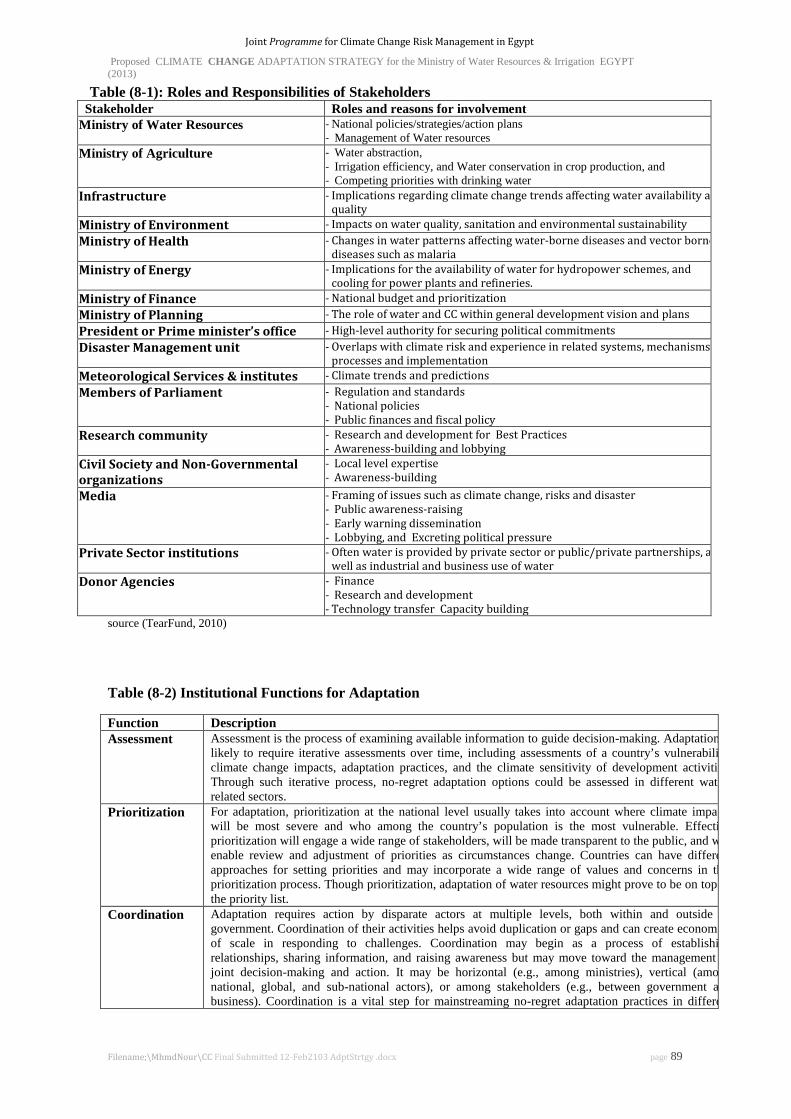
Joint Programme for Climate Change Risk Management in Egypt
Proposed CLIMATE CHANGE ADAPTATION STRATEGY for the Ministry of Water Resources & Irrigation EGYPT (2013)
Filename;\MhmdNour\CC Final Submitted 12-Feb2103 AdptStrtgy .docx page 89
Table (8-1): Roles and Responsibilities of Stakeholders Stakeholder Roles and reasons for involvement
Ministry of Water Resources - National policies/strategies/action plans - Management of Water resources
Ministry of Agriculture - Water abstraction, - Irrigation efficiency, and Water conservation in crop production, and - Competing priorities with drinking water
Infrastructure - Implications regarding climate change trends affecting water availability a quality
Ministry of Environment - Impacts on water quality, sanitation and environmental sustainability Ministry of Health - Changes in water patterns affecting water-borne diseases and vector borne
diseases such as malaria Ministry of Energy - Implications for the availability of water for hydropower schemes, and
cooling for power plants and refineries. Ministry of Finance - National budget and prioritization Ministry of Planning - The role of water and CC within general development vision and plans President or Prime minister’s office - High-level authority for securing political commitments Disaster Management unit - Overlaps with climate risk and experience in related systems, mechanisms,
processes and implementation Meteorological Services & institutes - Climate trends and predictions Members of Parliament - Regulation and standards
- National policies - Public finances and fiscal policy
Research community - Research and development for Best Practices - Awareness-building and lobbying
Civil Society and Non-Governmental organizations
- Local level expertise - Awareness-building
Media - Framing of issues such as climate change, risks and disaster - Public awareness-raising - Early warning dissemination - Lobbying, and Excreting political pressure
Private Sector institutions - Often water is provided by private sector or public/private partnerships, a well as industrial and business use of water
Donor Agencies - Finance - Research and development - Technology transfer Capacity building
source (TearFund, 2010) Table (8-2) Institutional Functions for Adaptation
Function Description Assessment Assessment is the process of examining available information to guide decision-making. Adaptation
likely to require iterative assessments over time, including assessments of a country’s vulnerabili climate change impacts, adaptation practices, and the climate sensitivity of development activiti Through such iterative process, no-regret adaptation options could be assessed in different watrelated sectors.
Prioritization For adaptation, prioritization at the national level usually takes into account where climate impa will be most severe and who among the country’s population is the most vulnerable. Effecti prioritization will engage a wide range of stakeholders, will be made transparent to the public, and w enable review and adjustment of priorities as circumstances change. Countries can have differe approaches for setting priorities and may incorporate a wide range of values and concerns in th prioritization process. Though prioritization, adaptation of water resources might prove to be on top the priority list.
Coordination Adaptation requires action by disparate actors at multiple levels, both within and outside government. Coordination of their activities helps avoid duplication or gaps and can create econom of scale in responding to challenges. Coordination may begin as a process of establishi relationships, sharing information, and raising awareness but may move toward the management joint decision-making and action. It may be horizontal (e.g., among ministries), vertical (amo national, global, and sub-national actors), or among stakeholders (e.g., between government a business). Coordination is a vital step for mainstreaming no-regret adaptation practices in differe

Joint Programme for Climate Change Risk Management in Egypt
Proposed CLIMATE CHANGE ADAPTATION STRATEGY for the Ministry of Water Resources & Irrigation EGYPT (2013)
Filename;\MhmdNour\CC Final Submitted 12-Feb2103 AdptStrtgy .docx page 90
source (WRI, 2012) Abd El-Gelil (2012) pointed out another aspect of capacity assessments is assessing the capacity of non-government stakeholders. This means appraising different adaptation options from their perspectives. In other words, the potential capacity of an actor is high if it would be rational from his perspective to take adaptation actions. Assessing the potential capacity generally refers to assessing the economic, financial, and skill resources available to an actor objectively. When a nongovernment stakeholder has a low capacity, it will not adapt on its own. The government must then consider either incentives to encourage adaptation in the form of providing resources through economic incentives or training, or they may consider options to regulate adaptation. Which type of options might be considered is determined by the relative costs of the option as shown on the following Table (8-3). Table (8-3) Examples for Policy Instruments for Adaptation
Regulatory Economic Information-based Risk of water shortage (including drought)
Restriction on water use Administrative allocation of water
Water pricing Water trading Abstraction taxes, charges Payments for ecosystem services (PES) Insurance schemes Microfinance schemes
Information and awareness campaigns to promote water saving
Risk of inadequate quality
Water quality standards Pollution discharge permits
Pollution taxes, charges Tradable pollution permits PES
Information and awareness campaigns Technical assistance for improved farming techniques
Risk of excess water (Including flood)
Land use planning/ zoning restrictions Building codes/ standards
Insurance schemes Public private partnerships (flood defense structures) PES Microfinance schemes
Flood risk mapping Early warning systems
source: (Dominican, 2012)
water related plans, programs, and projects. Information Management
Information management consists of collecting, analyzing, and disseminating information in supp of adaptive activities. Relevant information will vary across sectors, countries, and climate chan impacts but, at a minimum, typically covers climate variables, the status of natural and hum systems, and existing coping strategies. Providing or accessing existing information for conducti vulnerability assessments is critical for most adaptation activities. Good information management w ensure that information is useful and accessible to stakeholders. It may also involve general awarene raising or building the capacity of stakeholders to use information for adaptation. It is essential th this information is not retained for use solely at a central level and is accessible to poor and vulnerab communities.
Climate Risk Management
The four functions above assess aspects of adaptive capacity relevant to a broad range of clima related challenges in a country. However, most countries face specific climate risks that loom larg than others. The Climate Risk Management function provides an opportunity to examine institution aspects of the specific capacities needed to address such risks. Addressing climate risks requires process of identifying the specific risks to a given priority, evaluating the full range of options f addressing the risks, then selecting and implementing risk reduction measures. Countries typically treat risk management on a sector-by-sector or issue-specific basis. For examp many countries have highly climate-sensitive agriculture and water sectors and may focus adaptati investments on building capacity for managing climate risks in these sectors.
Joint Programme for Climate Change Risk Management in Egypt
Proposed CLIMATE CHANGE ADAPTATION STRATEGY for the Ministry of Water Resources & Irrigation EGYPT (2013)
Filename;\MhmdNour\CC Final Submitted 12-Feb2103 AdptStrtgy .docx page 91
8.1.b STEP 2: Creating Enabling Environment to mainstream Adaptation into IWRM plans & Policies
The next step following the situational analysis is making sure that an enabling environment conducive to mainstreaming adaptation is in place. This can be done through integrating climate change adaptation policies, establishing an effective governing structures, promoting dialogue and coordination between water-related sectors, utilizing existing practices and tools, integration within development budget, building capacity of the required institutional frameworks, and raising public awareness on climate change. i- Understanding Mainstreaming of Climate Change Adaptation as an Integrated Policy
Approach Efforts to formulate national adaptation policies or climate change strategies will need to be supported by a cross-cutting, integrated policy approach (UNDP-UNEP, 2011). It is evident that mainstreaming no-regret adaptation options into IWRM plans cannot be undertaken in isolation of the efforts needed to mainstream climate change considerations in development planning. It must be an integral part of the national efforts towards a climate resilient development.
ii- Establishment of transparent and effective governing structures Good governance that supports participation from inter-sectoral planning and links between institutions, and vulnerable groups, is the first step towards integrating climate risk assessment and management into development decision-making. Participation by different stakeholders and civil society allows vulnerable groups that might be affected by climate change to help steer the process towards more equitable outcomes. Another important aspect of good governance is the effective decentralization of water resources management that has the potential to tap into successful community-based experiences in dealing with climate variability, and hence positively support no-regret adaptation. Good decentralization requires a number of core elements including a guarantee of transfer of political power and adequate budget from the centre, a strong institutional framework, a solid legal and regulatory framework, and technical capacity in local government. (TearFund, 2008)
iii- Promotion of dialogue and coordination between water-related sectors Engagement of stakeholders means recognizing that each and every actor has a valid view and relevant information to contribute to a task. Multi-stakeholder processes are increasingly encouraged as they encourage better decision making by ensuring that the views of main actors are incorporated and that a consensus is reached. Facilitating multi-stakeholder processes requires willingness to participate on the part of the stakeholders. It also requires a sensitive and delicate process of facilitation.
iv- Building on existing practices, tools and systems Although adaptation must be a locally driven process, national policies and frameworks should support it. The primary objective of adaptation activities must be to build resilience and adaptive capacity in vulnerable local communities, which already need to adapt to climate change. Local approaches for adaptation could be further developed and built upon. The setting up of institutions, systems and planning should not become a goal in itself, it is the effects that they may; or may not, provide the basis for considering success. The emergence of climate change as an additional burden on development requires a pragmatic approach that makes use of existing mechanisms in support of sustainable development, such as national long-term development planning mechanisms. Such an approach should be expanded to incorporate the added tasks of integrating no-regret actions wherever possible (UNFCCC, 2008).

Joint Programme for Climate Change Risk Management in Egypt
Proposed CLIMATE CHANGE ADAPTATION STRATEGY for the Ministry of Water Resources & Irrigation EGYPT (2013)
Filename;\MhmdNour\CC Final Submitted 12-Feb2103 AdptStrtgy .docx page 92
It is important for the mainstreaming team to develop an understanding and awareness of who is working on adaptation to climate change at national and local levels, and what progress has been made. This would entail review adaptation activities at both levels. Key questions to consider are (TearFund, 2010):
- Are there any existing mechanisms for documenting best practice adaptation; including no-regret measures?
- Are there any existing policy measures in place for promoting adaptation? - Is there a national mechanism tasked with coordinating adaptation across sectors and ministries? - What adaptation measures are being promoted within national development plans? - What information exists on historic climate variability and change and how have been addressed? - Who is involved? - Have any lessons been learned or best practices been determined?
v- Integration within development budgets Assigning a budget for adaptation in general across different sectors of development; and especially water-related sectors, helps to ensure that they will be appropriately funded in the long term. In the case of adaptation, the economic argument should be communicated widely to policymakers and other stakeholders. No-regret options by definitions would bring numerous economic, social, and environmental benefits under all climate risks scenarios (TearFund, 2006). Financial resources for climate change will need to come from existing domestic finance and international sources which are becoming increasingly available as donors develop initiatives and funding mechanisms for adaptation. The UNDP-UNEP, 2011 highlighted the following opportunities for adaptation funds:
- The Strategic Priority on Adaptation (SPA), which is an ecosystem-focused fund ensuring that climate change concerns are incorporated in the management of ecosystems through GEF focal area projects. These GEF Projects focus on reducing vulnerability to climate change impacts. This Fund began in 2010 to finance concrete adaptation projects and programs in developing countries with a share from the proceeds of Clean Development Mechanism (CDM) and other sources.
- The Least Developed Countries Fund (LDCF) is operated by the GEF and provides support to least developed countries as they prepare national adaptation programs for action NAPAs.
- The Special Climate Change Fund (SCCF) is concerned primarily with activities, programs and measures in the development sectors most affected by climate change. The SCCF was established in 2001 to finance projects related to adaptation; technology transfer and capacity building; energy, transport, industry, agriculture, forestry and waste management; and economic diversification.
- Climate Investment Funds (CIF) to be managed by the World Bank includes the Clean Technology Fund and the Strategic Climate Fund, which will support various programs.
- Climate Mainstreaming-Related Funds, under the Strategic Climate Fund, the Pilot Program for Climate Resilience will focus on mainstreaming climate change into development planning and budgeting, through technical assistance and investment programs.
-The Spanish MDG Fund includes mainstreaming of climate adaptation into development plans. -The Global Climate Change Alliance (of the European Commission) will focus on integrating adaptation plans into poverty reduction and development strategies.
vi- Building capacity of the required institutional frameworks Capacity development of national, sectoral planners, and multi-stakeholder planning processes and establishment of mechanisms to promote national dialogue among relevant sectors is essential. - Government institutions need to build capacity on enhancing negotiations skills, mediation & conflict
resolution among relevant stakeholders. They also need to enhance their capacity on integrated planning, policy development, and analysis.

Joint Programme for Climate Change Risk Management in Egypt
Proposed CLIMATE CHANGE ADAPTATION STRATEGY for the Ministry of Water Resources & Irrigation EGYPT (2013)
Filename;\MhmdNour\CC Final Submitted 12-Feb2103 AdptStrtgy .docx page 93
- Academic and research institutions need to enhance capacity to deal with different aspects of climate change such as monitoring, climate data collection and management, systematic observation and modeling.
- Media people and organizations need to develop their capacity in education and awareness rising on the necessity of mainstreaming and multi-disciplinary approach to address climate change adaptation issues.
- Parliamentarians should enhance their capacity on institutional and legislative reforms necessary for mainstreaming climate change adaptation plans into sustainable development and IWRM plans.
vii- Raising Public awareness on climate change One challenge for mainstreaming climate change adaptation is the lack of awareness and knowledge among policy makers and other stakeholders about the risks posed by climate change. Climate change and its potential impacts should thus be brought into discussions on water resources management in order to raise awareness of the links between water and other related sectors. The adaptation mainstreaming team might then continue the effort to engage those stakeholders to ensure integrating no-regret adaptation practices in relevant sectors, and strengthening institutional capacities. This national dialogue should also include non-governmental actors (e.g. civil society, academia, business and industry, the general public and local communities). Awareness rising at the national level can include activities such as national media campaigns on climate impacts, internal government campaigns on the linkages between climate change, water and other sectors. Awareness on adaptation to climate risks should also be raised among a number of different local stakeholders, such as households, local organizations, opinion leaders and educators. This highlights the importance of targeted messaging and the use of appropriate communication tools (local radio, drama, flyers, posters, workshops, video, and so on). Awareness rising about climate change at the local level must be balanced and delivered through appropriate mechanisms. This means striking a balance between providing too little and too much information; either situation can end up disempowering people, as they may feel they do not have enough information to act or feel overwhelmed by too many details and options. This raises the question of how much information to convey, since climate change is a relatively complex issue, and how best to do so. (OECD, 2009a) 8.1.c STEP 3: Planning and Policy Structures Climate change risks and the need for adaptation to climate change should be clearly recognized and incorporated within national policies. It would hopefully lead to urge downstream levels of decision-making to systematically consider climate risks and needs for adaptation. As these policies provide the overall framework within which the lower levels operate, the inclusion of adaptation considerations within them can shape downstream priorities and help provide the framework to facilitate adaptation at the lower levels (sectoral and project levels). In addition, the inclusion of adaptation within these national policies could then influence the way the national budget is allocated by highlighting adaptation as a key element to be considered in investment decisions.
8.1.d STEP 4: Develop Institutional Structures Conducive to Mainstreaming Climate
Change into IWRM Abdel Gelil, 2012 referred the political weakness of the environmental agencies; which are assumed responsible to coordinate the climate change adaptation strategy at the national level, to several factors: including (a) comparatively recent establishment and restructuring; (b) power politics; (c) limited institutional mandate; (d) comparatively smaller roles as advisors or coordinators; (e) limited budgets; and (f) overlapping institutional jurisdictions. Thus, experience

Joint Programme for Climate Change Risk Management in Egypt
Proposed CLIMATE CHANGE ADAPTATION STRATEGY for the Ministry of Water Resources & Irrigation EGYPT (2013)
Filename;\MhmdNour\CC Final Submitted 12-Feb2103 AdptStrtgy .docx page 94
suggests that this arrangement leads to weak inter-sectoral co-ordination. He also commented on the other coordination through a powerful central body; such as the office of the President or Prime Minister which will involve the implementing ministries or agencies in reviewing their own legislation and results as part of the adaptation strategies. He added that, to mainstream no-regret options into IWRM plans and policies, the ministry of water resources, which is generally leading coordinating efforts on IWRM, could play a central role. A multi-stakeholder council/committee could be formed with representation from all the stakeholders identified in Table (8-1). This multi-stakeholder mechanism would benefit from the existing established processes of mainstreaming IWRM in national and sectoral plans. This third option for institutional setup is to use the existing governance structure of IWRM to ensure mainstreaming no-regret adaptation options. In some other countries, a national water resources authority was established to consolidate water resources management activities under one central agency.
8.1.e Mainstreaming climate change considerations into sectoral policies, plans, and
programs through strategic environmental assessment There is a need to identify the appropriate points at which to introduce climate change adaptation activities. The same is valid for finding the right entry points to mainstream no-regret adaptation options into IWRM plans. Potential entry points include land use planning, agriculture strategies, disaster response strategies and infrastructure design. Environmental impact assessments could be another entry point and a mechanism for mainstreaming climate change adaptation. However, guidelines for environmental impact assessments would need to be broadened to include climate change impacts. Current guidelines consider only the impact of a project or activity on the environment, not the impact of the environment on the project. It is also important to incorporate climate change considerations in planning mechanisms and to ensure that the responsibility for co-ordination lies with appropriate implementation agencies. Furthermore, attention should be given not only to EIA at the project level but also to Strategic Environmental Assessment (SEA) at the policy levels. SEA refers to “a range of analytical and participatory approaches that aim to integrate environmental considerations into policies plans and programs (PPPs) and evaluate the inter-linkages with economic and social considerations” (OECD, 2006). It is a process to estimate the environmental impacts of legislation, policies, plans and programs. SEA offers a structured approach to integrating environmental considerations into PPPs at different levels, including the sector level.
8.2 Mainstreaming Climate Change Adaptation into the Egyptian Water Sector From the foregoing review in section (3.5), it can be concluded that over the past few years, Egypt has made quite significant progress in establishing the institutional framework and in building national capacity in the field of climate change. At present, several organizations are extensively involved at the national level in climate change related activities. These include environmental and energy organizations, ministry of water resources and irrigation and ministry of agriculture, research centers, universities, governmental organizations and laboratories, and about 200 non-governmental organizations. These multi-layer climate change institutional arrangements can be employed to play a leading role in integrating climate change issues into the national development agendas However, one of the main characteristics of the climate research activities in Egypt is the fragmentation or non-coordination of objectives, efforts and information. Most of the studies done by several agencies are not coordinated and focus mainly on impact and risk assessments under different scenarios. Other studies or reports (including the National Communication ones) identified adaptation options and mentioned existing policies synergistic with adaptation. According to Hassanein (2011); Egypt does not have a national, integrated climate change monitoring and reporting system. What we
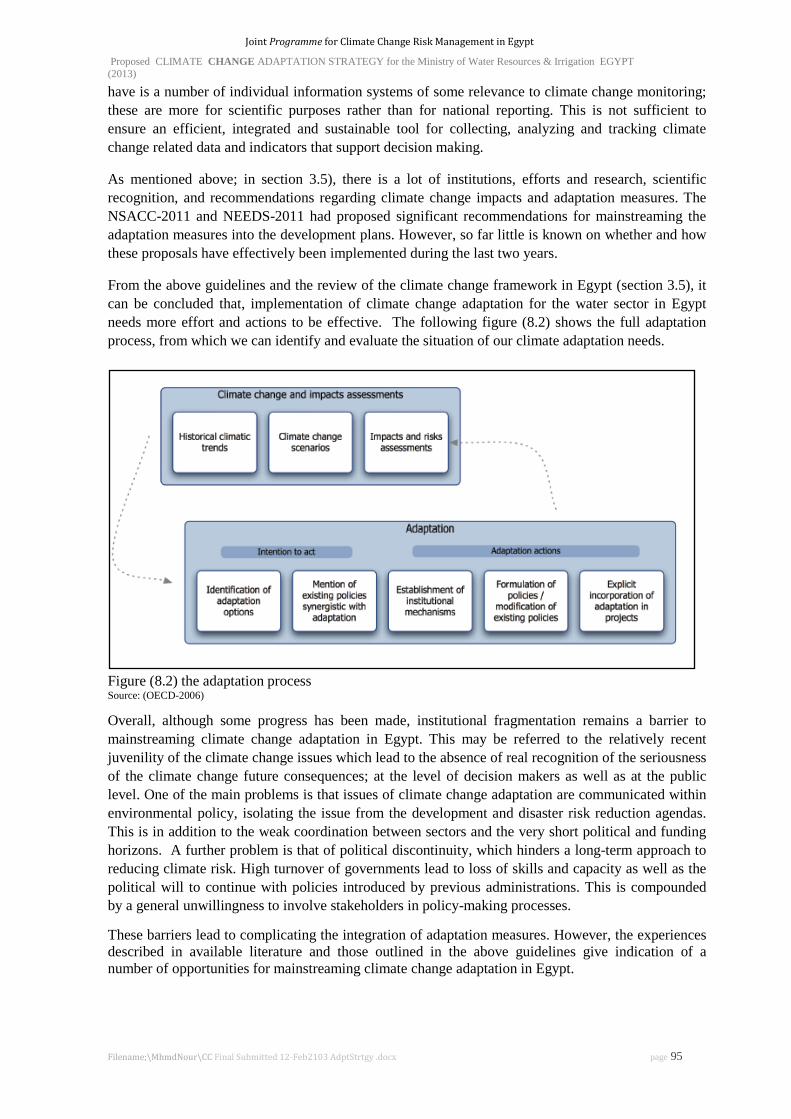
Joint Programme for Climate Change Risk Management in Egypt
Proposed CLIMATE CHANGE ADAPTATION STRATEGY for the Ministry of Water Resources & Irrigation EGYPT (2013)
Filename;\MhmdNour\CC Final Submitted 12-Feb2103 AdptStrtgy .docx page 95
have is a number of individual information systems of some relevance to climate change monitoring; these are more for scientific purposes rather than for national reporting. This is not sufficient to ensure an efficient, integrated and sustainable tool for collecting, analyzing and tracking climate change related data and indicators that support decision making. As mentioned above; in section 3.5), there is a lot of institutions, efforts and research, scientific recognition, and recommendations regarding climate change impacts and adaptation measures. The NSACC-2011 and NEEDS-2011 had proposed significant recommendations for mainstreaming the adaptation measures into the development plans. However, so far little is known on whether and how these proposals have effectively been implemented during the last two years. From the above guidelines and the review of the climate change framework in Egypt (section 3.5), it can be concluded that, implementation of climate change adaptation for the water sector in Egypt needs more effort and actions to be effective. The following figure (8.2) shows the full adaptation process, from which we can identify and evaluate the situation of our climate adaptation needs.
Figure (8.2) the adaptation process Source: (OECD-2006)
Overall, although some progress has been made, institutional fragmentation remains a barrier to mainstreaming climate change adaptation in Egypt. This may be referred to the relatively recent juvenility of the climate change issues which lead to the absence of real recognition of the seriousness of the climate change future consequences; at the level of decision makers as well as at the public level. One of the main problems is that issues of climate change adaptation are communicated within environmental policy, isolating the issue from the development and disaster risk reduction agendas. This is in addition to the weak coordination between sectors and the very short political and funding horizons. A further problem is that of political discontinuity, which hinders a long-term approach to reducing climate risk. High turnover of governments lead to loss of skills and capacity as well as the political will to continue with policies introduced by previous administrations. This is compounded by a general unwillingness to involve stakeholders in policy-making processes.
These barriers lead to complicating the integration of adaptation measures. However, the experiences described in available literature and those outlined in the above guidelines give indication of a number of opportunities for mainstreaming climate change adaptation in Egypt.

Joint Programme for Climate Change Risk Management in Egypt
Proposed CLIMATE CHANGE ADAPTATION STRATEGY for the Ministry of Water Resources & Irrigation EGYPT (2013)
Filename;\MhmdNour\CC Final Submitted 12-Feb2103 AdptStrtgy .docx page 96
Although the current report identified a more detailed strategy that would help developing and formulating policies, several important mainstreaming actions should be activated to start implementing these policies. These are summarized in establishment of institutional mechanisms and formulation of policies or modifying existing ones and explicitly incorporate adaptation in projects. Therefore; and in line with the NSACC-2011 and NEEDS recommendations, it is important and necessary to establish an effective, competent, and capable entity that can mainstream the adaptation measures into the integrated water resources management as well as the national development strategy. According to the above mentioned climate change adaptation guidelines, establishment of this entity requires legal, financial and institutional setup that can handle, monitor and evaluate the implementation process. Legal setup requires setting a law that include mainstreaming climate change adaptation as a mandatory assignment to all concerned authorities, so that it will be a coherent part of the cycle of all development projects. Financial resources are important also for that body to enable it fulfill its obligation efficiently. These could be mobilized either as a small percentage of each project or as a fixed budget within the national budget system. This entity may start as a central body that is linked to the office of the prime minister or the cabinet to acquire the capacity and power to deal and coordinate with all concerned ministries and bodies. Then, upon establishment and assigning mandates, resources, rules and authorities, and plans, it would expand over the whole country to cover all geographical and ministerial or sectoral aspects related to water resources management. The Ministry of Water Resources and Irrigation, as well as relevant ministries, would establish corresponding smaller units attached directly to the minister and/or the planning sector in order to have sufficient communications with all sectors and governorates. This unit will have a coordination and supervisory role. The coordination role will be coordinating activities with different concerned ministries and sectors in the ministry and making sure that climate change adaptation is mainstreamed into different projects cycle. The supervisory role will be monitoring climate change adaptation implementation activities and evaluation of different activities as it progress in its implementation. This unit will have the role of planning for climate change adaptation and in building capacity and raising awareness about climate change adaptation within different departments in the ministry and at all levels. This unit should plan a phased approach and make use of available personnel and resources to enable mainstreaming the adaptation strategy into the ministry’s plans.

Joint Programme for Climate Change Risk Management in Egypt
Proposed CLIMATE CHANGE ADAPTATION STRATEGY for the Ministry of Water Resources & Irrigation EGYPT (2013)
Filename;\MhmdNour\CC Final Submitted 12-Feb2103 AdptStrtgy .docx page 97
Bibliography Abdel Gelil, I., (2012); “Globalization of the environmental issues: response of the Arab region”, in M. Tortora, & ed, Sustainable systems and energy management at the regional level: Comparative approaches. Information Science Reference.
Abdel Gelil, I., (2012); “Guidelines for Mainstreaming Adaptation Options in IWRM Plans”, UNEP- UNFCCC-Wb-WRI, Sustainable Water Integrated Management (SWIM)-Support Mechanism. http://www.swim-sm.eu/files/Integration_of_CC_actions_in_IWRM_plans
Abou-Hadid, A. (2006); “Assessment of Impacts, Adaptation, and Vulnerability to Climate Change in North Africa: Food Production and Water Resources”, Project No. AF 90, Washington, District of Columbia: Assessments of Impacts and Adaptations to Climate Change (AIACC).
AbdRabo, M. (2011); “Water Track”, Available: [http://www.bibalex.org/cssp/Speakers/SpeakersDetails.aspx]
AbdRabo, M. (2011); “Socio-economic Valuation Study of Vulnerable Land to Sea Level Rise at the Nile Dedlat”, Climate Change Risk Management Peograme in Egypt
Abu-Zeid, M. and Biswas, A.K. (1991); “Some major implications of climatic fluctuations on water management”, International Journal of Water Resources Development, 7: 74-81.
Agrawala, S. et al. (2004); “Development and Climate Change in Egypt: Focus on Coastal resources and the Nile”, Environment Policy Committee, Working Party on Global and Structural Policies and Working Party on Development Co-operation and Environment, Organization for Economic Co-operation and Development (OECD).
Ahmed M. H. (2007); “Development Framework for Integrated Coastal Zone Management of the Nile Delta Using Information Technology’, Journal of Institute National des Sciences de la Mer et de l’Amenagement du Littoral, ISMAL, Algiers PELAGOS, ISSN 1112-7848, pp 45-59.
Allam, M. N. (2012); “Entiiby Agreement and the Ethiopian Dams – Facts and Consequences”, Publihsed by : Al-Ahram Center for Political and Strategic Studies (in Arabic)
Allen, R.G., Pereira, L.S., Raes, D. and Smith, M., (1998); “ Crop evapo-transpiration: Guidelines for computing crop water requirements”, FAO Irrigation and Drainage Paper No. 56. Food and Agriculture Organization of the United Nations, Rome.
Al-Taher, S.M., Medany, M.A., Abou-Hadid, A.F. (2009); “Possible adaptation measures of agriculture sector in the Nile Delta to climate change impacts”, Advances in Science and Research, Vol. 3,.
AMCOW. (2012); “Water Security and climate resilient development : strategic framework”, Abuja: AMCOW secretariat.
Amer, A, and Sherif, M.M. (1996); “An Integrated Study for Seawater Intrusion in the Nile Delta Aquifer”, working paper for SRP, NWRC-MPWWR, Cairo, Egypt.
Arnell, N.W. (1999a); “Climate change and global water resources”, Global Environmental Change, 9 (Supplement 1): S31-S49.
Arnell, N.W. (1999b); “A simple water balance model for the simulation of stream flow over a large geographic domain”, Journal of Hydrology, 217(3-4): 314-335.
Attia, B. (2009); “Assessing Existing Water Resources Policies”, prepared for UNESCO-Cairo Office under Climate Change risk management in Egypt IWRM and Forecasting component.
Bakheit, H.Y. (2011); “Millennium Dam: a report on the Ethiopian Millennium Dam, its impact on Sudan”, Ministry of Irrigation & Water Resources, Sudanow Magazine, Khartoum - Sudan
Bates, B.C., Z.W. Kundzewicz, S. Wu and J.P. Palutikof. (2008); “Climate Change and Water”, IPCC Technical Paper VI, Geneva: Intergovernmental Panel on Climate Change.
Beelay, A.A., et al. (20103); “SWOT analysis and challenges of Nile Basin Initiative: IWRM prespective”, Chinese Journal of Population, Resources and Environment – Vol. (8) – no. 1
Bergkamp G., O.B. and I.B. (2003); “Change, Adaptation of Water resources Management to Climate Change”, International Union for Conservation of nature &Natural Science, IUCN Publication Service unit.
Beyene, T., Lettenmaier, D. and Kabat, P. (2009); “Hydrologic impacts of climate change on the Nile River Basin: implications of the 2007 IPCC scenarios. Climatic Change”, 100(3): 433-461.
Joint Programme for Climate Change Risk Management in Egypt
Proposed CLIMATE CHANGE ADAPTATION STRATEGY for the Ministry of Water Resources & Irrigation EGYPT (2013)
Filename;\MhmdNour\CC Final Submitted 12-Feb2103 AdptStrtgy .docx page 98
Blanken, J. (2012); “Mainstreaming of MDGF Projects (FAO Component) and provision of tools for strategic decisions for the adaptation to Climate Change in the Egyptian agricultural sector”, Final mission report - UNJP/EGY/022/SPA, Climate Change Risk Management Program.
Blodget HW, Taylor P.T., Roark J.H. (1991); “Shoreline changes along the Rosetta–Nile Promontory”: monitoring with satellite observations. Mar Geol 99:pp.67–77.
Blöschl G, Montanari A., (2010); Climate change impacts throwing the dice, Hydrol. Process. 24, pp.374–381.
Blue Plan, (1988); “Futures of the Mediterranean Basin: Environment Development 2000-2025”, Sophia, Antipols. Cited in: Baric, A. and Gasparovic, F. 1992.
DHI (2011); “Literature Review – Climate Change and the river Nile”, DHI-UK, Met Office, MWRI, UNEP under project no. 11801270: Assessing the impacts of climate change on the water sector in the Nile Basin, March 2011
California Adaptation Planning Guide (APG), (2012); “Planning for Adaptive Communities, Defining Local and Regional Impacts, Understanding Regional Characteristics, and Identifying Adaptation Strategies”, prepared by California Emergency Management Agency, and California Natural Resources Agency
Cascao, A.E. (2013); “How the construction of large-scale dams is changing the hydropolitical relations in the Nile Basin”, SIWI, Available [www.slideshare.net/ana.cascao/hh6]
Cascao, A.E. (2011); “Nile-Hydropolitics in the Nile basin”, Lecture at Aalto University, Finland, 8-Nov2011, Available [www.slidshare.net/ana.cascao/]
Cascao, A.E. (2011); “Cooperation in the Nile basin: Potential, Obstacles and challenges”, DANIDA Development Days, Copenhagen, 3-May2011, Available [www.slidshare.net/ana.cascao Danida 2011/]
Conway, D. (1993); “The development of a grid-based hydrologic model of the Blue Nile and the sensitivity of Nile river discharge to climate change”, unpublished PhD thesis, University of East Anglia, UK.
Conway, D. and Hulme M, (1993); ”Recent fluctuations in precipitation and runoff over the Nile sub-basins and their impact on Main Nile discharge”, Climate Change, 25, pp. 127-151.
Conway, D. and Hulme M, (1996); ”The impacts of climate change variability and future climate change in the Nile Basin on water resources in Egypt”, water resources development, vol. 12, No 3.
Conway, D., Ktol M., Alcamo, J., and Hulme M, (1996); ”Future Availability of water in Egypt: the interaction of global, regional, and basin scale driving forces in the Nile basin”, Ambio, A journal of the human environment, the royal Swedish academy of science.
Conway, D. (2005); “From Headwater Tributaries to International River: Observing and Adapting to Climate Variability and Change in the Nile Basin”, Global Environmental Change, 15 (2): 99-114
Conway, D., C. M. and W. B. (2004); “Over one century of rainfall and temperature observations in Addis Ababa, Ethiopia”, International Journal of Climatology, 24:77-91.
Conway, D. (2005); “From Headwater Tributaries to International River: Observing and Adapting to Climate Variability and Change in the Nile Basin”, Global Environmental Change, 15: 99-114.
CoRI (2008); “Coastal vulnerability to climate changes and adaptation assessment for coastal zones of Egypt, Final Report”, Wikipedia, URL: http://en.wikipedia.org/ wiki/niledelta.
Cynthia R., Daniel H. (1998);. ”Climate Change and the Global Harvest - Potential Impacts of the Greenhouse Effect on Agriculture”, Oxford University Press.
Dahab, K. (1993); "Hydrogeological Evaluation of the Nile Delta After High Dam Construction", PhD. Thesis, Faculty.of Science, Menoufia Univ, Egypt.
Delft Hydraulics (1991); “Implications of relative SLR on the development of lower Nile Delta, Egypt”, Pilot study for a quantitative approach, Final report. CRI.
Delft Hydraulics, and Resource Analysis: (1992); Vulnerability Assessment to Accelerated to Accelerated Sea Level Rise, Case Study Egypt. Final Report October: 1992, Prepared for Commission of European Communities in cooperation with the Coastal Research Institute, Alexandria, Egypt.
Diab, M.Sh., Dahab, K., and El Fakharany, M. (1997), "Impacts of the paleo-hydrological conditions on the groundwater quality in the Northern part of Nile Delta", The geological society of Egypt, J. of Geol. 4112B, Cairo, pp.779-795.

Joint Programme for Climate Change Risk Management in Egypt
Proposed CLIMATE CHANGE ADAPTATION STRATEGY for the Ministry of Water Resources & Irrigation EGYPT (2013)
Filename;\MhmdNour\CC Final Submitted 12-Feb2103 AdptStrtgy .docx page 99
Dominican, K., (2012): “Adapting Water Policy for Climate Change Adaptation”, technical workshop on water and climate change impacts and adaptation strategies under the Nairobi work program. Mexico City: UNFCCC.
DRI (2010); “Vulnerability of the drainage system infrastructures to expected mean seal level rise (Ras El-Bar & Gamasa), Technical report, Drainage Research inst. National Water Research Center, MWRI – Egypt (June 2010).
EEAA (2004); Environmental Status Report for 2004
EEAA. 2009; Egypt State of the Environment Report 2008. Egypt Environmental Affairs Agency, Cairo, Egypt. Available: http://www.eeaa.gov.e.g./english/info/report_search.asp#soe. Eid, Helmy M., (1996); “Country Study of Egypt: Vulnerability and Adaptation to Climate Change in Egyptian Agriculture”, final report. Giza: soils and water research institute, Ministry of Agriculture.
Eid, Helmy M., (1997); “Support for the National Action Plan of Egypt: Assessment of Strategy and Policy Measures for Adaptation to Climate Change in Egyptian Agriculture”, Final Report. Giza: Soils, Water and Environment Research Institute (SWERI), Ministry of Agriculture, February 1997.
Eid, Helmy M., (2001); “Climate change studies on Egyptian Agriculture”, Soils, Water and Environment research institute (SWERI) ARC, Ministry of Agriculture, Giza, Egypt.
Eid, H.M., El Marsafawy, S.M., Ouda, S.A. (July 2006); “Assessing the economic impact of climate change on agriculture in Egypt: A Ricardian approach”, CEEPA Discussion paper No. 16. Special Series on Climate Change and Agriculture in Africa.
El-Quosy, Dia El Din., (1995): “Vulnerability Assessment of Water Resources in Egypt to Climate Change”, Climate research Vol. 6 No.2.
El-Raey, M. et al., (1994); “Vulnerability Assessment of the Coastal Zone of Egypt to the Impacts of Sea Level Rise. Phase II”, US Country Study Program.
El-Raey, M. et al, (1995); “Inventory and Mitigation Options, and Vulnerability and Adaptation Assessment”, Interim Report on Climate Change Country Studies.
El-Raey, M., Dewidar, K., El Hattab, M. (1999); “Adaptation to the impacts of sea level rise”, in Egypt. Climate Research. Vol. 12.
El-Raey, M; Frihy, O., Nasr, S.M., Dewidar, K.H. (1999); “Vulnerability assessment of sea level rise over Port Said Governorate, Egypt”, Environmental Monitoring and Assessment, 56 (2): 113-128; MAY 1999
El-Raey, M. (2009); Mapping Areas Affected by Sea-Level Rise Due to Climate Change in the Nile Delta Until 2100, in Hexagon Series on Human and Environmental Security and Peace (HESP), Brauch, H.G. ed., Free University of Berlin, UNU-EHS and AFES-PRESS.
El-Raey, M. (2010); “Impact and Implications of Climate Change for the Coastal Zones of Egypt. In: Michel, D., Pandya, A. (eds.) (2010), Coastal Zones and Climate Change.
El-Shaer, H. M. and others, (1997); “Impact of climate change on possible scenarios for Egyptian agriculture in the future. Mitigation and Adaptation Strategies for Global Change”, 1 (3), 233-250.
El-Shamy, M.E.A.M., 2006. “Improvement of the Hydrological Performance of Land Surface Parameterization: An Application to the Nile Basin”, PhD Thesis, Imperial College, University of London, London.
El-Shamy, M.E. (2008); “Assessing the Hydrological Performance of the Nile Forecast System in Long Term Simulation”, Nile Basin Scientific Magazine, 1: 22-36.
El-Shamy, M.E., Baligira, R., Abdel-Ghaffar, E. and Moges, S. (2009a); “Investigating The Climate Sensitivity Of Different Nile Sub-Basins”, Thirteenth International Water Technology Conference. ITWC 13, Hurghada, Egypt.
El-Shamy, M.E., Sayed, M. A.Aty. and Badwy, B. (2009b); “Impacts of climate change on Nile flows at Dongola using statistically downscaled GCM scenarios”, Nile Water Science & Engineering Magazine, 2(Special issue on Water & Climate): 1-14.
El-Shamy, M.E., Seierstad, I.A. and Sorteberg, A. ( 2009c); “Impacts of climate change on Blue Nile flows using bias-corrected GCM scenarios”, Hydrol. Earth Syst. Sci., 13(5): 551-565.
El-Sharkawy, H., Rashed, H., and Rashed, I. (2009); "Climate Change: the Impacts of Sea Level Rise on Egypt", 45th ISOCARP Congress.
El-Shemy, M. and G.M. (2011); “Climate Change Impacts on Water Quality indices of the southern Part of Aswan High Dam reservoir, Lake Nubia”, 15th Int. water technology conference, IWTC-15, Alexdandria-Egypt

Joint Programme for Climate Change Risk Management in Egypt
Proposed CLIMATE CHANGE ADAPTATION STRATEGY for the Ministry of Water Resources & Irrigation EGYPT (2013)
Filename;\MhmdNour\CC Final Submitted 12-Feb2103 AdptStrtgy .docx page 100
El-Shinnaway I.A., Abu Zed A.I., Ali M.A., Deabes E.A. Abdel-Gawad S. (2001); ”Vulnerability to Climate Changes and Adaptation Assessment for Coastal Zones of Egypt”, The 27th Water Treatment Technology Conference 12-19 May 2001, Abu Qir Fertilizer and Chemical Industry Company.
El-Shinnaway I.A., (2008); “Coastal Vulnerability to Climate Changes And Adaptation Assessment for Coastal Zones of Egypt”, Coastal Research Institute (CoRI), National Water Research Center (NWRC), MWRI, Egypt.
El-Shinnaway, (2011); “Confronting sea Level Rise on Egypt’s Nile Delta Coast”, IDRC-CRDI, Adaptation, [www.idrc.ca/ccaa] El-Tahir, E.A.B. (1996); “El Niño and the Natural Variability in the Flow of the Nile River”, Water Resources Research, 32(1): 131-137.
ENTRO reports-Nile Water planning (2009), “Transboundary Water Cooperation in Africa: The Case of the Nile basin Initiative”, UNDP report, Volume 10, issue 2.
EPA & California Department of Water Resources, (2011); “Climate Change Handbook for Regional Water planning”, [http://www.water.ca.gov/climatechange/CCHandbook.cfm]
Evans, T. (1990); “History of Nile Flows”, in: H.P. P. and A. J.A. (Editors), The Nile: Resource Evaluation, Resource Management, Hydro-politics and Legal Issues. SOAS-RGS, London, pp. 5-39
European Union, (2010); “Sustainable Water Integrated Management (SWIM)”, Retrieved 2012 from SWIM: [www.swim-sm.eu] FAO-ADAPT (2011); “Framework Programme on Climate Change Adaptation”
FAO (1992); “The use of saline waters for crop production: Chapter - Examples of use of saline waters for irrigation”, FAO Irrigation & Drainage paper No. 48 [ http://www.fao.org/docrep/T0667E/t0667e06.htm]
Frihy, O.E. (1992); “Beach Response To Sea Level Rise Along the Nile Delta Coast of Egypt”, in: P.L. Woodworth (Editor), Sea Level Changes: Determination and Effects Geophysical Monograph 69, American Geophysical Union, IUGG 2:81-85.
Grain (2012); “Squeezing Africa Dry: Behind Every Land- Grab is a Water Grab”, [http://www.grain.org/article/entries/4516-squeezing-africa-dry-behind-every-land-grab-is-a-water-grab
Gleick, P.H. (1998); ”Climate change, hydrology, and water resources”, reviews of Geophysics, 27, pp 329-344
Gleick, P.H. (1991); ”The vulnerability of runoff in the Nile Basin to climatic changes”, Environmental Professional, 13, pp. 66-73.
Goujin, A., et al., (2007); Population and Human Capital Growth in Egypt: Projection for governorates to 2051”, Int. Inst. For applied systems analysis- interim report IR-07-010 [www.iiasa.ac,at)
Hassanin, L. (2012); “Learning from Egypt's Environmental Monitoring and Reporting Systems”, Centre for Development Informatics (CDI), University of Manchester, UK With the support of the International Development Research Centre (IDRC), Available [http://www.niccd.org]
Hodges, C.N., et al. (2010) “Integrated Seawater Agriculture Systems (ISAS): A Source of Sustainable Biofuels”, 2nd International Symposium on Bio fuels March 31, 2010, Delhi, India Hulme, M. (1989); ”Recent and future precipitation changes over the Nile Basin”, In Proceedings of the International Seminar on Climatic Fluctuations and Water Management, 11-14 December 1989, Cairo, Egypt.
Hulme, M. (1994); “Global climate change and the Nile basin. In The Nile: Sharing a scarce resource, an historical and technical review of water management and of economical and legal issues”, Howell, P.P. and J.A. Allan, eds. Cambridge University Press. 408 pp.
Hulme, M., Doherty, R.M., Ngara, T., New, M.G., and D. Lister (2001); “African climate change”,1900-2100. Climate Research 17: 145-168.
Hulme, M., R. Doherty, T. Ngara and M. (2005); “Global Warming and African Climate Change”. Climate Change and Africa, P.S Low, Ed., Cambridge University Press, Cambridge, 29-40.
Kim, U.; Kaluarachchi, J. J.; Smakhtin, V. U. (2008); “Climate Change impacts on hydrology and water resources of the Upper Blue Nile River Basin, Ethiopia”, International Water Management Institute, Colombo, Sri Lanka 27p (IWMI Research Report 126)
INC-1999 : Initial National Communication on Climate Change, Egyptian Environmental Affairs Agency (EEAA-June, 1999), The Arab Republic of Egypt, Prepared for the United Nations Framework Convention on Climate Change (UNFCCC).
Joint Programme for Climate Change Risk Management in Egypt
Proposed CLIMATE CHANGE ADAPTATION STRATEGY for the Ministry of Water Resources & Irrigation EGYPT (2013)
Filename;\MhmdNour\CC Final Submitted 12-Feb2103 AdptStrtgy .docx page 101
IPCC, (1996a): Houghton, J. T., and others (eds); Climate Change 1995: The Science of Climate Change. Report of IPCC Working Group I. Cambridge, Cambridge University Press.
IPCC, (1996b): Watson, R. T., and others (eds); Climate Change 1995:Adaptations and Mitigation of Climate Change, Scientific-Technical Analyses of Impacts. Report of IPCC Working Group II. Cambridge, Cambridge University Press.
IPCC, (2001); Third Assessment Report of the Intergovernmental Panel on Climate Change, “3. Impacts, Adaptation, and Vulnerability”. Contribution of Working Group II; J.J. McCarthy, O.F. Canziani, N.A. Leary, D.J. Dokken and K.S. White, Eds., Cambridge University Press, Cambridge, 1032 pp. IPCC, (2007); Fourth Assessment Report of the Intergovernmental Panel on Climate Change, “4. Adaptation and mitigation options. Contribution of Working Groups I, II and III; Pachauri, R.K and Reisinger, A. (eds.). Kate Archdeacon (2012); “Seawater Agriculture: High-Tech And Low-Tech Paths”, [www.sustainablecitiesnet.com/research]
Landais, E. (2010); “Researchers explore ways to use sea water for farming. Retrieved November 23, 2010” , from gulfnews.com: http://gulfnews.com/news/gulf/uae/environment/researchers-explore-ways-to-use-sea-water-for-farming-1.711262
Leipprand, A., et al. (2007); “Impacts of climate change on water resources – adaptation strategies for Europe”, report No. UBA-FB, Potsdam-Institute of climate impact research
LNDFC (2005a.b); Flood mapping and damage mapping of the Egyptian Nile, Unpublished Report, Ministry of Water Resources and Irrigation, Nile Forecasting Center, Lake Nasser Flood and Drought Control Project (LNDFC/ICC)
LNFDC, (2008); “Nile Forecasting System (NFS) Project Final Report”, Vol. III, Planning Sector, Ministry of Water Resources and Irrigation, Giza, Egypt.
Luzi, S., (2008); ”Double-Edged Hydro-politics on The Nile - linkage between domestic water making and transboundary conflict and cooperation”, a PhD dissertation – ETH, Zurich.
Mason, S. (2004); “From Conflict to Cooperation in the Nile Basin”, PhD Dissertation, ETH- Zurich
Metwalli, N. (2010); “Climate Change Risk Management Program (CCRMP)-Egypt, Mid Term Review, UNDP/MDG, August-2010
MoALR, (2009), “Sustainable Agricultural Development Strategy towards 2030”, Ministry of Agriculture and Land Reclamation , Cairo - Egypt MWRI, (1997); “The Egyptian Water Strategy Till 2017’, Planning Sector - Ministry of Water Resources and Irrigation, Cairo, Egypt.
MWRI, (2010); “Water Resources Development and Management Strategy in Egypt – 2050”, in Arabic, Ministry of Water Resources and Irrigation, Cairo, Egypt.
NEEDS (2010); Egypt National Environmental, Economic and Development Study) for climate Change; Egyptian Environmental Affairs Agency / Climate Change Central Department (April, 2010). Under the United Nations Framework Convention on Climate Change on Climate Change (UNFCCC)
Nawaz, R., Bellerby, T.J., Sayed, M.A.A., and El-Sٍٍٍٍhamy, M.E. (2010); “Blue Nile Runoff Sensitivity to Climate Change”, The Open Hydrology Journal, 4.
Ngigi, S.N. et. al., (2009); ”Climate change adaptation strategies Water resources Management options for smallholder Farming Systems in Sub-Saharan Africa”, The Earth Institute At Columbia University and the nd The MDG Centre
Nicholls, R. J., et al. (2011); . "Sea-level rise and its possible impacts given a ‘beyond 4◦C world’ in the twenty-first century." Philosophical Transactions of the Royal Society A 369: 1-21
Nile Basin Initiative, (2006); “Baseline and Needs Assessment of National Water Policies of the Nile Basin Countries: A Regional Synthesis”, Water Resources Planning & Management Project, Water Policy Component, Addis Ababa, Ethiopia.
NSACC-2011; “Egypt’s National Strategy for Adaptation to Climate Change and Disaster Risk Reduction”, Egyptian Cabinet / Information and Decision Support Center / UNDP (December 2011)
NWRP-2005; “National Water Resources Plan, Facing the Challenge”, Ministry of Water Resources and Irrigation

Joint Programme for Climate Change Risk Management in Egypt
Proposed CLIMATE CHANGE ADAPTATION STRATEGY for the Ministry of Water Resources & Irrigation EGYPT (2013)
Filename;\MhmdNour\CC Final Submitted 12-Feb2103 AdptStrtgy .docx page 102
Integrated Water Resources Management Plan for 2017.
OECD (2012); “Recent OECD Work on Adaptation to Climate Chang”, Organization for Economic Co-Operation Development [www.oecd.org/env/cc/adaptation]
Parry, M., Arnell, N., and Dodman, D. (2009), "Assessing the Costs of Adaptation to Climate Change", Imperial College, London.
Paul D., David K., (2001); ”Africa and Global Climate Change”, CR-Special-8, Vol. 17, No 2, Inter-Research, Clim-Res
PCMDI website, (Program for Climate Model Diagnosis and Intercomparison), [http//www-pcmdi.llnl.gov/]
RIGW (2011); “Adaptation to the impact of sea level rise in the Nile Delta Coastal zone, Egypt”, 2nd progress report, Research Institute for groundwater, Ministry of Water Resources and Irrigation - Egypt
Saleh M., Strzepek K.M., Onyeji S.C., and Yates D. (1994); “An Assessment of Integrated Climate Change Impacts on Egypt”, Working Paper WP-94-48, IIASA, Austria
Sayed, M. A.Aty & Nour El-Din, M.M. (2001); ”Adaptation of water policy of Egypt to mitigate climate change impacts”, Proceedings of the Stockholm Water Symposium.
Sayed, M. A.Aty & Nour El-Din, M.M. (2002), "Adaptation of Water Policy in Egypt to Mitigate Climate Change Effects" ,Stockholm Water Symposium, Stockholm, 10-17 August,2002.
Sayed, M. A.Aty, (2003); "Lake Nasser Flood and Drought Control/Integration with Climate Change Uncertainty and Flooding Risks (LNFDC/ICC)" AMCOW conference, Adiss Ababa, 8-13 December, 2003.
Sayed, M. A.Aty & Nour El-Din, M.M. & Nasr, F.M. (2004); "Impacts of Global Warming on Precipitation Patterns on the Nile Basin" second regional conference on action plans for integrated development, Cairo, Egypt, April 12-15,2004.
Sayed, M. A.Aty, (2004); “Impacts of Climate Change on the Nile Flows”, PhD Thesis, Ain Shams University, Cairo-Egypt
Sayed, M. A.Aty & Nour El-Din, M.M. (2004); "Climate Change Variability and its Impacts on Sensitivity of the Nile Flows to Precipitation Changes" Ninth International Symposium on River Sedimentation (9th ISRS), Yichang China, October 18-21/2004.
Sayed, M. A.Aty, (2005); "Lake Nasser Management, Integration with Risks Posed by climate change", presented at World Water Week, Stockholm Water Symposium, Stockholm, 21-27 August 2005.
Sayed, M. A.Aty, (2008); “Eastern Nile Planning Model, Integration with IDEN Projects To Deal with Climate Change Uncertainty and Flooding Risk”, Nile Basin Capacity building network journal, August 2008
Seawater Foundation. (2010); Seawater Foundation, Retrieved November 23, 2010, from Seawater Foundation: [http://www.seawaterfoundation.org]
Sea Water in Agriculture (2012); “the future of sea water in OCEAN HEALTH”,
[http://oceanplasma.org/documents/obstaclese.html]
Selishi, B., et al. (2008), “A Review of Hydrology, Sediment and Water Resources Use in the Blue Nile Basin”, Working paper 131 - International Water Management Institute, IWMI
Sestini, G. (1993); “Implications of climatic changes for the Nile Delta. In Climatic Change in the Mediterranean”, ed. G. Sestini, 535-601.
Shahin M., (1985); “Hydrology of the Nile Basin”, Developments in Water Science No. 21, Elsevier, The Netherlands.
SNC-2010 : Egypt’s Second National Communication, Egyptian Environmental Affairs Agency (EEAA-May 2010), under the United Nations Framework Convention on Climate Change on Climate Change
Soliman, E.S.A., Sayed, M. A.Aty & Nour El-Din, M.M., and Samy, G., 2008. “Integration of NFS with Regional Climate Model to Simulate the Nile Basin Hydro-climatology”, Nile Basin Water Engineering Scientific Magazine, 1: 75-85.
Soliman, E.S.A., Sayed, M. A.Aty & Nour El-Din, M.M. (2008); “Application of Regional Climate Models to Test the Impacts of Land Use Change on Basin Hydro-climatology, A Case study, Baro-Akobo Sobat Subbasin” , Nile Basin Capacity building network journal, August 2008

Joint Programme for Climate Change Risk Management in Egypt
Proposed CLIMATE CHANGE ADAPTATION STRATEGY for the Ministry of Water Resources & Irrigation EGYPT (2013)
Filename;\MhmdNour\CC Final Submitted 12-Feb2103 AdptStrtgy .docx page 103
Stratus Consulting (2012), “Potential Impacts of Climate Change on the Egyptian Economy”, prepared for UNDP- Cairo, Egypt.
Strzepek, K.M., Onyeji, S.C., Saleh, M. and Yates, D., 1995. “An Assessment of Integrated Climate Change Impacts on Egypt”, in: K.M. Strzepek and J. Smith (Editors), As Climate Changes: International Impacts and Implications. Cambridge University Press, Cambridge, UK, pp. 180-200.
Strzepek, K.M., Yates, DN; El-Quosy, D. (1996); “Vulnerability assessment of water resources in Egypt to climatic change in the Nile Basin”, CLIMATE RESEARCH, 6 (2): 89-95; FEB 19 1996
Strzepek, Kenneth M. and David N. Yates. 2000. “Responses and thresholds of the Egyptian economy to climate change impacts on the water resources of the Nile River”, Climatic Change 46: 339-356.
Strzepek, K., Yates, D., Yohe, G., Tol, R. and Mader, N. (2001); “Constructing ‘not implausible’ climate and economic scenarios for Egypt”. Integrated Assessment, 2: 139-157. Sutcliffe, J.V. and Lazenby, J.B.C. 1990. “Hydrological data requirements for planning Nile management”, in: P.P. Howell and J.A. Allan (Editors), The Nile, Resource Evaluation, Resource Management, Hydro-politics and Legal Issues. SOAS/RGS, London, pp. 107-136.
Sutcliffe, J.V. and Parks, Y.P. 1999. The hydrology of the Nile. IAHS Special Publication No. 5. International Association of Hydrological Sciences, Wallingford, UK.
Shalaby, T. (2010), “The Impact of Climate Change on Migration: The case of Egypt”, 1st workshop on climate-induced migration and displacement I MENA, Jun-15/2010, Marseille.
Tearfund. (2006); “Overcoming the barriers: Mainstreaming climate adaptation in developing countries”,
Tearfund. (2008); “Separate Streams: Adapting water resources management to climate change”, TearFund-UK, [http://www.wsscc.org/sites/default/files/publications/tearfund_separate_streams_2008.pdf]
TearFund, (2010); “How to integrate climate change into national-level planning in the water sector. UK: TearFund [http://www.adaptationlearning.net/guidance-tools/how-integrate-climate-change-adaptation-national-level-policy-and-planning-water-sect]
Teshome, W. (2009); “Transboundary Water Cooperation in Africa: the case of the Nile Basin Initiative (NBI)”, Review of General management, issue:2, available [www.ceeol.com]
Todd, D.K., and D.E. (1976); “Polluted Groundwater - a review of the significant literature”, publisher: Water Information Center
UNDP (2004); “Adaptation Policy Frameworks for Climate Change – Developing Strategies, Policies and Measures”, published by Cambridge University Press
UNDP. (2006): Beyond Scarcity: Power, poverty, and the global water crises. UNDP.
UNDP (2009); “Project document. Adaptation to Climate Change in the Nile Delta through Integrated Coastal Zone Management”- September-2009
UNDP-UNEP. (2011), “Mainstreaming climate change adaptation into development planning: a guideline for practitioners”, UNDP-UNEP
UNEP (1998); “Mitigation and Adaptation Cost Assessment: Concepts, Methods and Appropriate Use”, published by UNEP Collaborating Centre on Energy and Environment, Riso National Laboratory, Denmark
UNESCO-IHE (2009); “IWRM as a tool for Adaptation to Climate Change”, Training Manual and Facilitator Guide
University of East Anglia, UK (2000); “Assessment of Potential Effects and Adaptations for Climate Change in Europe”, (2000), Jackson Environment Institute & School of Environmental Sciences.
UNFCCC (2011), “Framework Convention on Climate Change, Water and climate change impacts and adaptation strategies
World Bank (WB), (2005); “Arab Republic of Egypt Country Environmental Analysis (1992-2002)”, MENA Region, Water, Environment, Social & Rural Development Department,
World Bank (WB), (2007); “Global Environment Facility. Policy Research Working Paper, World Bank. WPS4293. 35 pp.
World Bank (WB), (2010), "World Development Report 2010, Development and Climate Change". The World Bank, Washington, DC.

Joint Programme for Climate Change Risk Management in Egypt
Proposed CLIMATE CHANGE ADAPTATION STRATEGY for the Ministry of Water Resources & Irrigation EGYPT (2013)
Filename;\MhmdNour\CC Final Submitted 12-Feb2103 AdptStrtgy .docx page 104
Wigley, T. M. L. (1993); “Future climate of the Mediterranean Basin with particular emphasis on changes in precipitation”, In Climatic Change in the Mediterranean, ed. G. Sestini, 15-44
WMRI-NWRC (2002), unpublished report under the matching supply and demand project, Water management Research institute, National water research Center, Ministry of Water Resources and Irrigation, Egypt
World Bank (2007); “Assessing the Impact of Climate on Crop Water Needs in Egypt”, Global Environment Facility. Policy Research Working Paper, World Bank. WPS4293. 35 pp.
World Bank (2010), "World Development Report 2010, Development and Climate Change", The World Bank, Washington, DC.
WRI. (2012); “Ready or not: assessing institutional aspects of national capacity for climate change adaptation. World Resources Institute, [http://www.indiaenvironmentportal.org.in/files/file/ready_or_not.pdf]
Yates, D. (1996): “Integrating Water into an Economic Assessment of Climate Change Impacts on Egypt”, Working Paper WP-96-31, IIASA, A.
Yates, David N. and Kenneth M., Strzepek, K.M. (1998a); “An assessment of integrated climate change impacts on the agricultural economy of Egypt”, Climatic Change 38:261-287.
Yates, David N. and Kenneth M. Strzepek, K.M. (1998b); “Modeling the Nile basin under climatic change”, Journal of Hydrologic Engineering 3(2): 98-108.
Zanella, D. (2010); “Seawater Forestry Farming: An adaptive management strategy for productive opportunities in "barren" coastal lands. M.A. dissertation, California State University, Fullerton, United States -- California. Retrieved November 22, 2010, from Dissertations & Theses: Full Text (Publication No. AAT 1470817).
Zeitoun, M., et al., (2010); “Water Demand Management and the Water-Food-Climate nexus in the Middle-East & North Africa Region”, Regional Water Demand Initiative, IDRC-CRDI-IFAD, www.idrc.ca/wadimena
Joint Programme for Climate Change Risk Management in Egypt
Proposed CLIMATE CHA NGE ADAPTATION STRATEGY for the Ministry of Water Resources & Irrigation EGYPT (2013)
Filename;\MhmdNour\CC Final Submitted 12-Feb2103 AdptStrtgy .docx
Annex (A1)
Population Projections and Distribution on Governorates
Joint Programme for Climate Change Risk Management in Egypt
Proposed CLIMATE CHA NGE ADAPTATION STRATEGY for the Ministry of Water Resources & Irrigation EGYPT (2013)
Filename;\MhmdNour\CC Final Submitted 12-Feb2103 AdptStrtgy .docx
Annex (A2)
DHI Review on Climate Change Modeling and Projections
of Future Nile Flows

Joint Programme for Climate Change Risk Management in Egypt
Proposed CLIMATE CHA NGE ADAPTATION STRATEGY for the Ministry of Water Resources & Irrigation EGYPT (2013)
Filename;\MhmdNour\CC Final Submitted 12-Feb2103 AdptStrtgy .docx
Annex (A3)
Graphical presentation of Estimated Water Management
Vulnerability Trends
Joint Programme for Climate Change Risk Management in Egypt
Proposed CLIMATE CHA NGE ADAPTATION STRATEGY for the Ministry of Water Resources & Irrigation EGYPT (2013)
Filename;\MhmdNour\CC Final Submitted 12-Feb2103 AdptStrtgy .docx
Annex (A4)
Summary Review of Previous Adaptation Strategies in Egypt