class slides for ec 204 spring 2006 to accompany chapter 4
TRANSCRIPT

Class Slides for EC 204Spring 2006
To Accompany Chapter 4
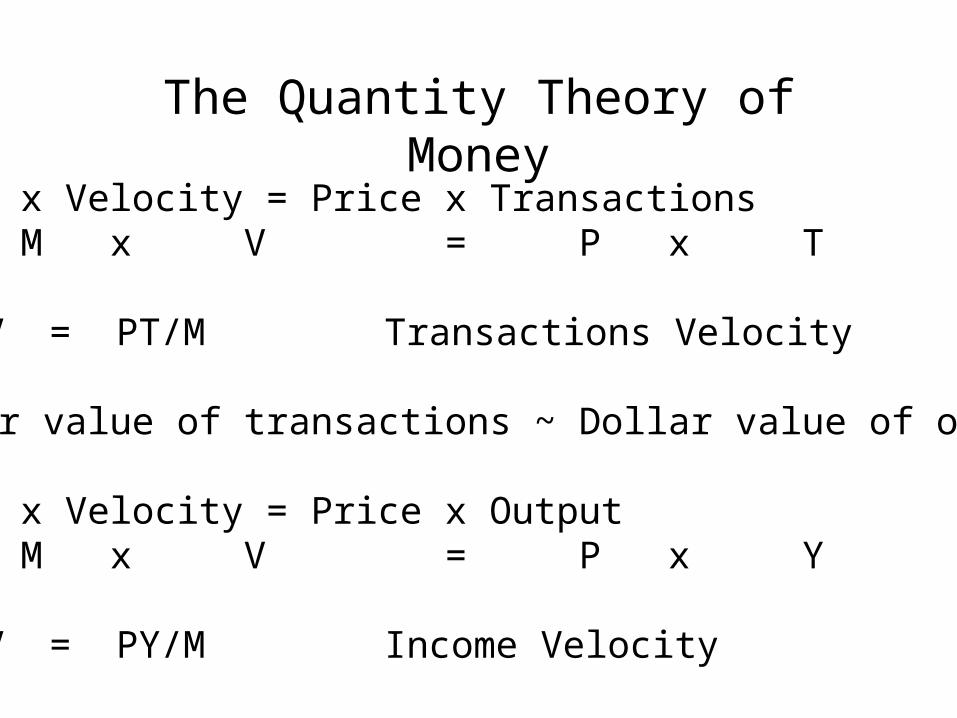
The Quantity Theory of Money
Money x Velocity = Price x Transactions M x V = P x T
V = PT/M Transactions Velocity
Dollar value of transactions ~ Dollar value of output
Money x Velocity = Price x Output M x V = P x Y
V = PY/M Income Velocity
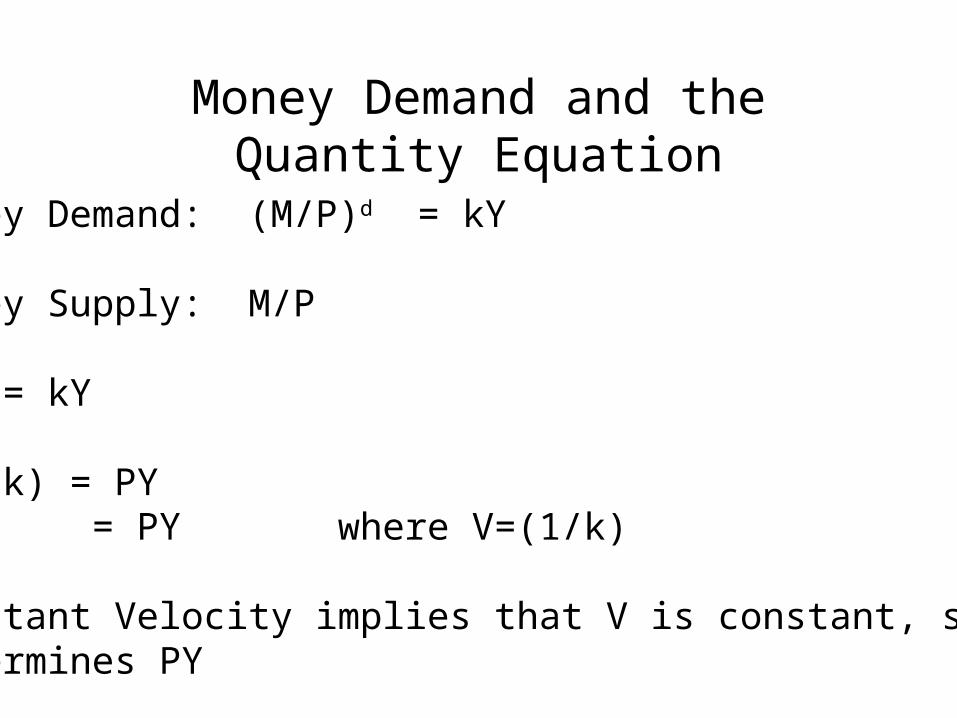
Money Demand and the Quantity Equation
Money Demand: (M/P)d = kY
Money Supply: M/P
M/P = kY
M(1/k) = PY MV = PY where V=(1/k)
Constant Velocity implies that V is constant, so Mdetermines PY
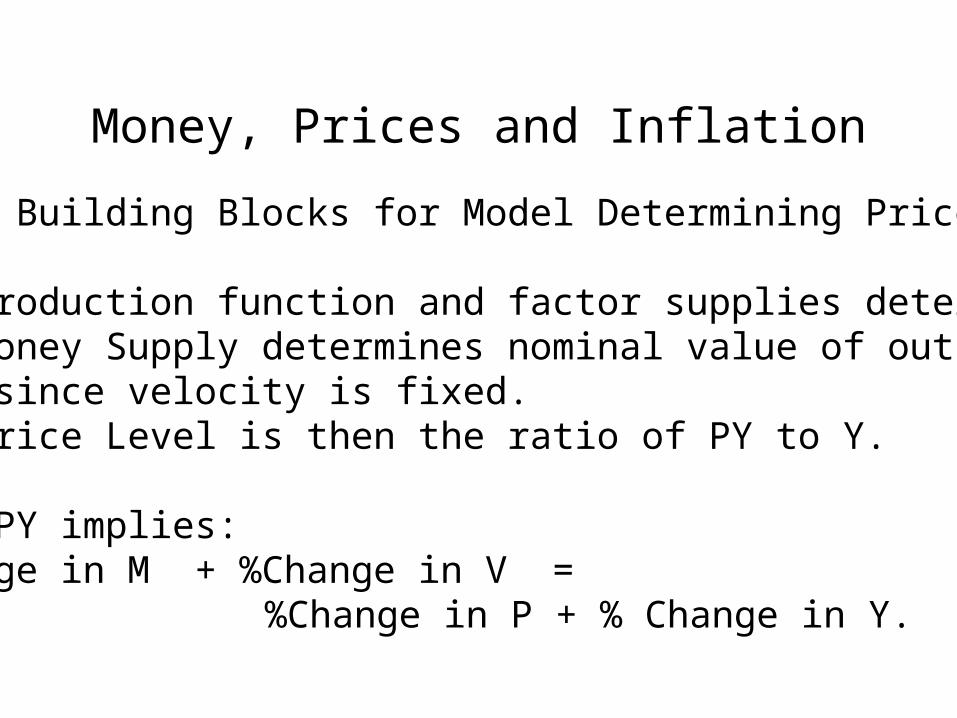
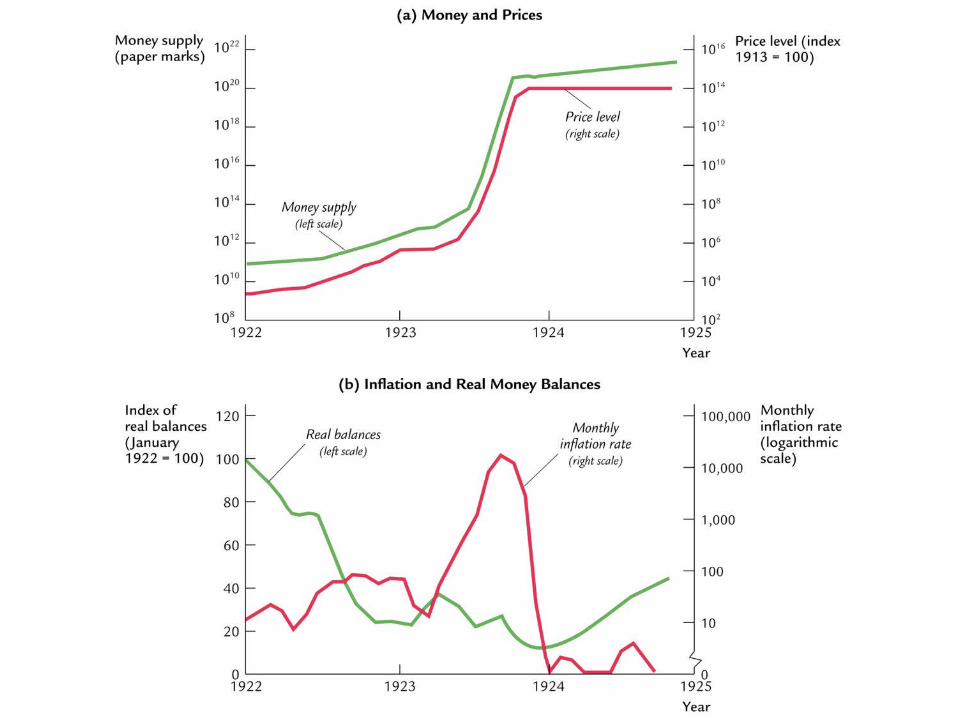
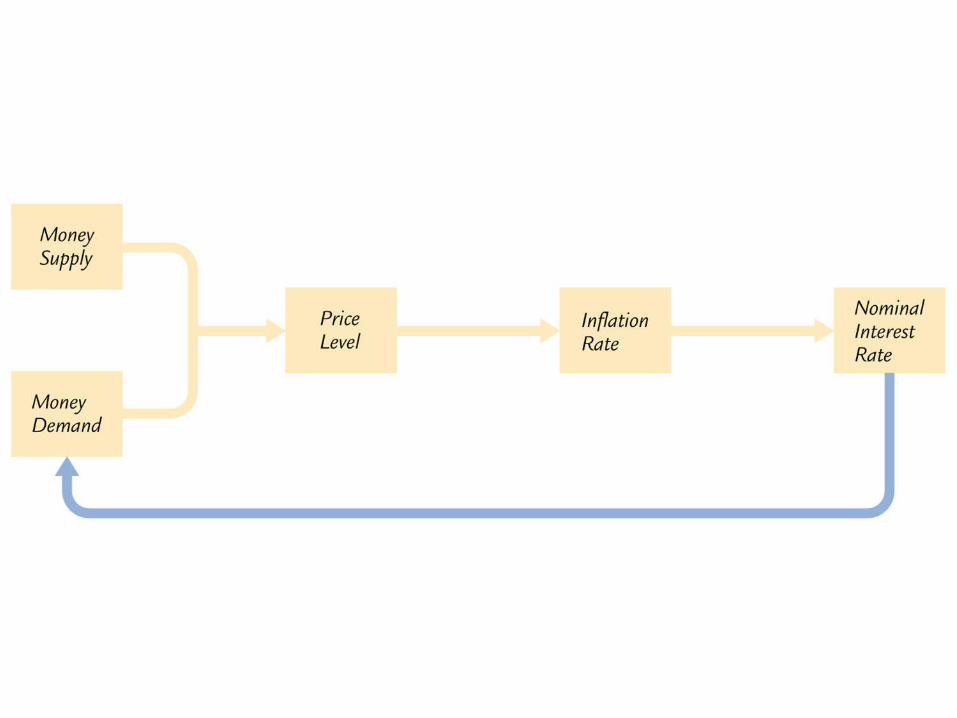
Money, Prices and Inflation
Three Building Blocks for Model Determining Price Level
1. Production function and factor supplies determine Y.2. Money Supply determines nominal value of output, PY, since velocity is fixed.3. Price Level is then the ratio of PY to Y.
MV = PY implies:%Change in M + %Change in V =
%Change in P + % Change in Y.
Empirical Evidence on Money-Inflation Relationship
• Holds for the U.S. over long periods of time as seen when comparing inflation and money growth over a various decades
• Holds across countries when comparing inflation and money growth over a given decade of time
• Doesn’t hold over short periods of time
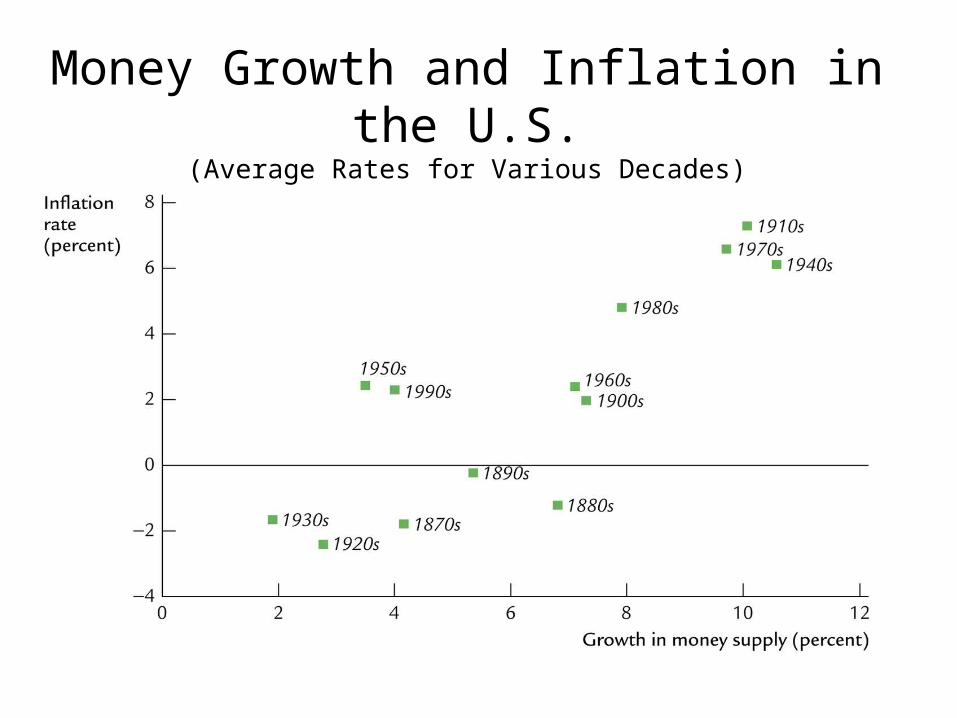
Money Growth and Inflation in the U.S.(Average Rates for Various Decades)

Money Growth and Inflation Across Countries(Average Rates for the 1990s)

Money Growth and Inflation in the United States1960-2003
0%
2%
4%
6%
8%
10%
12%
14%
0.0% 2.0% 4.0% 6.0% 8.0% 10.0% 12.0%PCE Price Index
M2
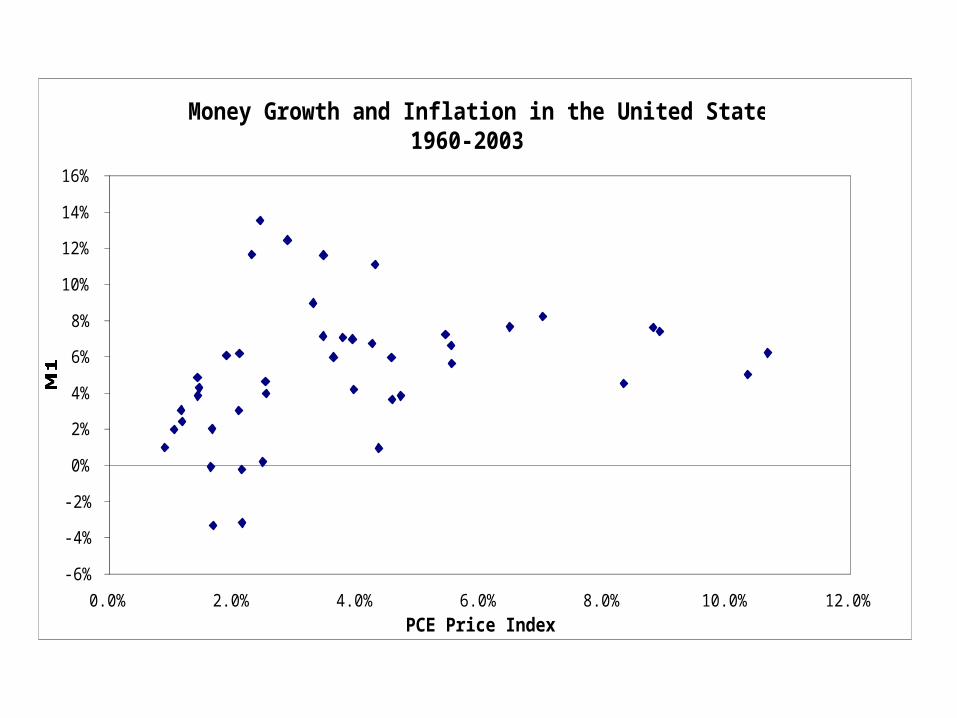
Money Growth and Inflation in the United States1960-2003
-6%
-4%
-2%
0%
2%
4%
6%
8%
10%
12%
14%
16%
0.0% 2.0% 4.0% 6.0% 8.0% 10.0% 12.0%PCE Price Index
M1
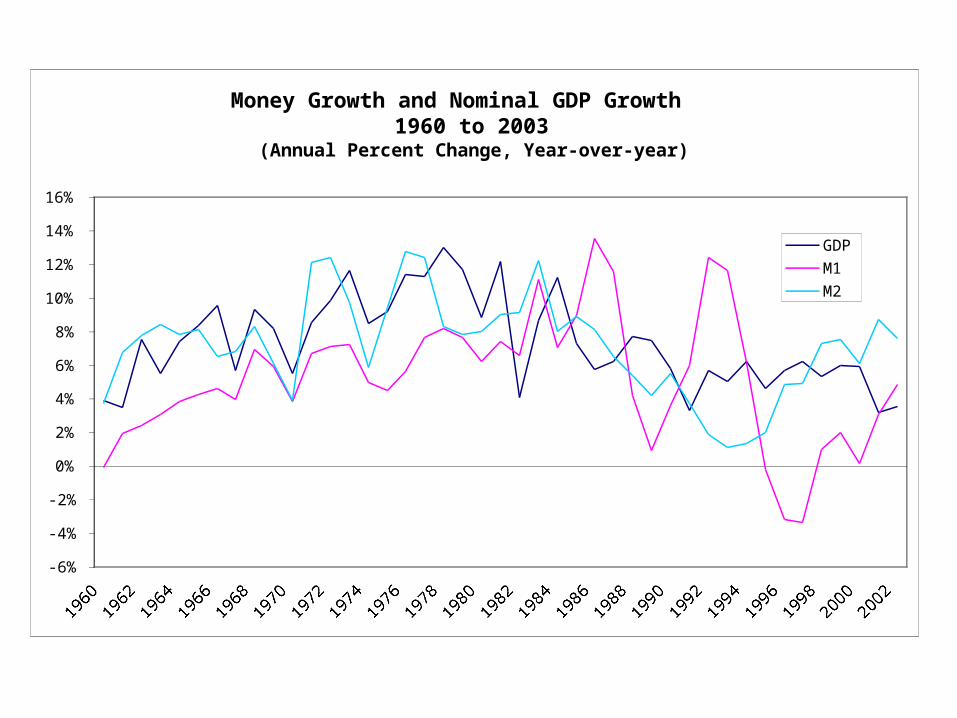
Money Growth and Nominal GDP Growth1960 to 2003
(Annual Percent Change, Year-over-year)
-6%
-4%
-2%
0%
2%
4%
6%
8%
10%
12%
14%
16%
1960196219641966196819701972197419761978198019821984198619881990199219941996199820002002
GDP
M1
M2
Seignorage: Revenue from Printing Money
Inflation is like a tax on real balances
People hold less real balances than otherwise
Value of revenue is approximately equal to inflation ratetimes the level of real balances: M/P)
Inflation and Interest Rates
Real Interest Rate = Nominal Interest Rate - Inflation Rate
r = i -
The Fisher Effect: i = r +
Ex Ante versus Ex Post Real Interest Rates: Expectedversus Actual Inflation.
Fisher Effect Becomes: i = r + e
Evidence Supports Fisher Effect
• Evidence for U.S. shows correlation between inflation and both short and long-term interest rates
• Evidence across countries shows relationship between inflation and interest rates over a given decade of time

Nominal Interest Rate and Inflation1962-2003
0%
2%
4%
6%
8%
10%
12%
14%
16%
1962 1964 1966 1968 1970 1972 1974 1976 1978 1980 1982 1984 1986 1988 1990 1992 1994 1996 1998 2000 2002
PCE Price Index
3-Month Treasury Bill

Nominal Interest Rate and Inflation1962-2003
0%
2%
4%
6%
8%
10%
12%
14%
16%
1962 1964 1966 1968 1970 1972 1974 1976 1978 1980 1982 1984 1986 1988 1990 1992 1994 1996 1998 2000 2002
PCE Price Index
10-Yr Govt Bond
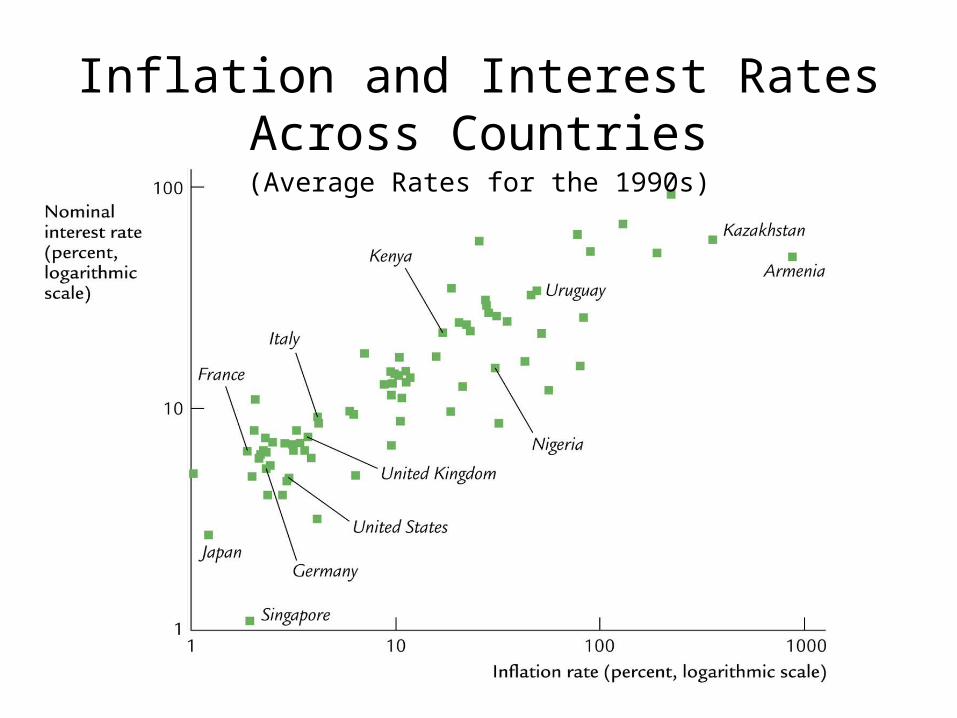
Inflation and Interest Rates Across Countries(Average Rates for the 1990s)
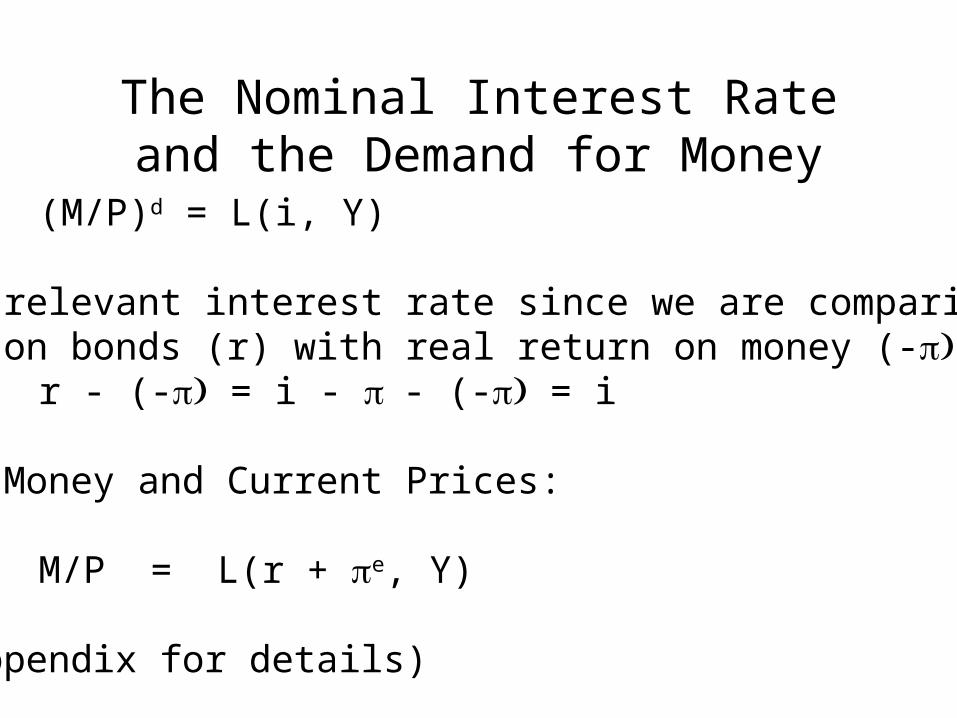
The Nominal Interest Rate and the Demand for Money
(M/P)d = L(i, Y)
“i” is relevant interest rate since we are comparing real return on bonds (r) with real return on money (-:
r - (- = i - - (- = i
Future Money and Current Prices:
M/P = L(r + e, Y)
(See Appendix for details)
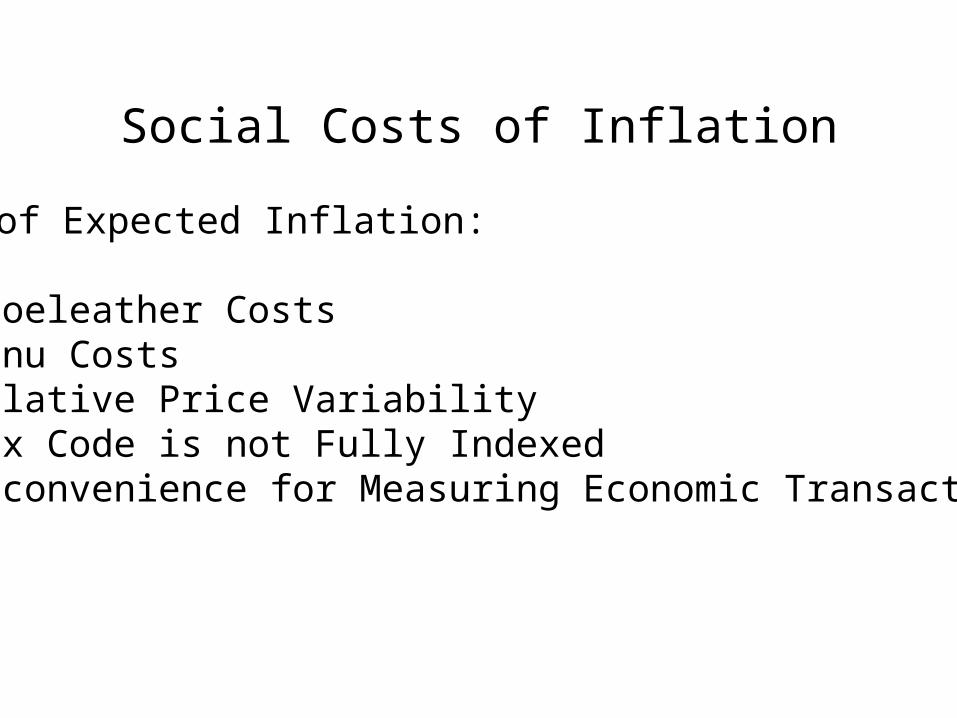
Social Costs of Inflation
Costs of Expected Inflation:
Shoeleather CostsMenu CostsRelative Price VariabilityTax Code is not Fully IndexedInconvenience for Measuring Economic Transactions
Costs of Unexpected Inflation:
Arbitrary Redistribution of Wealth
Examples: Creditors and DebtorsFixed Pensions
Why specify contracts in nominal terms?
Some indexing in U.S.: Social Security,Indexed Treasury Bonds, Part of Tax System
High Inflation also Tends to be highly variable inflationSo, further reason why high inflation may be a problem.