class: human genetics 236 family based allelic association ... · pdf filefamily based allelic...
TRANSCRIPT

Class: Human Genetics 236
Family Based Allelic Association TestsTDT, SDT, FBAT
Steve HorvathDepartments of Human Genetics and Biostatistics
Univ of California, LA

• The big picture: meiotic mapping• Transmission disequilibrium test• The sibship disequilibrium test (SDT)• The family base association test method and
the FBAT software• The Mendel Software
Contents

Meiosis in diploid organisms
– meiosis produces haploid gametes– mechanism for transmission of genetic
material to offspring– recombination by cross-over

Mendel’s laws
• Rule of Segregation– offspring receive one allele from each parent
• Rule of Independent Assortment– alleles of one gene can segregate independently of
alleles of other genes– (Linkage Analysis relies on the violation of
Independent Assortment Rule)

The big picture:locating (“mapping“) disease genes

trait 1
trait 2 trait 3
Reverse genetics: trait -> DNA
Meiotic mapping allows to identify DNAsegments that contain disease genes
Mapping is part of the “positional cloning“ strategy.• works well for Mendelian diseases,
• correspond to rare, highly penetrant disease alleles

Different ways of expressing the goal ofgenomics
• goal: find stretches of DNA that are risk factors for adisease.
• known as reverse genetics if you start with the phenotype(e.g. affectation status)
• aka. positional cloning (Collins FS)– 3 step procedure (adapted)
• first meiotic mapping (linkage, linkage disequilibrium)• second, physical mapping (includes sequencing)• third, find mutation and verify functional role

Different kinds ofmeiotic mapping methods
• parametric (better model-based) lod score analysis– single point– multipoint
• non-parametric (better model-free) linkage analysis– allele sharing methods– key concept: identity by descent– confusing factoid: non-parametric models sometimes equivalent
to parametric methods (Knapp M, 1993?)• association studies, linkage disequilibrium mapping
– family-based methods (TDT, FBAT)– population-based methods (chi-square test, log-linear model)

What do meiotic mapping methods have in common?
1. based on meiosis– made possible through the violation of Mendel’s law of
independent assortment– crossing over effects, recombination, ....– recombination fraction θ
2. requires genetic markers, and sometimes the distancesbetween them (“genetic map”)
3. usually test hypothesis of no linkage H: θ=1/2• but sometimes test for linkage disequilibrium

Background: Allelic association,transmission disequilibrium, the TDT

Association Studies
• “Association is simply a statistical statement about theco-occurrence of alleles or phenotypes. “
• Allele A is associated with disease D if people whohave D also have A more (or maybe less) often thanwould be predicted from the individual frequencies ofD and A in the population.– Source: Pg. 286 Human Molecular Genetics 2, Tom
Strachan

Population-based association studies
11 12 22 total
affected 274 12 0 286
unaffected 215 26 1 242
Total 489 38 1 528
χ2=10.83, DF 2, p=.004
•Objective: show that a genotype is associated withdisease•(Usual) Method: case-control study, cross classifyaccording to genotype, use chi-square
SNP genotype

• best: allele increases diseasesusceptibility– candidate gene studies
• good: some subjects share commonancestor– linkage disequilibrium studies
• bad: association due to populationstratification– family-based offer protection
The 3 possible causes for allelicassociation
d
! !{ }A1d
M
K
AllelesLoci

Allelic association studies test whetheralleles are associated with the trait
• 2 types of association tests– population-based association test
• cases and controls are unrelated• cross-classify by genotype• use χ2 test or logistic regression
– family-based association tests• cases and controls are related: parents, sibs etc• often based on allele transmission rates• prime example TDT

Transmission Disequilibrium Test(TDT)
• Spielman, et. al. Transmission Test for LinkageDisequilibrium: The Insulin Gene Region and Insulin-dependent Diabetes Mellitus(IDDM). Am J HumGenet 52:506-516, 1993.
• Original TDT uses affecteds only (binary trait), ignoresunaffecteds, bi-allelic markers
• Generalizations (e.g. FBAT) can deal with generaltrait, multi-allelic markers and missing parents.

TDT for a bi-allelic markerTerwilliger and Ott 1992, Spielman and Ewens 1993
non-transmitedallele
transmitted allele
a1 a2 a2 a2
a1 a2a1 a2
a1 n1/1 n2/1
a2 n1/2 n2/2
TDT=(n1/2-n2/1)2/(n1/2+n2/1)
is asymptotically χ2(1)

Example •nd|D=5•nD|d=0•TDT-chisq=5•P-value=.025

Transmission vs linkage equilibrium
A marker locus is in– transmission equilibrium with a disease if the disease
status of a child is independent of which parental allelesare transmitted to the child
• describes associations within nuclear families conditional onparental genotypes.
– linkage equilibrium with a disease if the disease status ofperson is independent of his or her marker genotype.
• describes associations within populations ignoring parentalgenotypes

Sources of transmission disequilibriumTransmission disequilibrium occurs when– one marker allele plays a direct role in the disease process.– the marker locus is in linkage disequilibrium with a disease-
predisposing locus.
Message: A strongly positive TDT result suggests that the testedmarker is a disease-predisposing gene or closely linked to sucha gene.
The TDT can distinguish these 2 possibilities from spuriousassociations due to population stratification. When there is priorevidence of linkage, the TDT can still detect transmissiondisequilibrium if it exists.

Hot research question in 1998:Are there family based allelic association teststhat can make use of discordant sibship, i.e. no
parental information available?Answer: yes, plenty!

Very simple discordant sibship test:The sibship disequilibrium test
(SDT)S Horvath, NM Laird AJHG 1998

• for each discordant sibship definem A=(no. of 1 alleles in affecteds)/no. Affected sibsm U=(no. of 1 alleles in unaffecteds)/no. Unaff. sibs
• test statistic has binomial distribution– if m A = m U --> discard sibship from analysis– if m A > m U --> assign score = 1 to sibship (hit)– if m A < m U --> assign score = 0 to sibship (miss)
• under H0 , P(hit)=P(miss)=.5• --> computation of exact P-values is easy
SDT= sign test that compares average no. of1 alleles in affecteds and unaffecteds

• b=no. of sibships with m A > m U
• c=no. of sibships with m A < m U
• SDT statistic T1 =(b-c)/sqrt(b+c)• under null hypothesis, T1 has N(0,1) distribution
• Question: Is such a simple test powerful?
SDT statistic has anasymptotic N(0,1) distribution

• 104 nuclear families with 375 subjects
• bi-allelic candidate gene: Alpha 2 M– b=32, c=8, 2 sided exact p=.000182
• APOE 4 allele– b=48, c=14, 2 sided exact p=.000017
• Message: can work in reality– But A2M finding has not yet been replicated
Data: Alzheimer diseaseBlacker et al Nat Genet 98

• Advantages– simple– does not require parental genotype information– tests null hypothesis H0: Δ (θ- .5)=0
• i.e. can test for linkage (θ=.5) and linkage disequilibrium Δ=0• conclusion: detects association only if marker is linked
– robust against misclassifications of affection status– can test multiple alleles at the same time– can compute exact P values
• Disadvantages– power OK but not great– requires dichotomous trait, no covariates
Advantages and disadvantages of the SDT

Many (more sophisticated)alternatives to the SDT
when dealing with missing parental data
• Many tests can deal with missing parents– The S-TDT (Spielman & Ewens 98)– DAT (Langefeld + Boehnke 98)– Schaid+Rowland 99, Weinberg CR 99, Allison 99, Risch
and Teng 98, Clayton 99– RC-TDT by Knapp 99 particularly powerful
• FBAT aims at combining some of the aboveapproaches

Q: Can one define haplotype based allelicassociation tests even if phase information isnot available? Can one do this whenparental data are possibly incomplete.A: yes! Several approaches, e.gTRANSMIT by D. Clayton.Here we discuss haplotype FBATReference: Steve Horvath, Xin Xu, Stephen Lake, Nan Laird (2004) FamilyBased Tests for Associating Haplotype with General Phenotype Data: thehaplotype FBAT software. Genetic Epidemiol

Features of haplotype FBAT• family-based testing method for allelic association between
haplotypes and quantitative or dichotomous phenotypes– Special case is the single marker FBAT program
• can handle missing parental genotypes and/or missingphase in both offspring and parents
• haplotype-specific (bi-allelic) or global (multi-allelic) tests• used for tightly linked markers (recomb. fraction=0)• tests are robust to
– population admixture– phenotype distribution– ascertainment based on phenotypes

Background
Approaches for dealing with missing phase1. `haplotype reconstruction' algorithm e.g.
Simwalk, Mendel, but it can introduce bias ifthere is population admixture
2. maximum likelihood (TRANSMIT) [Clayton,1999]: use maximum likelihood to estimatehaplotype frequencies from the sample
3. conditioning approach: Zhao et al., 2000;Dudbridge et al., 2000; Knapp 2001
characterizethe null in terms ofconditionaldistribution

Our weighted conditioning approach
• builds on the conditioning approach (3) and theweighting approach [Zhao et al., 2000].
• extends the algorithm described in Rabinowitz andLaird [2000] to multiple markers
• in contrast to previous work we also describe howto deal with missing parental genotypes and withquantitative traits

Test statistics in haplo FBAT

Asymptotic Test Statistics for phasedgenotypes
• Score Si for the i-th family• j-th individual in the i-th family• Tij= quantitative or binary trait• X(G) genotype coding; can
accommodate multiple haplotypes byturning X(G) into a vector
• Si depends on the conditionaldistribution Pcond
21
)(
)}({
)(),(
!"
=
#=
==
#
$
$
$
UVU
SVarV
SESU
GXTTGSS
T
i
i
i
ii
j
ijijiii

• use conditional probabilities to compute E(S), Var(S)
U= Σi Si-E (Si) V= Var(Σi Si)
• Univariate (bi-allelic) test statistic isZ=U/sqrt(V)
• Global (multi-allelic) test has the Mantel Haenszelform
UT V-1 U– χ2 (rank(V)) distribution– V is often not full rank -> use pseudo-inverse
Asymptotic distributionof FBAT statistics via Mantel Haenszel

The choice of marker coding X(g)
• Different genotype codings X(g) may increase the power.• The default uses an additive model so an offspring’s
marker genotype enters the FBAT test statistics as a count:the number of target alleles in the offspring.
• One can switch to a dominant, recessive or a genotypemodel using the model commands model d, model r ormodel g respectively
• It can also accommodate a multi-haplotype test (global test)by turning X(g) into a vector, see the next slide

Table of multi-allelic coding (Schaid 96)
genotype GEN GDOM GREC GTDT
AA (0,0,0,0,0) (1,0,0) (1,0,0) (2,0,0)
AB (1,0,0,0,0) (1,1,0) (0,0,0) (1,1,0)
AC (0,1,0,0,0) (1,0,1) (0,0,0) (1,0,1)
BB (0,0,1,0,0) (0,1,0) (0,1,0) (0,2,0)
BC (0,0,0,1,0) (0,1,1) (0,0,0) (0,1,1)
X(.)

Dealing with unphased genotypes:the weighted approach
• similar to Zhao et al 2000• k sums over phased genotpes compatible with gj• weights not used to assign phase or parental
genotypes• weights are estimated from the sufficient
statistics statistics are unbiased• weights will affect the power• it is natural to estimate the weights by the
conditional probability of observing Gjk giventhat it is compatible with gj EM algorithm
!
!
=
=
k
G
k
jkGj
jk
jk
w
GXwgX
1
)()(

The conditioning approach
• Principle [single marker case: Rabinowitz and Laird, 2000]• conditioning is on the sufficient statistics for any nuisance
parameters:– distribution of the phenotypes– the parental allele frequencies– model for ascertainment
• we extend the conditioning approach to tightly linkedmarkers by conditioning on the sufficient statistic forresolving phase as well– again based on observed parental and offspring genotypes
• evaluate the distribution of test statistics using the conditionaldistribution of offspring genotypes under the null hypothesis

• Step 1: Find all phased compatible mating types.• Step 2a: Find the ``alphabet'' of allowable offspring genotypes.• Step 2b: Find the set of allowable offspring genotype patterns.• Step 3: Compute the conditional offspring genotype probability given
the parental mating type. Make a list of possibly unphased offspringgenotypes allowed by step 2b. For the h-th pattern and the k-th matingtype define the matrix A*= P(h-th offspring pattern| Mk)$. Identifywhich offspring genotype pattern corresponds to the observed pattern.Without loss of generality assume it is the first pattern h=1. Then defineA(hk)=A*(hk)/A*(1k)
• Step 4: Drop non-constant offspring patterns. Dropping non-constantpatterns ensures that all the outcomes in this conditional distributionhave the same probability for any possible mating type.
• Step 5: Compute the conditional probabilities of each offspringgenotype pattern.
5 steps of the conditioning algorithm
Recommendation: please read the example in the paper…

Example
g1=(11)/(12) g2=(1,2),(1,2)
? (11)/(12)
g1 is phased, g2 is unphased2 allowable offspring genotype patterns:(g1,g2) and (g2,g1)with Pcond((g1,g2))=Pcond((g2,g1))=.5
The weighted approach
22
2121
2
)()()(
2/)1)(()(
))21/()12(()1())22/()11((
))2,1(),2,1(()(
SESESVar
wYYwYYSES
XwwX
XgX
!=
++!+=!
!+=
=

Finding an offset for the trait: hbat –oOften useful for quantitative traits
• Goal: subtract “optimal” offset o from the trait withoutbiasing the results
• Often similar to centering the trait by subtracting outthe overall mean
• This can improve the power when dealing with aquantitative or highly prevalent binary trait– not useful when there are only affected offspring
• Offset is determined by minimizing the variance underthe null, see Lunetta et al. AJHG

Formulas for finding an offset.This underlies hbat –o
21 )ˆ()ˆ()ˆ(
))(min(argˆ
)()(
)}({)(
)()(),()(
!"
=
=
#=
#==
#
$
$
$
oUoVoU
oVo
SVaroV
SESoU
GXoYYGSoS
T
i
i
i
ii
j
ijijiii
The score U and the variancedepend on the offset o.The offset is estimated byminimizing the variance.The estimate is plugged intothe final test statistic.

It is straightforward to incorporatecovariates into an FBAT analysis
• Incorporating offspring covariate information for measuredtraits may substantially reduce the variability.
• Thus, adjusting for covariates can make an importantdifference in the power of the test.
• The inclusion of covariates requires first externally calculatingresiduals and then submitting these as traits in a phenotypedata file.
• For example, a test statistic motivated by testing forinteractions in a generalized linear model is given by
Tinteraction=(Yij- pred(Yij|Z) )Zij
• Zij covariate of the j-th offspring in the i-th family• pred(Y|Z)=predicted value given the covariates Z

Multivariate traits
• When there are multiple correlated traits available oneach offspring, it may be desirable to test themsimultaneously.
• Such a test strategy can substantially reduce the powerloss associated with multiple testing approaches (Langeet al., 2002).
• Multiple traits can be tested using a multivariateversion of the classical univariate FBAT test statistic– Use the command fbat trait1 trait2
• References: PBAT by Chris Lange– Lange et al., (2002)– FBAT manual.

Censored traits: survival times or time to onset.• Several approaches exist.• Mokliatchouk et al. (2001) describe a score test based on Cox model.• Horvath et al. (2001) use a score test based on a proportional hazards
model with an exponential age-at-onset distribution.
• is an estimator of the cumulative hazard, which isestimated outside of FBAT. The estimate is read into FBATas quantitative trait (phenotype file).
• The approach is implemented with the –c option in “FBAT”.• Motivation: Then the statistic S takes on the same form as the score
equation of a proportional hazards model with an exponentialbaseline hazard function.
• For rules of thumb about which statistic to use in a particularsituation, refer to Lange et al. (2003a).
),(ˆ ijijij YcT !"=)(ˆ ijY!

Empirical variance estimator• Unlike “PBAT”, the “FBAT” software splits pedigrees into individual
nuclear families and treats them as independent• The pedigree’s contribution to the FBAT test statistics is then obtained
by summing over all nuclear families within the pedigree.• However, in the case where linkage is present and the null hypothesis
states “linkage, but no association”, the genotypes of the differentnuclear families derived from one pedigree are correlated.
• Even with a single nuclear family, the transmissions to multiple sibsare correlated when linkage is present.
• Therefore, when testing for association in an area of known linkagewith multiple sibs in a family or when multiple families in a pedigreeoccur, an empirical variance for the test statistics (Lake et al., 2001)should be used.
• Command: hbat -eT
ii
i
iiRSESSESV ))(())(( !!="

FBAT-tools and Power Calculations
• Lange et al. (2002a,b) propose a unified approach to powercalculations for family-based association tests of a singledichotomous or continuous trait and a biallelic marker.
The method is attractive since it can deal with• both affected and unaffected offspring• missing parental information• multiallelic markers• multiple traits• impact of study design• ascertainment conditions• Choice of the offset choice• Implementation in the PBAT software package

Results

Simulation Study• haplo FBAT is robust to population admixture:
– TRANSMIT is susceptible to very slight type I error rate inflationwhen parental information is missing and admixture
• haplo FBAT is comparable to TRANSMIT– when the data consist of family trios– discordant sibships with two affected and one unaffected offspring
and no parents.• haplotype FBAT has reduced power
– when discordant sibships with completely or partially missingparental information are sampled,
– possible explanation1. TRANSMIT may have a slightly inflated type I error2. a number of families are uninformative for haplotype FBAT, as
opposed to TRANSMIT

Asthma: CAMP Research Group, S. Weiss, E. Silverman
• 652 nuclear families consisting of 2011 individuals• traits: binary (diagnosis) and quantitative (bronch. resp)• 7 SNPs in the beta-2 adrenergic receptor gene• no single SNP was significant• haplotype-based, global tests were highly significant• comparison haplo FBAT and TRANSMIT
– chi-square statistic values of the two tests are very similar.– different p-values due to different degrees of freedom which are
determined by different haplotype inclusion criteria: FBAT=no. ofinformative families, TRANSM: freq. threshold
Phenotype chi 2 df p-value chi 2 df p-value chi 2 df p-value
Asthma diagnosis 2.2 1 0.138 35.6 9 <.00005 34.24 11 0.0003
Bronch. response 3.39 1 0.066 20.33 9 0.016 NA NA NA
haplo FBAT TRANSMITsingle marker FBAT
Cannot handlequantitative trait

Software Availability
• Google search for “FBAT”– software and documentation at
www.biostat.harvard.edu/~fbat/default.html.• integrated into the FBAT program version 1.4.
– command “hbat SNP3 SNP5 SNP11”– Empirical variance: “hbat -e”

• Haplotypye FBAT program can deal with haplotype data– input genotype data without phase information– can deal with quantitative and multivariate traits– But assumes zero recombination between markers– If the markers are unlinked, use SIMWALK or other software
• Unaffecteds can carry important information– to offset missing parental genotypes– when disease prevalence is high– design: ascertain at least one control (parents or sibs)!
• Population-based test are experiencing a renaissance– some papers argue that admixture effects are negligible.
• BUT family based designs are useful even if there is no admixture!– use of genomic controls for association studies, e.g Devlin and Roeder
1999
Summary

Selected references and linksLINK http://www.biostat.harvard.edu/~fbat/default.html
• Haplotype FBAT: Horvath S, Xu X, Lake SL, Silverman EK, WeissST, Laird NM (2004) Family based tests for associatinghaplotypes with general phenotype data: application to asthmagenetics. Genet Epidemiol, Vol 26, No 1, 61-69
• SINGLE Locus FBAT: Horvath S, Xu X, Laird NM (2001) Thefamily based association test method: strategies for studyinggeneral genotype-phenotype associations. Euro J Hum Gen9:301-306
• Statistical Theory underlying FBAT• D Rabinowitz and NM Laird (2000) A unified approach to
adjusting association tests for population admixture witharbitrary pedigree structure and arbitrary missing markerinformation.
• FBAT-Toolkit Team (in alphabetical order)• Steve Horvath, Nan Laird, Steve Lake, Christoph Lange, Kristel Van
Steen, Lin Wang, and Xin Xu

• Input file: standard linkage format– PedID, ID, DadID, MomID, Gender, Aff, Alleles…
• But specify the marker names in the first line!Marker1 Marker2 Marker31 1 0 0 1 0 0 0 3 3 3 41 2 0 0 2 2 1 2 2 5 8 6• To see a list of commands type
>> ?• To load pedigree data type
>> load ped Pedigree1.txt• To test for linkage between the haplotype locus and a
disease pre-disposing gene, type>> hbathaplotypes and EM estimates of frequency:h1 : 1 3 3 0.166079h2 : 2 3 3 0.125305
….Allele afreq fam# S E(S) Var(S) Z P-----------------------------------------------------------------------h2 0.125 17 22.790 17.790 8.812 1.684 0.092121h3 0.068 11 6.000 12.000 6.000 -2.449 0.014306h4 0.065 12 17.937 12.437 6.189 2.211 0.027047
Mini-tutorial I

• To start a log file type>> log Log1.txt
• To limit the output to statistics that have ap-value smaller than .05 type>> displayp .05
• To focus on haplotypes formed by markersMarker1 and Marker3, please type>> hbat Marker1 Marker3
• Invoke an empirical variance estimator by>> hbat -e
To use a multi-allelic marker coding:>> mode m>> hbat
• To load the phenotype file:>> load phe Pheno1.txt>> trait Trait1
Mini-tutorial II

Extensive Tutorial:haplotype FBAT

Input for haplo FBAT: the pedigree file• This file follows the standard linkage file format as used by Genehunter
i.e. the columns are– pedigreeID, individualID, fatherID, motherID,– gender,– affectation status,– Marker1Allele1 Marker1Allele2– Marker2Allele1 Marker2Allele2
• method assumes that the markers are tightly linked• text file, entries are separated by spaces (NOT TABS)• Special values
– missing values are 0– gender: 2 indicates female, 1 male,– affectation status: 2 indicates affecteds, 1 unaffecteds
• Different from the linkage format one needs to specify the markernames in the first line!

Loading the Pedigree File andRunning Haplotype FBAT
• Different from the linkage format one needs to specify themarker names in the first line!
• Pedigree1.txt are:Marker1 Marker2 Marker31 1 0 0 1 0 0 0 3 3 3 41 2 0 0 2 2 1 2 2 5 8 61 3 1 2 2 2 1 1 3 5 8 41 4 1 2 1 2 1 2 2 3 4 63 1 0 0 1 0 1 2 1 3 3 63 2 0 0 2 0 1 2 1 3 6 6

Begin the session• Start the FBAT software (double click on icon)• To see a list of commands type
>> ?• To learn about the min command type
>> ? min• To start a log file type
>> log Log1.txt• To load pedigree data type
>> load ped Pedigree1.txt• To limit the output to statistics that have a p-value smaller
than .1 type>> displayp .1current p_value is 0.100000

• To test for linkage between the haplotype locusand a disease pre-disposing gene, please type>> hbat
trait affection; model additive; test bi-allelic;minsize 10; p 0.100000haplotype analysis for the following markers:Marker1 Marker2 Marker3haplotypes and EM estimates of frequency:h1 : 1 3 3 0.166079h2 : 2 3 3 0.125305ETC
Message: estimates of haplotype freq. (EM alg)Allele afreq fam# S E(S) Var(S) Z P-----------------------------------------------------------------------h2 0.125 17 22.790 17.790 8.812 1.684 0.092121h3 0.068 11 6.000 12.000 6.000 -2.449 0.014306h4 0.065 12 17.937 12.437 6.189 2.211 0.027047
Message:• the univariate test statistic that counts how oftenhaplotype h3 is present in affecteds leads to ap.value of 0.014.• Negative sign in the Z statistic indicates that h3 isless frequent in affecteds than expected
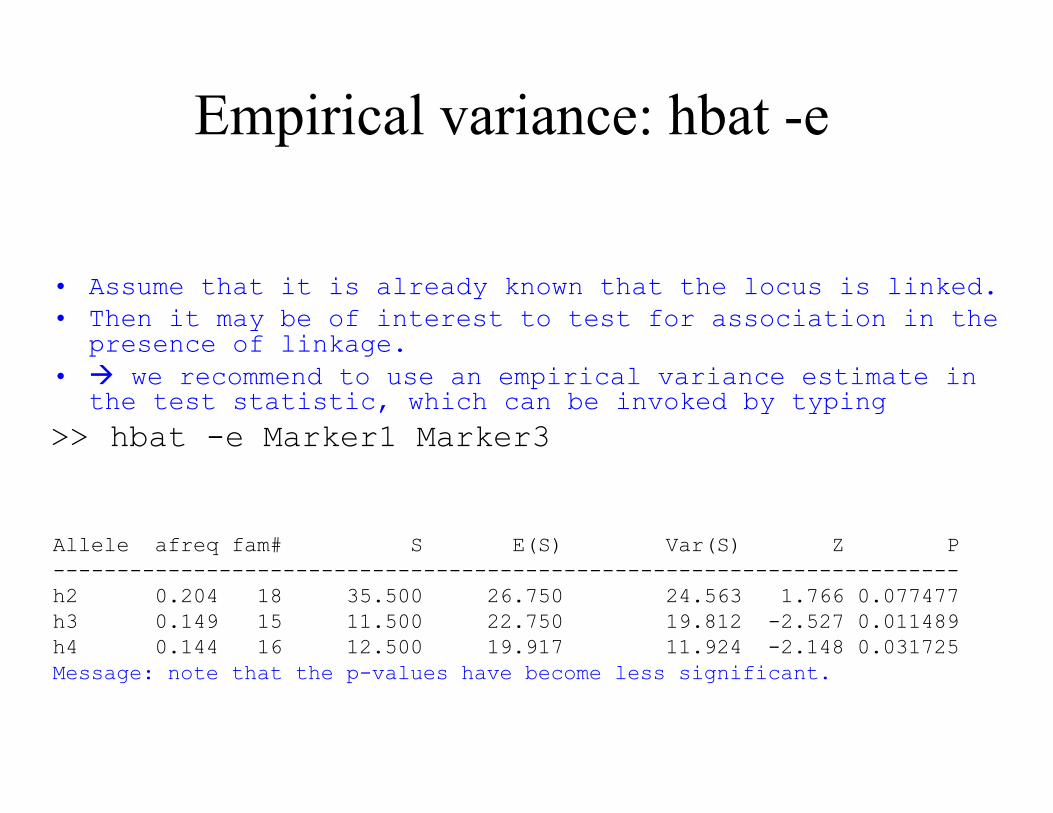
Empirical variance: hbat -e
• Assume that it is already known that the locus is linked.• Then it may be of interest to test for association in the
presence of linkage.• we recommend to use an empirical variance estimate in
the test statistic, which can be invoked by typing
>> hbat -e Marker1 Marker3
Allele afreq fam# S E(S) Var(S) Z P-----------------------------------------------------------------------h2 0.204 18 35.500 26.750 24.563 1.766 0.077477h3 0.149 15 11.500 22.750 19.812 -2.527 0.011489h4 0.144 16 12.500 19.917 11.924 -2.148 0.031725Message: note that the p-values have become less significant.

Analyzing Quantitative Traits
• Assume that you are dealing with a quantitative phenotype (trait),e.g.blood pressure. In this case you need to read in a phenotype file
• Briefly the columns are pedigree ID, individual ID, trait1, trait2, etc.• Importantly, you need to specify the trait names in the first row.
• Example file: Pheno1.txtTraitA TraitB1 1 0.52 11 2 0.16 21 3 0.45 21 4 0.72 13 1 0.85 - Comment: missing traits are coded by “-“3 2 0.76 13 3 0.22 23 4 0.2 2etc

Specifying the quantitative traitTo load the phenotype file, please type
>> load phe Pheno1.txt2 quantitative traits have been successfully read249 persons have been phenotypedTo see all the available traits type>> traitaffection** TraitA TraitB
Message: the first (default) trait is theaffection status trait specified in the pedigreefile. When using a phenotype file this trait canbe ignored. But for syntax reasons one stillneeds to provide an affection status column inthe pedigree file, e.g., just fill it up withones.
Let us now specify that TraitA is to be used insubsequent analyses.
>> trait TraitAaffection TraitA** TraitB

hbat-o commandTo test for linkage type>> hbattrait TraitA; model additive; test bi-allelic;minsize 10; p 0.100000
haplotypes and EM estimates of frequency:h1 : 1 3 3 0.166079h2 : 2 3 3 0.125305Allele afreq fam# S E(S) Var(S) Z P-----------------------------------------------------------------------h3 0.068 11 1.890 5.790 1.737 -2.959 0.003082
For quantitative traits it may be useful to type>> hbat –oRoughly speaking the option –o centers eachtrait, i.e., it subtracts a trait “medoid” fromeach trait.
The –o option can only be used with the bi-allelic mode.

The end of the sessionTo use a multi-allelic marker coding, please type>> mode m>> hbat....TO CHANGE THE GENETIC MODEL TYPE>> model dDominantTo use the single marker FBAT, please type>> fbatTo turn off the log file>> log offFor the experts:To view the haplotype configuration of selectedmarkers in each family type
>> viewhap Marker1 Marker3>> quit

Statistical tests in FBAT software
• fbat command: single marker analysis– fbat –o, fbat –e, fbat –o SNP1– fbat trait1 trait2 (multivariate traits)
• hbat command: multi-marker analysis– hbat –o SNP1 SNP3
• OLD version of FBAT contains the sdt command: sibshipdisequilibrium test.– Useful when testing for association given linkage.– only works for dichotomous traits and discordant sibships– Has been extended to the pedigree disequilibrium test (PDT) by
Martin et al?

FBAT for pros• If model d (dominant model) is significant, you may have a parent of
origin effect– check whether there is preferential transmission from the father or the
mother• Need help? when dealing with a dichot. trait, missing parents
contact SH• If your fbat or hbat result is significant,
– make sure there is no bizarre genotyping bias, e.g. detection ofheterozygote offspring is less likely than heterozygous parents
– consider checking whether there is transmission distortion bychecking transmission rates to unaffecteds
– CAVEAT: the asymptotic approximations of the TDT may be anti-conservative when testing multi-allelic markers with many alleles
• Always use the permutation test p-value in publications.

• When dealing with quantitative traits we recommend to center the trait,e.g. subtract the offspring mean– Or type hbat –o– hbat –o only works in univariate mode (mode b)
• not in multi-allelic mode (mode m)• fbat can deal with multivariate traits, type
fbat Trait1 Trait5– BUT hbat can‘t do this yet
• Monte-Carlo p-values can be obtained in “FBAT” with asingle trait, specifying a single marker or haplotypes using thecommand line hbat –p marker.
• when testing for association given linkage– Consider hbat –e, fbat –e– Probably less powerful but more rigorous: sdt command which
invokes the sibship disequilibrium test (Horvath and Laird 1998).
Final thoughts