city research onlineopenaccess.city.ac.uk/1191/1/panesar_mphil.pdfp5 power plant performance...
TRANSCRIPT
City, University of London Institutional Repository
Citation: Panesar, Angad Singh (2012). A study of organic Rankine cycle systems with the expansion process performed by twin screw machines. (Unpublished Doctoral thesis, City University London)
This is the unspecified version of the paper.
This version of the publication may differ from the final published version.
Permanent repository link: http://openaccess.city.ac.uk/1191/
Link to published version:
Copyright and reuse: City Research Online aims to make research outputs of City, University of London available to a wider audience. Copyright and Moral Rights remain with the author(s) and/or copyright holders. URLs from City Research Online may be freely distributed and linked to.
City Research Online: http://openaccess.city.ac.uk/ [email protected]
City Research Online
A study of organic Rankine cycle systems with the expansion
process performed by twin screw machines
By
Angad Singh Panesar
Thesis submitted for the degree of
Master of Philosophy
City University London
School of Engineering and Mathematical Sciences
2012
i
Table of Contents
List of figures ................................................................................................................................. iv
Nomenclature ............................................................................................................................... vi
Abstract ....................................................................................................................................... viii
Chapter 1 Introduction and literature review .............................................................................. 1
1.1 Industrial waste heat .......................................................................................................... 1
1.1.2 ORC for waste heat recovery ....................................................................................... 2
1.2 Objectives and methodology .............................................................................................. 3
1.3 Determining the waste heat ............................................................................................... 3
1.4 Energy conversion in ORC ................................................................................................... 4
1.5 Other ORC arrangements .................................................................................................... 7
1.5.1 Regenerator ................................................................................................................. 7
1.5.2 Reheat or dual expansion ............................................................................................ 8
1.6 Expanders .......................................................................................................................... 10
1.7 ORC process compared to steam process ........................................................................ 12
1.7.1 Organic working fluid classification ........................................................................... 13
1.7.2 Advantages of ORC ..................................................................................................... 15
1.8 Types of cycles .................................................................................................................. 15
1.9 Design boundary conditions ............................................................................................. 18
1.9.1 Standardised units ..................................................................................................... 19
1.10 Literature review ............................................................................................................. 20
1.10.1 Heat exchangers technologies for ORC .................................................................... 20
1.10.2 Steam vs. Organic fluids ........................................................................................... 21
1.10.3 Organic fluids ........................................................................................................... 22
1.10.4 Cycle configurations ................................................................................................. 23
1.10.5 Optimization ............................................................................................................ 24
1.10.6 Simulation ................................................................................................................ 25
1.10.7 Internal combustion engines ................................................................................... 26
1.11 Expander ......................................................................................................................... 26
1.11.1 Rotary vane expanders ............................................................................................ 27
1.11.2 Scroll expanders ....................................................................................................... 27
1.11.3 Screw expanders ...................................................................................................... 27
1.12 Existing Applications ....................................................................................................... 28
ii
Chapter 2 Working fluid .............................................................................................................. 32
2.1 Introduction ...................................................................................................................... 32
2.2 Desired properties ............................................................................................................ 33
2.3 Screening method ............................................................................................................. 36
2.4 R245fa ............................................................................................................................... 39
Chapter 3 Modelling (Global model) .......................................................................................... 41
3.1 Introduction ...................................................................................................................... 41
3.2 Model background ............................................................................................................ 41
3.3 Irreversibilities .................................................................................................................. 44
3.4 Assumptions for the model ............................................................................................... 46
3.5 Global model ..................................................................................................................... 47
Chapter 4 ORC components & modelling sub-routines .............................................................. 51
4.1 Boilers ............................................................................................................................... 51
4.1.1 Assessments of possible plate heat exchanger technologies .................................... 52
4.1.2 Findings ...................................................................................................................... 54
4.1.3 Boiler description ....................................................................................................... 55
4.1.4 Boiler module ............................................................................................................. 56
4.1.5 Overall heat transfer coefficient ................................................................................ 60
4.2 Expander ........................................................................................................................... 63
4.2.1 Lubrication ................................................................................................................. 63
4.2.2 Benefits of twin screw expander ............................................................................... 63
4.2.3 Expander module ....................................................................................................... 64
4.3 Condensers........................................................................................................................ 66
4.3.1 Condensers types ....................................................................................................... 67
4.3.2 Condenser module ..................................................................................................... 70
4.4 Feed pump ........................................................................................................................ 73
4.4.1 Pump selection & pressure ........................................................................................ 73
4.4.2 Cavitation ................................................................................................................... 73
4.4.3 Pump module ............................................................................................................. 74
4.5 Thermoeconomic optimization ......................................................................................... 75
4.5.1 Economic analysis ...................................................................................................... 76
4.5.2 Estimation of the Total Capital Investment (TCI) ....................................................... 76
4.6 Criteria of performance for ORC ....................................................................................... 78
Chapter 5 Results & discussion ................................................................................................... 80
5.1 Understanding the behaviour of an operating ORC ......................................................... 84

iii
5.2 Sensitivity study ................................................................................................................ 85
5.2.1 Increasing maximum ORC pressure ........................................................................... 85
5.2.2 Reducing minimum ORC temperature ....................................................................... 88
5.3 Expander mechanical efficiency ........................................................................................ 90
5.4 Power output vs. Cycle efficiency ..................................................................................... 91
5.5 Methodology for error analysis ........................................................................................ 92
6 Conclusion ................................................................................................................................ 94
Reference .................................................................................................................................... 96
Additional references ................................................................................................................ 101

iv
List of figures
Figure 1 Various available waste heat sources for ORC ................................................................ 2
Figure 2 Schematic ORC system layout for wet vapour expansion ............................................... 5
Figure 3 T-S diagram for ORC using R245fa with wet vapour expansion ..................................... 5
Figure 4 Schematic superheated ORC system layout .................................................................... 6
Figure 5 T-S diagram for superheated ORC using R245fa ............................................................. 6
Figure 6 Schematic ORC with a regenerator ................................................................................. 7
Figure 7 Schematic ORC system with reheat of the partially expanded vapour ........................... 8
Figure 8 T-S diagram for reheat ORC using R245fa ...................................................................... 9
Figure 9 Schematic layout for dual ORC systems ........................................................................ 10
Figure 10 Twin screw expander, a positive displacement machine with pressure ports and
direction of rotation [5] ............................................................................................................... 11
Figure 11 Under and over expansion losses in a twin screw expander ....................................... 11
Figure 12 Vapour curve comparison of water and organic fluids ............................................... 12
Figure 13 T-S diagram for dry fluids (Pentane) ........................................................................... 13
Figure 14 T-S diagram for wet fluids (Water) ............................................................................. 14
Figure 15 T-S diagram for isentropic fluids (R134a) .................................................................... 14
Figure 16 T-S diagram for TFC using R254fa ............................................................................... 15
Figure 17 T-S diagram for wet vapour cycle using R254fa ......................................................... 16
Figure 18 T-S diagram for superheated cycle using R254fa ........................................................ 16
Figure 19 T-S diagram for supercritical cycle using R134a ......................................................... 17
Figure 20 Shell and tube compared to plate and frame heat exchangers .................................. 21
Figure 21 Result of ORC survey ................................................................................................... 31
Figure 22 Reported efficiency vs. waste heat source temperature curve for commercial systems
.................................................................................................................................................... 31
Figure 23 Criteria list for evaluation working fluids .................................................................... 36
Figure 24 List of working fluids selected and their properties .................................................... 37
Figure 25 Cycle efficiency vs. waste heat source inlet temperature comparison for few working
fluids ............................................................................................................................................ 38
Figure 26 Net power output vs. waste heat source inlet temperature comparison for few
working fluids .............................................................................................................................. 38
Figure 27 Performance of heat transfer fluids (source: Honeywell) ........................................... 40
Figure 28 Schematic ORC system layout for the simulated case ................................................ 42
Figure 29 T-S diagram for feed pump representing losses .......................................................... 44
Figure 30 T-S diagram for expander representing losses ............................................................ 45
Figure 31 Losses during transporting fluid in the ORC ................................................................ 46
Figure 32 Power plant performance prediction program ........................................................... 48
Figure 33 Input & output parameters for the P5 ORC model...................................................... 49
Figure 34 Plate heat exchanger (source: Nordic group) ............................................................. 51
Figure 35 Temperature vs. Dryness change in boiler showing pressure drop ............................. 55
Figure 36 Temperature change of working fluid and waste heat source along the heat
exchanger length (assumption for LMTD) .................................................................................. 56
Figure 37 Preheater evaporator layout for simulation analysis ................................................. 57
Figure 38 Temperature profile vs. Heat transferred in the preheater and evaporator for the
simulated ORC case ..................................................................................................................... 57
v
Figure 39 Expander generator layout for simulation analysis .................................................... 64
Figure 40 Net power output vs. Coolant inlet temperature trend for cooling tower and water
cooled condensers ....................................................................................................................... 66
Figure 41 Net power output vs. Heat exchanger area trend for cooling tower and water cooled
condensers .................................................................................................................................. 69
Figure 42 Condenser layout for simulation analysis ................................................................... 71
Figure 43 Feed pump layout for simulation analysis .................................................................. 74
Figure 44 T-S diagram for the simulated cycle ............................................................................ 83
Figure 45 P-h diagram for the simulated cycle ........................................................................... 83
Figure 46 Power absorbed and rejected in the simulated ORC case ........................................... 84
Figure 47 Heat transfer as a function of temperature for single phase heating medium .......... 85
Figure 48 Relationship between maximum working fluid temperature and the amount heat
absorbed for fixed waste heat inlet condition ............................................................................ 86
Figure 49 Effect of heat source exit temperature on cycle efficiency and net power out with
fixed waste heat inlet condition .................................................................................................. 86
Figure 50 Effect of ORC cycle pressure on cycle and heat recovery efficiency ............................ 87
Figure 51 Optimal cycle and heat recovery point selection with varying heat absorbed in the
boiler as a result of feed pump pressure ..................................................................................... 88
Figure 52 Effect of coolant temperature on net power output and heat rejected in the
condenser for fixed waste heat ................................................................................................... 89
Figure 53 Effect of coolant temperature on cycle and overall conversion efficiency for fixed
waste heat................................................................................................................................... 89
Figure 54 T-s diagram illustrating the effect of reducing condensing temperature with fixed
waste heat................................................................................................................................... 90
Figure 55 Mechanical power losses in the simulated ORC case .................................................. 91
Figure 56 Variation and trade off between power output and cycle efficiency .......................... 92
Figure 57 Minimum instrumentation diagram to validate simulation results ............................ 93
Figure 58 Error analysis and off design prediction of components using P5 ORC model [69] .... 93
vi
Nomenclature
T Temperature
CP Specific heat
R Coolant temperature rise
Q Heat
U Overall heat transfer coefficient
A Area
UA Surface area function
P Pressure
X Dryness fraction
h Specific enthalpy
η Efficiency
∆ Change
W Power
v Specific volume
S Entropy
k Thermal conductivity
Re Reynolds number
ρ Density
V Velocity
Lp Length of the plate
µ Viscosity
Pr Prandtl number
Nu Nusselt number
H Convective heat transfer coefficient
x Thickness of the plate
μcf Capacity factor
Pal Average load for the power plant for a period
Prl Rated capacity for the power plant
φee Economic efficiency
vii
BELT Belt drive
BOIL Boiler
COOL Coolant
COOLP Coolant pump
COND Condenser
CONT Controls
EVP Evaporator
GEN Generator
GWP Global warming potential
HEX Heat exchangers
LGH Low grade heat
LMTD Log mean temperature difference
MFR Mass flow rate
ORC Organic Rankine cycle
ODP Ozone depletion potential
P5 Power Plant Performance Prediction Program
PD Pressure drop
PHE Plate heat exchangers
PP Pinch point
PR Pressure ratio
PRE Preheater
PAR Parasitic
REF Reference state
TSE Twin screw expander
VER Volumetric expansion ratio
VFR Volumetric flow rates
WHR Waste heat recovery
WHS Waste heat source
viii
Abstract
The prediction of the performance of energy systems that recover power from low grade heat
is one of the most important requirements for reducing their investment cost and optimising
system efficiency. The aim of this work was to study, model and analyse an Organic Rankine
cycle (ORC) system using a twin screw expander to generate the power output, with HFC-
245fa, as the working fluid. A software package (Power Plant Performance Prediction
Program), simulating ORC system performance was therefore prepared for this purpose. Major
components were represented by proper units and relations between the system’s
constituents defined. The preferred analytical procedure depends on both the system
complexity and the requirements of the study. In this case, the whole cycle was simulated in
order to obtain a good understanding of its behaviour with the aim of estimating its optimum
operating conditions. The procedure adopted was to start from a basic case and then improve
it, in a realistic way, in order to evaluate the system potential. Performance indicators, like
thermal efficiency, specific net output, total UA and surface of the heat exchangers, as well as
the relative cost of the system all need to be taken into account but it is impossible to optimise
all of them simultaneously. The design value for these parameters is therefore a matter of
choice, or compromise.
Efficiencies of ORC systems were calculated based on the assumption that the working fluid
entered the expander as wet vapour. For the heat source and sink conditions chosen for this
study, the overall cycle efficiency was estimated as approximately 6% using R245fa. This and
the power output are highly dependent on the ambient air temperature when using air-cooled
condensers. Allowing for a small degree of subcooling at the condenser exit, it is shown that
the heat recovery should be maximised.

1
Chapter 1 Introduction and literature review
1.1 Industrial waste heat
In a typical developed country as much as 40% of the total fuel consumption is used for
industrial and domestic space heating and process heating. Of this, around one third is wasted
[1]. Low grade heat has generally been discarded by industry and has become an
environmental concern because of thermal pollution. This wasted heat can be lost to the
atmosphere at all stages of a process, through inefficient generation, transmission, or during
final use of the energy. This has led to the search for technologies which not only reduce the
burden on non-renewable sources of energy but also take steps toward a cleaner
environment. Also, given the growing scarcity of primary energy resources, achieving increased
efficiency of energy conversion processes is one of the key challenges for optimising primary
energy use. From this perspective, low temperature waste heat from various processes is
becoming more and more attractive as a secondary energy source.
Waste heat can be recovered either directly or more commonly, indirectly. Direct heat
recovery is often the cheaper option, but its use is restricted by location and contamination
considerations. In indirect heat recovery, two fluid streams are separated by a heat transfer
surface. Devices that convert low grade heat to electricity and can be retro-fitted to existing
plants to increase their efficiency and contribute to their emission reductions are of great
interest. Used in this way, technologies that convert low grade heat to electricity can be
advantageous on two fronts. Firstly by the improvement of the efficiency of current
technology and also in application to sustainable energy sources that are, to date, unexploited.
One approach which is found to be highly effective in addressing the above mentioned issues
is to make use of low grade heat to generate electric power in an Organic Rankine cycle (ORC)
system. For low to medium temperature heat sources, organic working fluids offer advantages
over water as the working medium, as used in conventional Rankine cycle systems, by
increasing the cycle efficiency, thereby enabling more power to be generated. This has been
shown to be particularly promising for decentralized combined heat and power production [2].
The recovery of waste heat has a direct effect on the efficiency of the process. This results in
both reduced utility consumption and process costs. It also reduces the fuel consumption,
which leads to reduction in the flue gas produced. This permits equipment sizes of all flue gas
handling equipment such as fans, stacks, ducts, burners, etc. to be reduced in addition to
reducing atmospheric pollution.

2
1.1.2 ORC for waste heat recovery
An ORC system, using an organic fluid instead of water as the working fluid is feasible in heat
recovery from geothermal resources, exhaust gases of gas turbines and waste heat from
industrial plants. The success of the ORC technology can be partly explained by its modular
feature. This success is reinforced by the high technological maturity of most of its
components due to their extensive use in refrigeration applications [3]. Moreover, such
systems are more suitable for local and small scale power generation than conventional power
generation systems. Today, they are commercially available in the MW power range. Many
units have been installed for recovering power from geothermal and waste heat. However,
very few have been installed in the kW range of outputs [3].
Low grade heat (80°C to 200°C) as in the industrial waste heat stream, solar heat trapped by
collectors with low to medium ratios of concentration, low temperature geothermal sources,
and cooling water streams of stationary engines are some of the sources that have been
proposed which can be effectively used in ORC systems, as shown in figure 1 [3].
Figure 1 Various available waste heat sources for ORC
The most important characteristic of waste heat sources is the extent of their availability, the
temperature at which they are available, the temperature of the cooling medium, and the cost
of converting the waste heat into useful power. Currently the market for ORC power systems
lies in the range of hundreds of millions of U.S. dollars annually [4]. In the short term, an
increase in environmental regulations will likely be the first catalyst to drive the market to a
higher level before an increase occurs in the price of fossil fuels. Thus, the first area in which
ORCs will find a potentially large market will be in kW scale waste heat utilization. Also the
utilisation of waste heat will continue to increase due to the ongoing international effort to
reduce the emission of greenhouse gases.
3
1.2 Objectives and methodology
Current research trends can essentially be divided into three sub-areas, namely ORC plant
engineering, working fluids and process simulation. Due to the enormous practical relevance
of this technology, there are some complex overlaps between these three sub-areas with
regard to the optimisation approaches that are taken. Optimising the plants by converting the
waste heat into electricity in an ORC process at low temperature is a relatively cost intensive
solution due to the investment involved, but one that leads directly to increased efficiency.
The thermodynamic and economic performance of ORC systems are influenced by a
multiplicity of factors, including resource characteristics, single phase or two-phase expansion,
the thermodynamic cycle configuration, subsystem characteristics, fuel cost, subsystem design
and off-design efficiency factors, working fluid characteristics, and the selected independent
thermodynamic process states.
Hence, predicting the performance of ORC systems that recover power from low grade heat is
one of the most important requirements for reducing their investment cost and optimising
system efficiency. The objectives of this project therefore was to study, model and analyse an
design point ORC system using a twin screw expander to generate power using HFC-245fa, as
the working fluid. The methodology in achieving this involved preparing a software code called
Power Plant Performance Prediction Program to simulating ORC system behaviour using
performance indicators, like thermal efficiency, specific net output, total UA and surface of the
heat exchangers. This software was further used to report the sensitivity of the ORC system.
1.3 Determining the waste heat
Quality: When recovering waste heat, the quality of waste heat must be considered first.
Depending upon the type of process, waste heat can be discarded at virtually any temperature
from that of chilled cooling water to high temperature waste gases in an industrial furnace or
kiln. Usually, higher temperatures equate to higher quality of heat recovery and greater cost
effectiveness. The strategy of how to recover this heat depends in part on the temperature of
the waste heat gases and the economics involved. If some of this waste heat could be
recovered, a considerable amount of primary fuel could be saved. The energy lost in waste
gases cannot be fully recovered however, much of the heat could be recovered and loss
minimized.
Quantity: In any heat recovery situation it is essential to know the amount of heat
recoverable. Calculating quantity of waste heat is given as: Q = MFR x Cp x ΔT
4
1.4 Energy conversion in ORC
The current market niche for ORC systems depends on simplicity and affordability. The benefit
of the technologies discussed in this thesis will demonstrate that the basic ORC is the favoured
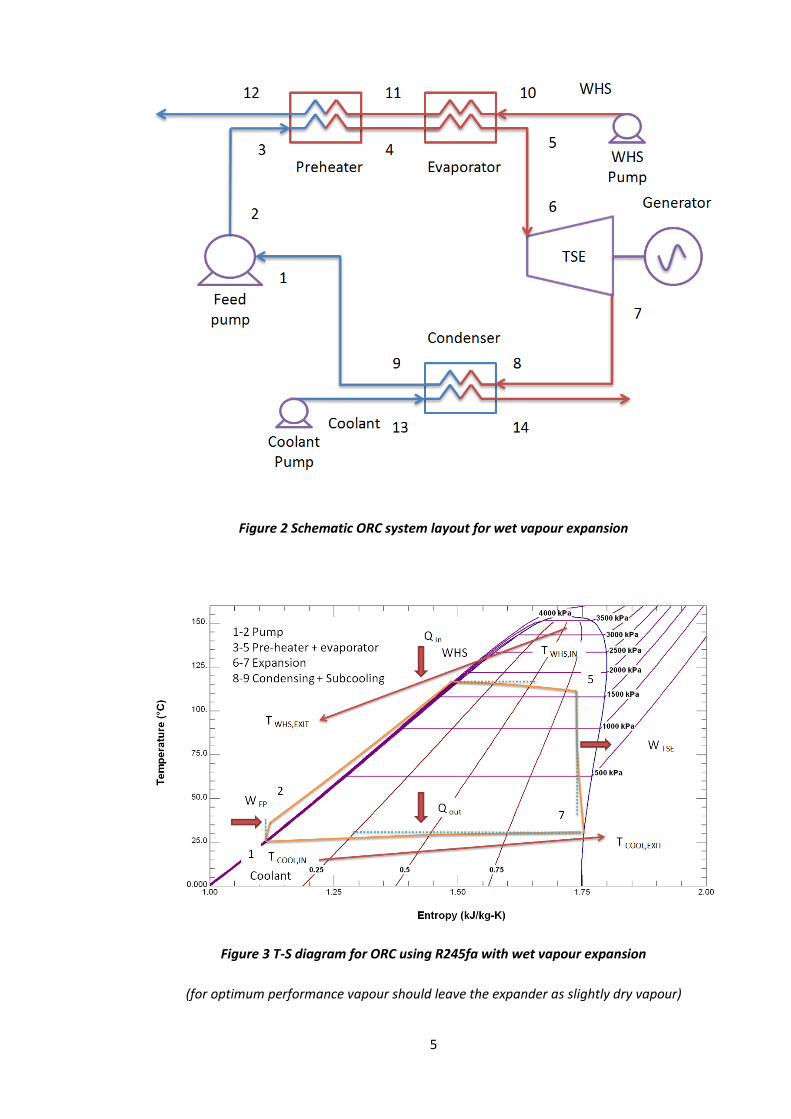
configuration and this has therefore been the focus of investigation and analysis. The systems
considered are for the expansion of wet vapour as shown in figure 2, and superheated vapour,
as shown in figure 4.
The working fluid operates in a sealed, closed-loop cycle. The stream of geothermal brine or
any other fluid carrying source heat enters the system through the network of heat exchangers
in which heat is transferred to the working fluid. Typically, there are two stages of heat
exchange, one occurring in a preheater, where the temperature of the working fluid is raised
to its boiling point and the other in an evaporator, where the working fluid is vaporized.
However, when the fluid is to be superheated, a third heat exchanger, the superheater, is
added.
After heat addition, high-pressure wet vapour is expanded. The exhaust of the organic fluid
from this process can be anywhere between wet or superheated vapour, as a result of the
characteristic retrograde shape of the working fluid saturation line. A superheated stream of
exhaust vapour may enter directly to the condenser, where it is cooled and condensed.
However, if economically feasible, it may first pass through another heat exchanger, the
regenerator, which recovers part of the energy of the superheated vapour and transfers it to
the liquid working fluid entering a preheater. After leaving the condenser, the liquid must be in
the sub-cooled state at the pump inlet in order to avoid the onset of cavitation. The working
fluid enters the pump, where its pressure is increased and returned directly, or through the
regenerator, to the preheater.
5
Figure 2 Schematic ORC system layout for wet vapour expansion
Figure 3 T-S diagram for ORC using R245fa with wet vapour expansion
(for optimum performance vapour should leave the expander as slightly dry vapour)

6
Figure 4 Schematic superheated ORC system layout
Figure 5 T-S diagram for superheated ORC using R245fa
7
1.5 Other ORC arrangements
1.5.1 Regenerator
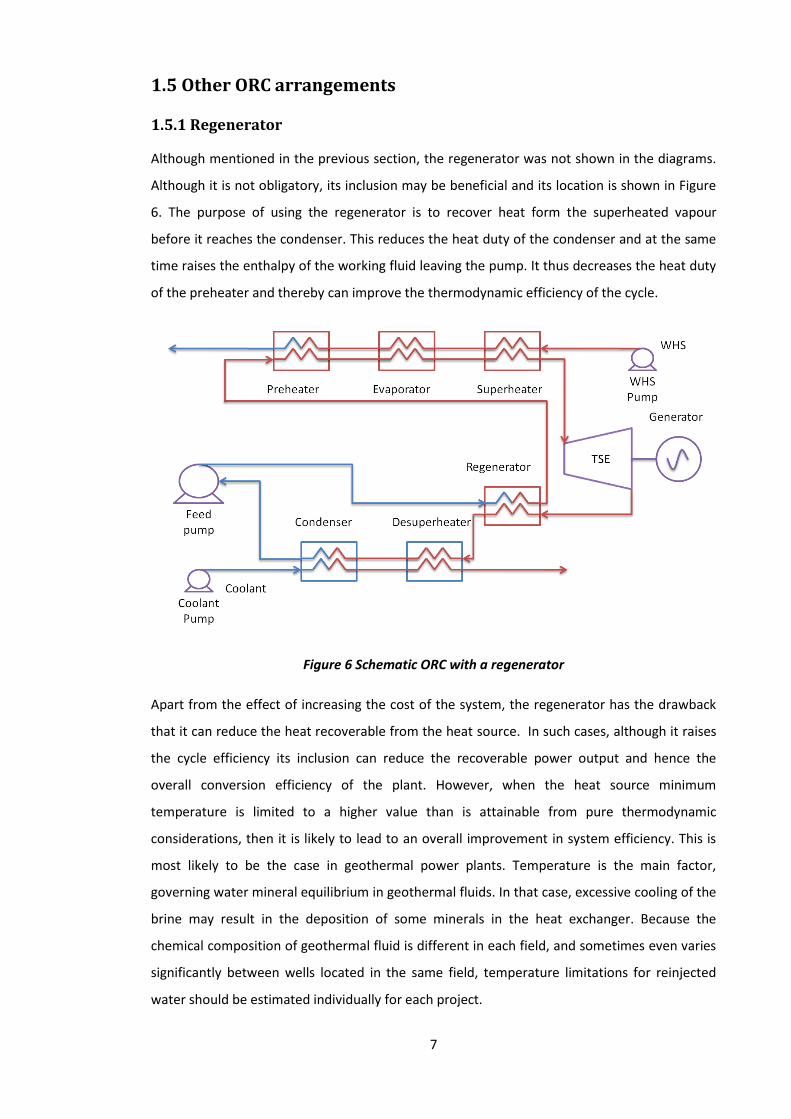
Although mentioned in the previous section, the regenerator was not shown in the diagrams.
Although it is not obligatory, its inclusion may be beneficial and its location is shown in Figure
6. The purpose of using the regenerator is to recover heat form the superheated vapour
before it reaches the condenser. This reduces the heat duty of the condenser and at the same
time raises the enthalpy of the working fluid leaving the pump. It thus decreases the heat duty
of the preheater and thereby can improve the thermodynamic efficiency of the cycle.
Figure 6 Schematic ORC with a regenerator
Apart from the effect of increasing the cost of the system, the regenerator has the drawback
that it can reduce the heat recoverable from the heat source. In such cases, although it raises
the cycle efficiency its inclusion can reduce the recoverable power output and hence the
overall conversion efficiency of the plant. However, when the heat source minimum
temperature is limited to a higher value than is attainable from pure thermodynamic
considerations, then it is likely to lead to an overall improvement in system efficiency. This is
most likely to be the case in geothermal power plants. Temperature is the main factor,
governing water mineral equilibrium in geothermal fluids. In that case, excessive cooling of the
brine may result in the deposition of some minerals in the heat exchanger. Because the
chemical composition of geothermal fluid is different in each field, and sometimes even varies
significantly between wells located in the same field, temperature limitations for reinjected
water should be estimated individually for each project.
8
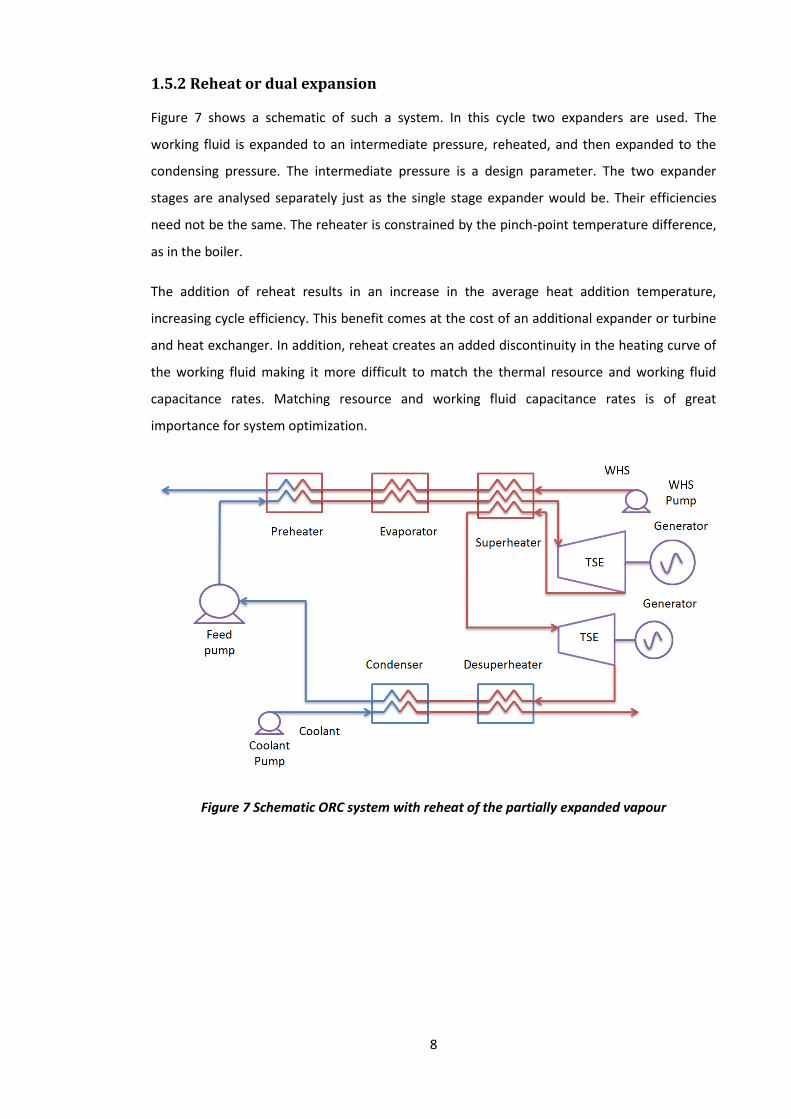
1.5.2 Reheat or dual expansion
Figure 7 shows a schematic of such a system. In this cycle two expanders are used. The
working fluid is expanded to an intermediate pressure, reheated, and then expanded to the
condensing pressure. The intermediate pressure is a design parameter. The two expander
stages are analysed separately just as the single stage expander would be. Their efficiencies
need not be the same. The reheater is constrained by the pinch-point temperature difference,
as in the boiler.
The addition of reheat results in an increase in the average heat addition temperature,
increasing cycle efficiency. This benefit comes at the cost of an additional expander or turbine
and heat exchanger. In addition, reheat creates an added discontinuity in the heating curve of
the working fluid making it more difficult to match the thermal resource and working fluid
capacitance rates. Matching resource and working fluid capacitance rates is of great
importance for system optimization.
Figure 7 Schematic ORC system with reheat of the partially expanded vapour
9
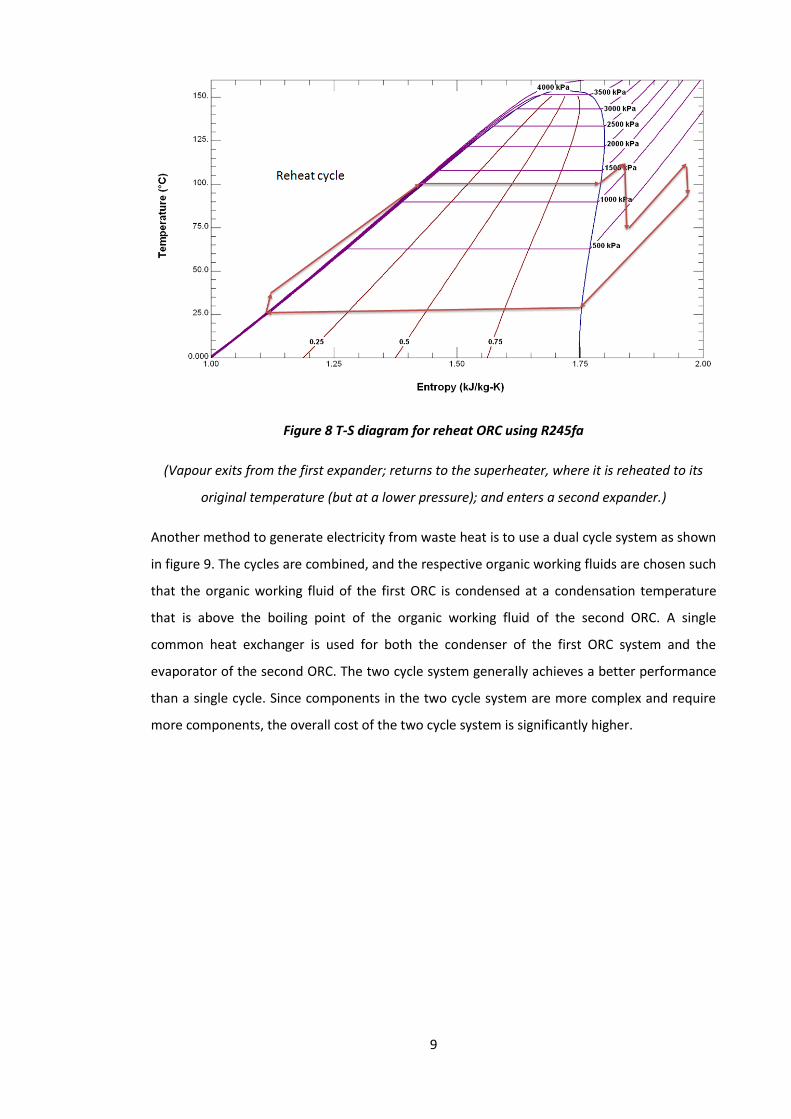
Figure 8 T-S diagram for reheat ORC using R245fa
(Vapour exits from the first expander; returns to the superheater, where it is reheated to its
original temperature (but at a lower pressure); and enters a second expander.)
Another method to generate electricity from waste heat is to use a dual cycle system as shown
in figure 9. The cycles are combined, and the respective organic working fluids are chosen such
that the organic working fluid of the first ORC is condensed at a condensation temperature
that is above the boiling point of the organic working fluid of the second ORC. A single
common heat exchanger is used for both the condenser of the first ORC system and the
evaporator of the second ORC. The two cycle system generally achieves a better performance
than a single cycle. Since components in the two cycle system are more complex and require
more components, the overall cost of the two cycle system is significantly higher.

10
Figure 9 Schematic layout for dual ORC systems
1.6 Expanders
Performance of the ORC system is directly dependent on that of the expander. The choice of
machine for this purpose strongly depends on the operating conditions and on the power
output. Two main types of machines can be distinguished: these are turbines and positive
displacement types.
Positive displacement type machines, like a twin screw expander as shown in figure 10 are
more appropriate for small scale ORC units [4], because they are characterized by lower flow
rates, higher pressure ratios and much lower rotational speeds than turbines. In some
operating conditions liquid may appear at the inlet of expansion. This could be a threat of
damage for turbo-machines but not for scroll and screw expanders.
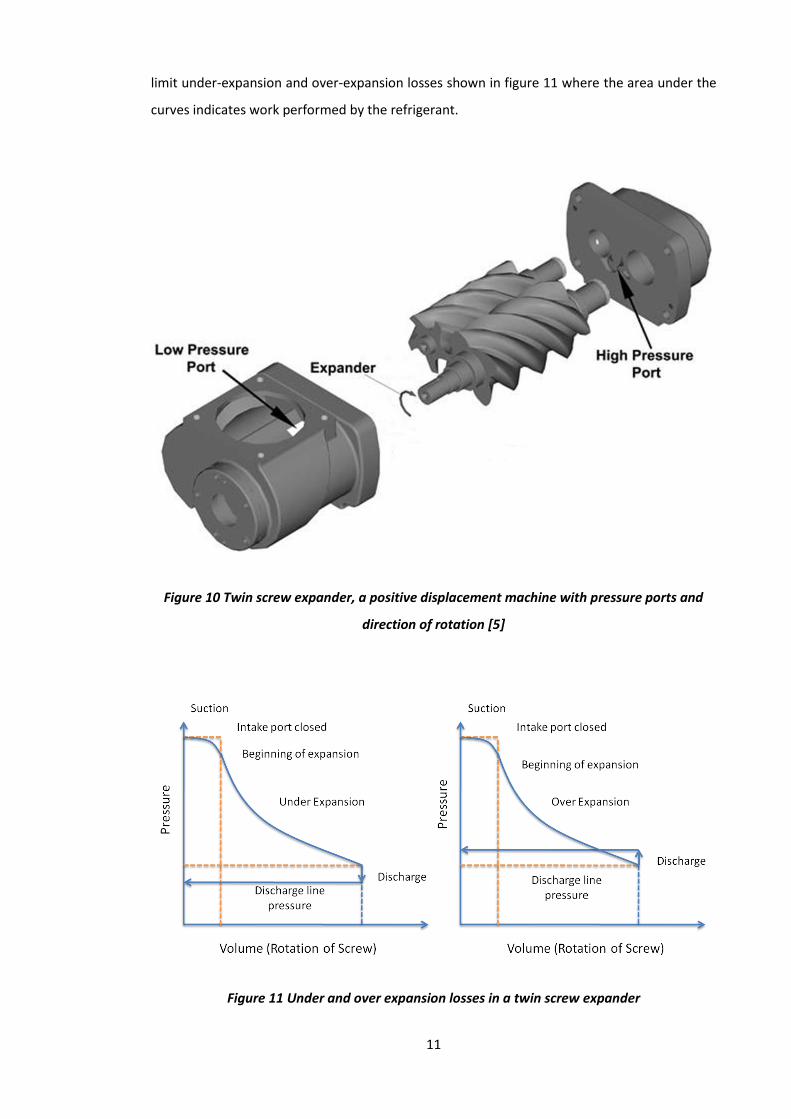
Expanders (scroll, screw, vanes) are characterized by a fixed built-in volume ratio. To optimize
their performance, this built-in volume ratio should match the operating conditions in order to
11
limit under-expansion and over-expansion losses shown in figure 11 where the area under the
curves indicates work performed by the refrigerant.
Figure 10 Twin screw expander, a positive displacement machine with pressure ports and
direction of rotation [5]
Figure 11 Under and over expansion losses in a twin screw expander
12
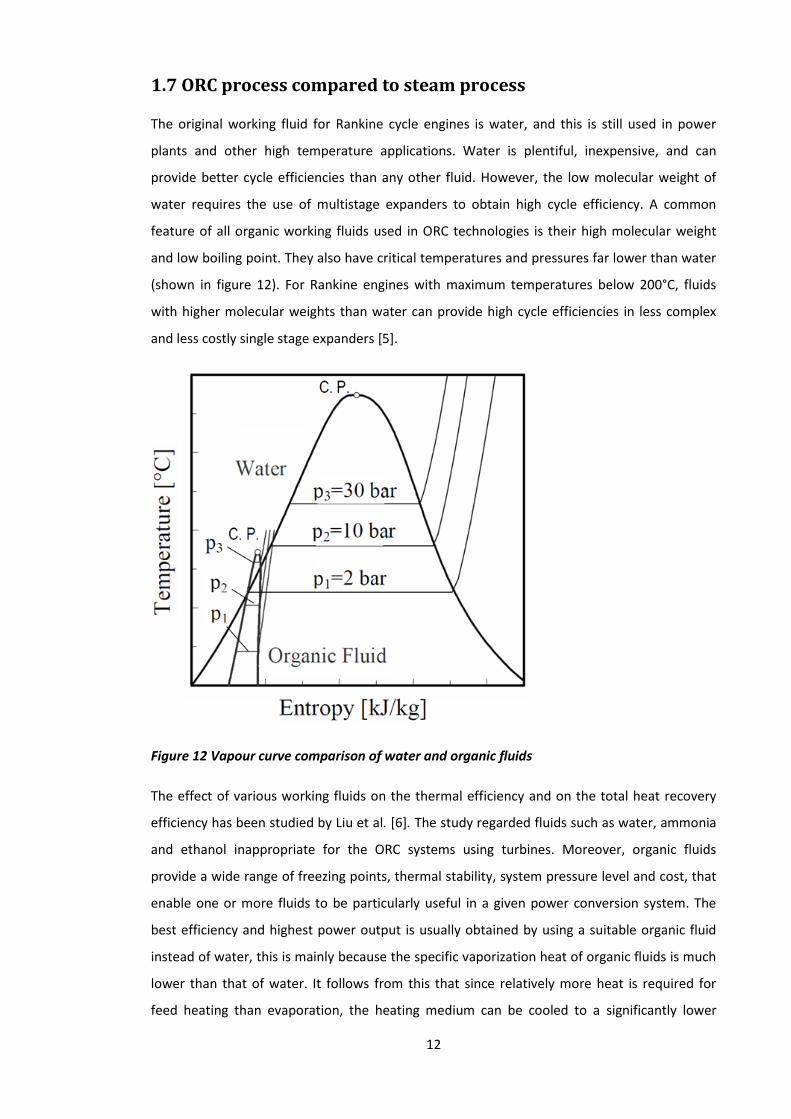
1.7 ORC process compared to steam process
The original working fluid for Rankine cycle engines is water, and this is still used in power
plants and other high temperature applications. Water is plentiful, inexpensive, and can
provide better cycle efficiencies than any other fluid. However, the low molecular weight of
water requires the use of multistage expanders to obtain high cycle efficiency. A common
feature of all organic working fluids used in ORC technologies is their high molecular weight
and low boiling point. They also have critical temperatures and pressures far lower than water
(shown in figure 12). For Rankine engines with maximum temperatures below 200°C, fluids
with higher molecular weights than water can provide high cycle efficiencies in less complex
and less costly single stage expanders [5].
Figure 12 Vapour curve comparison of water and organic fluids
The effect of various working fluids on the thermal efficiency and on the total heat recovery
efficiency has been studied by Liu et al. [6]. The study regarded fluids such as water, ammonia
and ethanol inappropriate for the ORC systems using turbines. Moreover, organic fluids
provide a wide range of freezing points, thermal stability, system pressure level and cost, that
enable one or more fluids to be particularly useful in a given power conversion system. The
best efficiency and highest power output is usually obtained by using a suitable organic fluid
instead of water, this is mainly because the specific vaporization heat of organic fluids is much
lower than that of water. It follows from this that since relatively more heat is required for
feed heating than evaporation, the heating medium can be cooled to a significantly lower
13
temperature. This means, that more heat can be recovered, thereby increasing the electric
power produced from a given heat source.
1.7.1 Organic working fluid classification
A characteristic that must be considered during the selection of a fluid is its saturation vapour
curve. The degree to which fluids are drying or wetting is generally related to the vibrational
degree of freedom available to the fluid molecule. This characteristic affects the fluid
applicability, cycle efficiency, and arrangement of associated equipment in a power generation
system.
Water is a wetting fluid, its vapour saturation curve has a negative slope (δT/δs < 0), resulting
in a two-phase mixture upon isentropic expansion. Most organic fluids show, to varying
degrees, drying behaviour resulting in a superheated vapour upon isentropic expansion. It is
the drying behaviour of organic working fluids that make them superior to water for the
utilization of low-temperature thermal resources and are the selected type of refrigerants for
further analysis.
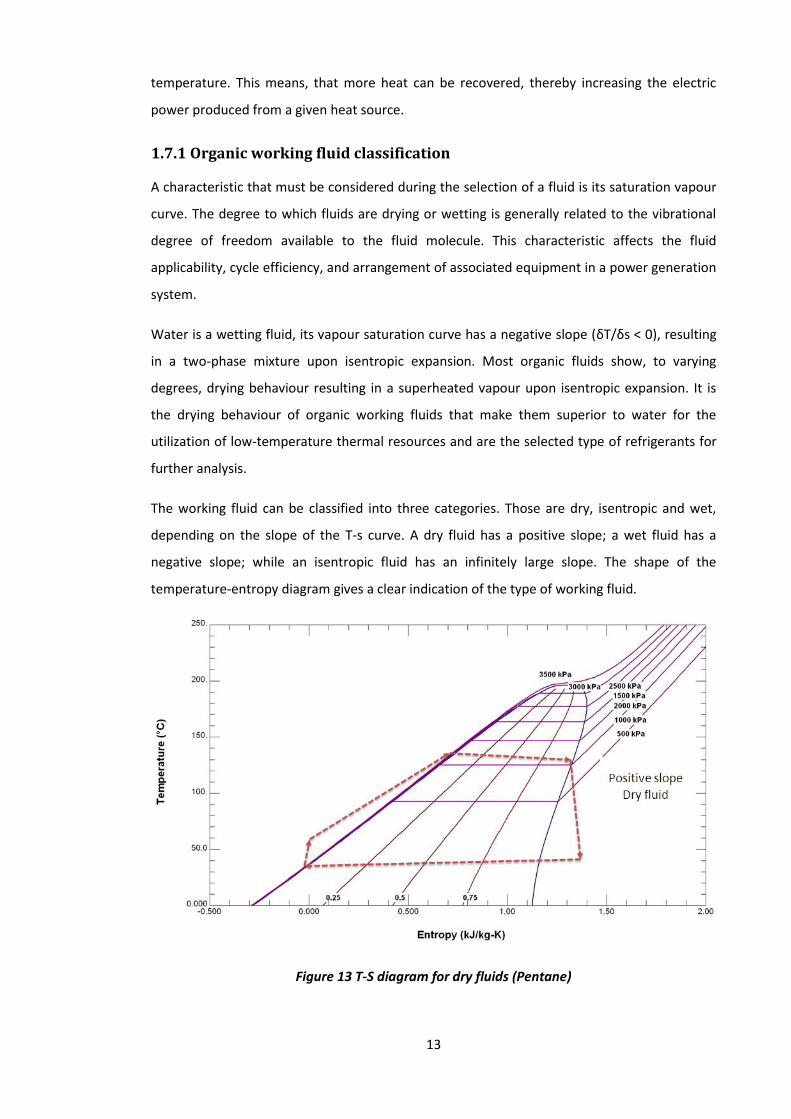
The working fluid can be classified into three categories. Those are dry, isentropic and wet,
depending on the slope of the T-s curve. A dry fluid has a positive slope; a wet fluid has a
negative slope; while an isentropic fluid has an infinitely large slope. The shape of the
temperature-entropy diagram gives a clear indication of the type of working fluid.
Figure 13 T-S diagram for dry fluids (Pentane)
14
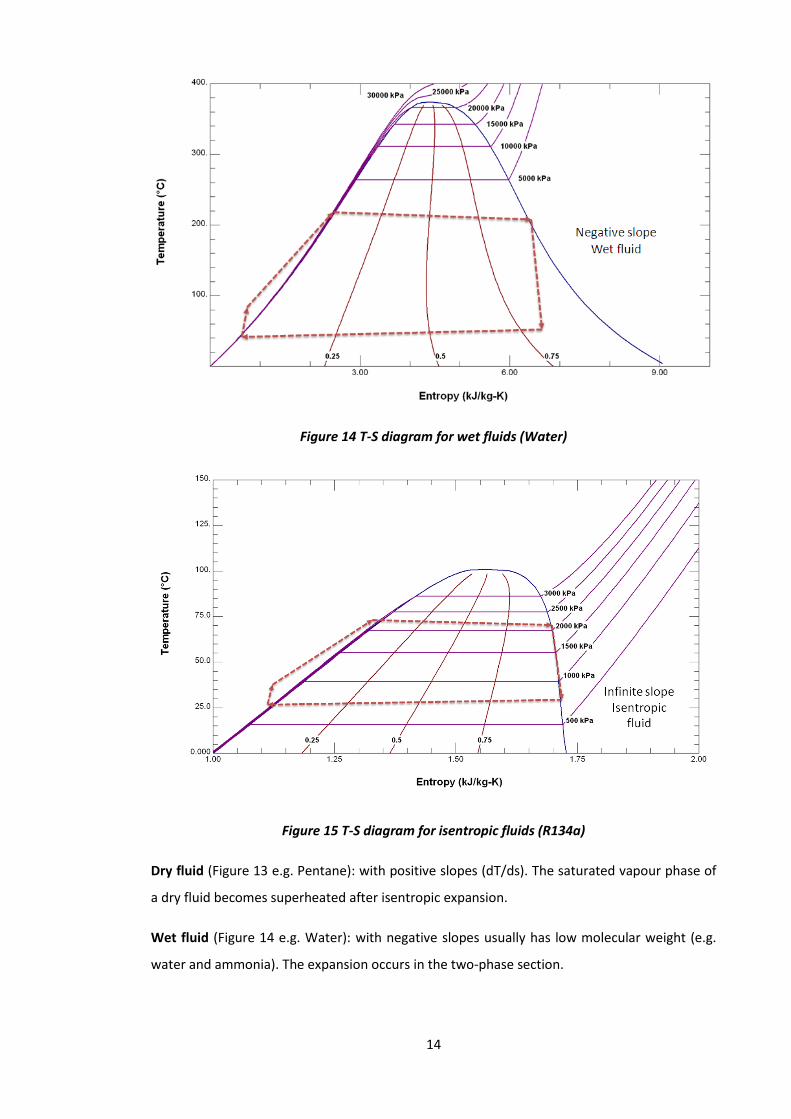
Figure 14 T-S diagram for wet fluids (Water)
Figure 15 T-S diagram for isentropic fluids (R134a)
Dry fluid (Figure 13 e.g. Pentane): with positive slopes (dT/ds). The saturated vapour phase of
a dry fluid becomes superheated after isentropic expansion.
Wet fluid (Figure 14 e.g. Water): with negative slopes usually has low molecular weight (e.g.
water and ammonia). The expansion occurs in the two-phase section.
15
Isentropic fluid (Figure 15 e.g. R134a): Since the vapour expands along a near vertical line on
the T-S diagram, vapour saturated at the expander inlet will remain saturated throughout the
expansion without condensation or will have slight superheat.
1.7.2 Advantages of ORC
ORC systems have advantage in comparison to steam plants. They are compact, due to the
higher densities of the vapour phase. Require fewer stages of expansion. No superheat is
required to avoid wet vapour conditions in the expander exhaust. The smaller ratio between
evaporative heating and liquid heating in the working fluid increases the amount of power that
may be recovered from a particular heat source, dependant on the characteristics of the fluid
chosen. The expander (twin screw expander) operates at a low peripheral speed. This has the
advantage of gear free transmission resulting in long operating life, less maintenance, and
fewer repairs [5]. Most ORC systems are essentially self running and do not need the constant
supervision of a human operator.
1.8 Types of cycles
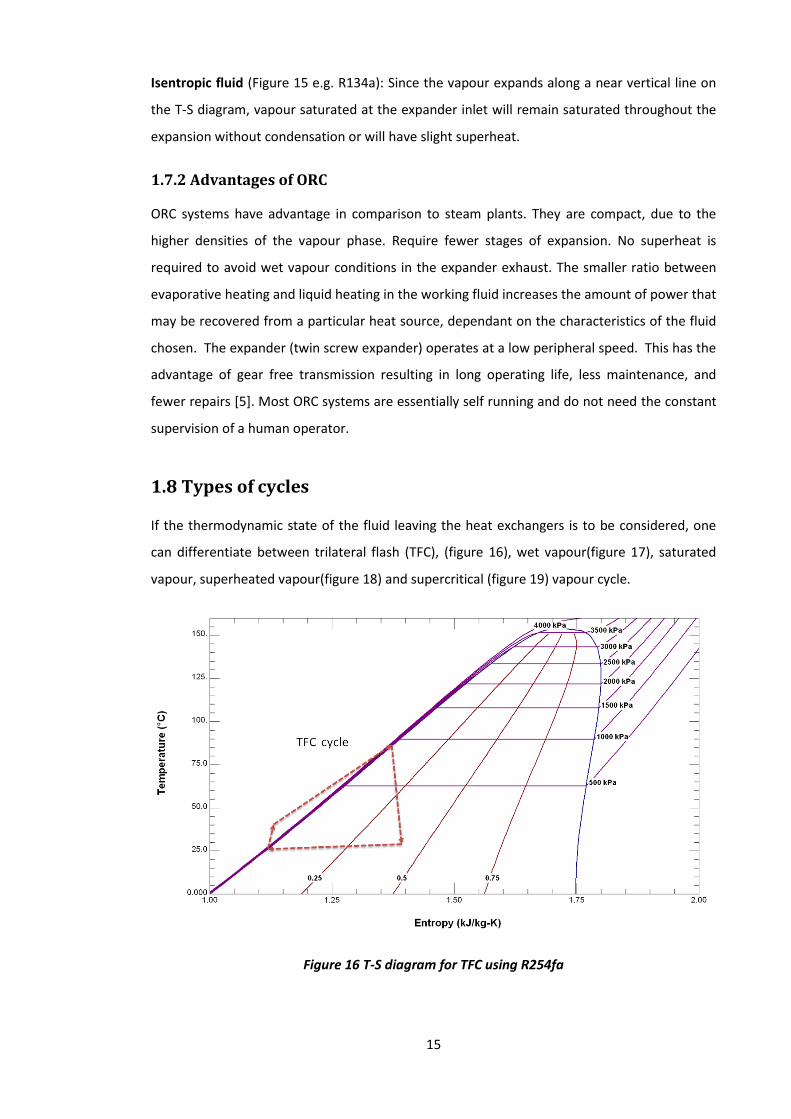
If the thermodynamic state of the fluid leaving the heat exchangers is to be considered, one
can differentiate between trilateral flash (TFC), (figure 16), wet vapour(figure 17), saturated
vapour, superheated vapour(figure 18) and supercritical (figure 19) vapour cycle.
Figure 16 T-S diagram for TFC using R254fa

16
Figure 17 T-S diagram for wet vapour cycle using R254fa
Figure 18 T-S diagram for superheated cycle using R254fa
17
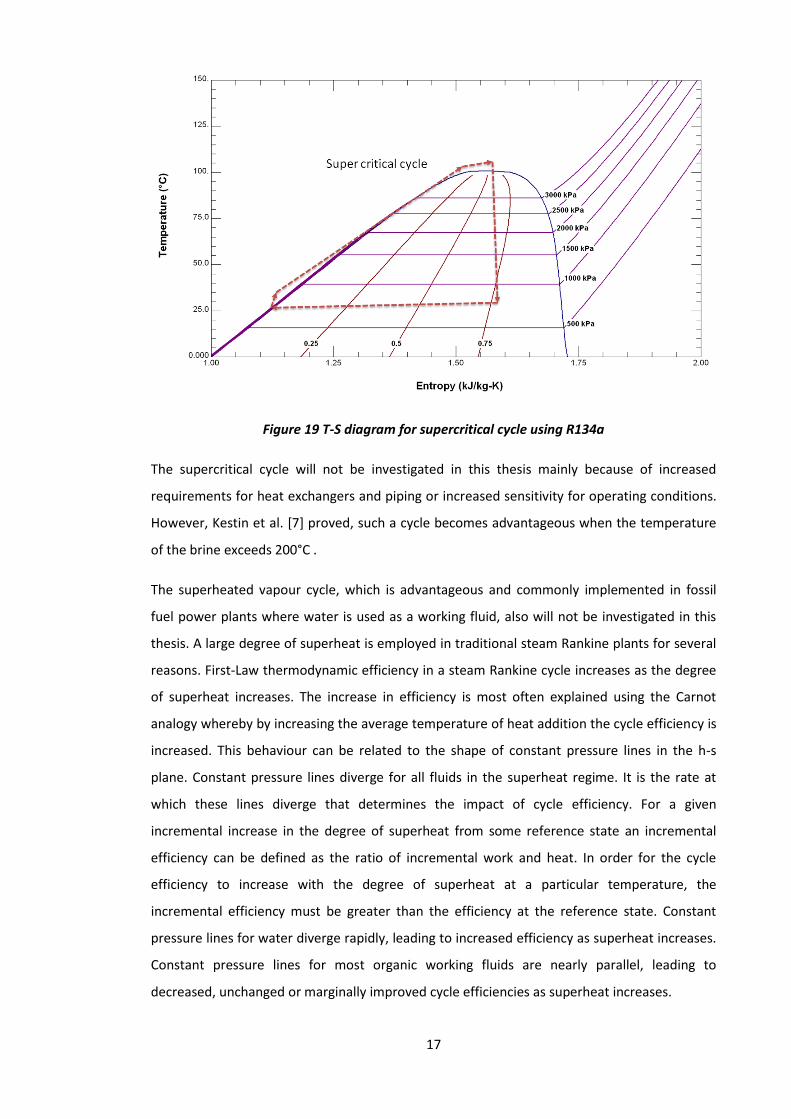
Figure 19 T-S diagram for supercritical cycle using R134a
The supercritical cycle will not be investigated in this thesis mainly because of increased
requirements for heat exchangers and piping or increased sensitivity for operating conditions.
However, Kestin et al. [7] proved, such a cycle becomes advantageous when the temperature
of the brine exceeds 200°C .
The superheated vapour cycle, which is advantageous and commonly implemented in fossil
fuel power plants where water is used as a working fluid, also will not be investigated in this
thesis. A large degree of superheat is employed in traditional steam Rankine plants for several
reasons. First-Law thermodynamic efficiency in a steam Rankine cycle increases as the degree
of superheat increases. The increase in efficiency is most often explained using the Carnot
analogy whereby by increasing the average temperature of heat addition the cycle efficiency is
increased. This behaviour can be related to the shape of constant pressure lines in the h-s
plane. Constant pressure lines diverge for all fluids in the superheat regime. It is the rate at
which these lines diverge that determines the impact of cycle efficiency. For a given
incremental increase in the degree of superheat from some reference state an incremental
efficiency can be defined as the ratio of incremental work and heat. In order for the cycle
efficiency to increase with the degree of superheat at a particular temperature, the
incremental efficiency must be greater than the efficiency at the reference state. Constant
pressure lines for water diverge rapidly, leading to increased efficiency as superheat increases.
Constant pressure lines for most organic working fluids are nearly parallel, leading to
decreased, unchanged or marginally improved cycle efficiencies as superheat increases.
18
Note that ORC efficiency only degrades in the absence of any form of recuperation or energy
recovery. As the degree of superheat increases for an organic working fluid, the amount of
available energy at the expander exit also increases. Efforts to increase the average
temperature of heat addition must always be considered along with energy recovery in order
to optimize cycle efficiency. Therefore a significant amount of superheat added to the
hydrocarbon working fluid has the effect of a relatively small increase of power output. Hence,
the cycles studied here are for wet & saturated vapour admission to the expander, due to their
practical relevance.
1.9 Design boundary conditions
Design boundary conditions for the model of an ORC should be carefully chosen in order to
assure the best performance of the unit under its future operating conditions. The factors
which effect of performance of ORC power plant in the greatest way and have to be assessed
before the design process are, design temperature of heat source, mass flow and type of fluid
used as a heat source. The mass flow of heat source fluid directly affects the power output of a
plant. With all other boundary conditions fixed, optimal power capacity as well as the size of
heat exchangers is almost proportional to the mass flow of the waste heat source. From an
economic point of view, if the price of fuel is fixed, in almost all circumstances a high rated
power plant is favoured over a small unit. That is because the specific cost of each component
is dependent on its size. It is usually high for small units and decreases exponentially with the
size.
A solution to these two problems exists, although it is not a perfect one. It takes advantage of
an obvious feature of standardized units. Because of identical construction and performance,
such units can work in a parallel network, where the flow of the heat source fluid is distributed
equally across several units. Such a design provides a chance for a close fit of designed capacity
to the available flow. The smaller the elementary unit is, the better the achievable match will
be. However, compromise has to be found between the close fit of supply and demand and
increased costs caused by the small size of the elementary unit, additional piping etc.
Other issues linked to the development of a waste heat recovery system involve assessing,
upset conditions occurring in the plant due to heat recovery, availability of space etc. It is also
necessary to evaluate the selected waste heat recovery system on the basis of financial
analysis such as investment, depreciation, payback period, rate of return etc.

19
1.9.1 Standardised units
However, waste recovery is still a challenge it would be desirable to have a system that
effectively recovers waste heat over a wide temperature range from multiple low grade heat
sources. Implementing process integration in the industry can be time consuming and
complicated. Therefore, it is recommended to concentrate on simple and standard off the
shelf solutions. The advantages of standard systems compared to custom made systems are
that these can be designed quickly and that the heat recovery network, which is generated, is
reliable. The duplication of simple network structures also makes it possible to reuse the
operation and maintenance procedures.
20
1.10 Literature review
1.10.1 Heat exchangers technologies for ORC
In heat exchanger design, there are three types of flow arrangements: counter-flow, parallel-
flow, and cross-flow. Compare to other flow arrangements counter flow is the most efficient
design because it transfers the greatest amount of heat. For efficiency, heat exchangers are
designed to maximize the surface area of the wall between the two fluids, while minimizing
resistance to fluid flow.
The basic designs for heat exchangers are the shell-and-tube heat exchanger and the plate
heat exchanger, although many other configurations have been developed. Shell and tube
heat exchangers consist of a series of tubes so that it can either provide or absorb the heat
required. A set of tubes is called the tube bundle and can be made up of several types of
tubes; plain, longitudinally finned, etc. The shell is inherently weaker than the tubes so that
the higher-pressure fluid is circulated in the tubes while the lower pressure fluid flows through
the shell. When a vapor contains the waste heat, it usually condenses, giving up its latent heat
to the liquid being heated. In this application, the vapor is almost invariably contained within
the shell. If the reverse is attempted, the condensation of vapors within small diameter parallel
tubes causes flow instabilities [1]. Tube and shell heat exchangers are available in a wide range
of standard sizes with many combinations of materials for the tubes and shells. Shell and tube
heat exchangers are typically used for high-pressure applications (with pressures greater than
30 bar and temperatures greater than 260 °C). This is because shell and tube heat exchangers
are robust due to their shape.
Another type of heat exchanger is the plate heat exchanger. One is composed of multiple, thin,
slightly-separated plates that have very large surface areas and fluid flow passages for heat
transfer. This stacked-plate arrangement can be more effective, in a given space, than the shell
and tube heat exchanger. Advances in gasket and brazing technology have made the plate-
type heat exchanger increasingly practical. Research conducted by Chammas et al. [8] proved
the possibility of using plate heat exchanger for boiler and condenser when operating with
organic working fluids. The plate heat exchanger has been selected since it represents high
effectiveness with a compact size and volume. The effectiveness of the heat transfer process in
the boiler and condenser depends essentially on the mean temperature difference at which
the heat is delivered or rejected, and the heat transfer coefficients of the working fluid on the
both sides of the heat exchangers.
21
Advantages Disadvantages
Shell and
tube
type
Less expensive as compared to Plate
type,
Can be used in systems with higher
operating temperatures and pressures,
Pressure drop across a tube cooler is
less,
Tube leaks are easily located and
plugged since pressure test is
comparatively easy,
Heat transfer efficiency is less
compared to plate type,
Capacity cannot be increased,
Requires more space in comparison to
plate type,
Plate and
frame
type
Simple and Compact in size,
Heat transfer efficiency is more,
Capacity can be increased by
introducing plates in pairs,
Turbulent flow help to reduce deposits
which would interfere with heat
transfer,
Initial cost is high,
Finding leakage is difficult since
pressure test is not as ease,
Bonding material between plates
limits operating temperature,
Pressure drop caused is higher than
tube type,
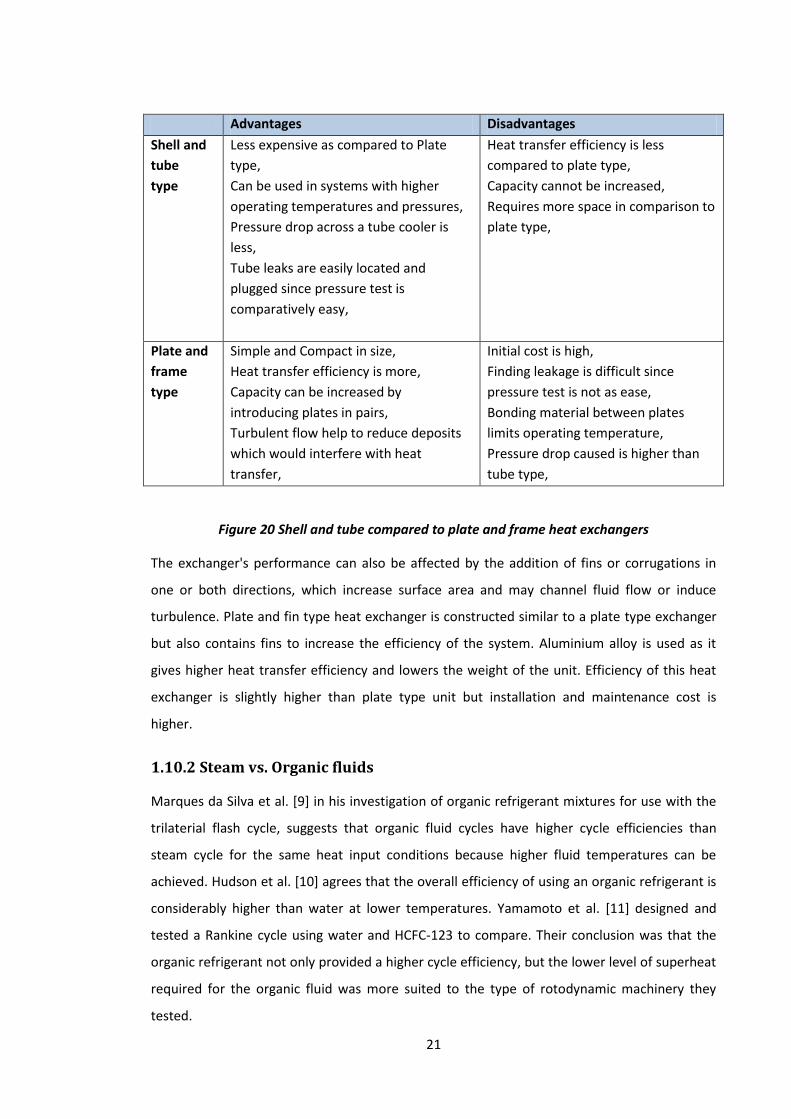
Figure 20 Shell and tube compared to plate and frame heat exchangers
The exchanger's performance can also be affected by the addition of fins or corrugations in
one or both directions, which increase surface area and may channel fluid flow or induce
turbulence. Plate and fin type heat exchanger is constructed similar to a plate type exchanger
but also contains fins to increase the efficiency of the system. Aluminium alloy is used as it
gives higher heat transfer efficiency and lowers the weight of the unit. Efficiency of this heat
exchanger is slightly higher than plate type unit but installation and maintenance cost is
higher.
1.10.2 Steam vs. Organic fluids
Marques da Silva et al. [9] in his investigation of organic refrigerant mixtures for use with the
trilaterial flash cycle, suggests that organic fluid cycles have higher cycle efficiencies than
steam cycle for the same heat input conditions because higher fluid temperatures can be
achieved. Hudson et al. [10] agrees that the overall efficiency of using an organic refrigerant is
considerably higher than water at lower temperatures. Yamamoto et al. [11] designed and
tested a Rankine cycle using water and HCFC-123 to compare. Their conclusion was that the
organic refrigerant not only provided a higher cycle efficiency, but the lower level of superheat
required for the organic fluid was more suited to the type of rotodynamic machinery they
tested.
22
1.10.3 Organic fluids
Arguably the most crucial selection for any heat engine is the working fluid with which it
operates. All other components are based on the thermodynamic and physical properties of
the working fluid. This is why considerable development has gone into examining such aspects
as favourable selection criteria, the properties of fluid mixtures and the predictive modelling of
fluid behaviour. The selection of the working fluid is critical to achieve high-thermal
efficiencies as well as optimum utilization of the available heat source. Also, the organic
working fluid must be carefully selected based on safety and technical feasibility. There is a
wide selection of organic fluids that could be used in ORC applications. The economics of an
ORC system are strictly linked to the thermodynamic properties of the working fluid.
Hung et al. [12] has shown that the efficiency of the ORC depends on two main factors:
working conditions of the cycle and thermodynamic properties of the working fluids. Different
working fluids have been compared (Benzene, Toluene, p-Xylene, R-113, and R-123). Among
these fluids p-Xylene shows the highest efficiency while benzene shows the lowest. However,
p-Xylene presents the lowest irreversibilities when recovering high temperature waste heat,
while R-113 and R-123 present a better performance in recovering low-temperature waste
heat.
Maizza et al. [13] examined the relative thermodynamic merits of some organic refrigerants
used in low temperature ORC. They modelled using source temperatures between 80°C and
100°C (and various sink temperatures). Isobutane (R600a) and HCFC-123 proved to be the
most efficient. Saleh et al. [14] used alkanes, fluorinated alkanes, ether and fluorinated ethers
as working fluids in ORC for geothermal power plants at high pressures up to 20 bars. They
found the highest thermal efficiency was 0.13 for the high boiling substances with positive
slope in subcritical processes (e.g. n-butane).
Hung et al. [15] studied waste heat recovery of ORC using dry fluids. The results revealed that
irreversibility depended on the type of heat source. Working fluid of the lowest irreversibility
in recovering high temperature waste heat fails to perform favourably in recovering low-
temperature waste heat. Larjola et al. [16] pointed out that higher power output is obtainable
when the temperature of the working fluid more closely follows that of the heat source fluid to
be cooled. In other words, a system has a better performance if the temperature difference
between the heat source and the temperature of the working fluid in an evaporator is reduced
due to its lower irreversibility.
23
From the study of design parameters, Lee et al. [17] concluded that the temperature of
saturated vapour in the evaporator, the condensing temperature in the condenser, the
temperature of superheated vapour flowing out of the superheater and the effectiveness of
the regenerator have significant effects on the economic feasibility of the ORC energy recovery
system, and there exists an economical combination for those parameters. He also pointed out
that the system efficiency of an ORC correlates with the fluid’s normal boiling point, critical
pressure and molecular weight.
Drescher et al. [18] investigated the ORC in solid biomass power and heat plants. He proposed
a method to find suitable thermodynamic fluids for ORCs in biomass plants and found that the
family of alkybenzenes showed the highest efficiency. Chen et al. [19] examined the
performance of a trans-critical CO2 power cycle utilizing energy from low grade heat in
comparison to an ORC using R123 as working fluid. They found that when utilizing the low
grade heat source with equal mean thermodynamic heat rejection temperature, the carbon
dioxide trans-critical power cycle had a slightly higher power output than the ORC.
The use of waste heat from micro turbines to enhance their overall performance by integrating
them with an ORC bottoming cycle was highlighted by Invernizzi et al. [20]. A specific analysis
was conducted to select the most appropriate fluid capable of satisfying both environmental
and technical concerns. With reference to a micro-gasturbine with a size of about 100 kWe, a
combined configuration could increase the net electric power by about 1/3. This result is
achieved by adopting esa-methyl-disiloxane (the simplest olygomer among poly-methyl-
siloxanes) as the working fluid.
1.10.4 Cycle configurations
Mago et al. [21] showed the potential of a regenerative ORC using dry organic fluids to convert
waste heat to power from low-grade heat sources. The different working fluids studied were
R-113, R-245ca, R-123, and isobutene. It was shown that using a regenerator resulted in higher
thermal efficiency and lower irreversibilities. He also showed that using fluids with higher
boiling temperature improved the system performance. Desai et al. [22] found that a basic
ORC can be modified by incorporating both regeneration and turbine bleeding to improve
thermal efficiency. They proposed a methodology for appropriate integration and optimization
of an ORC as a cogeneration process with the background process to generate shaft-work.
Saleh et al. [14] also presented a thermodynamic analysis of ORC’s using several working fluids
and showed that regeneration using an internal heat exchanger improves thermal efficiency in
the case of dry fluids. A small portion of the working fluid may be extracted from the turbine
24
and mixed with the working fluid before it enters the evaporator. Through turbine bleeding,
the mean temperature of heat addition can be increased to increase the thermodynamic
efficiency of the overall power generating cycle. However, it may be noted that the net shaft-
work is reduced due to extraction of the working fluid from the turbine.
1.10.5 Optimization
Hung et al. [12] analysed parametrically and compared the efficiencies of ORCs using cryogens
such as benzene, ammonia, R11, R12, R134a and R113 as working fluids. The results showed
that for operation between isobaric curves, the system efficiency increased for wet fluids and
decreased for dry fluids while the isentropic fluid achieved an approximately constant value for
high turbine inlet temperatures. Isentropic fluids were most suitable for recovering low
temperature waste heat. Even though they compared the ORC performance with different
working fluids and found a suitable working fluid that gave the best ORC performance, they did
not evaluate the performance under the optimization condition. It is not easy to evaluate the
performance of the ORC with different working fluids under different operating parameters
because different operating parameters could result in better or worse performance.
Therefore, it is necessary to evaluate the performance of ORCs with different working fluids
under their optimization conditions.
Wei et al. [23] considered the system performance analysis and optimization of an ORC system
using HFC-245fa as the working fluid and analysed its thermodynamic performance under
disturbances. They found that maximizing the use of exhaust heat was a good way to improve
the system net power output. At high ambient temperatures, the system performance
deteriorated and the net power output deviated from the nominal value by more than 30%.
They usually used a conventional optimization algorithm to optimize the ORC. The
disadvantage of the conventional optimization algorithm is that it is easy to converge to sub-
optimal solutions in the process of searching for the optimum, especially for complicated
optimization problems.
Angelino et al. [24] investigated the use of working fluids such as aromatic hydrocarbons,
siloxane and siloxane mixtures, straight chain hydrocarbons, and aromatic perfluorocarbons
for waste heat recovery from a molten carbonate fuel cell plant. The performance of energy
recovery cycles using different fluids was evaluated by means of optimization software for
different operating conditions and cycle configurations. Madhawa et al. [25] presented a cost
effective optimum design criterion for ORC’s utilizing low temperature geothermal heat
sources. They used the ratio of the total heat exchanger area to net power output as the
25
objective function to optimize the ORC using the steepest descent method. They observed that
the choice of working fluid could greatly affect the power plant cost.
1.10.6 Simulation
Development in simulation tools for ORC systems in both steady flow and transient regimes
have seen rapid growth in the last decade. Wei et al. [26] showed two alternative approaches
for the design of a dynamic model for an ORC to be used for the design of control and
diagnostics systems. The model was been developed in Modelica language and simulated with
Dymola. The two modeling approaches, based on moving boundary and discretization
techniques, are compared in terms of accuracy, complexity and simulation speed. Simulations
show that the models predict the data with an accuracy of 4%. The moving boundary model is
less complex than the discretized version, as it is characterized by smaller order and higher
computational speed. As a result, it is more acceptable for control design applications.
Cycle-Tempo developed by TU Delft [27] is a fully graphical program, not only the system
configuration can be assembled as a Process Flow Diagram and data input is made by filling
property dialog boxes but also the results are available as well ordered charts, plots and tables.
A further important feature is the capability of performing the exergy analysis of the system.
Such analysis provides an insight into the exergy flows and losses in sub-systems, and it is a
fundamental tool when looking for the optimal system configuration. The main feature of
Cycle-Tempo is the calculation of all relevant mass and energy flows in the system. Additional
features allows for more detailed analysis and optimization of the system. The number and
type of components and sub-systems, and the way in which they are connected, may vary in
each individual case. Cycle-Tempo thus leaves entirely up to the user the choice of system
configuration. The program contains a large number of component and connection models
that enable the user to compose almost any desired system model.
In order to determine the optimum operating conditions, commercial software’s like
VirtualPlant and process simulator HYSYS have been implemented to carry out thermodynamic
analysis of the ORC and combined heat and power plants [28] [29]. Model results include
generation capacity and heat rate, as well as mass flows and state point details. These results
help facilitate evaluation of conceptual changes in operating and equipment condition
parameters. These software’s can also be used to validate measured data, calculate expected
component performance based upon actual operating conditions and recommend optimum
set points to maximize profitability. Additionally, steady state modelling for optimizing ORC
systems (SimORC) has also been developed by Labothap using Engineering Equation Solver
including a library of component models that have been experimentally validated [30]. In the
26
presence of highly transient heat source they have also developed control strategies using
Modelica language.
1.10.7 Internal combustion engines
An internal combustion engine in vehicle only converts roughly one third of the fuel energy
into mechanical power. For instance, for a typical 1.4 litre Spark Ignition ICE, with a thermal
efficiency ranging from 15 to 32%, 1.7 to 45 kW of heat is released through the radiator (at a
temperature close to 80 - 100°C) and 4.6 to 120 kW through the exhaust gas (400 - 900°C) [3]
[8] [31].
The Rankine cycle system is an efficient means for utilising exhaust gas in comparison with
other technologies such as thermo-electricity and mechanical turbocompounding. The idea of
coupling an ORC system to an ICE is not new. Mack Trucks [32] designed and built a prototype
of such a system operating on the exhaust gas of a 288 HP truck engine. A 450 km on-road test
demonstrated the technical feasibility of the system and its economic value. A 12.5%
improvement in the fuel consumption was achieved. Systems developed today differ from
those of the 70’s because of the advances in the development of expansion devices and the
broader choice of working fluids [3].
Heavy duty truck engines can recover heat from the exhaust gas [33] [34] and, in addition from
the cooling circuit [35]. The control of the system is particularly complex due to the transient
nature of the heat source. However, optimizing the control is crucial to improve the
performance of the system. For instance, Honda proposed to control the temperature by
varying the water flow rate through the evaporator by varying the pump speed and to control
the expander supply pressure by varying its rotational speed. Performance of recently
developed (2007) prototypes of ORC systems is promising. For instance, the system designed
showed a maximum cycle thermal efficiency of 13%. At 100 km/h, this yields a cycle output of
2.5 kW (for an engine output of 19.2 kW). This represents an increase in the thermal efficiency
of the engine from 28.9% to 32.7% [3] [33].
1.11 Expander
Turbines are not particularly suitable devices for low power generation machines. So,
volumetric machines remain the more likely candidates. A short survey conducted on different
positive displacement machines gives their applicability in ORC process.

27
1.11.1 Rotary vane expanders
Badr et al. [36] carried out a research program on these machines. The results of the program
have shown that the maximum isentropic efficiency that can be achieved is up to 73% at
rotational speed of 3000 rpm. The power produced by the vane expander was up to 1.8 kW
with R-113 as working fluid. The inlet temperature and pressure of the tested vane expander
were approximately 125°C and 625 kPa. The pressure ratio achieved was 2.79. The major
problem encountered when using a rotary vane expander was the achievement of adequate
lubrication of the internal rubbing surfaces. The presence of insufficient lubricant resulted in
severe damage due to wear of the components, and resulted in poor isentropic efficiencies.
1.11.2 Scroll expanders
In the last decades, many researchers have evaluated the performance of scroll compressors
operating in the expander mode. Yanagisawa et al. [37] investigated the use of a scroll
compressor for air expansion; the volumetric and adiabatic efficiencies of the tested expander
were 76% and 60% respectively with a pressure ratio of 5. A steam scroll expander was tested
by Kim et al. [38]. Results show volumetric efficiency of 52.1%, the scroll expander was
designed to operate at a pressure ratio of 5.67, a rotational speed of 2317 rpm, and a rated
power output of 15 kW. Kane et al. [39] developed a small hybrid solar power system
operating with two superposed scroll expanders. The working fluids for the tested expander
were R-123 and R-134a. The first expander operating with R-123 was designed to generate 5
kW with a built in volume ratio of 2.3. The second expander operating with R-134a was
designed to deliver 8 kW with the same built in volume. The expander efficiencies measured
up to 68%. Lemort et al. [40] tested three different types of expanders suitable for recover
Rankine cycle. The three expanders had swept volumes of 148, 98, and 60 cm3 respectively and
corresponding internal built in volume ratio close to 4.1, 3.1, and 2.6. Results show that the
best results were obtained from the expander having the highest built-in volume operating
with steam, when the measured isentropic efficiency was 55% and the highest delivered
mechanical powers achieved with the same expander was approximately 3 kW.
1.11.3 Screw expanders
Helical screw machines offer the advantage of simple architecture. Steidel et al. [41] reported
the performance of a Lysholm helical screw expander with an isentropic efficiency up to 32.4%
with a pressure ratio of 7.1, and a mechanical shaft power output of 32.7 kW. One method for
improving the efficiency of an ORC is to further improve the adiabatic efficiency of the unit
used to extract power from the pressure difference of the working fluid. There had not been
the progress needed to begin to achieve this until the last decade. Smith et al. [4] developed a
28
twin screw expander that worked well, and the isentropic efficiency obtained in their studies
reached values higher than 70%. This was based on the use of new rotor profiles that was
made possible by progress in manufacturing and advanced computer simulation of the
expansion process. This followed from earlier studies that analysed screw machines working
as compressors [42] [43]. These machines have the advantage of not requiring oil flooding
while maintaining direct rotor contact. This also, minimises the internal leakage due to
clearance between the screws and the casing. As new working fluids are tried to increase
overall heat engine efficiency, so too are new ways to exploit their benefits through new
expander designs.
In the range of power output from 1 to 10 kW, scroll expanders represent the best solution by
their operating performance and reliability. On the other hand, the rotary vane expander can
be another option when the required power output is lower than 2 kW. The screw expander
has the capability of delivering high power outputs above 20 kW. The oil-free twin screw
expander appears to be the most promising concept among the assessed technologies,
regarding its reliability and acceptable expansion ratio. Such a machine requires some
modification to change its mode of operation from compression to expansion mode.
1.12 Existing Applications
After a thorough search, few key companies were reviewed that use ORC technology in their
products. Some of these companies specifically target waste heat from diesel engines while
others were broader in their application. The companies reviewed were UTC Power, Turboden,
Ormat, Barber-Nichols, Global Energy & ElectraTherm [3] [44] [45] [46] [47].
Honeywell: Manufactures an ORC working fluid called Genetron 245fa (1,1,1,3,3-
pentafluoropropane), a nonflammable liquid with a boiling point slightly below room
temperature at standard one atmosphere air pressure. It is not considered a volatile organic
compound, has zero ozone depletion and global warming potential, and is environmentally
safe. It has better heat transfer characteristics than standard HFCs. Genetron 245fa is a good
choice for waste heat recovery from low-pressure steam systems.
UTC Power: A United Technologies Co., has developed the Pure Cycle power system utilizing
ORC technology. The PureCycle power system is an electric power generating system which
runs off any hot water resource at temperatures as low as 90°C. The hot water can be derived
from a geothermal source or other waste heat source. Currently this ORC unit is sized at 280
kW (gross) of electrical power. One of these is commercially running at Chena.
29
Turboden: Turboden is an Italian company that specializes in ORC technology. They have
combined heat and power systems in established sizes ranging from 200 kW to 2000 kW. They
also have heat recovery systems that range from 500 kW to 1500 kW. The company can also
build custom sizes but currently do not manufacture any under 500 kW for applications
requiring a single unit. They have installed many units, mostly in Europe and in the biomass
industry.
Each module is easy to transport and ready to install. It is built on a single skid-mounted
assembly, and contains all the necessary equipment for electrical production (evaporators,
condensers, piping, working-fluid reservoirs, feed pumps, turbine, electric generator, control,
and switch-gear). Larger systems can be constructed from multiple modules. An optional
regenerator is added for higher temperature applications, such as biomass-powered CHP
facilities.
Ormat Technologies Inc: Ormat is the world leader in ORC technology. They have successfully
installed ORC units around the world. They specialize in geothermal power, recovered energy
generation, and remote power units. Their units range from 200 kW to 22 MW for the
recovered energy generations units for waste heat recovery. Their remote power units range
in size from 2-45 kW. Ormat’s energy converter utilizes a hermetically sealed ORC generating
system, which contains only one smoothly rotating part the shaft driving the turbine’s
alternator rotor. Defined as a closed-cycle vapour turbogenerator, it is a self-contained power
package suitable for tapping into waste heat from remote locations. The Heidelberg cement
AG plant in Germany operates a turnkey Ormat system generating 1.5 MW from a heat
recovery system. Operation of the power plant results in a reduction of 7,000 tons of CO2
emissions each year. The Minakami Tsukiyono-Niiharu Sanitary facility in Japan uses an Ormat
system to generate 550 kW of electricity from the burning of refuse-derived fuel. A 1.3-MW
Ormat generator is used by the Shijiazhuang Heating and Power Plant in China to create
electricity from waste heat recovered from flue gases.
Barber Nichols Inc: A Colorado manufacturer of high-performance specialty turbo-machinery,
has been designing and building ORC systems since 1970. BNI has built and operated
numerous geothermal and solar energy systems utilizing ORC engines. They have experience
building waste heat applications but on an industrial scale. Two of their geothermal plants are
located in California. The plants utilize relatively low-temperature geothermal water (115°C) to
produce electricity (700 kW and 1.5 MW) that is sold to the local utility. As with most ORC
systems, these units operate continuously without the need for a human operator.

30
Global Energy: Global Energy has developed the Infinity Turbine, an ORC turbine built for
waste heat and geothermal applications. While there are numerous potential uses for this
turbine, one that is specifically being targeted uses diesel engine exhaust. According to the
website, the Infinity Turbine consists of a single skid-mounted assembly that fits in the
standard 20 or 40 foot ISO standard shipping container. All the equipment required for the
power skid to be operated (i.e. heat exchangers, piping, working fluid feed pump, turbine,
electric generator, control and switch-gear) fit into the container. A price of $60,000 was
reported for the 30 kW with a delivery time of 11 weeks.
ElectraTherm: Nevada based ElectraTherm launched an ORC unit that captures waste on a
smaller scale and have further plans to produce units ranging from 30-65 kW. The
ElectraTherm Heat to Power Generation System captures waste heat from almost any
geothermal or industrial source. Built on a skid, it's both modular and mobile. Automated
control systems permit unattended operation resulting in low operation and maintenance
costs. Using patented technology, it requires minimal heat (about 90°C liquid). ElectraTherm
operates 12 Green Machines internationally. The latest price was reported around $2400-
$2700 per kW.
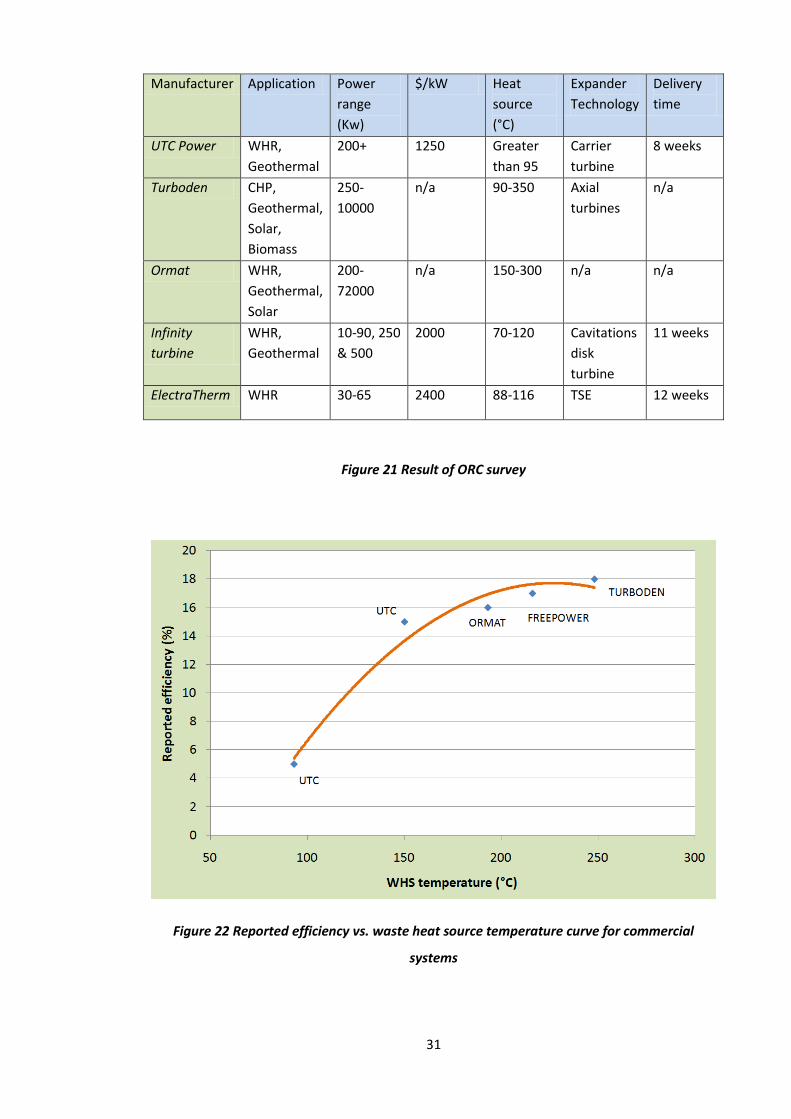
31
Manufacturer Application Power
range
(Kw)
$/kW Heat
source
(°C)
Expander
Technology
Delivery
time
UTC Power WHR,
Geothermal
200+ 1250 Greater
than 95
Carrier
turbine
8 weeks
Turboden CHP,
Geothermal,
Solar,
Biomass
250-
10000
n/a 90-350 Axial
turbines
n/a
Ormat WHR,
Geothermal,
Solar
200-
72000
n/a 150-300 n/a n/a
Infinity
turbine
WHR,
Geothermal
10-90, 250
& 500
2000 70-120 Cavitations
disk
turbine
11 weeks
ElectraTherm WHR 30-65 2400 88-116 TSE 12 weeks
Figure 21 Result of ORC survey
Figure 22 Reported efficiency vs. waste heat source temperature curve for commercial
systems
32
Chapter 2 Working fluid
2.1 Introduction
With some of the general differences between water and organic fluids established, it is
possible to examine the properties that drive organic fluid selection for particular applications.
The proper choice of working fluid in the ORC is of key importance as it has a major effect on
the performance of the unit. Because of the low temperature of the heat source,
irreversibilities occurring in heat exchangers are very harmful to the overall efficiency of the
cycle. These inefficiencies are highly dependent on the thermodynamic properties of the
working fluid. A basic requirement for organic working fluids used in ORC power plants is that
the pressure of the working fluid in each phase of the cycle should be higher than the
atmospheric pressure. It eliminates the risk of air leakages into the cycle. Such inflows are
difficult to notice and very dangerous for power plants.
The range of organic fluids is such that there are hundreds of working fluids in the market.
However, the available pool of refrigerants narrows down significantly, once cost and
environmental standards are considered. Because of the zero ozone depletion potential, HFCs
have been predominantly chosen as alternative refrigerants replacing CFCs and HCFCs. Since
HFCs have a high global warming potential there is still a search for the next generation
refrigerants that might have better cycle performance. Another characteristic that must be
considered during the selection of an organic fluid is its saturation vapour curve. This
characteristic affects the fluid applicability, cycle efficiency, and the arrangement of associated
equipment in a power generation system. The working fluids of dry or isentropic type are more
appropriate for ORC systems as they do not need superheat and show better thermal
efficiencies.
33
2.2 Desired properties
There are numerous properties that should be considered for the design and selection of
working fluids for ORC processes. Important factors of the working fluids needed to be
considered are listed below [3] [6] [9] [12] [14] [15] [48] [49] [50] [51] [52]:
Ozone depletion potential: The ozone depletion potential is an index that determines the
relative ability of chemical substances to destroy ozone molecules in the stratosphere hence
working fluids with low or zero ozone depletion potential are required.
Global warming potential: The global warming potential is an index that determines the
potential contribution of a chemical substance to global warming. Hence, the refrigerant
should have low environmental impact and greenhouse warming potential.
Toxicity of working fluid: All organic fluids are inevitably toxic. A working fluid with a low
toxicity should be used to protect the personnel from the threat of contamination in case of
fluid leakage. Hence, the determination of the toxicity of the designed working fluids is
important for human safety reasons.
Availability and cost: Traditional refrigerants used in ORC’s are expensive. This cost could be
reduced by a more massive production of those refrigerants, or by the use of low cost
hydrocarbons. The fluid selected has to be commercially available from several suppliers at an
acceptable cost.
Vapour curve: The preferred characteristic for low temperature ORC is the isentropic
saturation vapour curve, since the purpose of the ORC focuses on the recovery of low grade
heat power, a superheated approach like the traditional Rankine cycle is not appropriate. In
the case of a positive slope saturation curve, the fluid has to be cooled down at the exhaust of
the expander before entering the two phase state. If economical this can be done by the use of
a regenerator between the exhaust of the pump and the exhaust of the expander.
Density: This parameter is of key importance, especially for fluids showing a very low
condensing pressure. The density of the working fluid must be high either in the liquid or
vapour phase. High liquid or vapour density results to increased mass flow rate and equipment
of reduced size.
Chemical stability: Under a high pressure and temperature, organic fluids tend to decompose,
resulting in material corrosion and possible detonation and ignition. Thermal stability at
elevated temperature is thus a principle consideration in working fluid selection.
34
Pressures: The maximum operating pressure required in the ORC process should be
appropriately chosen for example, high pressure processes require the use of expensive
equipment and increasing complexity but also high pressure implies high densities and hence
smaller heat exchanger and expander. Particular consideration is given to condensing pressure
and volume as they are directly related to cycle operation and maintenance and equipment
size.
Compatible with lubricating oil: Organic fluids must coexist with lubricating oil. The selection
of a suitable oil requires careful consideration of the desired physical and chemical properties,
as well as the working fluid and materials of construction to be used. Numerous investigations
of the behaviour of oils in contact with organic fluids have been conducted. In general, studies
have shown that some oils are more stable toward organic fluids than others, with increased
temperature accelerating the refrigerant-oil reaction. The reaction rate is also dependent on
the kinds of metal in contact with the oil and organic fluid, the amount of air and moisture
present, and the additives present in the oil. When in contact, an organic fluid and lubricating
oil have a property known as mutual solubility. Organic fluids may be classified as completely
miscible, partially miscible, or immiscible according to their mutual solubility relations with
lubricating oils.
Material Compatibility: The working fluids should be non-corrosive to the more common
engineering materials used for the different components of the ORC such as pipes, heat
exchangers, seals etc.
Flash point: A working fluid with a high flash point should be used in order to avoid
flammability.
Specific heat: The liquid specific heat should be high meaning that less preheating is required.
Thermal conductivity: A high conductivity represents a better heat transfer in heat-exchange
components. The thermal conductivity must be high in order to achieve high heat transfer
coefficients in both the employed condensers and vapourisers.
Viscosity: The viscosity of the working fluid should be maintained low in both liquid and
vapour phases in order to achieve a high heat transfer coefficient with reduced power
consumption. Working fluid liquid and vapour viscosities have to be low to minimize frictional
pressure drops and maximize convective heat transfer coefficients.
Melting point: The melting point temperature should be lower than the lowest ambient
operating temperature in order to ensure that the working fluid will remain in the liquid phase.
35
Mass flow rate: The mass flow rate of the working fluid should also be low in order to maintain
reduced operating costs.
Condensing pressure: The working fluid condensing pressure should be higher than the
atmospheric pressure to avoid leakage of air into the system.
Triple point: The triple point should be below the minimum ambient temperature to ensure
that the working fluids will not solidify at any operating temperature or when the system is
shut down.
Enthalpy variation: The working fluid enthalpy reduction in the expander should be large to
increase the efficiency of the thermodynamic cycle and to minimize the flow rate of the
working fluid.
Vapour specific volume: Vapour specific volume at saturation (condensing) conditions give an
indication of condensing equipment size. Noticing that organic fluid vapour volume varies by
three orders of magnitude between n-pentane (vapour specific volume 0.4m3/kg at 30°C) and
n-dodecane (vapour specific volume 400m3/kg at 30°C) highlights the importance of this
information in selecting the working fluid. Organic fluids with low saturation vapour volumes,
like n-pentane, require smaller condensing equipment and contribute to the choice of these
working fluids for applications where minimizing size and complexity is a priority.
Heat capacity: A low value of the heat capacity of the liquid leading to ds/dT ~ 0 for the
saturated liquid line and a high ratio of the latent heat of vaporization to the liquid heat
capacity are favourable. Those properties reduce the amount of heat required to raise the
temperature of the sub-cooled liquid to the saturation temperature corresponding to the
boiling pressure. Operating with finite heat sources, a high heat capacity of the liquid can lead
to a higher recovered energy from the heat source and then increases the total efficiency of
the cycle.
Thermodynamic performance: The efficiency of an ORC is a well known process performance
indicator that provides a valid assessment of the potential production of power from the
process. The efficiency and/or output power should be as high as possible for the given heat
source and heat sink temperatures.
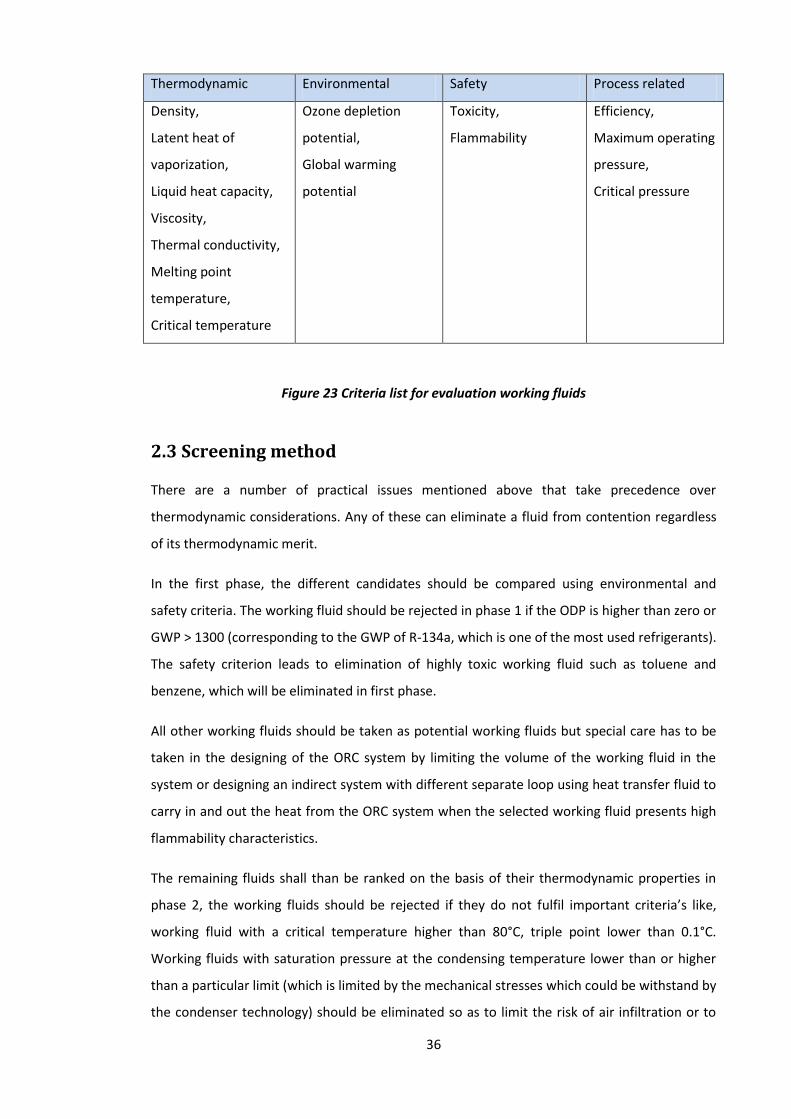
36
Thermodynamic Environmental Safety Process related
Density,
Latent heat of
vaporization,
Liquid heat capacity,
Viscosity,
Thermal conductivity,
Melting point
temperature,
Critical temperature
Ozone depletion
potential,
Global warming
potential
Toxicity,
Flammability
Efficiency,
Maximum operating
pressure,
Critical pressure
Figure 23 Criteria list for evaluation working fluids
2.3 Screening method
There are a number of practical issues mentioned above that take precedence over
thermodynamic considerations. Any of these can eliminate a fluid from contention regardless
of its thermodynamic merit.
In the first phase, the different candidates should be compared using environmental and
safety criteria. The working fluid should be rejected in phase 1 if the ODP is higher than zero or
GWP > 1300 (corresponding to the GWP of R-134a, which is one of the most used refrigerants).
The safety criterion leads to elimination of highly toxic working fluid such as toluene and
benzene, which will be eliminated in first phase.
All other working fluids should be taken as potential working fluids but special care has to be
taken in the designing of the ORC system by limiting the volume of the working fluid in the
system or designing an indirect system with different separate loop using heat transfer fluid to
carry in and out the heat from the ORC system when the selected working fluid presents high
flammability characteristics.
The remaining fluids shall than be ranked on the basis of their thermodynamic properties in
phase 2, the working fluids should be rejected if they do not fulfil important criteria’s like,
working fluid with a critical temperature higher than 80°C, triple point lower than 0.1°C.
Working fluids with saturation pressure at the condensing temperature lower than or higher
than a particular limit (which is limited by the mechanical stresses which could be withstand by
the condenser technology) should be eliminated so as to limit the risk of air infiltration or to
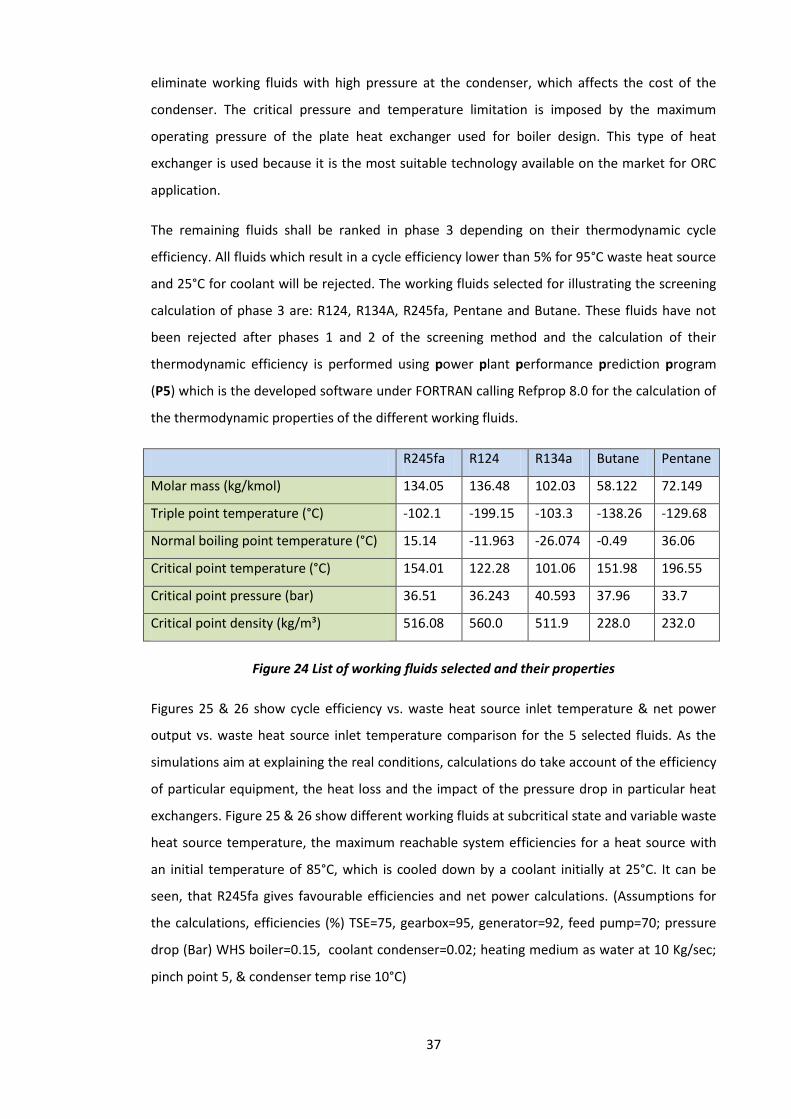
37
eliminate working fluids with high pressure at the condenser, which affects the cost of the
condenser. The critical pressure and temperature limitation is imposed by the maximum
operating pressure of the plate heat exchanger used for boiler design. This type of heat
exchanger is used because it is the most suitable technology available on the market for ORC
application.
The remaining fluids shall be ranked in phase 3 depending on their thermodynamic cycle
efficiency. All fluids which result in a cycle efficiency lower than 5% for 95°C waste heat source
and 25°C for coolant will be rejected. The working fluids selected for illustrating the screening
calculation of phase 3 are: R124, R134A, R245fa, Pentane and Butane. These fluids have not
been rejected after phases 1 and 2 of the screening method and the calculation of their
thermodynamic efficiency is performed using power plant performance prediction program
(P5) which is the developed software under FORTRAN calling Refprop 8.0 for the calculation of
the thermodynamic properties of the different working fluids.
R245fa R124 R134a Butane Pentane
Molar mass (kg/kmol) 134.05 136.48 102.03 58.122 72.149
Triple point temperature (°C) -102.1 -199.15 -103.3 -138.26 -129.68
Normal boiling point temperature (°C) 15.14 -11.963 -26.074 -0.49 36.06
Critical point temperature (°C) 154.01 122.28 101.06 151.98 196.55
Critical point pressure (bar) 36.51 36.243 40.593 37.96 33.7
Critical point density (kg/m³) 516.08 560.0 511.9 228.0 232.0
Figure 24 List of working fluids selected and their properties
Figures 25 & 26 show cycle efficiency vs. waste heat source inlet temperature & net power
output vs. waste heat source inlet temperature comparison for the 5 selected fluids. As the
simulations aim at explaining the real conditions, calculations do take account of the efficiency
of particular equipment, the heat loss and the impact of the pressure drop in particular heat
exchangers. Figure 25 & 26 show different working fluids at subcritical state and variable waste
heat source temperature, the maximum reachable system efficiencies for a heat source with
an initial temperature of 85°C, which is cooled down by a coolant initially at 25°C. It can be
seen, that R245fa gives favourable efficiencies and net power calculations. (Assumptions for
the calculations, efficiencies (%) TSE=75, gearbox=95, generator=92, feed pump=70; pressure
drop (Bar) WHS boiler=0.15, coolant condenser=0.02; heating medium as water at 10 Kg/sec;
pinch point 5, & condenser temp rise 10°C)
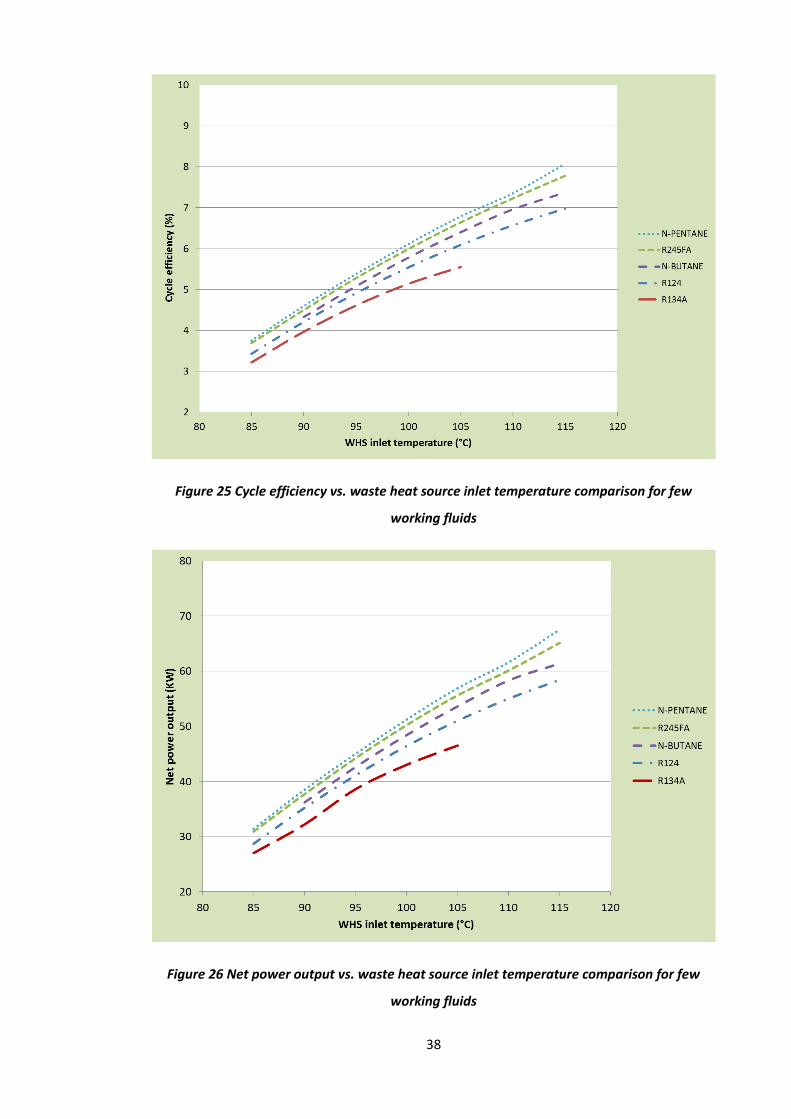
38
Figure 25 Cycle efficiency vs. waste heat source inlet temperature comparison for few
working fluids
Figure 26 Net power output vs. waste heat source inlet temperature comparison for few
working fluids
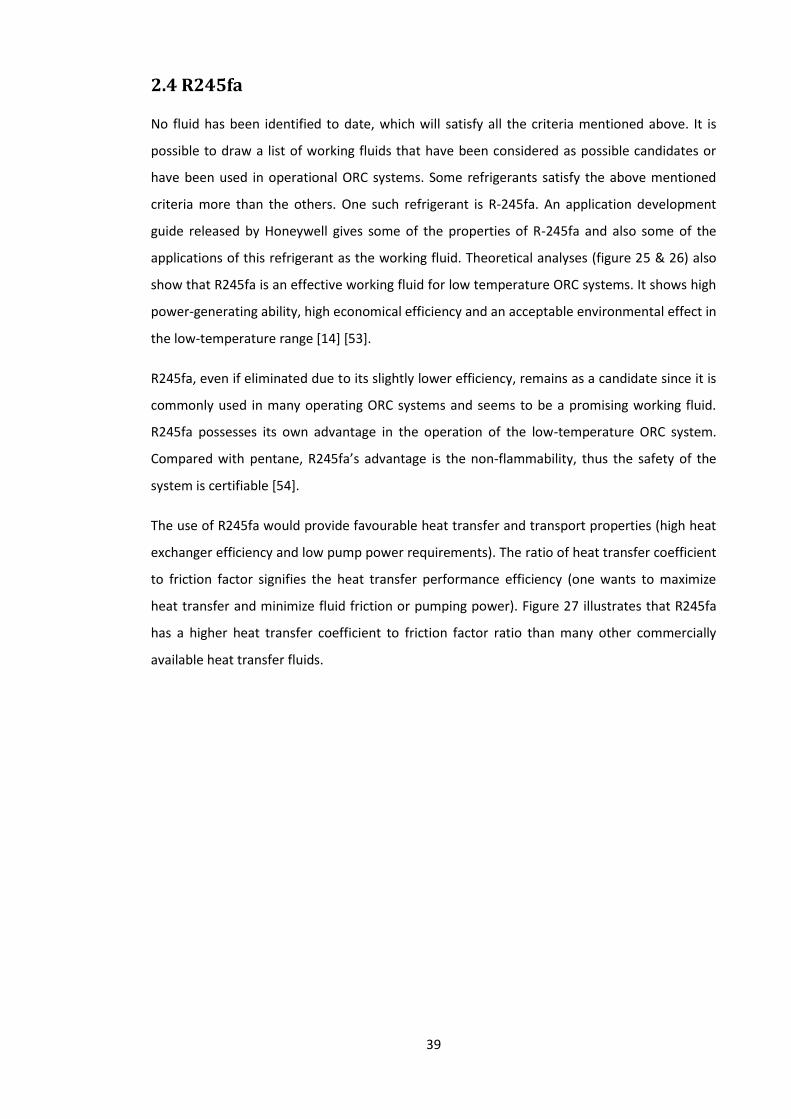
39
2.4 R245fa
No fluid has been identified to date, which will satisfy all the criteria mentioned above. It is
possible to draw a list of working fluids that have been considered as possible candidates or
have been used in operational ORC systems. Some refrigerants satisfy the above mentioned
criteria more than the others. One such refrigerant is R-245fa. An application development
guide released by Honeywell gives some of the properties of R-245fa and also some of the
applications of this refrigerant as the working fluid. Theoretical analyses (figure 25 & 26) also
show that R245fa is an effective working fluid for low temperature ORC systems. It shows high
power-generating ability, high economical efficiency and an acceptable environmental effect in
the low-temperature range [14] [53].
R245fa, even if eliminated due to its slightly lower efficiency, remains as a candidate since it is
commonly used in many operating ORC systems and seems to be a promising working fluid.
R245fa possesses its own advantage in the operation of the low-temperature ORC system.
Compared with pentane, R245fa’s advantage is the non-flammability, thus the safety of the
system is certifiable [54].
The use of R245fa would provide favourable heat transfer and transport properties (high heat
exchanger efficiency and low pump power requirements). The ratio of heat transfer coefficient
to friction factor signifies the heat transfer performance efficiency (one wants to maximize
heat transfer and minimize fluid friction or pumping power). Figure 27 illustrates that R245fa
has a higher heat transfer coefficient to friction factor ratio than many other commercially
available heat transfer fluids.

40
Figure 27 Performance of heat transfer fluids (source: Honeywell)
Pekasol is a registered trademark of proKuhlsole, Hycool is a registered trademark of Norsk Hydro, Dowfrost is a registered trademark of The Dow Chemical Company & Tyfoxit.

41
Chapter 3 Modelling (Global model)
3.1 Introduction
The ability to model ORC equipment and complete ORC plant is essential for optimizing the
performance and consequently cutting down costs. For many years, computer models have
been important tools in this area. Designing ORC power plant is a highly domain dependent
task. It requires a balanced study of three major considerations, namely: the decision about
the plant lay out (choice of components and their dispositions); the planning of the plant
operational requirements (provision for maintenance and upratings); and the variation of
external conditions (changing waste heat source and electric prices).
Depending on the system complexity and the scope of a particular research different
approaches can be involved. At least the following components must be included, preheater,
evaporator, expander, condenser, pumps and connection lines. To specify any unit,
parameters like inlet and outlet streams and operating pressure/temperature should be
known.
3.2 Model background
Power Plant Performance Prediction Program or P5 is an ORC mathematical model built by
connecting the models of its different main components. It is then used for simulation and
analysis in this study. The model was designed for screening of potential power cycle
configurations and detailed design optimization and analysis. Material requirements of the
evaporator are more stringent as the working fluid becomes superheated, and a lower thermal
conductivity of the superheated vapour would result in a lower heat transfer rate as compared
with the saturated vapour. Hence, due to economical feasibility and technical simplicity a wet
vapour cycle was considered with a variable expander exit dryness fraction to a maximum
value of X=0.99. Equations that describe the performance of each cycle component were
developed and the coupled equations are solved to provide a steady state operating point that
can be analysed to determine the performance potential of the optimum designed cycle. The
energy balance for each component and isentropic efficiency definitions are applied in order to
determine states of the working fluid and then evaluate the specific net output and the cycle
efficiency.
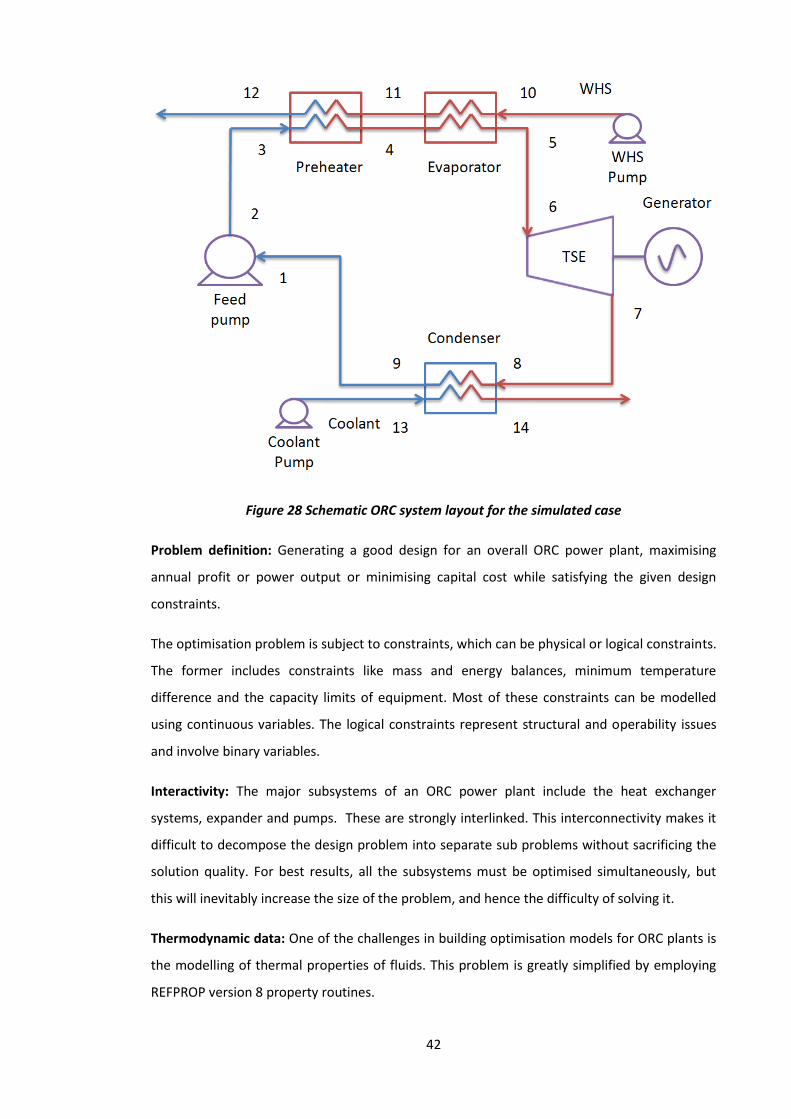
42
Figure 28 Schematic ORC system layout for the simulated case
Problem definition: Generating a good design for an overall ORC power plant, maximising
annual profit or power output or minimising capital cost while satisfying the given design
constraints.
The optimisation problem is subject to constraints, which can be physical or logical constraints.
The former includes constraints like mass and energy balances, minimum temperature
difference and the capacity limits of equipment. Most of these constraints can be modelled
using continuous variables. The logical constraints represent structural and operability issues
and involve binary variables.
Interactivity: The major subsystems of an ORC power plant include the heat exchanger
systems, expander and pumps. These are strongly interlinked. This interconnectivity makes it
difficult to decompose the design problem into separate sub problems without sacrificing the
solution quality. For best results, all the subsystems must be optimised simultaneously, but
this will inevitably increase the size of the problem, and hence the difficulty of solving it.
Thermodynamic data: One of the challenges in building optimisation models for ORC plants is
the modelling of thermal properties of fluids. This problem is greatly simplified by employing
REFPROP version 8 property routines.
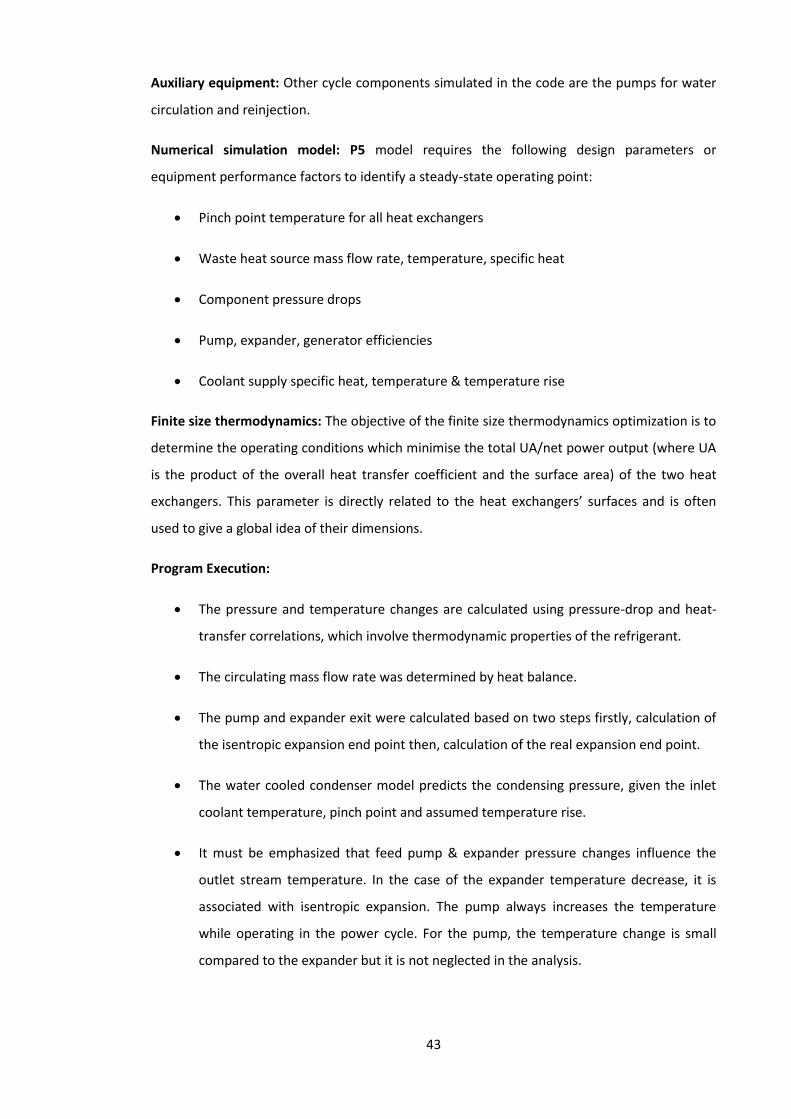
43
Auxiliary equipment: Other cycle components simulated in the code are the pumps for water
circulation and reinjection.
Numerical simulation model: P5 model requires the following design parameters or
equipment performance factors to identify a steady-state operating point:
Pinch point temperature for all heat exchangers
Waste heat source mass flow rate, temperature, specific heat
Component pressure drops
Pump, expander, generator efficiencies
Coolant supply specific heat, temperature & temperature rise
Finite size thermodynamics: The objective of the finite size thermodynamics optimization is to
determine the operating conditions which minimise the total UA/net power output (where UA
is the product of the overall heat transfer coefficient and the surface area) of the two heat
exchangers. This parameter is directly related to the heat exchangers’ surfaces and is often
used to give a global idea of their dimensions.
Program Execution:
The pressure and temperature changes are calculated using pressure-drop and heat-
transfer correlations, which involve thermodynamic properties of the refrigerant.
The circulating mass flow rate was determined by heat balance.
The pump and expander exit were calculated based on two steps firstly, calculation of
the isentropic expansion end point then, calculation of the real expansion end point.
The water cooled condenser model predicts the condensing pressure, given the inlet
coolant temperature, pinch point and assumed temperature rise.
It must be emphasized that feed pump & expander pressure changes influence the
outlet stream temperature. In the case of the expander temperature decrease, it is
associated with isentropic expansion. The pump always increases the temperature
while operating in the power cycle. For the pump, the temperature change is small
compared to the expander but it is not neglected in the analysis.
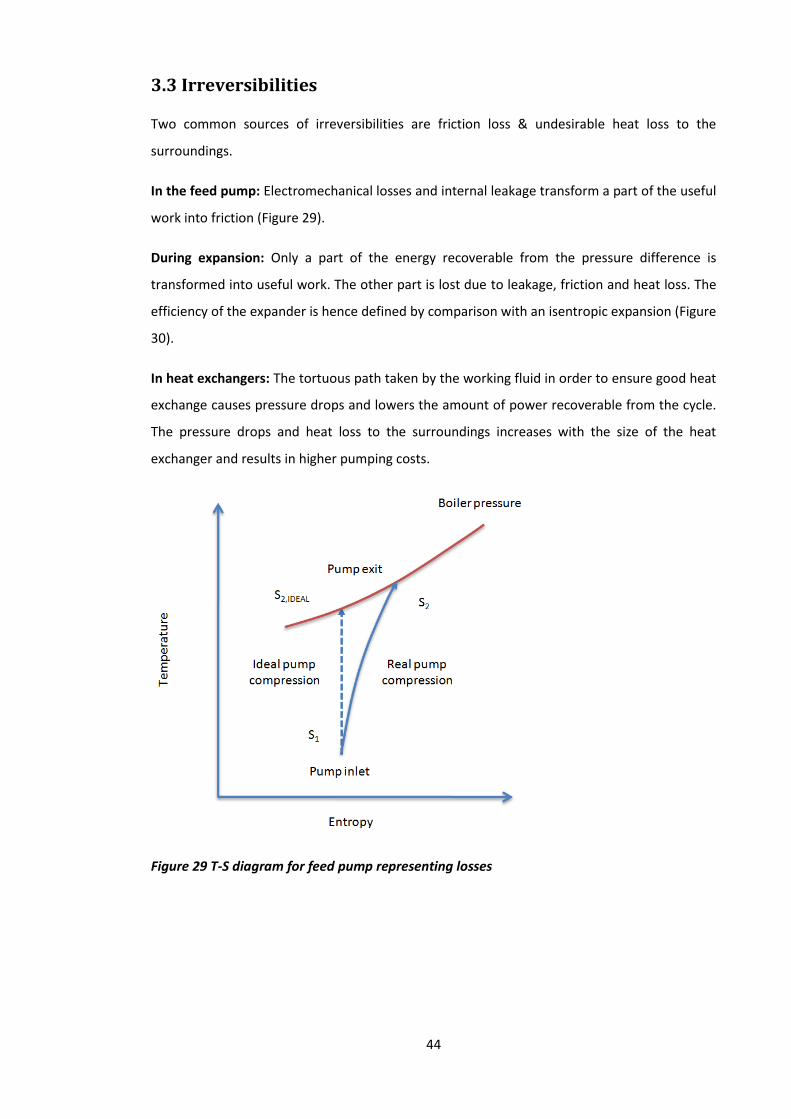
44
3.3 Irreversibilities
Two common sources of irreversibilities are friction loss & undesirable heat loss to the
surroundings.
In the feed pump: Electromechanical losses and internal leakage transform a part of the useful
work into friction (Figure 29).
During expansion: Only a part of the energy recoverable from the pressure difference is
transformed into useful work. The other part is lost due to leakage, friction and heat loss. The
efficiency of the expander is hence defined by comparison with an isentropic expansion (Figure
30).
In heat exchangers: The tortuous path taken by the working fluid in order to ensure good heat
exchange causes pressure drops and lowers the amount of power recoverable from the cycle.
The pressure drops and heat loss to the surroundings increases with the size of the heat
exchanger and results in higher pumping costs.
Figure 29 T-S diagram for feed pump representing losses
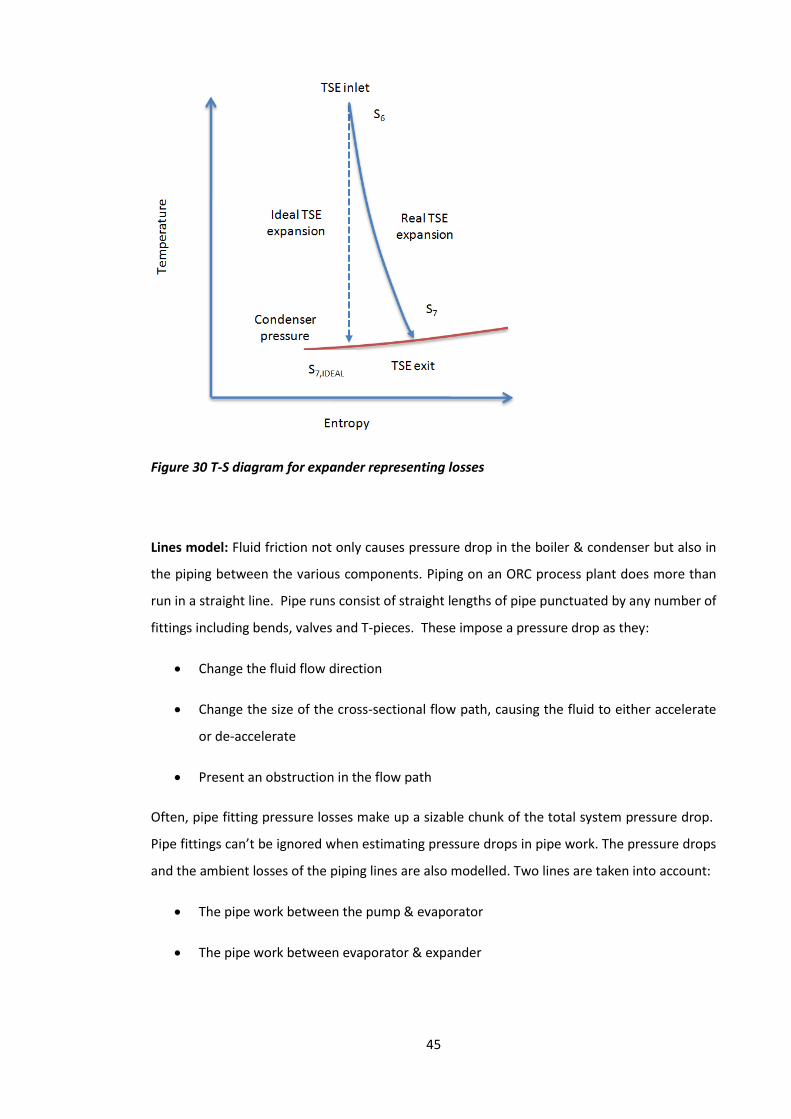
45
Figure 30 T-S diagram for expander representing losses
Lines model: Fluid friction not only causes pressure drop in the boiler & condenser but also in
the piping between the various components. Piping on an ORC process plant does more than
run in a straight line. Pipe runs consist of straight lengths of pipe punctuated by any number of
fittings including bends, valves and T-pieces. These impose a pressure drop as they:
Change the fluid flow direction
Change the size of the cross-sectional flow path, causing the fluid to either accelerate
or de-accelerate
Present an obstruction in the flow path
Often, pipe fitting pressure losses make up a sizable chunk of the total system pressure drop.
Pipe fittings can’t be ignored when estimating pressure drops in pipe work. The pressure drops
and the ambient losses of the piping lines are also modelled. Two lines are taken into account:
The pipe work between the pump & evaporator
The pipe work between evaporator & expander
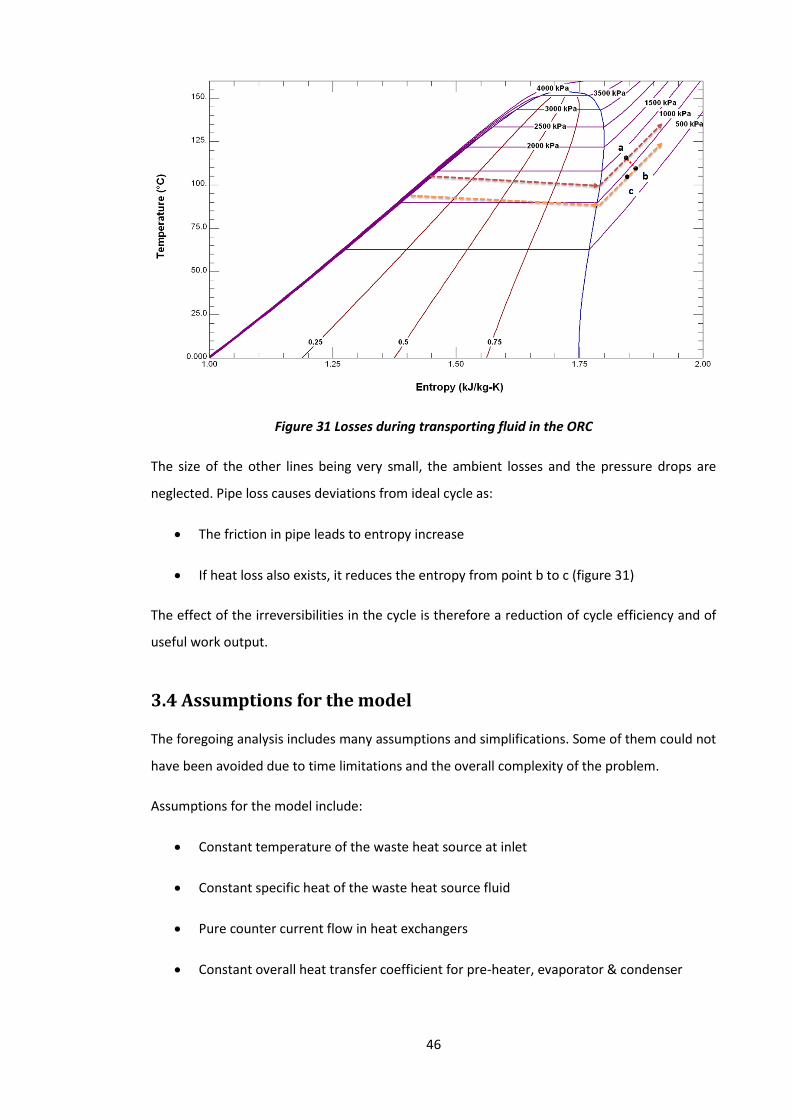
46
Figure 31 Losses during transporting fluid in the ORC
The size of the other lines being very small, the ambient losses and the pressure drops are
neglected. Pipe loss causes deviations from ideal cycle as:
The friction in pipe leads to entropy increase
If heat loss also exists, it reduces the entropy from point b to c (figure 31)
The effect of the irreversibilities in the cycle is therefore a reduction of cycle efficiency and of
useful work output.
3.4 Assumptions for the model
The foregoing analysis includes many assumptions and simplifications. Some of them could not
have been avoided due to time limitations and the overall complexity of the problem.
Assumptions for the model include:
Constant temperature of the waste heat source at inlet
Constant specific heat of the waste heat source fluid
Pure counter current flow in heat exchangers
Constant overall heat transfer coefficient for pre-heater, evaporator & condenser
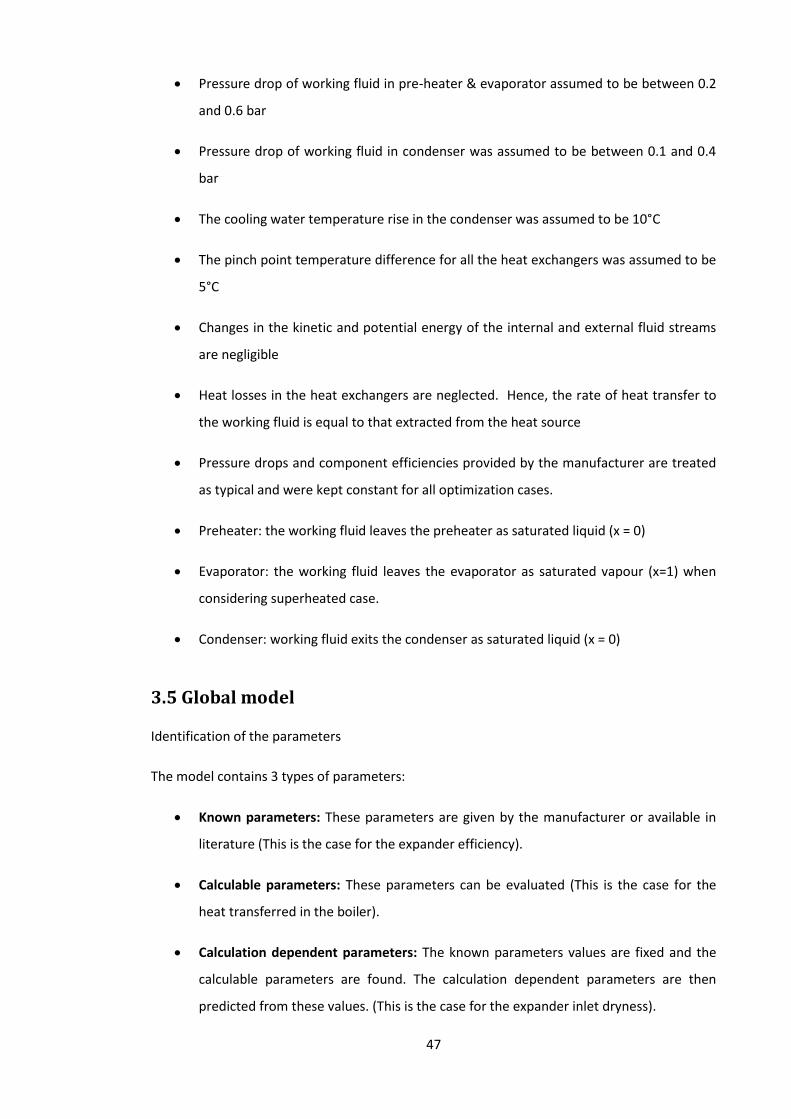
47
Pressure drop of working fluid in pre-heater & evaporator assumed to be between 0.2
and 0.6 bar
Pressure drop of working fluid in condenser was assumed to be between 0.1 and 0.4
bar
The cooling water temperature rise in the condenser was assumed to be 10°C
The pinch point temperature difference for all the heat exchangers was assumed to be
5°C
Changes in the kinetic and potential energy of the internal and external fluid streams
are negligible
Heat losses in the heat exchangers are neglected. Hence, the rate of heat transfer to
the working fluid is equal to that extracted from the heat source
Pressure drops and component efficiencies provided by the manufacturer are treated
as typical and were kept constant for all optimization cases.
Preheater: the working fluid leaves the preheater as saturated liquid (x = 0)
Evaporator: the working fluid leaves the evaporator as saturated vapour (x=1) when
considering superheated case.
Condenser: working fluid exits the condenser as saturated liquid (x = 0)
3.5 Global model
Identification of the parameters
The model contains 3 types of parameters:
Known parameters: These parameters are given by the manufacturer or available in
literature (This is the case for the expander efficiency).
Calculable parameters: These parameters can be evaluated (This is the case for the
heat transferred in the boiler).
Calculation dependent parameters: The known parameters values are fixed and the
calculable parameters are found. The calculation dependent parameters are then
predicted from these values. (This is the case for the expander inlet dryness).

48
Figure 32 Power plant performance prediction program
(Global model methodology, source: University of Liege)
In order to simulate the whole cycle, the different models explained later are connected
together. Each component is supposed to impose one or several outputs (figure 32):
Heat transfer across the evaporator is determined by the evaporator configuration and
by the temperature and flow rate of the waste heat source
Pressure drops are mainly a function of the heat exchanger geometrical characteristics
and of the flow rate
The pump imposes the refrigerant mass flow rate
The evaporator imposes the expander inlet dryness fraction
The condenser imposes the pressures at expander exhaust and pump supply
Liquid subcooling at the condenser exit is defined as a model input
49
Figure 33 Input & output parameters for the P5 ORC model
Input module
Refrigerant type: R245fa
Mass flow rates and supply temperatures of waste heat source in the evaporator is
10kg/sec & 100°C
Supply temperatures of coolant in the condenser is 25°C
Pump efficiency 70%
Generator efficiency 92%
Expander efficiency 75%
Pressure drop between 0.2 and 0.6 bars
Calculation module
The energy balance determines the mass flow rate of the working fluid, temperature
and pressure at each point
For the heat exchanger, the model gives the UA and then the area needed by
calculating U (optional)
All state points were calculated using REFPROP version 8, developed by NIST
50
Optimization Module
To maximize the economic competitiveness of ORC systems it is essential to optimise their
design. From a thermodynamic point of view for an ORC unit, the reduction of heat sink
temperature raises the thermal efficiency of the cycle. Thus, the working fluid should be
chosen in a way that, even for the lowest annual temperatures, its condensation pressure
exceeds atmospheric pressure.
The optimal operating point of such an ORC power plant can be approached in two ways
firstly, for a given investment it’s the point at which maximum power is generated. If it is
assumed that the total power plant cost is some function of its physical size (UA), then an
optimally designed ORC plant will always operate at the maximum power condition.
Alternatively, the aim is to minimise the cost per unit output. Unlike the traditional case, there
is no recurring fuel cost to complicate optimization, so these maximum power points reflect
true optimal for the defined operating conditions.
P5 demonstrates the fundamental relationship between power output, efficiency and heat
exchanger conductance (surface area function, UA). The two parameters used for the
evaluation of the performances are the net output power and the cycle efficiency. The
objectives of the optimization can be two fold:
Maximization of the total efficiency of the ORC plant
Minimization of the cost of the ORC plant
Since the cost of the heat exchanger and the condenser constitute a major part of the plant
cost, for optimizing purposes we can substitute the plant cost by their cost. So the new goal
can be to minimize the cost of the heat exchanger and the condenser which is proportional to
their surface. In such case the analysis will maximizes the profitability, rather than the
efficiency, of a given ORC by combining plant heat balances with a plant financial model.
Output module
This provides information to generate the optimum design for new ORC plant, or, to make the
right modifications to an existing plant, one can precisely predict plant performance to
determine the optimal way to run an ORC. Output data includes:
Expander shaft power
Net power out put
Cycle efficiency
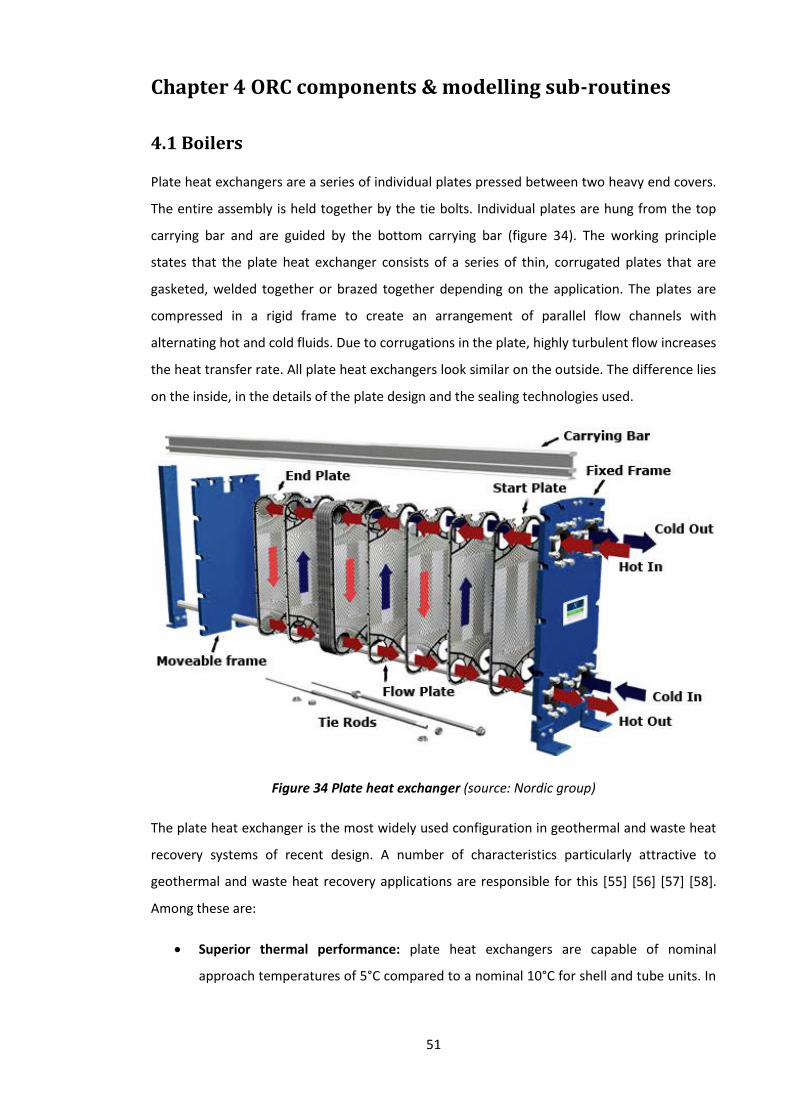
51
Chapter 4 ORC components & modelling sub-routines
4.1 Boilers
Plate heat exchangers are a series of individual plates pressed between two heavy end covers.
The entire assembly is held together by the tie bolts. Individual plates are hung from the top
carrying bar and are guided by the bottom carrying bar (figure 34). The working principle
states that the plate heat exchanger consists of a series of thin, corrugated plates that are
gasketed, welded together or brazed together depending on the application. The plates are
compressed in a rigid frame to create an arrangement of parallel flow channels with
alternating hot and cold fluids. Due to corrugations in the plate, highly turbulent flow increases
the heat transfer rate. All plate heat exchangers look similar on the outside. The difference lies
on the inside, in the details of the plate design and the sealing technologies used.
Figure 34 Plate heat exchanger (source: Nordic group)
The plate heat exchanger is the most widely used configuration in geothermal and waste heat
recovery systems of recent design. A number of characteristics particularly attractive to
geothermal and waste heat recovery applications are responsible for this [55] [56] [57] [58].
Among these are:
Superior thermal performance: plate heat exchangers are capable of nominal
approach temperatures of 5°C compared to a nominal 10°C for shell and tube units. In
52
addition, overall heat transfer coefficients (U) for plate type exchangers are three to
four times those of shell and tube units.
Availability of a wide variety of corrosion resistant alloys: Since the heat transfer area
is constructed of thin plates, stainless steel or other high alloy construction is
significantly less costly than for a shell and tube exchanger of similar material.
Ease of maintenance: The construction of the heat exchanger is such that, upon
disassembly, all heat transfer areas are available for inspection and cleaning.
Disassembly consists only of loosening a small number of tie bolts.
Expandability and multiplex capability: A plate heat exchanger consists of a
framework containing several heat transfer plates. It can easily be extended to
increase capacity. (This only applies to gasketed heat exchangers, and not to brazed
units.) In addition, two or more heat exchangers can be housed in a single frame, thus
reducing space requirements and capital costs.
Compact design: The superior thermal performance of the plate heat exchangers and
the space efficient design of the plate arrangement results in a very compact piece of
equipment. Space requirements for the plate heat exchanger are generally 10% to 50%
that of a shell and tube unit for an equivalent duty.
Thin material for the heat transfer surface: This gives optimum heat transfer, since
the heat only has to penetrate thin material.
High turbulence in the medium: The corrugated design of plates assures rigidity, at
the same time, it enhances the turbulence performance and maximizes the flow
distribution. The consequence of this higher heat transfer coefficient per unit area is
not only a smaller surface area requirement but also a more efficient plant. The high
turbulence also gives a self cleaning effect. Therefore, when compared to the
traditional shell and tube heat exchanger, fouling of the heat transfer surfaces is
considerably reduced. This means that plate heat exchangers can remain in service far
longer between cleaning intervals.
4.1.1 Assessments of possible plate heat exchanger technologies
From a thermodynamic point of view, a one pass design is preferred because it is the only one
that gives pure countercurrent flow. In the design of heat exchangers, not only the
construction and size, but also the material being used is of a high importance. The most basic
and the cheapest kind of steel used for heat exchangers is carbon steel. However, it cannot be
53
used in some cases. In geothermal systems, where the pH of brine is often highly acidic, carbon
steel, with its corrosive nature, is not the right choice. In individually designed units, special
corrosion analysis should be made before the material for heat exchangers is chosen. In
universal power plants, in order to avoid problems with corrosion, to ensure longer service life
and low operating costs, it is advised to choose a more expensive but fouling-resistant
material. Nickel alloys are considered to be highly corrosion-resistant materials. However,
because of their high price they are used only with very corrosive, high-temperature fluids. For
heat exchangers which handle chemically aggressive geothermal fluid, stainless steel is a
reasonable material selection. Stainless steels are much more resistant to uniform corrosion
than carbon steel, but some of them have a high potential for pit corrosion and cracking
corrosion.
Plate heat exchangers are commercially available with different construction materials. Four
types of plate heat exchangers exist: plate and frame, partially welded, brazed and welded
plate heat exchangers. Plate heat exchangers offer high heat transfer coefficients and large
surface areas with a small footprint making them the most suitable for low grade heat ORC
systems. The different plausible technologies are described below [55] [56] [57] [58].
The frame and plate heat exchanger: are constructed from a number of pressed, corrugated
metal plates compressed together into a frame. These plates are provided with gaskets, partly
to seal the spaces between adjacent plates and partly to distribute the media between the
flow channels. The most common plate material is stainless steel. The plates can be
constructed from stainless steel, titanium, incoloy, and hastelloy. When there is a risk of
corrosion, some companies offer heat exchangers with nonmetallic materials. The gaskets are
commonly made from Nitril rubber, hypalon, viton, neoprene, and EPDM. The minimum
temperature difference between the hot and cold streams could be as low as 2°C and this
minimum temperature difference could be located at the inlet or the outlet of the heat
exchanger depending on the configuration adopted for heat exchange (co-current or counter-
current).
Partially welded heat exchangers: have alternating welded channels and gasket channels. The
advantage of welding the plate pairs is that, except for a small gasket around the ports, other
materials are eliminated. The operating conditions are the same as the plate and frame heat
exchanger, this type of heat exchanger is more used for the evaporation and the condensation
of refrigerants because it limits refrigerant leaks.
The brazed plate heat exchanger: consists of a pack of pressed-plate brazed together, thus
completely eliminating the use of gaskets. The frame can also be eliminated. These heat
54
exchangers have heat transfer capacities up to 600 kW. Plate materials are usually made of
Stainless steel. Copper brazed units are available for temperatures up to 225°C and a
maximum operating pressure of 3 MPa, but copper braze may produce an incompatibility with
some working media. Nickel brazed units are available for temperatures up to 400°C and
maximum operating pressures of 1.6 MPa.
The welded plate heat exchanger: consists of a pack of pressed-plate welded together, thus
this heat exchanger cannot be dismounted. This heat exchanger can be made from a wide
range of metal materials, provided that they can be welded and cold-formed. Plate materials
include stainless steel, high temperature steel, copper and alloys, nickel and alloys, Hastelloy
and titanium. Depending on the material used, the welded-plate heat exchanger can operate
at temperatures up to 900°C and, in cryogenic applications, down to -200°C. The broad
application area of the welded-plate heat exchanger is: waste gas heat recovery, cryogenic
applications, and heat transfer between corrosive materials.
4.1.2 Findings
The selection of the most suitable technology of heat exchanger depends on the operating
conditions such as operating pressures and temperatures, cost, fouling, and material
compatibility. For liquid phase-change heat exchangers (boiler and condenser), if the operating
pressure is limited to less than 2.5 MPa and temperature is lower than 225°C, the brazed-plate
heat exchanger constitutes one of the most adequate solutions. If a higher temperature or
pressure is required, a fully welded plate-heat exchanger could be the choice, depending on
the design criteria.
However, for liquid-gas heat exchangers (recuperators), the heat transfer coefficient of the gas
side is 1/10 to 1/100 of that on the liquid side. Therefore, for a thermally balanced design to
obtain an overall heat coefficient of the same magnitude on each fluid side of the heat
exchanger, fins are required to increase the gas side surface area. Thus, the common heat
exchangers used for liquid-to-gas heat exchanger are of the extended surface and tubular,
plate-fin type. If the operating temperature and pressure could be tolerated with an
aluminium plate-fin heat exchanger, then this could be used, since it represents a compact
solution and an acceptable cost.
Cost represents a very important factor for selecting heat exchanger type. In general plate
heat exchangers have a lower total cost than other heat exchanger types when stainless steel,
titanium and other highly quality materials are used. Since tubes are more expensive than
extended surfaces and the heat transfer surface area density of a tubular core is generally
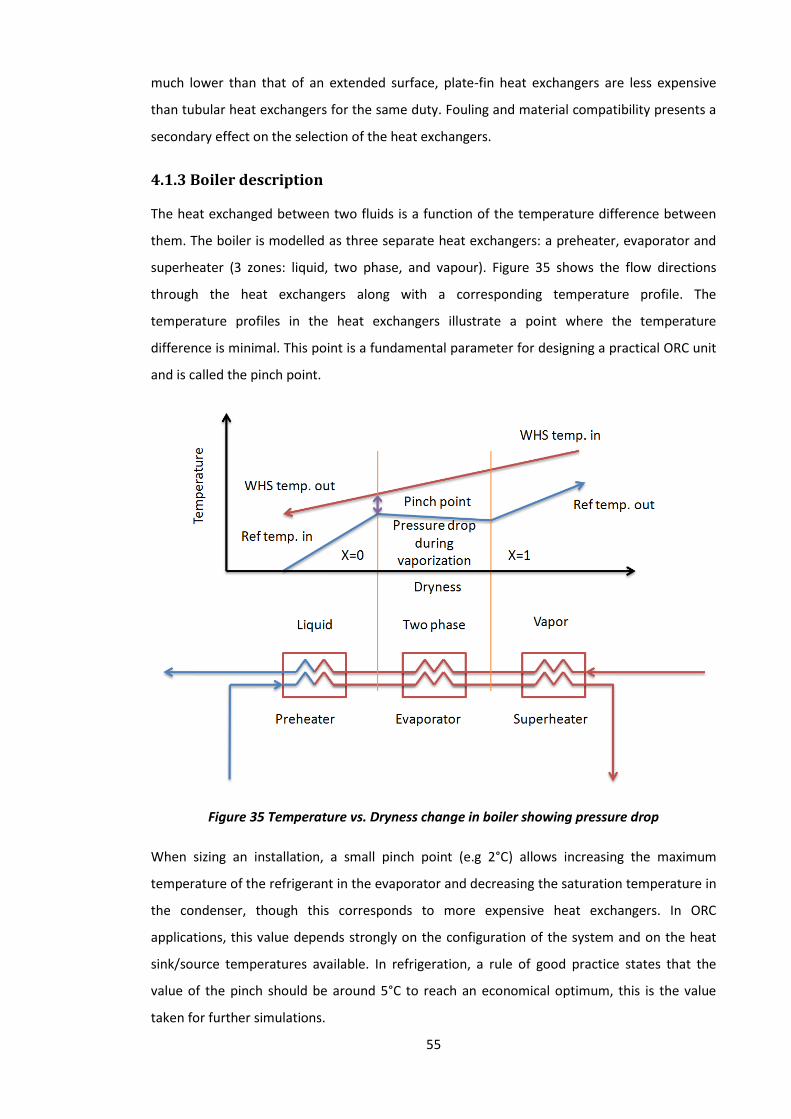
55
much lower than that of an extended surface, plate-fin heat exchangers are less expensive
than tubular heat exchangers for the same duty. Fouling and material compatibility presents a
secondary effect on the selection of the heat exchangers.
4.1.3 Boiler description
The heat exchanged between two fluids is a function of the temperature difference between
them. The boiler is modelled as three separate heat exchangers: a preheater, evaporator and
superheater (3 zones: liquid, two phase, and vapour). Figure 35 shows the flow directions
through the heat exchangers along with a corresponding temperature profile. The
temperature profiles in the heat exchangers illustrate a point where the temperature
difference is minimal. This point is a fundamental parameter for designing a practical ORC unit
and is called the pinch point.
Figure 35 Temperature vs. Dryness change in boiler showing pressure drop
When sizing an installation, a small pinch point (e.g 2°C) allows increasing the maximum
temperature of the refrigerant in the evaporator and decreasing the saturation temperature in
the condenser, though this corresponds to more expensive heat exchangers. In ORC
applications, this value depends strongly on the configuration of the system and on the heat
sink/source temperatures available. In refrigeration, a rule of good practice states that the
value of the pinch should be around 5°C to reach an economical optimum, this is the value
taken for further simulations.
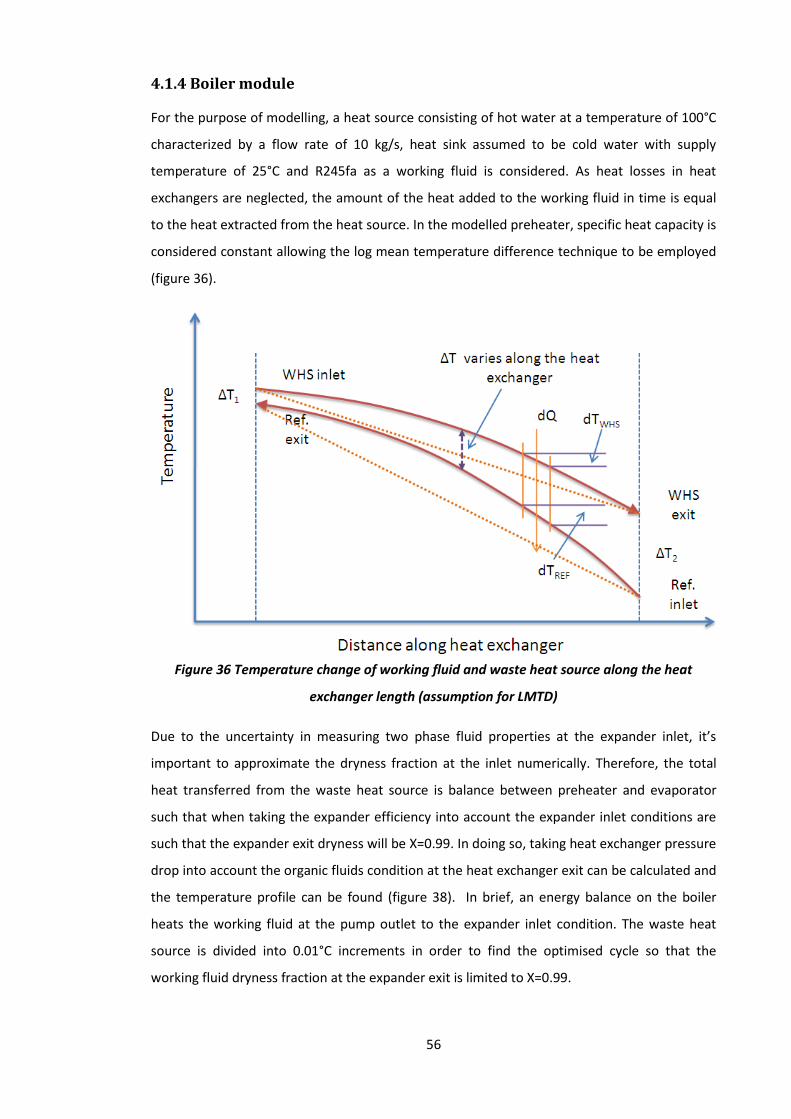
56
4.1.4 Boiler module
For the purpose of modelling, a heat source consisting of hot water at a temperature of 100°C
characterized by a flow rate of 10 kg/s, heat sink assumed to be cold water with supply
temperature of 25°C and R245fa as a working fluid is considered. As heat losses in heat
exchangers are neglected, the amount of the heat added to the working fluid in time is equal
to the heat extracted from the heat source. In the modelled preheater, specific heat capacity is
considered constant allowing the log mean temperature difference technique to be employed
(figure 36).
Figure 36 Temperature change of working fluid and waste heat source along the heat
exchanger length (assumption for LMTD)
Due to the uncertainty in measuring two phase fluid properties at the expander inlet, it’s
important to approximate the dryness fraction at the inlet numerically. Therefore, the total
heat transferred from the waste heat source is balance between preheater and evaporator
such that when taking the expander efficiency into account the expander inlet conditions are
such that the expander exit dryness will be X=0.99. In doing so, taking heat exchanger pressure
drop into account the organic fluids condition at the heat exchanger exit can be calculated and
the temperature profile can be found (figure 38). In brief, an energy balance on the boiler
heats the working fluid at the pump outlet to the expander inlet condition. The waste heat
source is divided into 0.01°C increments in order to find the optimised cycle so that the
working fluid dryness fraction at the expander exit is limited to X=0.99.
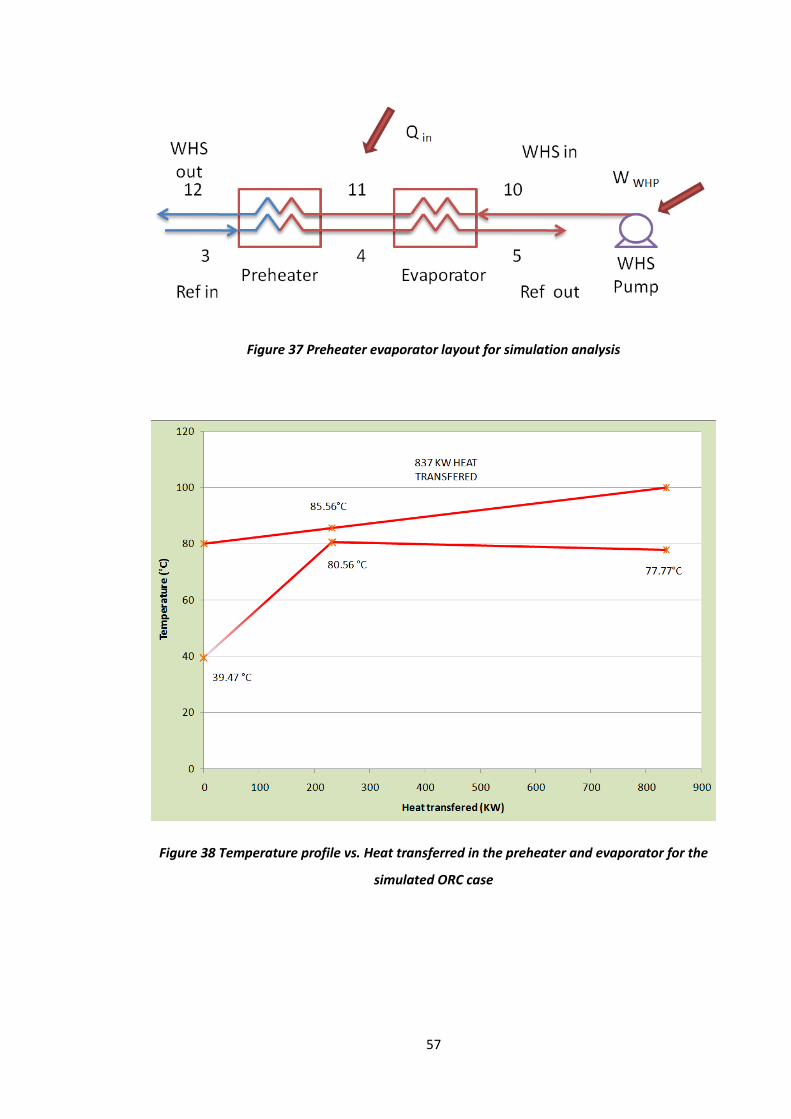
57
Figure 37 Preheater evaporator layout for simulation analysis
Figure 38 Temperature profile vs. Heat transferred in the preheater and evaporator for the
simulated ORC case

58
h (KJ/KG) , , 3 4 , , 4 5, & ,PRE IN PRE EXIT EVP IN EVP EXITh h h h h h h h
P (BAR) , , 3 4 , , 4 5, & ,PRE IN PRE EXIT EVP IN EVP EXITP P P P P P P P
T (°C) , , 3 4 , , 4 5, & ,PRE IN PRE EXIT EVP IN EVP EXITT T T T T T T T
S (KJ/Kgk) , , 3 4 , , 4 5, & ,PRE IN PRE EXIT EVP IN EVP EXITS S S S S S S S
Methodology,
Model &
Calculations
Input
, 10 100WHS INT T C
, , 11 85.56WHS EVP EXITT T C
, 12 80WHS EXITT T C
, 4.186 /P WHSC KJ Kg C
10 /WHSMFR Kg Sec
0.15BOILER PRE EVPPD PD PD BAR
5BOILPP C
waste heat source
IN PRE EVPQ Q Q
, , ,( )IN WHS P WHS WHS IN WHS EXITQ MFR C T T
, 10 12( )IN WHS P WHSQ MFR C T T
837.2INQ KW
Preheater
233PREQ KW
, , , 12 3( )A WHS EXIT WF PRE INT T T T T
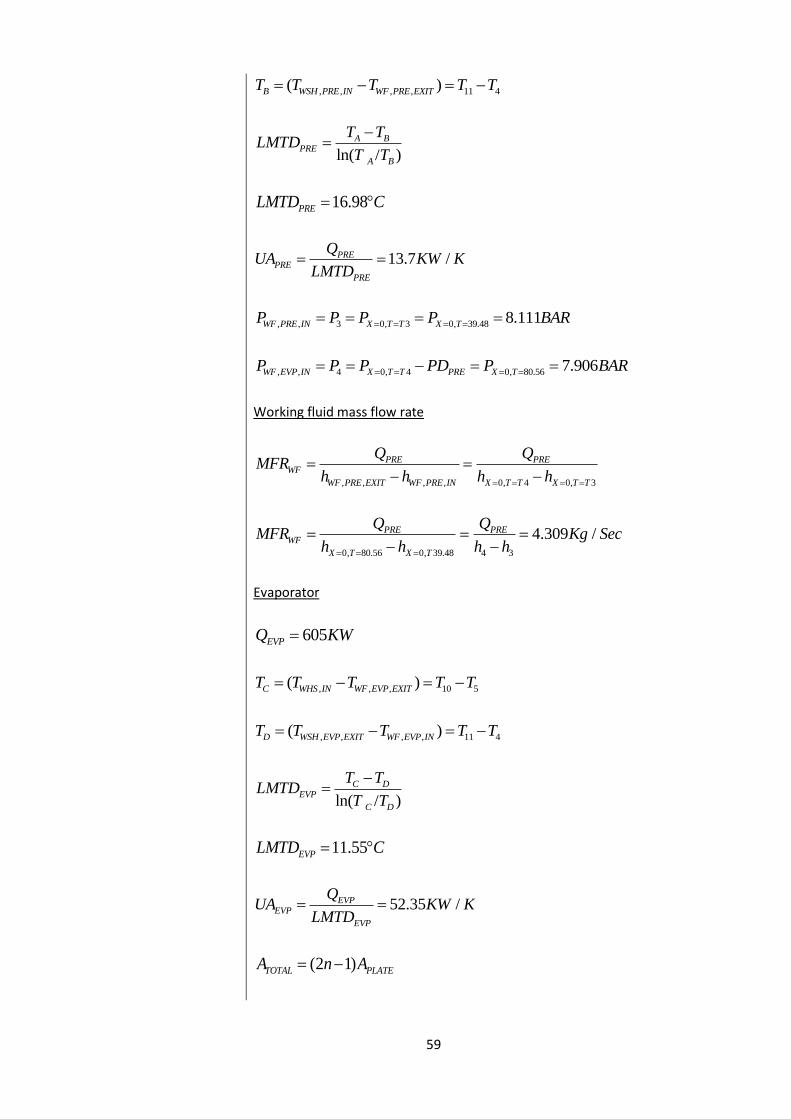
59
, , , , 11 4( )B WSH PRE IN WF PRE EXITT T T T T
ln( / )
A BPRE
A B
T TLMTD
T T
16.98PRELMTD C
13.7 /PREPRE
PRE
QUA KW K
LMTD
, , 3 0, 3 0, 39.48 8.111WF PRE IN X T T X TP P P P BAR
, , 4 0, 4 0, 80.56 7.906WF EVP IN X T T PRE X TP P P PD P BAR
Working fluid mass flow rate
, , , , 0, 4 0, 3
PRE PREWF
WF PRE EXIT WF PRE IN X T T X T T
Q QMFR
h h h h
0, 80.56 0, 39.48 4 3
4.309 /PRE PREWF
X T X T
Q QMFR Kg Sec
h h h h
Evaporator
605EVPQ KW
, , , 10 5( )C WHS IN WF EVP EXITT T T T T
, , , , 11 4( )D WSH EVP EXIT WF EVP INT T T T T
ln( / )
C DEVP
C D
T TLMTD
T T
11.55EVPLMTD C
52.35 /EVPEVP
EVP
QUA KW K
LMTD
(2 1)TOTAL PLATEA n A
60
, , 5 0.937, 5 0.937, 77.77 7.374WF EVP EXIT X T T EVP X TP P P PD P BAR
, 5 , 4EVP EVP
EVP EXIT EVP IN
WF WF
Q Qh h h h
MFR MFR
4.1.5 Overall heat transfer coefficient
Predicting the overall heat transfer coefficient for the heat exchanger normally depends on
detailed fluid property data and geometry information as well as an appropriate correlation.
The nature of two-phase flow in ORC heat exchangers is such that the vapour and the liquid
phase are of the same chemical substance (two-phase single-component). Heat transfer in a
two-phase two-component system (e.g. in air-water flow) has a relatively simple impact on the
system behaviour: only the physical (material) properties of the phases are temperature
dependent. Two-phase single-component systems are far more complicated, because the heat
transfer and the temperature cause (in addition to changes of the physical properties of the
phases) mass exchanges between the phases, by evaporation, flashing and condensation. Two-
phase systems like the liquid-vapour systems require their own, very complicated
mathematical modelling and dedicated two-phase single-component experiments.
In calculating the overall heat transfer coefficient for the heat exchangers, only the convective
heat transfer coefficient at the saturated liquid condition for the refrigerant are considered as
two phase heat transfer properties of R-245fa are not defined in NIST. Delil’s [59] work
summarised that the heat transfer process in two-component systems is based on caloric heat
only, the mechanisms are restricted to conduction and convection where as heat transfer in
single-component systems is far more efficient, as the transport is not only by caloric heat but
also by the larger contribution of latent heat (evaporation or condensation).
Though liquid-vapour flows obey all basic fluid mechanics laws, their constitutive equations are
more numerous and more complicated than the equations for single-phase flows. The
complications are due to the fact that inertia, viscosity and buoyancy effects can be attributed
both to the liquid phase and to the vapour phase, and also due to the impact of surface
tension effects [59].
An extra major complication for heat exchangers is the spatial distribution of liquid and
vapour, the so-called flow pattern. El Hajal et al. [60] and their research group [61] developed
a flow regime map for two phase fluids. They classified the flow into fully-stratified, stratified-
wavy, intermittent, annular, mist and bubbly flow regimes.
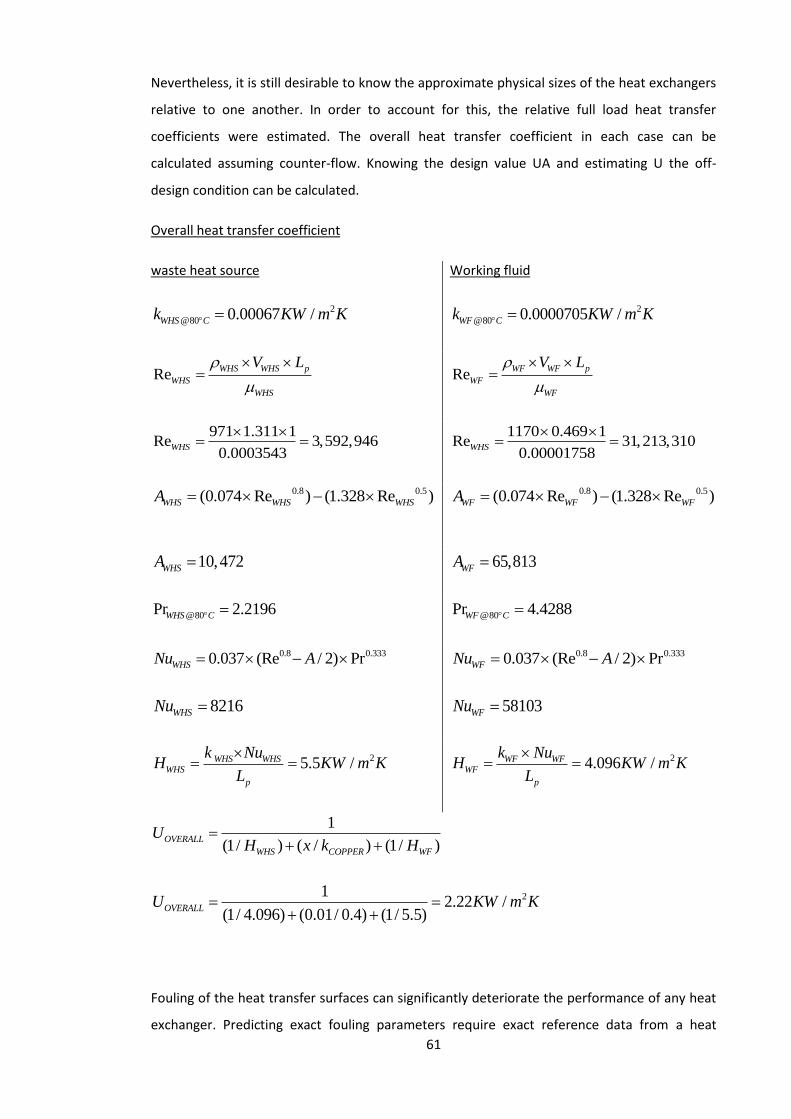
61
Nevertheless, it is still desirable to know the approximate physical sizes of the heat exchangers
relative to one another. In order to account for this, the relative full load heat transfer
coefficients were estimated. The overall heat transfer coefficient in each case can be
calculated assuming counter-flow. Knowing the design value UA and estimating U the off-
design condition can be calculated.
Overall heat transfer coefficient
waste heat source Working fluid
2
@80 0.00067 /WHS Ck KW m K
2
@80 0.0000705 /WF Ck KW m K
ReWHS WHS p
WHS
WHS
V L
ReWF WF p
WF
WF
V L
971 1.311 1Re 3,592,946
0.0003543WHS
1170 0.469 1Re 31,213,310
0.00001758WHS
0.8 0.5(0.074 Re ) (1.328 Re )WHS WHS WHSA
0.8 0.5(0.074 Re ) (1.328 Re )WF WF WFA
10,472WHSA
65,813WFA
@80Pr 2.2196WHS C @80Pr 4.4288WF C
0.8 0.3330.037 (Re / 2) PrWHSNu A
0.8 0.3330.037 (Re / 2) PrWFNu A
8216WHSNu
58103WFNu
25.5 /WHS WHSWHS
p
k NuH KW m K
L
24.096 /WF WFWF
p
k NuH KW m K
L
1
(1/ ) ( / ) (1/ )OVERALL
WHS COPPER WF
UH x k H
212.22 /
(1/ 4.096) (0.01/ 0.4) (1/ 5.5)OVERALLU KW m K
Fouling of the heat transfer surfaces can significantly deteriorate the performance of any heat
exchanger. Predicting exact fouling parameters require exact reference data from a heat

62
exchanger working at the same conditions. In the absence of such data, an adopted value can
give a good estimate. The fouling allowance can be expressed either as an additional
percentage of the heat transfer area, or as a fouling factor expressed in the units m2°C/W or
m2h°C/kcal. A plate heat exchanger is designed with higher turbulence than a shell and tube
exchanger, and this generally means a lower fouling allowance for the same duty. One could
say that the margin included in a plate heat exchanger is normally 0.000025 m2°C/W and a
typical fouling factor for organic heat transfer fluids is around 0.00018 [58].
63
4.2 Expander
4.2.1 Lubrication
The lubrication of expanders used in closed circuit vapour power generating systems in which
the lubricant is soluble in, or miscible with the working fluid has been investigated by Smith et
al. [4] [5] [44]. In ORC systems it possible that the lubricant is dissolved or emulsified with the
liquid phase of the working fluid and a proportion of the liquid phase is fed along the bearing
supply path to the bearing where heat generated in the bearing evaporates the working fluid,
leaving sufficiently concentrated lubricant in the bearing to provide adequate lubrication of
the bearing. The lubricant leaving the bearing and entering the expander travels to the
condenser with the working fluid exhaust from the expander. The lubricant again mixes with,
or dissolves in the liquid phase formed in the condenser and returns via the feed pump to the
heater. Build-up or deposit of lubricant in the evaporator section of the heater, which would
reduce its efficiency is prevented by its retention in the liquid recirculating through the
evaporator section and partially drawn off to flow through the expander, condenser and feed
pump. Advantageously, each bearing supporting the rotary element or elements of the
expander is lubricated in this manner. The total mass of lubricant required is not more than 5%
of the mass of working fluid. Typically 0.5% to 2% is sufficient [4] [5].
4.2.2 Benefits of twin screw expander
A screw expander comprises a meshing pair of helical lobed rotors contained in a casing which
together form a working chamber, the volume of which depends only on the angle of rotation.
Twin screw expanders have the following advantages:
Unlike the mode of power transmission in turbomachinery, power is transferred
between the fluid and the rotor shafts by pressure on the rotors, which changes with
the fluid volume. Consequently, the fluid velocities within them are approximately
one order of magnitude less than in turbines [4]
The twin screw expander has an isentropic efficiency of up to 75%
They are compact in size
They are inexpensive to manufacture compared to turbines
There are no valves to limit the flow
Expanders are scalable
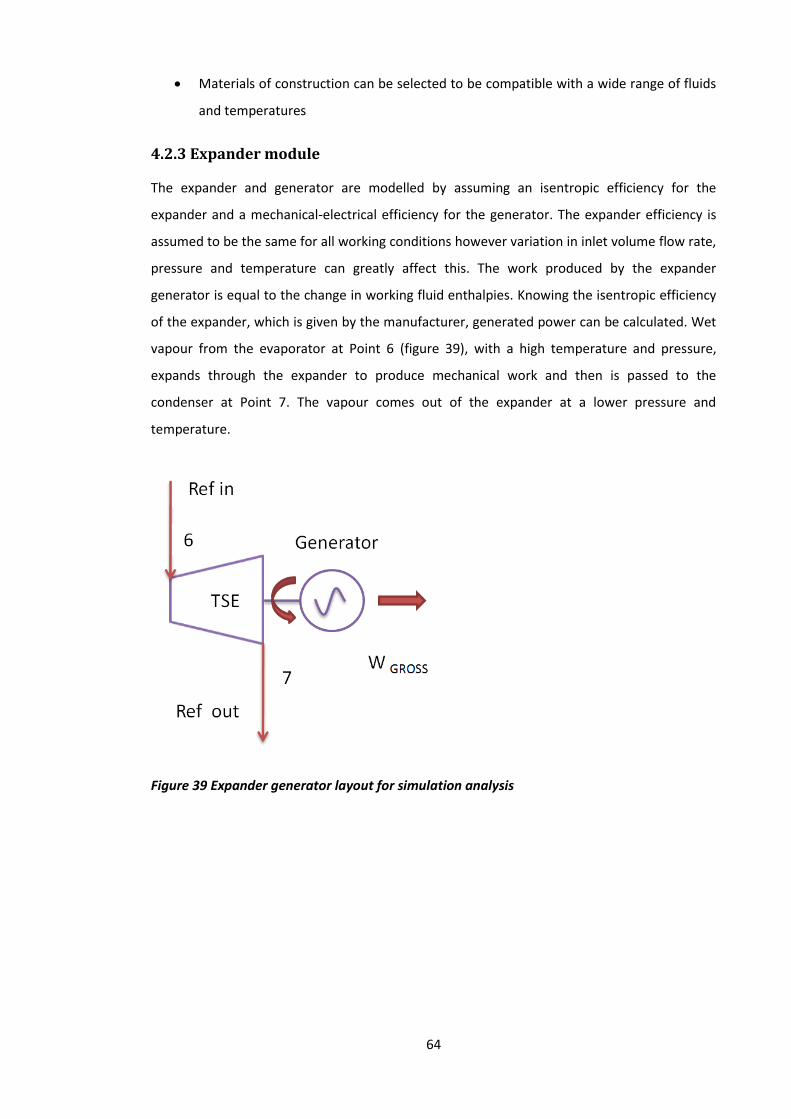
64
Materials of construction can be selected to be compatible with a wide range of fluids
and temperatures
4.2.3 Expander module
The expander and generator are modelled by assuming an isentropic efficiency for the
expander and a mechanical-electrical efficiency for the generator. The expander efficiency is
assumed to be the same for all working conditions however variation in inlet volume flow rate,
pressure and temperature can greatly affect this. The work produced by the expander
generator is equal to the change in working fluid enthalpies. Knowing the isentropic efficiency
of the expander, which is given by the manufacturer, generated power can be calculated. Wet
vapour from the evaporator at Point 6 (figure 39), with a high temperature and pressure,
expands through the expander to produce mechanical work and then is passed to the
condenser at Point 7. The vapour comes out of the expander at a lower pressure and
temperature.
Figure 39 Expander generator layout for simulation analysis
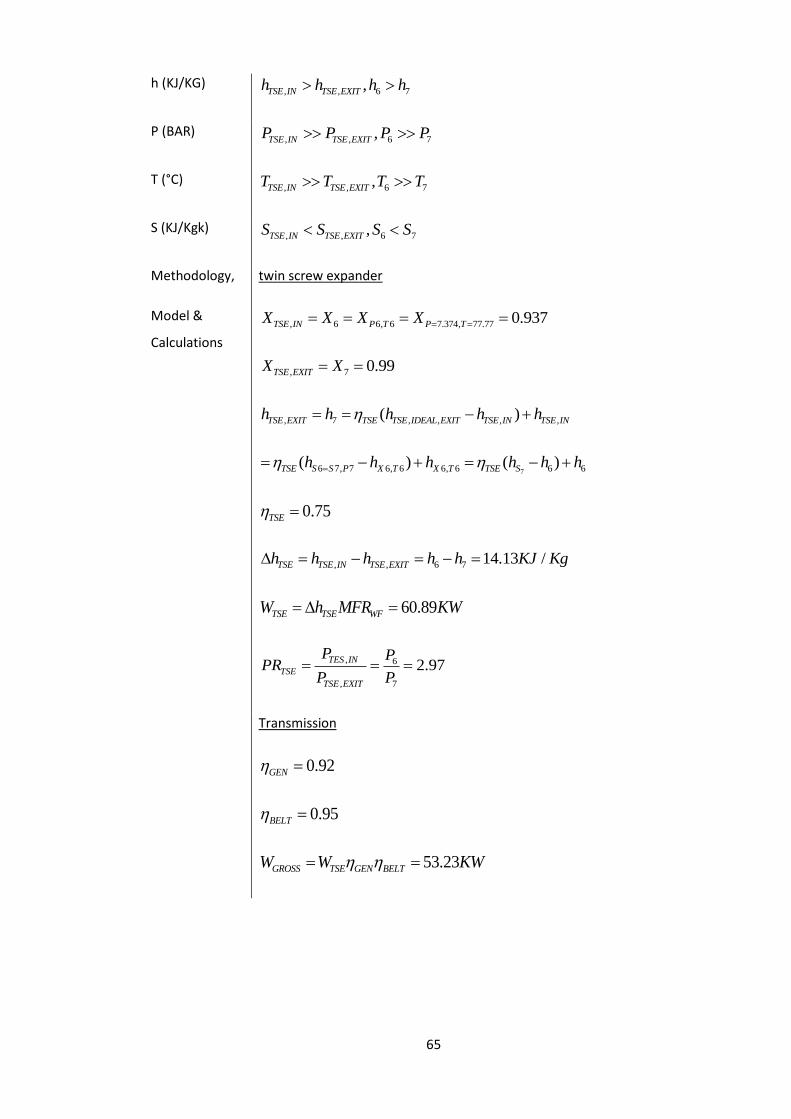
65
h (KJ/KG) , , 6 7,TSE IN TSE EXITh h h h
P (BAR) , , 6 7,TSE IN TSE EXITP P P P
T (°C) , , 6 7,TSE IN TSE EXITT T T T
S (KJ/Kgk) , , 6 7,TSE IN TSE EXITS S S S
Methodology,
Model &
Calculations
twin screw expander
, 6 6, 6 7.374, 77.77 0.937TSE IN P T P TX X X X
, 7 0.99TSE EXITX X
, 7 , , , ,( )TSE EXIT TSE TSE IDEAL EXIT TSE IN TSE INh h h h h
76 7, 7 6, 6 6, 6 6 6( ) ( )TSE S S P X T X T TSE Sh h h h h h
0.75TSE
, , 6 7 14.13 /TSE TSE IN TSE EXITh h h h h KJ Kg
60.89TSE TSE WFW h MFR KW
, 6
, 7
2.97TES IN
TSE
TSE EXIT
P PPR
P P
Transmission
0.92GEN
0.95BELT
53.23GROSS TSE GEN BELTW W KW
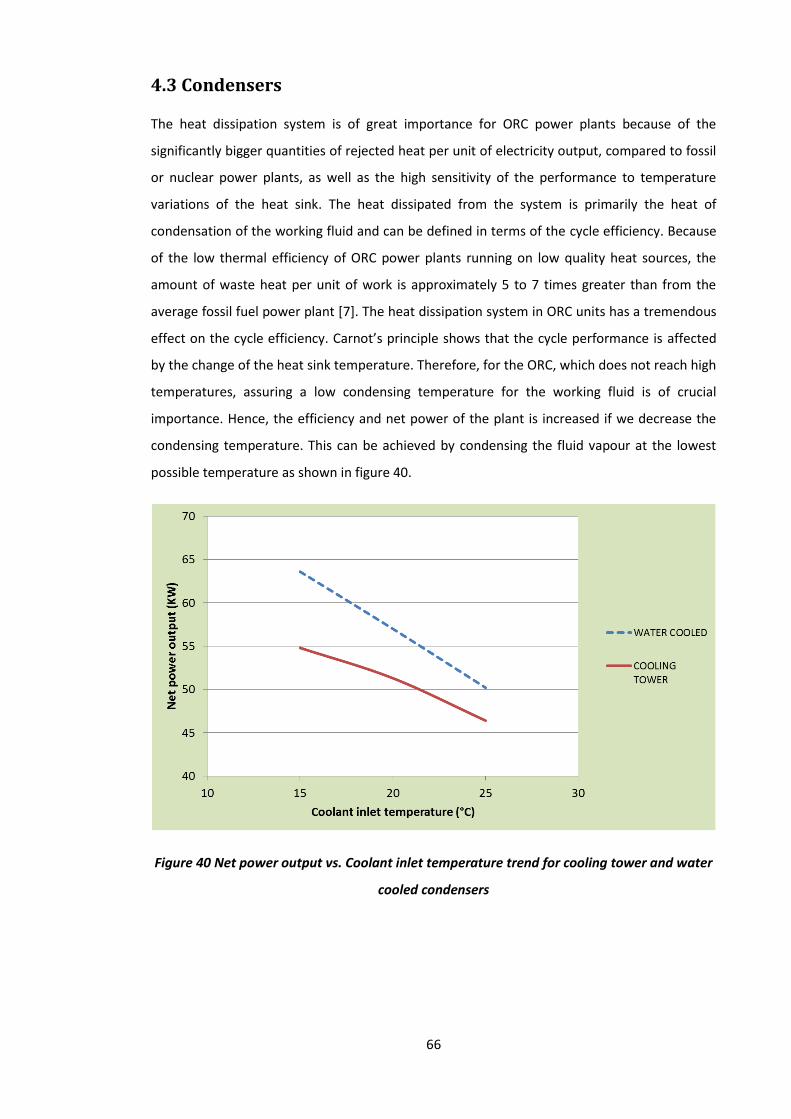
66
4.3 Condensers
The heat dissipation system is of great importance for ORC power plants because of the
significantly bigger quantities of rejected heat per unit of electricity output, compared to fossil
or nuclear power plants, as well as the high sensitivity of the performance to temperature
variations of the heat sink. The heat dissipated from the system is primarily the heat of
condensation of the working fluid and can be defined in terms of the cycle efficiency. Because
of the low thermal efficiency of ORC power plants running on low quality heat sources, the
amount of waste heat per unit of work is approximately 5 to 7 times greater than from the
average fossil fuel power plant [7]. The heat dissipation system in ORC units has a tremendous
effect on the cycle efficiency. Carnot’s principle shows that the cycle performance is affected
by the change of the heat sink temperature. Therefore, for the ORC, which does not reach high
temperatures, assuring a low condensing temperature for the working fluid is of crucial
importance. Hence, the efficiency and net power of the plant is increased if we decrease the
condensing temperature. This can be achieved by condensing the fluid vapour at the lowest
possible temperature as shown in figure 40.
Figure 40 Net power output vs. Coolant inlet temperature trend for cooling tower and water
cooled condensers
67
4.3.1 Condensers types
4.3.1.1 Water vs. air cooled
In nature, available cooling fluids are either water (from sea, lakes, rivers, or subsurface) or air.
In terms of heat transfer, water has more favourable properties than air, as follows:
Water has over 4 times higher specific heat than ambient air.
Water is 830 times denser than air.
Water has a volumetric heat capacity approximately 3450 times that of ambient air.
This implies that in order to have the same heat transfer effect, 3450 more volume of
air has to be moved than in the case of water, resulting in the need for bulky and
expensive equipment for air-handling, plus higher electricity consumption for the air
fans than the water pumps.
In condensers, water yields typical heat transfer coefficient many times higher than
those for air. This implies that the surface of the condenser and the corresponding
costs will be accordingly higher if air is used as cooling fluid rather than water. The
heat exchange surface has a direct impact on the weight and size of the condenser,
which are the most important economic variables defining the corresponding costs.
4.3.1.2 Surface water (once-through systems)
The cooling fluid is water which is transported to the ORC power plant through pipes from a
river, a lake or the sea. The temperature of the cooling water in this case varies in proportion
to season’s temperature. It can be 10°C-25°C. This is why surface water yields the lowest
condensing pressure and temperature. As far as it concerns the plant’s cost, the electricity
consumption for transporting the water (pipes, pumps etc.) may not be negligible, depending
on the location and distance of the water source. For heat exchange plate heat exchangers
may be a tempting option due to their compact size, their mass production and easy to
dismantle/mantle and clean capabilities and their high overall heat transfer coefficient, typical
values of which are 10-20 kW/m². Their main advantage is that they can yield the lowest
possible condensing temperatures, and hence the maximum conversion efficiency because
surface waters tends to have lower temperatures than ambient air during the summer period
[62].
68
Main drawbacks include:
Fouling or corrosion in the condenser in cases of adverse chemistry
High capital costs for piping and pumping stations or electricity consumption when the
water has to be transported from large distances
Environmentalists have real concerns about an excessive heating up of the cooling
water source during the summer months, so causing damage to the surrounding
ecosystem
Need for large water quantity. There are few places where sufficient water is available.
Hence, the market for water cooled units is very small.
4.3.1.3 Wet type cooling towers
The cooling water that is used in the condenser is conveyed to a cooling tower in order to
reduce its temperature so that it will be recycled and looped through the system. An important
reduction of its temperature is accomplished in the tower. In small or medium size plants, such
as geothermal power plants, cooling towers usually use mechanical ventilation (fan) for the
advection of the air stream. In these plants cooling towers that are mostly used are cross-flow
and traverse-flow. The typical temperature difference between the inlet and outlet cooling
water is 10°C. The temperature of the cooling water that comes out of the cooling tower
reaches at least 25°C, resulting in condensing temperatures around 40°C, depending on the
ambient temperature [62].
Wet cooling towers combine the use of water as a cooling media to the condenser and benefit
from its favourable heat capacity and heat transfer properties compared with air, while they
do not need the large volumes of surface water needed in once through cooling systems.
Instead, they evaporate water within the cooling tower, and need a much smaller quantity of
makeup water to compensate the evaporation losses plus the water blow down necessary to
maintain water quality.
4.3.1.4 Dry type cooling towers
In dry type cooling towers, the temperature of the air that comes out of the tower in order to
cool the fluid in the condenser is higher than 25°C. Typical values are 25-30°C resulting in
condensing temperatures around 40-50°C [63] [64]. In a dry type cooling tower no water
supply is necessary. Regarding auxiliary power consumption, they usually consume twice as
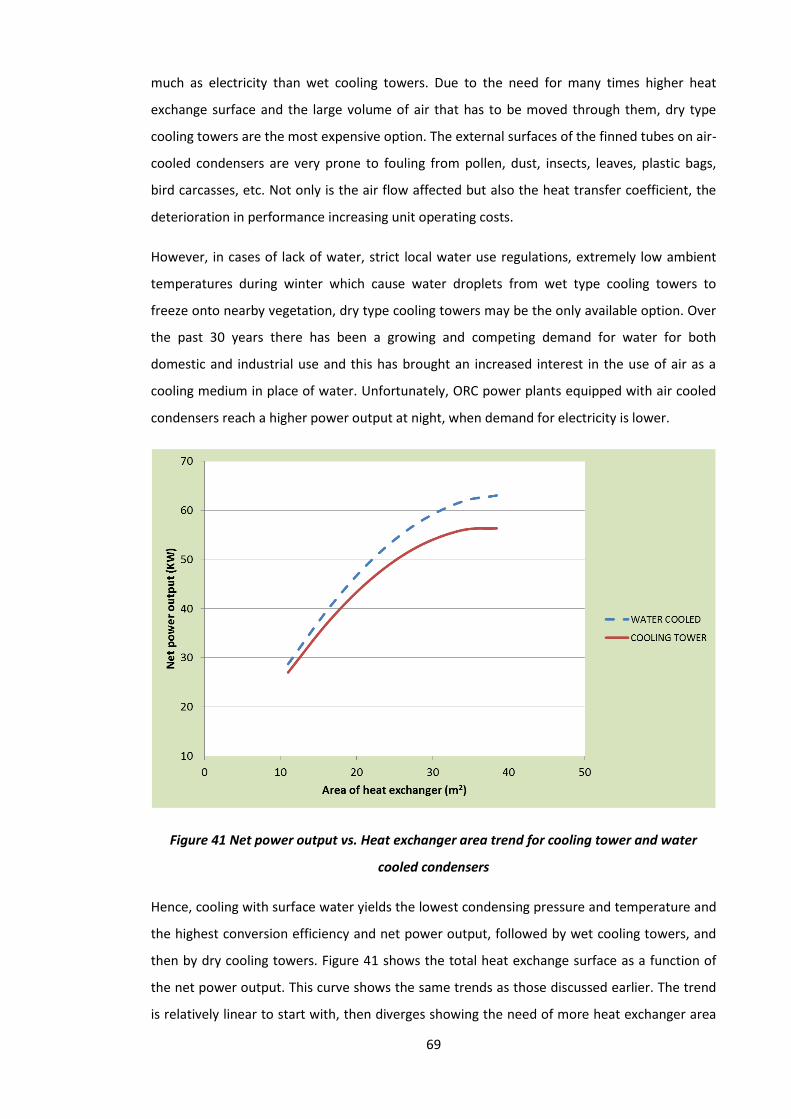
69
much as electricity than wet cooling towers. Due to the need for many times higher heat
exchange surface and the large volume of air that has to be moved through them, dry type
cooling towers are the most expensive option. The external surfaces of the finned tubes on air-
cooled condensers are very prone to fouling from pollen, dust, insects, leaves, plastic bags,
bird carcasses, etc. Not only is the air flow affected but also the heat transfer coefficient, the
deterioration in performance increasing unit operating costs.
However, in cases of lack of water, strict local water use regulations, extremely low ambient
temperatures during winter which cause water droplets from wet type cooling towers to
freeze onto nearby vegetation, dry type cooling towers may be the only available option. Over
the past 30 years there has been a growing and competing demand for water for both
domestic and industrial use and this has brought an increased interest in the use of air as a
cooling medium in place of water. Unfortunately, ORC power plants equipped with air cooled
condensers reach a higher power output at night, when demand for electricity is lower.
Figure 41 Net power output vs. Heat exchanger area trend for cooling tower and water
cooled condensers
Hence, cooling with surface water yields the lowest condensing pressure and temperature and
the highest conversion efficiency and net power output, followed by wet cooling towers, and
then by dry cooling towers. Figure 41 shows the total heat exchange surface as a function of
the net power output. This curve shows the same trends as those discussed earlier. The trend
is relatively linear to start with, then diverges showing the need of more heat exchanger area
70
for cooling towers to compete with water cooled condensers and finally resulting in very
marginal gains even by increasing the heat exchanger size. Regarding the need for cold water
supply, the order is reversed. In moderate climates, wet cooling towers are preferred as long
as a source of cooling water is available. Using a wet cooling tower, working fluid can be
cooled down to lower temperatures, which improves the efficiency of the cycle significantly. In
terms of costs, water cooled systems are generally considered less expensive to build and
operate as long as makeup water is available and cheap.
Industrial and geothermal cooling towers are all of the forced draft type, where the air flow
through them is induced by mechanically (electrically) driven fans. These absorb quite a
significant percentage of the ORC gross power output. Dry cooling is the most expensive
option due to the much higher heat capacity and heat transfer coefficient of water compared
with ambient air. Although in some arid areas plants using air-cooled condensers may be more
cost-effective, their power capacity is highly dependent on weather conditions and their net
power output usually fluctuates by 20-25% [7].
4.3.2 Condenser module
The condensing pressure is provided as an input to the global model. The pressure at state 9 is
the saturation pressure corresponding to the condensing temperature. For this simulation the
condensing pressure is dictated by three parameters the inlet temperature of the cooling
water (25°C), the minimum approach temperature (5°C) and the condenser temperature rise
(10°C). Hence, the condensation temperature for working fluid is fixed to 40°C. If river water is
the coolant, the hot water is dumped back into the river (its temperature is limited because of
environmental issues). The technique used to compute performance for the preheater and
evaporator is employed here with the condenser and slight sub-cooling (if needed). The only
difference is in the constrained variables. In the boiler, pressure is a design variable and mass
flow is a function of the heat exchanger performance. In the condensing section, mass flow
rate is known (determined in the boiler) and pressure is a function of the condenser
performance.
Heat transfer in the condenser can occur through three zones also: the desuperheating zone,
in which the organic vapour is reduced to saturated vapour, the condensing zone, in which the
organic fluid condenses from saturated vapour to saturated liquid, and a subcooling or drain
cooling zone, in which the saturated liquid is cooled to a temperature below its saturation
temperature.
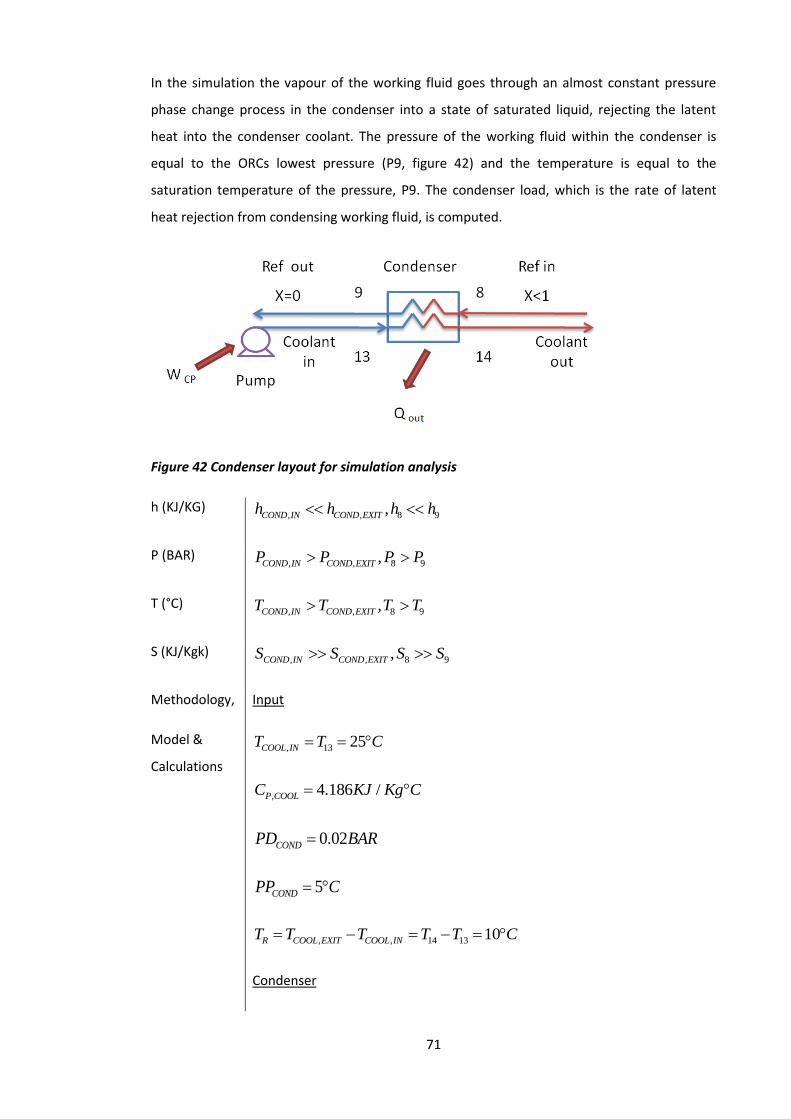
71
In the simulation the vapour of the working fluid goes through an almost constant pressure
phase change process in the condenser into a state of saturated liquid, rejecting the latent
heat into the condenser coolant. The pressure of the working fluid within the condenser is
equal to the ORCs lowest pressure (P9, figure 42) and the temperature is equal to the
saturation temperature of the pressure, P9. The condenser load, which is the rate of latent
heat rejection from condensing working fluid, is computed.
Figure 42 Condenser layout for simulation analysis
h (KJ/KG) , , 8 9,COND IN COND EXITh h h h
P (BAR) , , 8 9,COND IN COND EXITP P P P
T (°C) , , 8 9,COND IN COND EXITT T T T
S (KJ/Kgk) , , 8 9,COND IN COND EXITS S S S
Methodology,
Model &
Calculations
Input
, 13 25COOL INT T C
, 4.186 /P COOLC KJ Kg C
0.02CONDPD BAR
5CONDPP C
, , 14 13 10R COOL EXIT COOL INT T T T T C
Condenser
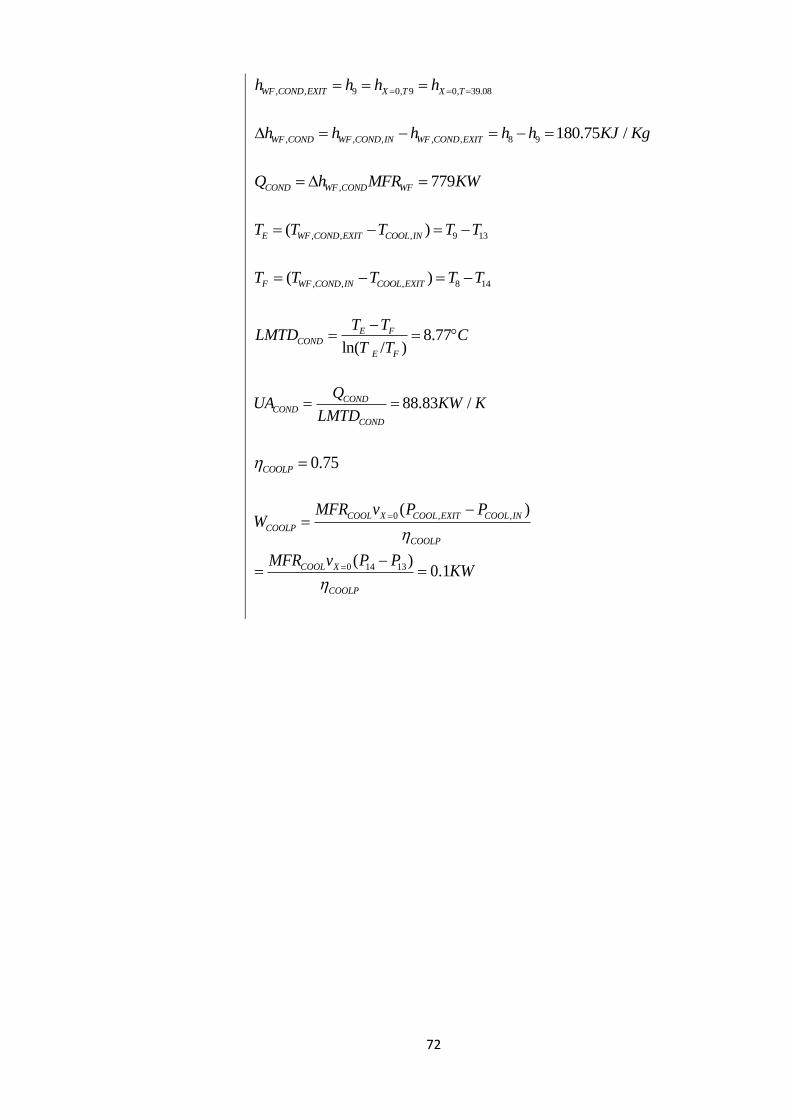
72
, , 9 0, 9 0, 39.08WF COND EXIT X T X Th h h h
, , , , , 8 9 180.75 /WF COND WF COND IN WF COND EXITh h h h h KJ Kg
, 779COND WF COND WFQ h MFR KW
, , , 9 13( )E WF COND EXIT COOL INT T T T T
, , , 8 14( )F WF COND IN COOL EXITT T T T T
8.77ln( / )
E FCOND
E F
T TLMTD C
T T
88.83 /CONDCOND
COND
QUA KW K
LMTD
0.75COOLP
0 , ,
0 14 13
( )
( )0.1
COOL X COOL EXIT COOL IN
COOLP
COOLP
COOL X
COOLP
MFR v P PW
MFR v P PKW
73
4.4 Feed pump
4.4.1 Pump selection & pressure
Pumps are divided into two fundamentals types: kinetic or positive displacement. In kinetic
displacement, a centrifugal force of the rotating element, called an impeller, impels kinetic
energy to the fluid, moving the fluid from the suction to the discharge. However, positive
displacement uses one or several reciprocating pistons, or a squeezing action of meshing
gears, lobes, or other moving bodies, to displace the media from one area into another. The
centrifugal pumps differ from the positive displacement pumps by their curves relating
pressure and flow. The slope of the centrifugal pump curve is mostly horizontal; when
increasing the differential pressure, the flow rate delivered decreases [65]. However, the
positive displacement pump curve is mostly vertical; when the flow rate does not depend on
the pressure head of the pump.
The selection of the best-suited technology of pumps depends not only on the volumetric flow
rates and the differential pressure, but also on the operating temperatures, inlet pressure,
outlet pressure, fluid type, and fluid viscosity. The pump selected has to operate with high
efficiency and for flow rates and pressure ratios that depend on the working fluid selected and
the desired power output. Regarding the low volumetric flow rates with the corresponding
pressure ratio, the positive displacement pump represents the most suitable option for small
ORC. On the other hand, ORC pumps should be able to operate with low viscosity fluids and
still ensure the desired head, which is only possible with pumps presenting very small
clearance between their lobes. In larger ORC units, centrifugal pumps are used where large
pressure rises are possible at high flow rates. Sometimes the required pressure ratios can be
even higher than a single stage centrifugal pump can handle, the need of multi-stage design is
required to cover all operating conditions of the ORC. Though it will represent a high cost and
a bulky pump system.
4.4.2 Cavitation
The pump operates on the condensate leaving the condenser, and thus precautions have to be
taken to prevent cavitation at the inlet. Cavitation occurs when the local pressure in the liquid
drops below the saturated vapour pressure corresponding to its operating temperature. The
liquid then, partially vaporizes the suction side is filled with vapour and the pump then does
not deliver the required flow rate of liquid. The effects of cavitation are manifested by pitting
and corrosion like effects on pump. More importantly, however, is the fact that cavitation
contributes to significant damage to seal, bearing and pump shafts, consequently resulting in
premature component failure and associated maintenance costs. In more common
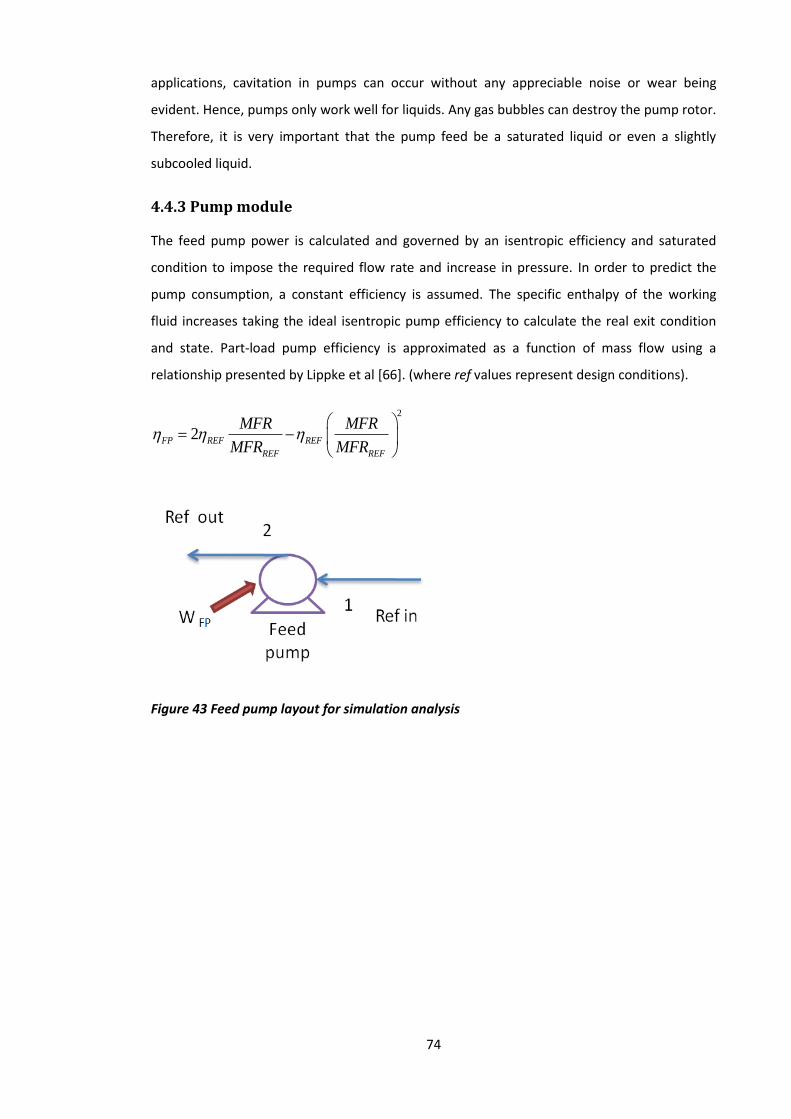
74
applications, cavitation in pumps can occur without any appreciable noise or wear being
evident. Hence, pumps only work well for liquids. Any gas bubbles can destroy the pump rotor.
Therefore, it is very important that the pump feed be a saturated liquid or even a slightly
subcooled liquid.
4.4.3 Pump module
The feed pump power is calculated and governed by an isentropic efficiency and saturated
condition to impose the required flow rate and increase in pressure. In order to predict the
pump consumption, a constant efficiency is assumed. The specific enthalpy of the working
fluid increases taking the ideal isentropic pump efficiency to calculate the real exit condition
and state. Part-load pump efficiency is approximated as a function of mass flow using a
relationship presented by Lippke et al [66]. (where ref values represent design conditions).
2
2FP REF REF
REF REF
MFR MFR
MFR MFR
Figure 43 Feed pump layout for simulation analysis
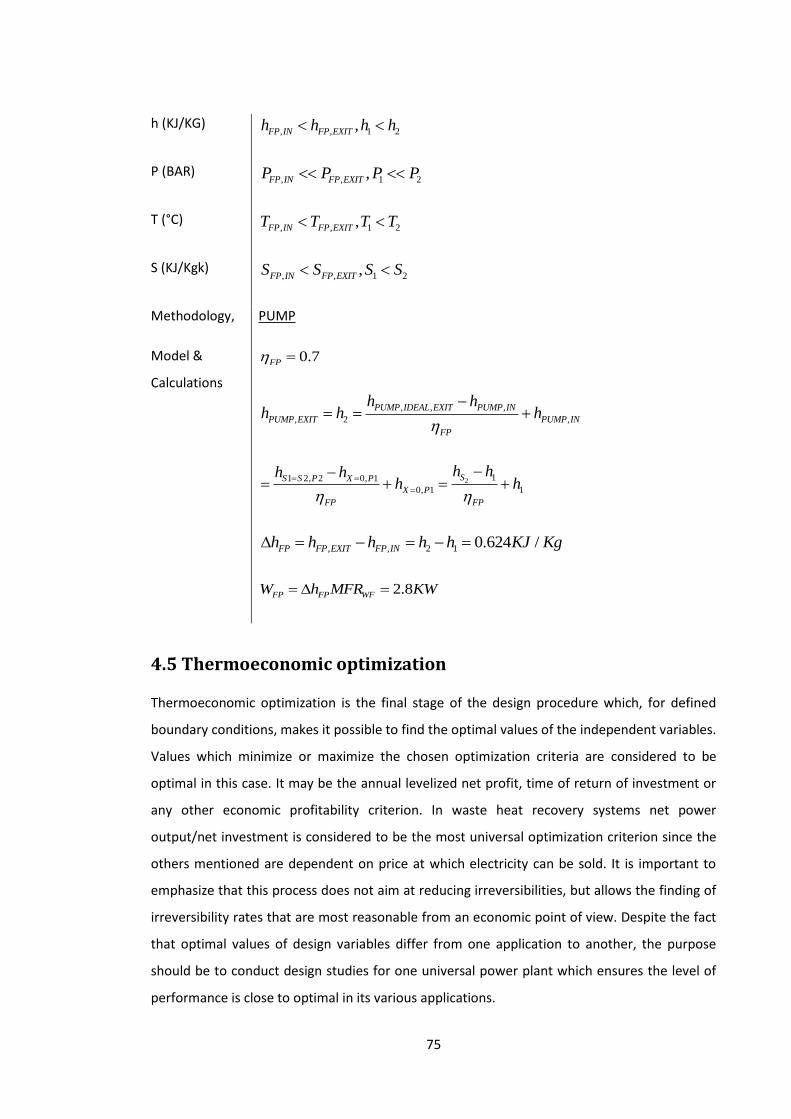
75
h (KJ/KG) , , 1 2,FP IN FP EXITh h h h
P (BAR) , , 1 2,FP IN FP EXITP P P P
T (°C) , , 1 2,FP IN FP EXITT T T T
S (KJ/Kgk) , , 1 2,FP IN FP EXITS S S S
Methodology,
Model &
Calculations
PUMP
0.7FP
, , ,
, 2 ,
PUMP IDEAL EXIT PUMP IN
PUMP EXIT PUMP IN
FP
h hh h h
2 11 2, 2 0, 1
0, 1 1
SS S P X P
X P
FP FP
h hh hh h
, , 2 1 0.624 /FP FP EXIT FP INh h h h h KJ Kg
2.8FP FP WFW h MFR KW
4.5 Thermoeconomic optimization
Thermoeconomic optimization is the final stage of the design procedure which, for defined
boundary conditions, makes it possible to find the optimal values of the independent variables.
Values which minimize or maximize the chosen optimization criteria are considered to be
optimal in this case. It may be the annual levelized net profit, time of return of investment or
any other economic profitability criterion. In waste heat recovery systems net power
output/net investment is considered to be the most universal optimization criterion since the
others mentioned are dependent on price at which electricity can be sold. It is important to
emphasize that this process does not aim at reducing irreversibilities, but allows the finding of
irreversibility rates that are most reasonable from an economic point of view. Despite the fact
that optimal values of design variables differ from one application to another, the purpose
should be to conduct design studies for one universal power plant which ensures the level of
performance is close to optimal in its various applications.
76
4.5.1 Economic analysis
The primary objective of every project is to be profitable. Therefore a proper design for any
cost effective thermal system requires evaluation of the project’s cost. Although more
expensive than conventional fossil-fuel power plants, ORC systems have their own place in the
energy market costing around $1,500-2,000 per kilowatt or 2-2.5 times that of conventional
Rankine cycle plants.
The total cost of production in an ORC power plant consists of capital investment, which is a
one-time cost, and operation and maintenance costs (O&M), which are continuous in nature.
When approaching the thermoeconomic analysis of such systems, some items must be taken
into account.
The efficiency of most components slightly decreases at part load
The cost formation process varies depending on the load level of each component
A rule to allocate the depreciation cost of components should be fixed with more
accuracy than for energy systems at steady operation
Energy exchanges with external networks take place at market price
4.5.2 Estimation of the Total Capital Investment (TCI)
The total Capital Investment of an ORC power plant can be shown as [56]:
TCI=FCI+SUC+WC+LRD+AFUDC
Where, FCI- Fixed capital investment, SUC- Start up costs, WC- Working capital, LRD- Costs of
licensing, research and development & AFUDC- Allowance for funds used during construction
4.5.2.1 Fixed capital investment
Fixed-capital investment cost is basically the capital needed to purchase and install all needed
equipment and build all necessary facilities. It consists of direct and indirect costs. The first
type, direct cost, represents all equipment, materials and labour involved in the creation of
permanent facilities. Indirect costs, although needed for completion of the project, do not
become a permanent part of the facilities.
Purchased equipment cost and the effect of size on the equipment cost: It should be
noted that among all heat exchangers used in the system, the most expensive are
those operating on a waste heat source fluid.

77
Installation of equipment: This cost accounts for transportation of equipment from the
factory, insurance, costs of labour, foundations, insulation, cost of working fluid,
thermal oil for the waste heat recovery loop and all other expenses related to the
erection of a power plant. However, ORC power plants that are assembled into one
unit when manufactured are transported relatively cheaply and easily because of their
small size.
Instrumentation, controls and electrical equipment: The cost of electrical equipment,
which for power plants usually includes distribution lines, emergency power supplies
etc
Piping: The cost of piping in the power plants
Engineering and supervision: This category of costs includes the cost of planning and
the design of the power plant as well as the manufacturer’s profit, the engineering
supervisor, inspection and administration. This is an expensive phase for traditional
power plants. However, in ORC standardised units that are preassembled, the cost of
supervision is lower as is the time of construction.
Construction: Expenses for construction include all the costs of temporary facilities and
contractor’s profits.
Other outlays consist of the start up costs, working capital and allowance for funds during
construction.
4.5.2.2 Start up costs
Start up costs are the expenses that have to be spent after the construction of the power plant
but before the unit can operate at a full load. They have to cover not only the cost of
equipment and work during startup time, but mainly the difference in income which is the
result of a partial load during this time.
4.5.2.3 Working capital
Working capital is the amount of money needed to cover the costs of power plant operation
before receiving payment. The unit should also work without permanent supervision therefore
labour costs are relatively low.
Operation and maintenance (O&M) costs: Operation and maintenance costs consist of
all expenses accrued during the operational phase of the power plant. They

78
encompass expenses related to labour, chemicals, spare parts, etc. Operation and
maintenance costs of the preheater and evaporator in geothermal applications are
significantly higher because of the risk of scaling and corrosion. If industrial waste heat
recovery applications are considered, this figure is relatively lower.
Contingencies: This cost should compensate for all unpredictable events which may
occur during transportation, construction and erection of the power plant. The
contingency factor dependent on the level of complexity and uniqueness of the power
plant. Since the risk of unpredictable events is low due to universal design, the
contingency factor is smaller than for an average power plant but it still has to be
taken into consideration.
4.6 Criteria of performance for ORC
The performance of a power plant can be expressed through some common performance
factors such as:
Net power output: Net power output of the power plant, also known as total power output,
can be calculated by subtracting all auxiliary power requirements from gross power output
produced by the expander/generator.
Cycle efficiency: Cycle efficiency is defined as the ratio between the net power of the cycle to
the boiler heat rate. It gives a measure about how much of the waste heat input to the
working fluid passing through the evaporator is converted to work.
The operating net power output & cycle efficiency may differ from the designed values. This
reduction may be caused due to the following reasons:
The expander efficiency being low during under expansion
The pump power consumption being higher than expected
The heat loss from system components such as pipes and expander can be large
because of inadequate insulation.
In order to improve the efficiency of this system, these issues have to be resolved using low-
cost solutions.
Capacity Factor: The capacity factor for a power plant is the ratio between average load and
rated load for a period of time and can be expressed as
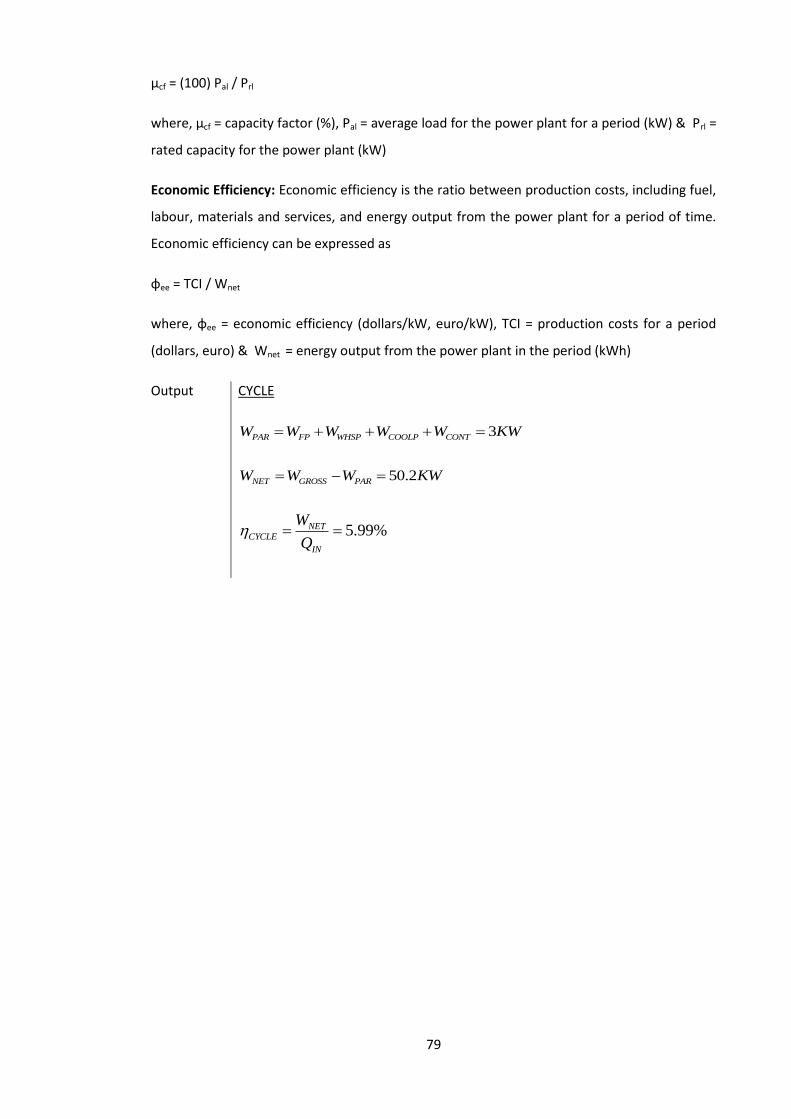
79
μcf = (100) Pal / Prl
where, μcf = capacity factor (%), Pal = average load for the power plant for a period (kW) & Prl =
rated capacity for the power plant (kW)
Economic Efficiency: Economic efficiency is the ratio between production costs, including fuel,
labour, materials and services, and energy output from the power plant for a period of time.
Economic efficiency can be expressed as
φee = TCI / Wnet
where, φee = economic efficiency (dollars/kW, euro/kW), TCI = production costs for a period
(dollars, euro) & Wnet = energy output from the power plant in the period (kWh)
Output CYCLE
3PAR FP WHSP COOLP CONTW W W W W KW
50.2NET GROSS PARW W W KW
5.99%NETCYCLE
IN
W
Q
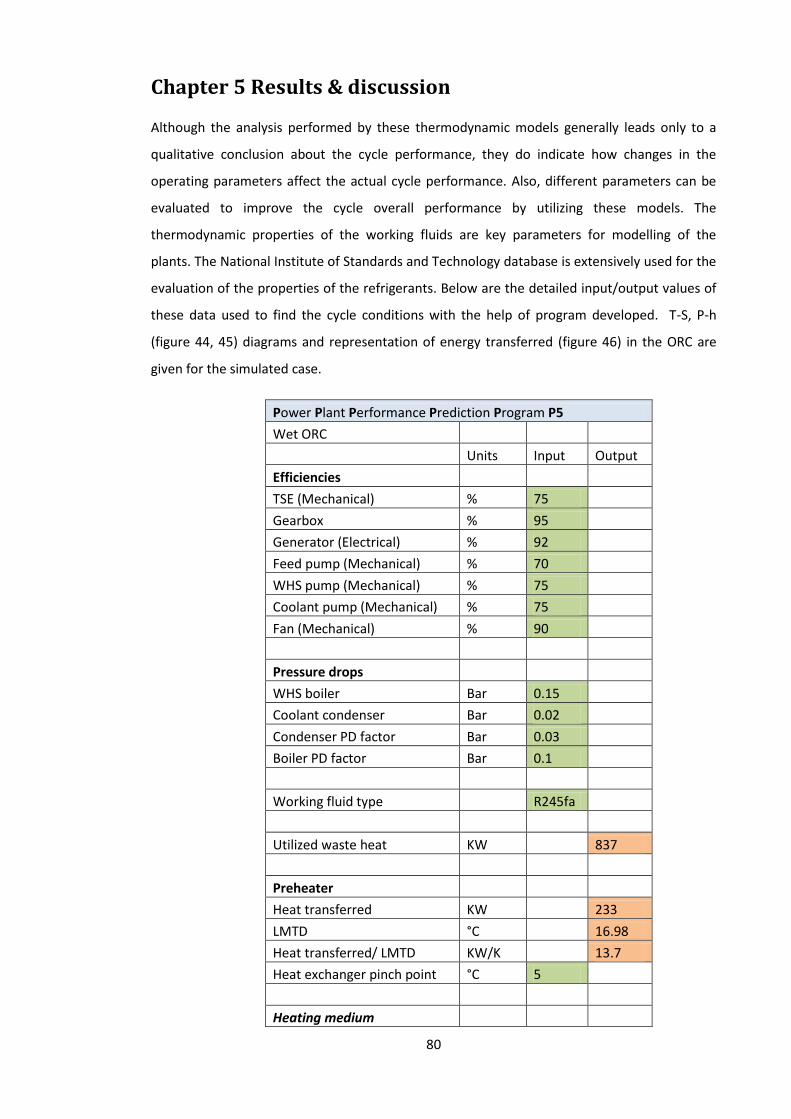
80
Chapter 5 Results & discussion
Although the analysis performed by these thermodynamic models generally leads only to a
qualitative conclusion about the cycle performance, they do indicate how changes in the
operating parameters affect the actual cycle performance. Also, different parameters can be
evaluated to improve the cycle overall performance by utilizing these models. The
thermodynamic properties of the working fluids are key parameters for modelling of the
plants. The National Institute of Standards and Technology database is extensively used for the
evaluation of the properties of the refrigerants. Below are the detailed input/output values of
these data used to find the cycle conditions with the help of program developed. T-S, P-h
(figure 44, 45) diagrams and representation of energy transferred (figure 46) in the ORC are
given for the simulated case.
Power Plant Performance Prediction Program P5
Wet ORC
Units Input Output
Efficiencies TSE (Mechanical) % 75
Gearbox % 95 Generator (Electrical) % 92 Feed pump (Mechanical) % 70 WHS pump (Mechanical) % 75 Coolant pump (Mechanical) % 75 Fan (Mechanical) % 90
Pressure drops WHS boiler Bar 0.15
Coolant condenser Bar 0.02 Condenser PD factor Bar 0.03 Boiler PD factor Bar 0.1
Working fluid type
R245fa
Utilized waste heat KW
837
Preheater Heat transferred KW
233
LMTD °C
16.98
Heat transferred/ LMTD KW/K
13.7
Heat exchanger pinch point °C 5
Heating medium

81
Inlet temp. °C
85.56
Exit temp. °C 80
Working fluid Pressure inlet Bar
8.11
Pressure exit Bar
7.91
Temp. inlet °C
39.47
Temp. exit °C
80.56
Enthalpy change KJ/KG
53.97
Evaporator Heat transferred KW
605
LMTD °C
11.55
Heat transferred/ LMTD KW/K
52.35
Heating medium Inlet temp. °C 100
Exit temp. °C
85.56
Specific heat KJ/Kg °C 4.186 MFR Kg/Sec 10
Working fluid Pressure inlet Bar
7.9
Pressure exit Bar
7.37
Temp. inlet °C
80.56
Temp. exit °C
77.77
Enthalpy change KJ/KG
140.28
TSE Inlet X %
0.937
Exit X %
0.99
Pressure inlet Bar
7.37
Pressure exit Bar
2.28
VER
3.13
Temp. inlet °C
77.8
Temp. exit °C
40
Enthalpy change KJ/KG
14.17
Shaft power KW
60.9
Condenser Type
water Heat transferred KW
779
LMTD °C
8.77
Heat transferred/ LMTD KW/K
88.83
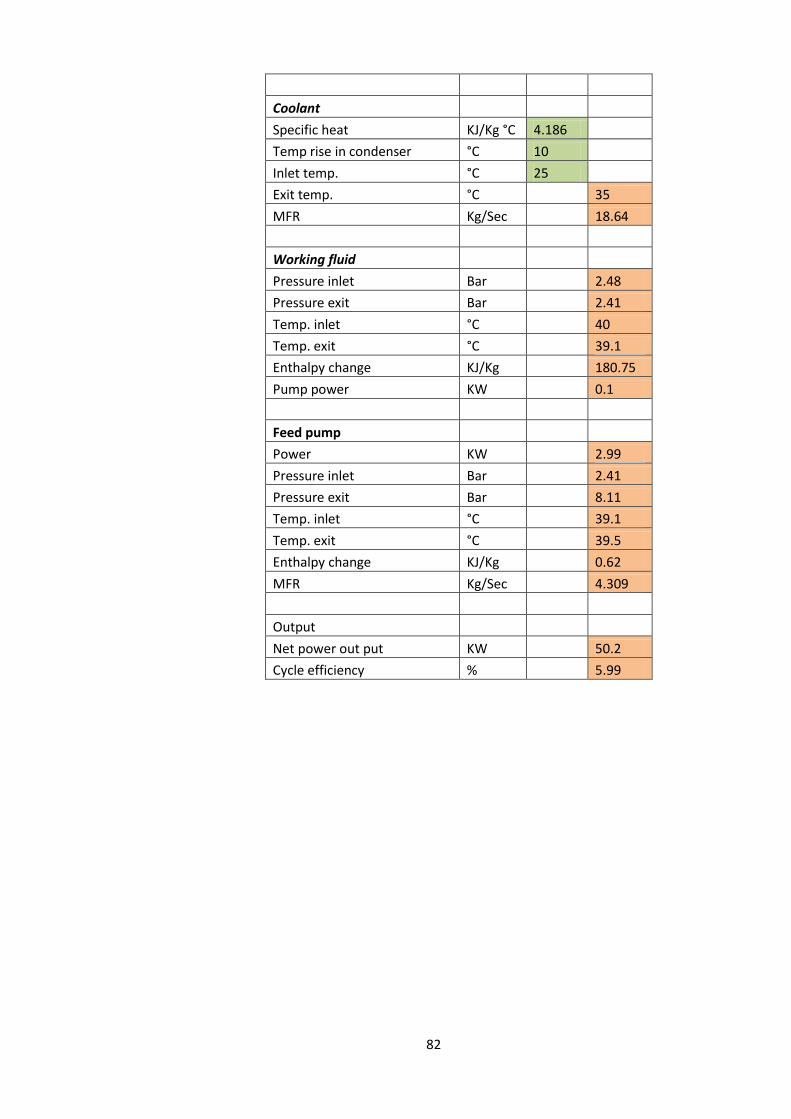
82
Coolant Specific heat KJ/Kg °C 4.186
Temp rise in condenser °C 10 Inlet temp. °C 25 Exit temp. °C
35
MFR Kg/Sec
18.64
Working fluid Pressure inlet Bar
2.48
Pressure exit Bar
2.41
Temp. inlet °C
40
Temp. exit °C
39.1
Enthalpy change KJ/Kg
180.75
Pump power KW
0.1
Feed pump Power KW
2.99
Pressure inlet Bar
2.41
Pressure exit Bar
8.11
Temp. inlet °C
39.1
Temp. exit °C
39.5
Enthalpy change KJ/Kg
0.62
MFR Kg/Sec
4.309
Output Net power out put KW
50.2
Cycle efficiency %
5.99
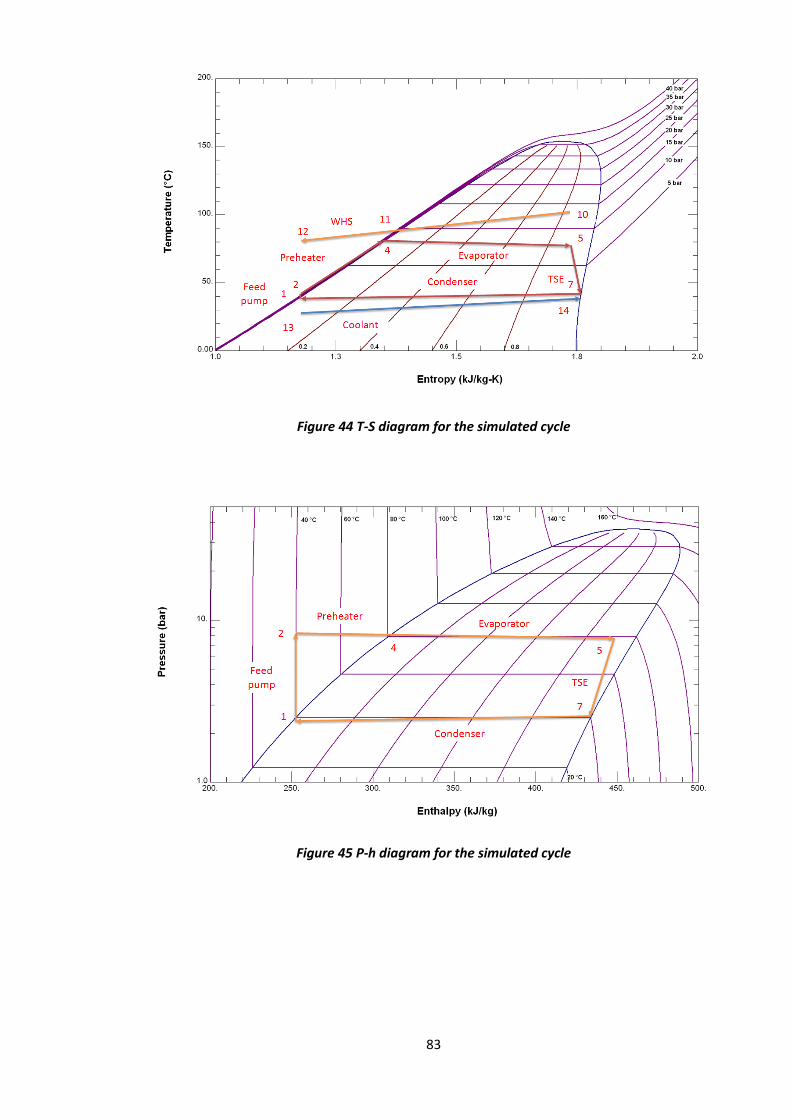
83
Figure 44 T-S diagram for the simulated cycle
Figure 45 P-h diagram for the simulated cycle
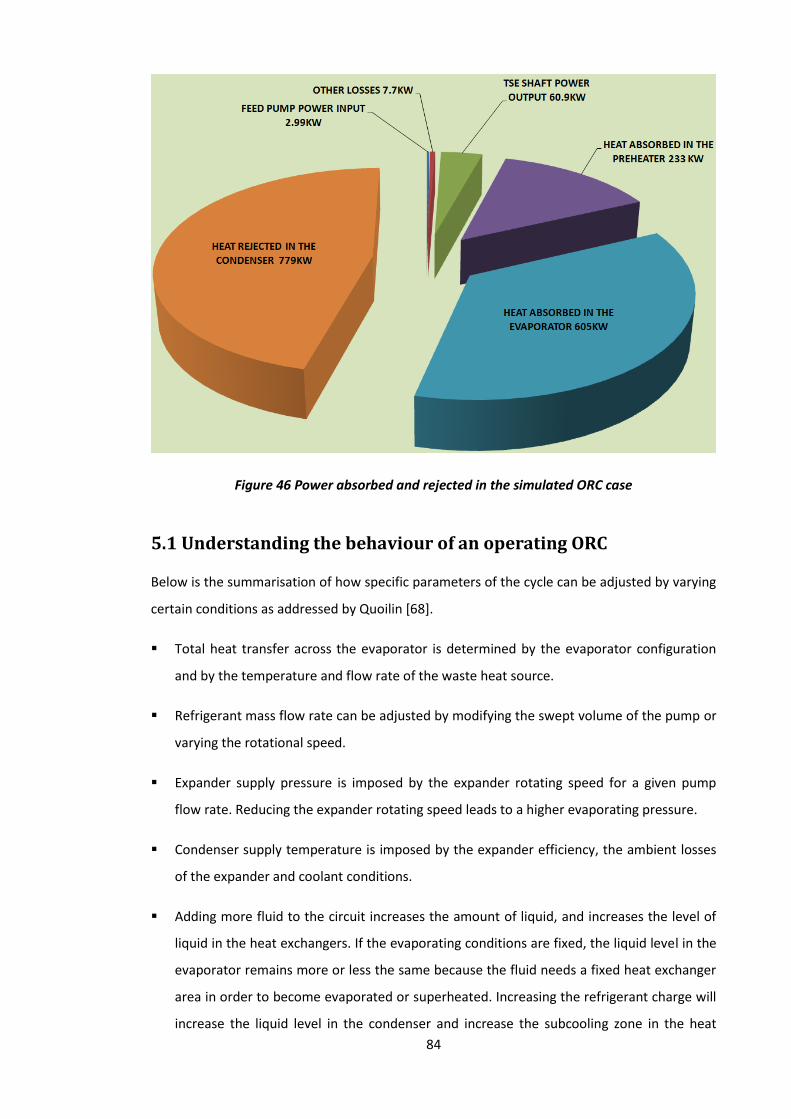
84
Figure 46 Power absorbed and rejected in the simulated ORC case
5.1 Understanding the behaviour of an operating ORC
Below is the summarisation of how specific parameters of the cycle can be adjusted by varying
certain conditions as addressed by Quoilin [68].
Total heat transfer across the evaporator is determined by the evaporator configuration
and by the temperature and flow rate of the waste heat source.
Refrigerant mass flow rate can be adjusted by modifying the swept volume of the pump or
varying the rotational speed.
Expander supply pressure is imposed by the expander rotating speed for a given pump
flow rate. Reducing the expander rotating speed leads to a higher evaporating pressure.
Condenser supply temperature is imposed by the expander efficiency, the ambient losses
of the expander and coolant conditions.
Adding more fluid to the circuit increases the amount of liquid, and increases the level of
liquid in the heat exchangers. If the evaporating conditions are fixed, the liquid level in the
evaporator remains more or less the same because the fluid needs a fixed heat exchanger
area in order to become evaporated or superheated. Increasing the refrigerant charge will
increase the liquid level in the condenser and increase the subcooling zone in the heat

85
exchanger. It can then be concluded that the condenser exhaust subcooling is imposed by
the refrigerant charge & heat transfer surface area in the condenser.
The condensing temperature is fixed by the pinch, the coolant temperature and the
temperature rise. The condensing pressure is imposed by the condenser effectiveness and
by the cold stream temperature.
Pressure drops are mainly a function of the heat exchanger geometrical characteristics,
bends and the flow rate.
5.2 Sensitivity study
5.2.1 Increasing maximum ORC pressure
Consider the cooling of a waste heat stream, as shown in figure 47. Given that the waste heat
is initially at a temperature T1. Then maximum heat recovery is obtained when it is cooled to
the ambient temperature, T3. However, when cooled to an intermediate temperature T2, the
amount of heat Q, is recovered with a heat recovery efficiency, eryHeat covRe =QAbsorbed/QMaximum.
Now in order to obtain the optimised power output, the conversion efficiency is then
calculated as Covnersion = Cycle . RecovHeat ery .
Figure 47 Heat transfer as a function of temperature for single phase heating medium
Keeping fixed waste heat inlet conditions, expander efficiency and expander exit dryness at
X=0.99. The effect of varying the feed pump pressure on the ORC’s net power output is
analysed. As the pressure and temperature of the working fluid in the boiler is increased for
the fixed pinch point, the exit temperature of the waste heat source also increases, resulting in
T1
T2
T3
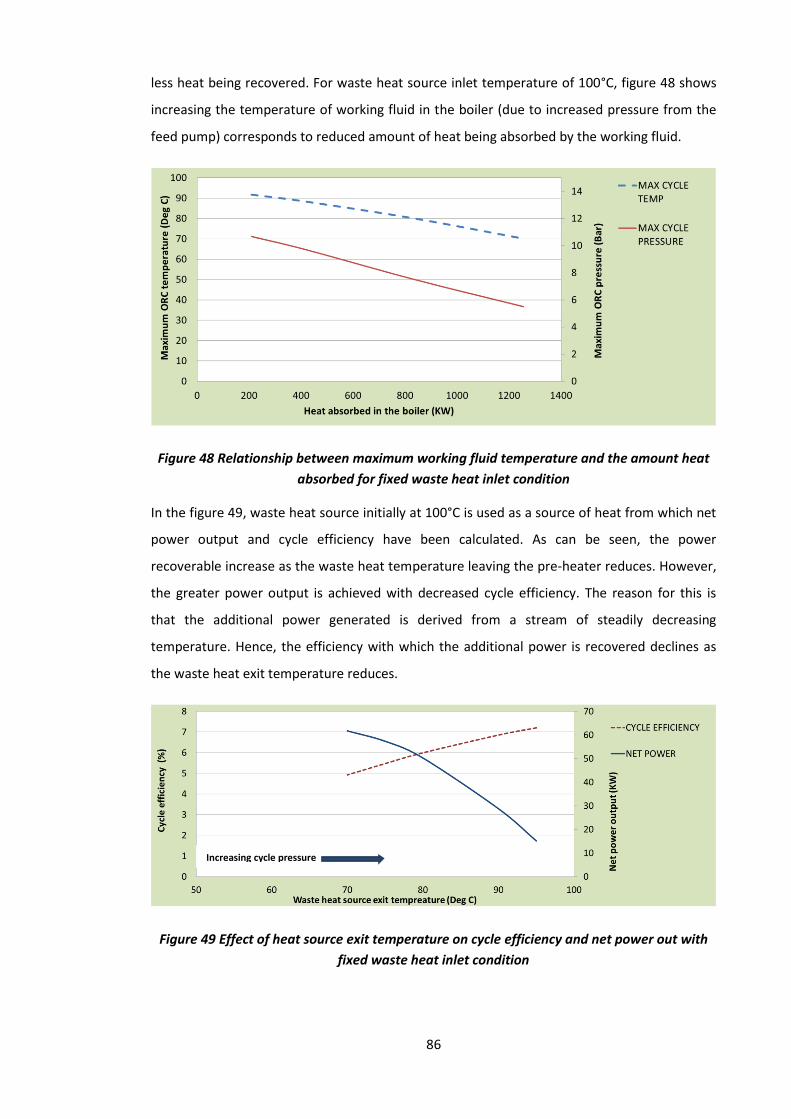
86
less heat being recovered. For waste heat source inlet temperature of 100°C, figure 48 shows
increasing the temperature of working fluid in the boiler (due to increased pressure from the
feed pump) corresponds to reduced amount of heat being absorbed by the working fluid.
Figure 48 Relationship between maximum working fluid temperature and the amount heat
absorbed for fixed waste heat inlet condition
In the figure 49, waste heat source initially at 100°C is used as a source of heat from which net
power output and cycle efficiency have been calculated. As can be seen, the power
recoverable increase as the waste heat temperature leaving the pre-heater reduces. However,
the greater power output is achieved with decreased cycle efficiency. The reason for this is
that the additional power generated is derived from a stream of steadily decreasing
temperature. Hence, the efficiency with which the additional power is recovered declines as
the waste heat exit temperature reduces.
Figure 49 Effect of heat source exit temperature on cycle efficiency and net power out with
fixed waste heat inlet condition
Increasing cycle pressure
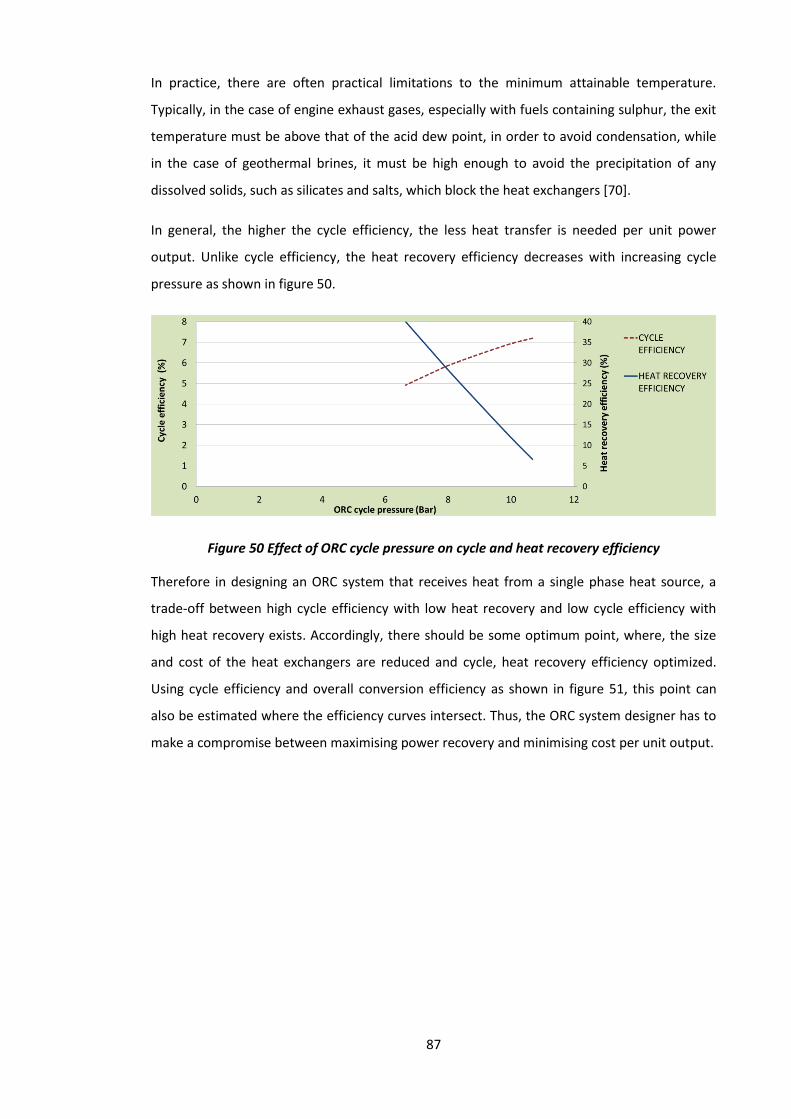
87
In practice, there are often practical limitations to the minimum attainable temperature.
Typically, in the case of engine exhaust gases, especially with fuels containing sulphur, the exit
temperature must be above that of the acid dew point, in order to avoid condensation, while
in the case of geothermal brines, it must be high enough to avoid the precipitation of any
dissolved solids, such as silicates and salts, which block the heat exchangers [70].
In general, the higher the cycle efficiency, the less heat transfer is needed per unit power
output. Unlike cycle efficiency, the heat recovery efficiency decreases with increasing cycle
pressure as shown in figure 50.
Figure 50 Effect of ORC cycle pressure on cycle and heat recovery efficiency
Therefore in designing an ORC system that receives heat from a single phase heat source, a
trade-off between high cycle efficiency with low heat recovery and low cycle efficiency with
high heat recovery exists. Accordingly, there should be some optimum point, where, the size
and cost of the heat exchangers are reduced and cycle, heat recovery efficiency optimized.
Using cycle efficiency and overall conversion efficiency as shown in figure 51, this point can
also be estimated where the efficiency curves intersect. Thus, the ORC system designer has to
make a compromise between maximising power recovery and minimising cost per unit output.
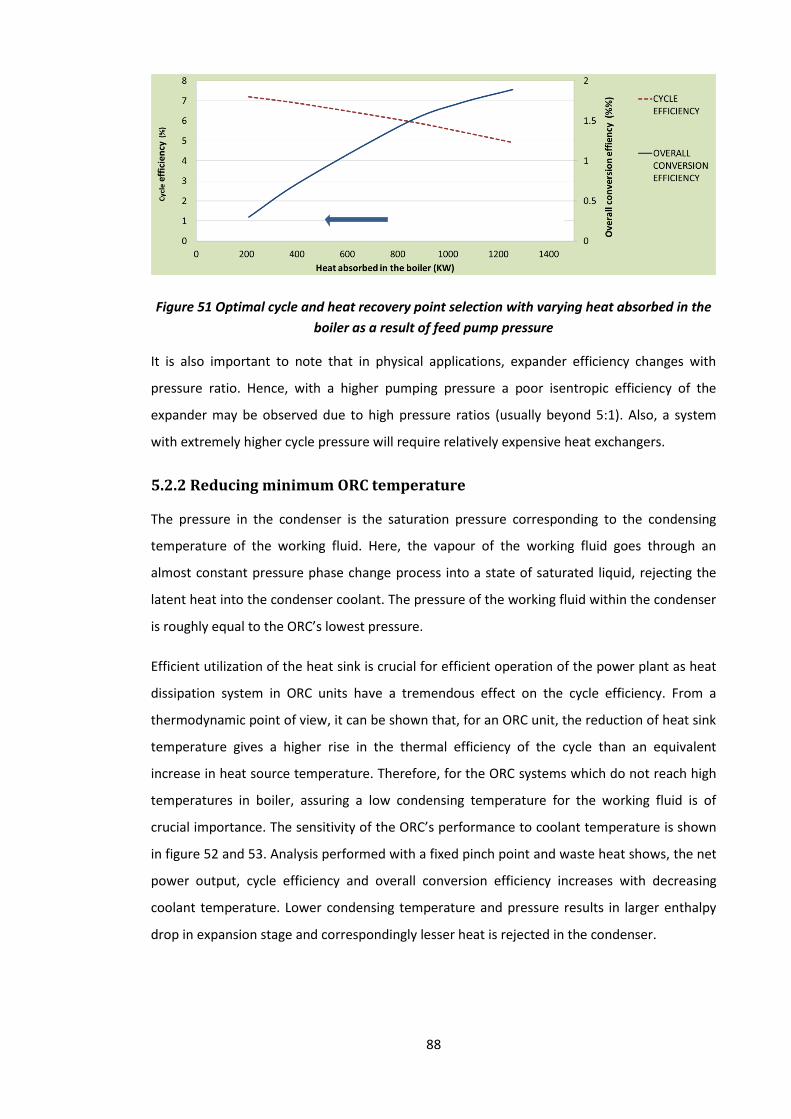
88
Figure 51 Optimal cycle and heat recovery point selection with varying heat absorbed in the
boiler as a result of feed pump pressure
It is also important to note that in physical applications, expander efficiency changes with
pressure ratio. Hence, with a higher pumping pressure a poor isentropic efficiency of the
expander may be observed due to high pressure ratios (usually beyond 5:1). Also, a system
with extremely higher cycle pressure will require relatively expensive heat exchangers.
5.2.2 Reducing minimum ORC temperature
The pressure in the condenser is the saturation pressure corresponding to the condensing
temperature of the working fluid. Here, the vapour of the working fluid goes through an
almost constant pressure phase change process into a state of saturated liquid, rejecting the
latent heat into the condenser coolant. The pressure of the working fluid within the condenser
is roughly equal to the ORC’s lowest pressure.
Efficient utilization of the heat sink is crucial for efficient operation of the power plant as heat
dissipation system in ORC units have a tremendous effect on the cycle efficiency. From a
thermodynamic point of view, it can be shown that, for an ORC unit, the reduction of heat sink
temperature gives a higher rise in the thermal efficiency of the cycle than an equivalent
increase in heat source temperature. Therefore, for the ORC systems which do not reach high
temperatures in boiler, assuring a low condensing temperature for the working fluid is of
crucial importance. The sensitivity of the ORC’s performance to coolant temperature is shown
in figure 52 and 53. Analysis performed with a fixed pinch point and waste heat shows, the net
power output, cycle efficiency and overall conversion efficiency increases with decreasing
coolant temperature. Lower condensing temperature and pressure results in larger enthalpy
drop in expansion stage and correspondingly lesser heat is rejected in the condenser.
Increasing cycle pressure
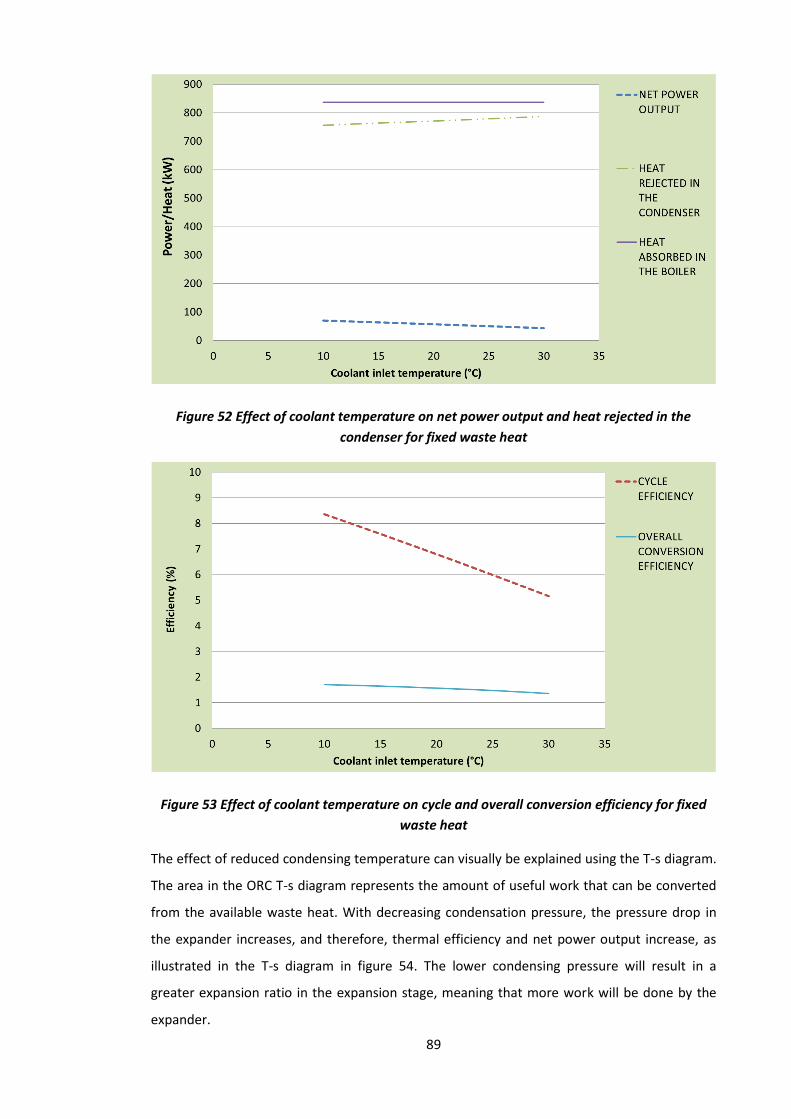
89
Figure 52 Effect of coolant temperature on net power output and heat rejected in the
condenser for fixed waste heat
Figure 53 Effect of coolant temperature on cycle and overall conversion efficiency for fixed
waste heat
The effect of reduced condensing temperature can visually be explained using the T-s diagram.
The area in the ORC T-s diagram represents the amount of useful work that can be converted
from the available waste heat. With decreasing condensation pressure, the pressure drop in
the expander increases, and therefore, thermal efficiency and net power output increase, as
illustrated in the T-s diagram in figure 54. The lower condensing pressure will result in a
greater expansion ratio in the expansion stage, meaning that more work will be done by the
expander.
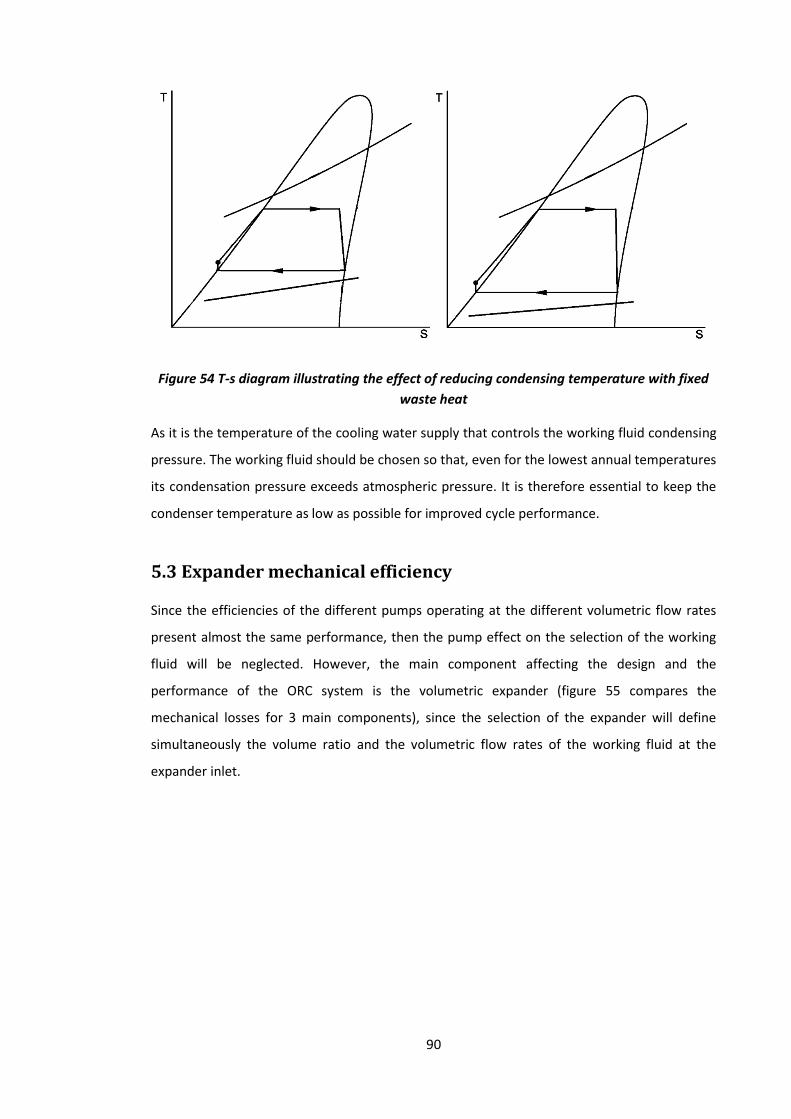
90
Figure 54 T-s diagram illustrating the effect of reducing condensing temperature with fixed
waste heat
As it is the temperature of the cooling water supply that controls the working fluid condensing
pressure. The working fluid should be chosen so that, even for the lowest annual temperatures
its condensation pressure exceeds atmospheric pressure. It is therefore essential to keep the
condenser temperature as low as possible for improved cycle performance.
5.3 Expander mechanical efficiency
Since the efficiencies of the different pumps operating at the different volumetric flow rates
present almost the same performance, then the pump effect on the selection of the working
fluid will be neglected. However, the main component affecting the design and the
performance of the ORC system is the volumetric expander (figure 55 compares the
mechanical losses for 3 main components), since the selection of the expander will define
simultaneously the volume ratio and the volumetric flow rates of the working fluid at the
expander inlet.
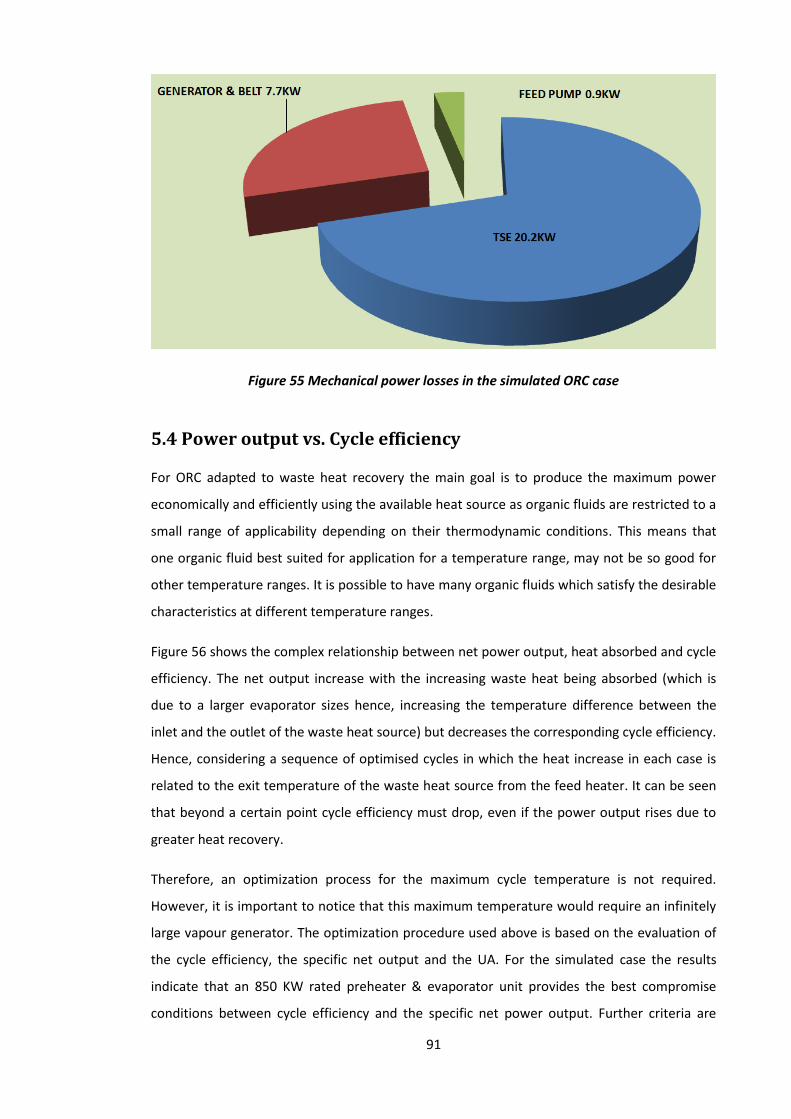
91
Figure 55 Mechanical power losses in the simulated ORC case
5.4 Power output vs. Cycle efficiency
For ORC adapted to waste heat recovery the main goal is to produce the maximum power
economically and efficiently using the available heat source as organic fluids are restricted to a
small range of applicability depending on their thermodynamic conditions. This means that
one organic fluid best suited for application for a temperature range, may not be so good for
other temperature ranges. It is possible to have many organic fluids which satisfy the desirable
characteristics at different temperature ranges.
Figure 56 shows the complex relationship between net power output, heat absorbed and cycle
efficiency. The net output increase with the increasing waste heat being absorbed (which is
due to a larger evaporator sizes hence, increasing the temperature difference between the
inlet and the outlet of the waste heat source) but decreases the corresponding cycle efficiency.
Hence, considering a sequence of optimised cycles in which the heat increase in each case is
related to the exit temperature of the waste heat source from the feed heater. It can be seen
that beyond a certain point cycle efficiency must drop, even if the power output rises due to
greater heat recovery.
Therefore, an optimization process for the maximum cycle temperature is not required.
However, it is important to notice that this maximum temperature would require an infinitely
large vapour generator. The optimization procedure used above is based on the evaluation of
the cycle efficiency, the specific net output and the UA. For the simulated case the results
indicate that an 850 KW rated preheater & evaporator unit provides the best compromise
conditions between cycle efficiency and the specific net power output. Further criteria are
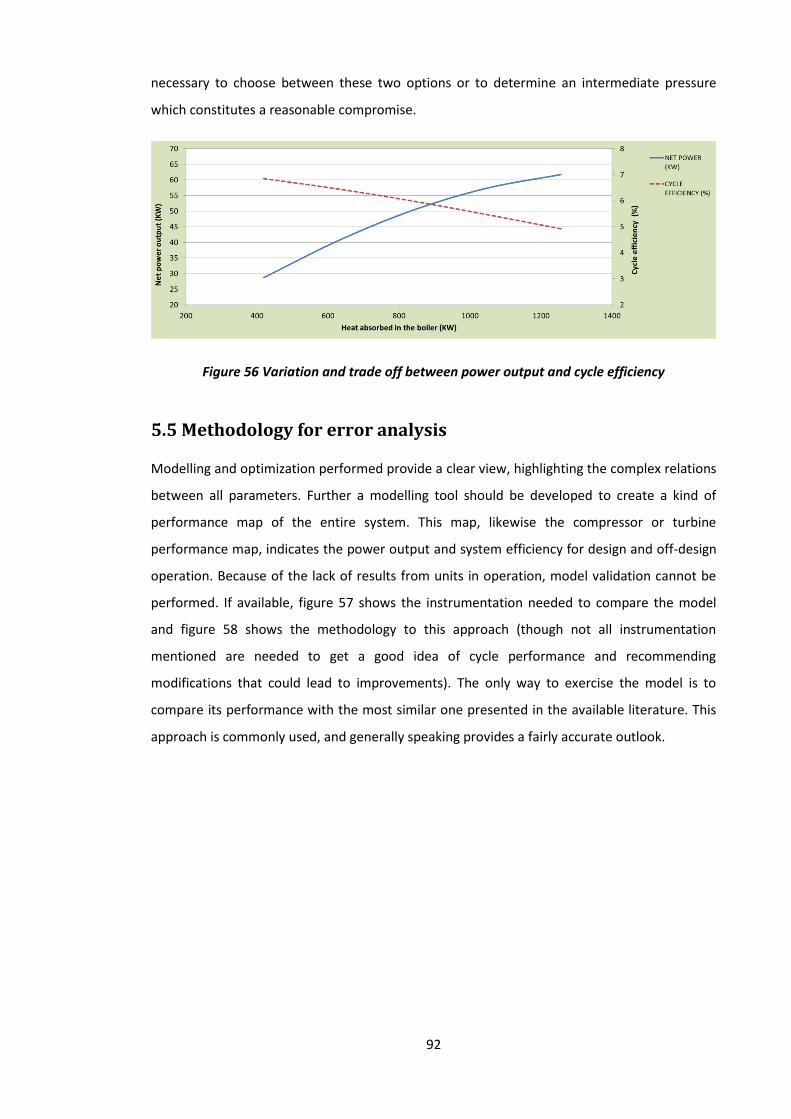
92
necessary to choose between these two options or to determine an intermediate pressure
which constitutes a reasonable compromise.
Figure 56 Variation and trade off between power output and cycle efficiency
5.5 Methodology for error analysis
Modelling and optimization performed provide a clear view, highlighting the complex relations
between all parameters. Further a modelling tool should be developed to create a kind of
performance map of the entire system. This map, likewise the compressor or turbine
performance map, indicates the power output and system efficiency for design and off-design
operation. Because of the lack of results from units in operation, model validation cannot be
performed. If available, figure 57 shows the instrumentation needed to compare the model
and figure 58 shows the methodology to this approach (though not all instrumentation
mentioned are needed to get a good idea of cycle performance and recommending
modifications that could lead to improvements). The only way to exercise the model is to
compare its performance with the most similar one presented in the available literature. This
approach is commonly used, and generally speaking provides a fairly accurate outlook.
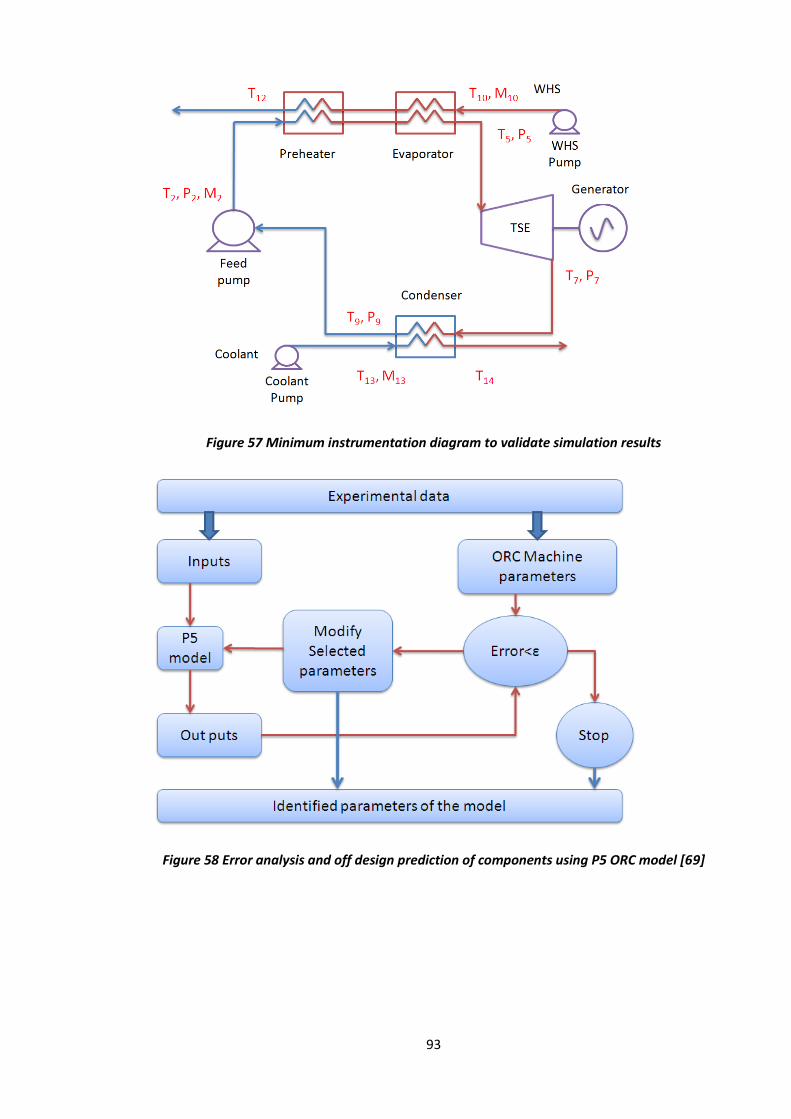
93
Figure 57 Minimum instrumentation diagram to validate simulation results
Figure 58 Error analysis and off design prediction of components using P5 ORC model [69]
94
6 Conclusion
The benefits of utilising vast resource of low grade heat cannot be ignored provided that
power can be recovered at an economic cost. Nowadays, ORC systems can be characterised as
the only proven technology used in kW to 1 MW range, despite the fact that it is linked with
low efficiencies. In practice limitation of the overall cycle efficiency can be partly explained by
the low temperature of the heat source, low off design expander efficiency, lack of insulation
and high condenser pump/fan power consumption. ORC offer a simple cycle design, enables
unattended operation, reduce production cost and complexity. It has to be noticed that such a
unit performs well only as long as the characteristic of the heat source is similar to the one it
was designed for.
The main goal of this research was to simulate and calculate the design operation of an ORC
system. In the course of the research work conducted, a semi-empirical model based on the
conservation of mass and energy for each component was designed and created with which
thermodynamic analyses were carried out. On the basis of the design parameters for optimal
performance and system sensitivity, numerous simulations were carried out to investigate the
complex interrelationships and influence on cycle efficiency and net power.
Brazed-plate heat exchanger was found to be the most suitable technology for boiler since it
presents compact design, high heat transfer coefficient and acceptable cost. In the power
industry, the reduced availability of water as the cooling medium, combined with an increased
emphasis on environmental considerations, often makes the selection of a dry air type cooling
tower a viable alternative to the traditional surface condenser.
Optimization of the working conditions is also needed in order to reduce the expander supply
superheating and the condenser exhaust subcooling. Dry fluids in general generate
superheated vapour at the exit, and this reduces the area of net work in the T-s diagram.
Hence, organic fluids should be operated at saturated conditions to reduce the total
irreversibility of the system.
The maximum value of total heat recovery efficiency increases with the increase of the inlet
temperature of the waste heat and decreases by using working fluids of the lower critical
temperature. The condensation pressure of the cycle is preferred to be higher than the
atmospheric pressure. With sensitivity analysis it was also shown that the thermal efficiency of
ORC increases when the condenser temperature is decreased or when the maximum cycle
pressure is increased.
95
The complete methodology described in this thesis is thus necessary and should be used in
ORC analysis and comparisons since it leads to a better comprehension of the effects of the
pressure, temperature and power output on cost, heat exchanger size and thermodynamic
performances. The choice of optimum operating conditions will differ depending on the
chosen performance indicator, but in most cases minimum cost will be the determining factor.
Problem with the sensitivity to heat source characteristics can be solved for a recovery plant
by sacrificing the recovery efficiency. In order to minimize the cost of energy output, the
power plant may be slightly undersized since the prime objective of each project is to be
profitable and the stream of waste heat is considered free of charge.
Analysis using a constant waste heat temperature or based on thermal efficiency may result in
considerable deviation for system design relative to the varying temperature conditions of the
actual waste heat recovery. Finally, the part load operation of a power plant deserves more
attention since it’s a more usual mode in a deregulated electricity market with ancillary
services provisioning being an established part of it.
96
Reference
1. Woolnough D, Waste heat recovery, THERMOPEDIA, A-to-Z Guide to Thermodynamics, Heat & Mass transfer
2. Schuster A, Karellas S, Kakaras E, Spliethoff H ,Energetic and economic investigation of
organic Rankine cycle applications, Applied Thermal Engineering, 29 (8–9) (2009), pp. 1809–1817
3. Quoilin S, Lemort V, Technological and economical survey of Organic Rankine Cycle
systems, European conference economics and management of energy in industry, Portugal, 2009
4. Smith IK, Stosic N, Kovacevic A, Screw Expanders Increase Output and Decrease the
Cost of Geothermal Binary Power Plant Systems, Proceedings of the Geothermal Resources Council Annual Meeting, USA, 2005
5. Smith IK, Stosic N, Kovacevic A, Power Recovery From Low Cost Two-Phase Expanders,
City University London, 2004
6. Liu B, Chien K, Wang C, Effect of Working fluids on Organic Rankine Cycle for Waste Heat Recovery, Energy 29 (2004), pp. 1207-17
7. Kestin, DiPippo, Khalifa, Ryley 1980: Sourcebook on the Production of Electricity from
Geothermal Energy, United States Department of Energy
8. Chammas R, Clodic D, Combined Cycle for Hybrid Vehicles, Society of Automotive Engineers, 2005
9. Marques da Silva P, 1989, Organic Fluid Mixtures as Working Fluids for the Trilateral
Flash Cycle System, Thesis, City University London
10. Hudson R, Technical and Economic Overview of Geothermal Atmospheric Exhaust and Condensing Turbines, Binary Cycle and Biphase Plant, Geothermics 17 (1988), pp. 51-74
11. Yamamoto T, Furuhata T, Arai N, Mori K, Design and testing of the organic Rankine
cycle, Energy 26 (2001), pp. 239-51
12. Hung T, Wang S, Kuo C, Pei B, Tsai K, A study of organic working fluids on system efficiency of an ORC using low grade energy sources, Energy 35 (2010), pp. 1403-11
13. Maizza V, Maizza A, Working fluids in non-steady flows for waste energy recovery
systems, Applied Thermal Engineering 16 (1996), pp. 579-90
14. Saleh B, Koglbauer G, Wendland M, Fischer J, Working fluids for low temperature organic Rankine cycles, Energy 32 (2007), pp.1210-21
15. Hung T, Waste heat recovery of organic Rankine cycle using dry fluids, Energy
Conversion and Management 42 (2001), pp. 539-53
16. Larjola J, Electricity from industrial waste heat using high-speed organic Rankine cycle, International Journal of Production Economics 41 (1995), pp. 227-35

97
17. Lee M J, Tien D L, Shao C T, Thermophysical capability of ozone-safe working fluids for
an organic Rankine cycle system. Heat Recov Syst CHP, 13 7 (1993), pp. 409–418
18. Drescher U, Bruggemann D, Fluid selection for the organic Rankine cycle in biomass power and heat plants, Applied Thermal Engineering 27 (2007), pp. 223- 28
19. Chen Y, Lundqvist P, Johansson A, Platell P, A comparative study of the carbon dioxide
transcritical power cycle compared with an organic Rankine cycle with R123 as working fluid in waste heat recovery, Applied Thermal Engineering 26 (2006), pp. 2142-47
20. Invernizzi C, Iora P,Silva P, Bottoming micro-Rankine cycle for micro-gas turbines,
Applied Thermal Engineering 27 (2007) 100-10.
21. Mago P, Chamra L, Srinivasan K, Somayaji C, An examination of regenerative organic rankine cycles using dry fluids, Applied Thermal Engineering 28 (2008), pp. 998-1007
22. Desai N, Bandyopadhyay S, Process integration of organic Rankine cycle, Energy 34
(2009), pp.1674-86
23. Wei D, Lu X, Lu Z, Gu J, Performance analysis and optimization of organic Rankine cycle for waste heat recovery, Energy Conversion and Management 4 (2007), pp. 1113-19
24. Angelino G, Colonna P , Organic Rankine cycles for energy recovery from molten
carbonate fuel cells, Intersociety Energy Conversion Engineering, USA, 2000
25. Madhawa H, Golubovic M, Worek W, Ikegami Y, Optimum design criteria for an Organic Rankine cycle using low-temperature geothermal heat sources, Energy 32 (2007), pp. 1698-706
26. Wei D, Lu X, Lu Z, Gu J, Dynamic modeling and simulation of an Organic Rankine Cycle
(ORC) system for waste heat recovery, Applied Thermal Engineering 28 (2008), pp. 1216-1224
27. Technical Notes, Cycle-Tempo. A program for thermodynamic modeling and optimization of energy conversion systems, retrieved from http://www.cycle-tempo.nl/
28. Yamamoto T, Furuhata T, Arai N, Mori K, Design and testing of the organic Rankine
cycle, Energy, 26 (3) (2001), pp. 239–251
29. Lee J, Jeon M, Kim T, The influence of water and steam injection on the performance of a recuperated cycle microturbine for combined heat and power application, Applied Energy, 87 (4) (2010), pp. 1307–1316
30. Quoilin S, Declaye S, Tchanche B, Lemort V, Thermo-economic optimization of waste
heat recovery Organic Rankine Cycles, Applied Thermal Engineering, 31 (2011), pp. 2885–2893
31. Chammas R, 2005, Rankine cycle for hybrid vehicles, simulation and design of a first
prototype, Thesis, Ecole des Mines de Paris
32. Doyle E, Patel P, Compounding the truck diesel engine with an organic rankine cycle system, Society of Automotive Engineers, 1976
98
33. Endo T, Kawajiri S, Kojima Y, Takahashi K, Baba T, Ibaraki S, Takahashi T, Shinohara M,
Study on Maximizing Exergy in Automotive Engines. Society of Automotive Engineers, 2007
34. Nelson C, Exhaust Energy Recovery, Directions in Engine-Efficiency and Emissions
Research, 2008
35. Freymann R, Strobl W, Obieglo A, The Turbosteamer: A System Introducing the Principle of Cogeneration, Automotive Applications 69 (2008), pp. 20-27
36. Badr O, Naik S, O’Callagen P, Probert S, Expansion machine for a low power-output Steam Rankine-Cycle engine, Applied Energy 39 (1991), pp. 93-116
37. Yanagisawa T, Fukuta Y, Ogi T, Hikichi T, Performance of an oil-free scroll-type air
Expander, International conference on Compressors and their systems, 2001, pp. 167-74
38. Kim H, Ahn J, Park I, Rha R, Scroll expander for power generation from a low-grade
steam source, Proceedings of the IMECHE, Journal of Power and Energy 221 (2007), pp. 705-11
39. Kane M, Larrain D, Favrat D, Allani Y, Small hybrid solar power system, Energy 28
(2003), pp. 1427-43
40. Lemort V, Teodorese I, Lebrun J, Experimental study of the integration of a scroll expander into a heat recovery Rankine cycle, International Compressor Engineering Conference, 2006
41. Steidel R, Berger R, Performance characteristics of the Lyshlom engine as testes for
geothermal applications, Proceedings of the International Energy Conversion Engineering Conference (1981), pp. 1334-40
42. Hanjalic K & Stosic N, Development and Optimization of Screw Machines with a
Simulation Model, Part II: Thermodynamic Performance Simulation and Design Optimization, Journal of Fluids Engineering, American Society of Mechanical Engineers 119 (1997), pp. 664-70
43. Smith IK, Stosic N, Prospects for Energy Conversion Efficiency Improvements by the
Use of Two-Phase Expanders, Proceedings of the 2nd International Heat Powered Cycles Conference, Paris, 2001
44. Smith IK, 1994, Existing Installations, in Crook AW ed. Profiting from Low Grade Heat-
Thermodynamic Cycles for Low-Temperature Heat Sources, The Institution of Electrical Engineers, London, pp. 127-49
45. Brasz J, Biederman B, Holdmann G, Power production from a moderate temperature
geothermal resources, Geothermal Resources Council Annual meeting, USA, 2005
46. Alaska Center for Energy and Power, Test Evaluation of Organic Rankine Cycle Engines Operating on Recovered Heat from Diesel Engine Exhaust, 2010

99
47. Chuen-Sen L, Capture of Heat Energy from Diesel Engine Exhaust, Final Report, Department of Energy, 2008
48. Badr O, Probert S, O’Callaghan P, Selecting a working fluid for a Rankine-Cycle Engine,
Applied Energy 21 (1985), pp. 1-42
49. Maizza V, Maizza A, Unconventional working fluids in organic Rankine-cycles for waste energy recovery systems, Applied Thermal Engineering 21 (2001), pp. 381-90
50. Papadopoulos A, Stijepovic M, Linke P, On the systematic design and selection of
optimal working fluids for Organic Rankine Cycles, Applied Thermal Engineering 30 (2010), pp. 760-69
51. Pedro J, Chamra L, Srinivasan K , Chandramohan S, An examination of regenerative
organic Rankine cycle using dry fluids, Applied Thermal Engineering 28 (2008), pp. 998-1007
52. Techanche B, Papadakisa G, Lambrinosa G, Frangoudakisa A, Fluid selection for a low-
temperature solar organic Rankine cycle, Applied Thermal Engineering 29 (2009), pp. 2468-76
53. Wang X, Zhao L, Wang J, Zhang W, Zhao X, Wu W, Performance evaluation of a low-
temperature solar Rankine cycle system utilizing R245fa, Solar Energy 84 (2010), pp. 353-64
54. Bruno J, Lopez-Villada J, Letelier E, Romera S, Corona A, Modelling and optimization of
solar organic Rankine cycle engines for reverse osmosis desalination, Applied Thermal Engineering 28 (2008), pp. 2212-26
55. Brazed plate heat exchanger, Landskrona, Sweden, 2003-2008 SWEP International AB
56. Bejan A, Tsatsaronis G, Moran M, 1996, Thermal design and optimization, John Wiley
& Sons, Inc. USA
57. A Technical Reference Manual for Plate Heat Exchangers in Refrigeration & Air conditioning Applications, Alfa Laval AB, Fifth edition, 2004
58. Kevin D. Rafferty, Geo-Heat Center , Chapter 11, Heat exchangers, 1994
59. Delil A, Single- and Two-Component Two-Phase Flow and Heat Transfer: Commonality
and Difference, National Aerospace Laboratory, NLR NLR-TP-2001-538
60. Hajal J, Thome J, Cavallini A, Condensation in horizontal tubes, part 1: Two-phase flow pattern map, Int. J. Heat Mass Transfer 46 (2003), pp. 3349-63
61. Kattan N, Thome J, Favrat D, Flow boiling in horizontal tubes. Part 1: Development of a
diabatic two-phase flow pattern map, J. Heat Transfer 120 (1998), pp. 140-47
62. Mendrinos D, Kontoleontos E, Karytsas C, Geothermal binary plants: water or air cooled, Centre for Renewable Energy Sources
63. Avant grade, Air Cooled Condensers
100
64. Putman R E, Jaresch D, Impact of air cooled condensers on plant design and operations
65. Nelik L, Centrifugal and Rotary Pumps: Fundamentals with Applications, CRC Press LLC, 1999
66. Lippke F, Simulation of the Part Load Behavior of a 30MWe SEGS Plant, Sandia National
Laboratories, 1995
67. Lukawski M, 2009, Design and Optimization of Standardized Organic Rankine Cycle Power Plant for European Conditions, Thesis, University of Iceland
68. Quoilin S, An introduction to thermodynamic applied to organic Rankine cycle, 2008
69. Lemort V, Quoilin S, Cuevas C, Lebrun J, Testing and modeling a scroll expander
integrated into an Organic Rankine Cycle. Applied Thermal Engineering, 29 (2009), pp. 3094–3102
70. Smith , I.K. Matching and Work Ratio in elementary thermal power plant theory. Proc
Inst Mech Engrs, Part A, 1992, 206(A4), 257-262.
101
Additional references
Andrew C, 2006, Design & Optimization of Organic Rankine Cycle Solar-Thermal Power
plants, Thesis, University of Wisconsin Madison
Aoun B, 2008, Micro combined heat and power operating on renewable energy for residential buildings, Thesis, School of Mines de Paris
Bryson M, 2007, The conversion of low grade heat into electricity using the
thermosyphon rankine engine and trilateral flash cycle, Thesis, Royal Melbourne Institute of Technology
Chandramohan S, 2008, First and second law analysis of organic rankine cycle, Thesis,
Mississippi State University
Eckard S, Multi-vane expander as prime mover in low-temperature solar or waste heat applications, International Energy Conversion Engineering Conference (1975), pp. 249-54
Fenton D, Abernathy G, Krivokapich G, Otts J, Operation and evaluation of the Willard
solar thermal power irrigation system, Solar Energy 32 (1984), pp.735-51
Garduza O, Sanchez F, Martinez D, Roman R, Vapour Pressures of Pure Compounds using Peng-Robertson Equation of State with Three Different Attractive Terms, Fluid Phase Equilibria 198 (2002), pp. 195-228
Gurgenci H, Performance of power plants with organic Rankine cycles under part-load
and off-design conditions, Solar Energy 36 (1986), pp. 45-52
Kaushik S, Dubey A, Singh M, Steam rankine cycle cooling system: analysis and possible refinements, energy conversion management, 35 (1994). pp. 871-86
Manolakos D, Papadakis G, Kyritsis S, Bouzianas K, Experimental evaluation of an
autonomous low-temperature solar Rankine cycle system for reverse osmosis desalination, Desalination 203 (2007), pp. 366-74
Manolakos D, Kosmadakis G, Kyritsis S, Papadakis G, Identification of behaviour and
evaluation of performance of small scale, low-temperature organic Rankine cycle system coupled with a RO desalination unit, Energy 34 (2009), pp. 767-74
Nguyen V, Doherty P, Riffat S, Development of a prototype low temperature Rankine
cycle electricity generation system, Applied Thermal Engineering 21 (2001), pp. 169-81
Nowak W, Borsukiewicz-Gozdur A, Stachel A, Using the low-temperature Clausius-Rankine cycle to cool technical equipment, Applied Energy 85 (2008), pp. 582-88
Piacentino A, Cardona F, On thermoeconomics of energy systems at variable load
conditions: integrated optimisation of plant design and operation, Energy Conversion and Management 48 (2007), pp. 2341-55
Prigmore D, Barber R, Cooling with the sun’s heat: Design considerations and test data
for a Rankine cycle prototype, Solar Energy 17 (1975), pp. 185-92
102
Quoilin S, Orosz M, Lemort V, Modeling and Experimental investigation of an organic
Rankine cycle using scroll expander for small solar applications, Eurosun Conference, Portugal, 2008
Saitoh T, Yamada N, Wakashima S, Solar rankine cycle system using scroll expander,
Journal of Energy and Engineering 2 (2007), pp. 708-18
Schuster A, Karl J, Karellas S, Simulation of an innovative stand-alone solar desalination system using an organic rankine cycle, International Journal of Thermodynamics 10 (2007), pp. 155-63
Somayaji C, Mago P, Chamra L, Second law analysis and optimization of organic
Rankine cycles, ASME Power Conference, 2006
Vijayaraghavan S, Goswami D, Organic working fluids for a combined power and cooling cycle, Journal of Energy Resources Technology 127 (2005), pp. 125-30
Yagoub W, Doherty P, Riffat S, Solar energy-gas driven micro-CHP system for an office,
Applied thermal Engineering 26 (2006), pp. 1604-10
Yamadaa N, Minamib T, Mohamadb A, Efficiency of Compact Organic Rankine Cycle
System with Rotary-Vane-Type Expander for Low-Temperature Waste Heat Recovery,
Energy 36 (2011), pp. 1010-17
Smith, I.K, (2011, January 17), Personal communication, City University London.