laterally loaded cast-in-drilled-hole...
TRANSCRIPT
TRANSPORTATION RESEARCH RECORD 1191 155
Laterally Loaded Cast-in-Drilled-Hole Piles
C. K. SHEN, S. BANG, M. DESALVATORE, AND C. J. PoRAN
The behavior of cast-in-drilled-hole pile has been investigated in detail with an instrumented model test pile embedded in either level or sloping ground of sand or silty clay soil. Upslope and downslope as well as parallel directional lateral loads were applied to the model test pile to measure the lateral resistance and the load-deflection relationship. Parameters such as the embedment length, the slope of the ground, the distance from the edge of the slope, and the cyclic loading were included in the study.
A large number of subsurface structures are designed mainly to resist the lateral or overturning loads applied above the ground level. These subsurface structures derive their bearing capacity from the passive earth resistance against lateral movements (translation or rotation). One of the widely used types of foundation in this category is the cast-in-drilled-hole (CIDH) pile . Piles of this type are normally less than 12 ft long and have a length-to-diameter ratio ranging from 2 to 1 for short piles to about 10 for longer piles. Because of their relatively low slenderness ratios and high rigidity with respect to the surrounding soils, they are conventionally considered as rigid members in design and analysis . Structures supported by CIDH piles are numerous, notably posts for large road and commercial signs and sound barrier walls for noise control along urban freeways.
A comprehensive investigation conducted more than 15 years ago by the Texas Department of Highways (1-3) concluded that the conventional design of CIDH piles appeared to be conservative. This study proposed a rigorous but simpleto-use alternative design method for calculating ultimate 'lateral loads. The formulation includes the development of shear stresses and the circumferential variation of normal stresses around a pile. The formulation, however, does not completely satisfy all the stress boundary conditions and the failure criterion; most importantly it does not include a provision for sloping ground conditions. In practice, for instance, sound barrier walls are frequently placed near the edge of roadway embankments. In light of the above, there appears to be a need to conduct a study to evaluate the lateral resistance of CIDH piles placed in level or sloping ground with the final objective of establishing an improved design methodology as applied to highway-related structures.
C. K. Shen, Department of Civil Enginee ring, Univ~r~ity of. lifornia, Davis, Cali f. 956L6. S. Bang, Department of 1vll Eng111ecring South Dakota School of Mines and Technology , Rapid City, S. Dak. 57701-3995. M. D cSalvatore, Geotechnical Branch , California D epartment of Transportation Labora tory, 5900 Folsom Boule var~, Sacramento Calif. 95819. C. J . Poran , D epartment of CIVll Engineering, Polytechnique Institute of New York, Brooklyn, N. Y. 11201.
LITERATURE REVIEW
The usual approach to treat the problem of a laterally loaded pile is first to categorize the pile as either rigid or flexible._ A clear distinction between those two , however, does not exist. It has been suggested that the rigidity of a pile can be related to the ratio of the flexural stiffness of the pile and the foundation soil modulus. Taking into consideration a wide range of soil stiffness, Kasch et al. ( 4) concluded that in order to ensure rigid pile behavior, the length-to-diameter ratio of a pile should not exceed about 6, but could be as high as 10 under certain conditions, such as in weak soils; also that a ratio of 20 or more ensures flexible pile behavior. Accordingly, the CIDH pile can be considered as a relatively rigid pile .
One of the first attempts to calculate the ultimate lateral resistance of a short rigid pile in cohesionless soil was made by Broms (5). He assumed that the active earth pressure acting on the back of a pile is negligible, that the distribution of passive earth pressure along the front of a pile is equal to three times the Rankine's passive pressure, and that the shape of a pile section has no influence on the distribution of ultimate soil pressure.
Based on the equilibrium of a tetrahedron-shaped soil failure wedge under lateral load , Reese et al. (6) formulated the ultimate soil resistance for a short rigid pile . The total ultimate lateral resistance of the pile is equal to the passive force minus the active force. The active force is computed from Rankine's theory and the passive force from the geometry of the wedge with boundary forces following the Mohr-Coulomb failure criterion.
Broms (7) also developed a theory to calculate the ultimate lateral resistance of a short rigid pile in cohesive soil. He suggested a simplified lateral soil resistance distribution: zero from the ground surface to a depth of 1.5 times the pile diameter, and a constant value of 9 times the undrained shear strength below this depth.
Using a failure wedge similar to the one used in cohesionless soils, Reese (8) formulated an expression for the ultimate resistance of a laterally loaded pile in soft clay . The resulting ultimate resistance per unit length of pile consists of three terms. The first indicates the resistance at the ground surface, the second relates to the increase in resistance with depth resulting from overburden pressure, and the third is a geometrically related restraint term. Matlock (9) later found that the third term in Reese's expression did not agree with experimental observations and suggested an alternative expression.
Ivey (J) studied the ultimate resistance of drilled piles in level ground and proposed a comprehensive design method . In his approach , unlike the conventional ones, both normal and shear stresses acting on all faces of the pile were considered. Distributions of these stresses resulting from a rotation

156
of the pile were assumed to vary along the circumferential direction by cosine and sine functions. The point of rotation and the resulting ultimate lateral resistance of the pile were th n calculated from the equi librium equations. T he proposed meth d wa later modified ba ed on m<>del te t results (J) . Although the the ry indudes most of the essential ctrnracteristics of rigid pile behavior under lateral loads the application may be limited because (a) fully active and passive condition · ba ed on Rankine 's theory were used (b) shear stresses did not totally satisfy the Mohr-Coulomb failure criteri n , and (c) most of the test re ults used to verify the theory, particularly those in sands, were obtained from scaled model piles of limited range.
0th r design methods available for short rigi<.1 pile · arc by Hay et al. (10), Ivey and Dunlap (2), Ivey and Hawkins (J 1) David on el al. (12), ytton (13) , Ivey e t al. (3) Seiler (/4) Han en (15). and other . In general, the Ivey and Dunlap and the Ivey and Hawkins metho Is yield conservative values ( 4).· whereas Hansen's and ytton's methods yield consistently unconservative value. for larger piles (16). Broms' method yields conservative results in stiff clays but unconservative results in soft clays (16).
There have also been many experimental studies on the load-deflection relationships (2, 4, 10, 17, 18) and the earth pressure measurements ( 4, 16, 17, 19-21) along laterally loaded rigid piles. In general the measured lateral earth pres ure distributions are parabolic shaped. Based on the measured earth pressure distribution, Biershwale et al. (16) reported that the p int of rotation or the point of zero lateral tress is located at approximmely 0.7 times the eml edment length of a pile as mea ured from the ground surface. This genera ll y coincides with result .. reported by other studies(/, 4, 10, 17, 19) stating that the rotaLion point lies in the vicinity of two-thi rds of the embedment length. However, studies (2, 4, 10, 18, 22) also indicated that rhe point of rotation does not remain at a constant depth below the ground surface, rather it moves to . lower depths as the lateral load is increa ed . The point of rotation could also move upward if the strength of the soil decreases with depth (2). In general, the point of rotation shifts downward from some point below the middle of the embedded pile for lighter loads to a point approximately threequarters of the embedment depth for maximum loads.
As indicated in this brief literature review, considerable research has been conducted on the ultimate soil resistance and pile capacity of laterally loaded piles . Most of the solutions, however, are based on the ultimate or limiting equilibrium conditions, and thus cannot be used to compute lateral earth pressures at conditions other than failure. In order to understand the soil-rigid pile interaction more clearly, a comprehen ive investigation including a laboratory model study was conducted. on iderations were given to both the working stress and ultimate stress states in level and sloping ground. The pile model tudy is described in detail in this study.
MODEL TESTING
Testing Facility
The testing facility included a large test bin, an instrumented pile, a loading system, and a data-acquisition system. The wooden test bin (12 ft x 4 ft x 4 ft) was composed of %-
TRANSPORTATION RESEARCH RECORD 1191
in.-thick plywood sidewalls, two sets of perimeter steel box beams to reinforce the walls , and a plywood bott m. A 2024-
4 aluminum tube pipe 0.25 in. thick, and 40 in. Io n , with an ou tside diameter of 3.5 in. , wa selected to reprn enl the model pile. T in ·trument the m dcl pit , the pipe wa cut into two h<tlf-circular cction · with hear pin installed along b th sides of one or the half pipe ections.
Eleven lateral pressure gauge mounts were installed in each of the two half pipe sections at a spacing of 3 in./mount. The large number of pressure gauge mounts allowed the locations of the pre sure gaug to be changed from le. t to test. Fina lly , a thi11 coal of medium ·and was glued to the outer urfa~e of the model pile lo produce the typical concrete- ii interface friction . en Kulitc model KHM-375-serie pressure gauge were insralled in the gauge mounts along the front and back si les <>(the rn del pile, wilh the pr~ · ·ure- ensitive diaphragm placed J1ush with the urface f the m del pile and in alignment with it length .
A set of electric circuit board · was de ·igncd and m unted inside the mode.I pile to perform the multiplexing and ignalconditi ning functi ns so that all the signals could be tra n -milted fr m the model pile to the data-acquisition system by a single set of wires. A picture of the fully instrumented model pile is shown in Figure 1.
An electrohydraulic closed-loop testing system wa modified to apply the lateral load to the instrumented model pile.
he hydraulic actuator was programmed t pull or push the
FIGURE 1 Model test pile with instrumentation.

Shen et al.
TABLE 1 SOIL PROPERTIES
Cohes1on (psf)
Fr1ct1on Angle
Max1mum Dry Dens1ty (pcf) (Mod1f1ed AASHTO Method T-180-57)
Liqu1d L1mft
Plast1c1ty Index
Water Content
Unified Class1f1cat1on
model pile laterally at a rate of 0.2 in./min. A lateral displacement of 3 in. was applied to the top of the model pile that corresponds approximately to a 5° angular rotation assuming no tip movement.
The load applied to the model pile was measured by a load cell connected between the hydraulic actuator and the loading rod. The lateral displacement and angular rotation of the model pile were measured by two linear variable differential transformers (LVDTs) attached to the top of the pile. The angular rotation and lateral displacement (much less than 3 in.) at ground level were calculated from the difference between L VDT readings and the geometry of the setup. Movements of the L VDTs were monitored and recorded by the dataacquisition system.
A microcomputer-based data-acquisition system was used for recording and processing data. Signals from various sensors picked up by the signal conditioners were filtered, converted, and then channeled through a multiplexer to a digitally programmable amplifier-attenuator that adjusted the output signal level. The adjusted analog signals were then fed through an analog-to-digital converter that digitized the signals that were to be processed by the computer.
Testing Program
The model pile testing program required the construction of either level ground or sloping ground embankments made ·of pit-run, air-dried river sand or silty clay. For each type of the embankment material studies, parameters such as embankment geometry and loading direction were varied to evaluate the load-versus-displacement response of the pile-soil system and the corresponding measurements of lateral earth pressure distribution in longitudinal and circumferential directions.
The testing program involved a sequence of events composed of sample preparation, placement of pile, and testing and data collection. Locally available silty clay (Yolo Loam) and sand (Cache Creek sand) were chosen as embankment materials . Their pertinent properties are described in Table 1.
A brief description of cohesive soil sample preparation is given as follows. The bin was initially treated with a waterproofing seal to help retain moisture in the soil. For each lift of compaction, approximately 1,500 lb of soil was placed in the test bin to make a 4- to 5-in.-thick loose layer. The soil layer was then compacted, first with a vibratory plate compactor and then with a pneumatic hammer. A uniform amount
Yolo Loam
1,800 - 2,750
24° - 26°
116
27
12
15.3 - 17.4%
CL
157
Cache Creek Sand
0
40° - 43°
114.3
SP
of compaction effort was applied to each layer during compaction to achieve uniformity in shear strength and dry unit weight. The specification for compaction control of the cohesive soil was for each layer to be compacted at 3.5 percent above the optimum moisture content and to a minimum of 95 percent of the maximum dry density obtained by the modified AASHTO method T-180-57. Compaction was carried out on the wet side of optimum in an effort to avoid overcompaction of the layers.
When preparation of a soil sample was completed, damp burlap was placed on the surface of the soil sample and then the entire bin was covered with a sheet of plastic to prevent evaporation of moisture from the soil sample . In an effort to obtain a more uniform moisture content, the soil sample was permitted to sit covered overnight.
After allowing the soil sample to set overnight, a posthole driller was used to drill a 9-in. diameter hole to the desired depth in the embankment soil. The model test pile was then lowered into the hole, aligned vertically and then clamped into place. The material removed during drilling was broken up and placed back around the model pile in 1-in. layers and compacted with a slide hammer compactor.
The method of compaction used in cohesionless soil consisted of compacting 4- to 5-in .-thick loose layers of sand in the test bin with a vibratory sled. To place the test pile in the compacted sand, a vibratory-pneumatic driving system was developed. The pile was lowered into the embankment by a combined action of vibrating the pile and removing the sand directly below the pile with vacuum. The base of the test pile was modified to channel the sand directly below the test pile toward the holes in the base . A large capacity vacuum source was used to remove the sand directly below the pile through t~o 1/2-in.-diameter holes in the base. The sand was removed through the pile via two Y2-in.-diameter copper tubes that ran from the base, through the center of the pile, and out at the sides of the pile near the top. To keep the sand flowing up the vacuum tubes, compressed air was fed to the base through four Y4-in.-diameter feeder tubes. The feeder tubes ran from the top of the pile, down through the center, and out through the four Y4-in.-diameter holes in the base. The modified pile tip and the plumbing inside the pile, are shown in Figures 2 and 3, respectively .
The installation of the instrumented test pile does not simulate the actual field practice of CIDH pile ; disturbance in the surrounding soil and the nonuniformity in density resulting from recompaction should be recognized. Once the instrumented model pile was placed in the soil, the loading arm

158
FIGURE 2 Modified pile tip.
was connected to the top of the pile at a predetermined loading height. The photograph in Figure 4 illustrates a typical test setup.
Test Results
A total of 17 tests on sand and 27 tests on silty clay were carried out. Parameters covered in this study were the embedment length (with a slight variation in silty clay soil), the type of loading (monotonic or cyclic), the direction of loading, the sloping nature of the ground, and the distance of the pile from the edge of the slope. Detailed description of each test is given in Tables 2 and 3. The cyclic loading tests were performed on silty clay samples. Different numbers of cycles of low-level loading were applied (Table 3, Tests 29 to 34, inclusive). It was indeed difficult to maintain compaction control when large size test samples were prepared in the model box; iitus 1w111 sampit: iu sampit: a suuslauliai amuum uf s1,;aut:r existed in the data. However, the results of tests carried out for each individual sample were generally well-behaved and consistent with the loading directions .
One observation that was most apparent during testing was the surface character of the failure zone exhibited in the soil around the pile. A fan-shaped failure zone extending radially from both sides of the pile at 45 degrees or greater to the
TRANSPOR TA TION RESEARCH RECORD 1191
direction of loading was observed in both level and sloping grounds. A typical ground surface failure pattern can be recognized, as shown in Figure 5.
The typical response of measured lateral load versus displacement in clay embankment and sand embankment can be seen in Figures 6 and 7, respectively. The lateral resistance of the model test piles are given in Table 4. They are recorded as either the maximum lateral load obtained from the load-displacement curves or the lateral load corresponding to approximately 5 degrees of angular rotation of the pile. Because the load cell has a 3,000-lb capacity, a number of tests performed in clay embankments were prematurely terminated at approximately 3,000 lb of lateral load.
When lateral load is applied in the downslope direction on the pile (Figure 8) for both the silty clay and the sand embankments, the placement of the test pile on either the slope or the edge of the slope results in lower lateral resistance than is the case when it is placed with upslope or horizontal loading directions. When Lhe test pile is placed on the edge of a slope and lhe loading direction is upslope, the resulting load veru · displacement curve is approximately the same as the c~rresponding curve obtained for horizontal loading. Differences, however, can be observed consistently from the test results that show that in clay embankment the lateral resist-
FIGURE 3 Plumbing inside the model test pile.

Shen et al.
FIGURE 4 Typical test setup.
159
ance is slightly greater for upslope loading than for horiwntal loading, and vice versa for sandy embankment.
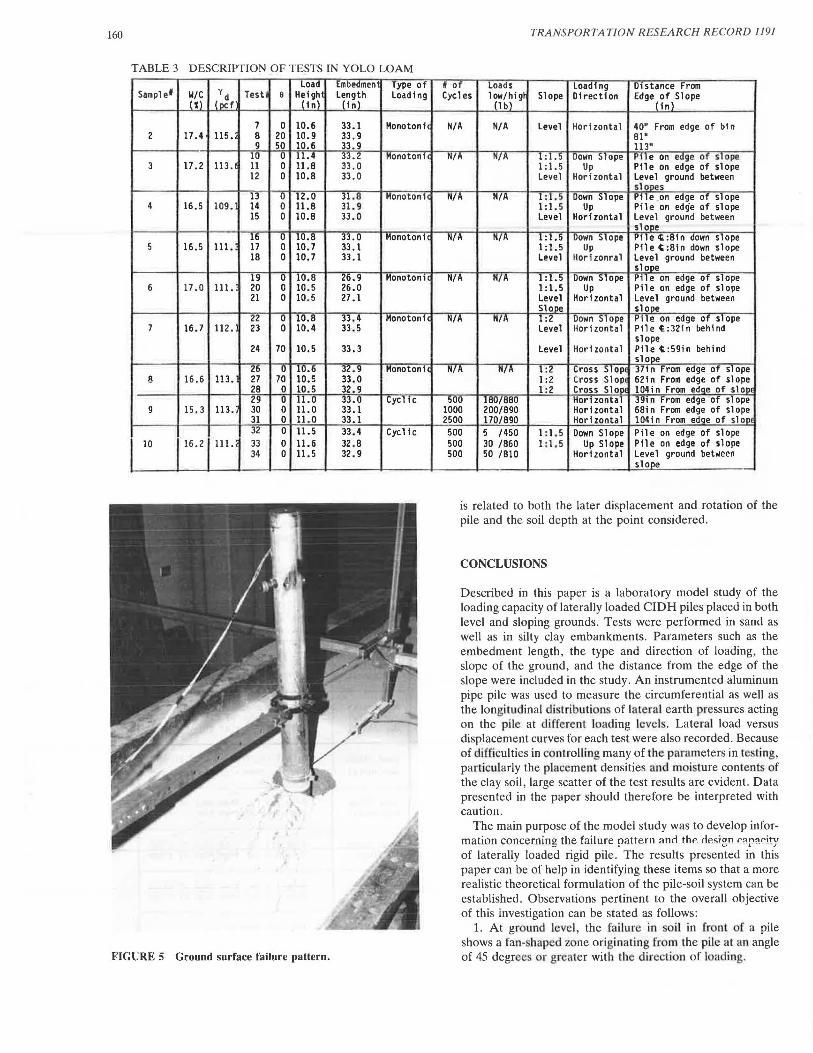
For cyclically loaded (push and pull) model pile tests in silty clay (the number of cycles varying from 500 to 2,500 and the low level cyclic loads from approximately 200 to 900 lb at 3 sec/cycle), the results in Figure 9 indicate that the number of loading cycles greater than 500 appears to have little effect on the load-displacement behavior of the model pile. Because the model test condition in the laboratory does not simulate the field cyclic loading environment and does not take into consideration the possible disturbance and weakening of in situ soil, the findings do not agree with the current design concept of reduced pile capacity for cyclic loading applications.
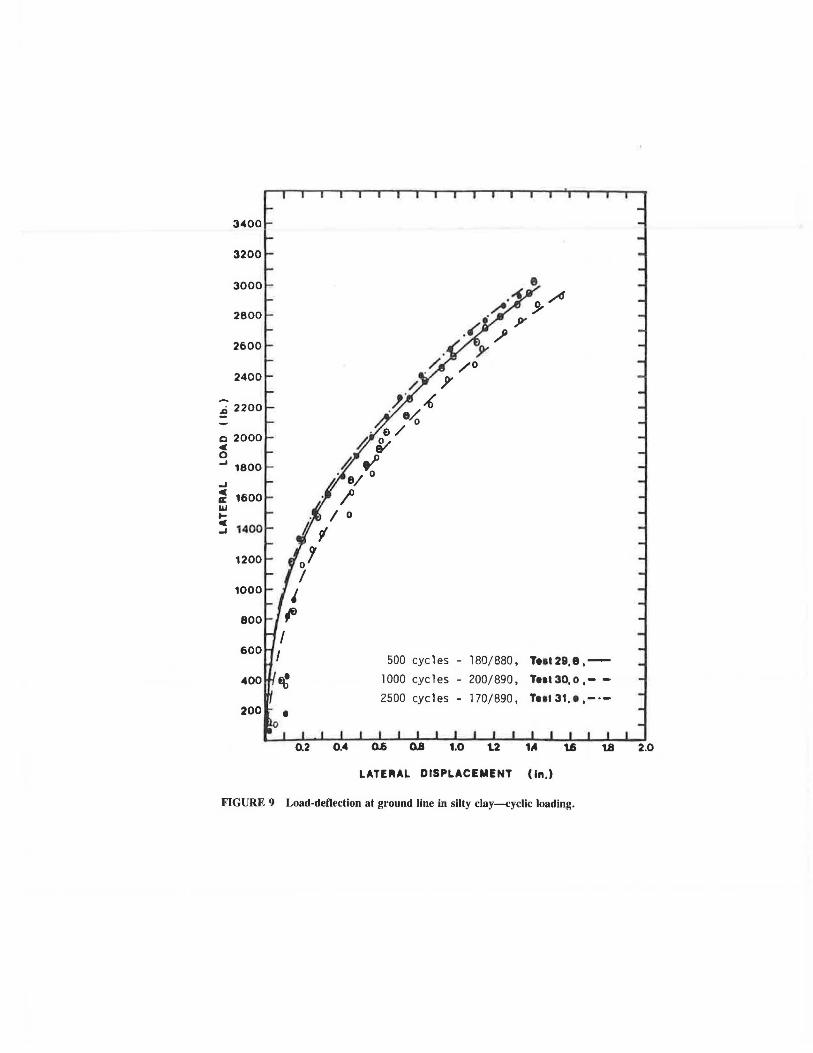
In an effort to develop a three-dimensional picture of the passive earth pressure distributions along the test pile, interface pressure transducers were placed at different locations along the pile circumference from test to test to gather a set of comprehensive data. In Tables 2 and 3, the various 6 values represent the angles of transducer locations with respect to the direction of loading: that is, 6 = 0 degrees when the transducer is placed in line with the loading direction and e = 90 degrees when it is placed perpendicular to the loading direction (Figure 8). The data obtained from sandy soil were later normalized and combined to show the radial passive earth pressure distributions against the pile at different depths for various load levels. A typical lateral earth pressure distribution along the depth of a pile in sand under different loading increments is shown in Figure 10. The pressure distributions are nonuniform both circumferentially and longitudinally. In general, the circumferential distribution has its maximum at 8 = 0 degrees, and decreases to at-rest pressure at 8 = 90 degrees. The longitudinal distribution of pressure
TABLE 2 DESCRIPTION OF TESTS IN CACHE CREEK SAND
Relative 9 1 e 2
Distance from Edge of Sample; y d Density Test II Slope Loading Slope or Bin
(pcf) (Z) (%) Direction (in)
1 0 N/A N/A Horizontal 52" from edge of bin 1 109.8 84.8 2 35 N/A N/A Horizontal 76" from edge of bin
3 70 N/A N/A Horizontal 107" from edge of bin
4 0 45 N/A Horizontal 47" from edge of bin 2 108.6 80.1 5 0 45 N/A Horizontal 78" from edge of bin
6 20 65 N/A Horizontal 108" from edge of b1 n
7 0 45 56 Down Slope Pile 1 in. from edge of slope 3 109.8 84.8 8 0 45 N/A Horizontal 108 in. from edge of bin
9 20 25 59 Down Slope Pile 1.3 in. from edge of slope 4 107.9 77.7 10 20 65 N/A Horizontal 109" from edge of bin
11 0 45 60 Down Slope Pile 1.3 in. from edge of slope 5 109.1 82.4 12 0 45 57 Up Slope Pile 0.8 in. from edge of slope
13 20 65 58 Up Slope Pile 1.8 in. from edge of slope 6 109.0 82. 0 14 0 45 60 Up Slope Pile 1. 5 in. from edge of slope
15 0 45 56 Cross Slope 46" from edge of bin 7 109.0 82.0 16 20 65 56 Cross Slope 81" from edge of bin
17 0 45 56 Cross Slope 108" from edge of bin
~ote: The height of loading for all tests in sand was 12 inches. The embedment length for all tests in sand was 32.75 inches.
160
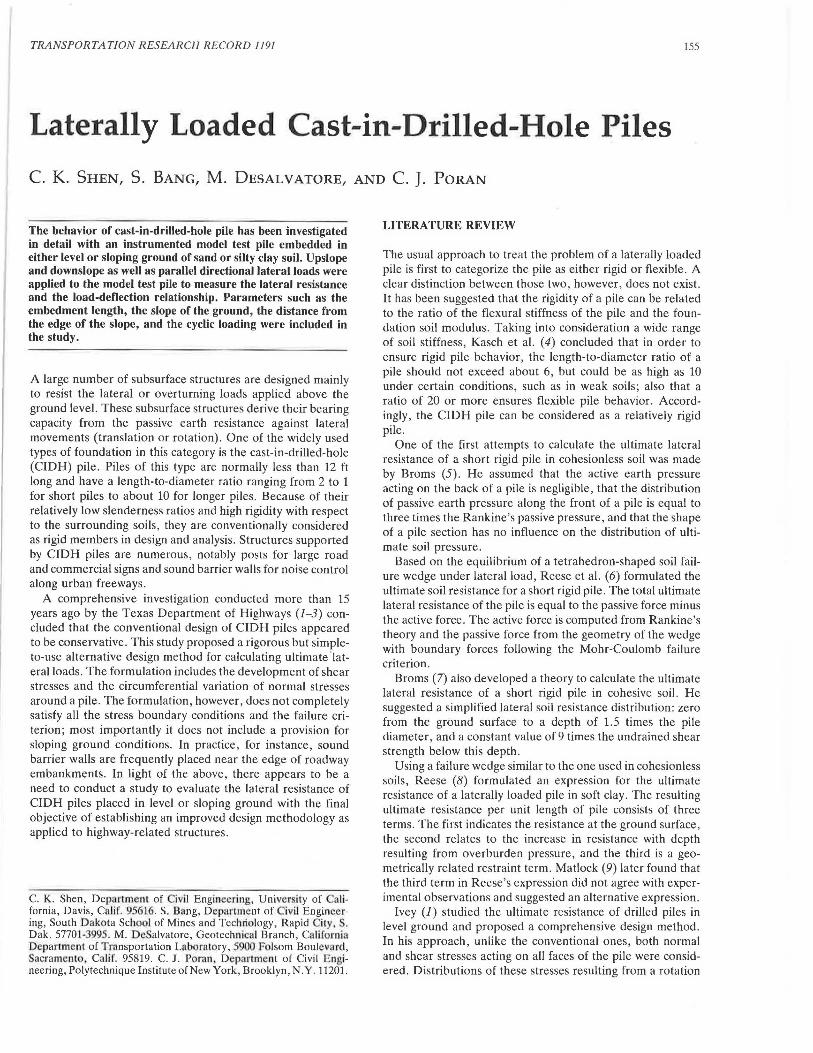
TABLE 3 DESCRIPTION OF TESTS IN YOLO LOAM Loa a Embeelmen Type of
Sampl ef W/C yd Testl e Heigh1 Length Loading (S) ( pcf (f nl (in)
7 0 10.6 33.1 Monotonf< 2 17.4 115 •• 8 20 10.9 33. 9
9 50 10.6 33.9 10 0 ll.4 33.2 Monoton1<
3 17.2 113.1 11 0 11.8 33.0 12 0 10.8 33.0
13 u 12.0 31.8 Monotonf< 4 16.5 log, 14 0 11.8 31. 9
15 0 10.8 33.0
lb u 10.8 33.0 l'lonotoni< 5 16.5 111. 17 0 10.7 33.1
18 0 10.7 33.l
19 0 10.8 26.9 Monotoni< 6 17.0 111. 20 0 10.5 26.0
21 0 10.5 27.l
22 0 10.8 33.4 Monotonl( 7 16.7 112. 23 0 10.4 33.5
24 70 10.5 33.3
26 0 10.6 32 . 9 Monotoni< 8 16.6 113. 27 70 10.5 33.0
28 0 10.5 32.9 29 0 ll.O 33.0 Cycl 1 c
9 15.3 113.1 30 0 11. 0 33.l 31 0 11.0 33.l 32 0 11.5 33.4 Cyclic
10 16.2 111.. 33 0 11.6 32.8 34 0 11.5 32. 9
FIGURE 5 Ground surface failure pattern.
TRANSPORT A TJON RESEARCH RECORD 1191
I of Loads Loading Dfstance From Cycles low/hi gt Slope Direction Edge of Slope
(1 bl (in)
N/A N/A Level Horizontal 40" From edge of b1 n 81" 113"
N/A N/A l:l.~ Down ~lope ~••eon eage or slope 1: 1.5 Up Pile on edge of slope Level Horizontal Level ground between
sl ooes N/A N/A 1 :l.5 Down Slope Pfl e on edge of slope
1 :1.5 Up Pile on edge of slope Level Horizontal Level ground between
slooe N/A N/A l :1.5 Down Slope P11 e <t :Bin Clown slope
1: 1.5 Up Pile t:8fn down slope Level Hori zonral Level ground between
slope N/A N/A I :1.5 Down Slope P11 e on edge of slope
l :1.5 Up Pile on edge of slope Level Horizontal Level ground between Slope slooe
N/A N/A 1:2 Down Slope Pile on edge of slope Level Horizontal Pile ~:32in behind
slope Level Horizontal Pile t:59in behind
slooe N/A N/A 1:2 Cross SlopE 371n From edge of slope
1 :2 Cross SlopE 62in From edge of slope 1:2 Cross SlOPl l04in From edoe of sloP1
500 180/880 Hor1 zontal 39i n From ed.ge of slope 1000 200/890 Horizontal 68in From edge of slope 2500 170/890 Horizontal 104in From edoe of slop1 500 5 /450 1: 1. 5 Down Slope Pile on edge of slope 500 30 /860 1: 1. 5 Up Slope Pile on edge of slope 500 50 /810 Horizontal Level ground between
slope
is related to both the later displacement and rotation of the pile and the soil depth at the point considered.
CONCLUSIONS
Described in this paper is a laboratory model study of the loading capacity of laterally loaded CIDH piles placed in both level and sloping grounds. Tests were performed in sand as well as in silty clay embankments. Parameters such as the embedment length, the type and direction of loading, the slope of the ground, and the distance from the edge of the slope were included in the study. An instrumented aluminum pipe pile was used to measure the circumferential as well as the longitudinal distribution of lateral earth pressures acting on the pile at different loading levels. Lateral load versus displacement curves for each test were also recorded. Because of difficulties in controlling many of the parameters in te ·ting, particularly the placement densities and moi ture contents of the clay soil, large scatter of the test results are evident. Data presented in the paper should therefore be interpreted with caution.
The main purpose of the model study was to develop information concerning the failure µattern ;met thP. rlPsien r"r<>c:-i!~'
of laterally loaded rigid pile. The results presented in this paper can be of help in identifying these items so that a more realistic theoretical formulation of the pile-soil system can be established. Observations pertinent to the overall objective of this investigation can be stated as follows:
l. At ground level, the failure in soiJ in front f a pile shows a fan- hap d zone originating Crom the pile at an angle of 45 degrees or gr ater with the direction of loading.

Shen et al. 161
0.2 0.4 0.6 OB 1.0 1.2 1.6 1.8 2.0
LATERAL DISPLACEMENT (In.)
FIGURE 6 Load-deflection at ground line in silty clay.
2. If the pile 1s placed on a slope and loaded in the downslope direction , its ultimate lateral loading capacity is lower than the capacity produced by a corre ponding pile either placed on the lope and loaded in the qpslope directi.on or placed on I vcl ground . Therefore to be on the ·afe •ide , the downslope loading capacity should be u ·ed to determine the design lateral resistance for CIDH piles placed on or near an embankment.
3. The passive earth pressure acting on a pile is nonuniform both circumferentially and longitudinally. Furthermore, the
magnitudes of earth pressure depend on the movement (displacement or rotation) of the pile with respect to the soil.
ACKNOWLEDGMENTS
The authors are grateful for the support provided by the California Department of Transportation and the Federal Highway Administration .

1300
1200
1100
1000
- 900 :!i c 800 c 0 ..I 700
..I
~ 600 Ill .... ~ 500
400
100
0.2 0.4 0.6 0.8
e
Downslope THI 9 ,e,
Horizontal Tes110,1 .- -
Upslope Test 12 o- -
1.0 1.2 1A 1.6 1B
LATERAL DISPLACEMENT (In.)
FIGURE 7 Load-deOection at ground line in sand.
Upslope loading
----?
11orizontal loading i:nmslope loading
Location of transducers
2.0
L~~ ---->~ ~ . Direction of loading
·~ FIGURE 8 Loading direction description.

TABLE 4 LATERAL RESISTANCE OF MODEL TEST PILES
Soil Test # Loading Slope Lateral Resistance direction (%) (1 bs)
Sand 1 Horizontal N/A 1,040 2 Horizontal N/A 1, 000 3 Horizontal N/A 1,000 4 Horizontal N/A 1,040 5 Horizontal N/A 970 6 Horizontal N/A 960 7 Downslope 56 450 8 Horizontal N/A 1,030 9 Downslope 59 520
10 Horizontal N/A 1,020 11 Downslope 60 540 12 Upslope 57 880 13 Upslope 58 900 14 Upslope 60 870 15 Cross-slope 56 970 16 Cross-slope 56 860 17 Cross-slope 56 800
Silty 7 Horizontal N/A 2,650 Clay 8 Horizontal N/A 2,860
9 Horizontal N/A 2,970 10 Downslope 67 1,900 11 Upslope 67 2,970 12 Horizontal N/A 2,880 13 Downslope 67 1,480 14 Upslope 67 2,180 15 Horizontal N/A 2,430 16 Downslope 67 1,390 17 Upslope 67 3,630 18 Horizontal N/A 2,680 19 Downslope 67 1,050 20 Upslope 67 2,550 21 Horizontal N/A 2,710 22 Downslope 50 1,820 23 Horizontal N/A 2,900 24 Horizontal N/A 2,760
26 Cross-slope 50 2,460 27 Cross-slope 50 2,550 28 Cross-slope 50 2,880 29* Horizontal N/A 3,020 30* Horizontal N/A 2,930 31* Horizontal N/A 2,920 32* Downslope 67 1,260 33* Upslope 67 2,520 34* Horizontal N/A 3, 110
* indicates cyclic loading tests
3400
3200
3000
2800
2600
2400
; 2200
c 2000 c 0 ~ 1800
~ c 1600 llC w ~ c 1400 ...I
1200
1000
800
600
400
200
~
• 0.2 0.4
500 cycles - 180/880, T11t29,e,~
1000 cycles - 200/890, T11l30,o ,- -
2500 cycles - 170/890, T11131,1,-·-
()..6 o.e 1.0 t.2 1A
LATERAL DISPLACEMENT (In.)
FIGURE 9 Load-deflection at ground line in silty clay-cyclic loading.
2.0
Shen et al.
Direction or Applied Latet1I Load
• • 21.75 In. Cell No. 4
• • 24.75 In. cen No. 3
•• 27.75 In. Cell No. 2
11 • 30.75in. Cell No. Note: 1sdeplh below groundllne
I I l I l l I l
T •• 3.75 in. Cell No.9
11::: 6.75 in. Cell No.a
•• 9.75 In. Cell No. 7
••12.75 in. Cell No. 6
•=18.75 in. Cell No. 5
I
Test• 2 Level Ground
Loeding Height= 12.0 In
Embedment Length = 32. 75 iri .
Pre11ure Ce ll Angle
··- 35° Pre11ure Distribution• : Load, 2001bs ,
Load, 400 lbs,
Load, 600 lbs,
Load, 800 lbs,
I l I I I
165
100 90 80 10 60 JO 20 10 0 10 10 JO 40 so 60 10 80 90 100 Later• • l'T•SIUt• (DSi)
FIGURE 10 Relationship between lateral pressure and depth in sand.
REFERENCES
1. D . L. Ivey. Theory, Resistance of a Drilled Shaff Footing to Overturning Loads. Texas Transportation Institute, Texas A&M University , Research Department 105-1. College Station, Feb. 1968.
2. D. L. Ivey and W.A. Dunlap. Design Procedure Compared to Full-Scale Tests of Drilled Shaft Footings . Texas Transportation Institute, Texas A&M University, Research Department 105-3, Feb. 1970.
3. D. L. Ivey, K. J. Koch, and C. F. Raba. Resistance of a Drilled Shaft Footing to Overturning Loads, Model Tests, and Correlation with Theory . Texas Transportation Institute, Texas A&M University, Research Department 105-2, College Station, July 1968.
4. V. R . Kasch. H. M. Coyle, R . E. Bartoskewitz, and W. G. Sarver. Lateral Load Test of a Drilled Shaft in Clay. Texas Transportation Institute. Texas A&M University. Research Department 211-1, College Station , Nov . 1977.
5. B . B . Broms. Lateral Resistance of Piles in Cohesionless Soils. Journal of Soil Mechanics and Foundation Division, ASCE, Vol. 90, SM3, 1964.
6. L. C. Reese, W. R. Cox, and F. D. Koop . Analysis of Laterally Loaded Piles in Sand. Offshore Technology Conference Paper 2080, Houston, Tex., May 1974.
7. B. B . Broms. Lateral Resistance of Piles in Cohesive Soils. Journal of Soil Mechanics and Foundation Division, ASCE, Vol. 90, SM3, 1964.
8. L. C. Reese . Discussion of Soil Modulus for Laterally Loaded Piles by B. McClelland and J. A. Focht, ASCE, Vol. 123, 1958.
9. H . Matlock . Correlations for Design of Laterally Loaded Piles in Soft Clay. Offshore Technology Conference, Paper No . 1204, Houston, Texas, April, 1970.
10. C. 0 . Hays, C.O., J. L. Davidson, E . M. Hagan, and R. R. Ristano. Drilled Shaft Foundation for Highway Sign Structures. Engineering and Industrial Experiment Station, University of Florida, Research Department D647F, Dec. 1974.
11. D . L. Ivey, and L. Hawkins. Signboard Footings to Resist Wind Loads . Civil Engineering, Vol. 36, No. 12, Dec. 1966.
12. J . L. Davidson, C. 0. Hays, and E. M. Hagan, Jr. Design of Drilled Shafts Supporting Highway Sign. In Transportation Research Record 616, TRB, National Research Council, Washington , D.C., 1976, pp. 62-66.
13. R . L. Lytton. Design Charts for Minor Service Structure Foundations . Texas Transportation Institute, Texas A&M University , Research Department 506-IF, Sept. 1971.
14. J . R . Seiler. Effect of Depth of Embedment on Pole Stability. Wood Preserving News, Vol. 10, No. 11. Nov. 1932.
15. J . I> . Hansen. The Ultimate Resistance of Rigid Piles Against Transversal Forces. The Danish Geotechnical Institute Bulletin, No. 12, Copenhagen, Denmark, 1961.
16. M. W . Bierschwale, H. M. Coyle , and R . E . Bartoskewitz. Field Tests and Design Procedure for Laterally Loaded Drilled Shafts in Clay. Texas Transportation Institute , Texas A&M University, Research Department 211-3F, Jan . 1981.
17. G . L. Holloway, H. M. Coyle , R . E . Bartoskewitz, and W. G . Sarver. Field Test and Preliminary Design Method for Lateral Loaded Drilled Shafts in Clay . Texas Transportation Institute, Texas A&M University, Research Department 211-2, Sept. 1978.
18. W. L. Shilts, L. D. Graves, and G . G. Driscoll. A Report of Field and Laboratory Tests on the Stability of Posts Against Lateral Loads. In Proc., 2nd International Conference on Soil Mechanics and Foundation Engineering, Vol. 5, Rotterdam, The Netherlands, 1948.
19. N. F. Ismael, and T. W. Klym. Behavior of Rigid Piers in Layered Cohesive Soil. ASCE, Vol. 104, GTB, Aug. 1978.
20 . L. C. Reese. Design and Construction of Drilled Shafts. ASCE, Vol. 104, GTI, Jan. 1978.
21. W . V . Wright, H. M. Coyle, R . E . Bartoskewitz, and L. J. Milberger. New Retaining Wall Design Criteria Based on Lateral Earth Pressure Measurements. TTl , Texas A&M University, Research Department 169-4F, Aug. 1975.
22 . E . Czerniak. Resistance to Overturning of Single Short Piles. Journal of the Structural Division , ASCE, Vol. 83, No. ST2, March 1957.
Publication of this paper sponsored by Committee on Subsurface Soi/Structure Interaction.