city research onlineopenaccess.city.ac.uk/12238/1/utility applications of smart online... ·...
TRANSCRIPT

City, University of London Institutional Repository
Citation: Elsayed, H.I. (2014). Utility Applications of Smart Online Energy Systems: A case for Investing in Online Power Electronics. (Unpublished Doctoral thesis, City University London)
This is the accepted version of the paper.
This version of the publication may differ from the final published version.
Permanent repository link: http://openaccess.city.ac.uk/12238/
Link to published version:
Copyright and reuse: City Research Online aims to make research outputs of City, University of London available to a wider audience. Copyright and Moral Rights remain with the author(s) and/or copyright holders. URLs from City Research Online may be freely distributed and linked to.
City Research Online: http://openaccess.city.ac.uk/ [email protected]
City Research Online

Utility Applications of Smart Online Energy
Systems:
A case for Investing in Online Power Electronics
A thesis submitted to
CITY UNIVERSITY, LONDON
For the Degree of
DOCTOR OF PHILOSOPHY
By
Hatim Ibrahim Elsayed
School of Engineering and Mathematical Sciences
Department of Electrical and Electronics Engineering
City University
London EC1V 0HB
United Kingdom
April 2014

1
Table of Contents
Acknowledgements ...........................................................................................................12
Declaration .......................................................................................................................13
Abstract ............................................................................................................................13
Chapter 1: Introduction and Commentary ..........................................................................15
1.1 The Thesis Structure ............................................................................................................. 15
1.2 Rationale for the Research Work undertaken ........................................................................ 16
1.3 The Original Contributions of this Thesis ............................................................................... 17
1.4 Current or Planned Practice Use of the Doctoral Work .......................................................... 18
1.5 Contemporary Relevance and Implications for Future Research and Practice Development ... 19
Chapter 2: Research Questions, Tools, Techniques, Methodology .......................................20
2.1 Introduction ......................................................................................................................... 20
2.2 Research Aim and Objectives................................................................................................ 20
2.2.1 Research questions and hypothesis ...........................................................................21
2.3 Research Methodology ........................................................................................................ 22
2.3.1 Resources and research direction ..............................................................................22
2.3.2 Research and data analysis .......................................................................................22
2.3.3 Dissemination artefact and plan................................................................................23
2.3.4 Validity, reliability, limitations, and ethics .................................................................23
2.4 Analysis of Literature ........................................................................................................... 24
Chapter 3: Operational Constraints in QPTS .......................................................................25
3.1 Introduction ......................................................................................................................... 25
3.2 Overview of Qatar Power Transmission System (QPTS) Challenges ........................................ 25
3.3 QPTS Software Models ......................................................................................................... 28
3.4 Overloading and Voltage problems in the 132 kV Western Ring ............................................. 30
3.5 Concluding Remarks ............................................................................................................. 32
Chapter 4: Compensation from FACTS and Non-FACTS Devices ...........................................34
4.1 Introduction ......................................................................................................................... 34
4.2 Physical Constraints in a Typical Transmission Power System ................................................ 34

2
4.3 Conventional Compensation................................................................................................. 35
4.3.1 Phase shifting transformer (PST) compensation .........................................................35
4.3.2 SEN transformer (ST) .................................................................................................36
4.4 Series Compensation ............................................................................................................ 36
4.4.1 Concept of series compensation ................................................................................36
4.4.2 Fixed Series Capacitor (FSC) compensation ................................................................37
4.4.3 Thyristor Controlled Series Capacitor (TCSC) ..............................................................38
4.4.4 Static Series Synchronous Compensator (SSSC) ..........................................................38
4.5 Shunt Compensation ............................................................................................................ 39
4.5.1 Static VAr Compensator- SVC ....................................................................................40
4.5.2 Static Compensator - STATCOM .................................................................................41
4.6 Series and Shunt Compensation FACTS Devices ..................................................................... 42
4.6.1 Interline Power Flow Controller (IPFC) .......................................................................42
4.6.2 Unified Power Flow Controller (UPFC) ........................................................................43
4.6.3 Generalized Unified Power Flow Controller (GUPFC) ..................................................45
4.7 Concluding Remarks ............................................................................................................. 46
Chapter 5: Smart Online Energy Systems and Power Electronics .........................................47
5.1 Introduction ......................................................................................................................... 47
5.2 Implementation of Smart Power Electronics initiative in QPTS and QPDS .............................. 47
5.3 Potential of using Online Power Electronics devices in QPTS ................................................. 48
5.4 Potential Smart Grid and Micro Grid Evolution in QTPS and QPDS ......................................... 49
5.5 Online FACTS Monitoring and Control via Synchrophasors .................................................... 51
5.6 Compatibility of QPTS Online SCADA and EMS Systems with PMUs ....................................... 52
5.7 Emerging Online Systems and Standards .............................................................................. 53
5.8 Concluding Remarks ............................................................................................................. 54
Chapter 6: Literature Review of Power Electronics and Online Energy Systems ...................55
6.1 Introduction ......................................................................................................................... 55
6.2 Literature Review of Utilities Applications in Power Electronics ............................................. 55
6.2.1 SVC voltage control via synchrophasor in Southern California Edison’s system ...........55
6.2.2 Various FACTS utilisation in Utilities ..........................................................................56
6.2.3 Modelling and control coordination of power systems with FACTS devices in steady
state operating mode ........................................................................................................57
6.2.4 Preventing voltage collapse by large SVCs at power system faults .............................58
3
6.2.5 SVC wide-area power oscillation damping control using PMUs ..................................60
6.2.6 Wide area monitoring, protection and control system in GB ......................................60
6.2.7 Synchrophasors for improved interconnection operations ..........................................61
6.2.8 PSS and FACTS devices controller for damping of power system oscillations ...............62
6.2.9 Small signals analysis of damping performance of IPFC and UPFC controllers .............64
6.2.10 Power-flow control and power-quality enhancement in interconnected networks ...65
6.2.11 Power flow calculation with GUPFCs connected in a power grid ...............................65
6.2.12 Online simulation benefits for operation of large power systems .............................66
6.2.13 Optimal location of FACTS devices using Genetic Algorism (GA) ...............................68
6.2.14 State estimation of power system with FACTS and HVDC .........................................70
6.2.15 Optimal allocation of FACTS devices using Bees Algorithm (BA) ...............................70
6.3 Literature Review of Online Energy Systems ......................................................................... 71
6.3.1 Online power conversion system technology .............................................................71
6.3.2 Online monitoring structures in power transmission lines ..........................................72
6.3.3 Online control on ESS and wind-diesel system ............................................................73
6.3.4 Online diagnosing shorted turns on the windings of power transformers ...................73
6.3.5 Online small signal stability PMUs based analysis of multi-machine systems .............74
6.3.6 Online smart alarm processing system for digital substations ....................................74
6.3.7 Online power estimation using an on-chip bus performance monitoring units ............75
6.3.8 Current phasor measurement in a power system state estimator ...............................75
6.3.9 Online estimation of maximum power transfer limits (Thevenin equivalent
parameters) ......................................................................................................................76
6.3.10 Online estimation of distorted power system signal parameters ..............................76
6.3.11 Online PMUs estimation/application of power grid impedance matrices .................77
6.3.12 Online state estimation for fault detection and voltage sag .....................................78
6.3.13 Distribution systems state estimation ......................................................................79
6.3.14 Improved power state estimation based on rectangular coordinates .......................80
6.3.15 Dynamic equivalents of power systems with online measurements ..........................81
6.3.16 Online collaborative voltage stability control of power systems ...............................82
6.3.17 Online dynamic security assessment for proper power system control .....................83
6.3.18 Online real-time hardware in the loop optimization using a simulation ....................83
6.4 Outcome of Literature Review .............................................................................................. 85

4
Chapter 7: Case Studies: Power Electronics Applications in QPTS ........................................86
7.1 Case Study One-Voltage and Power Flow Control with FACTS in QPTS ................................... 86
7.1.1 Objective ..................................................................................................................86
7.1.2 The solutions .............................................................................................................86
7.1.3 Simulation of the case study scenarios ......................................................................87
7.1.4 Power flow contingencies ..........................................................................................87
7.1.5 Application of different system improvement techniques ...........................................90
7.1.5.1 Uprating of the existing OHL capacity .....................................................................90
7.1.5.2 Using SVC in addition to OHL uprating ....................................................................92
7.1.5.3 Series Compensation (Fixed Series Capacitor- FSC) ..................................................92
7.1.5.4 Series Compensation (Thyristor Control Series Capacitor- TCSC) ..............................93
7.1.5.5 Generalized Unified Power Flow Controller - GUPFC ................................................93
7.1.5.6 Optimal GUPFC allocation technique using software simulation .............................94
7.1.6 Analysis of the case study ........................................................................................ 102
7.1.7 Concluding remarks ................................................................................................ 109
7.2 Case Study Two-Steady State and Dynamic Analysis of FACTS on QPTS ................................ 114
7.2.1 Introduction ............................................................................................................ 114
7.2.2 Power flow imbalance and low voltage ................................................................... 115
7.2.3 Smart power grid in Qatar: Application of STATCOM and composite conductors ...... 115
7.2.4 Upgrading the overhead lines using composite conductors ...................................... 116
7.2.5 Capacitor for steady-state voltage control ............................................................... 116
7.2.6 STATCOM for steady-state voltage control .............................................................. 117
7.2.7 STATCOM for dynamic voltage control .................................................................... 118
7.2.8 Green benefits of using composite conductors and STATCOM .................................. 128
7.2.9 STATCOM compensation controlled via synchrophasors .......................................... 129
7.2.10 Concluding remarks ............................................................................................... 130
7.3 Case Study Three-HVDC and STATCOM Performance in QPTS .............................................. 131
7.3.1 Introduction ............................................................................................................ 131
7.3.2 Modelling and analysing HVDC links in Qatar’s Transmission System ....................... 131
7.3.1 Concluding remarks ................................................................................................ 135
7.4 Conclusions of the three case studies ................................................................................. 135
Chapter 8: Potential Application of Smart Distributed Generation in QPS ......................... 137

5
8.1 Introduction ....................................................................................................................... 137
8.2 Problem Statement ............................................................................................................ 137
8.3 Daily Load Behaviour at Selected Substations During Summer............................................. 138
8.4 Planning and Operational Constraints within OOF Substation ............................................. 139
8.4.1 Substation disconnection ........................................................................................ 141
8.4.2 Poor power quality ................................................................................................. 142
8.4.3 Life-time reduction of materials due to overload conditions ..................................... 143
8.5 Energy Storage System (Battery Storage and PVs) Solution.................................................. 143
8.5.1 Photo voltaic - solar energy mapping of Qatar ........................................................ 144
8.5.2 Land requirements for PV panels ............................................................................. 145
8.5.3 Election of battery storage system (BSS) type and capacity ...................................... 145
8.5.4 Land requirements and location for BSS and PCS ..................................................... 146
8.5.5 Building layout for BSS and PVs ............................................................................... 147
8.6 Online Control of Energy Storage System ............................................................................ 148
8.6.1 Online power conversion ......................................................................................... 148
8.6.2 Control methodology .............................................................................................. 148
8.6.3 Control of PV panels ................................................................................................ 149
8.7 Implementation of Battery Storage System with Manufacturer Knowhow ........................... 150
8.7.1 To upgrade the power of the substation (Figure 71) ................................................. 150
8.7.2 To add two additional 40 MVA transformers and busbars ....................................... 150
8.7.3 To install a distributed generation (DG) plant downstream the substation ............... 151
8.7.4 To implement demand side management (DSM) techniques. ................................... 152
8.7.5 Comparison between solutions ................................................................................ 153
8.7.5.1 Solutions that shall be disregarded ....................................................................... 153
8.7.5.2 Solutions that shall re-formulated ........................................................................ 153
8.7.5.3 Potential solutions ............................................................................................... 154
8.7.5.4 Upgrading the substation ..................................................................................... 154
8.7.5.5 Using BESS devices ............................................................................................... 154
8.7.5.6 Using DSM ........................................................................................................... 155
8.7.5.7 The BESS proposal ................................................................................................ 156
8.7.6 General cost overview ............................................................................................. 157
8.8 Concluding Remarks ........................................................................................................... 158

6
Chapter 9: Discussions, Conclusions, and Recommendations ............................................ 161
9.1 The Discussions and Conclusions ........................................................................................ 161
9.2 The Recommendations ....................................................................................................... 162
9.3 The Contribution of this thesis ............................................................................................ 163
9.4 The Recommendation for future work ................................................................................ 164
List of Publications (References) ....................................................................................... 165
Appendix-A: - PSS®E Software used for Power System Analysis in the Study ..................... 173
Appendix-B: - Research Dissemination Artefact and Plan ................................................. 177
Appendix-C: - Research Theory in Power Electronics Technologies .................................... 190
Appendix-D: - FACTS and Custom Power Devices Design Characteristics ........................... 210
Appendix-E: - Optimization of Power Losses ..................................................................... 233
Appendix-F: - Authors’ Publications- Doctoral Research Published Papers ........................ 241

7
Figures
Figure 1: Qatar Power Transmission Network overview 400, 220 and 132 kV
Figure 2: Demand Forecast (MW) in Qatar for 2011-17
Figure 3: 220/132 kV QPTS SLD (PSS®E model 2016)
Figure 4: 400/220 kV QPTS SLD (PSS®E model 2016)
Figure 5: Normal power flow case without capacitors, STATCOM or HVDC (PSS®E QPTS -2015 model)
Figure 6: Normal case without capacitors, STATCOM or HVDC (PSS®E QPTS beyond 2015 model)
Figure 7: Typical power transmission line model
Figure 8: TCSC module
Figure 9: SVC building blocks and voltage/current characteristic
Figure 10: STATCOM structure and voltage/current characteristic
Figure 11: Interline Power Flow Controller -IPFC model
Figure 12: Unified Power Flow Controller (UPFC)
Figure 13: Generalized Unified Power Flow Controller GUPFC
Figure 14: Electric power consumption worldwide, 1971-2010
Figure 15: DSOs participating in Grid4EU smart grid project
Figure 16: Ranges of investment cost for TCSC, UPFC, SVC
Figure 17: Contingency power flow case N-1 @ Al S’halah-GCC (2015 model)
Figure 18: Normal case with increased load by 110 MW
Figure 19: Contingency case - Al S’halah-GCC with increased load by 110 MW
Figure 20: Voltages with OHL conductor up-rating to 256 MVA
Figure 21: Power flows with OHL conductor up-rating to 256 MVA
Figure 22: Power flows and voltages with conductor up-rating plus SVC
Figure 23: Power flows and voltages with series compensation using FSC and TCSC
Figure 24: Power flows and voltages with GUPFC-Location-4, (100 MW, 50 MVAr)
Figure 25: Power flows and voltages with GUPFC-Location-4, (50 MW, 50 MVAr)
Figure 26: Reactive power sizing at Dukhan in system intact condition (PSS®E 2017/18 model)
Figure 27: Reactive power sizing at Dukhan in N-1 contingency condition (PSS®E 2017/18 model)
Figure 28: Power transfer from Dukhan to Umm Bab in N-1 contingency condition (PSS®E 2017/18 model)
Figure 29: Normal case with GUPFC (50 MW, 50 MVAr)-Location-4, at Dukhan (PSS®E 2017/18 model)
Figure 30: GUPFC (50 MW, 50 MVAr)-Location-4, at Dukhan (towards Umm Bab) - N-1 at S’halah – GCC
Figure 31: GUPFC (50 MW, 50 MVAr)-Location-4, at Dukhan, N-1 at Sulami – Dukhan Jn
Figure 32: GUPFC (50 MW, 50 MVAr)-Location-4, at Dukhan, losing one converter of the GUPFC
Figure 33: Line loadings and voltages under normal operation and contingency (OOF: Out of firm)
Figure 34: Line loadings and voltages with OHL capacity up-rating, under normal operation and contingency
Figure 35: Line loadings and voltages with OHL up-rating plus SVC. Normal operation and contingency
Figure 36: Line loadings and voltages with OHL up-rating plus FSC (50%). Normal operation and contingency
Figure 37: Line loadings and voltages with OHL up-rating plus 70% SC (FSC 50%+TCSC 20%)
Figure 38: Line loadings and voltages with OHL up-rating plus GUPFC at location-1 (100 MW, 50 MVAr)
Figure 39: Line loadings and voltages with OHL up-rating plus GUPFC at location-2 (100 MW, 50 MVAr
8
Figures (continued)
Figure 40: Line loadings and voltages with OHL up-rating plus GUPFC at location-3 (100 MW, 50 MVAr)
Figure 41: Line loadings and voltages with OHL up-rating plus GUPFC at location-4 (100 MW, 50 MVAr)
Figure 42: Line loadings and voltages with OHL up-rating plus GUPFC at Location-4 (50 MW, 50 MVAr)
Figure 43: Normal case without fixed capacitor, STATCOM and without reconductored lines
Figure 44: Normal case with capacitors and reconductored lines
Figure 45: Normal case with STATCOM and reconductored lines
Figure 46: Siemens PTI’s PSS®E STATCOM closed loop control model
Figure 47: Machine rotor angle (degrees), with STATCOM, and with capacitor in steady state condition
Figure 48: Bus voltages (pu) of normal case, with STATCOM, and with fixed capacitor in steady state condition
Figure 49: Machine rotor angle (degrees) at Ras Laffan following contingency-1
Figure 50: Voltage profile of Dukhan 132 kV bus following contingency-1
Figure 51: Machine rotor angle (degrees) at Ras Laffan following contingency-2
Figure 52: Voltage profile of Al Sulami 132 kV bus following contingency-2
Figure 53: Machine rotor angle (degrees) at Ras Laffan following contingency-3
Figure 54: Voltage pu profile of Al S’halah 132 kV bus following contingency-3
Figure 55: STATCOM current pu profile for the three contingencies
Figure 56: Normal case with STATCOM and HVDC (PSS®E QPTS model – Beyond 2015)
Figure 57: Machine rotor angles (degrees) following contingency-1
Figure 58: Machine rotor angles (degrees) following contingency-2
Figure 59: Machine rotor angles (degrees) following contingency-3
Figure 60: Load profile of some OOF substations during the day of 2011 system peak
Figure 61: Operation of Maither North substation during normal conditions (without contingencies)
Figure 62: Operation of Maither North feeder-substation during a contingency
Figure 63: Maither North substation loading during 2011
Figure 64: The US Northeast blackout of Aug 14, 2003
Figure 65: Unplanned long interruptions in Europe excluding exceptional events; minutes lost per year-1999-2010
Figure 66: Solar resource spatial distribution in Qatar
Figure 67: Layout of a typical 4 MW BSS
Figure 68: Conceptual layout of solar panels and BSS building in Maither North substation
Figure 69: Single line diagram of the Maither North substation with conceptual connection of PV & BSS
Figure 70: Battery output for load following and maximum output control philosophy
Figure 71: Possible solution to distribution substation overload: to update substation power
Figure 72: Possible solution to distribution substation overload: to add a DG plant downstream
Figure 73: Simplified representation of the BESS solution proposed by a Manufacturer
Figure 74: Aerial view of the BESS solution integrated in Maither North substation
Figure 75: Simplified SLD of ESS
Figure 76: Areas in power system and simulation development
Figure 77: Power-angle curves and midpoint voltage sag
Figure 78: Transmission line model and voltage stability
Figure 79: Angle stability and equal area stability (Pm = mechanical power, Pe = electrical power)

9
Figures (continued)
Figure 80: Multi-machine stability
Figure 81: Line reactance and capacitor resonance
Figure 82: Shunt compensator at mid-point of lossless line and voltage current characteristics
Figure 83: Power angle characteristics at 2 pu and active/reactive power & power angle at 1 pu
Figure 84: Real power vs. reactive power
Figure 85: Power swing damping
Figure 86: System response to a perturbation
Figure 87: System response when the breaker opens inadvertently
Figure 88: Voltage-current curve without compensation
Figure 89: VI curve effects of increasing Vth (left) and Xth (right)
Figure 90: Components of TSC
Figure 91: TSC - Transient-free switching
Figure 92: TCR model and VI relationship
Figure 93: TCR - current relation with α= 90º and α= 180º
Figure 94: TCR – harmonics
Figure 95: Typical SVC scheme and SVC VI characteristics
Figure 96: 12-Step SVS-output waveform and harmonic spectrum
Figure 97: 24-Step output waveform and harmonic spectrum
Figure 98: 3-Level inverter and 5-level inverter
Figure 99: STATCOM - VAr generation and VI characteristics
Tables
Table I: Power flows results, OHLs reconductoring, 2015-2016 models
Table II: Power flows results- FSC and TCSC, 2015-2016 models
Table III: Power flows results- GUPFC 2015-2016 models
Table IV: Busbar voltages, OHLs reconductoring, 2015-2016 models
Table V: Busbar voltages- FSC and TCSC, 2015-2016 models
Table VI: Busbar voltages- GUPFC, 2015-2016 models
Table VII: Module efficiencies and surface areas per cell material
Table VIII: Advantages and disadvantages of different DG solutions
Table IX: Comparison between SVC and STATCOM
Table X: Base load flow result. Losses = 0.045 pu
Table XI: Load flow result for 5% increment in total demand. Losses = 0.04818
Table XII: Load flow result for 5% increment in total demand (bus 2 is slack). Losses = 0.04841
Table XIII: Optimum condition for the system. Optimum losses = 0.015 pu

10
Abbreviations - Nomenclature
Kahramaa- Qatar General Electricity & Water Corporation
QPTS- Qatar Power Transmission System
QPDS- Qatar Power Distribution System
QPS- Qatar Power System
CPBD-Corporate Planning and Business Development Department in Kahramaa
OPE- Online Power Electronics
FACTS- Flexible Alternating Current Transmission
HVDC- High Voltage Direct Current
SVC- Static VAr Compensator
STATCOM- Static Compensator
SC- Series Compensation
TCSC- Thyristor Control Series Capacitor
SSSC- Static Synchronous Series Compensator
UPFC- Unified Power Flow Controller
UPQC- Unified Power Quality Conditioner
MSC- Mechanically Switched Capacitor
TSC- Thyristor Switched Capacitor
TCR- Thyristor Controlled Reactor
FSC- Fixed Series Capacitor
PST- Phase Shifting Transformer
TCPST- Thyristor Controlled Phase Shifting Transformer
STS- Static Transfer Switch
VSC- Voltage Source Converter
CSC- Current Source Converter
LCC- Line Commutated Converter
MMC- Modular Multilevel Converter
IGBT- Insulated Gated Bipolar Transistor
GTO- Gate Turn-off Thyristor
GCT- Gate Commutated Thyristor
DVR- Dynamic Voltage Restorer
PWM- Pulse Width Modulation
PMU- Phasor Measurements Unit
PMU- Performance Monitoring Unit
SMT-Synchronized Measurement Technology
WAMPAC-Wide Area Monitoring, Protection and Control
WAM-Wide Area Monitoring
WAC-Wide Area Control
WAP-Wide Area Protection
PAR- Phase Angle Regulating transformers
PSS- Power System Stabilizer

11
Abbreviations – Nomenclature (continued)
ACCC- Aluminium Conductor Composite Core
ACCR- Aluminium conductor Composite Reinforced Conductor
TES- Thermal Energy Sources
RES- Renewable Energy Sources
ESS- Energy Storage System
OHL- Over-Head Line
BESS- Battery Energy Storage System
DSM- Demand Side Management
OOF- Out of Firm
ICT- Information, Communications Technology
GA- Genetic Algorithm
PSS®E -Power Systems Simulator Software
DG-Distribution Generations
PV-Photo Voltaic
GPS-Global Positioning System

12
Acknowledgements
I would like to offer special thanks to my External Supervisor, Prof. Loi Lei Lai, the
Co-Supervisor (Ex-Principal Supervisor), and Ex-Head of the Energy System Group, at City
University London, for his great support and guidance throughout this PhD study. The thank is
also extended to my Principal Supervisor, Prof. Nicos Karcanias the Associate Dean for
Research, Systems and Control Centre, School of Engineering and Mathematical Sciences at
City University London, for his patient supervision and cooperation. I appreciate the support
from Dr Youyou Yan, the Postgraduate Research Coordinator at City University. Many thanks
to Dr. Lambros Ekonomou, the Lecturer in Power Systems, Dr. E. Dr Milonidis, Senior
Lecturer in Power Systems of Electrical and Electronic Engineering Department at City
University and Dr. Antonis Alexandridis, from University of Patras.
The success of this research was also attributed to the knowledge gained from the
graduate engineering courses taken at University of Idaho, USA especially those conducted by
Professor Brian K. Johnson, of the Department of Electrical & Computer Engineering. The
course knowhow was augmented by a joint research work conducted with Professor Johnson
resulting in different research papers. Dr Keehan Chan and Eng. Edrissa Cham have offered
their assistance in formulating the case studies and both helped in reviewing and editing this
thesis.
I have to appreciate the continuous support from the management of Qatar General
Electricity and Water Corporation (Kahramaa), and Electricity Networks Planning Department
during this course of study. Thanks shall be mentioned to my family members, who stand
behind me and sacrificed their own rights and freedom for the sake of this study.

13
Declaration
I shall hereby declare to grant powers of discretion to the City University Librarian to
allow the thesis to be copied in whole or in part without further reference to me. This
permission covers only single copies made for study purposes, subject to normal conditions of
acknowledgement.
Hatim Ibrahim Elsayed
April 2014

14
Abstract
The backbone of any power grid, the transmission and sub-transmission networks,
should be flexible, robust, resilient and self-healing to cope with wide types of network adverse
conditions and operations. Power electronic applications are making a major impact on the
present and future state of power systems generation, transmission and distribution. These
applications include FACTS (Flexible Alternating Current Transmission), HVDC (High
Voltage Direct Current) in transmission and Custom Power devices in distribution. FACTS
devices are some of the advanced assets that network planners can use to make the
transmission grid become more flexible and robust. Many established research ideas to
advance operations of these devices have been published in the open literature over the last ten
years. The most recent publications in this field are reviewed in this thesis. A critical analysis
of literature and existing conditions reveals a range of potentials that are ideal for development
in Qatar’s increasingly strained electricity network.
As a result of demand surge in Qatar in recent years and the forecast to grow in the same
rate, the need for improvement in Qatar Power Transmission System (QPTS) is great and
significant. Conventional planning and operational solutions such as conductor up-rating, and
fixed series capacitors (FSC) are considered. However there are growing challenges on getting
new rights of ways for new overhead lines and even corridors for new cables. Advanced
FACTS devices are considered for dynamic control of power flows and voltages, such as
TCSC (Thyristor Controlled Series Capacitor) and GUPFC (Generalized, Unified Power Flow
Controller). The research in this thesis examines the potential for QPTS to improve and
develop, with emphasis on increased output through integrated online energy systems, online
FACTS and HVDC controllers based on synchrophasor measurements. The devices are
modelled in Siemens PTI’s PSS®E software, through steady-state mode case study to
investigate power flow control and voltage support. Comparison between similar FACTS
technologies, such as SVC and STATCOM, is also presented.
The improvement in power flow imbalance between transmission lines with different
ratings and lengths is studied. The FACTS devices are tested for voltage support to enhance the
network voltage profile and hence increase security and reliability to important industrial
customers. Optimization techniques of the FACTS devices allocation and rating are generally
discussed considering the voltage improvement and optimal power flow control. The results
achieved showing the network improvement with using the FACTS are presented in the case
studies. In a separate case study, applying medium voltage custom power devices to convert
DC battery storage and photovoltaic energy into AC energy using a power conversion system
is discussed. The dynamic mode of the STATCOM is modelled in QPTS in the succeeding
case study using the same software and compared with the capacitor banks. This is followed by
another case of HVDC analysis modelled with and without STATCOM present.
The thesis discussed the real time operation and control of power system physical
parameters in QPTS using capacitors, FACTS and HVDC. The key contribution of this thesis
is the application and resting of all sorts of FACTS and HVDC in QPTS. The system wide
area, coordinated control of FACTS (Online Power Electronics-OPE) is a new concept.
Another major contribution is being able to look at a system wide approach for a transmission
smart grid application. The results of thesis are presented in international conferences in USA,
Hong Kong, France, Portugal, and locally in the Arabian Gulf (Dubai, Oman and Qatar). The
thesis’s papers are listed in the ‘References’ section and in Appendix-F.

15
Chapter 1: Introduction and Commentary
1.1 The Thesis Structure
The preceding ‘Abstract’ is an executive summary of this research work, followed by
some detailed description of the thesis’s main objective, practical approach, original
contributions, and future works in this Chapter 1: ‘Introduction and Commentary’. More focus
on the thesis research questions, aim, techniques and tools used are given in Chapter 2:
‘Research Questions, Tools, Techniques, Methodology’. Chapter 3: ‘Operational Constraints in
QPTS’ illustrates the most significant challenges facing QPTS starting with the rising power
demand, power loops flow, and under-voltage conditions. This pressures the research to study
in details the power electronic technology efficiency and effectiveness at maximizing power
transmission accessibility. The enhancement of transmission capacity is developed in Chapter
4: ‘Compensation from FACTS and Non-FACTS Devices’. The chapter uses mathematic
equations to explain the physical parameters inherited within power systems that impede the
efficient delivery of active power followed by the mathematical equations to improve the
situation. The chapter then exhibits different FACTS and non-FACTS devices can be used to
help with active and reactive power compensation. The research also considered related
technologies in power electronics and non-power electronic based solutions.
Chapter 5: outlined the applications of smart energy systems and online power
electronic (OPE) in QPS including FACTS, distributed generations, energy storage, renewable,
etc. Chapter 6: ‘Literature Review of Power Electronics and Online Energy Systems’, reviews
critical literature details regarding this situation and other concepts. The research plan was
strategically created and implemented to collect and analyse unique data in this area. The
analysis and studies followed proper modelling and comparison with the existing data of load
flow available, are included in Chapter 7: ‘Case Studies: Power Electronics Applications in
QPTS’. In this research, QPTS steady-state load flow models have been created using Siemens
PTI’s Power System Simulator software (PSS®E) for the current year and the forecasted years
until 2017.
Chapter 8: ‘Potential Application of Smart Distributed Generation in QPS’ is a pure
applied research investigated the practical use of distributed generation in QPS using solar cells

16
and battery storage systems. The analysis showed how the smart DGs could assist the
distribution network to cope with the overloading situations. The outcome of this thesis is
augmented in Chapter 9: ‘Discussions, Conclusions, and Recommendations’. The last part of
the thesis encompassed the Appendices, commencing with Appendix-A: - ‘PSS®E Software
used for power system analysis in the study’. Appendix-B is the ‘Research dissemination
artefact and plan’ discussing the option of HVDC and upcoming research in this area post to
doctorate degree. This is followed by Appendix-C: ‘Research theory in power electronics
technologies’, with refined selection of basic power electronics theory from books, lectures and
papers. Appendix-D elaborates in the details of ‘FACTS, and Custom Power devices design
characteristics’. The ‘Optimization of power losses’ explained in Appendix-E is a pure original
research effort of this thesis reviewing one of the existing theories in power losses
optimisation. The list of the papers published during the course of this PhD work is included in
Appendix-F: ‘Authors’ publications- doctoral research published papers’.
1.2 Rationale for the Research Work undertaken
The main objective of this thesis is to study the potential to improve the Qatar Power
Transmission System (QPTS), using smart online energy systems, and the introduction of the
new terminology ‘Online Power Electronics’ (OPE). The OPE utilisation included online
FACTS (Flexible Alternating Current Transmission), HVDC (High Voltage Direct Current),
ESS (Energy Storage Systems). What has been done thesis is an implementation of OPE in real
networks (this is also a contribution). The research work started with modelling QPTS using
Siemens PTI’s PSS®E [88] and followed by identifying the planning and operational problems
in the existing power network. The next research step is the testing and nesting of power
electronics devices into QPTS and find how they solve the mentioned problems. The last step
is the inspection of how the new technologies of GPS synchrophasors, online systems could
impact the efficient operation of QPTS. The literature review has unveiled part of the survey
for online energy systems applications in real power networks [6]. Since the online systems are
emerging as a new research arena and utility applications are spreading around, the main result
of this thesis concluded that the control of power flow and voltage on a real time basis using
power electronics devices is an online application and hence the new term ‘OPE’ is nominated.
This research work conducted was motivated by the insistent needs to find scientific solutions
to some existing and anticipated operational and planning challenges in QPTS. The load
demand of Qatar’s transmission system is increasing rapidly due to the country’s expansive
infrastructural developments. This expansion will continue in the next 16 years especially with

17
the anticipated world cup football tournament in 2022 and Qatar National Vision 2030. The
challenge of QPTS’s load density increase triggered the need to control the flow of power to
avoid loop flows that will become inevitable [1], [2], [3]. At the same time, the demand for
power from remote and isolated locations far from the generating plants to feed the oil and gas
companies’ industrial loads poses significant challenges to the network. Conventional AC
transmission systems alone cannot solve these challenges as they are constrained by cost and
resources. FACTS devices and HVDC transmission would have to be incorporated in the
network to help solve some of these challenges. The research also considered smart solutions
from recent technologies in the arena of custom power devices and renewable incorporating
photovoltaic (PV), battery storage, smart conductors. The contributions to knowledge from this
thesis are explained in the next section.
1.3 The Original Contributions of this Thesis
The great impact of FACTS and HVDC in power systems real-time operation has
inspired the research to call for the new nomenclature ‘online power electronics-OPE’. The
implementation of OPE in the real QPTS is an applied research contribution as described in
section 1.2. The OPE concept is originated parallel to the anticipated utilisation of the real-
time online FACTS controllers based on GPS time-stamped, measurements and an online
knowledge base. The OPE concept is an integration of power electronics application into the
ground breaking online energy systems. Emphasizing the potential for integrated online
energy systems, there is demand for online power flow control, voltage control, monitoring,
fault analysis, system estimation. This is one of the original contributions of this thesis
together with the unique simultaneous analysis of FACTS and HVDC in QPTS. The
application technique using the software is demonstrated by significant case studies on
QPTS to achieve certain objectives coping with increased demand, voltage maintenance,
and power flow balancing. The rating and location of GUPFC in QPTS were selected by
simulating combinations of active and reactive power ratings on trial and error basis in the
software. This FACTS optimal rating selection and allocation technique could not be found
to have been conducted in the same practical approach in the past applied research. The
applied research conducted within this thesis can help other researchers to build from it.
Since this PhD work is an applied research by definition all of them contribute to the
science and have shown the importance of this PhD work. The original contributions on thesis
can be summarised as below:-

18
1. Applied research on realistic, existing power network of Qatar (QPS) is the key
contribution in this thesis.
2. Applying the concept of ‘online power electronics’-OPE driven by online FACTS
controllers set based on phasor measurements. The OPE proved feasible in solving
planning and operational challenges in combination with conventional techniques.
3. Power electronics (FACTS and HVDC) modelling and analysis in a real utility
transmission network (QPTS) is considered an applied research contribution.
4. There are no HVDC/GUPFC devices implemented in Qatar or in the Gulf States in
general. This will be a new idea in the region and innovation that will contribute
towards the advancement of knowledge.
5. Selection of the GUPFC among other FACTS devices as feasible for application in
QPTS as a result of network modelling is an applied research contribution.
6. Custom solution to solve overload in distribution substations using distribution custom
power electronic devices for energy conversion is an original applied research
contribution.
The research results are published in the thesis’s papers [1], [2], [3], [4], [5], [6], [7], [8].
1.4 Current or Planned Practice Use of the Doctoral Work
The research elements of this PhD piece of work have strong emphasis on practical
application in an existing power transmission system. The results achieved from the extensive
analysis carried out were significant with exposure to originality in terms of real applications in
a utility. Several case studies were performed using the Siemens PTI’s PSS®E software
package for FACTS, HVDC modelling and analysis in the papers [1], [2], [3], [4]. This is in
addition to analysis of renewable energy and battery storages, in the papers [5], [6], [7]. Online
energy systems are covered in the research work in [6] and in the online network cyber security
in [8]. Actually some of the proven technologies with direct impact on QPTS, such as
reconductoring using the new conductors (ACCC and ACCR); have been sent for execution at
site [1]. Implementation of the power electronic equipment recommended as part of the study
reports is expected within the next five to seven years.

19
1.5 Contemporary Relevance and Implications for Future Research and
Practice Development
This commentary introduces concepts, literature, case studies, and a research initiative
designed to acquire original data in these areas. This section provides initial introduction to the
research methodology, a detailed description of resources and research direction, and brief
research hypotheses prior to presenting the results and data analysis. The following chapters
contain the bulk of the entire presentation of research, the analysis of literature, relationship to
the Qatar context, presentation and analysis of simulations using Siemens PTI’s PSS®E [88],
and initial conclusions. It is the overall goal of the research chapter to present original research
while relating the results to developing practice and potential for development, providing a
manuscript of the finding of literature review and research project. The dissemination artefact
plan is further aiming at multiple stakeholders for the purpose of addressing the
communication of the results in a way which facilitates the progressive development of
practices in the field. According to the IEEE Power and Energy Society, the technologies of the
FACTS and Custom Power concepts, have been moving ahead at an increasing pace, very
significant near-to-long term benefits of the technologies are now recognized in the industry
[1], [2], [3]. FACTS devices comprising SVC, STATCOM, UPFC and GUPFC; synchronized
phasor measurements; and other technologies have been reviewed, applied, and assessed. The
original research designed and carried out emphasizes the potential for online analysis to
provide enhanced coordination of controls across a grid utilizing the FACTS devices such as,
SVC, STATCOM, TCSC, UPFC, or GUPFC.
Case studies were also conducted using HVDC transmission to mitigate the same
planning and operational problems, and the results were compared with FACTS impact on the
same system. While online security and controls have been addressed in research such as that
conducted, still there is a gap in literature regarding the direct emphasis of the potential for
online analysis to improve coordination of advanced smart systems. Moreover, the area of
emphasis for this research is Qatar, where the existing knowledge base for Qatar-specific
operations is also below a desirable (and properly informative) level.
Examination of the background of recent research in Qatar, amid the assessment of
power systems, has determined that there are both considerable challenges and considerable
potential [2], [3]. Details of the research objective, methodology, techniques, tools used in this
research, are further discussed in Chapter 2.

20
Chapter 2: Research Questions, Tools, Techniques, Methodology
2.1 Introduction
The content in this chapter falls mainly within the creation of new brainstorming
questions, hypothesis, and objectives that led to developing smooth flow path of studies and
analysis. The successful selection of research questions has resulted eventually to the new
concept of ‘Online Power Electronics’-OPE. The OPE is a bridge under construction between
the ever evolving power electronics technology and the new emerging online energy systems
[6]. While the research aim serves as the foundation for the research objectives, the research
questions of the study provide a formal inquiry to be answered through the analysis and
conclusions.
2.2 Research Aim and Objectives
The primary aim of this research is to examine the potential for a development plan to
improve utilization of transmission resources in the Qatar power system. The main research
objective is to present an increase of system performance using dynamic flow power
controllers implemented within transmission systems in Qatar and will focus on balancing
power flow and voltage improvement [2], [3]. This research effort was designed to assess the
online analysis in Qatar smart power systems, with emphasis on coordinating FACTS such as
SVC, TCSC, GUPFC, and UPFC. The study will assess challenges, and strategies to address
them, using online power electronic and controls analysis. The research explores the potential
application of new technologies in the Qatar power system which has thus far been scarcely
used in the west and other developed countries in other corners of the world.
The detailed objectives for this research study entail i) assess the potential for online
control systems to be integrated with existing systems of power coordination, ii) assess the
potential for these systems to benefit from coordinated control of FACTS devices, iii) assess
the installation of FACTS compensation that is controlled via synchrophasors, and iv)
recommend techniques and strategies to overcome existing obstacles and reach the successful
application of research objectives. The research will be followed by implementation on QPTS
since the proposed solutions proved technically and economically feasible for implementation.

21
2.2.1 Research questions and hypothesis
As stated in the introductory Commentary Chapter, the research inquiries for this
research effort are:
Primary Research Question: “What are the most immediate challenges and potential in
the development of online technology integrated with QPS?”
Secondary Research Question: “How can existing equipment and software best
facilitate the development of power system technology, and what are the most ideal directions
for future developments or research initiatives?”
The research has established brief hypotheses for these research inquiries, while these
hypotheses are further examined and compared in the concluding discussions and analyses of
the findings. Addressing each inquiry namely, the researcher holds the following hypotheses:
Hypothesis 1: The most immediate challenges and potential for online systems and
online power electronics integrated with power systems in Qatar lie within its ability to
introduce advanced technology, and develop programs and methods beyond the
accomplishments. The capacity to fund developmental projects aiming solely at innovation,
implementation, or potential is also limited by the amount of monetary funding available for
such projects, while the actions of academia can thereby largely benefit from this gap between
desire and accomplishments. Opportunities for progressive development lie in the efforts of
non-profit organisations, particularly those with interests in alternative energy, although some
relationship or promise to dedicate or invest in alternative energy distribution may be required
to receive sufficient attention and services from such organisations.
Hypothesis 2: Existing equipment and software can best facilitate the development of
power system technology through an increasing emphasis on the potential for internet
technology, for improved functions with power systems, and through continued attempts to
simulate systems while seeking improved efficiency.

22
2.3 Research Methodology
The research methodology for this research initiative lies predominantly in the analysis
of existing research, although further emphasis is to be placed on unique applications to
existing Qatar systems, as well as the potential for system development through an analysis of
PSS®E simulation results. Although existing information comprises the bulk of information
used for the analysis and recommendations, the results are to be applied to Qatar systems for
the progressive development of existing systems in a way which is ultimately an original
research. The research methodology is thereby designed to generate unique solutions and
recommendations from a combination of existing materials, implications from simulations, and
unique applications.
2.3.1 Resources and research direction
As mentioned, the primary resources for this study are existing literature, as this serves
as the foundation for the primary analysis. PSS®E simulation results are another resource, used
in the analysed relationships between literature and existing Qatar systems, and further used as
the foundation for proposed solutions and recommendations. The research direction begins
with the presentation of the problem, presentation of the literature review and outline of the
case study, and presentation of research for analysis, and then continues with an analysis of this
data which emphasizes the acknowledgement of limitations and proposal of solutions. The
research direction prioritizes the development of online systems, online power electronics and
components of the power industry in the Qatar context. In parallel with the research aim, the
research direction seeks to recommend actions which serve to optimize the improved
efficiency and effectiveness of online systems and online power electronics.
2.3.2 Research and data analysis
The research and data analysis comprise the bulk of the research presented, while the
literature is to be presented and related as described in the previous sections. The data analysis
further relates PSS®E [88] results to literature, while the research and data analysis is thereby
presented as a combination of conceptual relationships, comparative analyses, charts and tables
showing existing capacity and potential for future developments, lists of limitations and
opportunities, and recommendations for overcoming existing challenges. Multiple resources
are used for this research initiative, including existing published literature, QPTS models
23
developed in power systems analysis software, and existing systems and technology. Published
research serves as a foundation for the research background and direction. These resources are
gathered and combined for an analysis relating to available information in a way which
presents useful and unique relationships, potential improvements and developmental directions
for technology, and recommendations. As this relates to the aim and objectives of the research,
the data analysis entails their unique application and generation of original findings. Following
the initial presentation of literature, research findings, and data analysis, a subsequent
discussion, list of conclusions and recommendations, and dissemination plan will follow.
2.3.3 Dissemination artefact and plan
The findings involve recommendations relevant to the development of both power
systems and online components. Further attempts to discern the potential for the controllers, to
address demands, to be applied in new areas for new benefits in the future, or otherwise
provide a research direction for similar analyses. The research provides comparative analysis
with potential methods of optimization and design using a range of FACTS devices [3], [4].
Following the results and analysis presented in the following section, the dissemination artefact
and plan provides a more dynamic and direct course of action for improving Qatar systems.
This thereby summarizes the key findings of the results while applying them to an organized
methodology for future research and development. This dissemination artefact and plan is
designed as a formal call for action for progressive development and further research, and is
presented in a way which is ideal for future publication, as it is the intention of this research to
develop recommendations and facilitate awareness in a way which involves such an audience.
2.3.4 Validity, reliability, limitations, and ethics
Validity and reliability are not of as much concern to this research effort as is often
present in primary research and clinical research trials, as a sample of individual participants
are not questioned or tested. However, the study relies both on the reliability and validity of the
literature analysed in the research and analysis, while this research and analysis is further
dependent on the correct application and interpretation of the literature. Meanwhile, bias
applies similarly, and while the researcher is not bias to any particular solution, the analysis
and recommendations are presented objectively; the research itself was also conducted
objectively. The validity and reliability of resources researched and applied were carefully
examined for credibility; resources deemed unreliable, i.e. unaccredited websites or

24
publications from individuals without credentials were not applied to this analysis, for the sake
of validity and reliability. On a similar note, the study is limited by a number of factors, and in
addition to being bound by the original validity, reliability, and limitations of the literature
interpreted and applied in the analysis. The study is limited by the quantity of resources, time,
ability to access information regarding detailed Qatar-specific power system operations, and
(by fault of the researcher) the clear ability to foresee the most optimal and precise solutions
for the systems.
2.4 Analysis of Literature
The literature presented in the ‘Literature Review’ Chapter provides a foundation for a
dissemination artefact and plan, while the resources used for this analysis met specific
inclusion criteria to be used and applied for the subsequent analysis and presentation. A critical
appraisal of the existing case and recommendations for development in Qatar facilitate a wider
range of possible developments for online power electronics systems, power, and voltage
controls in the area. The research generally examined the optimal developments for expanding
transmission and power in QPS (rather than integrating and improving online controls).
Critically analysing the potential role of FACTS devices in the improvement of QPTS,
relevant aspects of the online structure and demands become apparent [2], [4], [6]. This
research pointed out that the development of online power electronics devices give rise to the
voltage levels, enhanced transient stability, decreasing the amount of loops in power flows.
Online power electronic controls can address, integrating network operations with
smart grid functions while improving efficiency and flexibility. The online analysis examining
the capacity to enhance controls and improved transmission network would be of considerable
benefit [6]. Next chapter provides a situational analysis of the current state of QPTS, models
PSS®E, highlighting the challenges and the potential improvement using online power
electronics, wide-area control and monitoring.

25
Chapter 3: Operational Constraints in QPTS
3.1 Introduction
This chapter is identifying QPTS problems from the available planning and operational
data to establish a base for the analysis and solutions of these problems. The chapter also
outlines the scientific creation of new steady state and dynamic models of QPTS for the years
2012, up to 2015-2017 using the PSS®E software. PSS®E is the main software tool used in
this study and it belongs to Siemens Company, however it has become the utility standard used
by worldwide utilities for power system analysis [88]. PSS®E is commercial software and
absolutely fully verified for power system analysis for many years and used by consultants,
contractors as well. The proper and verified modelling of QPTS has established the right
direction for accurate analysis at later stages of the case studies. The research results are
published in the thesis’s papers [1], [2], [3], [5], [6], [7].
3.2 Overview of Qatar Power Transmission System (QPTS) Challenges
QPTS operates at the voltage levels of 400 & 220 kV, while the sub-transmission
system operates at 132 & 66 kV voltage levels. The 400 kV network of QPTS is the primary
backbone in supplying existing and new load centres. The majority of power generation
facilities within this network are located in the northern, central and southern regions of the
State.
QPTS has overhead lines (OHLs) in the rural areas while underground cables dominate
in the developed land subdivisions. The industrial cities (Dukhan and Umm Bab) in the
western-south part of Qatar have a growing demand as a result of expansion of oil, gas and
cement industries. Figure 1 below presents an outline of QPTS network.

26
Figure 1: Qatar Power Transmission Network overview 400, 220 and 132 kV [9]
QPTS has seen unprecedented growth in capacity to cope with the rapid demand
growth. The 5-years demand forecast (2012-2017), including the three scenarios (base, high
and low), is shown in Figure 2. The overall power MW growth was 8.7% in the year 2012
while domestic MW growth amounted to 7.1%, and industrial growth was 6.1% [9]. The
demand growth in the years 2006-2009 was a record high that varied between 12%-14% per
annum, rendering it as one of the highest growth rates in the world at the time.

27
Figure 2: Demand forecast (MW) in Qatar for 2011-17 [9]
There are other challenges such as possible disturbances from external sources outside
the QPTS, increasing fault current levels, and bottlenecks in the sub-transmission system.
These challenges require more attention and investigation by network planners to foresee
emerging solutions. The power electronics based compensation (FACTS devices) and other
non-power electronics technologies such as the GE variable frequency transformers and the
SEN transformers can play a useful role in addressing these challenges and improving QPTS
operation while providing cost effective utilization of the existing transmission system. FACTS
devices can achieve different objectives, and can be selected based on the requirements to
improve QPTS operation and enhance smart grid implementation.
The information available from wide-area monitoring and controls coordination
utilizing PMUs can be an effective solution to the challenges of QPTS. It will look at the
integration of the voltage information provided by phasor measurement units to the online
control of FACTS controllers and integration with energy management, state estimation and
non-power electronics devices. The PMUs can supply real-time information necessary for
FACTS and HVDC to perform their functions to control voltage and power flow in the
network [1], [2], [3], [6].
5,375 5,823
6,338
6,849
7,345 7,772
8,190
5,972
6,653
7,371
8,076
8,765
9,439
5,699
6,090 6,436
6,772 7,094
7,433
5,855 6,395
6,924 7,299
7,563
8,219
4,000
4,500
5,000
5,500
6,000
6,500
7,000
7,500
8,000
8,500
9,000
9,500
10,000
2011 2012 2013 2014 2015 2016 2017
Pe
ak D
em
and
(M
W)
Base Case High Case Low Case CPBD Base Case-2011

28
3.3 QPTS Software Models
QPTS is modelled for two years 2015 and 2016 using the Siemens PTI’s PSS®E
software. The power flow cases include the bus loadings condition for the year 2015 based on
the forecast carried by the electricity planning department of Kahramaa [9]. The power flow
model for the existing network was tested and verified against the measured power flows and
voltages data from the National Control Centre (NCC) for the past eight years. The accurate
power flow model for the running year is used to develop the steady state models for the study.
Figure 3 is showing the 220/132 kV single line diagram (SLD) for QPTS for the year
2016 using the PSS®E software. The plot in the figure is a ‘2 in 1’ plot, including both the,
voltages and loadings with colour visualisation. The bars with the blue colour are the line
loadings percentage (blue is the load percentage). The colours, from blue to red and in between
are the voltage levels. The extremely red colours are the voltages above 1.05 pu or close to it
and the extreme blue ones are the voltages that are at 0.95 pu or below. The colours in
between, i.e. the yellow ones are the ones that are around 1.0 pu voltage.
Figure 3: 220/132 kV QPTS SLD (PSS®E model 2016)

29
Figure 4 is showing the 400/220 kV network SLD of QPTS for the year 2016. The
loading and voltage codes for this 400/220 kV network figure are similar to what have
explained above for Figure 3.
Figure 4: 400/220 kV QPTS SLD (PSS®E model 2016)
The western area (Dukhan- Umm Bab) is exhibiting low voltage levels (greenish blue
colour), as well as power flow imbalance in one of the 132 kV ring feeding the region (Figure
3). Finding practical and advanced solutions, for this unhealthy operation state is the main
focus of this thesis [1], [2], [3]. The next section explains more the problem in this area and
analyse the case with more contingencies [2].
30
3.4 Overloading and Voltage problems in the 132 kV Western Ring
The western part of Qatar, including the Dukhan and Umm Bab areas, has big industrial
load centres. The Dukhan and Umm Bab 132 kV networks are connected to the main grid
through two 132 kV double circuit overhead transmission lines [1], [2], [3]. One of the OHLs
is from the North of Qatar and the other OHL is from the South of the capital (Doha), and this
network configuration creates the Western Ring. The 132 kV OHLs feeding this western part
of Qatar have different ratings and lengths and are expected to pose problems, in the near
future, in operating the ring system due to uneven power flows.
The system from the South is stronger and pushes more power onto the 132 kV OHL
which unfortunately has the lower rating. In addition, the western system needs support
because of the long OHLs and low voltage problems are also anticipated with the increase in
industrial load in the area. Moreover, excess thermal limit loading on the older lines has
become an issue in the connections between the central and western regions [1], [2], [3]. The
400 kV and 220 kV network have not yet been greatly extended to and across this region, due
to scattered farm lands and houses, emerging authorities’ rules, and difficulty in identifying
corridors. There are plans to expand some industrial facilities, as the major industrial customers
have established their 132 kV substations and internal 33 kV distribution network with the help
of the power utility [2], [3].
Steady state and power flow analyses for 2015-2017 system load conditions have
confirmed additional unwanted power flow loops and low voltage problems in the western
region of Qatar, which are expected to increase in the year 2015 and beyond [1]. The reason for
this is that the 132 kV network from the South (the old OHL from Al S’halah to Umm Bab) is
closer to the load centres, thereby delivering most of the power. However, its thermal rating
(133 MVA) is about half the thermal rating (260 MVA) of the 132 kV lines coming from the
North (the double OHL from Ras Laffan– Al Sulami - Dukhan Junction) [1].
Figure 5 is showing the Western Ring normal power flow case for the model of 2015,
before the load increase and without any re-enforcements [2]. The figure is indicating
anticipated violation of voltages and power flows in system intact conditions for system load
conditions.

31
Figure 5: Normal power flow case without capacitors, STATCOM or HVDC (PSS®E QPTS -2015 model)
(generated using the Siemens PTI’s PSS®E software)
When the load increased in the year 2016 (normal power flow case), voltage values are
depressed at some busbars and the power flows started to show imbalance at certain lines
(Figure 6) [2].

32
Figure 6: Normal case without capacitors, STATCOM or HVDC (PSS®E QPTS beyond 2015 model)
As shown in Figure 6, the blue colour indicates each circuit of Al S’halah-GCC 132 kV
OHL is loaded at more than 50% of its thermal rating in normal conditions (about 80% loading
on the lines from Al S’halah) [1], [2], [3]. The loss of any one of the circuits will result to a
thermal overload of the other circuit. In addition, there are also low voltage problems in the
area [10].
3.5 Concluding Remarks
The utility has continued to function with conventional systems, despite the doubling of
demand in the past decade and anticipated doubling in less than another decade [2], [3], [4],
[9]. A recent earth fault occurred at one of the transmission transformer has resulted into a
transient voltage collapse in part of the distribution network. The widespread of the power
supply disturbance (about 600 MW) in the distribution network, showed the need for smart
grid to help mitigate the outage of the feeders. Indeed, during the summer months the higher

33
use of air-conditioning devices increases the loading of several distribution substations beyond
their firm N-1 capabilities. To meet the summer peak demand in transmission and distribution
systems while guaranteeing the N-1 reliability criteria, new smart planning methods have to be
evolved. It is essential to improve the system voltage profiles, transfer capacities, power factors
and system losses. The scenarios studied in this research are based on models of different
modern devices that are able to mitigate the mentioned factors to result in more power flows
and voltage improvement. This is one of the planning strategies to cope with the challenge of
high power demand in Qatar and raise the smart online power electronics initiative [2], [6].
Chapter 4 addresses the theoretical power system transmission line models and the
potential devices (power electronic or non-power electronic) that can be used for power
compensation, series, parallel or both. These theoretical models form the basis for practical
compensation models used in the subsequent analysis.

34
Chapter 4: Compensation from FACTS and Non-FACTS Devices
4.1 Introduction
This chapter comprises an original piece of research, reflecting the same level of
quality and originality, but less extensive and usually with an applied focus. The research
provides the relationship to developing practice in the area of online energy compensation
systems, but does not include a great deal of theoretical or philosophical arguments. The
chapter starts with explaining the main problems that hindering the efficient delivery of active
power (P) in transmission lines, and how power electronics and non-power electronics devices
can play a role in mitigating the situation [1], [2]. Then it explains the impact of different series
and shunt compensations (or both) in QPTS. The mathematical equations, representing
compensated and uncompensated power systems, are formulated in this thesis as part of the
power electronics base post-graduate course taken [16].
4.2 Physical Constraints in a Typical Transmission Power System
Examining the scientific theory and mathematical modelling behind power system
implementation and development, the power transfer equation is a known proportional
relationship that is a key theoretical aspect in optimizing systems. Inspecting the basic
transmission model in Figure 7, the well-known real power delivery equation (with no
compensation) is [2], [3]:
) (}./)*{()( 1212212,1 SinXVVP uncomp (1)
Figure 7: Typical power transmission line model

35
The reactance and phase angle are known to have a substantial impact on the overall
power flow of the system. Other factors limiting the power transfer are the sending and
receiving voltages. Varying these factors will impact the power delivery on transmission lines.
Updating the phase angles and the line reactance will be influential in delivering more active
power, while the voltage variation affects more the system reactive power map. Therefore a
‘lagging’ power factor is known to restrict transfer of active power, thereby inhibiting the
optimization of a power system [3], [4]. Series compensation and shunt compensations have
ability to provide solutions to power systems planning and operational problems. In this
chapter, models for different devices have been discussed comprising both FACTS and non-
FACTS devices.
4.3 Conventional Compensation
4.3.1 Phase shifting transformer (PST) compensation
Certain technologies, such as PSTs, have had the potential to improve transmission and
distribution for the past 80 years, but they are not always useful in modern systems. The PST
can be equivalent to a voltage source (VS) with phase shift angle delta α. The power transfer
equation with PST becomes:
)(.)/(*)( 1212212,1 SinXXVVP leakPST (2)
The PST serves to regulate the nature of phase angles and flow, using a shunt
transformer which processes power from the main line; the power is then processed through a
secondary winding, and ultimately processed back to the main line with a series transformer
[3], [4], [16]. In reality, the phase shift angle difference (δ) will be lower than 20º to 30º as the
PST’s angle can be less than 45º. The application of a phase shifter may or may not increase
power transfer. The maximum power transfer may actually go down due to increase in line
reactance due to the series transformer. However, the power transfer at smaller line angles will
go up significantly with PST compared to the uncompensated case, which is where the method
really helps. The transformer leakage reactance (Xleak) effectively makes the line looks longer.
There will be a substantial increase in the transient stability margin which the PST can provide.
The capability to maintain the maximum effective transmission angle during the first swing can
be utilized to increase the transient stability limit. It can then improve oscillatory stability, if
the compensator can change the angle quickly [16]. Usually best if needed to reverse power

36
flow from prevailing system conditions or to create an angle difference to allow power flow.
The PST has mechanical switches for voltage reverse plus mechanical taps for voltage
adjustment, but it is more costly than series compensation. Thyristors can be put and change
the pace continuously on the cycle by cycle basis. This can be used to damp power swing in the
power system and can increase the stability margin.
4.3.2 SEN transformer (ST)
Another device for independent control of bidirectional active and reactive power flow
in transmission lines is the “SEN" transformer (ST). The ST design has tap changers that are
used in on-load tap changers (OLTC) and a phase angle regulator. The ST can also control the
voltage at a point of installation in the transmission line. The new ST can be an efficient device
in controlling the active and reactive power flows selectively in utility transmission networks
[39]. The ST operation is compared with the operation of UPFC and proved to be a reliable
technology and cost-effective when compared with the VSC technology [39]. The drawback of
ST is always lying in the slow operation of tap changers compared to the fast VSC technology
and the inherited operational risks in using ST [16]. The maintenance of mechanical parts is
another major techno-economic challenge.
4.4 Series Compensation
4.4.1 Concept of series compensation
Series Compensator- SC with VSC can also be used to inject voltage to compensate for
magnitude change and phase due to a fault in one phase or compensate for magnitude change
in three phases. SC with stored energy supply is named as dynamic voltage restorer- DVR and
they can respond to voltage dips in less than a cycle or faster. Also SC can be used ideally to
limit the fault currents in transmission lines by using a power converter that looks like a large
inductor when the fault occurs [21], [16]. The chief drawback for SC is the potential sub-
synchronous resonance. Other drawback is the impact on system protection due to protection
bypass for out of system faults which leave compensation out of system during recovery from
disturbance when is needed most. Series capacitor compensation suits longer overhead lines,
but it is not practical for use in short overhead lines [21], [16].

37
4.4.2 Fixed Series Capacitor (FSC) compensation
Fixed series capacitor (FSC) compensation can be used to deliver more power. The real
power transfer equation with series fixed capacitor compensation is [2], [4]:
)(.)/(*)( 1212212,1 SinXXVVP CompCSer (3)
The potential increase in power transfer due to cancellation of part of line reactance
looks very high, however in most cases the actual power angle across the line will still be
below 45º. The steady state power flow will not be as big, but it will be bigger than that for
midpoint compensation (discussed later). The FSC installation has to be studied for the
possibility of sub-synchronous resonance- SSR especially with steam turbines characterized
with multi frequencies below 50/60 Hz. Therefore when designing a series capacitor in a
system, it can be put with hydro generation and avoid steam turbines as they may have multiple
resonant frequencies below 50/60 Hz. However exciting resonance frequencies above the
nominal frequency will help damping oscillations on the transmission lines above 50/60 Hz
[2], [3], [4], [16].
FSC is suitable more for longer and loaded overhead lines, while its use in shorter lines
shall be avoided [2], [3], [4]. While capacitor compensation allows the user to deliver
additional power, this takes place as the voltage must rise to a level below the over-voltage
range [2], [3], [4]. System protection can be affected by protection bypass, while this leaves
series compensation out of system during recovery from disturbance when is needed most. The
approach generally has a considerable impact on both transient and voltage stability (assumed
capacitor is not bypassed) as the margin of transient stability can be further enhanced. The
approach can be used to inject voltage compensation for magnitude and phase resulting from a
fault in one phase, and can also compensate for shifts in magnitude across three phases [2], [3],
[4]. Moreover, the approach can be applied to the restrictions of fault currents through the use
of power convertor, although the fault will nonetheless remain a challenge to the overall
transmission [3], [4], [20].

38
4.4.3 Thyristor Controlled Series Capacitor (TCSC)
Another potentially beneficial approach to implementing FACTS devices is the
application of thyristor controlled series capacitors– TCSC. TCSC has a reactor installed in
series with a thyristor, connected in parallel with a fixed series capacitor. Basic series
compensation is improved through the use of TCSC, as thyristor control can serve to improve
transmission replacing the less reliable mechanical switches [2], [16]. TCSC basic
configuration is shown in Figure 8.
Figure 8: TCSC module
TCSC is connected in series with a transmission line with no coupling between phases
and requiring no harmonic filters and can be applied to dampen power oscillations [16].
4.4.4 Static Series Synchronous Compensator (SSSC)
Yet another approach to compensation is achieved through the static series synchronous
compensator (SSSC). This approach is actually one of the more fundamental approaches to
FACTS devices implementation, while its design and benefits are similar to the compensation
processes outlined in the previous discussion. Essentially, the SSSC is a generator which
functions without an outside energy source as a compensator, and the technique can involve
energy absorption equipment, rated energy storage, or other compensation of real power in a
manner which affects the dynamic performance in the transmission structure [4]. Providing
similar compensation benefits through this approach, the approach may or may not be superior
to other methods, while the SSSC can only inject inductive or capacitive voltage. However, the
technology can be combined with additional equipment, such as a superconducting magnet
storage or a battery storage device, to inject series voltage [4], [16].

39
4.5 Shunt Compensation
A common solution is to have shunt capacitors at many locations, especially at the end
of the lines, instead of just one in the middle. This solution shall be studied with more care in
QPTS as the use of shunt capacitor banks has impact in system operation in relation to
transients, resonance and faults. There is a case study in this thesis comparing the operation of
shunt capacitors with STATCOM in steady-state and dynamic modes.
Reactive shunt compensator at midpoint of a transmission line can increase the
maximum transmissible power. Shunt connected FACTS devices can also be used at sensitive
nodes in the transmission networks to improve voltage stability or to compensate for rapid
fluctuation on some industrial loads such as arc furnaces. There will be a substantial increase in
the transient stability margin with ideal midpoint compensation [2], [4]. If we add shunt
compensation at midpoint of the line, the power transfer equation will become [4], [16]:
) /2(}.2//)*{()( 1212212,1 SinXVVP uncomp
(4)
Or simply from sending end to midline:-
)(}./)*{(2)( 1121_,1 mmcompm SinXVVP
(5)
Where the variables can be further altered to reflect the resultant changes on the power
transfer from midline to the receiving end bus is [2], [3]:-
)(}./)*{(2)( 2122_2, mmcompm SinXVVP
(6)
The potential to increase the overall power transfer is higher than the potential for the
phase shifting transformer implementation, however this implementation can result in a less
than desirable steady state flow of power amid a less than desirable power angle (less than
45º). The ratio of deceleration to equal area rises significantly for a proportionally significant
rise in transient stability margin. This method of shunt compensation can offer ideal voltage
support; and can further raise the capacity for transmission across the ‘post fault’ system for a
rise in transient stability [21], [22].

40
The increase in power transfer appears high but converter rating makes this option a
less practical solution due to large magnitudes of reactive power need to be supplied by the
shunt compensator. As a result, this approach is possibly less cost effective overall, especially
if fast dynamic response of the compensation is required. A common solution is to have shunt
capacitors at many locations instead of just one location. Real applications of shunt FACTS
compensation devices are explained hereafter.
4.5.1 Static VAr Compensator- SVC
SVC typically comprises of a TCR and a fixed capacitor or TSC. SVC has Q
compensation varies with V², with voltage/current characteristics as shown in Figure 9. This Q-
V relation reduces the SVC’s stability as it makes the reactive power drops quickly when
voltage decreases. It produces or draws no real power except drawing relatively low losses in
the vicinity of zero VAr output. On the average, the TCR- TSC low losses at zero will increase
in steps with increasing VAr capacitor output [16], [21]. The ratings of the capacitor and the
reactor depend on the required reactive power range. Harmonic filters are installed in parallel
to SVC to shunt the current harmonics to ground. Often the TCRs are implemented in a 12-
pulse configuration in order to lower the total harmonic distortion of harmonics generated in
response to the changes in the thyristor’s angle of firing delay [4], [16], [21], [40].
Figure 9: SVC building blocks and voltage/current characteristic [4], [13], [40]

41
SVCs are used to improve transmission and distribution performance by resolving
dynamic voltage problems and to improve conventional power systems while addressing
elements of their limitations amid rising demand [3], [23]. The accuracy, availability and fast
response enable SVC’s to provide high performance steady state and transient voltage control
compared with classical shunt compensation. A rapidly operating SVC with appropriate
control loops can provide rapidly varying reactive power required to damp dynamic voltage
oscillations under various system conditions and thereby improve the power system
transmission stability [16], [21]. SVC’s are also used to dampen power swings, improve
transient stability, and reduce system losses by optimized reactive power control. SVC is good
for load balancing since it is possible to control the three compensating admittances
individually by adjusting the delay angle of the TCRs for each phase so as to make the three
compensating currents identical [2], [4], [21]. The coordinated control of a combination of
these branches varies the reactive power.
4.5.2 Static Compensator - STATCOM
Static compensator – STATCOM, is a high speed shunt FACTS device employing
voltage source convertor-VSC technology behind a reactor or transformer [16], [21]. The
STATCOM technology uses controlled variation of this AC source to generate or sink the VAr
(Q) demanded within power systems [2], [3], [21]. STATCOM has a linear Q-V relation
compared to Q compensation varies with V² for SVC. Therefore STATCOM is better than
SVC with regard to stability and its speed of response is faster. It has a lower harmonic
emission and therefore needs little harmonics filtering. STATCOM can be utilized by the
utilities to improve the voltage stability, load balancing and the power factor. STATCOM
technology is approximately has a 40% smaller substation footprint than the static VAr
compensator (SVC) technology but it costs 70-80% more [16], [21]. STATCOM topology and
the terminal voltage, current compensation characteristics are shown in Figure 10.

42
Figure 10: STATCOM structure and voltage/current characteristic [4], [40], [13]
There are little STATCOM applications in industry side, although the fast response in
weak power systems facilitates a highly effective mitigating flicker compared to the SVC
approach [4], [92]. Meanwhile, the shunt compensation can be ideal in the event, the system
demands a dynamic control for the reactive power and maintenance of voltage stability [2], [4],
[21], [16].
4.6 Series and Shunt Compensation FACTS Devices
4.6.1 Interline Power Flow Controller (IPFC)
Another potentially ideal FACTS compensation solution for improving transmission
systems amid the rising demands can be derived from the Interphase Power Flow Controllers
(IPFC). The IPFC is among many possible configurations of the multi-converter FACTS
device, convertible static compensator (CSC). The IPFC is series equipment, which serves to
control both reactive and active power across their phases (Figure 11) and consists of two
series VSCs whose DC capacitors are coupled in a common dc link. This allows active power
to circulate between the VSCs and thus between the series voltage injections in the lines.

43
CSC was recently installed by the New York Power Authority (NYPA), including IPFC
as a pilot project to increase power transfer capability and maximize the use of the existing
transmission network [16].
Figure 11: Interline Power Flow Controller -IPFC model [4], [13], [40]
Because of this flexibility, it can also be referred to as a Generalized Unified Power
Flow Controller (GUPFC), but without shunt converter. The target is to control power flows of
multiple lines leaving a substation or a sub-network rather than control the power flow of a
single line by UPFC for instance. With this configuration two lines can be controlled
simultaneously to optimize the network utilization. The equipment itself contains capacitive
and inductive branches, while it does not contain the additional storage equipment
characteristic of the STATCOM and SSSC approaches described above [4], [20].
4.6.2 Unified Power Flow Controller (UPFC)
A variation of phase shift transformer is the Unified Power Flow Controller (UPFC)
which is a successful application of the evolutionary voltage source converter (VSC)
technology for shunt and series compensations. UPFC is the most comprehensive FACTS
device that is capable of providing active and reactive control, as well as adaptive voltage
magnitude control and phase angle regulation [21]. The UPFC consists of shunt and series
transformers, which are connected via two voltage source converters with a common DC-
capacitor (Figure 12). The shunt VSC is similar to STATCOM and the series VSC for series
compensation is similar to SSSC. The DC-circuit allows active power to circulate between
shunt and series transformers to control the phase shift of the series voltage [16], [21].

44
Figure 12: Unified Power Flow Controller (UPFC) [4], [40], [13]
Actually the UPFC can apply a series voltage with a continuously variable magnitude
and effective phase angle instead of a voltage with a fixed phase angle [16], [21]. It has two
degrees of freedom that can meet multiple control objectives by adding the series injected
voltage with appropriate amplitude and phase angle to the sending end terminal voltage. A
UPFC can inject zero power or produce no voltage or produce voltage 90° offset from the
current, like SSSC. The UPFC can act as a capacitor and put power into the system or as an
inductor and pull power off the system. When the power is non-zero the shunt converter has to
be putting this much power back into the system and is circulated through the dc bus [16], [21].
Change in the injected voltage can increase or decrease the real power transfer and changing
the angle of the injected voltage will also affect the real power flow. Voltage change coupled
with angle change may reverse the direction of the real power flow. The injected voltage can
be at any angle with respect to the line current and the UPFC can be used to control power flow
through an electrical transmission line connecting various generators and loads at sending and
receiving ends [16], [21]. In most cases it is normally required to maintain a constant level of
real power flow with the angles variation. The UPFC can also maintain a constant flow through
the line no matter what phase angle difference between the two ends of the line. When a
constant current is maintained with voltages magnitudes, it is basically just implies that the
angle difference between the two ends will vary, but the magnitudes won't vary [16], [21].
UPFC can also be used to control the current flow over a branch interconnecting two systems
that are normally out of synchronism. It will also probably need very high current ratings on
the shunt converter to support the circulating power for the 180° condition. So it will either
need a very high rating, or it will need to be tripped, however UPFC is not recommended for
such application, unless the systems are kept close to synchronization. Otherwise the angle

45
across the line could get larger than the UPFC could compensate, requiring the line to be
tripped [16], [21].
The series converter needs to be protected with a thyristor bridge to provide fast bypass
in the case of nearby transmission faults. For faults slightly farther away it is possible to
change the series injection to look like a large inductance, which could serve to lower the fault
currents. At present, UPFCs are not designed for this type of operation, but it is possible with
sufficient current ratings in the devices. Due to the high cost for the two voltage source
converters and the protection, UPFC device is getting quite expensive, which limits the
practical applications where the voltage and power flow control is required simultaneously [4],
[16], [21].
4.6.3 Generalized Unified Power Flow Controller (GUPFC)
The Generalized Unified Power Flow Controller (GUPFC), a variant from UPFC and
IPFC (Interline Power Flow Controller), can have one shunt converter in addition to the two
series converters (VSC) whose DC capacitors are coupled in a common dc link (Figure 13).
Figure 13: Generalized Unified Power Flow Controller GUPFC [4], [13], [40]
The merit of GUPFC (and also IPFC) is that it can control power flows of multiple
lines leaving a substation rather than controlling the power flow of a single line [3], [4]. Two
circuits on an overhead line would require two UPFCs or one GUPFC for controlling the flow
to maintain N-1 criteria. The GUPFC has two operation modes one as a capacitor to inject

46
power into the system and another as an inductor to absorb surplus power off the system,
circulated through the dc bus [2], [16], [33]. GUPFC control can be set to maintain a constant
active power flow with the angles variation, or maintain a constant flow through the line
regardless of the phase angle difference between the two ends of the line. Constant current
could be maintained with voltages magnitudes, while the angle difference varies between the
two ends, but the magnitudes remain the same [2].
4.7 Concluding Remarks
This chapter has explained different mathematical power compensation equations and
means of equipment compensations used in existing power systems. The chapter also presented
a general description about various realistic FACTS devices used around by utilities.
Next chapter provides a situational analysis of online power electronics, and online
systems, examining the case of QPTS as essential part to provide a foundation in this research
effort.
47
Chapter 5: Smart Online Energy Systems and Power Electronics
5.1 Introduction
This chapter is an executive assessment to examine the applications of certain smart
energy systems and OPE in QPS including both QPTS and QPDS [5], [6]. The technologies
include FACTS, DGs, EES and renewable. The emerging online system has triggered the core
of this thesis research to the new convention of online power electronics (OPE). The OPE is
the state of FACTS and HVDC devices when they interact with QPTS (or other power
network) in real time, or online operation and control of the network. As a follow up to the
search work in this thesis, the concept of OPE shall be adopted further and relevant standard
shall be established. The thesis is trying to bridge the OPE into the global online systems and
to achieve the required knowledge. For this an exhaustive research survey was conducted on
the emerging papers in the field.
Chapter 1 illustrated steps of OPE implementation in QPS networks starting with
equipments modelling QPTS. The process continues with identifying QPS problems and the
utilisation of power electronics devices into QPTS to solve them. The test of new GPS
synchrophasors, online systems showed impact on the operation efficiency of QPTS. The
implementation of OPE is in the real time control of power flow and voltage benefiting from
emerging online energy systems applications.
5.2 Implementation of Smart Power Electronics initiative in QPTS and
QPDS
Kahramaa faced the challenging task of planning, designing and managing an electrical
power grid which is in continuous expansion, while applying the latest and most innovative
smart grid solutions. One of the prime functions of power electronics devices in power
transmission and distribution systems is to facilitate the delivery of active power either in form
of AC or DC while maintaining the quality of supply. The operation of FACTS and HVDC
controllers on real-time monitoring and control is still a challenge for many utilities. Many
online control and measurement techniques can benefit from the performance of power
electronics in many aspects. This chapter will identify the relevant literature in the field of

48
power systems in utilities with problems similar to those facing QPTS and QPDS. The
discussion will explore arguments discussed in the published papers, while subjecting them to
critique compared to the QPTS case studies. This review of power electronics literature is
highlighting the experience of other utilities and is showing the latest advances in the field as
well [4], [16].
For the last few decades, the need for a larger integration of renewable energy sources
into the electrical grids, the ambition of offering a high quality electric service to increasingly
sensitive loads, the evolution towards deregulated electric markets, the unbundling of electrical
utilities, the necessity of reducing power consumption and the will of building a cost-effective
business model, have led to a new grid paradigm of electricity networks, known in the public
media as smart grids. There are solutions to these physical constraints in power transmission
systems, through the use of power electronics including SVC, STATCOM, TCSC, HVDC,
static transfer switches, and other power converters [1], [4], as described in the Case Studies
Chapter. The research included review of potential use of distributed generation (renewable) in
QPDS. The following sections cover the critical review of literature and comparing them with
case studies conducted. This developed research into smart grid technologies is offering
guidance and support to Kahramaa for establishing a smart grids roadmap that will be in line
with the Qatar National Vision 2030 and the National Development Strategy 2011-2016.
5.3 Potential of using Online Power Electronics devices in QPTS
The Consultancy for “Qatar Transmission System Short/Medium Term Planning
Support” [18] reported on the requirements of providing the shunt reactors to sustain voltage at
required limits. The report claimed that change in the load cycles from day to day were not
substantial, while mechanical switching can be implemented to improve the efficiency of
control. The Consultant’s report has concluded that the use of FACTS or HVDC devices QTPS
is not needed. The report explained that reason for not recommending FACTS devices, as fast
dynamic control is not necessary in QPTS [18]. The case studies discussed in this thesis have
proven the reverse, that implementation of FACTS devices can be beneficial in QPTS. The
results achieved showed evidence of better system performance when using GUPFC,
STATCOM, TCSC and SVC. Although the benefit, the cost for power electronics devices is
still high and in some cases, it is not justifiable [1], [2], [3].

49
The applications conducted in [2], [3], [4] examined the potential for power flow
controllers to enhance the power transmission operation of QPTS. In this analysis, greater
emphasis was placed on the nature of GUPFC and UPFC compared to other FACTS devices
such as SVC, STATCOM. The basic findings of the study are of potential solutions
specifically, the history of power flow controllers, voltage support relevant physical theory and
mathematical modelling, relationships to telecommunications. The potential effectiveness and
applications of FACTS in modern power electronics were reviewed and analysed in [1], [2],
[4]. FACTS devices have enhanced transient stability, improved load balance, decreased
undesired loops in power flow, and exhibited the potential to address undesirably high fault
current levels within the network [4].
The power electronic technology has been identified recently as one of key
technologies needed for the successful implementation of the emerging smart grid and the
creation of micro grids. The smart systems include other important areas in research as online
analysis (for the sake of enhancing controls), wide-area control and monitoring (using phasor
measurement units), and improved distributed generation and storage device operation [2], [4].
5.4 Potential Smart Grid and Micro Grid Evolution in QTPS and QPDS
Since the construction of the first electric power grids, by the end of the 19th century,
electric power demand worldwide is progressively growing up, as illustrated in Figure 41 [19].
0
200
400
600
800
1000
1200
1400
1600
Total world electricity consumption from 1971 to
2010 (Mtoe*)
1971 1975 1980 1985 1990 1995 2000 2005 2010
Industry Transport Other
(*) Mtoe: Millions of Tons of Oil Equivalent
Mtoe
Figure 14: Electric power consumption worldwide, 1971-2010 [19]
This trend can also be observed in Qatar, due to a rapid economic and urban
development of the country. Fully inscribed in the domain of smart grids, the purpose of the
research carried in [5] is to perform a comprehensive analysis of the potential solutions to one
of the challenges that Kahramaa is confronting. The research has created a five-year plan for

50
either upgrading the existing substations or either for diverting some loads to newly committed
and commissioned substations. However, the long lead time needed for these projects (3-3.5
years), together with the need of disconnecting the substations during civil works and
commissioning, have motivated this research to investigate alternative smart grid technologies
to shave and to balance peak loads at substations during N-1 contingencies [5].
The resolution made by the case study for exploring the potential of smart grid solutions
is well founded, since the capabilities of smart grid solutions are far beyond load shaving.
Thanks to their great flexibility they can offer a broad portfolio of functions such as ancillary
services (for instance frequency and voltage stability or black-start capability) or islanding. The
integration of smart grid technologies in distribution grids is currently a subject of strong
interest among the distribution operators (DSOs) in the world. In Europe, for example, a group
of six major DSOs (see Figure 15) have decided to gather their expertise and propose a
common project (known as Grid4EU) for smart grid development in Europe. To carry out this
mission Grid4EU will conduct six demonstrators that will address the following topics:
- Innovative Power Management at MV level.
- Innovative Power Management at LV level.
- DER integration.
- Energy Storage Systems.
- Demand Side Management (DSM).
- Micro grids (intentional islanding).
Figure 15: DSOs participating in Grid4EU smart grid project [20]

51
Considering that distribution grids will need to adapt and accommodate to new
“unknown” challenges, the comparison between different solutions shall not only be based in
their capital cost, but also in other important criteria such as flexibility, greenhouse gas
emissions, footprint, maturity and complexity. The accompanying improvements in QPTS
demand effective online systems continually expanding in order to keep up with demands and
with ‘smart’ grids and flexibility for a diverse range of power sources.
It must also be observed that traditional AC electrical equipment (i.e. transformers,
busbars, overhead lines, cables and protective circuits) have a well-known technology that has
been deployed during decades and thus, their low prices are a consequence of an economy of
scale. Conversely, smart grid technologies have just passed from a development stage to
pilot/demonstrator projects and their prices reflect the research and development efforts put on
these promising devices. To an extent, there are limits to how low the cost will get for some of
the technologies [16]. In order to make a definite choice between different solutions, Kahramaa
shall attribute an importance (weight) to each of these criteria. The case study for battery
storage and PVs presented in Chapter 8, analyses different DG options.
5.5 Online FACTS Monitoring and Control via Synchrophasors
WAMPAC systems are being installed by utilities in USA, Canada, Japan, Europe,
Asia and Africa and improved operation efficiency of complex generation and transmission
system. WAMPAC can assist the system operators in managing the real-time variances in the
grid, using time-synchronized measurements, and prevent cascading outages, enable islanding.
The steady state and dynamic control of QPTS have been recommended to be improved
through coordinating the operation of the power system control loops. The range of control
variables involved will effectively impact one another, leading to a demand for highly effective
coordination. Without this level of coordination, the impact may be great enough to alter the
intended harmonization of the FACTS components while generating detrimental interference
[2], [3], [15], [23]. In online monitoring and control systems the output of the FACTS, could be
maintained across the maximum and minimum series reactive powers, active powers, and
shunt reactive power. The design recommendations presented in [23] can be applied to the
design of the GUPFC controllers for transmitting the power through the Dukhan area discussed
in the case study. They can be further used to assist the controller in facilitating coordination
and steady state power control. The approach outlined is recommended for development,

52
design, and implementation of the GUPFC controller [23]. This involved using the Clark
Transformation p-q theory, as well as the theory of instantaneous aggregate voltage, for
controller optimization. The Clarke transformation is a special case of the Park's
transformation (d-q transform). The Park's transformation is often used to go to a rotating
reference frame synchronized to the system frequency, where the Clarke transform uses the
Park's transformation to go to the stationary reference frame [23].
5.6 Compatibility of QPTS Online SCADA and EMS Systems with PMUs
Further recommendation is the use of signals for voltage control in remote ends, stating
that the acquisition of angle and voltage signals could be achieved through remote systems or
phasor measurement units (PMUs) [3]. The GUPFC controller could be integrated with
telecommunication equipments, although further information would be required (from the
energy management system - EMS) to develop an effective course of action for broadcasting
the desired information [3], [23]. The integration and optimization of online systems is the
compatibility of QPTS telecommunications with GUPFC controllers and using synchrophasors
in a timely synchronized measured data. Telecommunication developments generally have
potential for online applications, and with overhauling QPTS control and communication
systems, it can integrate effective online systems. The standard way of applying transducers
and remote terminals units (RTUs) to generate voltages or angles data naturally demands a
revisit for modernisation [3]. More modern approaches may be ideal in the implementation of
PMUs to transfer information to the GUPFC through the C37.118 protocol for phasor data [4].
The transformation of protocols for controllers in Qatar could be avoided by allowing the use
of IEEE C37.118 protocol, and equipment which is not compatible with this could still be
integrated by translating to DNP3 protocol. The EMS system used to relay data must be
properly configured. The designer must use or structure a software program for the
synchrophasors, to optimize communication with other devices and online controls [2].
The fundamental assessment of the telecommunication design showed that the voltages
across Dukhan and Umm Bab can be measured and transferred to a power flow controller
through optical fibres in overhead lines already installed within the transmission systems [2].
The telecommunications are stated to be compatible with both recommended types of static
compensation and power controllers (SVC, STATCOM, TCSC, UPFC and GUPFC) through
the outlined protocols. The network servers have been running on Microsoft Windows
operating systems, and no issue has been discussed with this or is anticipated in the future. This

53
operating system is assumedly ideal for implementations of online controls. A range of other
telecommunication components in place in Qatar’s power systems, listing the SCADA system
in the control centre (including its Decent dual ring FDDI), the connection between the FDDI
and VMS TFE servers, data transfers between the control centre and stations using
plesiochronous and synchronous digital hierarchies (PDH and SDH), the use of IEC60870
protocol for gateways and RTUs connections.
The case analysis consideration of wide area controls also has significant implications
for Qatar’s online systems, while it is recommended to integrate the PMUs, synchrophasors
and wide area controls to address recent challenges in the Gulf and Qatar [3]. Moreover, these
elements can be tested with GUPFC, as current relations and phase voltages can be measured
by PMUs. These measurements further provide data which can be used to deduce states of
dynamic performance, undesired power flow, and stability [3]. The PMUs data can be
combined for use in other equipment in addition to the GUPFC as well, such as the SCADA
system in use, state estimators, energy management, and more. Many aspects of these
developments can be integrated with online controls and processes for maximized monitoring,
estimation, and management processes [3].
5.7 Emerging Online Systems and Standards
The research of publications revealed the increased potential embedded within the online
analysis applications [6]. There is an evidence of potential applications that can see the light
for real implementation and can benefit power grids. The applications include online controls,
state estimations, simulations, fault detection, power system stability enhancement, and online
integrated IT and control systems, etc. [6]. New standards emerging on online systems, such as
[66] and [67], are more related to the data exchange and the communication than to
the applications. One of the other known data exchange standard is IEC, 68150 [68] pertains to
communication automation for substations. The IEEE C37.118-2005 is the standard approach
to systems, while it is capable of locating measurement processes, formatting messages,
updating rates, signal processing, and PMUs are recommended to use this approach [3]. IEEE
C37.118-2005 governs application of synchrophasors for power systems [69], while fault
location on AC transmission and distribution lines is covered under the IEEE C37.114-2004
Guide [70]. The Wide Area Monitoring Protection and Control (WAMPAC) systems have two
standards, the IEC 61850 (power systems communication) and the IEEE 1588 (precision time
protocol). Next section highlights the need for wide area coordination of control and operation

54
in QPTS. In power electronic applications, the DNP3 protocol is inherently compatible through
FACTS. QPTS uses Microsoft Windows’ Network Management System, IEC60870-5-101
protocol for connections between gateways and RTUs, and the TCP/IP network in a range of
transmissions (microwave radio, pilot cables, and fibre optics) [3].
5.8 Concluding Remarks
The chapter gave an executive summary of the readiness of QPS and its potential to
accept the OPE and smart power applications. The future research is expected to progress the
nomenclature of OPE further and develop new standards to govern its regulations similar to
other news standards in online energy systems. Chapter 6 presents details of the literature
review of power electronics and online energy systems applications within utilities. The
chapter addresses the literature reviewed with appropriate references of present state of
knowledge which has been built upon in the research procedure and main proposition of the
thesis. An analysis of current literature in the next chapter also shows that the priority should
remain on improving online power electronic and wide-area control and monitoring as
possible.
55
Chapter 6: Literature Review of Power Electronics and Online
Energy Systems
6.1 Introduction
This chapter is presenting the individual efforts exerted to review various literatures
connected with power electronics especially with regard to real application in power utilities
operating around the globe. The literature collection is extremely useful as it comprises real
applications within utilities rather just theoretical models or assumptions on non-real power
networks. The critique to the discussed literature is another genuine contribution thrilled by an
engineering professional experience on real systems. This has led this research to develop a
new concept known as Online Power Electronics (OPE). The emerging online system has
triggered the core of this thesis research to develop the OPE. Also part of the research
knowledge discussed in this chapter is acquired from a postgraduate course of power
electronics applications in utilities, taken with a US university [16]. The main results of the
research in this chapter are published in the thesis’s papers [5], [6]. The next section of this
research surveyed carefully and thoroughly, the literature of online energy systems and their
potential use in QPTS. The information summary gained from publications, was incorporated
in the online energy system survey paper [6] that published in the 2012, US, IEEE, PES
conference. Other PMUs research is discussed in the thesis’s papers [1], [2], [3], [4].
6.2 Literature Review of Utilities Applications in Power Electronics
6.2.1 SVC voltage control via synchrophasor in Southern California Edison’s system
Paper [15] analysed applying synchronized phasor measurements to develop an
effective plan for a system that could maintain voltage at remote buses utilizing SVC while
avoiding overvoltage at the local bus where the compensator is connected. These researchers
pointed out that previous utilization of synchronized phasor measurements had only been
applied to the monitoring or after the assessment of system operations, despite the evidence
that the potential applications for on line control had a far wider range. Potential applications
include wide area control, remedial action schemes, and special protection schemes in the near
future, with potential in still further areas in the more distant future. Citing the Southern

56
California Edison’s (SCE) efforts to develop an effective use of synchrophasors in power
systems, they claimed that their research and subsequent implementation of an SVC have
satisfied the objectives of the SCE project, emphasizing the minimization of potential for over-
voltage conditions [15]. Since the SCE project was the first closed-loop control application of
synchrophasor measurements, the authors studied options for integration of the voltage
information provided by a phasor measurement unit with an SVC controller. To achieve this,
the experiment utilized SCADA protocol, and also attempted to provide readers with
recommendations for integration with other systems of energy management and state
estimation [15].
Following their review and description of their experiment, the researchers provided
‘lessons learned’ in addition to their detailed recommendations and conclusions. They stated
that “several issues” would have helped ease the commissioning of the SVC control of voltage
at a remote bus. The first is that all equipment should have been tested off-line prior to
deployment in the field. They were not able to do this because of the project schedule. They
were able to overcome this restriction with a lot of support by personnel at remote locations to
identify and resolve any issues. The second issue was that “the communication channel should
be implemented using a high-speed digital communication channel”, however this is not a
concern now if more recent standards are adhered to [16]. The developed controller for FACTS
compensation controlled via synchrophasors with time synchronized data from a wide area
measurement system (WAMS). The controller can also be utilized in other monitoring
applications and can also be used in future smart Qatar power grid. When coupled with the
information available from wide-area monitoring utilizing Phasor Technology, an SVC can be
a very cost effective solution to maintain voltage stability of the high-voltage transmission
network [15].
6.2.2 Various FACTS utilisation in Utilities
Similar to shunt capacitors combined with shunt reactors, the Static VAr Compensator
(SVC) is the oldest FACTS device. SVCs have been widely used by utilities for shunt
compensation for over 40 years. The first commercial SVC was installed to compensate for
fluctuation in an electric arc furnace [4], [22]. On transmission level the first SVC (940 MVAr)
was used in 1978/79 at the Shannon substation of the Minnesota Power System [22]. Since
then the SVC is widely used as the most popular FACTS device, and is still selected in most
new installations.

57
As for UPFC installation in the world, till recently only, two UPFCs were used around
the world one in USA and one in South Korea. According to the [23], UPFCs have been used
to control power flow and oscillation damping between a 345 kV and two 138 kV transmission
systems [2], [3], [23]. The study showed the UPFC has the ability to increase power flow of the
138 kV lines by 103% and dampen oscillation between 138 kV and 345 kV systems [23].
KEPRI (Korean Electric Power Research Institute) the research centre for KEPCO (Korean
Electric Power Corporation) studied a contingency case where a trip of the double circuit 345
kV overhead lines would lead to an overloading of the parallel 154 kV lines feeding the same
area demand leading to under voltage situation [15]. KEPCO had a request for a new right of
way to build a new 345 kV overhead line rejected, while the demand in the destination area
continued to grow. The studies suggested the installation of UPFC with rating +/- 40 MVA (for
each the series and shunt converters) for both the series and shunt converters, at the 154 kV
substation to be supported by 100 MVAr additional compensation [15]. The utility had found a
solution in this UPFC proposal, and studied the installation of +/- 40 MVA, at the 154 kV
level, for controlling the voltage and power flow [15].
The paper presented a study that investigated the steady state operational strategies of
UPFC in the Jeollanam-Do system in Korea. The study checked the operating points for the
UPFC in normal and contingency conditions and concluded that, the UPFC improved the
voltage performance of the study area. However additional shunt compensation of rating of
100 MVAr was needed to completely improve the low voltages during contingencies and
ultimately 100 MVA installed in South Korea [15].
There is another GUPFC installed on the NYPA system and some papers called it a
GUPFC and others called it a CSC (convertible series compensator). GUPFC was operational
since 2003, however they were about to start one of the commissioning test days when the
August 2003 blackout hit [16].
6.2.3 Modelling and control coordination of power systems with FACTS devices in
steady state operating mode
In the thesis [22], modelling and control coordination of power systems with FACTS
devices in steady state mode is studied. The application of WAC in protection and control has
been recently initiated. The recent applications of phasor measurement units (PMUs), with
advanced communication network to control local and remote voltages as in [15] have
enhanced the network performance. Online application in relation to secondary voltage control

58
has been discussed. The control procedure is applicable to any load variation or changes in
power system configuration, contingencies, interactions with generators, SVC, STATCOM etc.
[22]. Optimal control with inherited power system nonlinearity is not suitable for online
applications. In wide area coordination, the controllers receive signals from PMUs vide wide
area network, power system database, power system configuration (breakers, isolators etc.) and
try coordinate the set objectives for SVCs, UPFCs etc. As an option, it is practical to
incorporate the wide area controller in the energy management system (EMS) to provide
supporting functions necessary for control coordination. The authors confirmed that the
information available from PMUs on voltage phasors allows a linear model to be formed and
used in developing control strategy. This is considered as an online application for one aspect
of global power system security which is voltage value. The other power system security that is
gaining international recognition because of increasing marketing is the power flows in
transmission networks [22].
The research in this thesis dealt with steady state operation of FACTS devices from
another dimension and different angle. It looked at the real modelling of STATCOM, TCSC,
GUPFC and SVC in an existing transmission with its inherited system characteristics including
non-linearity and different load models. The FACTS allocation technique was too much in trial
and error approach, though this; it is so practical and provided useful results.
6.2.4 Preventing voltage collapse by large SVCs at power system faults
Another practical review of usefulness of using FACTS in real networks, explained
how the Saudi transmission system has improved in performance by using SVC to reduce the
risk of voltage collapse during fault conditions [24]. The western region transmission system
operates at 380 kV and 110 kV, and has including many transmission level reactors and
capacitors and reactors at the distribution level. Although all they have these voltage devices,
in addition to the transformers’ tap changers, their transmission system still shows signs of
weaknesses with regard to reactive power control [24]. The system suffered from control of
voltage between peak load and light load and unhealthy voltage recovery at medium load
condition and voltage collapse at peak [24]. The utility has conducted reactive power planning
study that advised several mitigations to be considered including fast fault clearance, dynamic
reactive power support during the faults and after fault clearing, and steady state reactive
power support to control daily voltage fluctuation [24].

59
The study results recommended installing 3000 MVAr, (5 SVCs with rating of +600/-
60 MVAr) at different 110 kV buses to resolve the motor stalling problem and daily load-
voltage control. Three SVCs were installed at different locations in the year 2008; the other
two SVCs were installed later to this date [24]. The paper [24] concluded that using SVCs was
an efficient solution in supporting the positive sequence voltage during faults. The SVC can
also combat the phenomena of stalling motors for those induction motors used in air-
conditioning systems. The paper recommended that the SVC shall have a high capacity during
faults; while fast response SVCs can have smaller ratings. The authors claimed that a few
seconds operation during fault is sufficient. The paper recommended that the SVC shall block
TSCs immediately after the fault clearance in order not to produce temporary over-voltages
when the loads are dropped [24]. The paper reported that the SVCs responded very fast to
actual three faults cases (phase to earth faults) that occurred in 2008. The SVC delivered full
capacitive power at the bus location in one and a half cycle (25 msec. in the 60 Hz Saudi
system). The system voltage has been maintained constant during the fault or even increased
slightly, while the voltage of other two healthy phases didn’t drop much [24]. It was reported
further that the SVC has reduced its output to 500 MVAr for about 4 cycles (66.67 msec.). The
SVC delivered 200 MVAr in the next 5 cycles (83.33 msec.) and stayed at this output for 30
seconds, while the faulted phase didn’t fully recover to its pre-fault level during this period
[24].
The critical review to this paper starts from the last contradicting statement that the
faulted phase has not recovered fully for 30 seconds, while it was mentioned also in the
operational records, that the SVC has managed to maintain the voltage constant. In another
literature, other utilities adopt control strategies that SVC or STATCOM devices are designed
to be isolated during short circuits in the network [16]. Also the previous research
recommended that TSCs shall be switched off after the fault clearance [16]. Each utility has the
option to select the SVC operation during faults, based on the prevailing operating conditions.
In this Saudi experience [24] the utility wants the SVC to contribute the needed MVAr power
during the fault itself, or initial fault recovery, since the load is dominated by air conditions. In
other places of the world and during winter climate the load would mainly be heaters, and
during fault conditions they could be no need for SVC operation. The rising critique here that
the SVC is designed to be used during fault conditions, as the authors confirmed that the SVC
is a robust device during faults and during fault clearance [24].

60
6.2.5 SVC wide-area power oscillation damping control using PMUs
The role of power oscillation damping control through the assessment of wide areas
was studied in Norway, using a static VAr compensator [6], [25]. The study encompassed
“feedback signals from remote phasor measurement units (PMUs) in Norway and Finland are
used to damp the critical inter-area modes through a large SVC unit located in south-east
Norway”. A comparison between two control design approaches: (i) model-based POD
(MBPOD) – dependant on accurate system model and (ii) indirect adaptive POD (IAPOD) –
which relies only on remote measurements is made. For MBPOD, optimisation approach is
used to obtain the parameters of the controller while the IAPOD is based on online Kalman
filter estimation and adaptive pole-shifting control. It is shown that the IAPOD yields almost
similar performance as the MBPOD with very little prior information about the system [25].
Meanwhile, the research compared the performance across multiple tie-line outages,
attempting to deduce the most optimal approach to wide area controls. The potential usefulness
and applications of these developments have been used and researched in depth in recent years,
as wide area signals used to optimize power oscillation damping control effectiveness. The
increasing potential of technology throughout the evolution of power systems instrumentation
has led to the examination of the possibility to adopt closed-loop damping control for wide-
area signals. Although conventional control concepts and solutions are continually used and
considered for future developments, primarily due to the level of precision which has evolved
through numerous integrations and on-going practice. But this method is becoming
increasingly inflexible in relation to the increasingly dynamic technology and broad range of
innovative features [6], [25].
Analysing the implementation of damping in key ‘inter-area’ modes across a SVC, the
authors examined feedback signals, the optimization of parameters within their fixed structure
controlled (based on a combination of pole-shifting and Kalman filter estimation), and a
comparison of MP and IA power oscillation damping (MBPOD and IAPOD) [6], [25].
Following their analyses, the authors determined that both damping approaches give rise to
similar results, further stating “the transient behaviour of SVC susceptance and voltage is
slightly inferior for an IAPOD both in terms of larger and higher frequency variations”.
6.2.6 Wide area monitoring, protection and control system in GB
The content of [26] published in 2006 is mainly focusing on the modelling, analysis and
control techniques of FACTS controllers and their future R&D applications. The controller

61
applications cover various power-system phenomena comprising steady state voltage and
power flow control, voltage and reactive power control, voltage stability control, small signal
stability control [26]. The FACTS controllers including IPFC, GUPFC, VSC HVDC and M-
VSC HVDC, etc., have been modelled and used for flow compensation and power quality
control in power system [26]. The book’s input is a collective effort from the authors’ practical
R&D industrial experience in the modelling, simulations and control design of FACTS [26].
The same research trend was followed by the same research leader at Imperial College
London. The work is an interesting piece of collaborative applied research in Wide Area
Monitoring, Protection and Control (WAMPAC) took place simultaneously at three British
universities: University of Manchester, Imperial College, and University of Strathclyde with
the SUPERGEN FlexNet Consortium [1], [26]. The mentioned research addressed the design
and development of an optimal WAMPAC architecture, communication infrastructure and
real-time application in GB power grid operation and planning [1], [26]. The technology is
named by the researchers as ‘Synchronized Measurement Technology (SMT)’ [26], because it
can provide synchronized time stamped measured signals to the controllers, using the global
positioning system (GPS). This technology has also been tested successfully in this R&D
project where wide area monitoring system was applied with three PMUs installed at the three
mentioned universities.
The Data Concentrator (DC) was installed in Ljubljana (Slovenia) and it acquired data
from all PMUs using standard internet communication network [26]. The WAM presented in
the paper is a commercial system known as ‘FlexNet’ helped to identify opportunities for
better optimisation of GB network performance [26]. The research used ‘Improved Recursive
Newton Type Algorithm’, to better estimate inter-area oscillation damping and frequency. The
researcher claimed that this research has supported the future application of real-time dynamic
protection and control schemes through the improved WAMPAC [26]. A combination of this
smart application and the other PMUs, SVC compensation controlled via synchrophasors
application [12] can be studied for potential application in Qatar to improve the system voltage
profile and monitor and control the network loading.
6.2.7 Synchrophasors for improved interconnection operations
This research discusses application of synchrophasors in Saudi Arabia transmission
network [27]. The introduction of this applied research stressed the fact that network
disturbance and blackouts occurred at different locations demonstrated the need for simple

62
situational awareness for system operators for sustained stability and increased operation
efficiency [27]. According to these researchers, the synchrophasors can improve the
visualization of system conditions and wide area control. Data streaming in a standard format
in synchrophasors was used in improving the SCADA (Supervisory Control & Data
Acquisition) data quality, as well as in providing automatic checks of state estimation
calculations [27]. The paper explained how system parameters such as voltages, angles, power
flows, and breaker statuses can be seen well in real-time rather than delayed by scan rates and
calculations. Power system phenomena in terms of oscillatory modes, damping ratio etc. can be
calculated, displayed for operators use, and correlated.
The authors claimed that ‘one of the main blackout causes in the wide areas, that the
system operator was using non-real time information to monitor real time operations in his
area’ [27]. The standard SCADA data is retrieved by slow sequential time scan of 1-5 seconds
making the situation impossible to see system oscillations [27]. The research conclusions
claimed the need for synchronised monitoring and control systems as the best solution for large
scale visualisation. It has exhibited the experience of other utilities on using synchrophasors in
visualisation of system dynamic performance. Synchronised measurements can boost real time
processing in relays, processors and other equipments which lead to high speed control actions
in manual and automatic modes. The new result, as per the researchers, is the new method they
presented for the voltage stability assessment of transmission corridors [27].
The synchrophasor technology discussed above can benefit QPTS in many aspects,
including the provision of fast detailed information of the incidents in the first 5 cycles after
faults. There was a partial disruption of electricity supply in part of QTPS, due to a fault in one
of the transformers, which was cleared in less than 5 cycles (100 m-seconds) and the SCADA
system showed no detail results within this short period, rather than only a trace of voltage
drop in the faulty phases and recovery. The synchrophasor technology can also work fine with
FACTS devices in controlling the compensation as explained in the paper [12] and in this
thesis.
6.2.8 PSS and FACTS devices controller for damping of power system oscillations
The dissertation [28] completed researching the potential for low frequency
electromechanical oscillations to impact transmission lines’ transference capacity and stability
of power systems. The thesis is emphasizing the reduction of this potential through the
implementation of PSS (power system simulator) and FACTS devices for damping oscillations

63
[28]. Similar to other studies in this area, the author acknowledged the capabilities of the
devices in general power system improvement, but the study provided more focus on the
ability to develop advanced PSS and systematic techniques for FACTS devices’ damping
controller design [28]. According to this researcher, an intelligent control strategy which
combines the knowledge of system identification, fuzzy logic control, and the neural networks
are applied to the PSS design. A fuzzy logic based PSS is developed and tuned by neural
network strategy. The proposed PSS improved the damping of power system oscillations over
a conventional PSS. But the same control strategy is not satisfactory for the FACTS damping
controller design, mainly because of the different locations and roles of FACTS devices in
power system oscillations compared to PSS. Additionally, a systematic approach provided to
design damping controllers, an examination of the challenges in feedback control, using the
PRONY method to establish a low order plant transfer function, strategy for changing the
controller gain in accordance with transmission line loading condition (for improved damping
in UPFC, and SVC), and simulation results relevant to these areas [28]. The researcher asserted
that “the UPFC brings quite a few challenges to power system simulation and study including
power flow calculations, modelling of converter control and UPFC dynamics, interfacing
UPFC with the power system for transient simulation program development and physical and
operating constraint modelling”.
The research work presented design techniques for power system stabilizers and
controllers, for the purpose of damping oscillations for FACTS equipment, recommending the
integration of PSS in damping controllers with excitation systems. Generally speaking, the PSS
has been found to perform superiorly to FACTS controllers in damping local oscillatory
modes, while the design presented, successfully integrated neural network theory, fuzzy logic
control, and system identification. An assessment of the strategy determined that it is more
ideal for PSS design than controlling FACTS, but continuing research could address the weak
areas for improvement in either area [28].
Further commenting on damping, according to research, FACTS devices are normally
installed on the high voltage transmission lines that are far away from any generator. They do
not affect the power system oscillations in the same way as PSSs. Instead, they do that
indirectly by affecting some of the power system network parameters. Therefore, unlike PSS, it
is difficult to derive fuzzy rules for damping controllers for FACTS devices, further pointing
out “PSSs use the local generator speed signal as their input and this signal is a good indicator
of power system oscillations, especially local oscillatory modes”. On the other hand, single
generator speed does not contain as much information about inter-area oscillatory modes as do

64
transmission line local signals like power, current and voltage. Therefore, sometimes it is hard
to damp out inter-area mode oscillations using PSSs only [28].
A more recent knowledge after this dissertation [28], revealed that, a series FACTS
controller with a damping controller ought to be able outperform a PSS on a generator if
designed correctly (so a TCSC, for example) since it can modulate power directly instead of
indirectly as is the case with a PSS [16]. There have been many TCSCs installed for this
purpose in Brazil, Sweden and India [16].
6.2.9 Small signals analysis of damping performance of IPFC and UPFC controllers
The research discussed the dynamic behaviour of IPFC and UPFC in a common
reference system [29]. The small signal model of the interline power flow controller is
developed and validated using electromagnetic transients simulation [29]. The paper made
comparison for the damping capabilities between for IPFC and UPFC. The research stated that
the series branches of these FACTS devices segment the network, creating a new structure that
could be used to improve the damping without requiring design of a tuned feedback controller
[29]. Since the IPFC has two series branches (VSCs) compared to the UPFC which has one
series branch, the IPFC has greater potential for improving the network’s dynamic performance
[29]. The results of this research have concluded that the effect of installing an IPFC or UPFC
in a constant power mode is similar to that of disconnecting the transmission line that contains
the series branch. This resulting modification in the network structure introduces significant
changes in the corresponding mode frequencies as well as mode damping [29]. The
transmission network can also improve more the damping performance with proper allocation
of series branches with controllers. This is attributed to the change in the network structure
rather than by tuning of controller parameters as in the case of PSS, requiring no use of
designing the feedback damping controller [29]. However it has been recommended with
proper damping, controller can modulate the performance of the FACTS device. The results
have a final observation that the IPFC can provide better damping improvement compared to
UPFC.
Considering the last conclusion, the GPUFC device modelled and studied in this thesis
can have a better performance compared to IPFC, because the GUPFC has two series branches
and one shunt branch and the latter can control the local and remote voltages (using PMUs).
This case study in the reference can be extended further to include the performance of GUPFC.

65
6.2.10 Power-flow control and power-quality enhancement in interconnected networks
The main objective of the PhD [30] is to explore the real interest and potential of a
Unified Power Line Conditioner (UPLC) when used for interconnecting MV distribution grids.
The writer claimed that UPLC is very versatile power electronic apparatus, and represents a
very appropriate circuit for interconnecting distribution grids. The researcher considered UPLC
as a universal topology that combines the capabilities of both UPFC and UPQC [30].
In this PhD thesis [30], the Autonomous Demand Area Power System (ADAPS) is
discussed in details. The ADAPS concept was developed by the Central Research Institute of
Electric Power Industry (CRIEPI), Japan, motivated by the large-scale penetration of
distributed generation (including fuel-cells and photovoltaic) expected in Japan [30]. The 6.6
kV power distribution system of Japan is serving high power demand cities in urban areas and
with a massive DG insertion would generate power flow congestions and voltage fluctuations
in distribution lines [30].
The vision of CRIEPI, that the ADAPS are integrated as the segment that includes the
distribution system at 6.6 kV and a primary system at 66 kV. According to the author, the
meshed structure is controlled by means of back-to-back MVDC devices named Loop Power
Flow Controllers (LPC) by the authors. The whole system is controlled by an operation control
system (OCS) and the communication network consists of sensors, demand/supply interfaces,
optical fibres, media converters and hubs [30]. The thesis addresses how the dual challenges of
controlling the power flow and power quality could be achieved simultaneously using a static
power electronic device.
6.2.11 Power flow calculation with GUPFCs connected in a power grid
The authors of [31] released the invention of new method to run load flow subroutine
using conventional Newton-Raphson method, incorporating a model of generalized power flow
solution into a power grid [31].
The disclosed method claimed to apply the generalized power flow solution model to
calculate the power flow solution with FACTS devices such as STATCOM, UPFC, and
GUPFC in a single framework [31]. The invented algorithm is designed to incorporate the
control variables of the shunt VSC into the state vector of Newton-Raphson power flow. The

66
new increment of state variables with the generalized power flow controller preserved the
quadratic convergence characteristic of the Newton-Raphson power flow algorithm [31].
The Newton-Raphson model contains different data inputs including bus types (slack,
load and generator buses), bus loading conditions, lines parameters, reactive power limits etc.
The new in this research is the generalized power flow controller comprising a shunt voltage
sourced converter in parallel with a bus and series branches having a sending-end and a
receiving end [31]. A shunt coupling transformer connecting the power flow controller to the
grid is, being modelled as an equivalent circuit of shunt voltage source converter in series with
impedance. Each series branch is modelled as a series voltage source converter and a series
coupling transformer (series voltage source in series with impedance). The DC capacitor is
hosted between voltage source converter and the shunt voltage source converter and the series
jointly connecting and sharing the same DC bus [31].
In this thesis, the same internationally accepted standard software (PSS®E) is used for
modelling and analysis of the case studies. Versions 31, 32 and 33 of this Siemens software
have a common power electronics data input card that can be customised to model different
FACTS and HVDC devices. This software is tested and verified by the supplier and also by
various utilities around the globe for correctness and preciseness. So the research work
conducted saved the effort and time to program or model any power electronics devices, while
focused mainly on efforts to get more useful results from the analysis on a real power network
(QPTS). The PSS®E software has already contained all power flow methods including Newton
Raphson, Decoupled and Fast decoupled techniques etc. Therefore the FACTS and HVDC
models used in the Cases Studies Chapter are embedded in the PSS®E power flow algorism
using one of the mentioned methods [1], [2], [3].
6.2.12 Online simulation benefits for operation of large power systems
Another critical element of research and development in power systems online elements
is simulation [33]. Estimation denotes the generation of approximations, while simulations are
the medium for testing structures amid developments for real-life equipment. Successful
planning and operation of power systems and system interconnections depend largely on the
engineer’s skills to provide safe, reliable and economic solutions. Simulation technologies
provide useful means for the design, operation and analysis of the power system, assisting in
making reasonable decisions for a reliable configuration. Due to powerful software and
advanced real-time simulators, it has become possible to simulate dynamic behaviour of large

67
power system [33]. Simulation technology has further facilitated the assessment of the growing
alternating and direct current projects proposed and implemented across a range of remote
generation systems. The changes in technology and in the demand for different forms of energy
have given rise to the development of systems designed to distribute power generated from
solar, wind, hydro, nuclear, and geothermal facilities [33].
The planning stage of simulation projects requires meeting demands identified during
the analysis phase, while these may include assessments of the functionality and dimensions of
equipment within the system. The rise of power system capacity and applications has been
paralleled by a rise of tool development, and some of these are capable of streamlining
conventional software simulations with real-time simulations. The authors reported on the
potential for NETOMAC to be used to decrease network size, another increasing demand in
order to transfer parts from a large power system simulation in form of a reduced network into
another program or into a real-time simulator, which cannot handle the full power system [33].
These authors pointed out that the simulation capacity in 2004 had reached a high level,
as programs at this time were capable of real-time simulation while features and capacity were
being improved at an exponential rate. The most influential improvements noted at this time
were new models, new technologies, and new applications. Also during this time, the real-time
simulation was increasingly converting to (purely) digital technology from analog (or analog-
digital combinations), as this change compounded with the demand for real-time applications
was assumed to be affecting all areas of power system software and simulation development
[6], [33]. The abilities of developers and demands from users were assumed to be the limiting
and driving factors, and these authors concluded that the results of simulation analyses are
limited by the talent of engineers assuming the research (regardless of technology) [6], [33].
Streamlining can facilitate the detailed analysis of commutation, related to individual
device switching in LCC HVDC and can be extended to an extent to FACTS and VSC HVDC.
RTDS is a simulation tool that can help in performing this analysis [16]. Combination of
FCATS and HVDC is not unique, as there have been papers and theses proposing this since the
late 1990’s. Nobody has actually installed a STATCOM with a HVDC link yet although many
papers have proposed it. LCC links use synchronous condensers, even in new installations, not
STATCOM [16].

68
6.2.13 Optimal location of FACTS devices using Genetic Algorism (GA)
Genetic Algorithm (GA) is an optimization search technique based on the nature of
random selection and genetics. The GA first generates encoded initial population randomly and
then select, till crossover and mutation are reached the maximum generation [34]. In the paper
[34], the researchers had claimed a novel algorithm for allocation of multi-type FACTS
devices based on Genetic Algorithm (GA) using a multi-objective optimization function. They
advised that the proposed algorithm tested on IEEE 5 and 6 test systems and WSCC (Western
System Coordinating Council) 9-bus power system has decreased the loss of system about 25%
[34]. At the conclusion, the paper also claimed that the test of multi-type FACTS devices has
led to improvement in security and reduction in losses without increasing the total cost of
power system [34]. Figure 16 gives an overall view of investment ($/kVar) compared to rating
of TCSC, UPFC and SVC (in MVAr).
Figure 16: Ranges of investment cost for TCSC, UPFC, SVC [34]
The critiques to this piece of research fall into two issues, the first is the reduction of
losses to 25% which doesn’t look so real in physical power systems. The second critique is that
with all the benefits to the tested network, but still it is ‘without increasing the total cost of
power system’. Obviously there shall be a cost of using multi-FACTS devices and the new
technology of power electronics costs more than the conventional power system development
of the same rating (Figure 16). However the paper should have compared both costs to give an
option for selection.

69
In another research paper [35], steady state models of UPFC, TCSC and TCPST have
been selected for simultaneous optimisation of the location, type, cost, and parameter values.
The research presented optimum FACTS allocation using genetic technique for two objectives;
reactive loss minimization and voltage stability improvement. Other objective is the cost to
find the optimum locations and sizes of different FACTS devices. The results of the study
confirmed that power system performance is improved by optimum allocation of FACTS
devices. Case studies conducted with, IEEE 30-bus and 118-bus systems are not in real
physical networks such as QPTS, presented in previous chapters [35]. The authors claimed that
of the most of the FACTS research was focused in the enhancement of transmission capacity
while, the research didn’t examine fully the minimisation of reactive power loss along with
improvement in voltage stability margin. The researchers proposed a GA search technique to
determine the optimal location of FACTS devices in transmission network to enhance the
voltage stability margin and minimize the reactive power loss of the power systems.
In this thesis, improvement of voltage stability margin is discussed using STATCOM
and the minimisation of active and reactive losses in the compensated lines comes as a by-
product of the reduced transmitted power (active and reactive). In other words the
enhancements of transmission capacity or local MVAr compensation bring other benefits to
power systems in terms of losses optimization and voltage support. The theory behind this
losses optimisation is well developed, however Appendix-E, tests the individual research
carried as part of this thesis to optimise the power losses using the B-Coefficients technique.
The research work advised that the use of FACTS technology could be a cost-effective
option for power delivery and could minimise capital investments cost when selecting the
optimum number and placement of these devices [35]. The paper used genetic algorithm, to
identify the optimal number and location of FACTS devices in the IEEE 30-busbar power
system. It is reported in [35], that the simultaneous use of different FACTS devices is the most
efficient method to enhance the transmission system transfer capacity. In finding the optimum
location for a FACT device generation costs, transmission losses, line overload and the costs of
installation and maintenance are considered [35]. The research claimed that the algorithm finds
the cost-effective location for the device.
Although the research conducted is not recent (2004), however, the researcher reached
results earlier than, what has been discovered in more recent papers. Similar to other research

70
in the area, they use MATLAB tool for the analysis on the standard IEEE 30 buses system. It is
very rare in the academic research fields to find simulation carried using the PSS®E software
on a real exiting transmission system.
6.2.14 State estimation of power system with FACTS and HVDC
Other estimation through their application of their recursive least squares technique; the
research has developed a model for integration within a system using a UPFC controller, and
used an IEEE 14-bus system for assessment [36]. The states selected within the UPFC, claimed
by the researcher as a new approach to power system state estimation with UPFC names as the
power injection model. The research mentioned that the model is effective for generating data
through estimations. Contributions to the existing knowledge base in power system estimation
through their application of recursive least squares technique (RLS); asserting this method is
entirely unique to applications in the field. The authors developed a model for integration
within a system using a unified power flow controller, and used an IEEE 14-bus system for
assessment [6], [36]. Asserting this research design produced evidence of an effective
methodology, the validity of the developed algorithm, and the ideal nature of the states selected
within the unified power flow controller, the authors presented a new approach to power
system state estimation. The methodology they presented made use of the LAV estimator. The
results of the research proved that the model is ideal for generating data through estimations.
The research conducted in [79] described how an algorithm applied in the estimation of
phase angles, amplitude, frequency, and other signal characteristics in power systems. It
focused in the estimation of distorted power system signal parameters, pointing out that the
method can be applied to controlling many electrical parameters and to online power
electronics including FACTS, HVDC etc. [6], [13].
6.2.15 Optimal allocation of FACTS devices using Bees Algorithm (BA)
The idea of ‘Bees Algorithm (BA)’ emanated from the physical movement of bees
searching for food. The honey bees fly in different directions in gangs to cover a large areas
containing food [36]. There are many researchers conducted useful work for applying the BA.
In one of the researches the BA was used to find the optimal location of FACTS devices to
achieve the economic generation and dispatch in the restructured electricity market. In 2010,
the paper [36], suggested BA to decide the optimal locations of FACTS devices to maximize
the available transfer capability (ATC) of power transmission (and hence the transactions)
71
between generations and loads in restructured power system. The research explained the
algorithm uses a novel method that combines the simultaneous search of the FACTS location,
parameters and types [36]. Two studies simulated the thyristor-based TCSC and SVC,
repeating power flow to evaluate the feasible ATC value within allowable limits real and
reactive power generation, line thermal, voltage and FACTS operation [36]. The model used
the IEEE30 bus system to verify the algorithm for enhancing the ATC and validated the results
using Genetic Algorithm. The research conclusions indicated that when the FACTS with
proper parameters combined with the optimum location could increase the ATC. The
researchers confirmed that BA is very efficient for this kind of nonlinear integer optimization
[36]. The same researchers carried similar initial study in 2009, using other more FACTS
devices including the UPFC and TCPST. The same conclusion received in both researches
stating the BA and GA gave similar results.
As a critic, the BA like other research location optimisation techniques is more versed in
theoretical content. More practical approach is to use the allocation techniques associated with
some international, utility standard softwares. The PSS®E software [88] used in this thesis has
its own location optimisation techniques called optimal power flow (OPF). The PV, QV
analyses conducted, explain the use of optimisation function of this software [88]. The results
from these analyses have used in the Case Studies Chapter. The function can use different
objectives including the best allocation of capacitors banks, reactors, FACTS, voltage or power
flow control.
6.3 Literature Review of Online Energy Systems
6.3.1 Online power conversion system technology
Other researchers proposed a method to develop and integrate single phase online UPS
systems, presenting a combination of circuit plans, implementation processes, theory, and
potential for systems using this technology [44]. The design included an integrated directional
AC/DC converter, thereby providing active power filtering and power factor correction for the
system. Beyond this, the authors further provided recommendations for operations across the
input state, the event of input power failure, and full functionality [44]. The input stage is
designed for the converter, allowing rectification, power factor correction across standard AC
line operation, and active power filtering across outage modes. Active power filtering can
continue through input power failure while offering reactive power. In the output stage, this

72
technology transmits power from the battery to the critical load, and the power capability is
superior to standard online UPS systems. The presented plans analysed for the UPS system,
assessing multiple circuit models and the strategies for design and implementation [44].
Expanding a case for their development and implementation opposed to the conventional
technology, the authors provided a combination of theory and simulation results to support
their argument and conclusions. A laboratory prototype of the technology was used in these
simulations supporting the functionality and potential for their system. The technology can be
applied or tested as part of the battery storage and PVs case studied in Chapter 7.
6.3.2 Online monitoring structures in power transmission lines
The paper examined the use of an innovative power supply for online monitoring
structures in power transmission lines [71]. The method for supplying power is ideal, drawing
energy from the electromagnetic effects generated from standard transmission. This relates to
fundamental theories of physics, as the current generated down any wire or power line
generates some magnetic field perpendicular to the flow of the electricity. This is an effective
energy that can be harnessed if technology worthwhile of investment could avoid this ‘waste’
of energy while diverting it back into the system. Using a custom designed Rogowski coil, the
authors proposed a method to harness these magnetic fields surrounding the transmission lines,
thereby converting it to electricity to power elements of a power station. Although this could
be used in a number of ways, the authors provided plans for harvesting the energy to use in
powering online monitoring systems. The authors presented circuit designs, theory, strategies
and methods for implementation and use, considerations for overvoltage and impulse line
current, and an analysis of feasibility and reliability were presented. All of these are entirely
viable and potentially beneficial across Qatar lines. The research, ultimately concluded
“experimental tests, including the, short-circuit and impulse-current tests, have been conducted
on the power supply to verify its performance under different operating conditions. Test results
show that the power supply is capable of providing stable outputs with no saturation and low
heat generation for the entire range of line conducting currents and can sustain severe
conditions such as abnormal impulse currents [6], [71]. This conclusion suggests that further
research could optimize methods or uses of such technology or strategies, while demonstrating
the practicality, benefits, and potential for transmission systems such as Qatar’s in adopting the
method. Clearly, this technology and the relevant methods provide an ideal path to efficiency,
while an investment in the machinery and installation could provide (or ‘save’) energy that
could potentially reimburse the investment by multiple times over as it allows the nation to

73
meet a greater percentage of energy needs through improved net output. Naturally, energy used
by the system powered from these devices allows the energy which would normally be used to
remain free for distribution elsewhere [71].
6.3.3 Online control on ESS and wind-diesel system
Other research has provided evidence of potential improvements by way of energy
storage and management, which could be integrated into online systems [72]. Naturally, the
ideal implementation would depend on budgeting factors, although the technology described
by [6], [72] reveals a clear benefit. The research presented an analysis of energy storage
systems that can be integrated with power systems to addresses variable power generation
sources. While this is generally only an issue with uncommon sources of energy such as wind
power, the design and strategy proposed and recommended offers insight into combining
technology, amid the additional establishment of flexibility for systems using multiple energy
sources. Energy storage system power must be controlled using multiple time frames to
achieve established objectives, with a dual level structure of control compatible with online
implementation. The method was analysed through a combination of theoretical exploration
and simulation. They concluded that a controller possessing the capacity to minimize dump
load, maximize energy storage system utilization, and restrict diesel ramp rates is proven to be
superior to available controller technology, which is compatible with online systems. Both the
mechanisms of managing the energy hold potential for benefit, particularly in the areas of
Qatar where energy storage is most desired, while the flexibility for additional energy sources
of smart grids is further desirable [6], [72].
6.3.4 Online diagnosing shorted turns on the windings of power transformers
One of the most important elements of online systems is fault assessment, while
systems capable of monitoring an entire network, identifying faults, and further attempting to
locate causes and solutions of faults are of great potential benefit. In a more recent analysis of
these areas, researchers studied the relationship between interturn faults in power transformers
with network failure, emphasizing the impact of the progression of fault severity, detection, on-
and offline testing, and problem solving through online systems [6], [73]. According to the
authors, “the main problem with SFRA as one of the well-recognized diagnostic tools for
detecting winding faults is its restriction to the domain of offline testing since the method
requires injection of a test signal into the transformer windings through the high-voltage
74
bushings. To address the difficulties arising from this issue, in this contribution, a new
technique for online transfer function monitoring of the power transformers windings through a
quite simple, economic, and non-invasive capacitive sensor installed on the surface of the
transformer bushing is presented. Interturn faults with various levels of severity were imposed
on the winding of a 35-kV/400-V, 100-kVA oil-immersed distribution transformer to evaluate
the feasibility and sensitivity of the method” [73]. Analysing this technique through a
controlled experiment, the authors concluded that modern online monitoring systems are
practical while capable of perceiving even minimal interturn faults (as low as 0.2%) across
windings. Moreover, it was recommended that such systems be integrated with power systems
to increase the capacity to detect warning signs, thereby reducing the potential for network
failure while improving the health assessments of transformers. These same benefits could be
realized in Qatar systems, with compounded benefits when integrated with the improvements
recommended and the previously analysed research [6], [7].
6.3.5 Online small signal stability PMUs based analysis of multi-machine systems
In another recent study published in the 2011, extended research provided a
methodology for analysing stability online, providing strong conclusive evidences of benefit
[6], [74]. These authors researched online signal stability assessments, using synchronized
PMUs information on power system that contains multiple machines. Their proposed and
assessed method does not require data regarding the line impedance, network configuration, or
generators, while it uses a combination of least square estimation and ambient data to develop
a reduced admittance matrix. Analysing their presentation with theoretical analysis and an
evaluation of strategically designed simulation results, the authors determined that the
recommended method has potential for benefits across a range of differing system types, while
it can further be used to assist operational personnel with monitoring the stability of signals in
the system [74].
6.3.6 Online smart alarm processing system for digital substations
Online monitoring, fault detection, and methods for designing these systems while
generating alarms were further assessed by the researchers presented recommendations for an
online intelligent alarm-processing system [6], [75]. This system was based on the design of
the digital substation; alarms were developed in accordance with IEC standards. The two
modules for parallel operation in the online development were presented and evaluated. The

75
authors provided a method for using alarms to notify users of the presence of alarms which has
clear benefit, to locate the presence and potential causes of false alarms, to locate missing or
dysfunctional alarms, and potential implementations in a case scenario complete with an
established software program [75].
6.3.7 Online power estimation using an on-chip bus performance monitoring units
In this study, the researcher analysed another aspect of online power system
management, assessing modern aspects of quality power estimation, efficient power
management, indirect power management, and using performance monitoring units for quality
online power estimation [6], [76]. Realizing that current CPU performance monitoring units
(PMUs) only assess the functions conducted within the core and cache (contributing to a
restriction of accuracy for system wide power estimation in both on- and off-chip memory).
The authors proposed an on-chip bus PMUs which effectively processes the functions of both
on- and off-chip components [76]. This on-chip bus (OCB) PMUs further compiles the data
across separate storage devices, while online software converts the stored data into power data
(using linear power models). Additionally, an algorithm designed to optimize the processing of
the OCB PMUs is proposed, while the authors assert its effectiveness in reducing the amount
of data processing required for effective compilation, conversion, and operation. The accuracy
of the power estimation through this system was compared to the power estimation of
conventional hardware measurements and cycle-accurate estimation, proving substantial
accuracy facilitating the ultimate recommendations [76].
6.3.8 Current phasor measurement in a power system state estimator
Three inclusion techniques for measuring current with phasor measurement units
examined in power system states, using a combination of conventional and comprehensive
formulas, the Jacobian matrix, and other performance estimation [6], [77]. The authors
presented an outline for combining estimations across hybrid states, phasor measurement units,
and integrating conventional techniques for each of the three methods used. Through the
experimentation, it was determined that each method has unique benefits while there was no
superior ‘all-purpose’ method. Moreover, the authors reported the behaviour of elements in
terms of general influences and the potential for “ill conditioning” to have affected the state
estimator gain matrix, as this was found to be a considerable factor [77]. It was asserted that
the ‘Monte Carlo’ technique is one which is ideal for simulating and generating sample

76
measurements, and discerning the average variation of estimated states. Meanwhile, it was
determined that the Jacobian matrix is ideal for identifying convergence behaviours and issues.
While on the basis of the simulation results, it is observed that the inclusion of the real and
imaginary part of the current phasor gives better performance in terms of the accuracy of the
estimator and convergence characteristics [77].
6.3.9 Online estimation of maximum power transfer limits (Thevenin equivalent
parameters)
Examining the online approximation of power transfer limits, stating the use of the
Thevenin equivalent has risen in popularity (due to its lack of complication) [78]. The research
study was designed to provide a model for investigating the Thevenin equivalent parameters,
while the potential for this method was examined, assessed, and discussed while simulation
results and a predictor-corrector framework were also presented [78]. The predictor-corrector
framework was suggested for the purpose of improving accuracy, while the method was tested
through a basic linear network as well as two larger and more complex systems. The
simulation determined that these methods are in fact effective, and are ideal in using for online
estimations of power transfer limits for weak load buses [78]. Acknowledging the challenges
associated with developing accurate estimations of Thevenin equivalent parameters, the
authors asserted that the significance of their research was evident in this alone, stating that an
effective approach to determine the Thevenin equivalent would be valuable for existing
processes and future research initiatives. Fortunately for them, the authors were able to present
an analytical model for generating and examining the Thevenin equivalent data for the case of
maximum power distribution for online systems [78]. The applicability of this model was
determined to be high, while recommendations for future research included decomposing the
coupling term, implementation on a larger scale, increased efficiency and timeliness, and
improving accuracy. Generally, this research proved that the model was not only functional but
ideal, and could serve as the foundation or guidelines for existing online systems [6], [78].
6.3.10 Online estimation of distorted power system signal parameters
An algorithm, designed to incorporate Kalman filtering principles, applied in an
analysis of estimation potential in the areas of phase angles, amplitude, frequency, and other
signal characteristics in power systems [79]. Pointing out that the method can be applied to
regulating digital automatic voltage, distribution static compensators, protection relays,

77
FACTS, and other areas of power electronics. The authors asserted that the algorithm is
especially useful in combining generators to grids amid a demand for accurate and quick trait
fluctuation detection [79]. It was further reported that the algorithm can benefit the
examination of noise influence, computer influence, and high order harmonics; it was the intent
of the study to examine these areas, and the authors conducted numerous simulations to
illustrate both the nature of influence and the benefits of the algorithm method. Concluding, the
authors prove that the method is in fact beneficial in conducting the outlined processes, as well
as estimating multiple signal traits at the same time. It is capable of making accurate
estimations in the presence of non-linear loads, noise, and other forms of substantial distortion.
It is further reported that the drawbacks of applying the traditional Kalman method include a
high sensitivity, although the improvements proposed were stated to have addressed this issue;
a custom summation is conducted across the samples in order to generate a periodic output
which is much less prone to complications. This signal is thereby less prone to being useless,
and is less distorted than the original [79]. Reporting on the results of multiple simulation
analyses, the authors prove how their technique is effective across a range of conditions.
Considering this, the study shows how known theories and methods can be developed further
to address complications or to generally improve processes and output. It provides a blueprint
for the effective use of Kalman filtering amid the outlined conditions [6], [79].
6.3.11 Online PMUs estimation/application of power grid impedance matrices
Acknowledging the significance of grid impedance matrix estimation in safeguarding
or analysing large power systems, the researcher reported on the potential for a recursive least-
squares approximation algorithm for locating impedance values [80]. Basing their method on
synchronized phasor measurements, the authors tested it across two power systems using data
managed through MATPOWER, and tracked changing parameters. Case studies were carried
out to estimate impedance, detect faults, and analyse voltage stability margins. Following the
presentation of the recursive least-squares estimation algorithm (including a forgetting factor)
for approximating impedance models, the authors pointed out that the case studies were in fact
proof of their accuracy as well as the potential for applicability of impedance parameters in
fault detection and stability monitoring [6], [80]. This piece of literature further recommended
the analysis of techniques to address data loss, communication delay, and online approximation
of grid parameters as areas ideal for progressive research. This study was yet another primary
research initiative which demonstrated how existing methods could be improved for enhanced

78
output, while further recommending topics for similar improvement in future efforts to
improve elements of online structure for power systems.
6.3.12 Online state estimation for fault detection and voltage sag
Fault identification and detection is often considered alongside other topics, and while
its importance in power systems is high as a failure to properly address the area can be
detrimental to development, a unique method for detection in estimation provided [81]. This
research is another example of the combined emphasis on estimation and another category,
while estimation and simulations are common areas used in primary research initiatives
attempting to safely examine the potential of some process or element [81]. The researchers
stated that one of the more desirable approaches to voltage sag approximation is an
approximation of the instantaneous voltage, and an approximation of the traditional state amid
the accessibility to redundant data. Meanwhile, the authors proposed approximation of voltages
amid sag performance during a fault, while the topology of the system is shifting across the
fault. As such, the matrix used in assessment must be reconfigured at the fault, and the authors
suggest the use of a reportedly efficient technique for both detecting faults and assessing the
grid topology. The method they present is based on traditional error detection within a grid and
residual assessments [81]. Using an IEEE I4 bus system, the authors prove the effectiveness of
their theory and method, further reporting the significance of various elements in greater detail.
According to their initial discussion, the researchers report “power quality (PQ)
monitoring is necessary to characterize electromagnetic phenomena at a particular location in a
power system [81]. In some cases, the objective of the monitoring is to diagnose power quality
problems, while in other cases, monitoring may be used in planning the installation of power
quality mitigating devices. Economic impacts of power quality problems are significant in
many load centres. In addition to resolving equipment disruption, a database of equipment
tolerances and sensitivities can be developed from monitored data. State Estimation (SE) is one
of the essential functions in Energy Management Systems (EMS)” [81]. The authors further
state that they applied a weighted least square algorithm to solve equations spanning a wide
network, while line currents and bus voltages were selected for linear measurement equations
in voltage approximation. Meanwhile, the automation of substations is considered progress
towards the development of a reliable system capable of ‘healing’ itself, and further reactors to
events with ideal responses in real-time quickly. Such a system is asserted to be cost effective,
and while it has not been possible until the rise of technologies occurring within a few years of

79
the study (communication technology in existence could not appropriately address the demands
of substation automation), there were many areas in need of examination and assessment. At
the time of publication, technology and communication practices had evolved to appropriately
address the demands, with the most beneficial technology including global positioning systems
(GPS), wireless communication, and intelligent electronic devices. This technology would
further serve to reduce complications in monitoring wide areas, implementation in real-time,
and synchronization, while the system can alter some aspects of the measurement matrix
without altering dimensions [81].
Attempting to improve the processes used to locate faults in time domain voltage sag
state approximation, the authors presented a novel and efficient method, ultimately concluding
that their method was successful in generating a unique advantage. In their closing statements,
the authors reported “the current based model allows a linear mapping between the measured
variable and the states to be estimated. Residuals analyses are used to obtain criteria threshold
[81]. The main advantage of the developed method is the fault detection and identification
within just one step time after fault instance. A time-domain measurement model was
considered for the voltage state estimation. The approach was tested on IEEE 14-bus system
[6], [81].
6.3.13 Distribution systems state estimation
It is more common for researchers to analyse estimation in regards to its capacity for an
evaluated method, and while the evaluation of the method is commonly a topic of research, the
previously reviewed authors placed emphasis on fault detection. Other researchers have placed
a greater emphasis on estimation, attempting to improve the nature of existing and future
processes in another manner. A year prior to the previously reviewed analysis, other
researchers studied the deregulation of power systems, the complications in the “operational
philosophy” of distribution, and the potential to change the approach of network operation
[82]. With this, these authors emphasized the potential for change using state estimation,
designing a study aimed at discovering techniques for optimizing distribution [82]. The authors
pointed out that, existing networks were passive by nature, and therefore, could only handle a
limited amount of the total capacity for distributed generation. Thus, future developments
should emphasize additional network restructuring capable of handling a rising amount of
distributed generation. A combination of evolved technologies and techniques were
recommended to accomplish such a feat. One possibility for improvement was a new approach
80
to general network operation, and improving controls, but this alternative could not
appropriately address the entirety of the realized (and assumedly surmountable) challenges.
Additionally, the authors recommended creatively engineered network structure housing these
controls, integrating software functions such as optimized power flow and state estimation into
the network’s control hub, and custom sensor placement for each network. Despite the
commonality of state estimation as a method used in systems analysis in general, such an
integral yet custom role was stressed, as was the recognition of differences between
transmission and distribution networks (especially in terms of topology and quantity of
available network measurements). With this, it is accepted that the state estimation methods
used for transmission systems are perceived as weak when related to the dynamics of
distribution. The authors state “the potential benefits of using SE technologies in distribution
network control have not been explored mainly because of the absence of adequate network
measurements and also the lack of rigorous methodology and tools that could be applied on
restricted measurements”. The development of new distribution system state estimation
(DSSE) is a challenging task as the tools to evaluate the quality of SE must consider a number
of issues relating to measurement types, locations and numbers” [6], [82].
Concluding, the authors write that the performance assessment of state estimation
methodologies prove that all methods ideal for transmission systems can be applied to
transmission systems, while effective estimation demands major changes to the algorithms.
Knowledge of noise traits improve the potential of effectiveness in development, while
changes to existing methods demand detailed statistical modelling amid a scarcity of relevant
measurements [82].
6.3.14 Improved power state estimation based on rectangular coordinates
Estimation also analysed, but focused on the evolution of the equivalent current
measurement model, use of rectangular coordinate state variables, and bus voltage phasors
[83]. Combining these elements, a new estimation technique is presented, while power
assessments, the magnitude of voltage, and approximations of voltage buses are utilized in
attempt to discern equivalent current phasor data. Through the presented approach, the authors
point out that a formula for assessment is generated through a constant gain matrix and
iterative computation [83]. Meanwhile, the authors propose simulations on IEEE systems
(specifically, 14, 30, and 57-bus for numerical simulations) using these methods. The study

81
was able to successfully generate unique data in these areas, and this data was further
compared to techniques applying polar forms of data to standard processes.
Generally, the study proved that the newer method demanded less time for
computation, which is especially beneficial when applied across a large power system, while
the study made many more specific revelations as well. Firstly, it was proven that the state
estimation model can be used in linear measurement, by using bus voltages as state variables
and converting power data to current data. As the authors point out, the gain matrix is treated
as a constant in this case, and further affects the Jacobian matrix assessment; the benefits were
observable across each of the three IEEE systems listed above, implying that similar benefits
are obtainable in real-time applications using FACTS devices [6], [83]. This research initiative
combined multiple aspects of theory and assessment in a way which further demonstrates the
value of estimation, reducing computation time, and improving processes.
6.3.15 Dynamic equivalents of power systems with online measurements
While internet technology is among the more recent of technologies evolving in the
history of power systems, online systems have provided recent enhancements to operations,
and the technology continues to provide new functions and potential for future development.
The ability for microcomputer equipment to measure and identify elements examined in online
systems, and the researchers used this equipment across a range of field tests [84]. Applying
the generated data to a dynamic response simulation, stability limit calculation, and comparing
to existing data, the researchers were able to generate a range of unique results and meaningful
analyses [84]. The final validation of dynamic equivalent (DE) had been utilized to generate
and apply equal parameters to practical stability analyses. The equivalent parameters located
and applied to the stability analysis and simulations, and the research concluded that the model
was efficient and effective [84]. More specifically, they concluded that the equivalent and
standard model do not show differences across ICTs, that the equivalent and standard models
are close to each other and to existing values across the dynamic responses. There is also more
influence on inter-area stability than intra-area stability for the equivalent parameters, and that
their equivalent model requires less than 50 percent of the CPU time (also compared to the
standard model). This study provided a useful methodology and structure for optimized and
organized online system elements, while the continued analyses and technological
developments continued to facilitate this progressive development of efficiency and
effectiveness [6], [84].
82
6.3.16 Online collaborative voltage stability control of power systems
Five years would pass between the work of [84] and the beginning of research
conducted in [85], while both applications and technology had evolved considerably over this
time. Collaborative voltage stability control was examined in online systems, aiming to analyse
effective methodologies for performance enhancement, efficiency, addressing operational
uncertainty, voltage stability, information exchange, error-tolerant communication, and the
deployment of multi-agent systems. The authors presented a framework for integrating power
system controllers in online systems in a manner which facilitates benefits in the
aforementioned areas, emphasizing the significance of error-tolerant communication and
deploying multi-agent systems. The authors further provide results for their study of voltage
stability within a New England power system (comprised of 10 machines and 39 nodes) [80],
[85]. Moreover, a feasibility study provided data regarding a low-probability cascading faults,
while the study overall provided a range of unique information as it expanded the knowledge
base for online technology for power systems at that time.
In presenting their results and providing analytical discussion, the researchers revealed
that the primary contribution of their literature piece stemmed from their feasibility study, as
they defined it as novel concept in online power controls [85]. Beyond this, addressing the
emphasis on collaboration and multi-agent systems, the study proposed an improved error-
tolerant agent communication protocol. It was proposed that this was possible through the use
of an algorithm optimizing information. Additionally, the study proposed the application of the
nesting method of decomposition in graph theory, as this serves to effectively deploy the multi-
agent systems. Moreover, this method serves to safeguard lesser functions surrounding power
loads, which thereby reduces the chance of them collapsing amid cascading faults [85].
The researchers were also able to contribute to existing literature through a range of
recommendations supplementing their descriptions of functionality and output. Asserting that
there are many areas in need of further examination and analysis, the authors recommend that
the practical applications of multi-agent systems, the potential for error or ineffective
operations, and the improvement of control algorithms be considered as prime areas for
enhancement and improved development. While the potential for this technology, related
applications, and the additional developments were proven and outlined, the researcher
recognized that the theory and technology have potential for still further applications and
improved output [85]. As a final recommendation, the authors stated that the area of load
shedding applied to collaborative online control, and the testing of a control algorithm for a

83
larger power system, are areas which would be targeted (by them personally) in future
research. This combination of original information and recommendations thereby assisted the
existing knowledge base in multiple ways, while the growing technological potential of both
power systems and online controls is clearly evident [6], [85].
6.3.17 Online dynamic security assessment for proper power system control
In this research online dynamic security assessment can be used to enhance the real-
time situational awareness for assessing different contingencies [86]. This allows the network
operators to take fast preventive and corrective actions. The research comprised numerous
contingencies, bulk power systems, and different dynamic operating conditions. The online
dynamic security assessment study developed a data mining framework for using decision trees
and a boosting technique [86]. The data mining framework has been processed in different
stages from offline training stage to multiple decision trees built on collected training data, and
an iterative algorithm [86]. The real-time update stage, discussed the decision trees together
with a smooth tracking of the decision changes. Real-time PMUs are used to locate the current
operating conditions into a timely security decisions in the online DSA stage. The authors
claimed that test of the online dynamic analysis on a practical power system proved that the
proposed approach is valid under a variety of realistic operating conditions [6], [86].
6.3.18 Online real-time hardware in the loop optimization using a simulation
More recently, the use of RTDS (Real Time Digital Simulator) has been expanded so
that it can now handle an analysis of nearly any power system [87]. One way in which RTDS
can be expanded is through the use of an optimization enabled electromagnetic transient
simulation technique (OE-EMTP). Initially this technique was used to tune the HVDC control
parameters. It was also used for optimization of the gating sequences in space vector
modulation. The simulations were done for each case application. This meant that multiple
simulations were necessary in most instances. A problem with traditional approaches to
multiple simulations is that they are wasteful. This is true for the common Monte Carlo
simulations. In order to overcome this problem, an optimization algorithm which is nonlinear
can be used to guide the simulation. In this case, existing simulation programs can be used as
objective function evaluators to help with optimizing the algorithm which is being employed.
PSCAD software which is based on ENT-type programming allows for the optimization to be
seamlessly incorporated into the simulations [87].

84
Unfortunately, even with the nonlinear optimization algorithm being used as a guide for
the simulation, the time which is required for the computations increases with the size of the
simulation. This means computational complexity increases with a higher number of iterations.
Furthermore, there can be discrepancies between real-world implementation and model
optimization. This means the conceptual model may be quite different than the real-world
application. The controllers may suffer from parasitic filtering during the analog input and
output stages. Finally, the controller conceptual model will not account for a number of issues
associated with implementation. For example, the conceptual model does not account for
floating-point representation of numbers, no ways, and limits of the signal quality [87].
In order to overcome problems regarding the use of RTDS for multiple simulations of
real-world applications, a new approach was investigated by using OE-EMTP simulations [87].
This technique consists of combining the already existing capabilities for simulation of the
EMT-type programs with optimization algorithms, which are nonlinear. This means that the
EMT type simulation can be used as a way of evaluating the optimization algorithm since it is
not part of the EMT-type simulation program. The optimum which is desired can be achieved
through iterative steps, which are conducted using the optimization algorithm. During each
trial, the parameters are adjusted in the optimization algorithm based on actual outcomes from
prior steps. This is done with the objective of improving the desired outcomes. When the OE-
EMTP technique is used with an EMT program which is off-line; the simulations are limited to
conceptual models. In order to overcome this problem, a real-time simulation must be utilized
as the objective function evaluator. This means that the RTDS is taking the place of the off-line
EMT-program. The RTDS environment evaluates the candidate through the use of an
externally derived nonlinear optimization algorithm in real time. This is more accurate than the
purely conceptual models previously developed [87].
The optimization algorithm which is external uses output derived from the RTDS and
executes the algorithm. This means there is a candidate for subsequent steps. This is done until
the termination criteria for the specific algorithm are met. This is a new approach which offers
at least two benefits. The first benefit is that the amount of time necessary for the optimization
process is substantially reduced. This is due to the real-time execution and evaluation of the
objective function. Another benefit is that the external optimization does not need to be fully
understood. The OE-EMTP technique with an off-line EMT-type program would require

85
complete information regarding the optimization subject. This is not a limitation of the OE-
EMTP when it is combined with the RTDS [6], [87].
6.4 Outcome of Literature Review
The chapter highlighted different FACTS devices including converters, compensators,
advantages and disadvantages and their applications in today’s power industry. The spreading
literature emphasized that with the potential advancement in silicon carbide-SiC technology,
many new power electronics applications would become techno-economically feasible. The
analysis inspected that any utility when considering FACTS shall compare the various devices
available, study and their design aspects for the best utilisation and optimum performance.
Different design aspects can reviewed for use with FACTS in any utility. Transmission
companies around the globe have increased their installations in the past few years of FACTS,
and there are still far more orders of SVC, STATCOM and HVDC. There are still fewer than
20 TCSC’s installed by different utilities [16].
The review of literature surveyed by the thesis showed that, the technology of power
electronics (FACTS, HVDC, custom power devices) is moving fast. Some technologies
outdated, even in a shorter time of less than 3-4 years when some of the authors’ research
papers were published [16]. For example, the design technologies discussed in Appendix-D for
FACTS and customs power devices, such as direct and indirect controls are now obsolete and
nobody uses this in new installations any more [4], [16]. As a critique and update to [16], the
discussed technology is outdated, since there are existing converters using this, but it will not
appear in the design of new FACTS devices. This extreme and aggressive development in this
power technology would necessitate that the experts and engineers in this field shall keep
abreast with its development on a daily basis.
Next chapter, exhibits more details in the case studies exploring different scenarios of
online control that can be used with online power electronics devices.
86
Chapter 7: Case Studies: Power Electronics Applications in QPTS
This chapter is explaining the applied research initiative to fetch new solutions for
QPTS challenges using online power electronics. Various studies were investigated, and this
chapter describes three research case studies conducted on QPTS. The first case study covers
the steady state power flow analysis carried out on the network revealing the impact of FACTS
devices [2]. The second case study further analyses the steady state and dynamic responses of
the QPTS with STATCOM device [1]. In the third case study HVDC transmission is modelled
in the QPTS and the steady state and dynamic behaviour of the network are compared between
HVDC, STATCOM and capacitor banks. The entire steady state and dynamic models for
QPTS created in this research were using the Siemens PTI’s PSS®E program [88]. The
executive results of these case studies are published in the thesis’s papers [1], [2], [3], [4], [5].
7.1 Case Study One-Voltage and Power Flow Control with FACTS in QPTS
7.1.1 Objective
The objective of this case study is to investigate the potential benefits of implementing
dynamic control of voltages, power flows in QPTS. The planning strategy is to explore mid-
term advanced solutions such as FACTS, HVDC, PVs, energy storage systems (ESS), and
other renewable resources together with the present conventional practices, which are facing
challenges in getting new rights of ways for new overhead lines and cables’ corridors. The
control of power flows and the voltage profiles in certain areas are the main concerns in the
long term plan for the transmission power network. This section outlines the actual case studies
and scenarios of voltage and power flow control conducted in the QPTS. The section also
provides recommendations and conclusions for implementation.
7.1.2 The solutions
The planning and operational solutions considered are comprised of conventional
transmission expansion options including conductor up-rating and fixed series capacitors
(FSC). Non-conventional and innovative means of dynamic control of power flows and
voltages are also considered. For example, FACTS devices, such as TCSC and GUPFC, are
considered. These devices are modelled, tested and verified for power flow control and voltage

87
support in interconnected overhead lines feeding the same industrial area with different ratings
and lengths. Comparison with other FACTS technologies such as SVC is also presented. The
analysis assessed the potential to improve power flow imbalance between transmission lines
and the voltage profile to enhance the network security and reliability for important industrial
customers. Optimization techniques for the FACTS devices allocation and rating considering
the voltage improvement and optimal power flow control are studied in general.
7.1.3 Simulation of the case study scenarios
To implement the discussed solutions, the following case study scenarios were
conducted in this planning project. The case studies simulated can be summarized as follows:-
Case-1) Upgrade of the under-rated 132 kV overhead lines
Case-2) Upgrade of the under-rated 132 kV overhead lines and use of TCSC
Case-3) Upgrade of the under-rated 132 kV overhead lines and use of SVC
Case-4) Upgrade of the under-rated 132 kV overhead lines and use of GUPFC
The four case study scenarios were modelled, and analysed using the PSS®E program [88].
7.1.4 Power flow contingencies
As has been described before, there is a potential power flow imbalance between the
two 132 kV overhead lines (OHLs) feeding Dukhan and Umm Bab industrial areas from
different network sources. Refer to Figures in next section to see an indication of the potential
imbalance and voltage profile concerns.
The power flow results for one contingency condition (switch-off the OHL between Al
S’halah and GCC substations) are shown in Figure 17 for the year 2015 model. As it can be
seen, the power flows and the bus voltages are within the acceptable limits. There is 80%
loading on Al S’halah-GCC OHL (within the limit), while the line voltage is maintained within
the allowable range +/- 5% [10].

88
Figure 17: Contingency power flow case N-1 @ Al S’halah-GCC (2015 model)
When the area load is increased by 110 MW (at Umm Bab substation), anticipating the
load growth beyond 2015 the lines exhibited appreciable loading and the imbalance between
the two sources. This is evident at Figure 18, leading to violation of N-1 (73% loading) and
voltage criteria in normal situation.
The loadings and voltage values for these cases (and for the cases to come) are shown
in Tables I –III and IV- VI, respectively, placed at the end of all scenarios in this chapter.

89
Figure 18: Normal case with increased load by 110 MW
Two N-1 contingencies, line switch-off with load increase, are shown in Figure 19.
There is an evidence of violating N-1 criteria loading to 144% on Al S’halah-GCC OHL, and
serious voltage violation with some buses drop to -12% or 0.88 pu [2].

90
Figure 19: Contingency case - Al S’halah-GCC with increased load by 110 MW
To cope with this situation and to come up with an appropriate solution, different load
balancing and voltage improvement techniques, are studied as discussed earlier and described
in the next sections.
7.1.5 Application of different system improvement techniques
7.1.5.1 Uprating of the existing OHL capacity
Since there are restrictions to install new OHLs, one of the obvious conventional
solutions is to up-rate the capacity of the under-rated 132 kV OHLs from 133 MVA to 265
MVA. In 2007-08, the Kahramaa decided to use ACCC (Alloy Composite Core Conductor) as
a pilot project to upgrade part of the Al S’halah-GCC OHL 132 kV OHL to replace the existing
ACSR conductor. By doing this, the OHL capacity was increased from 133 MVA to 265 MVA
and the new ACCC conductors were installed and commissioned in 2012. ACCC conductor
has high-strength and low-sag characteristics, which combined with its high-efficiency and
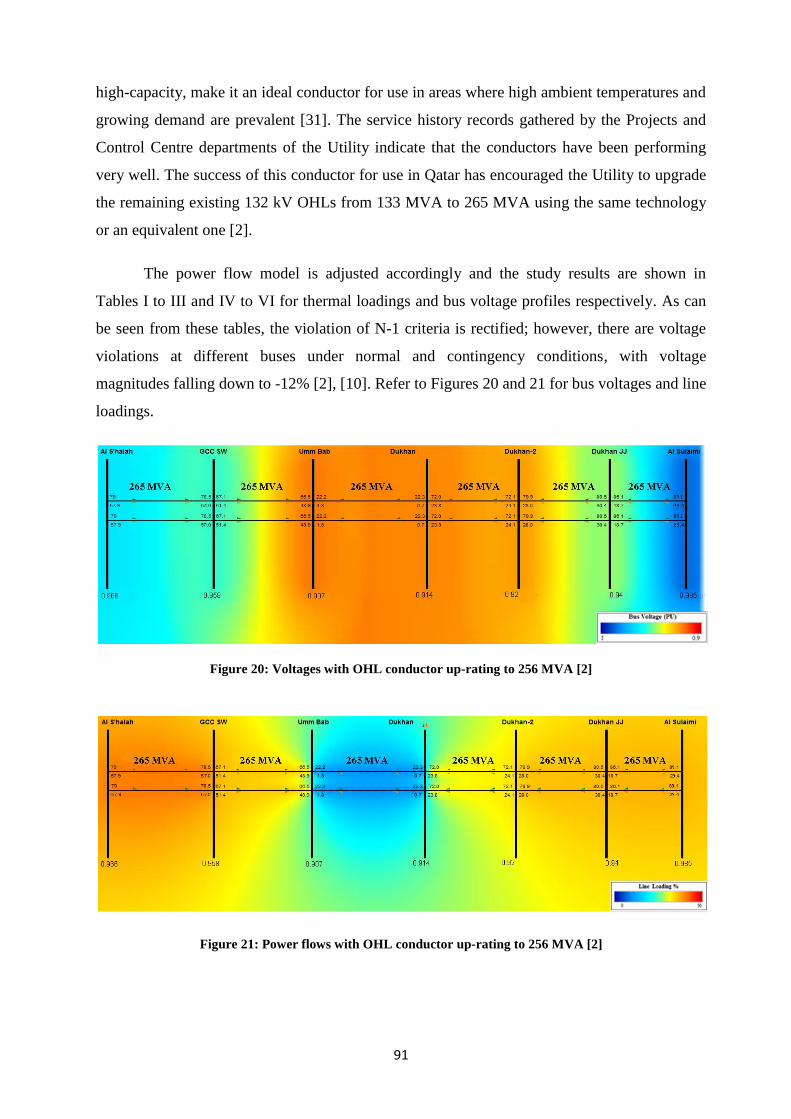
91
high-capacity, make it an ideal conductor for use in areas where high ambient temperatures and
growing demand are prevalent [31]. The service history records gathered by the Projects and
Control Centre departments of the Utility indicate that the conductors have been performing
very well. The success of this conductor for use in Qatar has encouraged the Utility to upgrade
the remaining existing 132 kV OHLs from 133 MVA to 265 MVA using the same technology
or an equivalent one [2].
The power flow model is adjusted accordingly and the study results are shown in
Tables I to III and IV to VI for thermal loadings and bus voltage profiles respectively. As can
be seen from these tables, the violation of N-1 criteria is rectified; however, there are voltage
violations at different buses under normal and contingency conditions, with voltage
magnitudes falling down to -12% [2], [10]. Refer to Figures 20 and 21 for bus voltages and line
loadings.
Figure 20: Voltages with OHL conductor up-rating to 256 MVA [2]
Figure 21: Power flows with OHL conductor up-rating to 256 MVA [2]

92
7.1.5.2 Using SVC in addition to OHL uprating
These voltage violations indicate that OHL up-rating alone would not solve the problem
and some sort of reactive support, either fixed or dynamic, would be required to adequately
resolve the problem. The overhead lines reconductoring is further supported by adding a SVC
at Dukhan bus to provide dynamic voltage support. The voltage profile has improved in the
area to the satisfaction of the transmission code voltage criteria. The colour coding is still
showing high loading in the shorter lines from Al S’halah to GCC and Umm Bab, due to flow
imbalance. Refer to Figure 22 and Tables IV to VI.
Figure 22: Power flows and voltages with conductor up-rating plus SVC [2]
7.1.5.3 Series Compensation (Fixed Series Capacitor- FSC)
To increase the power flow from the power stations in the Ras Laffan area, the OHLs
between Al-Sulaimi to Dukhan JJ are series compensated using fixed capacitors. The line is
compensated for 50% to avoid any probable risk of sub synchronous resonant- SSR. This is the
longest section of the OHL from the Ras Laffan side and is selected to have a maximum impact
of the series compensation.
The study results of this option for normal and contingency conditions are also shown
in Tables I and VI. The results show how this solution slightly improved the voltage profile as
compared to the conventional solution, but the Umm Bab busbar has seen a voltage of about
92.5% violating -5% voltage criteria. In addition, there is still voltage and loading violation
(106.6% loading) following N-1 contingencies .Therefore, this solution option did not resolve
the problem adequately.

93
7.1.5.4 Series Compensation (Thyristor Control Series Capacitor- TCSC)
The same scenario is repeated with 50% FSC, and 20% TCSC compensation. The N-1
loading violation has improved slightly from 106.6% to 103.8%; however some busbar are still
exhibiting out of Code’s limit values for voltages such as 0.93 at Umm Bab substation and
0.945 pu and Dukhan substation (Figure 23).
Figure 23: Power flows and voltages with series compensation using FSC and TCSC [2]
The simple mathematical equations explained in Chapter 4 “Compensation from FACTS
and non-FACTS Devices” demonstrate how the series and shunt compensations work in real
applications. More versatile FACTS devices need to be tested to compensate for both active
and reactive power for further improvement.
7.1.5.5 Generalized Unified Power Flow Controller - GUPFC
The power flow model is modified with the GUPFC, which has each converter rated as
100 MW, 50 MVAr. Different locations for the installation of this device are studied and the
results are summarized in the Tables I to VI. The results of location-4 are shown in Figure 24.
Figure 24: Power flows and voltages with GUPFC-Location-4, (100 MW, 50 MVAr) [2]

94
It is interesting to note that different locations give different performances in respect of
voltage profiles and line loadings. It is found that the best location for the installation of
GUPFC is at Dukhan. This location has not only improved the voltage profile of the network
but also brought the line loading of Al-Shalah to Umm Bab line to within the limits under
normal and contingency conditions. The location for this GUPFC is optimized using load flow
scenarios investigated at the different four locations Al Sulami- Dukhan Jn, Dukhan Jn–
Dukhan-2, Dukhan-2 – Dukhan, and Dukhan- Umm Bab. However, using a 100 MW, 50
MVAr GUPFC slightly overloaded the Al Sulami-Dukhan Jn line under the parallel circuit out
condition, indicating that the rating of GUPFC needs also to be optimized. Critical contingency
cases are carried out, particularly by switching off the OHLs Al S’halah-GCC and Al Sulami –
Dukhan Jn. using the power flow model the GUPFC, each converter rated as 50 MW, 50
MVAr at location-4 (Figure 25).
Figure 25: Power flows and voltages with GUPFC-Location-4, (50 MW, 50 MVAr) [2]
7.1.5.6 Optimal GUPFC allocation technique using software simulation
Using PSS®E [88], Power Voltage Curves (PV) and Reactive Voltage Curves (QV)
analyses were performed to determine the optimal size of the GUPFC. The proper sizing of the
GUPFC device is very important because low voltage is a major issue at Dukhan 132 KV bus
and vicinity. These two analyses (PV and QV) are widely performed to determine the networks
vulnerability to voltage instability and voltage collapse in order to properly size HVDC and
FACTS devices. The PV and QV analyses assessed the voltage variation with active and
reactive power change. The PV curve is a representation of voltage change as a result of
increase in active power transfer between two systems and the QV curve is a representation of
reactive power demand by a bus or buses as voltage level changes.

95
In PV analysis, PSS®E uses one power flow case to automatically create several power
flow cases in the engine by gradually increasing the power transfer from one system to another
with a user specified MW increment. As power transfer is increased, voltage decreases at the
buses on or near the transfer path. The transfer capacity where the voltage reaches the low
voltage criterion defined by the user is the low voltage transfer limit. The power transfer can
still continue until the solution identifies a condition of voltage collapse. This transfer limit is
the voltage collapse transfer limit. The PV analysis is used to determine the amount of MW
power that the GUPFC can supply to the load at Umm Bab reliably.
In QV analysis, PSS®E creates the QV curve through a series of AC power flow
calculations. By starting with the existing reactive loading at a bus, the voltage at the bus is
calculated for a series of power flow as the reactive load is increased in steps until the power
flow demonstrates convergence problems as the system approaches the voltage collapse point.
The user can also specify a particular voltage or voltage range at a bus for the program to
determine the minimum reactive power compensation required to keep the bus at the specified
voltage levels or ranges. The output of the QV analysis is the QV curve, which is typically a
convex curve. The bottom of the curve represents the voltage stability limit that is reactive
power value at the bottom of the curve, is the minimum reactive compensation needed. At
bottom of the curve, the change in reactive power with respect to voltage is zero. In other
words, the derivative is zero. To the right of the bottom of the curve, where an increase in
reactive power results to an increase of voltage, is the stable operating point. To the left of the
bottom of the curve, where an increase in reactive power results to a decrease in voltage, is the
unstable operating point.
Since the transfer of power reduces the system bus voltages, QV analysis was first
performed to determine the reactive power need at Dukhan, and then PV analysis was
performed with the determined reactive power size modelled at Dukhan. Figure 26 below
shows the minimum amount of reactive power needed at Dukhan without any contingencies to
keep its voltage at a minimum of 0.95 pu.

96
Figure 26: Reactive power sizing at Dukhan in system intact condition (PSS®E 2017/18 model)
The Figure above shows that the minimum reactive power needed at Dukhan without
any contingency is about 52 MVAr.
Figure 27 below shows the minimum reactive power needed to keep the bus voltages at
Dukhan and vicinity within ± 10% of 1 pu voltage following the loss of a single circuit
contingency.
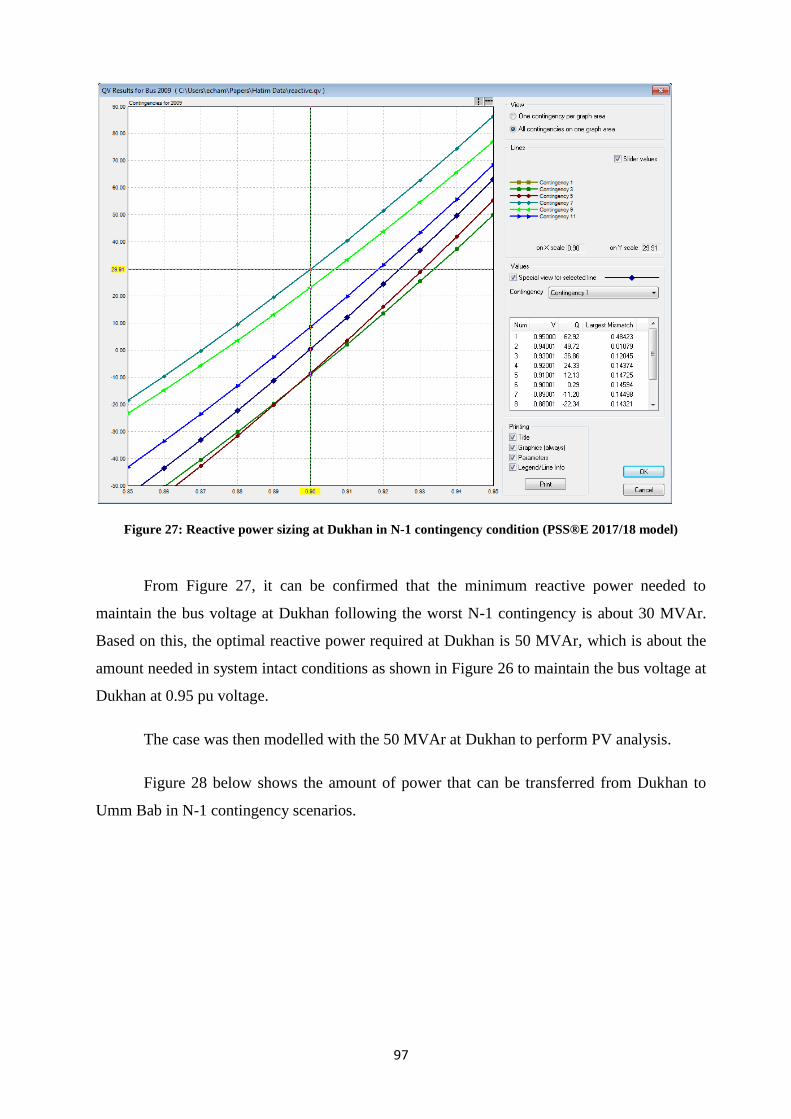
97
Figure 27: Reactive power sizing at Dukhan in N-1 contingency condition (PSS®E 2017/18 model)
From Figure 27, it can be confirmed that the minimum reactive power needed to
maintain the bus voltage at Dukhan following the worst N-1 contingency is about 30 MVAr.
Based on this, the optimal reactive power required at Dukhan is 50 MVAr, which is about the
amount needed in system intact conditions as shown in Figure 26 to maintain the bus voltage at
Dukhan at 0.95 pu voltage.
The case was then modelled with the 50 MVAr at Dukhan to perform PV analysis.
Figure 28 below shows the amount of power that can be transferred from Dukhan to
Umm Bab in N-1 contingency scenarios.

98
Figure 28: Power transfer from Dukhan to Umm Bab in N-1 contingency condition (PSS®E 2017/18 model)
From Figure 28 above, it can be shown that for the worst contingency, the minimum
amount of power that can be transferred is about 50 MW. This transfer level happens when the
bus voltage at Dukhan is above 0.89 pu but below 0.9 pu voltage. This difference in voltage
from 0.9 pu is insignificant, so it is therefore assumed that the maximum amount of power that
can be transferred from Dukhan to Umm Bab in N-1 contingency scenario is 50 MW.
Accordingly, from the QV and PV analyses, it was determined that the optimal size of
the GUPFC should be about 50 MW, 50 MVAr. From the research in the published papers, this
approach has not appeared from others in the published literature, and is a new contribution of
this work. In this dissertation the approach is described in detail rather than just presenting
results. The results found were very satisfactory under normal and contingency conditions as
listed in Tables I-IV and depicted in power flow plots at Figures 29-31
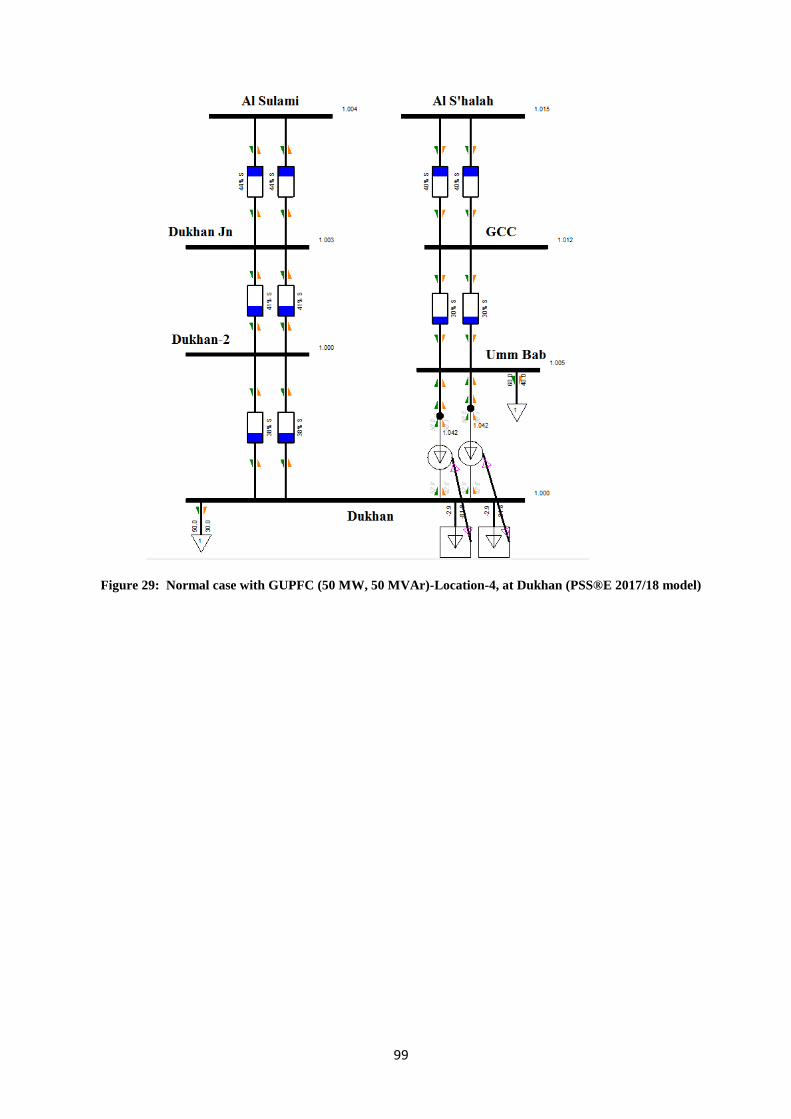
99
Figure 29: Normal case with GUPFC (50 MW, 50 MVAr)-Location-4, at Dukhan (PSS®E 2017/18 model)

100
Figure 30: GUPFC (50 MW, 50 MVAr)-Location-4, at Dukhan (towards Umm Bab)- N-1 at S’halah – GCC

101
Figure 31: GUPFC (50 MW, 50 MVAr)-Location-4, at Dukhan, N-1 at Sulami – Dukhan Jn
Figure 32 shows the contingency when losing one series converter from the GUPFC.
As can be seen the power flow is well shared between the two 132 kV OHLs forming the ring.
The other series converter of the GUPFC simply operates as a SSSC. It is worth noting that this
would be the normal response to this contingency, so the system would still have dynamic
series compensation on one line and it is connected to the same bus [2].

102
Figure 32: GUPFC (50 MW, 50 MVAr)-Location-4, at Dukhan, losing one converter of the GUPFC
7.1.6 Analysis of the case study
The analysis performed on QPTS 2015 model showed that the power flows and the bus
voltages are within the acceptable limits on the two OHLs (from different sources) feeding the
industrial area under study. When the load is increased by 110 MW anticipating conservative
load growth in the area beyond 2015, the lines exhibited appreciable loading and the imbalance
between the two sources occurred, leading to N-1 loading and voltage violations following the
contingencies (Figure 33). The reference in the below figure is the line loading in normal
operation and several contingencies, while the voltage values are inserted in the top of the bar
without reference [2].
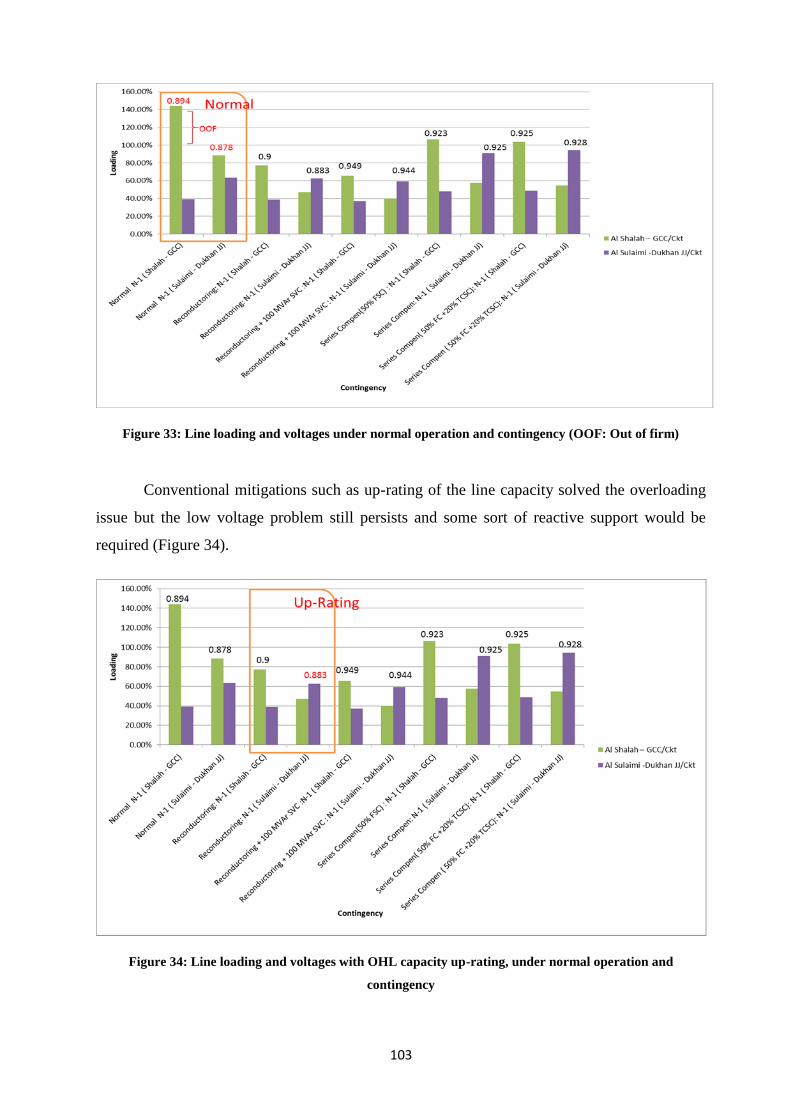
103
Figure 33: Line loading and voltages under normal operation and contingency (OOF: Out of firm)
Conventional mitigations such as up-rating of the line capacity solved the overloading
issue but the low voltage problem still persists and some sort of reactive support would be
required (Figure 34).
Figure 34: Line loading and voltages with OHL capacity up-rating, under normal operation and
contingency

104
Use of a 100-150 MVAr SVC in the area in addition to conductor up-rating shows
sufficient improvement in the network voltage profile, and this combination seems a feasible
solution to resolve the problem (Figure 35). However, a STATCOM has better performance
compared to a SVC, as it takes less space and produces more reactive output in low voltage
conditions but is more expensive. The STATCOM is not modelled in this steady state study
case, assuming that the shunt converter in the software is mainly for controlling the MVAr
power at the bus. However the STATCOM is modelled in the dynamic case studies that will
follow in this chapter.
Figure 35: Line loadings and voltages with OHL up-rating plus SVC. Normal operation and contingency
Series compensation of the longest segment of the OHL is also studied to balance the
power flow from the two sources, however, it is revealed that even with 70% of SC (50 % FSC
+ 20% TCSC) the overloading and low voltage problems are not fully resolved (Figures 36 and
37).

105
Figure 36: Line loadings and voltages with OHL up-rating plus FSC (50%)
Figure 37: Line loadings and voltages with OHL capacity up-rating plus 70% SC (FSC 50%+TCSC 20%)

106
A GUPFC with a rating of 100 MW and 50 MVAr was tested in four locations to
inspect the impact on power flows and voltages as shown in Figures 38-41. The network
performance is improved considerably with the use of the GUPFC device with rating of 50
MW and 50 MVAr (Figure 42). This GUPFC rating is considered the optimum rating
compared to the results achieved from the QV, PV analysis conducted using the PSS®E
software. Further the installation location for the GUPFC is optimized using power flow
simulations. It is found that the best location for the installation of GUPFC is at Dukhan which
has improved both the network voltage profile and the line loading of Al-Shalah to Umm Bab
line to within the limits under normal and contingency conditions. Also the power flow
imbalance is improved and the load is shared well between the two 132 kV OHLs forming the
ring (Figures 38-42).
Figure 38: Line loadings and voltages with OHL up-rating plus GUPFC at location-1 (100 MW, 50 MVAr)
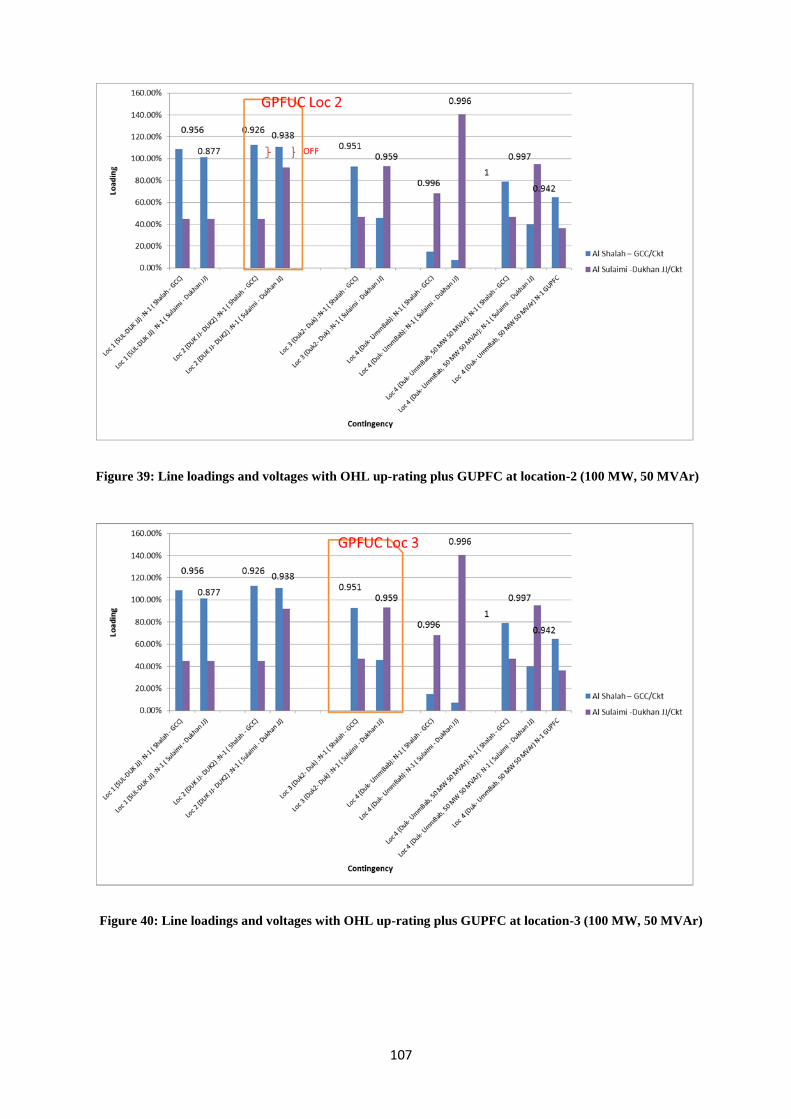
107
Figure 39: Line loadings and voltages with OHL up-rating plus GUPFC at location-2 (100 MW, 50 MVAr)
Figure 40: Line loadings and voltages with OHL up-rating plus GUPFC at location-3 (100 MW, 50 MVAr)

108
Figure 41: Line loadings and voltages with OHL up-rating plus GUPFC at location-4 (100 MW, 50 MVAr)
The selection of the 50 MW/50MVAr rating is found to be the optimal allocation for
GUPFC from different combination of active and reactive power ratings. The applied research
technique using Siemens PTI’s PSS®E software simulation is unique to this dissertation
(Figure 42). The PV and QV curves performed earlier in this chapter determine the optimal
size of the GUPFC using more scientific calculation.
Figure 42 shows the results of this optimal allocation for GUPFC [2].

109
Figure 42: Line loading and voltages with OHL up-rating plus GUPFC at Location-4 (50 MW, 50 MVAr)
7.1.7 Concluding remarks
The two feasible options studied, i.e., reconductoring of the line with SVC and the use
of GUPFC, need to be further complemented with dynamic and transient analysis to investigate
their performance along with cost assessment. Also a business case report shall be prepared for
this case study to provide a more techno-economic value to the results achieved. The report
will assist QPTS with decision making with regard to investment in such new online power
flow and voltage controls. This is a future work; however the dynamic model for the
STATCOM is studied in the next section. Their recommendations and conclusions provide a
solid argument for the rationalization of integration (in terms of benefit and potential). The
studies suggest that GUPFC is a viable solution to alleviate the power flow constraints faced in
the western region by increasing transfer from the north. The optimal allocation and selection
of GUPFC ratings discussed in this case study chapter is a simulation technique using the
PSS®E software [88]. The PV and QV analyses with voltage restriction and FACTS modelling
appear to be rarely used in other applied research literature. The PV, QV explanation for this
optimization may be well researched against the other known allocation theoretical techniques
algorithms. The loading and voltage values are also shown in Tables I-VI.

110
Table I: Power flows results, OHLs reconductoring, 2015-2016 models [2]
Study Cases
Al Shalah – GCC/Ckt Sulami -Dukhan JJ/Ckt
MW MVAr Loading MW MVAr Loading
1.0 Normal (2016) 44.7 31.1 40.9% 66.1 4.8 26.5%
N-1 (Shalah - GCC) 87 61.2 80.0% 67.5 6.4 27.1%
N-1 (Sulami - Dukhan JJ) 57.4 33.2 49.9% 107.5 13.8 43.4%
2.0 Normal, 110 MW load increase 78.6 57.8 73.4% 89.7 30.6 37.9%
N-1 (Shalah - GCC) 153.5 115.2 144.3% 92.1 34.2 39.3%
N-1 (Sulami - Dukhan JJ) 96.6 67.2 88.5% 145.9 62.3 63.5%
3.0 Reconductoring ) 79 57.9 39.2% 89.1 29.4 37.5%
N-1 (Shalah - GCC) 154.8 116 77.4% 91 31.9 38.6%
N-1 (Sulami - Dukhan JJ) 96.9 67 47.1% 144.6 59.9 62.6%
3.1 Reconductoring + SVC 76.7 31.8 33.2% 90.7 0.7 36.3%
N-1 (Shalah - GCC) 150.6 64.6 65.5% 92.6 2.4 37.1%
N-1 (Sulami - Dukhan JJ) 94.2 34.3 40.1% 147.8 11.6 59.3%
Table II: Power flows results- FSC and TCSC, 2015-2016 models [2]
Study Cases
Al Shalah – GCC/Ckt Sulami -Dukhan JJ/Ckt
MW MVAr Loading MW MVAr Loading
4.0 Series Compensation (50% FSC) 53.9 49.3 54.9% 112.8 30.8 46.8%
N-1 (Shalah - GCC) 104.2 96.1 106.6% 114.8 33.7 47.9%
N-1 (Sulami - Dukhan JJ) 57 50.9 57.5% 219.4 58.8 90.9%
4.1 Series Compensation, FC +TCSC 51.7 49 53.6% 115.5 30.9 47.8%
N-1 (Shalah - GCC) 99.9 95.2 103.8% 117.5 33.9 48.9%
N-1 (Sulami - Dukhan JJ) 52.7 50.2 54.7% 228 60.4 94.3%

111
Table III: Power flows results- GUPFC 2015-2016 models [2]
Study Cases
Al Shalah – GCC/Ckt
Al Sulami -Dukhan
JJ/Ckt
MW MVAr Loading MW MVAr Loading
5.0 GUPFC (100MW, 50 MVAr
each)
5.1 GUPFC Location 1
(Sul-Duk JJ) 66.7 25.4 53.7% 100 50 44.7%
N-1 (Shalah - GCC) 134 54.6 108.8% 100 50 44.7%
N-1 (Sulami - Dukhan JJ) 118.4 64.2 101.3% 100 50 44.7%
5.2 GUPFC Location 2 (Duk JJ-
Duk2) 60.9 41.1 55.2% 111.2 17.6 45.0%
N-1 (Shalah - GCC) 122.3 85.9 112.4% 111.2 17.6 45.0%
N-1 (Sulami - Dukhan JJ) 121.8 82.2 110.5% 222.4 56.5 91.8%
5.3 GUPFC Location 3 (Duk2-
Duk) 52.1 30.5 45.4% 116.4 -11.2 46.8%
N-1 (Shalah - GCC) 104.5 65.4 92.7% 116.4 -11.2 46.8%
N-1 (Sulami - Dukhan JJ) 52.1 31.6 45.8% 232.8 -5.9 93.1%
5.4 GUPFC Location 4 (Duk- Umm
Bab) 2.8 9.2 7.2% 170 -10 68.1%
N-1 (Shalah - GCC) 5.8 18.8 14.8% 170 -10 68.1%
N-1 (Sulami - Dukhan JJ) 2.8 9.2 7.2% 351.4 17.3 140.7%
5.5 GUPFC Location 4 (Duk- Umm
Bab, 50 MW 50 MVAr) 52.1 6.8 39.5% 116.3 -10.9 46.7%
N-1 (Shalah - GCC) 104.1 15 79.1% 116.3 -10.9 46.7%
N-1 (Sulami - Dukhan JJ) 52.2 6.8 39.6% 237.3 -5.1 94.9%
N-1 GUPFC 77.7 36.5 64.5% 90 -10 36.2%

112
Table IV: Busbar voltages, OHLs reconductoring, 2015-2016 models [2]
Study Cases Shalah GCC
Um
Bab Dukhan
Dukhan
JJ Sulami
1.0 Normal (2016) 0.995 0.988 0.964 0.971 0.985 1.001
N-1 (Shalah - GCC) 0.995 0.982 0.959 0.968 0.982 1.000
N-1 (Sulami - Dukhan JJ) 0.991 0.983 0.956 0.961 0.973 1.000
2.0 Normal (110 MW increased
load) 0.966 0.954 0.904 0.912 0.938 0.984
N-1 (Shalah - GCC) 0.967 0.942 0.894 0.903 0.932 0.982
N-1 (Sulami - Dukhan JJ) 0.953 0.938 0.878 0.88 0.903 0.985
3.0 Reconductoring ) 0.966 0.958 0.907 0.914 0.940 0.985
N-1 (Shalah - GCC) 0.966 0.950 0.900 0.909 0.936 0.983
N-1 (Sulami - Dukhan JJ) 0.953 0.944 0.883 0.884 0.907 0.986
3.1 Reconductoring + 100
MVAr SVC 0.988 0.983 0.953 0.975 0.986 0.999
N-1 ( Shalah - GCC) 0.987 0.978 0.949 0.971 0.983 0.997
N-1 ( Sulami - Dukhan JJ) 0.983 0.978 0.944 0.964 0.973 0.999
Table V: Busbar voltages- FSC and TCSC, 2015-2016 models [2]
Study Cases Shalah GCC
Um
Bab Dukhan
Dukhan
JJ Sulami
4.0 Series Compensation
(50% FSC) 0.979 0.969 0.929 0.944 0.975 0.982
N-1 ( Shalah - GCC) 0.98 0.961 0.923 0.939 0.973 0.979
N-1 ( Sulami - Dukhan JJ) 0.976 0.966 0.925 0.938 0.969 0.982
4.1 Series Compensation
( 50% FC +20% TCSC) 0.979 0.969 0.930 0.945 0.977 0.982
N-1 ( Shalah - GCC) 0.981 0.962 0.925 0.942 0.975 0.98
N-1 ( Sulami - Dukhan JJ) 0.978 0.968 0.928 0.942 0.973 0.982

113
Table VI: Busbar voltages- GUPFC, 2015-2016 models [2]
Study Cases Shalah GCC
Um
Bab Dukhan
Dukhan
JJ Sulami
5.0 GUPFC (100MW, 50 MVAr )
5.1 GUPFC Location -1
(Sul-Duk JJ) 0.995 0.989 0.966 0.993 1.033 1.000
N-1 ( Shalah - GCC) 0.994 0.98 0.956 0.983 1.023 1.000
N-1 ( Sulami - Dukhan JJ) 0.952 0.937 0.877 0.88 0.905 1.000
5.2 GUPFC Location 2 (DUK JJ-
DUK2) 0.982 0.973 0.939 0.957 1.000 1.003
N-1 ( Shalah - GCC) 0.98 0.962 0.926 0.945 1.000 1.003
N-1 ( Sulami - Dukhan JJ) 0.982 0.973 0.938 0.957 1.000 1.000
5.3 GUPFC Location 3 (Duk2-
Duk) 0.992 0.985 0.960 0.984 1.003 1.003
N-1 ( Shalah - GCC) 0.991 0.977 0.951 0.976 1.003 1.003
N-1 (Sulami - Dukhan JJ) 0.992 0.985 0.959 0.984 0.998 0.998
5.4 GUPFC Location 4 (Duk-
Umm Bab) 1.018 1.017 1.016 1.000 0.996 0.997
N-1 (Shalah - GCC) 1.018 1.015 1.014 1.000 0.996 0.997
N-1 ( Sulami - Dukhan JJ) 1.018 1.016 1.015 1.000 0.984 0.985
5.5 GUPFC Location 4 (Duk-
Umm Bab, 50 MW 50 MVAr) 1.015 1.012 1.005 1.000 1.003 1.004
N-1 ( Shalah - GCC) 1.014 1.008 1.001 1.000 1.003 1.004
N-1 ( Sulami - Dukhan JJ) 1.014 1.011 1.004 1.000 0.997 0.998
N-1 GUPFC 0.983 0.975 0.942 1.000 1.005 1.005

114
7.2 Case Study Two-Steady State and Dynamic Analysis of FACTS on QPTS
7.2.1 Introduction
In the previous chapter only the steady state operation of FACTS in QPTS including
the SVC model at Dukhan substation is considered. One of the challenges that face
transmission planners and operators is the steady state and dynamic control of voltage and
power flow. Reference [1] presents the results of a case study conducted to investigate the
performance of fixed capacitors and a STATCOM, in controlling the bus voltages of QPTS,
during a fault. The key comparison is with a STATCOM versus capacitors, not a STATCOM
versus no compensation at all. So the fixed capacitor option is included in the analysis to make
it a realistic comparison, expecting the performance can be corrected to an extent with this
option.
This case study outlines the analysis conducted to inspect the viability of fixed
capacitors and STATCOM in steady state voltage maintenance, as well as in dynamic voltage
recovery following the application of various faults to the system [1]. The SVC and the
STATCOM perform the same basic function of maintaining the bus voltage by controlling the
reactive power at the bus. Therefore the steady state results from STATCOM analysis in this
chapter could be compared with the steady state analysis for the SVC conducted in the
previous chapter.
The PSS®E software is used to model and analyse QPTS in both steady state and
dynamic system studies [88]. The system voltage profile and power flow are basically
influenced by the physical characteristics of the transmission system. The transmission grid can
work smarter if the network physical constraints are countered through the use of smart devices
to control voltage and power flows.
The system bus voltages are also dependent on whether the reactive power
compensation can be injected or drawn locally at the buses or imported from a distance source.
As a result of this relationship, inadequate reactive power in a part of the system could result to
voltage depression of the system’s bus voltages. FACTS can be utilized in the transmission
system to assist in improving the voltage profile for such systems.

115
7.2.2 Power flow imbalance and low voltage
Figure 43 shows the power flow and bus voltage results in normal condition for system
load conditions beyond the year 2015 without any reinforcements.
Figure 43: Normal case without fixed capacitor, STATCOM and without reconductored lines
(PSS®E QPTS Model – Beyond 2015)
As shown in Figure 43, each of the circuits of Al S’halah-GCC 132 kV OHL is loaded
at 82% of its rating in normal condition. The loss of any one of the circuits will result to a
thermal overload of the other circuit [2], [3]. This will result to a violation of N-1 criteria.
Furthermore, Figure 43 shows that some of the bus voltages are below 0.95 pu, which is a
violation of the voltage criteria in normal conditions [10].
7.2.3 Smart power grid in Qatar: Application of STATCOM and composite conductors
The widespread perception in the industry is that smart grid is mostly about the
deployment of smart meters and smart LV applications. A significant part of a smart grid
entails the application of modern technologies in power transmission operation and control. In
fact, the conventional transmission grid can be converted into a smart grid with the application
of FACTS devices. The trait of smart grid is the creation of operating conditions flexible
enough to enable system operators to control the flow of both active and reactive power flows,
and hence the magnitudes of voltage and phase angles, instead of the experiencing undesired

116
power flow loops controlled by the network resistances and reactive impedances [1]. The
evolving smart grids are assumed to continue in their development and capacity, likely
replacing many aspects of existing networks in the future. FACTS devices can serve to provide
a solution to networks that is further conducive to the implementation of wide area control
[22]. Additionally, other technology which can facilitate the implementation of these smart
grids includes energy storage devices capable of assisting in the transmission and distribution
of generated power. There are also smart technologies useful in implementing renewable
energy to power systems, the use of phasor measurement units communicating synchrophasors
data for large scale control and monitoring, and technology facilitating improved online
analyses of grid control and transmission coordination.
7.2.4 Upgrading the overhead lines using composite conductors
Upgrading of the existing OHL from 133 MVA to 265 MVA by reconductoring of the
132 kV lines from Al S’halah –GCC –Umm Bab – Dukhan was discussed in the
reconductoring section of the 132 kV lines [2]. Therefore this study assumes that the
mentioned OHLs have the new rating of 265 MVA in 2015-2017. This is an ideal planning
approach considering the challenges of getting new rights of ways for new overhead lines. It is
worth-mentioning that, although the OHL upgrade has solved the thermal overload issue, it did
not solve the low voltage issue [1], [2]. This study will show how voltages can be depressed at
Dukhan and Umm Bab areas under certain loading conditions and how the installation of a
STATCOM device can improve the voltage profile for these regions.
7.2.5 Capacitor for steady-state voltage control
One of the most feasible options to address the power flow imbalance and low voltage
problems mentioned in the previous section is the installation of a 100 MVA fixed capacitors
or STATCOM device at Dukhan 132 kV bus together with the reconductoring of the
mentioned lines [2]. The basic case is to assess the impact of 100 MVAr capacitors in both the
steady state and dynamic states and then compare the results with the STATCOM
performance. Figure 44 shows the voltage profile and thermal loadings of the lines in normal
condition, following the capacitor installation. From the figure, it is evident that the bus
voltages are within the allowable voltage range of ±5% and that each of the circuits at Al
S’halah-GCC is loaded at less than half of its thermal rating. A loss of any one of the circuits

117
will not result to a thermal violation of the other circuit, thereby maintaining the N-1 criteria
[2], [3].
Figure 44: Normal case with capacitors and reconductored lines (PSS®E QPTS Model – beyond 2015)
7.2.6 STATCOM for steady-state voltage control
The next option is to assess the power flow imbalance and low voltage problems when
a 100 MVA STATCOM device is installed at Dukhan 132 kV bus together with the
reconductoring [2]. Figure 45 shows the voltage profile and thermal loadings of the lines in
normal condition, following the installation of the 100 MVA STATCOM device and the
reconductoring of the mentioned lines. From the figure, the shown bus voltages are within the
allowable voltage range of ±5% [23]. Similar to the capacitor banks response, each of the
circuits at Al S’halah-GCC is loaded at less than half of its thermal rating, maintaining the N-1
criteria [2], [3].
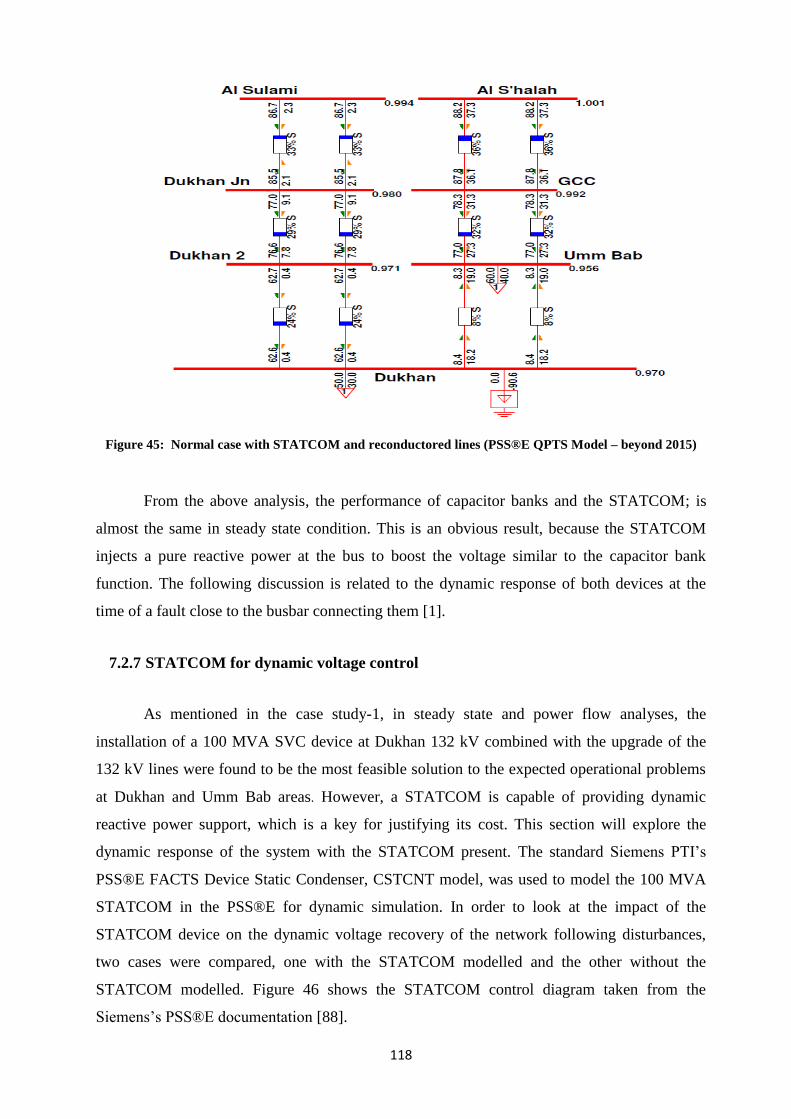
118
Figure 45: Normal case with STATCOM and reconductored lines (PSS®E QPTS Model – beyond 2015)
From the above analysis, the performance of capacitor banks and the STATCOM; is
almost the same in steady state condition. This is an obvious result, because the STATCOM
injects a pure reactive power at the bus to boost the voltage similar to the capacitor bank
function. The following discussion is related to the dynamic response of both devices at the
time of a fault close to the busbar connecting them [1].
7.2.7 STATCOM for dynamic voltage control
As mentioned in the case study-1, in steady state and power flow analyses, the
installation of a 100 MVA SVC device at Dukhan 132 kV combined with the upgrade of the
132 kV lines were found to be the most feasible solution to the expected operational problems
at Dukhan and Umm Bab areas. However, a STATCOM is capable of providing dynamic
reactive power support, which is a key for justifying its cost. This section will explore the
dynamic response of the system with the STATCOM present. The standard Siemens PTI’s
PSS®E FACTS Device Static Condenser, CSTCNT model, was used to model the 100 MVA
STATCOM in the PSS®E for dynamic simulation. In order to look at the impact of the
STATCOM device on the dynamic voltage recovery of the network following disturbances,
two cases were compared, one with the STATCOM modelled and the other without the
STATCOM modelled. Figure 46 shows the STATCOM control diagram taken from the
Siemens’s PSS®E documentation [88].

119
Figure 46: Siemens PTI’s PSS®E STATCOM closed loop control model [88]
The integration step size used for the dynamic simulation was ½ of a cycle (0.01
seconds for a 50 Hz system). Before any of the disturbances were simulated, the dynamic
simulation was run without any disturbances to confirm that the system was in steady state in
initial condition. Figure 47 shows the machine rotor angles of QPTS unit at Ras Laffan power
plant in steady state condition without re-enforcements, with a fixed capacitor at Dukhan 132
kV bus, and with a STATCOM at Dukhan 132 kV bus. Figure 48 shows the voltage profile of
the system at Dukhan and Umm Bab 132 kV bus in steady state condition without re-
enforcements, with a fixed capacitor at Dukhan 132 kV bus, and with a STATCOM at Dukhan
132 kV bus [1], [10].

120
Figure 47: Machine rotor angle (degrees), with STATCOM, and with capacitor in steady state condition
Figure 48: Bus voltages (pu), with STATCOM, and with fixed capacitor in steady state condition

121
The results shown in Figures 47 and 48 confirm that there are no oscillations in steady
state conditions. Figure 48 shows that the bus voltages at Dukhan and Umm Bab 132 kV are
within the allowable voltage range of ±5% in steady state when a STATCOM or a fixed
capacitor is installed at Dukhan 132 kV bus, while outside the range when there are no re-
enforcements [10]. This verifies the results of the previous case study-1. After confirming that
the system is working fine in steady state condition without any disturbances, three
contingencies were simulated to show the response of the system to disturbances and to
compare the performance of the modelled 100 MVA STATCOM device at Dukhan 132 kV bus
to that of the 100 MVAr fixed capacitor modelled at Dukhan 132 kV bus and to that of the case
without any re-enforcement. These dynamic simulations were performed with a 0.1 second
steady state period followed by the application of the appropriate disturbance. The
contingencies simulated are:
1. Three phase fault at Dukhan 132 kV bus (Contingency-1), cleared in 9 cycles (0.18
seconds).
2. Three phase fault at Al Sulami 132 kV bus at one of the 132 kV line end of Al Sulami –
Dukhan Jn. (Contingency-2), cleared in 9 cycles by disconnecting one of the circuits
between Al Sulami – Dukhan Jn 132 kV.
3. Three phase fault at Al S’halah 132 kV bus at one of the line ends of Al S’halah – GCC
132 kV line (Contingency-3), cleared in 9 cycles by disconnecting one of the 132 kV
circuits between Al S’halah – GCC.
Contingency-1 was simulated because the STATCOM device is modelled at Dukhan
132 kV bus, as such, this fault will have the most impact on the performance of the
STATCOM. Contingencies-2 and 3 were simulated because the mentioned circuits are main
sources of supply from Al Sulami and Al S’halah substations. They were simulated before in
the power flow and steady state analyses of the SVC device in the preceding case study [2].
The STATCOM vendors would design the controls to shutdown the STATCOM for self-
protection for a close-in fault. Any order for a STATCOM would need to specify the ability to
stay on line for a close in three phase fault [16].
Figure 49 shows the rotor angle of QPTS unit at Ras Laffan power plant without re-
enforcement, with a fixed capacitor at Dukhan 132 kV bus, and with a STATCOM at Dukhan
132 kV bus following contingency-1. There is significant acceleration during the fault but the
machines stay in synchronism and the oscillation is damped out after a few seconds. The
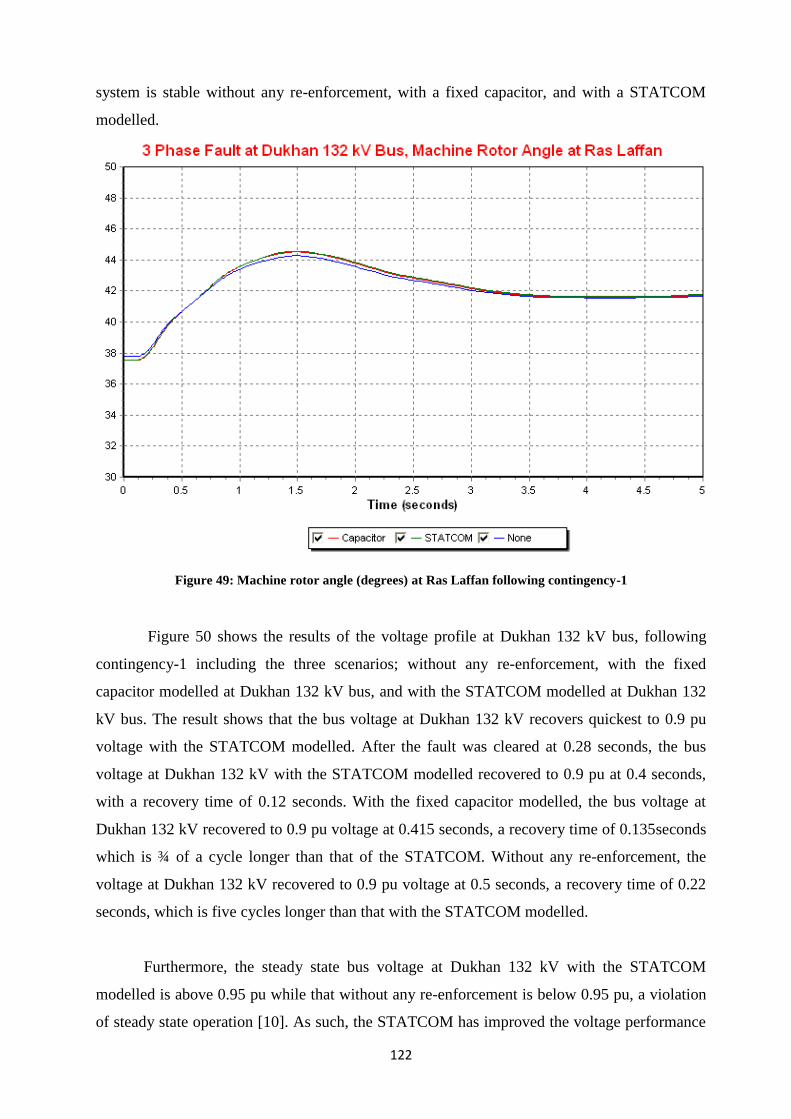
122
system is stable without any re-enforcement, with a fixed capacitor, and with a STATCOM
modelled.
Figure 49: Machine rotor angle (degrees) at Ras Laffan following contingency-1
Figure 50 shows the results of the voltage profile at Dukhan 132 kV bus, following
contingency-1 including the three scenarios; without any re-enforcement, with the fixed
capacitor modelled at Dukhan 132 kV bus, and with the STATCOM modelled at Dukhan 132
kV bus. The result shows that the bus voltage at Dukhan 132 kV recovers quickest to 0.9 pu
voltage with the STATCOM modelled. After the fault was cleared at 0.28 seconds, the bus
voltage at Dukhan 132 kV with the STATCOM modelled recovered to 0.9 pu at 0.4 seconds,
with a recovery time of 0.12 seconds. With the fixed capacitor modelled, the bus voltage at
Dukhan 132 kV recovered to 0.9 pu voltage at 0.415 seconds, a recovery time of 0.135seconds
which is ¾ of a cycle longer than that of the STATCOM. Without any re-enforcement, the
voltage at Dukhan 132 kV recovered to 0.9 pu voltage at 0.5 seconds, a recovery time of 0.22
seconds, which is five cycles longer than that with the STATCOM modelled.
Furthermore, the steady state bus voltage at Dukhan 132 kV with the STATCOM
modelled is above 0.95 pu while that without any re-enforcement is below 0.95 pu, a violation
of steady state operation [10]. As such, the STATCOM has improved the voltage performance

123
of the sub-transmission system. However, the performance of the STATCOM is slightly better
than that of the fixed capacitor. The steady state problem can be solved for far less cost without
a STATCOM, using a capacitor bank, however the main issue remains within the dynamic
voltage support during faults which is addressed in this case study [1], [16].
Figure 50: Voltage profile of Dukhan 132 kV bus following contingency-1
Similar to Figure 49, Figure 51 shows the rotor angles of QPTS unit at Ras Laffan
power plant without any re-enforcement, with a fixed capacitor modelled at Dukhan 132 kV
bus, and with a STATCOM modelled at Dukhan 132 kV bus following contingency-2. As in
Figure 51, there is significant acceleration during the fault but the machines stay in
synchronism and the oscillation is damped out after a few seconds. The system is stable
without any re-enforcement, with a fixed capacitor and with a STATCOM modelled.

124
Figure 51: Machine rotor angle (degrees) at Ras Laffan following contingency-2
Figure 52 shows the voltage performance of Al Sulami 132 kV bus without any re-
enforcement, with a fixed capacitor modelled, and with a STATCOM modelled following
contingency-2. Similar to contingency-1, the voltage profile and recovery after the fault is
cleared, with the STATCOM modelled is almost identical to that with the fixed capacitor. The
voltage profile and recovery after the fault is cleared with the STATCOM modelled is better
than that without any re-enforcement. The impact of the STATCOM on the voltage profile is
less in contingency-2 than in contingency-1 because the fault location in contingency-2 is
electrically farther from the STATCOM than that in contingency-1.

125
Figure 52: Voltage profile of Al Sulami 132 kV bus following contingency-2
Figure 53 shows the rotor angles of QPTS unit at Ras Laffan power plant without any
re-enforcement, with fixed capacitor modelled at Dukhan 132 kV bus, and with the
STATCOM modelled at Dukhan 132 kV bus following contingency-3. As in Figure 51, there
is a significant acceleration during the fault but the machine stay in synchronism and the
oscillation is damped out after a few seconds. The system is stable without any re-
enforcements, with fixed capacitor modelled, and with the STATCOM modelled.

126
Figure 53: Machine rotor angle (degrees) at Ras Laffan following contingency-3
Figure 54 shows the voltage performance of Al S’halah 132 kV bus without any re-
enforcement, with fixed capacitor, and with STATCOM modelled following contingency-3. As
in contingency-2, the STATCOM helped to improve the voltage profile and recovery time
following the disturbance [1]. The STATCOM and the capacitor performances are almost
identical.

127
Figure 54: Voltage pu profile of Al S’halah 132 kV bus following contingency-3
It is important also to look at the current and reactive power output of the STATCOM
to make sure the simulated STATCOM is performing realistically. The current output can only
exceed 110% for a short time (a few cycles) unless the specified in the purchase contract.
Performing a case with fixed capacitors ought to have similar results, but it would address
likely objections to the STATCOM [16].
Therefore STATCOM current is also measured during the course of the three
contingencies as shown in Figure 55. The STATCOM current profile looks different compared
to the voltage profile. In contingency-1, for a fault at Dukhan bus where the STATCOM is
connected, the current dropped when the fault occurred from about 1 pu to zero. When the fault
cleared the current reversed it direction to the value of -1.25 pu and then returned to about 1.2
pu and stayed at value for about 20 ms (1 cycle). They continued on the stable value of about
0.9 pu. In case of the other contingencies (2 and 3, fault at Al Sulami and Al S’halah), the
STATCOM current increased indicating that the STATCOM is feeding the remote fault or
perhaps the load in that remote area. When the fault cleared the STATCOM current for these
two contingencies followed the same pattern as for contingency-1 described above.

128
The reactive power generated by the STATCOM is anticipated to follow the same
voltage pattern, since ‘Q’ is proportional to the ‘V’ [4], [16]. The reactive power for the
STATCOM could also be measured by the PSS®E.
Figure 55: STATCOM current pu profile for the three contingencies
7.2.8 Green benefits of using composite conductors and STATCOM
According to the CTC Global Newsletter [11], the world consumes over 20 trillion kWh
of electricity annually, and more than 1.2 trillion kWh are lost to transmission losses. The
ACCC conductor is one of the smart technologies used to reduce line losses, thereby reduce
electricity costs and decrease emissions [11]. It appears that, Kahramaa is the first utility in the
Middle East to use this type of conductors by replacing the existing conductors in one of its
132 kV OHLs. The ACCR conductor is another technology from 3M, analogous to ACCC that
can be used to achieve the same objectives. These conductors have the ability to reduce line
losses by one-third or more. If these conductor technologies are widely deployed, they could
potentially reduce CO2 emissions by over 290 million metric tons every year [11]. This energy
is equivalent to saving 466 million megawatt hours, which is the generation equivalent of
53,267 megawatts. Considering oil-energy, a Btu conversion rate of 42%, the energy saved
would be equal over 1.9 billion barrels of oil annually [1], [11].
129
In this case study, the injection of 100 MVAr locally by the STATCOM removes the
needs for the same amount of reactive power to flow through the conductors (ACCC or
conventional). The saved capacity in the overhead lines could be used to deliver more active
power and push the conductor to work more towards dynamic level. This means more power
can be delivered from the bulk generation in the North of Qatar to feed loads instead of adding
local generation at the south-west. Also, reactive power flow through the overhead lines
increases line current, and in turn is increasing power losses. Therefore, power losses can be
reduced by providing reactive compensation locally. The reduction of power losses will reduce
the output of power generations, thereby reducing emission [1].
There is an operational practise to optimise active power losses in any transmission
network through generation scheduling. For any system consisting of many plants, there is an
optimum economic operation for any loading condition on the system (Appendix E).
Transmission losses can be made as minimum as possible through the continuous scheduling of
the loads amongst the system plants. One of the old commonly used method for dealing with
losses optimization is the B-coefficients or loss-coefficients method. There are many load flow
solutions usually needed before optimized losses are obtained (Appendix E). Siemens PTI’s
PSS®E software has an Optimal Power Flow function that can optimise the power losses,
along with locations of capacitor banks, etc. The theory of losses optimisation technique is
discussed in Appendix E using the B-coefficient method and A-constants calculations.
7.2.9 STATCOM compensation controlled via synchrophasors
Southern California Edison (SCE) has a practical application where the operation of
SVC is used to control both local and remote busbar voltages by utilising synchrophasor based
voltage measurements [12]. They claimed that SCE project is the first application of closed
loop control of SVC using synchrophasor measurements. The authors also concluded that when
an SVC is coupled with information available from synchrophasor based wide area monitoring;
it can be a very cost effective solution to maintain voltage stability of high voltage transmission
network [12]. The project also recommends the integration with other systems of energy
management and state estimation.

130
The advantage of the synchrophasor technology, is that it can provide synchronized
measured signals to the controllers, time stamped via global positioning system (GPS). This
provides the control systems for FACTS devices, the ability to act on information from remote
buses in addition to local measurements, enhancing the ability to solve system problems
through local actions. The synchrophasor technology is also called synchronized measurement
technology (SMT). This technology has also been tested successfully in an R&D project in
Great Britain, where a wide area monitoring system is applied with three PMUs installed at
three universities [13].
The measurements are compiled by a data concentrator (DC) installed in Slovenia. The
DC acquires data from all PMUs by standard internet communication network. A combination
of both practices from USA and GB can be applied in Qatar to improve the system voltage
profile, with the STATCOM replacing the SVC, and controlled via synchrophasors.
7.2.10 Concluding remarks
The study simulated various fault conditions in the network and analysed how the
STATCOM responds to recover the system voltage after each fault clearance. The study also
highlights how the system performance can be enhanced with a synchrophasor based control
system controlling the STATCOM. The main assumption to the study is the implementation of
a capacity upgrade of existing overhead lines feeding the STATCOM bus by using smart
conductors (ACCC) in 2015-2017. From the power flow and steady-state, the reconductoring
of the 132 kV lines from Al S’halah – GCC-Umm Bab-Dukhan together with the installation of
100 MVA fixed capacitors or 100 MVA STATCOM device at Dukhan 132 kV bus was found
to be one of the most feasible solutions studied so far. The option has solved the 132 kV power
flow imbalance and low voltage issues at Dukhan and Umm Bab areas. Dynamic simulation
analysis was performed to analyse the impact of this solution option on the system’s voltage
performance. The analysis has shown that the fixed capacitors or the STATCOM helped
improve the system’s voltage profile in both steady state and dynamic modes. They have
similar performance; however the STATCOM has a faster response in dynamic. It is
recommended that Kahramaa to follow this case study with more analysis including cost
analysis to decide whether to install the fixed capacitors or STATCOM at Dukhan 132 kV bus
(or at Dukhan-2).

131
For the obvious benefits to the system, the operation performance of the STATCOM
can be further enhanced with its compensation controlled based on voltage measurements from
remote buses via synchrophasors to work in a wide area monitoring and control (WAM, WAC)
modes [1], [12], [13], [26]. The Research Chapter elaborates more on the technology of WAM,
WAC and potential implementation in QPTS.
As noted above, the steady state problem can be solved for far less money without a
STATCOM, however, performing a case with fixed capacitors ought to have similar results,
but it would address likely objections to the STATCOM.
The previous case studies focused on the detailed analysis of the impact of the FACTS
devices (SVC and STATCOM) in QPTS. The next case study will summarize testing carried
out on the impact of HVDC (alone or with STATCOM) in the QPTS.
7.3 Case Study Three-HVDC and STATCOM Performance in QPTS
7.3.1 Introduction
As a follow up to the previous FACTS analysis, this case study compares the operation
performance between HVAC and HVDC. Siemens PTI’s PSS®E software is used in the case
study for modelling of HVDC equipment and also used for the analysis by subjecting QPTS to
different faults types at various locations. The following section gives more details of this case
study.
7.3.2 Modelling and analysing HVDC links in Qatar’s Transmission System
The previous study has concluded that the installation of a 100 MVA STATCOM or
fixed capacitors at Dukhan 132 kV bus will mitigate the low voltage problems in the area [1].
From here on, this report will assume that only a FACTS device (a 100 MVA STATCOM) has
been installed at Dukhan 132 kV bus as part of the re-enforcements.
A traditional solution to mitigate uneven loop flows is to re-dispatch generation or to
upgrade the ratings of the affected transmission lines. However, since there are no local
generation near the Dukhan and Umm Bab areas, the dispatch of remote generation will have
minimal effect, if any, in controlling the flow of power. Furthermore, the upgrade of the lines

132
at Dukhan and Umm Bab will mitigate the thermal overloads in the area but it will not control
the flow of power.
The most effective way to control the flow of power in this scenario would be the
application of an HVDC technology LCC (or classic) versus VSC HVDC. As such, in this
analysis, the double transmission lines from Al S’halah to GCC 132 kV network have been
replaced by two HVDC links, each with a capacity of 130 MW. Replacing the existing
transmission lines with HVDC links will eliminate the need for new right of way for the
HVDC links. Furthermore, an HVDC line of the same rating as the transmission lines, need a
narrower right of way [14].
To transfer the total amount of power from the HVDC links (260 MVA for both links),
the two parallel transmission lines from GCC to Umm Bab 132 kV has been upgraded to 260
MVA. In this case, the loss of one line from GCC to Umm Bab 132 kV will not limit the
transfer of power from the HVDC links in order to avoid thermal loading violations [10]. For
reactive power compensation, about 200 MVAr of capacitor has been installed at the inverter
end of the HVDC links (GCC 132 kV bus). This has further improved the voltage profile in the
area. Most likely the reactive compensation is in the form of harmonic filters if it is LCC
HVDC, however VSC HVDC can supply reactive power and doesn’t need reactive
compensation [16].
Figure 56 shows the power flow and voltage profiles of the Western Ring with re-
enforcements (the addition of HVDC links and STATCOM) in system intact condition for peak
load conditions beyond the year 2015.

133
Figure 56: Normal case with STATCOM and HVDC (PSS®E QPTS model – Beyond 2015)
As shown in Figure 56, each of the circuits of Al S’halah-GCC 132 kV OHL is loaded
at below 50% of its thermal rating in normal condition. The loss of any one of the circuits will
not limit the maximum power transfer of the HVDC links. In addition, there are no voltage
violations in the Western Ring [10].
Dynamic analysis has been performed on the cases with the STATCOM and HVDC
and without the HVDC to determine the impact of the installation of the HVDC lines at Al
S’halah to GCC 132 kV network on QPTS. The analysis has found that the HVDC lines have
no negative impact on the reliability of the grid. Dynamic simulations were performed with a
0.1 second steady state period followed by the application of the appropriate disturbance. The
contingencies simulated are:
1. Three phase fault at Dukhan 132 kV bus (contingency-1), cleared in 9 cycles (0.18
seconds).
2. Three phase fault at Al Sulami 132 kV bus (contingency-2), cleared in 9 cycles.
3. Three phase fault at Al S’halah 132 kV bus (contingency-3), cleared in 9 cycles.

134
Figures 57 to 59 below show the machine rotor angles with the STATCOM modelled
alone and with both the STATCOM and the HVDC modelled following contingencies -1, 2
and 3 respectively.
Figure 57: Machine rotor angles (degrees) following contingency-1
Figure 58: Machine rotor angles (degrees) following contingency-2

135
Figure 59: Machine rotor angles (degrees) following contingency-3
7.3.1 Concluding remarks
From Figures 57 to 59, it can be concluded that the system is transiently stable
following contingencies -1, 2 and 3. Moreover, the machines rotor angles for the case with the
STATCOM modelled alone are practically identical to the case with both the STATCOM and
HVDC modelled. The starting angles before the fault and the final angles after the fault is
cleared are almost the same. For both cases, there is a significant acceleration of the machines
during the fault but the machines stay in synchronism and the oscillation is damped out after a
few seconds. Therefore, the system is stable in both cases. A three phase fault at GCC busbar
(assuming that is the end receiving power on the HVDC and normally open point in the ring)
will be the worst contingency event for the HVDC and will likely cause a commutation failure
[16].
7.4 Conclusions of the three case studies
Static and dynamic models of FACTS devices are developed using PSS®E, the
professional verified power system analysis software. Time-domain simulations are performed
for the developed dynamic models of STATCOM, capacitors banks and HVDC with different

136
control parameter settings. UPFC and GUPFC, SVCs, STATCOM, synchronized phasor
measurements, and other technologies have been reviewed and assessed; in attempt to improve
power system operation amid its overall potential.
Replacing the double circuit lines from Al S’halah to GCC 132 kV with two HVDC
links will effectively control the flow of power in the area to avoid loop flows. In addition, the
HVDC links will not require any more right of way than that of the already existing double
transmission lines. Lastly the installation of the HVDC links will not have any negative impact
on the reliability of the grid; instead it will improve the reliability of the grid by avoiding
thermal overloads in the Western Ring. HVDC system can also modulate power transfer of the
HVDC to damp power swings on the system [16]. HVDC although practically found feasible
in long distance transmission lines, it is not limited to long lines applications. However it
proved to be effective when integrated with STATCOM [16].
Chapter 8 provides analysis of smart distributed generations (DGs) in QPTS and their
potential use.

137
Chapter 8: Potential Application of Smart Distributed Generation
in QPS
8.1 Introduction
The applied research work done in this chapter is an essential part of thesis due to the
creation of a mix of realistic distribution generation (DG) to cope with a seasonal peak load
that occurs in the summer in QPS. The analysis of the annual load to refine the peak load days
and hours, in the substations is a pure research effort of this thesis. The DG has included the
battery storage, photovoltaic cells (PVs), in addition to other options such as demand side
management (DSM). The applied research is investigated to the stage that made the
implementation of this DG, an easy objective using a mini-scale renewable in the form of PVs
integrated with battery energy storage system (BESS). The DG is designed to produce power in
the range of 5 to 10 MVA with a suitable power factor during the peak hours. The topology of
connecting the DG (BESS and PVs) is a practical design to distribute power of 7.2 MW at MV
level and 315 kV at LV level. The findings of the research in this chapter are published in the
thesis’s papers [5], [7]. Refer to Table VIII at the end of this chapter which provides general
overview of different DGs applications.
8.2 Problem Statement
Due to high and rapid growth in the electricity demand, QPS is facing a big challenge
to meet the load requirement at the distribution level following the reliability criteria. There are
reasonable number of 66/11 or 132/11 kV distribution substations in QPS with loading
exceeded their firm N-1 capacities (25 or 40 MVA). There is a five years statement plan to
upgrade these substations or divert some loads from them to newly committed/commissioned
substations. However, due to long lead time in implementing the projects, this research has
investigated the potential application of renewable energy storage system integrated with the
distribution substations to help shaving and balancing the peak loads at that substations [7].

138
8.3 Daily Load Behaviour at Selected Substations During Summer
Distribution grid can actually operate in unbalanced loading conditions and subject to
overload during peak hours. Qatar has the advantage that the peak hours occur mainly during
the day time (peak time between 2:00pm – 3:00pm) and use of PVs would be an ideal choice.
Out of firm (OOF) conditions at distribution substations may last for several hours and it is
quite common in a rapidly growing distribution system like the one at Kahramaa. Dealing with
such a condition is a big challenge for network planners [5], [7]. Figure 60, shows the load
profile of five substations during the day of system load peak in 2011. As can be seen these
substations remain OOF for many hours during the peak time and their load profiles make
them good candidates for PV and energy storage application.
Figure 60: Load profile of some OOF substations during the day of 2011 system peak [7]
Figure 60, indicates that most of the substations were remained OOF for about 6-10
hours and the maximum loads were 4-8 MVA in excess of their firm capacities. The task is to
select one substation for DG connection from these five OOF substations having similar
loading condition. Also, the space availability and age of the substation equipment are key
factors to be considered for selecting the candidate substation. Considering the above, Maither
North substation seems to be a potential candidate for this project. The peak load recorded for
this substation in summer 2011 was 44.5 MVA against a firm capacity of 40 MVA.
0
10
20
30
40
50
60
0 1 2 3 4 5 6 7 8 9 101112131415161718192021222324
MVA
Hours
lagtha South
KSS
Khore W
Syla S
Maither North
Firm Capacity

139
8.4 Planning and Operational Constraints within OOF Substation
Previewing the possibility of one of the incoming feeders/transformers being out of
service, at Maither North substation the 11 kV bus-section is normally closed to feed this
section without supply interruption (Figure 61). This switch allows for diverting the load
corresponding to the transformer that is out-of-service to the transformer that is still operational
[5]. During normal conditions (when none of the incoming devices is out-of-service), each of
the two transformers distributes the power among the feeders that are connected to its busbar.
The normal load flow in the substation is depicted in Figure 61.
Figure 61: Operation of Maither North substation during normal conditions (without contingencies)
In this regard, no problem is observed since the capacity margin is still high (the peak
power consumption is around 23 MVA per section). In N-1 criteria, each busbar shall not carry
more than 20 MVA, or the total load in the feeder and the transformer, shall not exceed 40
MVA [5].
The problem arises when one of the transformers/cables (either T1 or T2) is out-of-
service due to a contingency or any other programmed maintenance works. In that case, all the
power is delivered by the only transformer that is still in service, as illustrated in Figure 62.
The next section will discuss how the actual load in the substation has violated the N-1
criteria during the peak period. As it can be observed in Figure 62, the loading of the whole
busbar and the operating transformer could be exposed to power exceeding 40 MVA [7].
66/11 kV
40 MVAT1
66/11 kV
40 MVAT2
Normal Operation
PLoad 1 < 20 MVA PLoad 2 < 20 MVA
PT1 = PLoad 1 PT2 = PLoad 2

140
Figure 62: Operation of Maither North feeder-substation during a contingency [5]
If the power overload is integrated over time, during the worst summer peak load day the
exceeded energy yields around 42 MWh [5]. Figure 63 (a), for example, constitutes a
representative loading case of the substation under study during a full year. As it can be
observed, the electricity consumption ratio between the summer and the winter months exceeds
a ratio of three. In reality, the overload increases up to 45 MW and it is over 40 MVA (36 MW
at 0.9 power factor) for around 6 hours per day during the summer months (from July to
September 2011) as it is plotted in Figure 63 (b).
Another important constraint to take into account for the selection of the best solution is
the available surface area and the building height limitation. Since the substation is located in a
residential area, the height of the buildings is limited, perhaps to G+1 as the maximum limit.
But, before introducing the solutions to avoid the OOF periods, the consequences of having
overloaded substations will be roughly explained [5].
An overload condition arrives when the power delivered by a substation exceeds the
nominal power, which is the power for which the substation (and the power system around)
was originally designed and dimensioned. When a substation is overloaded it has not only an
impact on the materials and devices of the substation, but also on the operation, the reliability
and the stability of the distribution system. Next sub-sections further develop these points.
66/11 kV
40 MVAT1
66/11 kV
40 MVAT2
PLoad 1 < 20 MVA PLoad 2 < 20 MVA
PT1 = PLoad 1+ PLoad 2 < 40 MVA

141
Aug-04 Aug-05 Aug-06 Aug-0715
20
25
30
35
40
45
50
time [h]
Subs
tation
Pow
ers [M
W]
Substation Pow ers during a summer peak [MW]
T1
T2
T1+T2
Jan Feb Mar Apr May Jun Jul Aug Sep Oct Nov Dec0
10
20
30
40
50
time [h]
P in
T1+T
2 [M
W]
Total delivered pow er in Maither North Substation [MW]
16h
4-5 MW
(a)
(b)
Substation Power during a summer peak [MW]
Total delivered power in Maither North substation [MW]
P in
T1 an
d T2 [
MW]
Subs
tation
Pow
ers [
MW]
Figure 63: Maither North substation loading during 2011 [5]
8.4.1 Substation disconnection
The overloading of a substation may lead to a complete disconnection from the grid as a
consequence of the tripping of protective devices. In that case, two different scenarios may be
experienced:
Scenario I: The disconnection of the substation has a large impact on the rest of the
distribution system compromising the stability of the system. The worst-case scenario would
be a black-out of the zone. Figure 64, for example, shows a satellite image of one of the most
widespread blackouts in history of US and Canada in 2003 after the southern Brazil blackout in
1999. It happened just before 16h10 of the 14th
of August 2003 and it was mostly restored by
23h00 (but some areas did not get electricity until 2 days later). This blackout affected an
estimated 10 million people in Ontario and 45 million people in eight US states [5].

142
Figure 64: The US Northeast blackout of Aug 14, 2003 [5]
Scenario II: The disconnection of the substation does not have a large impact on the rest
of the distribution system. In this case, the consumers connected downstream are affected but
the grid-stability is not endangered [5].
In both of the above-mentioned scenarios customers would not be supplied for time
periods that range from minutes to days. The loss of electricity supply would present the
implications including damages and cost induced to industrial customers, loss of production,
workers idling, and damages induced to sensitive equipment, data loss, need of installing back-
up equipment. There are also damages induced to domestic customers. Also some TSOs/DSOs
offer “curtailment programs” to large industrial customers. In these programs the TSO shall
curtail the customer a certain number of hours per year getting, in exchange, a reduction in the
electricity bill. For example, in Spain there are already 151 interruptibility contracts in force,
which allowed REE, the Spanish TSO to curtail approximately 2122 MW (2012 data) [48].
This service is remunerated following the method described in [49]. Several studies have
worked on assessing the costs induced by interruptions [45], [46], [47].
8.4.2 Poor power quality
Unplanned interruptions impact the power quality served to end-users. Power quality
can be measured by different indicators. The number of minutes lost per year, for example, is a
typical index used by network operators to measure and control their power quality levels [49].
Figure 65 depicts the minutes lost per year (excluding exceptional events) in every voltage
levels in different European countries. In Qatar the system minutes lost (SML) in the
transmission system is kept well below 10 minutes which constitutes an outstanding record
comparing to the countries considered in Figure 65. This large difference can be explained due

143
to the older T&D assets of the countries considered in the figure. This means that the power
quality in Qatar is very good and an upgrade of the existing assets is just justified by the need
of reducing the OOF periods during N-1 conditions. The voltage level (EHV, HV, MV, LV) in
Figure 65 relates to where the incidents occur [50].
Figure 65: Unplanned long interruptions in Europe excluding exceptional events; minutes lost per year-
1999-2010
8.4.3 Life-time reduction of materials due to overload conditions
Overload conditions, especially over-currents, that generate thermal stress, impact the life-
time of the devices that compose the electrical substations. In [52] for example, the reliability
reduction in electrical substations due to equipment overload is studied and in [53] a method is
proposed for finding the optimal capacity of substation transformers considering the loss of
capacity during its lifetime.
8.5 Energy Storage System (Battery Storage and PVs) Solution
Combination of renewable, online power electronics and advent of more efficient
storage systems can give innovative solutions to similar challenges. Custom power electronic
devices have capacities to be integrated with battery storage or superconducting magnet
storage and such integrations can allow a voltage injection with varying angles. The successful
application in power electronics is due to the evolution of silicon voltage source converter
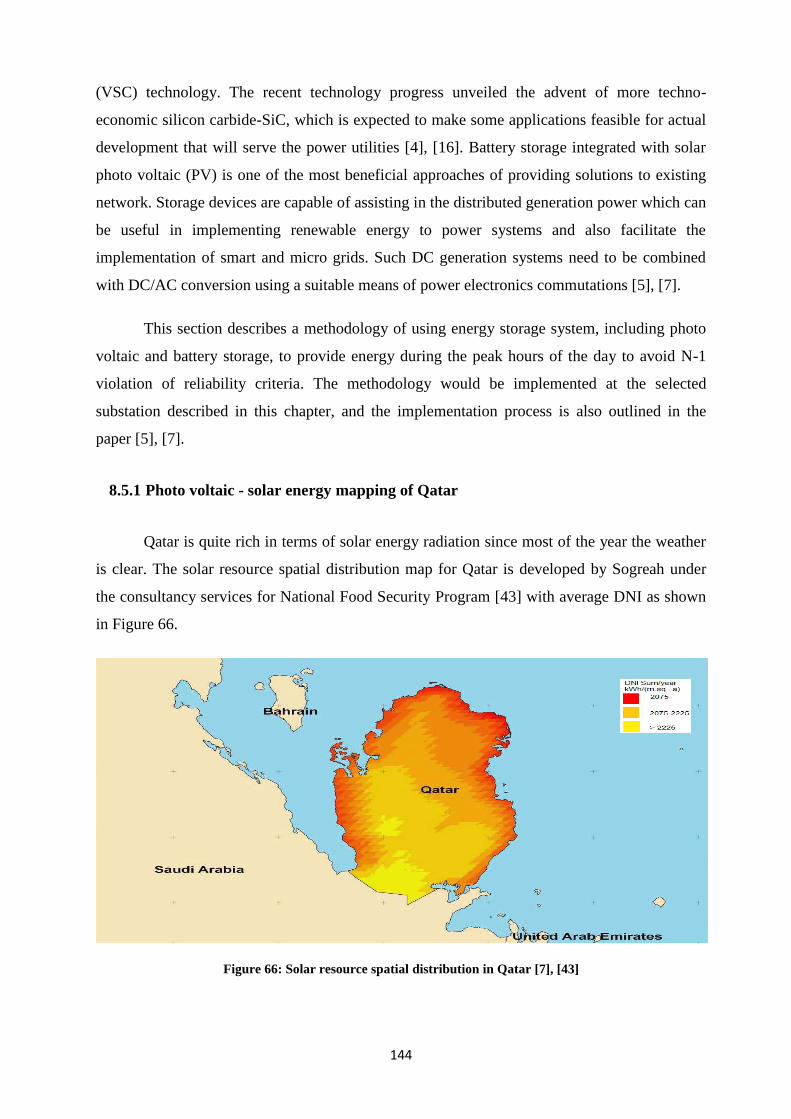
144
(VSC) technology. The recent technology progress unveiled the advent of more techno-
economic silicon carbide-SiC, which is expected to make some applications feasible for actual
development that will serve the power utilities [4], [16]. Battery storage integrated with solar
photo voltaic (PV) is one of the most beneficial approaches of providing solutions to existing
network. Storage devices are capable of assisting in the distributed generation power which can
be useful in implementing renewable energy to power systems and also facilitate the
implementation of smart and micro grids. Such DC generation systems need to be combined
with DC/AC conversion using a suitable means of power electronics commutations [5], [7].
This section describes a methodology of using energy storage system, including photo
voltaic and battery storage, to provide energy during the peak hours of the day to avoid N-1
violation of reliability criteria. The methodology would be implemented at the selected
substation described in this chapter, and the implementation process is also outlined in the
paper [5], [7].
8.5.1 Photo voltaic - solar energy mapping of Qatar
Qatar is quite rich in terms of solar energy radiation since most of the year the weather
is clear. The solar resource spatial distribution map for Qatar is developed by Sogreah under
the consultancy services for National Food Security Program [43] with average DNI as shown
in Figure 66.
Figure 66: Solar resource spatial distribution in Qatar [7], [43]

145
According to the DLR map the DNI conditions are quite good in Qatar since annual
cumulative DNI would be 2075 kWh/(m².a) or higher in most places in Qatar [43]. This
indicates that there is a huge potential of taping solar energy through PVs and other similar
solar technologies for electrical energy generation. This project would be a stepping stone in
entering to this field of energy conservation and getting experience with green field
technologies through this pilot project on utility level in Qatar.
8.5.2 Land requirements for PV panels
The space at the roof of the substation and free area available within the fence could be
utilized efficiently for PV panels’ installation. Benchmarking with similar projects in other
countries reveals that PV cells designed to produce 4 MW required an area of 45000 m² [7].
The land requirement is also studied for efficient solar panels commercially available in the
market. It is found that a high efficiency commonly available panel of about 315Wp (262Wmax)
requires a dimension of 1.65x1.31 m2. This implies that to have 1 MW of solar power, the solar
panels area only would require at least 7000 m2. Considering 40 % additional requirement for
inter panels spaces and access corridors, the total area requirement comes around 9800
m2/MW. Since, it is unlikely to have such a spare area available in an existing substation; it is
intending to feed at least the substation auxiliary load (including the A/C load) from PVs under
this project, not the customers load.
8.5.3 Election of battery storage system (BSS) type and capacity
BSS is probably the oldest method of grid energy storage system which was in place
during the direct current electric power networks. With the advent of very efficient, high
energy density, high power and long life batteries, the BSS is having many grid applications
including power, frequency and voltage stabilisation. Sodium Sulphur and Vanadium Redox
batteries are mainly used for grid energy storage. The BSS would require DC/AC (and vice
versa) power conversion system (PCS) from the battery voltage to distribution voltage level
(11 kV in this pilot case). Both BSS and PCS form a compact energy storage system (ESS). In
order to avoid OOF condition in future, it is estimated that a BSS of 8 MW/48 MWH would be
sufficient.
A Japanese manufacturer has proposed to use a containerized ESS of capacity 0.5
MWH with Lithium-Ion (LI) MHI batteries [7], however, this system which delivers ac power
at 300 V, requires a lot of space and seems not suitable for Kahramaa application. Also, the LI

146
batteries seem more suitable for fast load smoothing rather than load feeding for long time.
Sodium-Sulphur (NAS) batteries are relatively inexpensive, have high power, high energy
density three times compared to conventional batteries and have fast response (2 milliseconds),
while they occupy third space footprint [7]. Therefore, it is conceived that NAS batteries are
best suited for the application and are recommended to be used for the project. There were
some incidents of fire within certain NAS batteries installations that forced the manufacturer to
exert many R&D efforts to improve the batteries design.
8.5.4 Land requirements and location for BSS and PCS
The typical installation area for NAS batteries is about W15mXD2.3mxH4.5m for 1
MW block (area of 34.5 m² for 1 MW and 138 m² for 4 MW (0.5 MW X 8 units) [7]. 34 MW
of NAS battery system was installed for a wind and battery hybrid system in Japan in an area
of 82mX33.5m comprising of 17 units of 2 MW each. However, we believe that instead of
splitting the batteries into many units and housing them in separate buildings it is more
economical to house all the units in one building considering the limitation of available space.
Figure 67, shows a tentative layout of BSS for an existing 4 MW unit which is housed
in a 21mX40m building [7]. In order to install 8 MW of BSS a similar layout could be used in
the second floor of the building, however, since the substations are in the residential area and
there are limitations imposed on the maximum height of buildings. It is more suitable to have a
single story building with an area of about 2x(21mX40m) and have PV panels installed on the
roof of the building.
Figure 67: Layout of a typical 4 MW BSS [7]

147
8.5.5 Building layout for BSS and PVs
The layouts of the candidate substations were carefully reviewed for assessing the
available area in the yard, at the roof and within the building for any required switchgear
expansion. Considering the energy requirements, available land and substation’s life, Maither
North is selected for this PV and battery storage system project. The total area of the selected
substation is about 6900 m2 and the empty space available for solar panels and battery storage
system is about 5000 m2. The estimated power output by solar panels utilizing this area would
be in the range of 250-350 kW, just about enough for the auxiliary supply of the substation. It
is, therefore, recommended to install an 8 MW/48 MWh BSS for load levelling and a PV solar
energy system to feed the auxiliary load of the substation during the day with an integrated
control system. Figure 68, gives an overview of the available resources within the substation
for energy conversion system. A conceptual layout of solar panels and BSS building is also
shown in the figure. With this arrangement, it is expected to install at least 1000 solar panels
with an expected output of about 262 kW (315 kWp) which is the required auxiliary load of the
substation [7].
Figure 68: Conceptual layout of solar panels and BSS building in Maither North substation [7]
Maither North is a 66/11 kV, 40 MVA feeder transformer substation. Provision is
available to add two bays at the existing 11kV switchgear which would be used to connect the
BSS to the 11 kV busbar. The SLD of the substation is shown in Figure 69.

148
Figure 69: Single line diagram of the Maither North substation with conceptual connection of PV & BSS
At present the auxiliary supply for the substation is taken from the station auxiliary
11/0.415 kV 315 kVA transformers. It is recommended to connect the solar power output to
the 415 V distribution board to feed the auxiliary load with suitable control.
8.6 Online Control of Energy Storage System
8.6.1 Online power conversion
Design of online UPS systems, integrated in an AC/DC converter, and providing real
power filtering, power factor improvement and information about the AC input state is
available in the market [44]. The output in, this technology can transmit high power from the
battery system to the essential load, in a more efficient way compared to the available online
UPS systems [44]. High rated power delivery will assist in fast and efficient evacuation from
the high density batteries such as NAS.
8.6.2 Control methodology
Normally two kinds of control are available in the PCS, one is ‘load following control’
and the second is ‘constant output power control’. In load following control the battery output
follows the load profile and is adjusted to provide the additional power required for load
levelling (in our case to avoid the OOF condition) as shown in Figure 70. In constant output
control, a constant power of the battery is delivered during the peak hours irrespective of the
load requirements as shown also in Figure 70. The constant output control may be useful from
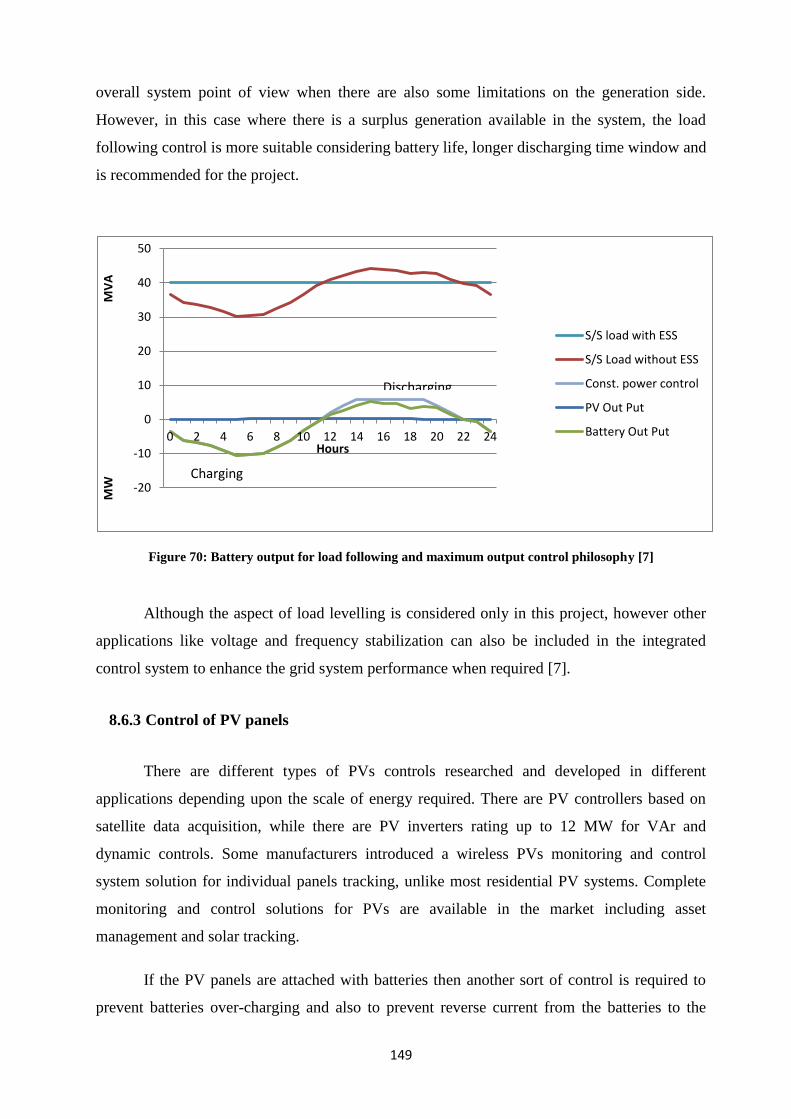
149
overall system point of view when there are also some limitations on the generation side.
However, in this case where there is a surplus generation available in the system, the load
following control is more suitable considering battery life, longer discharging time window and
is recommended for the project.
Figure 70: Battery output for load following and maximum output control philosophy [7]
Although the aspect of load levelling is considered only in this project, however other
applications like voltage and frequency stabilization can also be included in the integrated
control system to enhance the grid system performance when required [7].
8.6.3 Control of PV panels
There are different types of PVs controls researched and developed in different
applications depending upon the scale of energy required. There are PV controllers based on
satellite data acquisition, while there are PV inverters rating up to 12 MW for VAr and
dynamic controls. Some manufacturers introduced a wireless PVs monitoring and control
system solution for individual panels tracking, unlike most residential PV systems. Complete
monitoring and control solutions for PVs are available in the market including asset
management and solar tracking.
If the PV panels are attached with batteries then another sort of control is required to
prevent batteries over-charging and also to prevent reverse current from the batteries to the
-20
-10
0
10
20
30
40
50
0 2 4 6 8 10 12 14 16 18 20 22 24
MW
M
VA
Hours
S/S load with ESS
S/S Load without ESS
Const. power control
PV Out Put
Battery Out Put
Charging
Discharging

150
PVs during the night. The upcoming PV control will comply with statutory regulations for
efficient and safe PV installation.
8.7 Implementation of Battery Storage System with Manufacturer Knowhow
Generally speaking, different types of solutions can be foreseen, while four types can be
explained in this sub-section. As explained in sub-chapter, the obvious planning solution is to
consider equipment up-rating.
8.7.1 To upgrade the power of the substation (Figure 71)
For upgrading the substation two different alternatives exist:
To replace the existing components by power-upgraded components:
This solution is rather expensive because the replacement of two transformers, two
busbars, incoming switchgear and the undergrounded XLPE cables are required. Moreover,
while the replacement is done the substation cannot supply power to the end-users and the
replacement works may last for several months/years. Since the existing substation is placed
inside a building, it is necessary to check that the required extra space (even if not very large)
still fits in the building. Otherwise supplementary civil works shall be added to the budget. The
upgraded transformer rating above 40 MVA would also conflict with Kahramaa standard and
would increase fault level at 11 kV busbars and downstream distribution system.
Utility
grid
Substation
(Snññ) Ploads
Figure 71: Possible solution to distribution substation overload: to update substation power [5]
8.7.2 To add two additional 40 MVA transformers and busbars
This solution is probably one of the most frequently implemented solutions because it
enables an increase of the distribution grid capacity and does not require long shutdowns (can
be done during winter months). Considering that the electricity consumption in Qatar is

151
increasing at astonishing rates, it can be an interesting choice. However, the delivery time is in
the range of 3-3.5 years. Regarding the technology of the substation, two types of substations
can be considered: gas-insulated switchgear (GIS) and air-insulated switchgear (AIS) [54]. The
main difference between these two solutions is that, since gas presents a higher insulation
capability than open air, the components of the substation can be installed at a less footprint
and, as a result, GIS is much more compact (around 30%) than AIS. Moreover, GIS presents a
higher reliability than AIS and the GIS is well adapted for highly populated areas where there
is a lack of space. However, GIS is not yet available for medium voltage levels [54].
8.7.3 To install a distributed generation (DG) plant downstream the substation
DG can be of three different types (and its combinations), as illustrated in Figure 72:
i) Thermal Energy Sources (TES).
ii) Renewable Energy Sources (RES).
iii) Battery Energy Storage System (BESS).
One advantages of these solutions compared to the upgrade of the substations is that, since
the energy is locally generated, the transmission and distribution losses (and thus generation
cost) are minimized.
Utility
grid
Substation
(Sn)
Distributed
Generation
Thermal
plant
Renewable Energy
Based plant
Battery Energy
Storage
Figure 72: Possible solution to distribution substation overload: to add a DG plant downstream [5]
The main differences between RES, TES and BESS are that RES are:
RES is neither controllable nor predictable, while TES and BESS can be regulated to adapt
to the load increase. In addition BESS has the capability of behaving as a regulated load. This
means that BESS is very well suited for large RES integration cases where energy balance
must be adjusted up or down at any time.

152
Another advantage offered by TES and BESS (especially BESS) is that they can be used to
for intentional islanding of load plus DG clusters (micro grids). Intentional islanding enhances
the autonomy of grid parts resulting in a higher stability and reliability of the main grid.
Additionally, TES and BESS can participate to ancillary services such as:
Primary/secondary frequency regulation.
Primary/secondary voltage regulation.
Black-Start capability
Comparing to TES, RES and BESS do not emit greenhouse gases (or at least little) so
they are free of green taxes, while RES often requires large surface areas. For example, a 14.37
MW PV farm needs 28 acres land, which makes 1.26 MW/ha (1 acre=4 046.86 m2=0.4047 ha)
[55]. And the largest onshore wind farm, Alta Wind Farm, which is located in California, has
an installed capacity of 1020 MW over a 9000 acres land (3642.17 ha) [56], which is around
0.28 MW/ha. These large surfaces do not make RES well adapted for urban areas. Moreover,
wind turbines shall be installed to a certain distance away from households due to their noise
pollution. On the other hand, the efficiency of PV plants is still below 20 %, as it can be
observed in Table VII:
Table VII: Module efficiencies and surface areas per cell material [55]
Cell material Module efficiency Surface area per kWp
Monocrystaline silicon 13-19 % 5-8 m2
Polycrystalline silicon 11-15 % 7-9 m2
Micromorphous tandem cell
(a-Si/c-Si) 8-10 % 10-12 m2
Thin-film-copper-
indium/gallium-
sulphur/diselenide
(GI/GS/Se)
10-12 % 8-10 m2
Thin-film cadmium telluride
(CdTe) 9-11 % 9-11 m2
Amorphous silicon (a-Si) 5-8 % 13-20 m2
8.7.4 To implement demand side management (DSM) techniques.
DSM works in controlling the consumption of loads as to:

153
Shave/reduce the peak load consumption, by increasing the temperature set-point of air
conditioning systems or by reducing the lighting system intensity.
Shift the load profile. For example by scheduling warm-water heater or boiler at a
different time (it is often programmed during night hours).
This method does not require the installation of high power equipment, but rather the
deployment of a large measuring, communication and remote/distributed energy managing
control system. DSM demonstrator projects are being implemented all over the world and the
first conclusions from these studies start to come up [57].
8.7.5 Comparison between solutions
In order to offer a clear overview of the different solutions, Table VIII summarizes the
most important characteristics by means of green, orange or red smiley, representing a good,
average or bad adequacy in relation with the selected criteria. From this analysis the following
conclusions can be extracted:
8.7.5.1 Solutions that shall be disregarded
There are a certain number of solutions that do not respond to the requirements of Maither
North Overload. For example, actual GIS switchgear is only commercialized down to sub-
transmission levels. For this reason, GIS solution could only be used in the high voltage side of
the substation. A similar reasoning can be applied to combined cycle gas turbine (CCGT)
plants since the existing CCGT power plants are in the order of hundreds of MWs. The
integration of diesel generators shall be studied in future works. Finally, wind-based energy
generation shall be pushed aside because wind turbines are not really well adapted for urban
environments (noise, height, aeroplane landing, visual impact etc.)
8.7.5.2 Solutions that shall re-formulated
There are certain solutions that can be integrated in the substation but not to help for the
main load-shifting functions, but for supplying the auxiliaries of the substation (control units,
lighting, air-conditioning etc.). This is the case of PV panels, which can be installed on the
roofs of the substation buildings or in the floor. If solar panels are installed in the 5000 m2
available area, 250-350 kW can be obtained [5], [7].

154
8.7.5.3 Potential solutions
The upgrade of the substation, the use of BESS devices (NaS) and the use of DSM
techniques are finally found among potential solutions together with PVs. It is rather difficult
to make a choice between these solutions because they all present advantages and
disadvantages.
8.7.5.4 Upgrading the substation
The major advantage of upgrading the substation (adding a 1×40 MVA (firm) substation
works in parallel with the existing substation) is that it is a very well-known technology. It
does not take much space (a 2×40 MVA S/S only requires 2500m² in a single storey building
or 1600m² if built in two stories). Its cost is in the range of 12.6-16.8 M€ (60-80 MQR).
The major disadvantage of updating the substation is that it does not offer any extra
flexibility to participate in ancillary services (it has only on-load tap changers – OLTC) or to
balance powers/ regulate voltage in case of a high penetration of rooftop PV in households.
This last point can become very important (even critical) when PV penetration will reach
higher levels. Moreover, since the electric power is produced in distant generation plants, there
are power losses in the transmission path (2-3 % of the demand energy). In Qatar the
transmission losses amount to 2% of the total demand, while the distribution losses are more
compared to transmission losses. The delivery time of an additional substation is estimated to
3-3.5 years. This means that, during this time, the substation is in OOF conditions during N-1
operation, putting in danger the stability of the grid. Additionally, the substation needs to be
partially shut down during some time (weeks to months) for the upgrade works and
commissioning.
8.7.5.5 Using BESS devices
The major advantage of using a BESS device is in the flexibility that it offers. BESS can
supply power during the summer peak but it can also absorb power in the case of an over-
generation coming from a massive installation of PV panels during the rest of the year.
Moreover BESS can participate to the different frequency/voltage regulation services and to
the black-start of the system. Finally, BESS could also be used for creating autonomous micro
grids (islands disconnected from the main grid). In comparison to a new substation, it is not
necessary to install 40 MVA of BESS, as installation of 7-8 MVA of BESS (NaS) is sufficient

155
for relieving the summer peak. In terms of footprint, a 40 MVA substation and a 7-8 MVA
(NaS) are pretty much equivalent (around 1200-1600 m2 on G+1) and they both fit in the
available area of Maither North substation. The installation cost is also very much close but the
operation is different in the long term, since the energy of the BESS is locally generated (near
to the consumption zones), the transmission losses are avoided.
Another important advantage of BESS is that the delivery time is less than the delivery
time of a 40 MVA substation (around half) and it does require the minimum shutdown of the
substation. The major disadvantage of using BESS is that, since NaS batteries are based in
sodium, some countries may ask for special permissions before their installation. However, the
only manufacturer of this type of batteries in the world assures that there is no discharge of
polluting gases and their noise level is very low. Another point to consider is that during winter
months the battery would be under-used. It would be very interesting to combine the summer-
peak load shifting function with other services to enhance the value of the battery. In any case,
this is the same situation as for extra 40 MVA substations. It must be mentioned that,
considering the limited space, the use of Li-Ion batteries would require too much space (only
the batteries would need 1927 m²putting them one close to the other) and their cost is higher
than NaS (in Li-Ion the cost varies very much from technology to technology and from
provider to provider).
8.7.5.6 Using DSM
As for BESS, the major advantage of using DSM techniques is the flexibility that it can
offer. DSM does not take any place (or very little) in the substation and the used devices are
low-power apparatus that benefit from large-scale production and thus, have low prices.
However, the deployment cost of DSM programs is still under study (the business models are
manifold).The major disadvantage of DSM is the complexity needed to obtain the above-
mentioned flexibility. Because, to obtain a high degree of flexibility, many users need to be
aggregated and managed, and large communications and measuring infrastructures need to be
deployed. Observing the large number of pilot projects running or planned, and the interest
shown by different grid-stakeholders in this technology, it is considered as a very promising
technology.

156
8.7.5.7 The BESS proposal
After this analysis it can be observed that the use of BESS, especially that of sodium-
sulphur type, is in the short-list of potential solutions to be used for shifting the peak demand
during the summer months in Qatar. Figure 73 shows a simplified representation of the
solution proposed by a manufacturer.
Figure 73: Simplified representation of the BESS solution proposed by a Manufacturer [5]
It consists of a 7.2 MW/43.2 MWh BESS. Since the solution is modular, the total power
and energy capacity can be split between both busbars. This 3.6 MW/21.6 MWh can be
connected to each of the busbars or the full capacity to the same busbar. This provides a higher
flexibility. In this regard, two options can be considered:
- To relate some of the batteries to a particular busbar (as represented in Figure 73). The
area of BESS solution is shown in Figure 74 compared the existing used area, the
available area.
- To be able to connect any of the batteries to any of the busbars (Figure 75).
This solution provides the highest flexibility but it is more expensive than the one before.
The proposed solution requires a surface of 1066 MW (32.6 m×32.7 m), which lets
plenty of space for the solar panels needed to supply the auxiliary circuits.
66/11 kV
40 MVAT1
66/11 kV
40 MVAT2
BESS
7.2 MW/ 43.2 MWh
VSC VSC VSC VSC

157
Figure 74: Aerial view of the BESS solution integrated in Maither North substation [5]
For a better understanding of the modularity of the solution, Figure 75 shows the
simplified SLD of the BESS at the substation.
Figure 75: Simplified SLD of ESS [5]
8.7.6 General cost overview
A tentative cost analysis is described in this section. The market indicates that the NaS-
BSS costs about $300/kWh on average [7]. The estimated energy requirement for this project is
48 MWh (8 MW output power) which makes the total tentative cost (EPC) for this project to
be about $14.4M (52.5 MQR), i.e., about 6.6 MQR/MW. This is almost three times the cost
incurred on a standard distribution (66/11 kV) substation per MVA. However, to avoid OOF
condition, Kahramaa needs to build a new substation with 40 MVA capacity. Also, the ESS is
a generation rather than a distribution system, which might support the justification for new
Shelter #1(2´1.2 MW
converter
system)
MV/LV
Battery
Shelter #2(2´1.2 MW
converter
system)
MV/LV
Battery Battery
Shelter #3(2´1.2 MW
converter
system)
MV/LV
Battery Battery
Shelter #4(2´1.2 MW
converter
system)
MV/LV
Battery Battery
1.2 MW 1.2 MW 1.2 MW 1.2 MW 1.2 MW 1.2 MW 1.2 MW
Battery
1.2 MW
66/11 kV
40 MVAT1
66/11 kV
40 MVAT2
BESS 7.2 MW/ 43.2 MWh

158
investment. Moreover, this ESS is a new technology, usually characterized as more expensive;
however utilities would like to embark in new smart applications on pilot cases.
8.8 Concluding Remarks
Electrical energy storage using integrated batteries and PVs system, is rapidly evolving
technology and is being accepted as a viable source and essential part of electricity delivery
system. Its use in power as well as in energy oriented applications is quite promising in the
modern power system of the future. This batteries and PVs system application, although small,
satisfies part of Kahramaa long term objectives to utilize renewable energy as well as in the
best use of energy conservation to minimize the total dependence on conventional fossil fuels.
This article describes and discusses the differences between various solutions and technologies
to alleviate the problems created by substations overload during N-1 conditions. The
application is in line with Kahramaa strategic plans to comply with Qatar National Vision 2030
for renewable, including solar energy parallel to the energy conservation measures. The
concept for this energy storage system shall be further studied for potential implementation.
Table VIII below gives comparison between different distributed generations, and clarifies
their merits and drawbacks.
Table VIII: Advantages and disadvantages of different DG solutions [5]
Solution Cost Footprint
Trans-
mission
Losses
Flexibility
(incl.
ancillary
services)
Life time
Gas/
chemical
emission
Efficiency
Shutdown S/S
during works
for
installation
Maturity
Add
GIS (HV)
& (MV)
1×40 MVA
(firm) GIS S/S
would cost
around 14-18.6
M€
GIS/AIS=1/0.9
(only materials,
installation and
maintenance
[58]
10-25 % of a
conventional AIS
[57]
3200 MW/ha
Power needs
to be
delivered
from
generation
centers
Little
flexibility
OLTC
>20 yrs (20
yrs
supervision
from
original
supplier
[58])
SF6
(depending
on the
technology)
88-92 %
Weeks-
months
(winter)
MV GIS
substations
not
available
yet but
possible to
combine
HV GIS
with MV to
increase
distribution
efficiency
[59]
Add
AIS (MV)
GIS (HV)
1×40 MVA
(firm) GIS, AIS
2×40 MVA S/S
is typically built
Power needs
to be
Little
flexibility
>20 yrs
SF6
(depending
88-92 %
Weeks-months
(winter)

159
Solution Cost Footprint
Trans-
mission
Losses
Flexibility
(incl.
ancillary
services)
Life time
Gas/
chemical
emission
Efficiency
Shutdown S/S
during works
for
installation
Maturity
S/S costs
around 60-80
MQR (12.6-
16.8 M€)
in 50m×50m
(2500 m2)
320 MW/ha
delivered
from
generation
centers
(OLTC) on the
technology)
CCGT
1×
40 MVA plant
costs around
22 M€
55
0
€2006/kW@500
MW plant [60]
Not enough place
in urban area:
1.26MW PV/ha
8.3 MW/ha
[61]
No
transmission
losses
Yes but only
in generation.
>25 yrs
55 %
[60]
Weeks-l
months
(winter)
Small scale
CCGT plants
do not exist
(diesel
generators may
be used
instead).
PVs
1×40 MVA
plant costs
around 244 M€
6100
€2006/kW@10
MW plant [62]
Not enough place
in urban area:
1.26 MW/ha
No
transmission
losses
Intermittent
generation
>25 yrs
< 20%
[55]
Several
months
(winter)
Work to do on
efficiency
Wind
1×
40 MVA plant
costs around
46 M€
1150
€2006/kW@100
MW plant [62]
Not possible to
install a WT in
urban area
0.28 MW/ha
No
transmission
losses
Intermittent
generation
>20 yrs
59 % @
MPP
Several
months
(winter)
ESS NaS
300-500
$2009/kWh=230-
380 €/kWh
[63]
A 7.2 MW/43.2
MWh
installation (all)
would require
around 12-16.4
M€ (only the
batteries)
1.2 MW/ 7.2
MWh battery
container with
W9.4m×D2.3m×
H4.8m
A 7.2 MW/43.2
MWh installation
(all) would
require around
1066 m2
No
transmission
losses
Specially
energy
oriented
applications
2500-4500
cycles
(around 15
years)
Sodium
installations
need
special
environmen
tal
permissions
75-92 %
[63]
Minimum or
no need of S/S
shutdown
Large
experience by
NGK (>300
MW installed)

160
Solution Cost Footprint
Trans-
mission
Losses
Flexibility
(incl.
ancillary
services)
Life time
Gas/
chemical
emission
Efficiency
Shutdown S/S
during works
for
installation
Maturity
ESS Li-
Ion
600-2500
$/kWh=456-
1900 €/kWh
[63]
A 7.2 MW/43.2
MWh
installation (all)
would require
around 19.7-82
M€ (only the
batteries)
1 MW/ 0.5 MWh
battery container
with
W7m×D3m×H3.
3m
A 7.2 MW/43.2
MWh installation
would require
>1927 m2 (only
the batteries)
No
transmission
losses
1000-10000
cycles (5-
15 years)
90-100 %
[63]
Minimum or
no need of S/S
shutdown
Demonstrator
projects
promptly
increasing
(specially US
[64])
DMS
Depends on the
number and
type of end-
users that must
be aggregate
and the type of
functions to be
deployed.
Almost no
footprint at the
substation itself
No
transmission
losses
- Needs
strong
engagem
ent of the
end-
customer
- Complex
aggregati
on and
managem
ent
No return
of
experience
available
yet
No need of S/S
shutdown
Demonstrator
projects [20],
[57]

161
Chapter 9: Discussions, Conclusions, and Recommendations
9.1 The Discussions and Conclusions
This examination of literature, critical appraisal of existing conditions, compilation of
discussion targeting the potential of online energy systems and online power electronics reveal
the areas in which Qatar power transmission system (QPTS) can achieve the greatest benefit.
The most relevant studies of QPTS have shown a substantial potential for the integration of
FACTS devices, particularly the SVC (or STATCOM), TCSC and GUFPC, or HVDC and
other power flow controllers. The case studies conducted showed how FACTS and HVDC
devices can cope with the rising demand for Qatar power in recent and upcoming years. The
studies explained the benefits of altering power system elements such as the capacity of cables,
overhead lines, without a need for additional lines or substations in the mid-term.
The reconductoring of the overhead lines from Al S’halah – GCC-Umm Bab-Dukhan
together with the installation of 100 MVA STATCOM device at Dukhan 132 kV bus was
found to be the most feasible solution. The selected option has proved effective in solving the
132 kV power flow imbalance and the low voltage cases. Dynamic simulation analysis has
shown that the STATCOM has improved the system’s voltage profile in steady state and
dynamic modes. The conventional capacitor banks have also similar performance to
STATCOM, in steady state and dynamic analysis; however the STATCOM outperforms the
capacitor in fast dynamic compensation. It is recommended that Kahramaa to install the
STATCOM at Dukhan 132 kV bus (or at Dukhan-2) for the obvious benefits to QPTS
discussed. The selection of 50MW/50MVAr is found to be the optimal allocation for GUPFC
from different combination of active and reactive power ratings. The GUPFC can make a
change on the way the utility controls the power flow in part of the network and this will pave
the way for smart grid implementation in the QPTS.
When the HVDC is modelled in QPTS (with STATCOM and without STATCOM) the
system has become transiently stable. However there is similarity in the machines rotor angles
with the STATCOM modelled alone and with the case both the STATCOM and HVDC
modelled. The machine angles for all states of the faults before and after clearance are almost
the identical. The machines in QPTS stayed in synchronism and the oscillation is damped out

162
few seconds, post to the significant machines’ acceleration during the fault. Therefore, the
system is stable in both cases. The direct result is that two HVDC links will effectively control
the power flow in the area and prevent the unwanted loop flows when they replaced the double
circuit 132 kV lines in the case study. Further to this, HVDC links don’t need any extension to
the already existing right of way for the two transmission lines. Essential conclusion that the
installation of the HVDC links has improved the reliability of the grid by avoiding thermal
overloads in the area of study, while there is no negative impact on QPTS reliability.
A qualitative and quantitative comparison based on the particular case of DGs, has been
performed (Table VIII) highlighting the advantages and disadvantages of each solution. The
solution based on BESS is highlighted due to its remarkable flexibility, compared to other DG
options such as PVs, winds, geothermal etc. The BESS can also assist with maintaining power
quality in the network considering its effect in mitigating frequency, voltage and power factor
variations. It is advisable Kahramaa to consider installing BESS in the mentioned substation to
feed the extra load, together with PV panels to supply the substation auxiliary load. This is a
green project that produces no polluted emissions; however environment permission is needed
for use of Sodium batteries. Use of Li-Ion battery shall also be considered to huge
improvement in its development and high output rating of new products. The pilot project can
then be counted as part of Kahramaa fulfilment of Qatar National Vision 2030 and Qatar
National Development Strategy 2011-2016.
9.2 The Recommendations
Generally speaking, the main recommendation of this evaluation of literature that the
integration of flexible online power electronics controls is ideal for increasing the power flows
of existing lines, balancing the flows and maintaining the voltages’ profiles. The online
controls serve to facilitate the need for additional online analysis, control, and security, while
put more emphasis on wide-area and monitoring in QPTS.
It has been recommended to Kahramaa to carry out more techno-economic studies that
would ultimately lead to the implementation of either FACTS or HVDC in QPTS. The
operation performance of the STATCOM can be further enhanced with its compensation
controlled via synchrophasors installed at various locations to work in a wide area monitoring
and control (WAM, WAC) modes. The synchrophasor technology can benefit from the global
positioning system (GPS) to provide synchronized time stamped measured signals to the

163
controllers. This technology has been found very useful in real utility application. As smart
application it can be used in QPTS to control the FACTS compensation, influence the network
power flows and the dynamic voltage. The GUPFC can receive measured data via PMUs and
synchrophasor units dispersed at certain locations of QPTS, and synchrophasor technology can
enhance decision making process of the system operators for increased power delivery up to
dynamic limit of transmission lines.
9.3 The Contribution of this thesis
The power electronics data, analysis, and subsequent discussion and recommendations
in this thesis, provide an extension of the evolving knowledge base as well as potentially
beneficial information. The following points are the main contributions from this thesis:
Applied research on realistic, existing power network of Qatar (QPS) is the key
contribution in this thesis.
Applying the new concept of ‘online power electronics’-OPE driven by online FACTS
controllers set based on phasor measurements. The OPE proved feasible in solving
planning and operational challenges in combination with conventional techniques.
Power electronics (FACTS and HVDC) modelling and analysis in a real utility
transmission network (QPTS) is considered an applied research contribution.
There are no HVDC/GUPFC devices implemented in Qatar or in the Gulf States in
general. This will be a new idea in the region and innovation that will contribute
towards the advancement of knowledge.
Selection of the GUPFC among other FACTS devices as feasible for application in
QPTS as a result of network modelling is an applied research contribution.
Custom research solution applied to solve overload in distribution substations using
custom power devices for energy conversion is an applied research contribution.
The topology of connecting the distributed generation (BESS and PVs) is an applied
research contribution design to distribute power of 7.2 MW at MV level and 315 kV at
LV level.

164
9.4 The Recommendation for future work
After working exhaustively on QPTS challenges and problems, some open issues can be
addressed in the coming future research. The following key technologies discussed in this
thesis, however they need to be addressed further for feasible applications of the smart grid:-
Online Analysis: better coordination of controls across the grid
Wide-area monitoring and control: Phasor Measurement Units (PMU)
Distributed Generation and Storage Devices
It is advisable to study more the application of wide area measurement and control with
stamped signals from synchrophasors to have a better coordinated control. The use of FACTS
is considered as one of the key technologies for the success of the upcoming smart grid
implementation. From power electronic perspective, more emphasis shall be placed on FACTS
devices and wide area control applications using synchrophasors. The transformation of
protocols for controllers in transmission deeper analysis of the EMS system is needed for
detailed configuration. This recommendation is still potentially ideal for implementation years
later, and should be considered in greater detail across on-going analyses. Compatibility of
OPE with DNP3 for FACTs shall be further researched and extended beyond HVAC to HVDC
[3].
To complement the research in this thesis and for future research, it is recommended to
conduct a comprehensive research and studies on the integration of alternative energy sources
and its impact on the power quality and stability of the network. The upcoming research shall
study the optimum location of online energy storage devices, which can provide the most
effective stability and quality of the supply in the system. The study can be extended to include
the smart metering infrastructure in power system networks and its implications. Micro grid is
the theme of research and development in the foreseen horizon including distributed
generation. This research can be followed by more investigations in the FACTS dynamic
model in QPTS using the PSS®E software of other application. Fast transient response can be
tested in QPTS including the FACTS using the relevant software. The mathematical
explanation for the optimization of GUPFC allocation approach may be well researched
against the known FACTS allocation techniques such as Genetic and Bee Algorithms.

165
List of Publications (References)
[1] Elsayed H, Cham E, Al Jaidah Y, Al Najjar A. (2013) ‘Towards Smart Power Grid in
Qatar: Application of STATCOM and Composite Conductors’, The 4th
Arab Union of
Electricity General Conference, Doha, Qatar, 7-9 January 2013.
[2] Elsayed H, Abu Eida S, Chaudhry S, Al-Mahmoud A. (2012) ‘Dynamic Control of
Voltage and Power Flow in Qatar Transmission System’, Session A1, Paper A103,
Cigre GCC Power 2012 Conference & Exhibition_ Oman 12th – 14rd November
2012 (selected as one of the best three applied research papers in the conference).
[3] El-Sayed, H.I.; Chan, K. ; Al-Jomali, A.A. ; Johnson, B.K. ; Lai, L.L. (2010),
‘Operation Enhancement by Power Flow Controller - An Investigation in the Qatar
Transmission System’, The IEEE 2010 Power and Energy General Meeting,
Minneapolis, Minnesota, USA, 25-29 July 2010.
[4] H.I. El Sayed, B.K. Johnson, L.L. Lai, N. Tse (2009), ‘Investigation into the
advancement of FACTS and their implementation impact in a Utility’. The 8th IET
International Conference on Advances in Power System Control, Operation and
Management, APSCOM2009. Kowloon Shangri La Hotel, Hong Kong, 08-11
November 2009.
[5] Elsayed H, Borya M, Al Jaidah Y, Amoussouga E, Al-Marri S, Al Najjar A. (2013)
‘Battery Storage and PVs Energy Conversion System to meet Summer Peak in Qatar:
A reasoned choice among potential Smartgrid solutions’, The 4th
Arab Union of
Electricity General Conference, Doha, Qatar, 7-9 January 2013.
[6] Elsayed, H.I.; Johnson, B.K. ; Lai, L.L. (2012), ‘Online Systems Potential
Applications in Intelligent Power Grids’, PES IEEE General Meeting, San Diego,
California, USA, 22-26 July 2012.
[7] H.I. Elsayed, S.R. Chaudhry, A.A. Al-Mahmoud (2012), ‘PV, Battery Storage and
Energy Conversion System for Meeting Peak Load in a Substation’, CIRED and IET
2012 Workshop, “Integration of Renewables into the Distribution Grid”. Lisbon,
Portugal, 29-30 May 2012. www.cired2012-workshop.org, IEEE Xplore Digital
Library E-ISBN: 978-1-84919-628-4, Digital Object Identifier: 10.1049/cp.2012.0758.
[8] Elsayed, H., Sasono, P., and Lai, L. (2007), ‘Risk Assessment and Mitigations of
Electronic/Cyber Intrusions into SCADA, DCS and LAN Systems of a Utility’, 3rd
GCC CIGRE International Conference and Exhibition (GCC Power 07), Dubai, UAE,
05-07 Nov. 2007.
166
[9] Qatar General Electricity & Water Corporation- Electricity Transmission Planning,
Demand Forecast Report 2012- 2017.
[10] Transmission Grid Code, Qatar General Electricity & Water Corporation.
[11] ACCC Conductor News CTC Global Newsletter, December 2012
[12] Anthony Johnson, Robert Tucker, Thuan Tran; John Paserba, Dan Sullivan;
Chris Anderson and Dave Whitehead (2007), ‘Static VAr Compensation Controlled
via Synchrophasors’, Proceedings of the Western Protective Relay Conference,
Spokane, WA, Oct. 2007.
[13] Terzija V., Kunjumuhammed L.P., Pal B.C., Burt G., Babnik T., Osborne M.,
Hung W. (2011), ‘FlexNet Wide Area Monitoring System’, Power and Energy Society
General Meeting, 2011 IEEE, San Diego, CA, 24-29 July 2011.
[14] New England Power Service Company, Power Technologies Inc. – HVDC
Power Transmission Technology Assessment.
[15] B.H. Chang, J.B. Choo, S.J. Im, J.S. Yoon, S.Y. Kim, X.K. Xu and B.P. Lam
“Study of Operational Strategies of UPFC in KEPCO Transmission System”
IEEE/PES Transactions and Distribution Conference & Exhibition: Asian and Pacific
Dalian, China 2005.
[16] Prof. Johnson, B., ‘Utility Applications of Power Electronics ECE529
Postgraduate Course’, University of Idaho- USA, 2008-2013.
[17] Xiao-Ping, Z., Handschin, E., and Yao, M. (2001), ‘Modelling of the
generalized unified power flow controller (GUPFC) in a nonlinear interior point OPF’,
IEEE Transactions on Power Systems, vol. 16, no. 3, pp. 367-373.
[18] Parsons-Brinckerhoff (2009), ‘Consultancy for Qatar Transmission System
Short/Medium Term’ Planning Support’, Power System Studies- Stages 0, 1, 2 and 3,
Parsons Brinckerhoff-PB Power.
[19] International Energy Agency (IEA), “Key World Energy Statistics 2012’
[20] Base Cartography Datasets for Europe,CRID4EU: www.grid4EU.eu
[21] Narain G. Hingorani, and Laszlo Gyugyi (2000), ‘Understanding FACTS:
Concepts and Technology of Flexible AC Transmission Systems’, IEEE Press.
[22] Nguyen, V. L., ‘Modeling and Control Coordination of Power Systems with
FACTS Devices in steady state operating mode’-PhD Thesis 2008, The University of
Western Australia, Energy Centre, School of Electrical, Electronic and Computer
Engineering. (Supervisor Prof. Nguyen, T. T.)

167
[23] H. Akagi, EH. Watanabe, and M. Aredas, (2007), ‘Instantaneous Power Theory
and Applications to Power Conditioning’, IEEE Press on Power Engineering, New
York: Wiley.
[24] Al-Mubarak, A.H. ; Bamsak, S.M. ; Thorvaldsson, B. ; Halonen, M. ;
Grunbaum, R. (2009) ‘Preventing voltage collapse by large SVCs at power system
faults’. Power Systems Conference and Exposition, 2009. PSCE '09. IEEE/PES
[25] N. R. Chaudhuri, A. Domahidi, R. Majumder, B. Chaudhuri, P. Korba, S. Ray,
K. Uhlen (2010), ‘Wide-area power oscillation damping control in Nordic equivalent
system’, IET Generation, Transmission & Distribution, vol. 4, no. 10, pp. 1139-1150.
[26] Zhang, Xiao-Ping, Rehtanz, Christian, Pal, Bikash- Flexible Ac Transmission
Systems: Modeling and Control. Springer, Heidelberg, Jan. 1, 2006.
[27] Bandar Allaf, Roy Moxley, ‘Synchrophasors for Improved Interconnection
Operations’, www.cigre-gcc.org/wp-content/uploads/2012/10/Pap-49.pdf .
[28] R. You, (2006), PhD, ‘Controller design for PSS and FACTS devices to
enhance damping of low-frequency power oscillations in power systems’, dissertation
presented to Montana State University’s School of Engineering, Bozeman, MT.
[29] Shan Jiang, Ani M. Gole, Udaya D. Annakkage, D.A. Jacobson, “Damping
Performance Analysis of IPFC and UPFC Controllers Using Validated Small-Signal
Models” Power Delivery, IEEE Transactions on Power Delivery, Vol. 26, No. 1, Jan.
2011.
[30] Boyra, M., PhD Thesis, ‘Power-flow control and power-quality enhancement in
interconnected distribution networks’, Écoledoctorale “Sciences et Technologies de
l’Information, des Télécommunications et des Systèmes” Mondragon Unibertsitatea,
Oct 2012.
[31] Chia Chi Chu, Sheng Huei Lee, Chung Hsiung Chen “Method of Calculating
Power Flow Solution of a Power Grid that Includes Generalized Power Flow”, United
States Patent Application 20090182518-A1, published 2009.
[32] Mehrdad Tarafdar HAGH, Mehdi Ahmadi JIRDEHI (2010), ‘A Robust Method
for State Estimation of Power System with UPFC’, Turkish Journal of Electrical
Engineering & Computer Sciences, vol. 18, no. 4, pp. 571-582.
[33] Povh, D., Retzmann, D., Rittiger, J. (2004), ‘Benefits of Simulation for
Operation of Large Power Systems and System Interconnections’, 4th
IERE General
Meeting and IERE Central and Eastern Europe Forum , October 17-21, 2004, Kraków,
Poland, Available at: http://www.ptd.siemens.de/Simulation_IERE.pdf [Accessed 12
Oct. 2011].

168
[34] Ghanaati, O. ; Dept. of Electr. Eng., Islamic Azad Univ., Abadeh, Iran ;
Seirafian, V.R. ; Naderpour, I. ; Teymouri, J. Power System Security Improvement
with Optimal Placement of FACTS Devices Using Genetic Algorithms, Computer
Applications and Industrial Electronics (ICCAIE), 2011 IEEE International
Conference on, 4-7 Dec. 2011, Penang
[35] Rajive Tiwari, Member, IEEE, K.R.Niazi, Senior Member, IEEE, Vikas Gupta
‘Optimal Location of FACTS Devices for Improving Performance of the Power
Systems’ Power and Energy Society General Meeting, 2012 IEEE, 22-26 July 2012,
San Diego, CA.
[36] R. Mohamad; Khairuddin, A.; Mustafa, M. W.; Kalam, A. (2010), ‘Optimal
allocation of multi-type FACTS devices using bees algorithm for ATC enhancement in
deregulated power system’, International Review of Electrical Engineering-Iree, 5 (2),
Mar/Apr2010 Part B, Vol. 5 Issue 2, p644644 – 651.
[37] Mathur, R. and Varma, R. (2002), ‘Thyristor-Based FACTS Controllers for
Electrical Transmission Systems’, IEEE Press Series on Power Engineering, New
York: Wiley, p. 448-455.
[38] Ghosh, A. and Ledwish G. , ‘Power Quality Enhancement Using Custom Power
Devices’, Kluwer Academic Publishers Group, Boston, USA, 2002.
[39] Sen, K.K. Westinghouse Electro-Mech. Div. Technol. Centre, “Comparison of
the "Sen" transformer with the Unified Power Flow Controller” Power Delivery, IEEE
Transactions on Oct. 2003.
[40] Singh B., Verma K.S., Singh D., Singh C.N., Singh A., Agrawal E., Dixit
R.,Tyagi B. - Introduction to FACTS Controllers: A Critical Review. International
Journal of Reviews in Computing, 31st December 2011. Vol. 8.
[41] Sen, K.K. and Stacey, E.J. (1998), ‘UPFC- Unified Power Flow Controller:
Theory, Modeling and Applications,’ IEEE Transactions on Power Delivery, vol. 13,
no. 4, pp. 1453-1460.
[42] Professor Arindam Ghosh Power Electronics Lectures, Dept. of Electrical
Engineering, Indian Institute of Technology Kanpur, India
[43] Consultancy Service for Detailed Preliminary Feasibility Assessment of Various
Types of Combined Concentrated Solar Powered seawater Desalination Technologies
Including Power & Water Infrastructures. Qatar National Food Security Program,
Final Report, Main Text, March 2010, SOGREAH.

169
[44] T. J. Liang, J.-L. Shyu (2004), ‘Improved DSP-controlled online UPS system
with high real output power’, IEE Proceedings - Electric Power Applications, vol. 151,
no. 1, pp. 121-127.
[45] C. Ketkaew, O. Noohawn, N. Klairuang, “Outage cost of industrial customers in
distribution and sub-transmission systems for reliability improvement,” UPEC2010,
August 2010.
[46] F. Roos, “Electricity Supply Reliability – Evaluation of Improvement Solutions
for Existing Electricity Networks.”, Licentiate Thesis, 2005, Department of Industrial
Electrical Engineering and Automation, Lund University, Sweden, http://www.iea.lth.se
, ISBN 91-88934-41-1
[47] P. Linares, L. Rey, “The costs of electricity interruptions in Spain. Are we
sending the right signals?, WP FA5/2012, Alcoa Foundation
[48] REE Interruptibility Service:
www.ree.es/ingles/operacion/servicio_interrumpibilidad
[49] Spanish Ministry of Industry, Tourism and Commerce: Orden ITC/2370/2007,
de 26 de Julio.
[50] K. Keller, B.F.C, Franken, “Quality of supply and market regulation; Survey
within Europe”, KEMA Report for European Copper Institute, December 2006.
[51] CEER, “5th CEER Benchmarking Report on the Quality of Electricity Supply”,
2011
[52] A. Ferreira, “Reliability Reduction in Electrical Installations Due To Equipment
Overload”, IEEE Latin America Transactions, Vol. 6, Issue 1, 2008.
[53] D. Elmakis, A. Braunstein, Y. Naot, “A probabilistic method for establishing
the transformer capacity in substations based on the loss of transformer expected life”,
IEEE Transactions on Power Systems, Vol. 3, No. 2, 1988.
[54] R.R. Foy, K.G. Kutlev, U. Anderson, “Selecting reliable and cost effective
power systems for oil & gas facilities”, PCIC Europe 2010 Conference, 2010.
[55] RENI, “PV Power Plants 2012: Industry Guide” www.pv-power-plants.com
[56] Clean Energy Action Project, www.cleanenergyactionproject.com
[57] F. Boshell, O.P. Veloza, “Review of developed demand-side management
programs including different concepts and their results”, IEEE/PES Transmission and
Distribution Conference and Exposition: Latin America, 2008.
[58] M. Matienzo, W. Laboguin, J. Jucar, “Economics between conventional and gas
insulated substation: A project decision”,
www.geocities.ws/march_matienzo/GIS_Substation.pdf

170
[59] “Laois-Kilkenny Reinforcement Project: Technical comparison of AIS and GIS
Substation Options” PE595-F1268-R268-003-003, ESBI Engineering Solutions for
EIRGRID, 2011
[60] W. Zimmermann, A. Osterholt, J. Backes, “Comparison of GIS and AIS
systems for urban supply networks”, ABB Review 2/1999
[61] A. Klein, “Comparative Costs of Energy: Coal, CCGT, Wind”, Emerging
Energy Research, 2006
[62] http://www.power-technology.com/projects/uskmouth/, Uskmouth power
stations
[63] A. Klein, “Comparative Costs of Renewable Power Generation”, Emerging
Energy Research, 2006
[64] M. Beaudin, H. Zareipour, A. Schellenberglabe, W. Rosehart, « Energy Storage
for mitigating the variability of renewable energy sources”, Energy for Sustainable
Development, Issue 14, pp. 302-314, 2010
[65] A. Klein, “US Utility-Scale Battery Storage Market Surges Forward-Market
View”, NARP 825-110928, EER, 2011
[66] IEEE C37.118-2011 “Standard for Synchrophasor Measurements for Power
Systems”.
[67] IEEE C37.118.2-2011 “Standard for Synchrophasor Data Transfer for
Power Systems”.
[68] IEC, 68150 “Standards for electrical substation automation”.
[69] IEEE C37.118-2005 “Standard, Synchrophasors for Power Systems”.
[70] IEEE C37.114-2004 “Guide for Determining Fault Location on AC
Transmission and Distribution Lines”.
[71] Lin Du Caisheng Wang ; Xianzhi Li ; Lijun Yang ; Yan Mi ; Caixin Sun
(2010), ‘A Novel Power Supply of Online Monitoring Systems for Power
Transmission Lines’, IEEE Transactions on Industrial Electronics, vol. 57, no. 8, pp.
2889-2895.
[72] Abbey, C., Wei Li, and Joos, G. (2010), ‘An Online Control Algorithm for
Application of a Hybrid ESS to a Wind–Diesel System’, IEEE Transactions on
Industrial Electronics, vol. 57, no. 12, pp. 3896-3904.
[73] Bejhat , V., Vahedi, A., Setayeshmehr, A., Borsi, H., and Gockenbach, E.
(2011), ‘Diagnosing Shorted Turns on the Windings of Power Transformers Based

171
Upon Online FRA Using Capacitive and Inductive Couplings’, IEEE Transactions on
Power Delivery, vol. 26, no. 4, pp. 2123-2133.
[74] B. Mohammadi-Ivatloo, M. Shiroei, and M. Parniani, (2011), ‘Online small
signal stability analysis of multi-machine systems based on synchronized phasor
measurements’, Electric Power Systems Research, vol. 81, no. 10, pp. 1887-1896.
[75] Wei, L., Guo, W., Wen, F., Ledwich, G., Liao, Z., Xin, J. (2011), ‘An Online
Intelligent Alarm-Processing System for Digital Substations’, IEEE Transactions on
Power Delivery, vol. 26, no. 3, pp. 1615-1624.
[76] Younghyun Kim ; Sangyoung Park ; Youngjin Cho ; Naehyuck Chang (2011),
‘System-Level Online Power Estimation Using an On-Chip Bus Performance
Monitoring Unit’, IEEE Transactions on Computer-Aided Design of Integrated
Circuits & Systems, vol. 30, no. 11, pp. 1585-1598.
[77] S. Chakrabarti, E. Kyriakides, G. Ledwich, A. Ghosh (2010), ‘Inclusion of
PMUs current phasor measurements in a power system state estimator’, IET
Generation, Transmission & Distribution, vol. 4, no. 10, pp. 1104-1115.
[78] W. Li, Y. Wang, T. Chen (2010), ‘Investigation on the Thevenin equivalent
parameters for online estimation of maximum power transfer limits’, IET Generation,
Transmission & Distribution, vol. 4, no. 10, pp. 1180-1187.
[79] R. Agha Zadeh, A. Ghosh, G. Ledwich, F. Zare (2010), ‘Online estimation of
distorted power system signal parameters’, IET Generation, Transmission &
Distribution, vol. 4, no. 6, pp. 746-755.
[80] J. Yang, W. Li, T. Chen, W. Xu, M. Wu (2010), ‘Online estimation and
application of power grid impedance matrices based on synchronised phasor
measurements’, IET Generation, Transmission & Distribution, vol. 4, no. 9, pp. 1052-
1059.
[81] Jamal BEIZA, Seyed Hossein HOSSEINIAN, Behrooz VAHIDI(2010), ‘Fault
detection and identification for voltage sag state estimation in power systems’, Turkish
Journal of Electrical Engineering & Computer Sciences, vol. 18, no. 4, pp. 665-675.
[82] R. Singh, B.C. Pal, R.A. Jabr (2009), ‘Choice of estimator for distribution
system state estimation’, IET Generation, Transmission & Distribution, vol. 3, no. 7,
pp. 666-678.
[83] C. Rakpenthai, and S. Uatrongjit, (2008), ‘Improved Power State Estimation
Based on Rectangular Coordinates’, AIP Conference Proceedings, vol. 1052, no. 1, pp.

172
[84] P. Ju, F. Li, N.G. Yang, X.M. Wu, N.Q. He (2004), ‘Dynamic equivalents of
power systems with online measurements’. Part 2: applications’, IEE Proceedings -
Generation, Transmission & Distribution, vol. 151, no. 2, pp. 179-182.
[85] W. Du, Z. Chen, H.F. Wang, R. Dunn(2009), ‘Feasibility of online collaborative
voltage stability control of power systems’, IET Generation, Transmission &
Distribution, vol. 3, no. 2, pp. 216-224.
[86] Miao He ; Junshan Zhang ; Vittal, V. Sch. of Electrica, Computing & Energy
Engineering, Arizona State Univ., Tempe, AZ, USA ; ‘A data mining framework for
online dynamic security assessment: Decision trees, boosting, and complexity
analysis’, Innovative Smart Grid Technologies (ISGT), 2012 IEEE PES
[87] In-Kwon Park, A. M. Gole, Paul Forsyth, Rick Kuffel (2011). ‘Hardware in the
loop optimization using a real-time simulation environment’. Paper presented at “The
International Conference on Power Systems Transients”, Delft, The Netherlands.
[88] Siemens AG. (2011), ‘PSS®E’, ‘PSS® SINCAL’ Power Systems Simulator
Softwares, Available at: “http://www.energy.siemens.com/hq/en/.Siemens Energy
[Online Jan. 2014], and at: http://www.energy.siemens.com/us/en/services/power-
transmission-distribution/power-technologies-international/software-solutions/pss-
e.htm [Accessed 12 Oct. 2011].
[89] K. Meng, Z.Y. Dong, K.P. Wong, Y. Xu, F.J. Luo (2010), ‘Speed-up the
computing efficiency of power system simulator for engineering-based power system
transient stability simulations’, IET Generation, Transmission & Distribution, vol. 5,
no. 5, pp. 652–661.
[90] Chen, Y., Wang, X., Liao, G., and Wang, W. (2009), ‘User Defined Excitation
System Models in PSS/E’, Power System Technology, vol. 18, DOI: CNKI: SUN:
DWJS.0.2009-18-016.
[91] Zhi Ding, Jing Ge, Wei Cao, Xiao Qi, Wen Yang (2011), ‘A Comparison of
Short-circuit Decaying Calculation Between PSS/E BKDY and Computational Curve’,
Advanced Materials Research, vol. 354-355, no. 2012, pp. 1126-1131.
[92] Vargas, R., Sellschopp, F., Arjona, M., and Diaz, D. (2008), ‘A Matlab-based
tool for power system dynamics analysis: A comparison with PSS/E’, 43rd
International Universities Power Engineering Conference, pp. 1-5.

173
Appendix-A: - PSS®E Software used for Power System Analysis in
the Study
The PSS®E software mentioned in the previous chapter, as stated, has been a common
choice in academia and professional development alike. The PSS®E software [88] potential is
so commonly used in the field. The earliest version initially developed by Power Technology
Incorporation (PTI) of USA in 1976 (PTI is part of Siemens AG since 2005), the Power
System Simulator for engineering program is currently one of the most comprehensive
programs that harness available technology. According to the Siemens (2011) website, the
program is “the premier software tool used by electrical transmission participants” world-wide.
The probabilistic analyses and advanced dynamics modelling capabilities included in PSS®
E
provide transmission planning and operation engineers a broad range of methodologies for use
in the design and operation of reliable networks. PSS®E is the standard Siemens offering for
electrical transmission analysis that continues to be the technology of choice in an ever-
growing market that exceeds 120 countries [88]. Meanwhile, despite its past rivalling with
programs created with freely available developing tools by experts in academia in previous
years, the program is asserted to have the most features, best performance, and highest
potential for simulating power systems. PSS®E has primarily been designed to simulate,
assess, and facilitate optimization of systems, the program integrates processes and features in
the areas of power flow, network reduction, transfer limit analysis, dynamic simulation,
optimal power flow, balanced fault analysis, unbalanced fault analysis, extended terms
dynamic simulation, open access and pricing, reactive power sizing, probabilistic assessment,
and more [88] . PSS®SINCAL [88] is another Siemens’ software version has also been created
to address power system simulation in areas other than electrical networks, such as water,
heating, gas, and other areas, incorporating features which allow it to facilitate the demands of
utility companies, municipal services, industry, or even consulting firms. With this, features
include power flow, short circuit, harmonics, probability and reliability, dynamic simulation,
protection, load forecast, cost assessments, and steady state and dynamic analyses for pipe
network modules [6], [88]. Both programs offer a uniform GUI interface while providing
sector processing, an open database, multiple modes of graphical display (i.e. schematic and
topical), internet compatibility, GIS and SCADA interfaces with CIM standard. While the
practical features of the program had been effectively mirrored by the program discussed by
[33], the advanced technology and features of Siemens PSS®E continue to be used by the
assumedly widest range of experts and professionals. Other results revealed similarities in

174
many areas with another program, concluding that the two programs were directly comparable
overall, and supporting the concluding assertions of, that expert skills are more of a limiting
factor than available technology in the field [33].
The research analysed the success of PSS®E in the power industry, reporting on the
usefulness of the simulation and analysis features [89]. Pointing out that stability analysis,
strategic planning for power systems and market deregulation affects the development of
simulation techniques and network expansion, the researchers stated that the increasing size of
networks and growing expenses further increase the value of simplifying any area [30].
Assessing the potential for an EnFuzion-based approach to computing in simulating large and
complex networks in PSS®E, examining a 39-bus power system. EnFusion is basically using
parallel computer to run simulations at the same time, especially idle computers, as this will
make the simulation/analysis faster. Following multiple contingency analyses and an
assessment of optimal power flow, it was determined that the applied method was one capable
of increasing the speed of simulations and reducing elapsed time, while additional computer
nodes proportionally facilitate these improvements [89]. Praising PSS®E’s potential to conduct
useful functions benefitting power system assessments through fault analyses, dynamic
simulations, and power flow, the authors criticize the time and effort required for multiple case
analyses involving any combination of expansive systems. The authors state “although a
program can be manually split into several separate jobs which can be run simultaneously on
multiple computers, the process was labour-intensive and susceptible to errors [89]. All of such
means rapid increase in computing requirement for system operations, particularly in real-time
dynamic security assessment. Distributed computing, a form of parallel computing is one of the
direct results of the need to meet large-scale and complex computational demand common in
many fields. It involves the integration, cooperation and management of network computers.
The main goal of distributed computing system is to connect users and resources in a
transparent, open and scalable way. Moreover, the internet allows simulation projects to be
developed from a wider range of developers, improving the capacity to solve problems, and
decreases the amount of time required for project completion. The EnFuzion software
addresses these needs while it can be further applied to other areas, such as energy,
engineering, telecommunications, three dimensional rendering, and more. The capacity of the
technology facilitates ideal simulations through a high reliability, GUI, support of multiple
platforms, efficient network use, a ‘strong robustness,’ and more. As this was applied to
generate successful and desirable results in the research, future technology would similarly

175
benefit from addressing the aforementioned needs through these, similar, or improved
approaches.
Researchers studied user defined excitation system models in PSS®E, citing the
popularity of PSASP and BPA in the Chinese power industry, while a range of excitation
system models used built with PSS®E [90]. The study validated the effectiveness of user-
defined excitation system modelling, and demonstrated the potential of simulations ran through
a single-machine infinite bus system [6], [90]. Later, other researchers would assess dynamic
simulations in PSS®E, emphasizing computational curves, current decrement, and calculations
[91]. The results of the analysis would show that the accuracy of the applied PSS®E BKDY
simulation was desirably high, although the computational curve analysis proved to generate
errors as a result of its conservative nature [91]. The potential for conservative nature to affect
simulation and generate errors was stressed in the concluding discussion of the research, as was
the general demand for dynamic analysis for short-circuits in the power system. It is very
important to calculate the short-circuit current for selecting electrical equipment, configuring
protective relaying, and automatic devices. The authors further explain that short-circuit
current calculation which only requires network infrastructure details, considering steady state
power flow while generating values for the periodic element of current, is a convenient
calculation now available in the majority of power system simulation software [6], [91].
Figure 76 below depicts multiple aspects of power systems and simulation, while these
areas can contribute to the path of research and development in the field [92]. A new research
presented and assessed the capacity for a recently improved simulation program to emulate the
electrodynamics of a modern power system. The program was planned to be integrated with an
online security program monitoring power distribution in a large area of northern Mexico [92].
Figure 76: Areas in power system and simulation development [92]

176
Although this simulation program had first been created and developed to suit the needs
of academic and research, the C++ and MATLAB based software was perfected using
numerical libraries, differential and algebraic equations, and public licensure [6], [92]. While
emphasizing transient stability analysis, the authors explained how even such a program, using
common software development tools, could rival the PSS®E software potential so commonly
used in the field.
Their results revealed similarities in many areas, concluding that the two programs
were directly comparable overall, and supporting the concluding assertions of [33], that expert
skills are more of a limiting factor than available technology in the field.

177
Appendix-B: - Research Dissemination Artefact and Plan
The Dissemination Artefact
This brief chapter provides a dissemination artefact and plan, considering both the
literature and the research findings. The dissemination artefact plan provides a more dynamic
and direct course of action for improving Qatar systems. This thereby summarizes the key
findings of the results while applying them to an organized methodology for future research
and development. This dissemination artefact and plan is designed as a formal call for action
for progressive development and further research as it is presented in a way which is ideal for
future publication.
It is therefore the intention of this chapter to outline all significant elements of research
and findings in a communicable way, facilitating the expansion of the existing knowledge base
as well as the continuation of developmental efforts and research. While development in power
electronics and transmission is outlined by the combined findings clearly demonstrated the
potential for improvements and progressive development for power systems in the near future.
These findings and recommendations support the findings and recommendations generated
from this research and analysis.
The primary aspect of recommendations for improving Qatar transmission systems is to
integrate a flexible and comprehensive online system capable of wide-area control, monitoring,
and generating (as well as storing). Meaningful data which can be used to assess output,
potential faults and causes, and substation functions; meanwhile, this system should remain
flexible for the integration of FACTS devices and smart power grids, particularly the
increasing integration of power controllers and the expansion of the Qatar distribution system.
The research results will be communicated through publications at international
conferences, seminars, professional journals, meetings etc. for calibre Institute such as US
(IEEE), and UK (IET). The research findings will also be disseminated nationally through
publication in related to electrical engineering and energy conversion (e.g., IEEE, IET). The
research team also intends to establish a course on FACTS compensation controlled via
synchrophasors with time synchronized data from wide area measurements and controls. The
literature presented provides a foundation for a dissemination artefact and plan, while the

178
resources used for this analysis met specific inclusion criteria to be used and applied for the
subsequent analysis and presentation of the dissemination artefact and plan.
The final key important element of recent case analysis and research of the integration
of enhancing technology into the Qatar system was a cost analysis. Although this does not
directly relate to the implementation of online controls, it shows a great deal of the general
demand for resources, funding, and organisation for a substantial expansion or development
initiative to the nation’s power systems. The integration of online software beyond this point
would be much less, although it could range greatly depending on both the functions of the
software and the level of integration with improving developments (such as those outlined).
It is assumed that the improvement of technology recommended would facilitate
adaptability and improving controls in the following years, while this shows that there is
worthwhile potential for the (additional) integration of effective and efficient online controls.
Closing the analysis, it is recommended that on-going research in the area examine the
economics in greater detail, and investigate the nature of additional communications assisting
the power controls (which could be integrated with a study of online controls).
HVDC Journal Paper Outlines
The paper discusses how to incorporate HVDC Power Transmission in QPTS. It started
with the introduction, background, scope of research, and project approach. The paper
contains, the general comparison of HVDC and HVAC Transmission, characterization of
transmission needs, applying HVDC and AC Technologies to meet Qatar’s System needs,
Power Flow control with AC or DC. Operation performance of HVDC systems in the world
was reviewed and compared with AC transmission systems for general criteria for evaluation
and principal benefits of DC Transmission. The study comprised the optimal use of limited
corridors by converting AC to DC giving an example of technical issues for converting double
–circuit 230 kV to 188 kV DC (our lines/cables are 220 kV), converting single-circuit radical
AC line to DC for increased reliability and DC transmission line and AC transmission lines on
same row. The Modelling of HVDC part with links in AC Systems explained the techniques of
how to model HVDC followed by modelling and analysing HVDC in Qatar transmission
system. The relative cost of HVAC and HVDC transmission options is discussed taking into
account the heavier line loading will increase losses, The break even distance between DC and

179
AC, variation in break-even distance with loading and contingencies and the value of lost
transfer capacity.
The Dissemination of the Research project
To disseminate essential part of the research, it is intended to submit a power systems
transaction paper. The paper is about modelling an HVDC/UPFC to control the flow of power
(steady-state/transient) in Qatar transmission network, thereby avoiding loop flows. PSS®E
software is used for the modelling and simulations of the HVDC and FACTS devices in the
power network model.
There were communications with Editor of IEEE Transaction, to make sure that the
paper meets the transaction criteria considering the fact that there are few HVDC/FACTS
devices in the region in general, but not in Qatar and if this paper is implemented, it would be
first in Qatar. The IEEE Transaction Editor response, that the paper is to prove to the editor and
peer reviewers that what we are presenting the six key attributes of what an archival
publication needs.
The Journal is the PES Transaction and the contact was done with IEEE PES Executive
Office, at 445 Hoes Lane, Piscataway, NJ 08855-1331 USA, fax: +1 732 562 3881, e-mail:
[email protected]. The Editor was informed of the intention to submit a power systems transaction
paper. The paper is about modelling an HVDC/UPFC to control the flow of power (steady-
state/transient) in Qatar transmission network, thereby avoiding loop flows. It also includes
using STATCOMS to improve the voltage profile of the network in dynamic/transient stability.
The Transaction Editor name is François Bouffard, Ph.D. and he is Assistant Professor
and Member, GERAD at the Department of Electrical and Computer Engineering, McGill
University, 3480 University Street, room 535 Montreal QC, Canada H3A 0E9 at the telephone
+1 514 398 2761, email [email protected] and site, www.ece.mcgill.ca/~fbouff1.
The transaction Editor's responded to our request and has referred us to Section 8 of the
IEEE PES Authors' Kit: http://www.ieee-pes.org/part-8-reviewer-and-editor-guidelines. The
Editor’s advice was that the job in the paper is to prove to the paper editor and reviewers that
what you are presenting meets the six key attributes of what an archival publication needs. The
requirements for a transaction paper includes: a new idea/innovation, something that will

180
contribute towards the advancement of knowledge, something that has never been done before,
etc. Next sub-section outlines the transaction paper to be published in the IEEE, PES.
There are no HVDC or UPFC in Qatar or in Qatar in general. So if this study is
implemented, it will be first in the region and will satisfy the requirements of the PES
Transactions. The next chapter presents the details of the case study carried and the results. The
case study itself was described in more details in the Case Studies Chapter.
Introducing HVDC Transmission in Qatar Transmission System
The goal of this section is to develop an assessment of Qatar national electric utility
system’s need for electric transmission during the period 2013 to 2030 that could be met by
HVDC transmission system. The assessment is to include both the technical and economical
evaluation of HVDC transmission system in comparison with conventional AC transmission
systems as well as with Flexible AC Transmission System (FACTS). The section looked at
Qatar’s electricity network challenges to supply new load interconnection requests at remote
locations as well as to ensure the reliable operation of the existing network in light of the
increasingly growth of load. The possible roles for HVDC transmission to solve these
challenges are explored and then compared with AC transmission both technically and
economically.
The load demand of Qatar’s transmission system is increasing rapidly due to the
country’s expansive infrastructural developments. This expansion will continue in the next 17
years especially with the anticipated world cup football tournament in 2022 and Qatar National
Vision 2030. The expansion will be challenging as it will increase QPTS load density. As the
load density increases, the need to control the flow of power to avoid loop flows will become
an inevitable. At the same time, the demand for power from remote and isolated locations far
from the generating plants to feed the oil and gas companies’ industrial loads will pose
significant challenges to the network. Conventional AC transmission systems alone cannot
solve these challenges. FACTS devices and HVDC should be incorporated in the network to
help solve some of these challenges.

181
Scope of Research
The first task of this research is to look at Qatar’s current and future transmission needs
with the emphasis on the application of HVDC transmission system to solve these needs.
Technical evaluation of the HVDC with traditional AC and FACTS devices will be analysed in
this task. The second task of this research is to do an economical comparison of applying
HVDC technology to Qatar’s transmission network with the implementation of AC or FACTS
devices. The third and last task of this research is to model and HVDC transmission in QPTS
and analysed its performance.
Qatar Transmission Needs
This section identifies the future needs for new transmission facilities and re-
enforcements to the current transmission network. Predicting the future needs of Qatar’s
transmission network, as in predicting any other country’s transmission network, is
complicated. However, unlike most utilities, Qatar’s electricity utility is experiencing a rapid
growth due to the extreme demand for electric power to feed the oil and gas industries in
remote areas. Furthermore, the rapid infrastructural development in the urban areas is
stretching the existing transmission network to its limits. The need to reliably and
economically meet the increasing demand for generation from remote areas to supply the
industrial demand and the load demand from the massive infrastructural expansion of the urban
areas are two of the most complicated challenges face by Qatar’s electricity utility company
today. These challenges will become more complicated in the next 17 years.
For the near term, the increasing load demand in the urban areas can be met by the
power plants that are located near urban load centres and by the re-enforcements of the existing
urban network. Eventually, due to the massive urban expansion, the generating plants near the
urban load centres will not have any reserve capacity left in them and all the near-load sites
suitable for new generating plants will be all occupied. Similarly, there would be no available
right of way for transmission re-enforcements. The nation’s electric utility would be inevitably
forced to use unconventional solution options such as the application of distributed generation,
FACTS or HVDC to reliably feed the load would have to be implemented.
As the only electric utility company of an oil producing nation, the electric utility of
Qatar supplies power to remote and isolated oil fields and other industrial facilities that are far

182
from the generating plants, where very little or no transmission infrastructure is available. Most
of the transmission network of QPTS consisted of cables. As such, supplying power to remote
and isolated loads can be very challenging because transmission cables cannot reliably transfer
power for very long distances. In addition, it is difficult to control the flow of power to reliably
supply remote and isolated loads. Since generating plants are far away from these loads, their
dispatch pattern will have very little impact in avoiding loop flows.
Building new power plants near the remote and isolated loads centres could be very
costly. As such, possible feasible solutions to supply remote and isolated loads that are far from
the rest of the network are through the application of FACTS devices and HVDC transmission
technology. For shorter distances, FACTS and HVDC transmission can transfer the same
amount of power. However, for long distances, as in the case of remote and isolated loads in
Qatar, the HVDC system can transfer up to twice as much as FACTS devices of similar
operating voltage can do. The next section will explore the possible solutions of meeting
Qatar’s transmission needs with conventional AC network, FACTS and HVDC transmission.
Meeting Qatar Transmission Needs with HVDC and AC Transmission
This section starts by briefly comparing DC and AC transmission. Then it defines two
functional needs of the Qatar transmission network that requires the enhancement of the
transmission network. Lastly, it explores how DC and AC, with and without FACTS
applications are likely to meet those needs.
Comparisons between AC and DC have been made since the infancy of the electricity
industry. Over the years, HVDC has been proven to be economically competitive for long
transmission lines in addition to being the technically feasible solution for mid-distance and
long transmission cables. It is also the only practical way of interconnecting systems that have
different frequencies, which is not a functional need of Qatar transmission system. This section
will compare the application of HVDC and AC to the functional needs of Qatar transmission
network. Two functional needs of Qatar transmission system that requires the transmission
enhancements in the near future are the need to feed remotely isolated industrial loads and the
need to reliably feed the growing load demand in the urban areas. Both requirements will
challenge the transmission network to control the flow of power by optimally utilizing the
existing transmission network in order to avoid loop flows.

183
Among the remotely isolated load areas in Qatar are ones that are virtually isolated by
distance from the main grid such as the industrial loads at Dukhan and Umm Bab areas [1].
Unfortunately for such loads, there are no local generations to feed them. As such, they are fed
by power plants that are far away. Sometimes, as in the case with Dukhan and Umm Bab loads,
these loads are connected to the main grid through parallel transmission lines that have
different distances [1]. As load grows in the area, there is the potential for one of the parallel
transmission lines to be under-utilized relative to its thermal capacity while other is heavily
loaded. Currently, this is the problem the 132 kV network at Dukhan and Umm Bab is facing.
This parallel flow inequity, loop flow, is very difficult and costly to mitigate [14].
Especially in Qatar and in particular the 132 kV network at Dukhan and Umm Bab
areas, where this problem cannot be solved through generation dispatch since the power plants
are far from the loads. The choice between installing local generation and controlling the flow
of power on the transmission lines has to be made. It is very costly to install new generating
plants in remote and isolated areas since for the most part; they will be under-utilized. As such,
installing local generation would not be the most feasible solution. Similarly, due to the length
of the 132 kV transmission lines at Dukhan and Umm Bab [1], phase angle regulating
transformer or line series compensators will not be effective in controlling the flow of power
[14]. Furthermore, line series compensators are less flexible in controlling the flow of power.
On the other hand, FACTS devices or HVDC will be very effective to precisely control
the flow of power on transmission lines to different desired values [63]. However, FACTS
devices cannot match the range of power flow modulation possible with HVDC transmission,
especially if power flow reversal is required [14]. Furthermore, unlike HVDC transmission, for
long AC transmission lines, simply forcing active power flow on desired paths by using
FACTS devices will increase losses in the system [14]. As such implementing an HVDC
transmission would be better than FACTS devices to solve the loop flow problem at Dukhan
and Umm Bab 132 kV network.
This research will look at integrating an HVDC line at the Dukhan and Umm Bab area
to control the flow of power. The existing transmission line at Dukhan will be converted to an
HVDC. This will avoid the need for a new right of way for the HVDC. Modelling and
simulation of the HVDC will be done with Siemens Power Technologies (Siemens PTI) power
systems analysis software, PSS®E. The modelling and the analysis of the HVDC will be
presented in the later chapters.

184
Another type of remote and isolated industrial loads in Qatar are the physical islands of
oil and gas fields that are located some distance from the main grid. These islands could
produce their own local generation to feed their load. However, as their load increases and the
need for reliability and power quality becomes a requirement, the islands will have to be
interconnected to the main grid. An AC or DC cable interconnection to the main grid will
provide better reliability, frequency control and voltage regulation than isolated operation.
Furthermore, imported power is likely to be less expensive than local generation.
The load demand of an island and its distance from the main grid would determine
whether AC or DC cable should be used. The larger the load demand of an island, the higher
the voltage level of connection to the main grid would be. High voltage AC cables must be
limited to short lengths to avoid excessive charging current from consuming the capacity for
active power transfer. At the transmission voltage level, the submarine AC cable length is
limited to about 70 km due to this problem. No FACTS devices can remedy this problem as of
now. A possible solution would be underwater switching stations with submarine reactors, the
cost of which makes an HVDC transmission more attractive.
In addition, the power quality and voltage support requirements at the load would
increase the cost of the submarine AC cable, unless if local generation is available to provide
the reactive power compensation needed at the load end. For higher load level and long
distance from the main grid, HVDC transmission is the feasible option, technically.
Furthermore, in the case where the primary intention of interconnecting the island to the main
grid is for better reliability, better frequency control, and better voltage regulation, the HVDC
transmission would be the feasible choice even for short distances. Power quality is equally as
important as reliability for oil and gas industries because it impacts their production level.
Unlike a submarine AC cable, an HVDC transmission will isolate the disturbances at the main
grid from reaching the islands. Therefore, another potential place in Qatar to install an HVDC
is at Halul Island, an oil and gas producing island which is about 100 km from the main
transmission network of Qatar at Ras Laffan.
Lastly, the need to feed the growing load demand in the urban areas, another functional
need of Qatar transmission system that requires transmission enhancement in the near future, is
a very challenging task that cannot only be solved with conventional AC transmission. The
demand for electricity in the city of Doha and surroundings will continue to grow rapidly even
with the use of demand side management. The continue load growth in the urban areas coupled
with the retirement of some of the power plants feeding these loads will eventually require

185
added generation. However, as the population grows in the city, new generation, large or small,
will be impossible to site. As such the growing load demand must be met with increase in
import capacity of the transmission network.
Since new right of way will become extremely difficult to obtain, the existing right of
ways must be exploited. The ratings of the transmission cables might be upgraded and
increased. Their operating voltages might also be increased in other to transfer more power;
however, this might require more right of way than already existing. In cases where lines
serving load centres are underutilized while other are over loaded, conventional techniques can
be implemented to reroute the power flow in order to maximize the total import by using
phase angle regulating transformers (PAR) or re-dispatching generation patterns since the
power plans are not that far from the loads. Eventually, all of these conventional solutions
might not suffice as load continues to grow. Furthermore, the transfer of AC power will be
limited due to any one of the following reaching their limits: rotor angle stability constraints,
steady state voltage constraints, or voltage stability constraints.
The use of FACTS devices and HVDC transmission will have to be implemented.
Power would have to be imported from generating plants that are far away from the urban
areas. As such, the amount of power that can be transported on a given transmission right of
way, power density, would be important. For shorter transmission lines, the power density of
FACTS devices is comparable to that of HVDC transmission. But eventually as new power
plants are build farer from the city the power density of an HVDC transmission could be up to
twice that of a three phase AC line with similar operating voltage. Furthermore, there would be
very little power losses for the HVDC compared to the AC line.
In addition, an HVDC will be very attractive to load centres, since its inverters can
provide the reactive power needed by the loads. This will be particularly important to load
centres that lost generators due to retirement. If there was no local generation to begin with at
these load centres, an HVDC would be superior to adding a local generation. The reason for
this is because an HVDC transmission would require less space in addition to it would not
increase the short circuit current as a generator would. It can in fact reduce the short circuit
current levels. This will be particularly important to QPTS where the electricity network is
currently experiencing high short circuit current levels. As mentioned earlier, as load grows in
the urban areas, it is inevitable that certain AC lines will be under-utilized while other AC lines
are overloaded. If the under-utilized AC lines are replaced by HVDC transmission, the
effective increase in power transfer capability will be even greater than the difference between

186
the AC and the DC line ratings alone. The reasons for this are that the desired power will be
forced to flow on the converted line that was previously underutilized and that the parallel AC
lines that were overloaded would be better utilized.
Operational Performance of HVDC in the World
Deciding whether to use an HVDC or AC system should depend not only on the cost
but also on the performance. Power quality and reliability of the system in commercial service
should be the primary concerns of any transmission planning engineer. This section looks at
the operational performance of an HVDC system by evaluating the commercial performance of
the already installed HVDC systems. This information will help power system engineers in
deciding whether to use an HVDC or AC system. In particular, this section will look at the
energy availability of an HVDC system, the energy utilization of an HVDC system, the energy
unavailability of an HVDC system, and the transient performance of an HVDC system.
The energy availability of an HVDC is the amount of energy that could be transmitted
by an HVDC except due to limitation of transmission capacity following a planned or
unplanned contingency. The energy availability of an HVDC is influenced by the availability
spare equipments, stages of the construction which will affect the scheduled unavailability of
power, system operational requirements such as low system demand which might
economically allow the extension of outages beyond a minimum time, thus affecting the forced
and scheduled unavailability. The average annual system availability of HVDC with thyristor
valve system installed in the world is higher than 97 percent. This is an excellent performance.
For the QPTS in particular, the available of energy is very important since the potential places
in the system where an HVDC could be connected are the urban areas, and the remote and
isolated places to supply power to oil and gas industries. Any service interruption at the remote
and isolated places will result to a significant loss of revenue for oil and gas industries.
Furthermore, once the energy is available again, it will take a lot of time for the production of
gas and oil to reach their peak levels.
The average annual energy utilization of HVDC installed in the world is about 50
percent. Energy utilization is the amount of energy transmitted over an HVDC system based on
its rating. It should be noted that individual HVDC system energy utilization varies from year
to year depending on the demand and the availability of fuel such and wind and hydro
resources. Based on these factors, it is safe to conclude that the potential energy utilization of
HVDC in Qatar would be significantly more than 50 percent because the potential locations of

187
an HVDC in QPTS are in urban areas, where the demand for energy is very high and in remote
and isolated areas to feed industrial loads, where the demand for energy is also very high and
constant for the most part. Furthermore, the availability of unpredictable fuel such as wind and
hydro would not be an issue in Qatar since all of the power plants in QPTS are gas or
combined cycle.
Energy unavailability is the amount of energy that could not have been transmitted in
the transmission system due to scheduled or forced outages. A scheduled outage is one that has
been planned well in advance with a predetermined duration while a force outage is one that
was not planned. A forced outage is defined by either a fault that is cleared by manual
restoration or the failure of a power plant or equipment that would require repair or
replacement. The average forced outages of an HVDC thyristor valve system is about 1.1
percent. The average total energy unavailability of an HVDC thyristor valve system is about
5.6 percent. In transient performance, an HVDC system performance is considered adequate if
the transmitted power returns to the level of being transmitted prior to a fault that resulted to a
voltage drop below 90 percent of the pre-fault voltage. In more than 98 percent of the times,
the transient performances of the installed HVDC systems in the world are considered
adequate. In conclusion, the installed HVDC systems in the world show an excellent
performance and reliability.
Relative Cost of HVDC and HVAC Transmission Options
This section does an economic comparison between an HVDC and HVAC transmission
in terms of the classical break-even distance. As stated earlier, the level of transmission loading
in QPTS is expected to increase significantly in the near future. Even at present, during
outages, some transmission lines/cables in QPTS are already loaded at more than 90 percent of
their thermal ratings [1]. An HVDC will be cost competitive with HVAC if the transmission
system can be loaded close to its thermal ratings. The reason for this is that heavier loading
increases losses. Transmission losses increase as the square of loading. In addition, if HVAC
loadings increase to their thermal limits, lower circuits will be used to transmit bulk power
which further increase losses since the percent losses are higher at lower voltage levels.
Furthermore, as line loadings increases, the reactive losses will also increase, thus necessitating
the use of reactive power compensation. With HVDC transmission system, the entire line is
available for active power flow, as such an HVDC with a similar rating with an HVAC; the
HVDC will transfer more real power [23]. In addition, the line losses for HVDC are

188
significantly lower than that for comparable HVAC transmission. As such a significant
consideration should be put into losses when comparing the costs of an HVDC with HVAC
transmission.
The distance where the lower dc transmission cost pays for the higher dc terminal cost
is called the break even distance. The break even distance is used for economic evaluation to
determine whether to use an HVDC or an HVAC transmission system. However, losses are not
typically included in the break even distance evaluation. When losses are included in the life
expectancy of the transmission facilities, the break even distance will be lesser. This study
assumes that QPTS facilities will be loaded at their maximum thermal ratings and that the ratio
of the average loss to the peak loss of the year is 0.4, loss factor. The break even distance
would be less if the loss factor is higher. Furthermore, the costs of HVDC converters are
assumed to be $50/kW/terminal. From here on, the comparisons of the cost of an HVDC and
HVAC will be based on these assumptions.
The possible voltage levels in QPTS where an HVDC could be installed are the 132 kV
level and the 220 kV level. In comparing the cost of a double circuit 230 kV ac transmission
line with a thermal rating of 1000 MW compared to the cost of a 281 kV dc bipole with similar
thermal rating, the break even distance is 100 miles when the cost of reactive power
compensation is not included and 90 miles when the cost of reactive power compensation is
included. Reactive power compensation is needed to maintain a reasonable voltage level for
long ac transmission lines at higher loadings. The cost comparison of a double circuit 230 kV
ac transmission line with a 3-188 kV bipole, both of which have a thermal rating of 1000 MW,
the break even distance without reactive power compensation is about 140 miles with that with
reactive power compensation is about 125 miles.
The break even distance is significantly lesser for transmission cables than transmission
lines because cables at higher voltage ratings as mentioned earlier needs a significant amount
of reactive power compensation to be able to transfer power even for short distances. The
break even distance for a double circuit 345 kV, 3 phase cable to ±400 kV cables, both of
which have a thermal rating of 1000 MW is 28 miles. The break even distance for low voltage
lines loaded to their thermal limit is lesser than that for high voltage lines loaded at their
thermal limits because losses as a percentage of loading decreases as the voltage increases.
This is particularly important for this study because the potential application for an HVDC in
QPTS is at the 132 kV and 220 kV levels.

189
When lines are loaded near their thermal limits, the break even distance decreases as
load increases as the square of line loading. However, it is important to note that when loadings
are very low, the break even distance decreases as load decreases. This is due to the fact that as
loading decreases, the converter cost declines while the line cost remains constant. In
conclusion the cost of HVDC transmission becomes more competitive if the line is both
underutilized and at maximum thermal loadings. The HVDC lines to be installed at Dukhan
and Umm Bab area will be operating at its maximum thermal loadings.
Modelling and Analysis of HVDC
The HVDC system was modelled in PSS®E software together with a STATCOM as
explained in the HVDC case study described in Chapter 6. After the verification of the HVDC
model, the dynamic analysis followed PSS®E by subjecting the transmission system in the
western region to various fault types. The conclusions derived from the case study (Chaper-3)
have shown that QPTS dynamic performance has improved with HVDC and STATCOM and
even with the STATCOM alone. There is considerable acceleration in the rotor angle of
different machines, at the fault start, but the system remained stable. HVDC installation
doesn’t require new right of way as the existing right of way for the 132 kV overhead lines can
be used.

190
Appendix-C: - Research Theory in Power Electronics Technologies
The following review of basic FACTS theory which explains the impact of power
electronics in controlling the power system parameters. It is a summary of series of lectures
conducted by Professor Arindam Ghosh, Department of Electrical Engineering, Indian Institute
of Technology Kanpur, India [42].
Power Flow over Lossless Transmission Line
The transfer equation of lossless lumped parameter representation of the power
transmission line is [42]:-
( )
(7)
Similarly
( )
(8)
The real active power over the transmission line is:-
(9)
The reactive (imaginary) power absorbed by the line:-
( )
(10)
The power-angle curves and midpoint voltage sag are shown in the Figure 77.

191
Figure 77: Power-angle curves and midpoint voltage sag [42]
It is assumed that
(
) (
) (11)
Voltage Stability
Voltage stability is the ability of the power system to recover from a disturbance fault
incidence to the pre-fault nominal voltages of all system buses. In addition, the system shall
also be able to maintain the nominal voltage at buses in the steady state (Figure 78). For stable
power system, the bus voltages shall not drop continuously post to a load change or
disturbance [42].
Figure 78: Transmission line model and voltage stability [42]

192
( )
(12)
Voltage Stability
{ ( )}
( )
(13)
The transmission line impedance is constant and Zratio is inversely proportional to the
load impedance (Figure 79). The maximum power transfer occurs when the load impedance is
equal to the line impedance, which is called the surge impedance. The transmitted power
decreases after this operation point and the voltage starts to decrease till a collapse point unless
measures are taken [42].
Figure 79: Angle stability and equal area stability (Pm = mechanical power, Pe = electrical power) [42]
As a result of power demand increase operation power systems are interconnected
while machines are operated close to their stability limits [42]. In practical bulk power system
a set of interconnected machines naturally oscillate against other groups of machines (Figure
80) in a frequency range of 0.1 Hz to 3 Hz. This natural phenomenon of oscillation of two
groups of the system is called inter-area oscillation, which could be initiated by a small
disturbance in any part of the system [42].
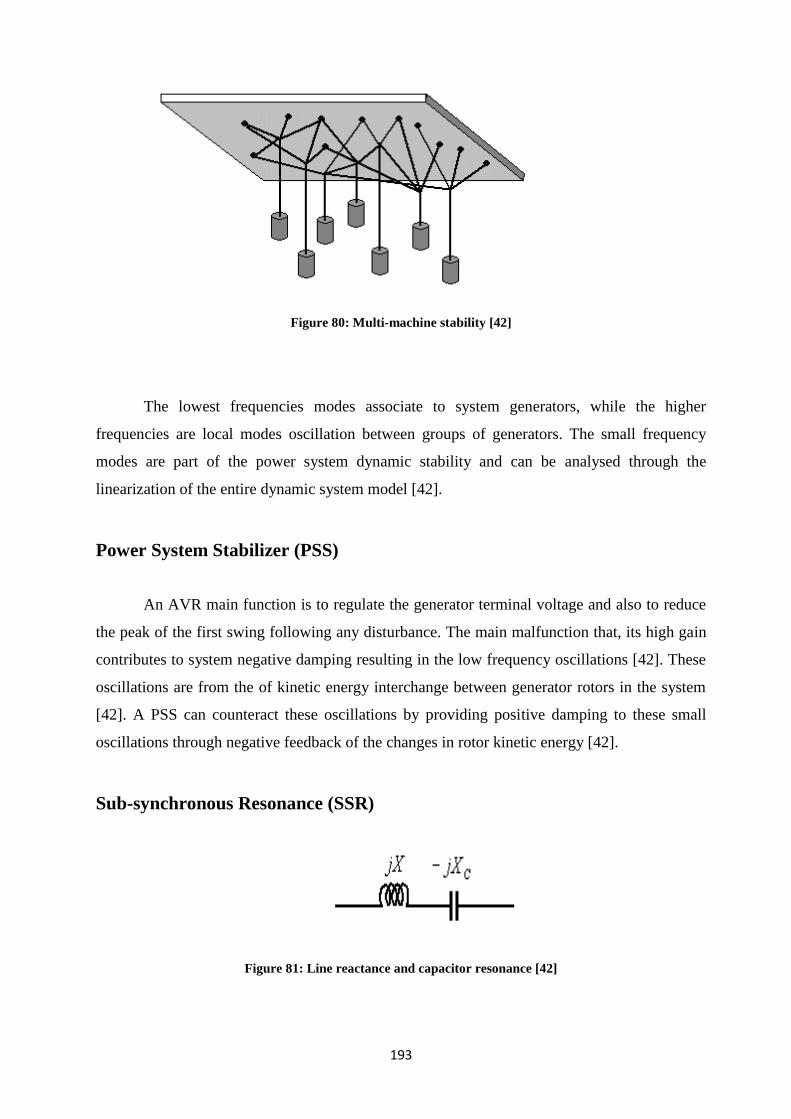
193
Figure 80: Multi-machine stability [42]
The lowest frequencies modes associate to system generators, while the higher
frequencies are local modes oscillation between groups of generators. The small frequency
modes are part of the power system dynamic stability and can be analysed through the
linearization of the entire dynamic system model [42].
Power System Stabilizer (PSS)
An AVR main function is to regulate the generator terminal voltage and also to reduce
the peak of the first swing following any disturbance. The main malfunction that, its high gain
contributes to system negative damping resulting in the low frequency oscillations [42]. These
oscillations are from the of kinetic energy interchange between generator rotors in the system
[42]. A PSS can counteract these oscillations by providing positive damping to these small
oscillations through negative feedback of the changes in rotor kinetic energy [42].
Sub-synchronous Resonance (SSR)
Figure 81: Line reactance and capacitor resonance [42]

194
SSR usually occurs in transmission lines systems compensated by series capacitors
(Figure 81). For a radial series compensated transmission system, the natural un-damped
frequency is given by [42]:-
√
(14)
Hence the complement frequency , where being the nominal system
frequency
SSR occurs when the complement frequency value becomes close to one of the
torsional frequencies of the turbine-generator shaft system, especially the steam turbines [42].
A rotor induced small voltage oscillation can result in large sub-synchronous currents that can
result in an oscillatory component of rotor torque with phase that enhances the rotor
oscillations. The oscillation in the turbine shaft system can grow to damaging levels, if this
torque overcomes the mechanical damping [42].
Shunt Compensation of Transmission Systems
Any FACTS or non-FACTS device that that is connected in parallel with a transmission
line is called a shunt compensator. It is referred to as a compensator since it compensates for
the reactive power in the ac system. It can improve the voltage profile, improve the power-
angle characteristics, improve the stability margin provide damping to power oscillations
(Figure 82).
Ideal Shunt Compensator
Figure 82: Shunt compensator at mid-point of lossless line and voltage current characteristics [42]

195
The ideal shunt compensator is represented by an ideal current source that supplies only
reactive power and no real power and could be connected at the midpoint of a line (assumed
lossless line with reactive impedance only).
Voltage Profile Improvement of Shunt Compensator
From the voltage-current characteristics shown in the Figure, the ideal shunt
compensator has constant voltage at the midpoint for different values of injected current [42].
For (
) (15)
(
)
(
)
(16)
Since
{ (
)} (
) (17)
Therefore the current shall be generated at phase quadrature with the midpoint shunt
voltage, to inject only reactive power by the compensator. However both active and reactive
Power compensation at midpoint improves the power flow over a line (Figure 83). The active
power flowing through the line is:-
(
) (18)
And the reactive power absorbed by the line is:-
[ (
)] (19)
And the reactive power generated by the shunt compensator is:-
[ (
)] (20)
Figure 83: Power angle characteristics at 2 pu and active/reactive power & power angle at 1 pu [42]

196
Reactive Power Requirement
For a transfer of 1.0 per unit real power, the shunt compensator is required to inject a
reactive power of about 0.54 per unit from, while for 2.0 per unit real power the compensator
needs an injection of 4.0 per unit reactive power [42].
It is assumed that
For transfer of 1.0 PU, an active real power, the reactive power injection can be
reduced by lowering the mid-point voltage (Figure 84) [42].
Figure 84: Real power vs. reactive power [42]

197
Improvement of Stability Margin
Figure 85: Power swing damping [42]
The power swing equation known by the mechanical, electrical power difference
(Figure 85):-
( | |) (21)
Pm is the mechanical power input, whereas the electrical power Pe is defined as a
function of the midpoint voltage magnitude and the load angle. The midpoint voltage and load
angle can influence the transmitted power on transmission lines, for constant voltage values at
both ends [42].
The swing equation can be linearized as:-
| | | |
(22)
The midpoint voltage magnitude ‘Vm’ is regulated at constant value and therefore no
increment
| |
The linearized swing equation becomes:-
(23)

198
The roots locations of the swing equation are on the imaginary axis of the s-plane,
implying that the load angle will have no damping and will oscillate with a constant frequency
of [42]:-
√
Constant oscillation in the linearized swing equation forms unstable system, and we can
add a derivative of the load angle to it [42].
The midpoint voltage can be varied as follow and the linearized swing equation
becomes [42]:-
:-
| |
(24)
Which is an equation of a 2nd order system where
⁄
| |
With a stable solution satisfied if
For synchronisation of the shunt compensator injecting reactive power with the
network, the angle of the voltage source has to be in phase with the midpoint voltage [42].
| | | | (25)
The research proposes to regulate the midpoint voltage to 1.0 per unit using a PI
controller of the form. System response to perturbation is shown in Figure 86 [42].
| | ( | |) ∫( | |) (26)
Figure 86: System response to a perturbation [42]

199
A term that is proportional to the deviation of machine speed in the feedback loop
can be introduced to improve damping such that the control law is given by [42]:-
| | ( | |) ∫( | |)
(27)
The last term is the system damping to (Figure 87) [42].
Figure 87: System response when the breaker opens inadvertently [42]
Real Shunt Compensators, SVC and STATCOM
The Static Compensator (STATCOM) produces a voltage, with a fundamental
component in phase with the midpoint voltage. It comprises an inverter based
synchronous voltage source (SVS) and a connecting step-up transformer to HV or EHV
installations [42]. The oldest shunt compensator is the Static VAr Compensator (SVC),
which acts as a variable reactance. For power transmission system without compensation
(Figure 88) the system is represented by its Thevenin equivalent looking from the
midpoint of the line. The variable reactive load is assumed connected at the midpoint
[42].
Figure 88: Voltage-current curve without compensation [42]
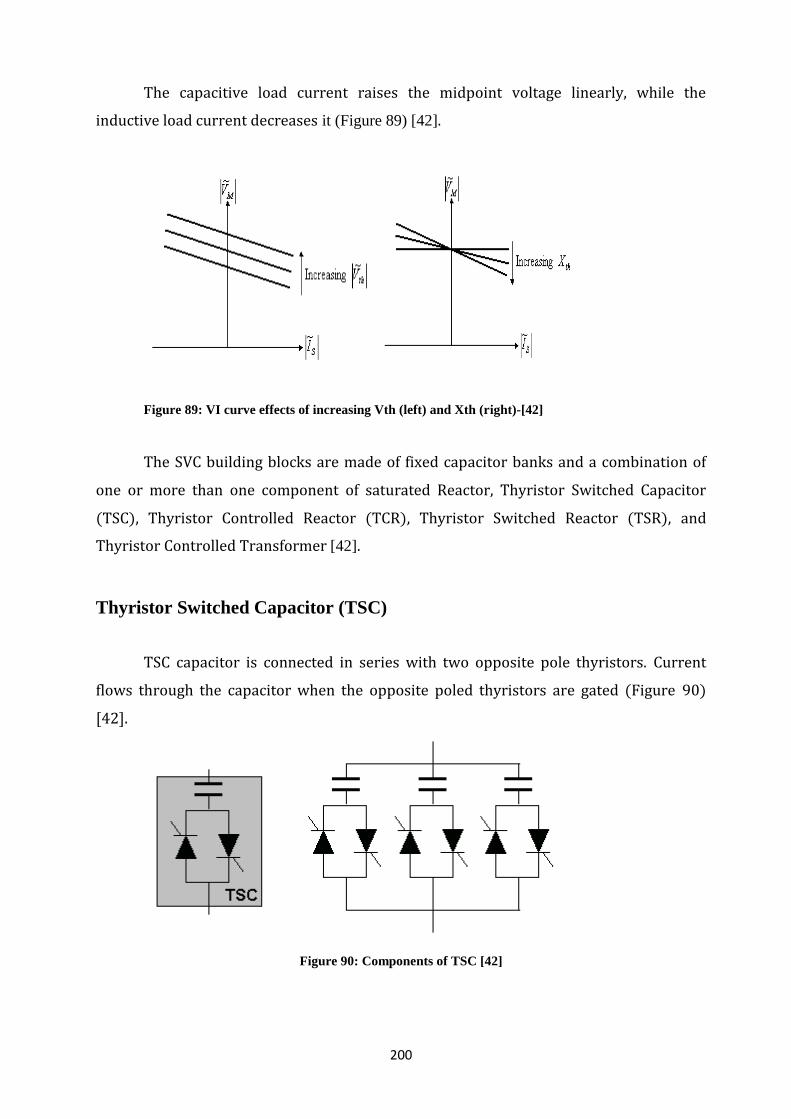
200
The capacitive load current raises the midpoint voltage linearly, while the
inductive load current decreases it (Figure 89) [42].
Figure 89: VI curve effects of increasing Vth (left) and Xth (right)-[42]
The SVC building blocks are made of fixed capacitor banks and a combination of
one or more than one component of saturated Reactor, Thyristor Switched Capacitor
(TSC), Thyristor Controlled Reactor (TCR), Thyristor Switched Reactor (TSR), and
Thyristor Controlled Transformer [42].
Thyristor Switched Capacitor (TSC)
TSC capacitor is connected in series with two opposite pole thyristors. Current
flows through the capacitor when the opposite poled thyristors are gated (Figure 90)
[42].
Figure 90: Components of TSC [42]

201
The effective reactance of the TSC pack can be changed by switching a TSC on or
off. An n-pack TSC has effective reactance as [42].
(28)
Where k is the number of TSCs conducting
TSC suddenly blocks current or allows the current through it, in Transient-free
Switching [42]. Therefore substantial transients occur if a TSC is switching while the
current following through it is not zero. If a TSC is supplied by a voltage source and has
a capacitor voltage and a current through the capacitor, then as = C (d /dt), the
current is zero when d /dt = 0, i.e., when the capacitor voltage reaches its peak [42].
Therefore for transient-free switching, the capacitor voltage shall be in its positive peak
or negative peak during switching on or off. The device must be switched on at a
particular instant of the voltage cycle. The capacitor voltage is kept at the peak of the
supply voltage when the switch is off indicating an open circuit (Figure 91) [42].
Figure 91: TSC - Transient-free switching [42]
Thyristor Switched Reactor (TCR)
Two opposite poled thyristors are connected in series to a reactor in a TCR. Each
of these thyristors conducts in each half cycle of supply frequency (Figure 92) [42].

202
Figure 92: TCR model and VI relationship [42]
The gating signal to each thyristor is elaye by a a gle ‘α’ from he zero cross g
of he source vol age (α s he f r g angle or conduction angle) [42]. The conduction
a gle mus be he ra ge 9 º ≤ α≤ 8 º. For α 9 º he curre w ll have full
conduction and will lag the voltage by 90º. For α= 180º, the current will be zero. (Figure93)
[42].
Figure 93: TCR - current relation with α= 90º and α= 180º [42]
The TCR fundamental reactance is given from the below equation [42]:-
{
∫ s ( )
(cos α cos ) for α ≤
α
for α ≤ (29)
The fundamental current is derived from this equation as [42]:-
( s )s ( 9 ) (30)
Since the TCR fundamental current must lag the voltage by 90º, we have the
fundamental frequency susceptance of the TCR as [42]:-

203
( )
(31)
The susceptance is zero for º (α 8 º) a rec procal of he chose value of
XL for 8 º (α 90º) (Figure 94) [42].
Figure 94: TCR – harmonics [42]
The T R curre w ll co a o ly he o harmo cs a oes ’ co a c or
even harmonics. The peaks of the harmonic currents are given by [42]:-
[ {( ) }
( ) {( ) }
( ) cosα
] (32)

204
The ormal ze harmo c a spec rum for var ous values of α are shown in the next
slide. As the firing angle increases, the magnitude of the harmonic currents increases.
Both the peak and conduction perio ( ) ecrease w h crease α resulting in a
reduction of the peak of fundamental current and increase in harmonic contents [42].
Static VAr Compensator (SVC)

205
Figure 95: Typical SVC scheme and SVC VI characteristics [42]
When system voltage increases from an operating voltage V0 (figure above), If the
system to V1 , the SVC moves the operating back to voltage V3 a po ‘ ’ by absorb g he
surplus inductive power. On the other operating side, the SVC maintains the voltage at V4
in case of a decrease in the system voltage (Figure 95) [42].
Synchronous Voltage Source (SVS)
The figure below outlines the main scheme of the synchronous voltage source
(SVS). The SVS transformer primaries provide a phase shift of 30º, 12-step output
waveform and harmonic spectrum. Each of switches (S1, S2 ...S6) is a two opposite poled
thyristors conduct in each half cycle of supply frequency (Figure 96) [42].

206
SVS - voltage waveforms
Figure 96: 12-Step SVS-output waveform and harmonic spectrum [42]
Similarly a 6n-step output voltage can be obtained by connecting n basic 6-step
inverters and by providing phase shift through transformer connections [42]. Also a 24-
step inverter (Figure 97) can be achieved by phase shifting each of the four 6-step
inverters by 15º, while a phase shift of 7.5º between 8 basic inverter output will produce
a 48- step output waveform. The firing pulses of the 6-step basic inverters must also be
phase shifted by 15º or 7.5º to obtain 24 or 48-step output waveforms respectively. The
lowest order harmonics in a 6n-step inverter is 6n ±1 in the ac side and 6n in the dc side
[42].

207
Figure 97: 24-Step output waveform and harmonic spectrum [42]
3- Level Inverter and 5- Level Inverter are shown in the Figure 98 below
Figure 98: 3-Level inverter and 5-level inverter [42]

208
Static Compensator - STATCOM
A STATCOM is like an SVS that is supplied by a dc storage capacitor Cdc or
batteries. The SVS is connected in shunt with the power ac system bus through a coupling
transformer with certain leakage reactance [42].
Figure 99: STATCOM - VAr generation and VI characteristics [42]
The reactive power absorbed or supplied by the STATCOM depends on the values
of he phase a gles (θ ϕ) a vol ages a he bus a he S erm al. f θ ϕ, and
V1>V2, the purely reactive current Iq will flow from the ac network to the SVS and the
conver er w ll absorb he uc ve power. f θ s s ll equal o ϕ, and V2> V1 then the
current will flow from the SVS to the ac system and the converter generates capacitive
power for the ac system. In practice pure reactive injection or absorption may not be
possible and is not desirable, since the converter will fall, the voltage across the capacitor
falls due to the losses in the STATCOM outside the zero output region. The dc capacitor
voltage can be regulated by replenishing the losses due to switching and in the coupling
ra sformer c rcu by absorb g power from he ac sys em. Therefore ϕ mus lag θ
by a small amount such that the dc capacitor voltage is held constant and hence the
converter voltage [42].
In a multi-step converter, the fundamental component of the output voltage is
determined by the magnitude of the dc capacitor voltage and the voltage magnitude V2
can be increased or decreased vis-à-vis the magnitude of V1 by charging or discharging

209
the dc capacitor through the control of the angle ϕ. The control loop will become slow,
and pulse width modulation (PWM) can effectively be used in a multilevel converter to
better the control response. In a sinusoidal PWM, the fundamental component of the
output voltage magnitude can be changed by changing either the capacitor voltage or the
modulation index [42]. Flying capacitor topology can be used, since the capacitor voltage
imbalance problem poses restriction in diode-clamped topology [42].
Below table shows comparison between SVC and STATCOM:-
Table IX: Comparison between SVC and STATCOM [42]

210
Appendix-D: - FACTS and Custom Power Devices Design
Characteristics
The recent advancement in FACTS devices is attributed to the successful application of
the evolutionary voltage source converter (VSC) technology. The upcoming silicon carbide
(SiC) technology is more efficient and expected to supersede silicon technology and could
further improve capabilities of FACTS devices by improving efficiency. For example silicon
IGBT will be replaced by SiC IGBT. SiC is anticipated to have a better characteristic, less
losses, broader band and higher voltage blocking. However it has been said SiC will
revolutionize power electronics for a long time, without that much to show for it [16].The
FACTS technology has been identified recently as one of key technologies needed for the
successful implementation of emerging smart grid and micro grid. In power electronics the
principles of electricity physical laws like Ohms, and the simplification methods Thevenin,
Norton are still maintained [16]. The principles of physical laws are also maintained that we
can’t change current in the inductor instantaneously (L*di/dt) and we can’t change voltage
across the capacitor instantaneously (C*dv/dt). In the old saturable reactor compensator
reactor/inductor banks are operated slightly in the saturation and can actually adjust the voltage
changes, by the degree of saturation. Some FACTS devices such as SVC’s use air core reactors
[16]. Voltage Source Converter- VSC is known to have 96-98% efficiency depending on the
technology used and can reach like 98% with modular multilevel converters. While the line
commutated Current Source Converter- CSC is more efficient (99%). VSC is used more
compared to CSC, as true CSC FACTS are not seen although SVC and TCSC are based on
CSC technology [16]. While HVDC is mostly CSC however this trend has started to change in
the last few years, with more orders (and an explosion in papers) on VSC HVDC [16].
Thyristors are PNPN latching naturally commutated devices means they depend on
external circuits to make them start conducting currents. With the gate connected to the first N-
type region, the PN junctions will be ready to conduct as soon as they are forward biased, but
the NP will not be. By injecting a gate current into the N region, a sufficient number of charge
carriers are injected to overcome that barrier [16]. Once the main current starts to follow into
the device, it takes the place of the gate current to keep the device on. When the gate current
latches the thyristor, it keeps itself on as long as the current flows and the PN- junction will
stand in reverse till the current goes to zero. When the current starts to reverse the PN-junction
will prevent the current from reversing. So the device is going to turn-off naturally like a diode

211
(naturally commutated). This is why the gate pulse to turn on a thyristor doesn’t need to last for
the entire time the devise needs to conduct. Turn on is normally done with gate current ~10 A,
20-40 V [16]. Thyristors can do only lagging power factor operation, but they can’t interrupt
current and still need external gate circuit to turn them off [16]. Thyristor can be used with a
firing delay around zero (minimum firing delay), 3-5° in most cases for static switch it comes
closer to zero. For firing delay angle α=0° or α=180° we have one half of the cycle, and most
vary from α=0° or α=90°. Similar to IGBT, self-commutating devices like Gate Turn-Off
Thyristor (GTO), Gate-Commutated Thyristor (GCT) will be able to interrupt current before
natural current zero. With forced commutation, thyristor has an active circuit to force the
current zero to make the thyristor off [16].
The Insulated Gate Bipolar Transistor IGBT is an extremely fast opening device with
opening time in the range of 10’s to 100’s of nanoseconds. The IGBT is voltage based gating
device and needs an appropriate voltage applied to its gate to turn it and keep it on. The voltage
based gate pulse supplies a bias voltage, not a charge; with low power (drive circuit is usually
20 V DC). The IGBT would require the gate pulse to turn them on, to last for the entire time
the devices need to conduct. In IGBT the current can be interrupted before it reaches the
current zero [16].
Multilevel Converter
Multilevel inverter was first introduced for locomotive motors in Japan and Europe.
Traction applications are switching to AC drives instead of DC drives, and needed to have an
inverter that goes to higher voltages. In a multilevel converter we can vary the voltage
magnitude directly by changing the conduction widths. The effective change in switch timing
waits until the next time a level makes a switch transition. The output from multilevel inverter
can take different multiple voltage values. 3-level inverter can generate 3-levels of voltages
(+V, 0, -V). Multi-level converter will generally have relatively slower response compared to
other converters and will not be suitable power applications that require fast response. This
voltage topology is also a better way to increase the voltage rating with fewer switches
connected in series. Since it needs extra diodes and capacitors, it will cost more than a bridge
type converter. The losses are generally less, since even though the converter essentially
switches as often, fewer switches are involved in each switching operation [4], [38] , [16].

212
Modular Multilevel Converter (Chain Link Converter)
The chain link converter is an extension of H-bridge connection and connected as 3-
single chain of capacitors. In a chain link converter we can vary the voltage magnitude directly
by changing the conduction. The effective change in switch timing waits until the next time a
level makes a switch transition for one of the H-bridges. If there are more levels in the chain
the converter will respond faster. This voltage topology is also a good way to increase the
voltage rating with fewer switches connected in series. This will need more capacitors, raising
the cost; however having simpler modules may mean the cost per module is lower. The
problem here is that you need to make sure that you balance the voltage between the capacitors
in each module. They usually add a slow control loop on the switching to maintain the balance
on these capacitors; otherwise you end up with one capacitor having most of the voltage across
and shrink on the other two. Before it was not usually suitable to connect between a dc source
and supply mains because the energy is not drawn from a single source, however new HVDC
systems are using this converter topology [16]. Each dc stage needs to draw energy from
electrically separate sources. Some manufacturers use this design as it is cost-effective and has
effective control to implement [4], [16], [38].
Pulse Width Modulation- PWM converter
The generated PWM control signal contains a carrier signal and modulating signal. We
can vary the magnitude of the voltage by changing the modulation using PWM. The
modulation ratio of the PWM scheme sets the magnitude of the ac side voltage (controls Q).
The idea of any PWM is basically to take energy from the harmonics and put it in the
frequency of switching. In some cases peak amplitude at the carrier frequency may be actually
bigger than the fundamental component amplitude. However updates in the modulation ratio
show at the next switch transition [4], [16]. The response can be improved by increasing
switching frequency. However if switching frequency is increased the switching losses will
also increase. If the switching frequency is already causes faster switch transitions than the rate
of change of the modulation ratio, a faster control scheme is needed. PWM will tend to have
the lowest efficiency (95-96%) with a significant operating cost. The drawback with VSC, it
generates voltage harmonics that cannot be trapped using shunt filters and require series
devices to round out the edges. PWM is one option to reduce voltage harmonics. Also PWM
schemes are more complex if it is required to raise the system voltage rating by connecting the
devices in series [4], [16], [21].

213
Direct and Indirect Controls
The modular multilevel converter is suitable for distribution applications; where
unbalanced condition is common practice. Some manufacturers are targeting transmission with
chain link converter as they found it more effective control-wise and cost effective to
implement. Other manufacturers are using 3-ph bridge or multilevel converter; however this
chain converter is better for unbalanced operation. PWM is a fast way of doing direct voltage
control. The response time in direct control is as small as one cycle and can have a fast loop for
varying reactive power [4], [16].
A direct voltage control scheme can be done by PWM converter, multilevel converter
or modular multilevel converter (MMC). Direct voltage control scheme is the one where a
command to vary the voltage magnitude on the output voltage directly changes the voltage.
The two common ways are to change the modulation ratio in a PWM converter or change the
conduction widths in a multilevel converter or in a chain link converter. In all these cases the
average voltage is increased or decreased simply by changing timing of the switching, and we
can say that |Vdc|=a*k*Vdc where ‘a’ is the modulation ratio [16].
Direct control is an option to independently control 3-quantities. We change the width
of the square wave or we when we do PWM there is sensibility to cut notches to have a better
sinusoidal fundamental waveform at ½ pulse switching frequency. With direct control there are
two degrees of freedom in control: control Vac to control the reactive power Q and control Vdc
to control the active power P. In direct control we can have a response time as small as one
cycle (20 ms or 16.7 ms) and we can have a fast loop for varying reactive power, depending on
PWM frequency or number of levels in a multilevel converter or chain link [16]. PWM is a fast
way of doing direct voltage control [16].
The previous indirect voltage control is used for controlling the ac voltage (Vac)
indirectly by controlling the dc bus voltage (Vdc) via charging and discharging the dc
capacitor. In an indirect scheme, the ac voltage magnitude is proportional to the dc bus voltage.
The switching scheme does not have the ability to directly scale the voltage magnitude, so
|Vdc|=k*Vdc. Vdc is the same for all phases and it is very difficult to do phase balancing with
indirect control 3-ph bridge. The ac side inductance also is a factor, since it affects the rate of
change of a current, but the size of the dc capacitor is a chief factor [21].

214
In indirect control there will limits and control on the ac and dc voltages. The dc
voltage is increased by transferring real power from the ac system ( <90º) to charge the
capacitor and decreased by transferring energy out of the capacitor. The response of the ac
voltage magnitude will depend on how quickly the capacitor voltage can increase or decrease.
Indirect control is very slow and the time constant of changing the current through the
inductance and the time constant of how fast we control the voltage across the capacitor are not
going to change quickly. A larger capacitor will slow the response and smaller one will speed it
at a cost of sacrificing waveform quality somewhat. The response is also limited by the fact
that the phase angle can only change twice per cycle to initiate a change in the dc capacitor
voltage [4], [16], [21].
The control loop will also influence the response time, but this will be fast compared to
the response of the capacitor. These factors limit the response time bridge based STATCOM
operating in indirect voltage control mode. The response time for indirect control is about 100
ms because of the capacitor (5/6 cycles on 50/60 Hz systems respectively).
Indirect control transfers power through the converter, while on average of several
cycles the ac power (Pac) equals to zero. If voltage on the capacitor keeps going the capacitor
insulation may fail. On the other hand when pulling energy out from the capacitor its voltage is
going to be lower and lower. There will limit and control on the ac and dc voltages and there
are couples of concerns while doing indirect control to keep the device within current limits
and the big size of the dc capacitor. Indirect voltage control schemes are generally used for
high MVA rated installations (balanced 3-ph) where GTO's are required. The switching losses
from the devices are so high that it is more cost effective to build a 24 pulse or 48 pulse bridge
(with relatively expensive transformer connections) than it is to tolerate the switching losses.
These installations also generally predate multilevel converters or create 48-pulse with
multilevel (Westinghouse) [4]. Now this technology is obsolete and nobody uses this in new
installations any more [4], [16]. As a critique and update, this technology is out dated, since
there are existing converters using this, but it will not appear in new FACTS devices [16].
Mechanical Switches vs. Static Power Converter
Mechanically switched capacitors will be cheaper than a TSC; however mechanical
switches sometimes pose operational restriction to some sensitive and fast varying loads. For
arc furnaces or steel mills you will see significant voltage changes between 5 and 10 Hz,

215
whereas 11 Hz is the most irritating frequency for office buildings [4], [38], [21], [16]. Fast
response is required and can’t be attained with mechanical switches. This brings the cost
difference with TSC down a bit. Drawbacks of mechanical switches can be summarized as
follows:
Slow as response time is a second or less
Conventional circuit breakers actually interrupt the current at natural current
zero and have no synchronization control on voltage to avoid closing on a peak
capacitor voltage.
They have wear and tear and associated operational and maintenance costs.
They cannot be switched on constantly. So TSC is better, if it is required to
switch the capacitor constantly (many times per day or more)
In terms of control, electro-mechanical controls that might be associated with
mechanical switches have inertia and take time to do control functions, while
digital control is faster.
Any conventional circuit breaker actually interrupts the current at natural current zero
and a capacitor stores a voltage peak across it (current phase angle in the capacitor is 90˚ out of
phase with voltage). Mechanical switches connected to capacitor circuit normally have no
synchronization control on voltage to avoid closing on a peak capacitor voltage. A mechanical
switch when closed on a peak voltage on the capacitor, inrush current and transients will occur.
These phenomena could be avoided with voltage measured on the other side of the thyristor
and closes when the voltages match. The other trade-offs between mechanically switched
capacitors and a TSC that the latter has inherited losses and integral cycle control. Static power
converters can be used in these applications instead of mechanical switches for their merits and
fast operation characteristics [4], [21], [16].
Static Transfer Switch- STS
STS can be used in essential distribution system to maintain the supply from two
independent sources. Static power converters have merits and can be used instead of
mechanical switches for applications that require fast operation characteristics. Dynamic
Voltage Restorer- DVR (SC with stored energy supply) can respond to voltage dips in less than

216
a cycle or faster is useful in distribution systems [4]. STS has two thyristors connected back to
back not fired continuously and turned on every half cycle. Since thyristors are not fired
continuously and just turning on every half cycle we have to have some way of synchronizing
the firing pulse. Once STS receives a trip signal, it will stop gating the thyristor and then
naturally commutated off at natural current zero and the current will be interrupted. Advantage
of STS is a circuit to synchronize with line current zero so we don’t accidently interrupt the
current when the alternate device is turning on. It is not required to synchronize the current
because the current and voltage not necessarily going to be in phase with each other. Once STS
receives a trip signal, it is going to wait for the natural current zero to interrupt the current.
Thyristor implementation is less expensive. Static power converters have merits and can be
used instead of mechanical switches for applications that require fast operation characteristics.
Static Transfer Switch-STS can be used in essential distribution system to maintain the supply
from two independent sources [4], [38], [21], [16].
Standards and Harmonics Filters
IEEE 519-1992 Standards used in US and Canada for harmonics, while IEC 61000-
3/4/5 used in Europe. IEEE 519-1992, IEC 61000-3/4/5 Standards have different philosophies
for harmonics mitigation and control. IEEE certain harmonics criteria (TDD and THD) have to
be met by the load at the point of common coupling. IEEE 519-1992 regulates the load TDD
and THD at the point of common coupling, while IEC standard controls the insertion of load
into the power system by virtue of its contribution of the harmonic current to a certain
threshold. THD is basically a measure of the harmonics relative to the present current, while
TDD is measuring the current relative to the rated current. IEC standard regulates the load that
produces the harmonics itself and basically if the content of harmonic current is worse than a
certain threshold then the load can’t be plugged into the power system
Passive filters are suitable for absorbing low order frequencies, while serious active
filters work well in high order frequencies applications. Most of the 5th harmonics currents are
going through the shunt filters and the series VSC filter can be used to clean around 7% of the
5th harmonics currents to the satisfaction of IEEE-519 or other standards. Series filter will
isolate the harmonics sources from the system as it only passes nominal frequency current and
can be viewed as a harmonic isolator. Active filters take less space but will probably cost more
than passive filters. They can be tuned for a set of harmonics not just one harmonics and there

217
is a need for reactive compensation to have a capacitor. Active harmonics filters will help the
situation while passive filters interact badly with the rest of the system [4].
12 pulse VSC configurations will still create significant 11th and 13th harmonic
voltages, more than acceptable level. Even a 24 pulse configuration will exceed limits such as
those from IEEE519. With sufficient design (48-pulse) the final output voltage can be made to
approximate a sine wave closely enough so that no (or a very small amount) filtering is
required. The 48-pulse configuration moves the dominant voltage harmonic frequencies to
levels where a smaller series inductance will provide adequate filtering. The combined
harmonic filter consists of both a shunt active filter and a series active filter. The series filter is
connected between the main power system and the shunt filter and this combination can be
viewed as part of UPQC functions. The effective impedance of an inductive circuit increases
with the increase in frequency and the magnitude of the nth harmonic current reduces with
increase in the value of ‘n’. Therefore lower order voltage harmonics are of concern to any
power system and since the power system is mostly inductive, the currents produced by higher
order voltage harmonics get attenuated. This implies that the reduction in the current
magnitude associated with lower order harmonics is not as significant as the reduction
achieved for higher order harmonics. We must therefore try to eliminate the lower order
voltage harmonics [4].
Shunt filters: Most loads producing voltage harmonics are going to produce current
harmonics; however as a secondary effect of current harmonics few loads directly produce
voltage harmonics. We can use a passive shunt filter to shunt current low frequency harmonics
to ground. The shunt filter operates primarily on the low order harmonics and for frequencies
above this passive high pass filter shall be used [4]. High pass filters will clean 80% of the
higher frequency currents and the series filter will clean the rest. The other option is “shunt
active filter” only designed to go up to 25th harmonics or lower. [16].
Shunt filters applications: We can add shunt 5th & 7th filters to cancel 5th & 7th
harmonics which are the biggest components as 5th is more or less 1/5 of the total current.
Actually in the best cases 90% of the 5th harmonics currents are going through the shunt
filters. Although shunt filter is passive and limited to just the lower order harmonics it may
have some capability to act also as a shunt compensator for load balancing or reactive
compensation. However, this will create a trade-off, and may hurt harmonics filter
performance. The notch single tuned shunt filters (e.g. 5th, 7th harmonics) are typically de-
tuned slightly since the filter impedance at the resonant frequency is too low and the filter can

218
draw too much current from other sources in the power system at that harmonic frequency.
Drawing these added harmonic currents causes two problems: the filter elements may exceed
their current rating and the harmonics currents flowing through the power system impedance
create a harmonic voltage drop. This can cause voltage harmonics at the harmonic frequency at
the filter location, impacting all the loads present there [16].
The shunt filter is instead de-tuned to ensure that an acceptable level of harmonics
enters the power system, rather than essentially none as would be the case with an ideal filter
that was perfectly tuned. Another reason for detuning filter is that it will be difficult to get the
exact values of L and C needed for tuning the filter. In addition, these values will change
somewhat overtime especially the capacitance value. Larger filter installations might have taps
on the inductor, allowing for some ability to fine tune the filter once it is installed [16].
Series filters: If there is a load that produces voltage distortions, then the cleaning
options are a bit limited and can’t just have a path to shunt these harmonics to ground. Instead
this makes voltage drop and to keep them from spread, series inductors are used to filter the
voltage harmonics. The VSC series filter will isolate the harmonics sources from the system as
it only passes 50/60 Hz current and can be viewed as a harmonic isolator. It keeps the shunt
filter from seeing the current harmonics present on the ac system. As a result, the shunt filter
does not try to filter all those harmonics and its current ratings will be more consistent.
The series filter may clean up the remainder of low order harmonics, but it will also get
the higher frequency harmonics. The series VSC filter can be used to clean around 7% of the
5th harmonics currents depending on how much it is needed to satisfy IEEE-519 Standard or
other standards. Hence VSC series filter could be rated smaller and go for higher frequencies.
To be able to filter higher harmonics, the series filter needs a higher switching frequency, so it
will be limited in ability to do any other series voltage waveform compensation, although it
could do some by circulating power. In realistic converter, this will be quite limited [16].
The exception is that some loads have VSC at the front end and those are fairly low.
Active series filter can be used to attenuate current harmonics by inserting a series voltage
proportional to the line current and can inject currents 180° out of phase with load currents.
Most people trying to install series filters are using three single-phase H-bridges instead of 3-
phase bridge as it is difficult to filter the 3-ph independently with 3-phase bridge. Active filters
take less space and will probably cost more than passive filters. They can be tuned for a set of
harmonics not just one harmonics and anyway you need reactive compensation to have a

219
capacitor. Putting active harmonics filters will help the situation because passive filters interact
badly with the rest of the system.
In power electronics, transformers connection wye/delta, wye/wye has phase shift of
30° and will get amount of harmonics cancellation that makes the filter cheaper. Transformer
connection with 30° phase shift can be used with 12-pulse converter while, transformer
connection with 15° phase shift can be used with 24-pulse converter and 7.5° phase shift is
used with 48-pulse converter. In general 12-pulse configuration isn’t enough and even in 24-
pulse configuration you have to zoom in upper course of current to see any distortion. Beyond
12-pulse the simple transformer connection wye/delta, wye/wye can’t be chosen and the
tertiary configuration wye/ wye-delta is needed. The current is good in 48-pulse but the 7.5°
phase shift needs complicated transformer configuration that costs higher [16].
Static VAr Compensator- SVC
Static VAr Compensators- SVC comprised of TCR and capacitors normally connected
in delta and has half cycle response for 6-pulse configuration and faster response for 12-pulse.
The time constant, Td, for the transfer function in SVC is typically 2.5 ms to 5 ms and is 20
times faster than a MSC, but it costs 10-15 times more [16] , [21]. On the average, the TCR-
TSC low losses at zero will increase in steps with increasing VAr capacitor output reaching
about 1.0% at rated output [16], [21].
The conventional TCR in SVC produces current harmonics and is not able to operate in
PWM, since PWM operation requires self-commutating devices. By varying the firing delay
angle (α) on thyristor we can change the fundamental RMS current at the expense of producing
a lot of harmonic distortion in the current. At firing delay angle (α=0) there will virtually be no
harmonics and only the fundamental current will dominate. Harmonic filters are installed in
parallel to SVC to shunt the current harmonics to ground, while firing delay angle (α) can be
chosen to control a little. In practice the TCR and capacitors will be connected in ∆, and no
filtering will be needed for triple harmonics (3, 6, 9, etc.). Harmonics filtering will be needed
for 5, 7, 11, 13, 17, 19 harmonics etc. This could be accomplished with notch filters for 5th
harmonics, 7th harmonics and high pass filter for the rest [16], [21].

220
The notch filters for 5th, 7th harmonics will have capacitive contribution to the SVC
circuit when operating at the nominal frequency (50 or 60 Hz) and thus will contribute to the
required capacitor value on the system as far as the SVC is on. Also 12-pulse configuration can
be used to reduce the harmonics produced due to varying the thyristor firing delay angle and
will eliminate the 5th and 7th harmonics. In some cases, the triple-n harmonics content are not
identical in each phase and their normal cancellation will not take place through the
conventional delta connection. This will lead to the generally unneeded operation mode that
requires the installation of the third harmonic filters [16], [21].
The overall efficiency of a SVC could be improved if the capacitor banks could all be
switched out of the circuit however, but normally not all of the capacitors could be switched
off when providing inductive reactive power or even zero reactive power unless the SVC is off
entirely. The TCR will need to cancel all of the capacitance first. This will result in a much
larger current through the TCR, increasing conduction losses in the thyristor and resistive
losses in the inductor and some resistive losses in the capacitors. Also the system will lose
ability to filter the harmonics since part of the capacitance will come from the harmonic filters,
and they can't be switched out if the TCR is operating. If only one capacitor bank could be
switched out, then the TCR current would be reduced by ⅓ and it would be reduced by ⅔ if
two capacitor banks could be switched out. TCR can only absorb reactive power, making it
necessary to switch the capacitors with a net VAr surplus [16], [21]. Thyristors are not able to
turn themselves off and interrupt the current. If the thyristors are replaced with IGBT's or
GTO's then PWM use is possible, however the circuit topology would probably need to change
too to more fully to utilize the IGBT or GTO [16]. PWM produces voltage harmonics with a
TSC and in VSC, however PWM would not produce voltage harmonics if used in a TCR type
connection since PWM is done in a current source, not a voltage source [16]. In any case, the
voltage harmonics cannot be shunt to ground using the parallel filters and require devices such
as transformers to smooth out the transition [16]. Harmonic study or harmonic frequency scans
shall be done when it is required to install SVC [16], [21].
With unbalanced system voltages the compensating currents in each phase would
become different. SVC is good for load balancing since it is possible to control the three
compensating admittances individually by adjusting the delay angle of the TCRs for each
phase so as to make the three compensating currents identical. It is assuming delay angles for
the 3-TCRs to be different to compensate for different phases. The function of this
compensator is to make the load balanced and looks like a real power unity power factor load

221
(resistive) when the line currents drawn by the load are in phase with the line voltages [16],
[21].
Normally not all of the capacitors could be switched off when providing inductive
reactive power or even zero reactive power unless the SVC is off entirely. The TCR will need
to cancel all of the capacitance first. This will result in a much larger current through the TCR,
increasing conduction losses in the thyristor and resistive losses in the inductor and some
resistive losses in the capacitors. Also the system will lose ability to filter the harmonics since
part of the capacitance will come from the harmonic filters, and they can't be switched out if
the TCR is operating. If only one capacitor bank could be switched out, then the TCR current
would be reduced by ⅓ and it would be reduced by ⅔ if two capacitor banks could be switched
out. TCR can only absorb reactive power, making it necessary to switch the capacitors with a
net VAr surplus [21], [16]. Thyristors are not able to turn themselves off and interrupt the
current. If the thyristors are replaced with IGBT's or GTO's OR PWM use is possible. However
PWM also produces voltage harmonics and in a conventional TCR based SVC, the voltage
harmonics cannot be shunt to ground using the parallel filters and require devices such as
transformers to smooth out the transition. Harmonics Study or harmonics frequency scan shall
be done when it is required to install SVC [16], [21].
SVC normally connected in delta and has half cycle response for 6-pulse configuration
and faster response for 12-pulse. The time constant Td for the transfer function in SVC is
typically 2.5 ms to 5 ms and is 20 times faster than MSC, but it costs 10-15 times more. On the
average, the TCR- TSC low losses at zero will increase in steps with increasing VAr capacitor
output reaching about 1.0% at rated output [16], [21].
Static Compensator- STATCOM
The Static compensator – STATCOM is a FACTS device based on high power voltage
source converters (VSC). The STATCOM, employing will produce the required VAr (Q) for
power systems in a linear relationship with voltage, unlike a conventional SVC which has a
voltage squared relationship. By varying the capacitor voltage source-VS, in STATCOM by
changing the modulation using PWM, one can vary the magnitude of the voltage. The
STATCOM produces voltage harmonics and there will be smaller current distortion, moved to
higher frequencies than is the case with a SVC. The current distortion could be cleaned up with
shunt filters, but the voltage harmonics pose more of a problem and they can induce current

222
harmonics from many loads, which can cause them to misoperate [16]. They require series
filtering to clean voltage harmonics up. One option is to use series inductance; however a lot of
inductance is needed to filter the lower frequency harmonics. The compensator will have
additional reactive load to compensate from this inductance. PWM operation allows the VSC
in the STATCOM to push the harmonic energy up to frequencies where a smaller ac side
inductance produces acceptable filtering. However PWM schemes are more complicated if
devices need to be connected in series to raise the voltage rating. Also transformer inductance
will act as a low-pass filter and will round the edges of PWM and smooth the transitions out
(harmonics) at the expense of adding more losses to the transformer, if the transformer needs a
higher leakage. For IGBT's, it would be more effective if a VSC STATCOM were built instead
of SVC, since there would be significant voltage transients trying to turn off the current
through an inductor prior to a natural current zero. STATCOM with chain link converter or
with multi-level converter will generally have response slower than PWM, but it will work for
some power system needs that don’t require fast response. The losses are generally lower than
for PWM, since even though the converter essentially switches as often, fewer switches and
lower voltages are involved in each switching operation [16], [21].
The STATCOM converter has no internal energy storage and requires the net
instantaneous power at the ac and dc terminals of the VSC always be equal. The STATCOM
will generally draw balanced sinusoidal currents in quadrature with the system voltages, but
the dc capacitor will experience no charging current because no real power is exchanged with
the ac system. It is not that much cost and saving to have one capacitor verses three phases and
for unbalanced condition. It is better to avoid 3-phase bridge, so as not to exceed the capacitor
current rating. There is also inherited voltage sharing problem with 3-phase bridges. In general,
the STATCOM will draw a negative sequence fundamental component as well as a positive
sequence third harmonic current component. The third voltage harmonics generated in the
STATCOM output is unwanted [16], [21]. This is mainly true with slow PWM that resulted
from GTOs. Development in a new transmission STATCOM installation will most likely
involve modular multilevel converters, which will go back to the idea of individual converters
on each phase leg [16]. The STATCOM operation under unbalanced conditions is different
from that of the SVC, but both have similar consequences. For such operation the alternating
power component at twice the fundamental frequency will appear at the ac terminal of the
STATCOM converter. This will be matched by an alternating second harmonics charging
current in the dc terminal, producing in turn an associated alternating voltage component of the
same frequency across the capacitor shunting the dc terminals [16], [21].

223
The STATCOM is more expensive and has more losses (even if PWM is not used) and
we have to trade that off. In the past real power application PWM is not used as much because
of the penalty in losses, until very recently new STATCOMs used PWM, but the very newest
designs are instead using many levels (possibly hundreds) [16]. For higher frequencies, the
chief delay will be in calculating the new set points; however in general PWM could respond
in 2-3 msec. The attainable response and the closed voltage regulation loop of the STATCOM
are significantly small. The time constant for the transfer function of the STATCOM is
typically 200 µs to 350 µs [21]. The combination of a STATCOM with mechanically switched
capacitors-MSC may provide a good and economical solution for many applications. This is
because the STATCOM would be able to provide capacitive VAr output immediately upon
demand and the additional capacitive output would be delayed by the MSC operation [16],
[21].
First generation STATCOMs required a 48-pulse structure to reduce voltage harmonic
distortion to acceptable levels, while the second generation STATCOMs used slow PWM or
multilevel converters [2] , [3] , [21]. Modern STATCOMs take that a step further by increasing
the number of converter levels or increasing the PWM switching frequency. These
improvements in performance reduce voltage harmonics, which decreases the need for series
filtering to clean them up. One option is to use series inductance; however a lot of inductance
is needed to filter the lower frequency harmonics. The compensator will have additional
reactive load to compensate from this inductance. The use of multilevel converters also reduces
the voltage stress on the power electronic devices and serves to improve efficiency [2], [4],
[16], [21].
Other miscellaneous aspects of the STATCOM include its capacity to be integrated
with superconducting magnet storage or battery storage, as these integrations can allow a
voltage injection with varying angle, while the operation of the approach amid unbalanced
conditions has similar potential consequences as the static VAr compensation [2] , [3] , [16].
Series capacitors- Thyristor Controlled Series Capacitor- TCSC
Basic series compensation can be improved through the use of a thyristor controlled
series capacitor, as thyristor control can serve to provide fast dynamic response without
generating harmonics and requiring harmonic filters. This technology is possible through the

224
installation of a reactor with a thyristor in parallel with a fixed capacitor, thereby being
installed in lieu of conventional switches. Meanwhile, the thyristor controlled series capacitor
is integrated within the system in series with a transmission line devoid of coupling across
phases [2], [16]. Static Synchronous Series Compensator- SSSC with VSC can also be used to
inject voltage to compensate for magnitude change and phase due to a fault in one phase or
compensate for magnitude change in three phases. Also a SSSC or TCSC can be used ideally
to limit the fault currents in transmission lines by using a power converter that looks like a
large inductor when the fault occurs [16], [21], although nobody has implemented it. The chief
drawback for conventional SC is the potential sub-synchronous resonance. When designing a
series capacitor in a system, it can be put with hydro generation and avoid steam turbines as
they may have multiple resonant frequencies below 50/60 Hz. However exciting resonance
frequencies above the nominal frequency will help damping oscillations on the transmission
lines above 50/60 Hz. Other drawback is the impact on system protection due to protection
bypass for out of system faults which leave compensation out of system during recovery from
disturbance when is needed most. Series capacitor compensation suits longer overhead lines,
but is not practical for use in short overhead lines [16], [21].
TCSC is connected in series with a transmission line with no coupling between phases,
while SVC is shunt connected (wye or delta). Harmonic currents (3, 5, 7, 9, 11 etc.) are
produced by the TCR in the TCSC, during partial conduction (when σ is at angle other than 0˚
or 180˚). No element is connected in Wye/delta to circulate the triple-n harmonics and the
harmonics currents need a circuit to close the conduction path. In TCSC, the easiest path is
through the capacitor (circulating current). As a result, only a small percentage of the harmonic
current spread into the transmission system, so harmonic current filters are not needed. The
capacitor impedance is divided by the harmonics order ‘n’ as (1/n)X. It will look smaller and
smaller impedance to harmonics and current harmonics mostly go for the capacitor in TCSC.
This is why the TCSC doesn’t need harmonics filtering for currents [16].
Harmonic currents are produced by the TCR in the TCSC, during partial conduction
(when σ is at angle other than 0˚ or 180˚). No element is connected in Wye/delta to circulate
the triple-n harmonics and the harmonics currents need a circuit to close the conduction path.
In TCSC, the easiest path is through the capacitor (circulating current). As a result, only a
small percentage of the harmonic current spread into the transmission system. The capacitor
impedance is divided by the harmonics order ‘n’ as (1/n)X. It will look smaller and smaller
impedance to harmonics and current harmonics mostly go for the capacitor in TCSC. This is
why the TCSC doesn’t need harmonics filtering for currents [16], [21].

225
Therefore in most cases, filtering or harmonic cancellation through a 12-pulse
connection is unnecessary in TCSC. While harmonic filters are not required, harmonic currents
are produced by this design in partial conductance, and the impedance of the capacitor is
inversely proportional to the order of harmonics. The reduced impedance and tendency from
the current harmonics to travel along the easiest path results in only a minimal portion of the
harmonic currents being distributed through the transmission system (the reason why filters are
not required). The harmonic currents travelling through the capacitor generate voltage
harmonics at the frequency through the capacitor, as the impedance to the voltage increases
due to the proportional rise with the order of the harmonics [3] , [16]. Ultimately, the voltage
harmonics are reduced along the line inductance [4], [16], [20].
The harmonic currents flowing through the capacitor create a voltage harmonics at that
frequency across the capacitor (and the TCSC). The largest harmonics voltage will occur at
whatever frequencies have the largest current harmonics from the TCR. These would be
viewed as harmonic voltage sources connected in series with the line, rather than current
sources. While the harmonics order ‘n’ times inductor impedance (n. X) will make the
impedance to the voltage harmonics bigger. Therefore voltage harmonics will get dropped
across the line inductance and usually cause a little bit less for power system, but it is an issue
with GTO control series capacitor [16], [21]. It will also result in little harmonics distortion
(especially since the fundamental component is large). Again, filtering or harmonic
cancellation through a 12-pulse connection is unnecessary. The TCSC is normally connected
on each phase as a three independent converters. If one wants to connect the TCSC in wye,
delta 12-pulse and so on, one would need to interface the TCSC through a transformer. 12-
pulse configuration reduces the harmonics produced due to varying the thyristor delay firing
and is sufficient for series compensation- TCSC. Controlled series compensation- TCSC can be
applied effectively to damp power oscillations. To damp sub-synchronous resonance a resistor
can be put in the thyristor circuit what is known as NGH-SSR. This can create fundamental
50/60 Hz resonance and designed so that the lower set range of firing angle looks like an
inductor and above that the system works as a net capacitor [16], [21].
Convertible Static Compensator (CSC) – IPFC
One of the used FACTS devices is the convertible static compensator (CSC). CSC was
installed before by the New York Power Authority (NYPA), including (IPFC) as a pilot [16].
The CSC-project shall increase power transfer capability and maximize the use of the existing

226
transmission network. Within the general conceptual framework of the CSC, multi-converter
FACTS device, the Interline Power Flow Controller (IPFC), is among many possible
configurations.
Generalized/Unified power flow controller- GUPFC/UPFC
One of the potential configuration of CSC and a variation of phase shift transformer is
UPFC (Unified Power Flow Controller) which is arguably the most comprehensive CSC
FACTS device that is capable of providing active and reactive control, as well as adaptive
voltage magnitude control and phase angle regulation. The UPFC is a successful application of
the evolutionary voltage source converter (VSC) technology for shunt compensation and series
compensation. Till recently only, two UPFCs were used around the world one in USA and one
in South Korea. The UPFC has dual function using two VSCs, one shunt VSC similar to
STATCOM and one series VSC for series compensation similar to SSSC. UPFC can do more
than a phase shifting transformer with two degrees of freedom that can meet multiple control
objectives by adding the series injected voltage with appropriate amplitude and phase angle to
the sending end terminal voltage.
A UPFC can inject zero power or produce no voltage or produce voltage 90° offset
from the current, like SSSC. The UPFC can act as a capacitor and put power into the system or
as an inductor and pull power off the system. When the power is non-zero the shunt converter
has to be putting this much power back into the system and is circulated through the dc bus
[16], [21]. Change in the injected voltage can increase or decrease the real power transfer and
changing the angle of the injected voltage will also affect the real power flow. Voltage change
coupled with angle change may reverse the direction of the real power flow. The injected
voltage can be at any angle with respect to the line current and the UPFC can be used to control
power flow through an electrical transmission line connecting various generators and loads at
sending and receiving ends [16], [21]. In most cases it is normally required to maintain a
constant level of real power flow with the angles variation. The UPFC can also maintain a
constant flow through the line no matter what phase angle difference between the two ends of
the line. When a constant current is maintained with voltages magnitudes, it is basically just
implies that the angle difference between the two ends will vary, but the magnitudes won't vary
[16], [21].

227
UPFC can be used to control the current flow over a branch interconnecting two
systems that are normally out of synchronism. It will do this by injecting the appropriate series
voltage with an appropriate magnitude and angle until it reaches its limits. It will also probably
need very high current ratings on the shunt converter to support the circulating power for the
180° condition. So it will either need a very high rating, or it will need to be tripped, however
UPFC is not recommended for such application, unless the systems are kept close to
synchronization unless that UPFC has a very high voltage rating for the series injection
converter. Otherwise the angle across the line could get larger than the UPFC could
compensate, requiring the line to be tripped [16], [21].
The approximate voltage ratings for UPFC shall be determined from different factors.
With SSSC we can inject voltage 90° out of phase relative to the current (+/- jX), while UPFC
has a greater angle margin including a full circle of magnitude-angle spectrum. UPFC inserted
voltage phasor has controllable magnitude from zero to maximum value and angle from 0° to
360°. In general, and for a practical system, UPFC can provide fast reactive shunt
compensation with a total control range of 320 MVAr (-160 MVAr to +160 MVAr) and
control power flow in the 138 kV high capacity transmission lines, forcing the transmitted
power, under contingency condition, up to 950 MVA. Normally UPFC equipment comprises
two identical GTO thyristor-based converters, each rated +/- 160 MVA [21].
The converter side voltage is of the main transformer is 37 kV phase to phase (for both
shunt and series transformers). The shunt-connected transformer has a 138 kV delta-connected
primary, and series transformer has three separate primary winding each rated at 16% of the
phase voltage. If utility can afford it can maximize the benefits of installing two identical main
shunt transformers and single main series transformers have to be provided with configuration
that can provide a shunt compensation with a total control range of +/- 320 MVAr [16], [21].
HVDC
Two lines commutated current source converters:
Consider the topology of basic six-pulse bridge converter, based on line commutated,
current source converter with stiff voltage source is on the ac side using GTOs (turn off

228
thyristors) and stiff current source is on the dc side. The six-pulse current source converter is
connected to dc side through a smoothing reactor big enough to remove ripples from the
current. We consider this as 1-pole connected to the +ve side of the dc voltage and with ground
connection to –ve side of the dc voltage [16], [21].
The current source converter–CSC, topology uses thyristor control rectifier and
associated with series dc inductor. The CSC is 99% efficient compared to VSC efficiency
96%-98%. The second six-pulse current source converter will be connected the same way. The
second HVDC line will have similar converter topology as described and connected to the first
HVDC line. The two current source converters are connected to the ac source via 3- winding
wye/wye-delta transformer with certain transformer inductances Xc. This will form 12-pulse
bridge and because of ∆/∆/y transformer 5th and 7th harmonics will cancel and so 11th and
13th will make the harmonics. So we have high pass filters for 11th and 13th harmonics at the
transformer primary side. The two lines will be connected point to point with earthing system
on the middle to have a clamp on the voltage on this earthing point [16].
Two voltage source inverters: The topology is everything almost similar to above
configuration except 3-ph, six-pulse bridge inverter, based on, voltage source converter is used
instead of the current source converter. Again assume that the centre point of the dc system is
grounded as described above. In both cases A & B the two conductors will be installed on one
tower. The voltage source converter–VSC, topology uses DC bus system (capacitor) and
associated ac/dc- dc/ac conversion. The VSC has efficiency in the range of 96%-98%.With
VSC we are able to reverse the polarity of the current, but the voltage is always fixed. On the
other side dc/ac the current polarity does not change and we can reverse the voltage polarity as
the thyristor will be facing one-way. The parallel capacitor on the DC side will contribute to
the fault current and may produce harmonics.
In both cases this is the rectifier (ac/dc) configuration on the end of the first ac system,
while on the other ac system there will be an inverter (dc/ac) topology with the same converter
structure described above.
For system response for a fault at the midpoint of the positive pole of the transmission
line, for fault on the +ve pole of the transmission line will have a return path to the grounded
centre point of the dc system. The current does not reverse and there will be no feed to the
earth fault from the negative pole. They actually have controls on these that they measure this

229
current and then they put offset on the firing delay to keep this current zero. The converter will
have very fast, direct control over the firing delay angle α. The converter at the far end of the
line cannot feed the fault as it cannot conduct current in the reverse direction. The dc voltage is
controlled by firing delay angle as Vdc= Vdo* cosα, where Vdo=3√2/π|Vll| and α is the firing
delay angle. If α=0° then Vdc=3√2/π|Vll|= 1.35 |Vll| (the dc voltage will be 35% greater than
the ac system line to line voltage). So the dc current is indirectly controlled by changing the
firing delay angle α and if we stop sending gating the devices on, they will not stop carrying
current. So during earth fault the dc voltage shall be zero to stop the earth current from
flowing, i.e. Vdc=0 and this happens when cosα=0 (means α=90°). In normal operation we
want to keep α small and the general objective is to keep the primary angle in the
neighbourhood of α=15-20° to have a working power factor cosα= 0.97-0.94 respectively. If
we set the firing delay angle > 90° we will get a negative number and so we can make the fault
on the sending end converter negative and start positive current or fault current. The problem
that the devices require time before it can see the forward voltage across it and will forward
voltage when the angle passes 180° and hence the devices will shoot away and fail on
conducting and tend to recover extinction angle 180° max of conduction. If the firing delay
angle gets too big (α=180°) there will be what is called commutation failure and the fault
current will fall and rise again [16].
Previously a couple of Henries inductor is installed to control this current and limit the
current rise. This dc reactor is very expensive and in the newer system they put a reactor of less
than a Henry (H) to cut the cost and try to compensate by changing the converter control.
Actually the cost of this inductor is more than all the engineering cost including the design.
Additional protection equipment needed (AC or DC):
The common problem for protection is the ac side. The issue is that the current will not
fall to zero immediately on the ac side inductance and there shall be some protection
equipment on the ac side. Also the inductance on the ac side limits the transition, so whenever
there is a switch from device to another you see commutation overlap in the dc fault current.
The RMS ac current equivalent to the dc current Idc will be equal to Irms= Idc √6 ⁄π and if the
transformer sees all harmonics the true RMS current will Irms= Idc √2 ⁄√3 with assumed
transformer reactance in the range 12-20%.
The first requirement needed is a suitable circuit breaker at both ac sides of the lines.
The circuit breakers shall be attached with suitable protection and tripping control schemes

230
with associated telecommunication and tele-protection from the fault measurement on the dc.
The circuit breaker can also be equipped with suitable over-current and earth fault protective
relays.
Control measures
All systems around the world they have one voltage relative to the ground and then
another voltage relative to the ground. They don’t use the whole return ground. They actually
have controls on these that they measure this current and then they put offset on the firing
delay to keep this current zero. The reason to keep it zero, if you start to put current through the
earth and a path between them you will find a lot of people upset with you because of a lot of
interference with electronics. If there is a pipe (water or gas) that follow the same corridor, this
current will follow on their pipe conductor and will speed up the corrosion of the pipe line
unless other measure is taken.
Suppose we have two systems that are normally out of synchronism. At present there are
several HVDC connections linking them, but no ac connections. If the systems are slightly off
frequency from each other, the phase angle across this line will vary continuously with the
potential for large, uncontrolled power flows, so the HVDC connection is used to decouple the
two systems. Would it possible to install AC line between these two systems with a UPFC
installed to control the power flows instead of putting a HVDC connection? How would this
need to be rated (i.e. what angles can achieve, what approximate voltage ratings, etc.) if it were
installed. Assume that the equivalent voltage at each end of the line is 1.0PU and you want to
maintain a constant current through the line no matter what the phase angle difference between
the two ends of the line does. It is possible to install AC line between these two systems with a
Unified Power Flow Controller –UPFC installed to control the power flow instead of putting a
HVDC connection.
Application of Power Electronics in Fuel Cells Distribution Energy Systems
Fuel cells can supply energy from the stored primary chemical sources to produce a
distribution system of 400V L-L [16]. The system requires a static dc/ac converter to connect
them to the distribution network. Criterion has to be defined to choose the inverter taking into
account the difference of voltage values between a typical fuel cell (200V, 10 A) and the
available industrial network voltage, 400V. The total number of parallel fuel cell stacks
depends on the distribution load current flowing and the output current of each fuel cell stacks.

231
The classical solution for this kind of conversion is a boost converter plus PWM voltage source
converter-VSC [16].
Different converter topologies such as a bridge voltage source converter, a multilevel
voltage source converter, a current source converter can be used. The most common will be
alternative energy generation whether if VSC to connect the fuel cell or even cases of wind
generation are going to produce voltage harmonics and they have to meet the Standards [16].
Alternatively, the inserted series voltage is added to the voltage at the point of common
coupling such that the device can provide a buffer to eliminate any voltage dip, sag or flicker
[4].
Using the Voltage Source Converter- VSC Topology, the alternative energy is
considered as a voltage source and shall be connected in series with an inductor. The value of
this inductor depends on the permissible dc current ripple and on the pulsation frequency of the
PWM. A switch with two semiconductors a diode plus an IGBT are used on a 3-ph, bridge
configuration. The capacitor is normally connected in parallel with additional series connected
diode and IGBT, for bi-directional blocking. The three PWM voltage sources represent the
three-phase distribution network together with the output filter capacitors [16]. VSC converter
may need more switches and an IGBT compared to CSC for current blocking in the reverse
direction. If this is going to be connected to build distribution system then three- single phase
bridges is better than 3-ph bridge as distribution system will always be unbalanced. Centre
grounded point will provide voltage clamp at the grounded middle point between the two
voltage sources or fuel cell stacks (+/- Vdc) [16].
Using Current Source Converter- CSC Topology, PWM -CSC based on IGBT can be
used. A matrix converter is also studied for this connection with CSC [16]. The topology can
have switch with two semiconductors, an IGBT used on a 3-ph-bridge configuration. Bi-
directional blocking switch is needed and the switches have to be able to block negative and
positive voltages. The PWM current source inverter is connected, in series with an inductor, to
the three phase distribution network. CSC type of converter has more conduction losses than
the other topologies, depending on input current. The PWM CSC has some advantage, as it
commutates less and has less commutation losses than VSC. The switching power losses in the
PWM, CSC is smaller than those in a boost plus PWM, VSC. The power circuit for CSC is
simpler and has no intermediate electric energy storage [16]. For higher power application
GTO thyristors can be used, however for distribution system applications, the preferred device
usually is the IGBT as it can carry fairly large current and has a fast switching characteristics

232
and low losses. There is an N-type diode that inherent in the IGBT package or added to GTO
and GCT, but is not needed in CSC [12]. It is not recommend reversing the current either under
transient operation or due to current ripple driven by the converter and additional series diode
and IGBT are needed for blocking. For balanced load, though the load currents are balanced
and do not contain any triple harmonics, the neutral current may not always be zero in the
steady state. The initial excursion neutral current is due to the inverter circuit in forcing the
currents through the inductive load. However, the transient dies down very fast and the neutral
currents settle around zero. There will be a high frequency ripple in the neutral current due to
switching action, but the average current has the desired value of zero. For zero sequence
unbalanced load, there will be a significant neutral current; in addition, the high frequency
switching ripples are also present in the neutral current. It can be connected with anti-parallel
diode. The chain link convertor is suitable for distribution, and this may however be strength
for photovoltaic or fuel cell applications [4].
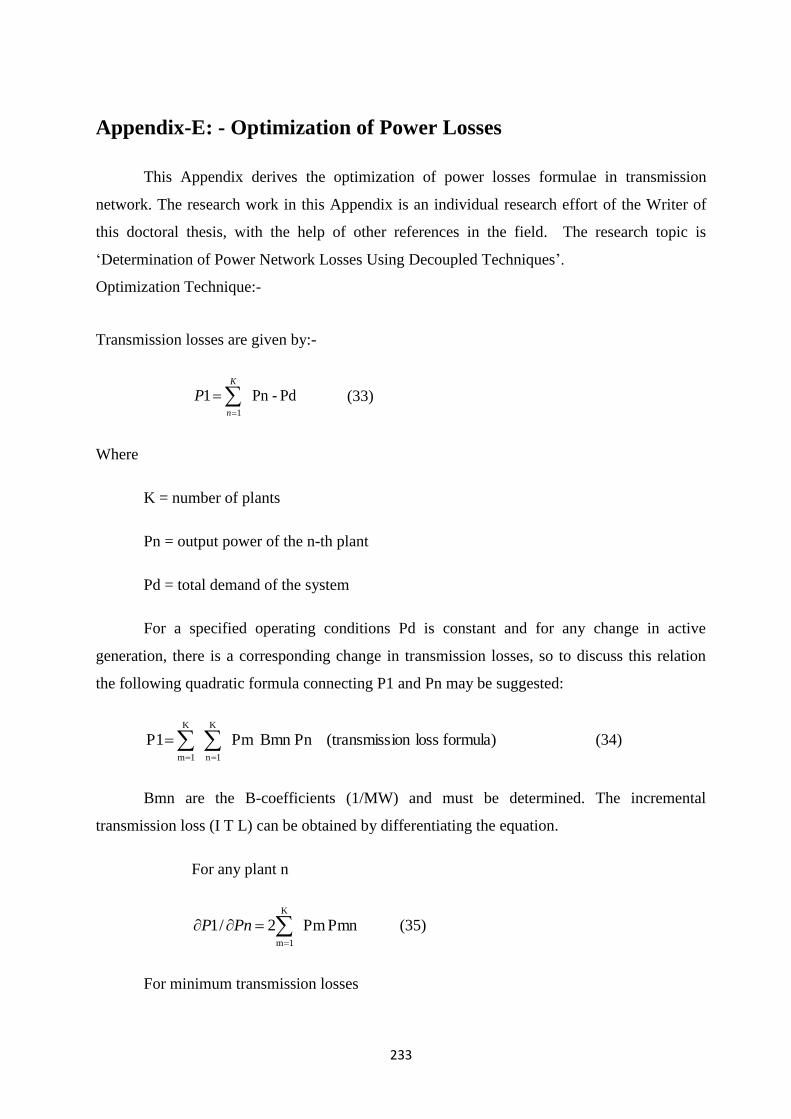
233
Appendix-E: - Optimization of Power Losses
This Appendix derives the optimization of power losses formulae in transmission
network. The research work in this Appendix is an individual research effort of the Writer of
this doctoral thesis, with the help of other references in the field. The research topic is
‘Determination of Power Network Losses Using Decoupled Techniques’.
Optimization Technique:-
Transmission losses are given by:-
K
n
P1
Pd-Pn 1 (33)
Where
K = number of plants
Pn = output power of the n-th plant
Pd = total demand of the system
For a specified operating conditions Pd is constant and for any change in active
generation, there is a corresponding change in transmission losses, so to discuss this relation
the following quadratic formula connecting P1 and Pn may be suggested:
K
1m
K
1n
formula) lossion (transmissPn Bmn Pm P1 (34)
Bmn are the B-coefficients (1/MW) and must be determined. The incremental
transmission loss (I T L) can be obtained by differentiating the equation.
For any plant n
K
1m
Pmn Pm 2/1 PnP (35)
For minimum transmission losses

234
K
1m
0Pmn Pm or 0/1 PnP (36)
Hence an optimum set of plant outputs can be determined by solving the equation. The
technique used is to equate this equation to a parameter
K
1m
Pmn Pm
After that reasonable incremental values of are taken and the corresponding plant
loading P1, P2, PK are determined using the elimination technique discussed in Chapter 2. For
each set of plant loadings, the constraining the relation should be less or equal to some
tolerance. If this equation is not satisfied, then a new value of is taken. Once this equation is
satisfied, then the corresponding P1, P2, PK are the optimum plant outputs.
To follow this optimization technique, then it is necessary to determine the B-
coefficients.
Determination of the B-Coefficients:
Differentiating the equation with respect to Pn one obtains:-
∂/∂Pn (∂P1/∂Pn) = ∂2 P1/∂Pn
2 = 2 Bnn (37)
And differentiating the equation again with respect to Pm gives:-
∂/∂Pm (∂P1/∂Pn) = ∂2 P1/∂Pm∂Pn = 2 Bmn (38)
Thus if the second derivatives of the system transmission, losses with respect to
plant outputs can be found, the B-coefficients can be determined.
The left hand side I T L the equation can be written as:-
N
1j
/ j . j P1/ /1 PnPnP
j = phase angle at bus j
N = Number of buses in the system.

235
The term ∂j / ∂ Pn stays constant for any change in plant outputs or load levels around
the operating condition. This term can be referred to by a set of constants Ajn. The I T L for
any plant ‘n’ can then be rewritten as:-
N
1j
Ajn . j P1/ /1 PnP (39)
Differentiating equation with respect to Pn and Pm, the following two equations would
be obtained for the B-coefficient constants:-
N
1i
2N
1j
N
1i
2N
1j
(41)Ajn . Aim .i P1/ 2/1
And
(40)Ajn .Ain θj.θi P1/ 1/2Bnn
jBmn
Expression For ∂2 P1/∂i∂j:-
The transmission loss P1 can be expressed in terms of voltage magnitudes and phase
angles as:-
N
1n
N
1K
N
1n
2 (42) θn)-θk ( cosGnk Vk Vn -Gnn Vn 2P1
Gnk = conductance between buses n and k
If the bus voltages are assumed constants then the first derivative of P1 with respect to
j is:-
N
1K
(43) θj)-θk (sin Gjk Vk Vj 2P1/ j
Differentiating equation (12), first with respect to j and second with respect to i, the
following generalized equations would be obtained:-
(45) θj)-θi ( cos Gij Vj Vi 2θjθiP1/
j iFor
(44) Gjj 2Vj - θk)-θj ( cosGjk Vk Vj 2θjP1/
j iFor
2
N
1K
222

236
Calculation of the A-Constants: -
The term Ajn represents a change in phase angle j for a change in plant Pn
with all other plants remaining constants. The steps followed to determine Ajn are as follows:-
A base case load flow must be carried out to determine the power at the slack bus and
also the voltage magnitude and angle at each bus.
The total demand power is increased by 5% and the total demand power plus losses is
supplied by any plant taken as slack bus. The changes in phase angles j for all buses are
determined. This determines the first column of the A-constants matrix.
Then another plant is taken as slack to supply the same demand as stated in step (2)
plus the new losses. This step determines the second column in the A-constants matrix.
The process is repeated for every plant in the system. Therefore if an N-bus system
contains G plants, the order of the A-constant matrix is N x G.
Derivation of the equations:-
Expanding equation (2) assuming that we have 3-generators in the system:
P1=P12 B11 + P2
2 B22+P3
2 B33+2P1 P2 B12+2P1 P3 B13+2P2 P3 B23
Differentiating P1 with respect to P3
3
1m
PmBm3 2 B23 2P2B13 2P1B33 2P3P3P1/
Differentiating ∂P1/∂P3 again with respect to ∂P3:-
∂/∂P3. (∂P1/∂P3) = ∂2 P1 / ∂P3
2 = 2B33
Generalizing for any generator n, the previous equation follows as:-
∂2 P1/∂Pn
2 = 2Bnn
Similarly ∂/∂Pm (∂P1/∂Pn) = 2Bmn

237
Derivation of the equations:-
Expanding equation, assuming a 3-bus system
∂P1/∂P1 = ∂P1/∂1. A11+∂P1/∂2.A21 + ∂P1/∂3. A31
∂Pl/∂P = ∂P1/∂1. A12+∂P1/∂2.A22 + ∂P1/∂3. A32
Then
∂2P1/∂P1
2 = ∂/∂P1[∂P1/∂1. A11+∂P1/∂2.A21 + ∂P1/∂3. A31]
Thus
∂2P1/∂P1
2 = A11 [∂
2P1/∂1
2. ∂1/∂P1 + ∂
2P1/∂2.∂1. ∂2/P1 +
∂2 P1/∂3. ∂ . ∂3/∂P1] + A21 [∂
2 P1/∂1.∂2. ∂1/∂P1 +
∂2P1/2
2 .∂2/∂P1 + ∂
2P1/∂3.∂2. ∂3/∂P1] +
A31 [∂2P1/∂1.∂3.∂1/∂P1 + ∂
2 P1/∂2.∂3. ∂2/∂P1 +
∂2 P1/∂3
2 . ∂3/∂P1]
Substituting for the partial derivatives of phase angles with respect to plant outputs, by
Ajn yields:-
∂2P1/∂P1
2 = A11
2 .∂
2P1/∂1
2 + A21
2. ∂
2P1/∂2
2 +A31
2.∂
2 P1/∂3
2 +
2A11. A21.∂2 P1/∂1.∂3 + 2A11. A31. ∂
2 P1/∂1.∂3 + 2A21. A31
∂2 P1/∂2. ∂3
Generalizing for n-generator in the system:-
Ajn Ain. j.i.P1/ nPP1/ 2n
1
n
1
22 i j
Other equation follows in the same way:-
Derivation of the equations:-

238
Expanding equation for a 3-bus system:-
P1 = 2V12. G11 + 2V2
2. G22 + 2V3
2 .G33 – V1
2 G11 – V2
2 G22-V3
2, G33-2V1.V2.
G12. cos (1 - 2) – 2V1.V3. G13. cos (1-3) – 2V2. V3. G23 cos (2 - 3)
Differentiating P1 with respect to 1 twice, one obtains:-
∂2 P1/∂1
2 = 2V1. V2. G12 cos (1-2) + 2V1 .V3 . G13. cos (1-3)
.G112V1 θk)-θ1 ( cos G1K. Vk. V1. 2 23
1k
Generalizing for N-bus system:-
.Gjj2Vj θk)-θj ( cos GjK. Vk. Vj 2 /1 2N
1k
22
QjP
Results:-
A simple 3-bus system was discussed.
The optimum loss of this system was determined following the optimization
technique steps. The A-constants were calculated manually with this aid of the load flow
results obtained for the system. These constants can be calculated using the computer as a part
of the optimization program. The A-constants are calculated only once at the beginning of the
program since they are independent of load increments around the operating conditions.
The following steps represent the procedure followed to obtain optimized losses
of the 3-bus system. A base load flow of the system was carried out and the results obtained are
shown in Table X.
Table X: Base load flow result. Losses = 0.045 pu
Bus No. Voltage Angle PG PL
1
2
3
1
1
0.898367
0
- 0.009044
- 0.08220
0.545446
0.5
-
0
0
1

239
The total load demand was then increased by 5% and the load flow results obtained are
shown in Table XI.
Table XI: Load flow result for 5% increment in total demand. Losses = 0.04818
Bus No. Voltage Angle PG PL
1
2
3
1
1
0.898367
0
+0.007376
- 0.088558
0.59818
0.5
0
0
0
1.05
With the same load in step (2), bus (2) was then taken as slack, the load flow results are
presented in Table XII.
Table XII: Load flow result for 5% increment in total demand (bus 2 is slack). Losses = 0.04841
Bus No. Voltage Angle PG PL
1
2
3
1
1
0.898367
- 0.002831
+0.009042
-0.089714
0.545446
0.552962
0
0
0
1.05
Note: - all values are in pu based on 300 MVA
The A-constants were obtained using the results in the steps. As defined before the A-constants
are given by:-
Ajn = ∂j / ∂Pnj / Pn
From the load flow data in the tables.
A11 = 0

240
0.141873 - 5.0552962.0
0.0822 0.089714 - A32
0 A22
0.0534534 - 5.0552962.0
0 - 0.002831 A12
(3) and (1) Tables From
0.1205673 - 545446.059818.0
0.0822 0.088558 - A31
0.0316304 - 0.545446 0.59818
0.009044 - 0.007376 A21
The B-coefficients using the computer were found to be:-
B11 = 0.0309 , B12 = 0.0243
B21 = 0.0243 , B22 = 0.0358
Computer result for minimum losses was found as presented in Table XIII:-
Table XIII: Optimum condition for the system. Optimum losses = 0.015 PU
Bus No Base Pg Optimum
1
2
0.545
0.500
0.545
0.470
= 0.06
Since the load increment in the steps is small, the voltage magnitude for the load bus
(3) is assumed constant. The voltage can also be maintained constant at generator buses (1) and
(2) by varying the exciter. Hence the assumption made in deriving the A-constant formula is
satisfied.

241
Appendix-F: - Authors’ Publications- Doctoral Research Published
Papers
The following nine papers were published by the PhD Authors in different international
conferences held in USA, Europe, Asia and the Middle East during the course of this research
work from 2007 to 2012. Eight papers from the mentioned nine below are used as references in
this study except one which is in the study focus as it is related to measuring human exposure
to magnetic fields.
Paper I:
Elsayed H, Cham E, Al Jaidah Y, Al Najjar A. (2013) ‘Towards Smart Power Grid in Qatar:
Application of STATCOM and Composite Conductors’. The paper was presented and
published in the 4th Arab Union of Electricity General Conference, held in Doha, Qatar,
between 7-9 January 2013.
Paper II:
Elsayed H, Borya M, Al Jaidah Y, Amoussouga E, Al-Marri S, Al Najjar A. (2013) ‘Battery
Storage and PVs Energy Conversion System to meet Summer Peak in Qatar: A reasoned
choice among potential Smartgrid solutions’. The paper was presented and published in The
4th Arab Union of Electricity General Conference, Doha, Qatar, 7-9 January 2013.
Paper III:
Elsayed H, Abu Eida S, Chaudhry S, Al-Mahmoud A. (2012) ‘Dynamic Control of Voltage
and Power Flow in Qatar Transmission System’. The paper was presented and published in
Session A1, Paper A103, Cigre GCC Power 2012 Conference & Exhibition_ Oman 12th –
14rd November 2012.
*The paper has been selected as one of the best three applied research papers in the conference.
Paper IV:
Elsayed, H.I.; Johnson, B.K.; Lai, L.L. (2012), ‘Online Systems Potential Applications in
Intelligent Power Grids’. The paper was presented and published in PES IEEE General
Meeting, San Diego, California, USA, 22-26 July 2012.

242
Paper V:
H.I. Elsayed, S.R. Chaudhry, A.-A.A. Al-Mahmoud (2012), ‘PV, Battery Storage and Energy
Conversion System for Meeting Peak Load in a Substation’. The paper was presented and
published in CIRED and IET 2012 Workshop_ Integration of Renewables into the Distribution
Grid Lisbon, Portugal, 29-30 May 2012, www.cired2012-workshop.org. IEEE Xplore Digital
Library E-ISBN: 978-1--84919-628-4, Digital Object Identifier: 10.1049/cp.2012.0758.
Paper VI:
K. El Lithy, S. Al-Suwaidi, H. Elsayed, ‘Measuring Human Exposure to Magnetic Fields near
EHV 400 KV GIS Substation and Power Lines in the State of Qatar’. The paper was presented
and published in 2011 North American Power Symposium, Boston, Massachusetts, USA,
August 4-6, 2011.
Paper VII:
El-Sayed, H.I. ; Chan, K. ; Al-Jomali, A.A. ; Johnson, B.K. ; Lai, L.L. (2010), ‘Operation
Enhancement by Power Flow Controller - An Investigation in the Qatar Transmission System’.
The paper was presented and published in The IEEE 2010 Power and Energy General Meeting,
Minneapolis, Minnesota, USA, 25-29 July 2010.
Paper VIII:
H.I. El Sayed, B.K. Johnson, L.L. Lai, N. Tse (2009), ‘Investigation into the advancement of
FACTS and their implementation impact in a Utility’. The paper was presented and published
in The 8th IET International Conference on Advances in Power System Control, Operation and
Management, APSCOM2009. Kowloon Shangri La Hotel, Hong Kong, 08-11 November 2009.
Paper XIX:
Elsayed, H., Sasono, P., and Lai, L. (2007), ‘Risk Assessment and Mitigations of
Electronic/Cyber Intrusions into SCADA, DCS and LAN Systems of a Utility’. The paper was
presented and published in 3rd GCC CIGRE International Conference and Exhibition (GCC
Power 07), Dubai, UAE, 05-07 Nov. 2007.