city of new bern
TRANSCRIPT

City of New Bern North Carolina
COMPREHENSIVE ANNUAL FINANCIAL REPORT
FOR THE YEAR ENDED JUNE 30, 2016
Prepared by: City of New Bern Finance Department
Submitted by: Joseph R. Sabatelli, CPA Director of Finance

CITY OF NEW BERN, NORTH CAROLINA
COMPREHENSIVE ANNUAL FINANCIAL REPORT FOR THE YEAR ENDED JUNE 30, 2016
TABLE OF CONTENTS
Page Number
INTRODUCTORY SECTION
Letter of Transmittal ...................................................................................................................................... i‐xi
GFOA Certificate of Achievement .................................................................................................................... xii
List of Principle Officials ................................................................................................................................. xiii
Organizational Chart....................................................................................................................................... xiv
FINANCIAL SECTION
Independent Auditor’s Report ........................................................................................................................ 1‐3
Management’s Discussion & Analysis ........................................................................................................... 4‐14
Basic Financial Statements:
Government‐wide Financial Statements
Statement of Net Position ...................................................................................................................... 15
Statement of Activities ........................................................................................................................... 16
Fund Financial Statements
Balance Sheet – Governmental Funds .................................................................................................... 17
Statement of Revenues, Expenditures, and Changes in Fund
Balances – Governmental Funds ........................................................................................................ 18
Reconciliation of the Statement of Revenues, Expenditures, and Changes in
Fund Balances of Governmental Funds to the Statement of Activities................................................. 19
General Fund – Statement of Revenues, Expenditures, and Changes in
Fund Balances – Budget and Actual .................................................................................................... 20
Statement of Net Position – Proprietary Funds ........................................................................... 21 and 22
Statement of Revenues, Expenses, and Changes in Net
Position – Proprietary Funds .................................................................................................. 23 and 24
Statement of Cash Flows – Proprietary Funds .................................................................................... 25‐28
Notes to Financial Statements ............................................................................................................... 29‐71
Required Supplementary Information:
Law Enforcement Officers’ Special Separation Allowance Schedule of Funding Progress ............................. 72
Other Postemployment Benefits Schedule of Funding Progress .................................................................. 73
Schedule of City of New Bern’s Proportionate Share of Net Pension Liability (Asset) ................................... 74
Schedule of City of New Bern’s Contributions ............................................................................................. 75
Notes to Required Supplementary Information .......................................................................................... 76

CITY OF NEW BERN, NORTH CAROLINA
COMPREHENSIVE ANNUAL FINANCIAL REPORT FOR THE YEAR ENDED JUNE 30, 2016
TABLE OF CONTENTS
Page Number
FINANCIAL SECTION (CONTINUED):
Combining and Individual Fund Statements and Schedules:
Combining Balance Sheet – Nonmajor Governmental Funds .................................................................. 77‐79
Combining Statement of Revenues, Expenditures, and Changes in Fund
Balances – Nonmajor Governmental Funds ....................................................................................... 80‐82
General Fund – Schedule of Revenues, Expenditures, and Changes in Fund
Balances – Budget and Actual (Budgetary Basis) ................................................................................ 83‐86
Community Development Fund – Schedule of Revenues, Expenditures, and Changes in
Fund Balances – Budget and Actual (NON‐GAAP) ................................................................................... 87
Emergency Telephone Fund – Schedule of Revenues, Expenditures,
and Changes in Fund Balances – Budget and Actual (NON‐GAAP) ........................................................... 88
Police Special Revenue Fund – Schedule of Revenues, Expenditures,
and Changes in Fund Balances – Budget and Actual (NON‐GAAP) ........................................................... 89
Grants Special Revenue Fund – Schedule of Revenues, Expenditures,
and Changes in Fund Balances – Budget and Actual (NON‐GAAP) ........................................................... 90
Glenburnie Road Multi‐Use Path Project Fund – Schedule of Revenues, Expenditures,
and Changes in Fund Balances – Budget and Actual (NON‐GAAP) ........................................................... 91
Public‐Private Partnership Fund – Schedule of Revenues, Expenditures,
and Changes in Fund Balances – Budget and Actual (NON‐GAAP) ........................................................... 92
FEMA Hurricane Irene Fund – Schedule of Revenues, Expenditures,
and Changes in Fund Balances – Budget and Actual (NON‐GAAP) ........................................................... 93
2012 CDBG NC Catalyst Fund – Schedule of Revenues, Expenditures,
and Changes in Fund Balances – Budget and Actual (NON‐GAAP) ........................................................... 94
Metropolitan Planning Organization (MPO) Plan Fund – Schedule of Revenues, Expenditures,
and Changes in Fund Balances – Budget and Actual (NON‐GAAP) ........................................................... 95
Entitlement Cities CDBG Program Fund – Schedule of Revenues, Expenditures,
and Changes in Fund Balances – Budget and Actual (NON‐GAAP) ........................................................... 96
Neuse Boulevard Sidewalk Fund – Schedule of Revenues, Expenditures,
and Changes in Fund Balances – Budget and Actual (NON‐GAAP) ........................................................... 97
2014 Bulletproof Vest Partnership Program Fund – Schedule of Revenues, Expenditures,
and Changes in Fund Balances – Budget and Actual (NON‐GAAP) ........................................................... 98
Equitable Sharing Fund – Schedule of Revenues, Expenditures,
and Changes in Fund Balances – Budget and Actual (NON‐GAAP) ........................................................... 99
Radio System Equipment Fund – Schedule of Revenues, Expenditures,
and Changes in Fund Balances – Budget and Actual (NON‐GAAP) ......................................................... 100
General Capital Projects Fund – Schedule of Revenues, Expenditures,
and Changes in Fund Balances – Budget and Actual (NON‐GAAP) ......................................................... 101

CITY OF NEW BERN, NORTH CAROLINA
COMPREHENSIVE ANNUAL FINANCIAL REPORT FOR THE YEAR ENDED JUNE 30, 2016
TABLE OF CONTENTS
Page Number
FINANCIAL SECTION (CONTINUED):
Combining and Individual Fund Statements and Schedules (Continued):
IT Network Merger Fund – Schedule of Revenues, Expenditures,
and Changes in Fund Balances – Budget and Actual (NON‐GAAP) ......................................................... 102
Electric Fund – Schedule of Revenues, Expenditures,
and Changes in Net Position – Budget and Actual (NON‐GAAP)............................................................. 103
Electric Rate Stabilization Fund – Schedule of Revenues, Expenditures,
and Changes in Net Position – Budget and Actual (NON‐GAAP)............................................................. 104
Water Fund – Schedule of Revenues, Expenditures,
and Changes in Net Position – Budget and Actual (NON‐GAAP)............................................................. 105
Water Capital Reserve Fund – Schedule of Revenues, Expenditures,
and Changes in Net Position – Budget and Actual (NON‐GAAP)............................................................. 106
West New Bern Water System Improvement Fund Capital Project Fund– Schedule
of Revenues, Expenditures, and Changes in Net Position – Budget and Actual (NON‐GAAP) .................. 107
Sewer Fund – Schedule of Revenues, Expenditures,
and Changes in Net Position – Budget and Actual (NON‐GAAP)............................................................. 108
Sewer Capital Reserve Fund – Schedule of Revenues, Expenditures,
and Changes in Net Position – Budget and Actual (NON‐GAAP)............................................................. 109
Township 7 Sewer Improvements Capital Project Fund – Schedule of Revenues, Expenditures,
and Changes in Net Position – Budget and Actual (NON‐GAAP)............................................................. 110
Stormwater Fund – Schedule of Revenues, Expenditures,
and Changes in Net Position – Budget and Actual (NON‐GAAP)............................................................. 111
AMI/DSM System Enterprise Capital Project Fund – Schedule of Revenues, Expenditures,
and Changes in Net Position – Budget and Actual (NON‐GAAP)............................................................. 112
Kale Road Project Enterprise Capital Project Fund – Schedule of Revenues, Expenditures,
and Changes in Net Position – Budget and Actual (NON‐GAAP)............................................................. 113
Schedule of Ad Valorem Taxes Receivable ................................................................................................ 114
Analysis of Current Tax Levy ..................................................................................................................... 115

CITY OF NEW BERN, NORTH CAROLINA
COMPREHENSIVE ANNUAL FINANCIAL REPORT FOR THE YEAR ENDED JUNE 30, 2016
TABLE OF CONTENTS
Page Number
STATISTICAL SECTION:
Net Position by Component – Last Ten Fiscal Years ........................................................................... 116 and 117
Changes in Net Position – Last Ten Fiscal Years ....................................................................................... 118‐123
Program Revenues by Function/Program – Last Ten Fiscal Years ....................................................... 124 and 125
Fund Balances – Governmental Funds – Last Ten Fiscal Years ............................................................ 126 and 127
Changes in Fund Balances – Governmental Funds ‐ Last Ten Fiscal Years ........................................... 128 and 129
The Electric System – Electricity Purchased, Consumed and Billed ‐ Last Ten Fiscal Years ................... 130 and 131
Electric Rates – Last Ten Fiscal Years ................................................................................................. 132 and 133
Electric System – Major Users – Current Year and Nine Years Ago .................................................................. 134
Water System – Major Users – Current Year and Nine Years Ago .................................................................... 135
Sewer System – Major Users – Current Year and Nine Years Ago .................................................................... 136
Assessed Value and Estimated Actual Value of Taxable Property – Last Ten Fiscal Years ................................. 137
Property Tax levies and Collections – Last Ten Fiscal Years ............................................................................. 138
Principal Taxpayers – Current Year and Nine Years Ago .................................................................................. 139
Direct and Overlapping Property Tax Rates – Last Ten Fiscal Years ................................................................. 140
Ratios of Outstanding Debt by Type – Last Ten Fiscal Years ............................................................................ 141
Direct and Overlapping Governmental Activities Debt ................................................................................... 142
Legal Debt Margin Information – Last Ten Fiscal Years ...................................................................... 143 and 144
Demographic and Economic Statistics ‐ Last Ten Fiscal Years .......................................................................... 145
Principal Employers – Current Year and Nine Years Ago ................................................................................. 146
Full‐Time Equivalent City Government Employees by Function/Program – Last Ten Fiscal Years ..................... 147
Operating Indicators by Function/Program – Last Ten Fiscal Years ................................................... 148 and 149
Capital Asset Statistics by Function/Program – Last Ten Fiscal Years ................................................. 150 and 151
COMPLIANCE SECTION:
Independent Auditor’s Report on Internal Control Over Financial Reporting
and on Compliance and Other Matters Based on an Audit of Financial
Statements Performed in Accordance with Government Auditing Standards .............................. 152 and 153
Independent Auditor’s Report on Compliance for the Major Federal Program and
on Internal Control over Compliance in Accordance with the Uniform Guidance ............................... 154‐156
Independent Auditor’s Report on Compliance for the Major State Program and on
Internal Control over Compliance in Accordance with Applicable Sections of
the Uniform Guidance and the State Single Audit Implementation Act ....................................... 157 and 158
Schedule of Expenditures of Federal and State Awards .................................................................................. 159

CITY OF NEW BERN, NORTH CAROLINA
COMPREHENSIVE ANNUAL FINANCIAL REPORT FOR THE YEAR ENDED JUNE 30, 2016
TABLE OF CONTENTS
Page Number
COMPLIANCE SECTION (CONTINUED:
Schedule of Findings and Questioned Costs ............................................................................................ 160‐167
Schedule of Prior Audit Findings .................................................................................................................... 168
City of New Bern’s Corrective Action Plan ...................................................................................................... 169

INTRODUCTORY SECTION

Everything comes together here.
i
Dana E. OutlawMayor
Mark A. Stephens City Manager
300 Pollock Street, P.O. Box 1129New Bern, NC 28563-1129
(252)636-4000
Aldermen
Dallas O. Blackiston Victor J. Taylor E. T. Mitchell
Johnnie Ray Kinsey Bernard W. White Jeffrey T. Odham
December 28, 2016 To the Honorable Mayor, Board of Aldermen, and Citizens of the CITY OF NEW BERN: The Comprehensive Annual Financial Report of the CITY OF NEW BERN, North Carolina (the City) for the fiscal year ended June 30, 2016, is hereby submitted. The basic financial statements contained herein have been audited by the independent certified public accounting firm of Mauldin & Jenkins, LLC, a firm of licensed certified public accountants, and their unmodified opinion is included in the financial section. Management assumes full responsibility for the completeness and reliability of the information contained in this report, based on a comprehensive framework of internal controls that it has established for this purpose. Because the cost of internal control should not exceed anticipated benefits, the objective is to provide reasonable, rather than absolute, assurance that the financial statements are free of any material misstatements. To the best of our knowledge and belief, the data enclosed is accurate in all material respects and is reported in a manner designed to present fairly the financial position and changes in financial position and, where applicable, the cash flows of the various funds of the City. All disclosures necessary to enable the reader to gain an understanding of the City’s financial activities have been included. This report includes all the funds of the City. The City provides a full range of services including police and fire protection; sanitation services; construction and maintenance of streets and other infrastructure; community development services including planning and zoning; and parks and recreational services. In addition to general governmental activities, the City owns and operates electric, water, sewer and stormwater utilities; therefore, these activities are included in the reporting entity. The New Bern Housing Authority, the New Bern-Craven County Public Library, Swiss Bear Downtown Development Corporation, and Friends of the Fireman’s Museum do not meet the established criteria for inclusion in the reporting entity, and accordingly are excluded from this report. Generally Accepted Accounting Principles (GAAP) requires that management provide a narrative introduction, overview and analysis to accompany the basic financial statements in the form of Management’s Discussion and Analysis (MD&A). This letter of transmittal is designed to complement the MD&A and should be read in conjunction with it. The City of New Bern’s MD&A can be found immediately following the independent auditor’s report.
Everything comes together here.
ii
The City is required to undergo a “Single Audit” in conformity with Title 2 U.S. Code of Federal Regulations (CFR) Part 200, Uniform Administrative Requirements, Cost Principles, and Audit Requirements for Federal Awards, and the State Single Audit Implementation Act.
Information related to this single audit, including the schedule of expenditures of federal and state awards, findings and recommendations, and the auditor’s reports on the internal control over financial reporting and compliance with applicable laws, regulations, and contract and grants agreements, is included in a separate reporting package. ECONOMIC CONDITION AND OUTLOOK New Bern, settled in 1710 at the confluence of the Trent and Neuse Rivers, is located 110 miles east of Raleigh, the State Capitol, and 35 miles west of the Atlantic Ocean. New Bern is the largest municipality in Craven County and serves as the County seat. Rich in history, it is the site of North Carolina’s Colonial Capital and its first State Capitol. New Bern is also the Birthplace of Pepsi Cola, a drink first created by Caleb Bradham, a local pharmacist, in 1898. Downtown New Bern offers museums, shops, galleries, restaurants, historic sites, waterfront hotels, bed and breakfast accommodations, marinas, a convention center, parks, historic homes and churches. Tryon Palace Historic Sites & Gardens, the first permanent seat of colonial government in North Carolina, offers visitors an opportunity to experience over 300 years of American history and acres of period-inspired gardens. The City is centrally located to several growing communities including the cities of Jacksonville, Morehead City, Greenville, and Kinston, all around 40 miles and less than an hour’s drive away. The City is easily accessible by US 70, US 17, and NC 43. As of June 2016 the community had an unemployment rate of 4.9 percent compared to a statewide rate of 4.9 percent. The 2015 census population for the city was reported as 30,070. The City is a council-manager form of government with a Board of Aldermen and Mayor. The Board is composed of six members who are elected by ward, and a mayor who is elected at-large. Each serves for four year coincident terms. The City Manager, Director of Finance, and City Attorney, are appointed by, and serve at the pleasure of the Mayor and Board of Aldermen. The City Manager serves as the chief executive officer of the organization, and is responsible for carrying out Board of Aldermen policy through the administration of the various departments and their staff. The City thrives on tourism as it has over 150 sites included in the National Register of Historic Places. Stretching 248 miles, the Neuse River, located in New Bern, is the longest river in North Carolina and the widest river in America (6 miles across). The City is centrally located to 157,000 acres of the Croatan National Forest which is nationally recognized for its trails and recreation opportunities. Government (federal, state and local) is the largest single employer in the County with 24 percent of all jobs. CarolinaEast Health System is the City’s largest single employer serving approximately 185,000 patients a year and employing over 2,200 people and with an average utility payment of over $1.4 million per year, CarolinaEast Health Systems contributes significantly to the City’s economy. The hospital is currently undergoing the largest expansion in its 53 year history to include a new comprehensive cancer center and new public concourse.
Everything comes together here.
iii
New Bern is home to two large manufacturing facilities: Moen, Inc. and BSH Appliances, Corp. Moen is the number one faucet brand in North America and constructed a new component warehouse in the summer of 2016 that brought 75 new jobs to the area. BSH Appliances, a German based manufacturer, is the world’s third-largest home appliance manufacturer specializing in cooking, washing/drying, refrigeration/freezing, and other consumer products. New Bern is host to the largest of the three U.S based factories. The City partnered with Craven County, the City of Havelock, and the Committee of 100, to form the Craven 100 Alliance (C1A). This is a public-private economic partnership that has raised nearly $1.3 million from various sources to make things happen in Craven County. The primary goals of C1A include: encouraging the county’s best and brightest young people to stay in the area, establish relationships with local major employers, and develop training programs to prepare a rising workforce. MAJOR INITIATIVES FOR THE YEAR Fiscal year 2015-2016 included the planning and implementation phases of several initiatives as well as the continuation or completion of projects begun during the previous fiscal year. UNC School of Government Property Study The City contracted with the UNC School of Government to engage in a city owned property utilization study. The initiative includes simultaneous pre-development processes for 4 project sites in New Bern’s Central business District in order to attract private investment and further the City’s community and economic development goals as they relate to New Bern’s historic downtown, with the current focus on two sites. This is an $110,000 project. City Market: 205 First Street. Former Warehouse/Utilities
The Choice Neighborhoods (CNI) planning grant brought community leaders and stakeholders together to envision its future and design a strategic transformation. Both the Gateway Renaissance and CNI Transformation plans include redevelopment of the 1st Street Corridor, bringing amenities, education, work force development & job opportunities to an underserved community. On February 21, 2015, at their annual retreat, the New Bern Board of Alderman supported staff efforts to improve corridors and seek redeveloopment of the Warehouse/Utility site into a multi-use city market. The Multi-Use City Market project consists of improvements on New Bern’s primary connecting corridor into historic downtown. The area has seen little growth, increased poverty, high population density, and overall population loss. The area lacks nearby services, amenities, adequate public transportation and job opportunities. This project will address the needs of an underserved community by offering workforce development training, job creation and entrepreneurial options. The building requires improvements and street accessibility that will take approximately 6 months. Implementation of this project involves collaboration between the City (property owner), Craven Community College, Craven County, grant foundations and local business leaders.

Everything comes together here.
iv
Public Works Facility The scope of this project is for the relocation of the City of New Bern’s Public Works Administration office from City Hall to 1004 South Glenburnie Road. This project included renovating the existing facility of Glenburnie Road to add offices for the Director of Public Works, two administrative assistants, a staff engineer and the Public Building Superintendent. The project cost approximately $50,000 and was completed in May 15, 2016. Palace Point Commons This project reduced the existing 50 foot paved surface located along South Front Street behind Tryon Palace to 27 feet of paved surface and an eight foot exposed aggregate sidewalk and additional green space. Overhead power lines were converted to underground and new street lighting was added. This project was designed and coordinated through the City of New Bern’s Public Works Department. The project was completed in June of 2016 at a cost of $130,000. New Bern Fire Rescue Introduces New Partner In September 2015, New Bern Fire Rescue introduced the newest member of its arson investigation team through the State Farm Arson Dog Program: K-9 Darby, an 18 month old Goldadore. Darby will assist the department by sniffing out the causes of fires including any accelerants that may be used in cases of arson. Darby and her handler, Fire Marshall Danny Hill, completed a five week canine-accelerant detection school training. Having Darby on board extends the capabilities of the investigator and her scent-discriminating abilities are better than any equipment available at a fire scene when arson is expected. Township No. 7 Sewer Improvements Project Due to the limited treatment capacity of the city’s Septic Tank Effluent Pump (STEP) system, a reduction in system users is required to ensure that the New Bern Seven Treatment Facility operates within its permit limitations. To accomplish this reduction, approximately 1,100 STEP system users will be transferred to the City's Conventional system. The proposed infrastructure will also be utilized to expand the Conventional system coverage area and reduce overall system operating pressures (reduced maintenance costs). The engineering design and construction administration services for this project will be performed by City of New Bern staff. This project was awarded to STEP Construction, Inc. for $608,318. Neuse River Gateway Project The City acquired the building and grounds located at 1307 Country Club Road. This was made possible by a triple-funding effort from the City, the Bate Foundation, and a Coastal Waterfront Grant. The tax value of the building and grounds is over $400,000 and the City was able to purchase it for $311,000. Parks and Recreation Administration will use this property for administrative offices and the additional river access for kayaks, canoes, and fishing opportunities.
Everything comes together here.
v
AMI/DSM Smart Grid Project Phase III The Department of Public Utilities requested a budget of $5,600,000 for the third and last phase of the Advanced Metering Infrastructure (AMI) Project. This third phase will be comprised of the installation of 14,000 electric meters, 10,000 water meters, and 6,000 load management devices to enable customers of the Public Utilities Department to actively monitor and control their electric and water consumption. This phase of the AMI project also includes the implementation of Outage Management, Interactive Voice Recognition and Pay as You Go functionality being made available to the customers. The cost of this system is divided between the Electric and Water Funds based upon the meters, devices, and core system allocation for each fund. The largest driver behind better implementing this technology will be the ability to reduce system demand through load management. This ability will directly affect the power supply costs for the City as the system is expanded. This will complete the deployment of the AMI technology throughout the electric and water systems. 2015-16 CDBG Community Revitalization Grant This project included a new playground shade structure for Henderson Park that was completed in the summer of 2016. Funding was provided by CDBG funds secured by the Development Services Department. Carter-Sampson Park Development A one quarter acre neighborhood park located at the corner of Green and Sampson Streets in the Duffyfield community was developed and opened to the public in the spring of 2016. Park amenities include a ½ basketball court, swings, sandbox, and play rockers. Primary funding of park was provided by Swiss Bear, Inc. Credit Exposure Risk Reduction Effective Fiscal Year 2015, the Board of Aldermen directed the City to phase in initiatives to bring write off levels closer to other public utilities our size based upon recommendations from our American Public Power Organizational Check Up (OCU) in 2012. APPA returned in 2015 for a follow up OCU and applauded the governing board’s efforts in holding steady to the initiative and highlighting our success in a case study included as part of an industry training manual for public utility customer service best practices. This paradigm shift significantly changed from “finding a way to say yes” in place for decades to a more limited credit policy. Deposit assessment for delinquent activity and limitations on the number of pay arrangements offered are the crux of the initiatives. Write offs have dropped 32% since implementation. 2015 Public Power Award of Excellence The City of New Bern Utility Business Office was awarded the 2015 Public Power Award of Excellence for Financial Stability. The award recognizes our organization’s efforts in offering best practice customer options throughout the billing process, including: equal payment programs, e-billing, and multiple payment choices. This award also recognizes community partnerships and implementation of new technology within the electric system.
Everything comes together here.
vi
Customer Communication and Community Involvement APPA’s 2015 follow up OCU also recognized our significant improvements made in customer communication and customer outreach recognizing us with the highest marks attainable in this category. Notable achievements include our expanded role in social media platforms, our “eco@home” customer bill insert newsletters published multiple times a year, and collaborative programs such as “E-tracker” with our joint action committee, ElectriCities, teaching local New Bern High School students how to make informed decisions about household utility use. Additionally, Our New Bern CONNECTS Round Up program which allows participants to voluntarily “round up” bills to the next dollar and directing the “round up” funds to help customers in crisis continues to garner momentum. To date, 88 customers have signed up and contribute to the program since its launch to help 47 families in the greater New Bern area. Our first corporate sponsor contributor was recently secured. These initiatives, along with the many non-profit events staff are involved with throughout the year contribute to solidifying our commitment of having an active role in our community. Information Technology Consolidation and Upgrade
Two significant milestones were completed in this multiyear project during FY 2015-2016, the merging of the Police Department and City Microsoft Active Directory domains and email systems. The City has worked to gain efficiencies through the consolidation and upgrade of the previously existing and separated information technology and infrastructure. All city e-mail accounts have been migrated from locally managed (on-premises) servers to Microsoft’s Exchange 365 cloud-based email service. In addition to providing new functionality, the move to cloud-based email resulted in significant efficiency gains since the several hundred staff hours annually that were required to manage our local email infrastructure can now be devoted to other requirements. Information Technology Financial Servers and Domain Controller Replacement
The creation and initial configuration of virtual Linux servers intended to replace the physical HP-UX servers on which the database and application software for the City’s Banner financial system is hosted was completed this fiscal year. When the final configuration and transition of the database and application to these servers is completed in FY 2016-2017 the City will benefit from having its financial system hosted on a more cost-effective, secure and easily scalable platform. Utility Rate Reductions During the preparation of the FY 2015-2016 budget, the City identified various efficiencies within the Electric, Water and Sewer Funds resulting in rate reductions of 3%, 6% and 4.5% respectively effective on July 1, 2015. Additionally, the City further reduced Electric rates by 12% effective September 1, 2015 and 1.25% effective April 1, 2016 due to a reduction in power supply costs resulting from the sale of electric generating assets of the NC Eastern Municipal Power Agency to Duke Energy.

Everything comes together here.
vii
MAJOR INITIATIVES FOR THE FUTURE Fiscal year 2016-2017 includes the planning and implementation phases of several initiatives as well as the continuation or completion of projects begun during the previous fiscal year. Lawson’s Creek Park Improvements This project will be completed in three phases. Phase one will be for the resurfacing of an existing 0.40 acre parking lot and an existing 1.50 acre parking lot and boat launch. This phase was completed in November of 2015. Phase II is for the replacement of approximately 1600 feet of new decorative fencing along the boundary of the park along NC Highway 70. This phase of the project should be completed in September 2016. Phase three of the project will consist of widening the entrance road, adding a lighted landscaped island down the center of the road, adding sidewalks, and an additional turn lane for exiting the park. In addition, a new elevated walkway will be added along the Neuse River connecting Lawson’s Creek Park with the Parks and Recreation Administration offices. This phase of the project is scheduled to be completed by February 2017. The total estimated cost of the project is $300,000. Riverwalk Extension This project will extend the existing Riverwalk approximately 600 feet from Council Bluffs Park to the Galley Marina. The proposed walkway will be an eight foot wide exposed aggregate sidewalk with an eight inch brick paver border. In addition, the City will be making necessary drainage repairs along the existing bulkhead. The project is scheduled to be completed in November 2016 and the estimated cost is $75,000. Streetscape Improvements This project will consist of removing the existing concrete sidewalks along the 200 block of Hancock Street and the 400 block of Pollock street and replacing them with a new decorative paver sidewalk. The project will have approximately 8,300 square feet of hexagonal pavers, 2,950 linear feet brick paving sidewalk band, 650 linear feet of patterned concrete sidewalk, and the installation of additional tree islands, driveways, handicap ramps, benches and garbage receptacles. In addition, all of the overhead power will be converted to underground. The project is scheduled to be completed by February 2017 and is estimated to cost approximately $850,000. FY 2017 Misc. Water System Improvements Project This project will involve replacing aging portions of the City water distribution system at various locations throughout the City. At most of these locations, existing 2” galvanized water mains will be replaced with 6” ductile iron and PVC piping. These changes to the water distribution system will improve system pressures and firefighting capabilities. The engineering design and construction administration services for this project will be performed by City of New Bern staff. This project is scheduled to be awarded March 2017.

Everything comes together here.
viii
Third Avenue Extension This project will consist of extending Third Avenue approximately 200’ towards the Stanley White Recreation Center with a new 24’ wide road with curb and gutter, sidewalks, landscaping, and improved storm drainage. The estimated cost of the project is $100,000 with construction beginning in July of 2016. West New Bern Water System Improvements Project This project will involve installing new water mains, constructing a new elevated storage tank and increasing the capacity of the water system distribution pumps to improve the domestic and fire flow supply to the western portions of New Bern. These changes to the water distribution system will improve system pressures and firefighting capabilities. The engineering design and permitting of the project was awarded to Rivers and Associates, Inc. in February 2016 for $369,000. The design and permitting is anticipated to be complete and ready for bid by May 2017 and construction is expected to begin in the fall of 2017. The estimated construction cost is $3 million. Township No. 7 Sewer System Improvements Project – Phase III This project will involve modifications to the sanitary sewer in the Township No. 7 area to include an upgrade to the existing pumps and control components at the equalization basin along with the construction of a new transmission force main across the Trent River. The need for these improvements have been identified since 2006 as the ultimate solution to fixing the over-allocation issues and providing the capacity for New Bern to continue to grow in the areas south of the Trent River. The engineering design and permitting of the project was awarded to Rivers and Associates, Inc. in February 2016 for $349,500. The design and permitting is anticipated to be complete and ready for bid by May 2017 and construction is expected to begin in the fall of 2017. The estimated construction cost is $4 million.
Expansion of Lewis Farm Rd. Substation To provide the necessary level of capacity for the growth of the highway 70 corridor and provide contingency to the existing 25 MVA transformer and circuits. This project will consist of the purchase and installation of a new 25 MVA 115 kV to 23 kV substation transformer and the bus and breakers to expand the station to six circuits from the existing three circuits. This installation is estimated at a cost of $1,750,000. The replacement cost of this unit is expected to be financed as its useful life exceeds 30 years. Trent Road Substation Transformer Bank A Replacement As identified in our five year Capital Projects plan the 50 MVA transformer bank at the Trent Rd. Substation will require replacement. This transformer bank was built in 1960 and through recent testing there have been indications that the units are reaching the end of their useful life. During periods of peak demand the electric system requires the capacity provided by this transformer bank and cannot provide service to its customers if the unit were to fail. A new substation transformer installation to replace this unit is estimated at a cost of $1,000,000. The replacement cost of this unit is expected to be financed as its useful life exceeds 30 years.
Everything comes together here.
ix
Information Technology Wireless Networking Infrastructure Technical Refresh The City currently has wireless networking capability in a number of buildings, but the infrastructure that provides that capability is reaching end of life. Replacing this infrastructure will result in efficiency gains in the management of the system, better overall wireless network performance for users, and will set the stage for a future project to provide direct wireless access to internal network resources (as opposed to the requirement to use Virtual Private Network technology to access those resources currently). With the rapid growth of the use of mobile computing devices such as tablets and smartphones by City employees the ability to directly access internal applications, databases and other resources wirelessly will facilitate much more efficient work processes. Information Technology Network Vulnerability Management Daily administrative operations and the provision of numerous citizen services relies heavily on the capabilities provided by City IT systems. The compromise of those systems would significantly impair or even eliminate the ability to administer the City government and deliver citizen services. Attacks against IT systems are becoming more numerous and more sophisticated than ever before, and the measures implemented by the City to protect our systems against those threats must also evolve. Many industry best practice security measures have already been implemented on the network including securing the perimeter with firewalls, isolating critical internal systems with VLANs, prompt installation of operating system and application security updates, and the training of system users in basic security practices. The next step is to implement the capability to perform comprehensive scans of the network to detect potential malicious activity and to identify insecure system configurations. A capital project for FY 2016-2017 has been approved for this purpose. OTHER INFORMATION Budget preparation process Preparation of the City’s fiscal year budget is a process that involves the citizens of New Bern, the New Bern Board of Aldermen, individual city departments, and the City Manager’s Budget Committee. A budget retreat is held by the City Manager in February. During this meeting, a preview of the economic forecast for the coming fiscal year is presented and the Board’s goals and objectives for the upcoming fiscal year are confirmed. This important meeting provides valuable insight and feedback from board members for the management team to use in developing the proposed budget. The next major phase in the preparation of the budget occurs after the retreat with the distribution of the new budget preparation package instructions to department heads to be used in submitting their proposed budgets. Budget review meetings are scheduled as necessary in March with department heads and the Budget Committee to study their requests. The City Manager is given a briefing on any new programs, new position requests, as well as major increases in budget requests.
Everything comes together here.
x
In April, the City Manager makes any final revisions to the proposed budget along with the proposed utility and tax rate for the new fiscal year. In late April, the City Manager’s proposed budget is presented to the Board, the press, and the public. The proposed budget is made available for public inspection in the office of the City Clerk, the library, and on the City’s website (which can be viewed by visiting http://www.newbern-nc.org/departments/finance/budget/). In May, the Board holds a series of budget workshops in which intense study of the proposed budget occurs. During these meetings the Board reviews the budget and makes any necessary adjustments. North Carolina General Statues require one public hearing be held for public comment on the proposed budget. In a concentrated attempt to give an opportunity to the Citizens of New Bern, a public hearing is scheduled by the Board for public input on the budget. This hearing is usually conducted in late May or early June. The Board formally adopts the budget at a regular Board of Aldermen meeting on or prior to June 30th. Acknowledgements This report is the work of the efficient and dedicated services of the City of New Bern Accounting Staff. Each member of the accounting division has our sincere appreciation for the contributions made in the preparation of this report and in their continued professional excellence in accounting for the fiscal actions of the City. Awards The Government Finance Officers Association of the United States and Canada (GFOA) awarded a Certificate of Achievement for Excellence in Financial Reporting to the City of New Bern for the fiscal year ended June 30, 2015, which was the third year the City prepared a comprehensive annual financial report (CAFR). The Certificate of Achievement is a prestigious national award, recognizing conformance with the highest standards for preparation of state and local government financial reports. In order to be awarded a Certificate of Achievement, a Government Unit must publish an easily readable and efficiently organized CAFR whose contents conform to program standards. Such CAFR must satisfy both generally accepted accounting principles and applicable legal requirements. A Certificate of Achievement is valid for a period of one year only. We believe our current report continues to conform to the Certificate of Achievement program requirements, and the City will be submitting it to the GFOA to determine its eligibility for another certificate. Independent Audit The City is required by the North Carolina General Statues to have an annual independent audit of its financial statements. In addition, Title 2 U.S. Code of Federal Regulations (CFR) Part 200, Uniform Administrative Requirements, Cost Principles, and Audit Requirements for Federal Awards, and the State Single Audit Implementation Act require annual independent audits of the City’s compliance with the applicable law and regulations related to certain statements. Combining and individual fund statements and schedules are included in the

Everything comes together here.
xi
financial section of this report. The independent auditor’s reports on compliance matters are included in the financial section of this report. In closing, we would like to express our appreciation to the Mayor, Board of Aldermen, Department Heads, and all City staff for their leadership, interest, and support in planning and conducting the financial operations of the City in a responsible and progressive manner. Respectfully submitted, ______________________________ _______________________________ Joseph R. Sabatelli, CPA Mark A. Stephens Director of Finance City Manager

xii

xiii
CITY OF NEW BERN, NORTH CAROLINA
LIST OF PRINCIPAL OFFICIALS JUNE 30, 2016
BOARD OF ALDERMEN
Dana E. Outlaw Mayor
Dallas O. Blackiston Mayor Pro Tem
Jeffrey T. Odham Johnnie Ray Kinsey Victor J. Taylor Bernard W. White Patricia C. Schaible
CITY ADMINISTRATION
Mark Stephens City Manager
Kristen Culler
Assistant City Manager
Joseph R. Sabatelli Brenda Blanco Thurman Hardison Director of Finance Deputy City Clerk Director of Parks & Recreation Jonathan Rynne Jeffrey Ruggieri Director of Utilities Director of Development Services Bobby Boyd Sonya Hayes Fire Chief Director of Human Services Matthew Montanye Toussaint Summers Director of Public Works Chief of Police

City of New Bern Organizational Chart FY 2015-16
Citizens of New Bern
Mayor & Board of Aldermen
Director of
Finance
Finance
Accounting
Business Office
Purchasing & Warehouse
City Manager
Information Technology
Parks &
Recreation
Admin
Centers & Community Programs
Parks, Facilities, &
Grounds
Athletics, Aquatics, &
Outdoor Programs
Cemeteries
Police
Office of the Chief
Operations Division
Services Division
Fire & Rescue
Fire Inspection Education
Fire Suppression
Public Works
Admin
Garage
Insurance
Leaf & Limb
Public Buildings
Sanitation
Stormwater
Streets
Development Services
Planning & GIS
Building & Inspections
Community & Economic
Development
Human
ResourcesPublic
Utilities
Electric
Distribution
Electric Communication
Electric Administration
Power Production
Water
Resources
Admin
Wastewater Treatment
Water Treatment
Water Resource
Operations
Assistant City Manager
Public Information
Officer
City Clerk
City Attorney
xiv

FINANCIAL SECTION

INDEPENDENT AUDITOR’S REPORT
Honorable Mayor and Members of the Board of Aldermen City of New Bern, North Carolina
Report on the Financial Statements
We have audited the accompanying financial statements of the governmental activities, the business‐type activities, each
major fund, and the aggregate remaining fund information of the City of New Bern, North Carolina (the “City”), as of and for
the year ended June 30, 2016, and the related notes to the financial statements, which collectively comprise the City’s basic
financial statements as listed in the table of contents. Management’s Responsibility for the Financial Statements
Management is responsible for the preparation and fair presentation of these financial statements in accordance with
accounting principles generally accepted in the United States of America; this includes the design, implementation, and
maintenance of internal control relevant to the preparation and fair presentation of financial statements that are free from
material misstatement, whether due to fraud or error. Auditor’s Responsibility
Our responsibility is to express opinions on these financial statements based on our audit. We conducted our audit in
accordance with auditing standards generally accepted in the United States of America and the standards applicable to
financial audits contained in Government Auditing Standards, issued by the Comptroller General of the United States. Those
standards require that we plan and perform the audit to obtain reasonable assurance about whether the financial statements
are free from material misstatement.
An audit involves performing procedures to obtain audit evidence about the amounts and disclosures in the financial
statements. The procedures selected depend on the auditor’s judgment, including the assessment of the risks of material
misstatement of the financial statements, whether due to fraud or error. In making those risk assessments, the auditor
considers internal control relevant to the entity’s preparation and fair presentation of the financial statements in order to
design audit procedures that are appropriate in the circumstances, but not for the purpose of expressing an opinion on the
effectiveness of the entity’s internal control. Accordingly, we express no such opinion. An audit also includes evaluating the
appropriateness of accounting policies used and the reasonableness of significant accounting estimates made by
management, as well as evaluating the overall presentation of the financial statements.
We believe that the audit evidence we have obtained is sufficient and appropriate to provide a basis for our audit opinions.
200 GALLERIA PARKWAY S.E., SUITE 1700 • ATLANTA, GA 30339-5946 • 770-955-8600 • 800-277-0080 • FAX 770-980-4489 • www.mjcpa.com Members of The American Institute of Certified Public Accountants • RSM International

2
Opinions
In our opinion, the financial statements referred to above present fairly, in all material respects, the respective financial
position of the governmental activities, the business‐type activities, each major fund, and the aggregate remaining fund
information of the City of New Bern, North Carolina as of June 30, 2016, and the respective changes in financial position and,
where applicable, cash flows thereof and the budgetary comparison for the General Fund for the year then ended in
accordance with accounting principles generally accepted in the United States of America. Other Matters
Required Supplementary Information
Accounting principles generally accepted in the United States of America require that the Management’s Discussion and
Analysis, Law Enforcement Officers’ Special Separation Allowance Schedule of Funding Progress, Other Postemployment
Benefits Schedule of Funding Progress, the City of New Bern’s Proportionate Share of Net Pension Liability (Asset), and the
Schedule of the City of New Bern’s Contributions on pages 4‐14, 72, 73, 74, and 75, respectively, be presented to supplement
the basic financial statements. Such information, although not a part of the basic financial statements, is required by the
Governmental Accounting Standards Board who considers it to be an essential part of financial reporting for placing the basic
financial statements in an appropriate operational, economic, or historical context. We have applied certain limited
procedures to the required supplementary information in accordance with auditing standards generally accepted in the
United States of America, which consisted of inquiries of management about the methods of preparing the information and
comparing the information for consistency with management's responses to our inquiries, the basic financial statements, and
other knowledge we obtained during our audit of the basic financial statements. We do not express an opinion or provide any
assurance on the information because the limited procedures do not provide us with sufficient evidence to express an opinion
or provide any assurance.

3
Other Information
Our audit was conducted for the purpose of forming opinions on the financial statements that collectively comprise the City’s
basic financial statements. The introductory section, the combining and individual fund statements and schedules, the
statistical section, and the schedule of expenditures of federal and state awards, as required by Title 2 U.S. Code of Federal
Regulations (CFR) Part 200, Uniform Administrative Requirements, Cost Principles, and Audit Requirements for Federal
Awards (Uniform Guidance) and the State Single Audit Implementation Act, are presented for purposes of additional analysis
and are not a required part of the basic financial statements.
The combining and individual fund statements and schedules and the schedule of expenditures of federal and state awards
(the “supplementary information”) are the responsibility of management and were derived from and relate directly to the
underlying accounting and other records used to prepare the basic financial statements. Such information has been subjected
to the auditing procedures applied in the audit of the basic financial statements and certain additional procedures, including
comparing and reconciling such information directly to the underlying accounting and other records used to prepare the basic
financial statements or to the basic financial statements themselves, and other additional procedures in accordance with
auditing standards generally accepted in the United States of America. In our opinion, the supplementary information is fairly
stated in all material respects in relation to the basic financial statements as a whole.
The introductory and statistical sections have not been subjected to the auditing procedures applied in the audit of the basic
financial statements, and accordingly, we do not express an opinion or provide any assurance on them.
Other Reporting Required by Government Auditing Standards
In accordance with Government Auditing Standards, we have also issued our report dated December 28, 2016 on our
consideration of the City’s internal control over financial reporting and on our tests of its compliance with certain provisions of
laws, regulations, contracts, and grant agreements and other matters. The purpose of that report is to describe the scope of
our testing of internal control over financial reporting and compliance and the results of that testing, and not to provide an
opinion on internal control over financial reporting or on compliance. That report is an integral part of an audit performed in
accordance with Government Auditing Standards in considering the City’s internal control over financial reporting and
compliance.
Atlanta, Georgia December 28, 2016

4
Management’s Discussion and Analysis As management of the City of New Bern, we offer readers of the City of New Bern’s (the “City”) financial statements this narrative overview and analysis of the financial activities of the City for the fiscal year ended June 30, 2016. We encourage readers to read the information presented here in conjunction with additional information that we have furnished in the City’s financial statements, which follow this narrative. Financial Highlights • The overall financial position of the City increased in 2016 as evidenced by an increase in
the total net position of $19.9 million. This was from governmental activities which increased $12.2 million and business‐type activities increased $7.7 million
• The assets and deferred outflows of resources of the City exceeded its liabilities and deferred inflows of resources at the close of the fiscal year by $194.7 million.
• As of the close of the current fiscal year, the City’s governmental funds reported combined ending fund balances of $20.1 million with a net decrease of $584,149 in fund balance. Approximately 59.5% of the total fund balance, or $11.9 million, is unassigned and available for spending at the government’s discretion and approximately 40.5%, or $8.2 million, is non‐spendable, assigned or restricted.
• At the end of the current fiscal year, fund balance available for appropriation (statutory formula) for the general fund was $12.9 million (including restricted cash) or 36.2% of the total general fund expenditures and transfers out for the fiscal year. The informal fund balance goal of the City is 25%.
The City’s total debt decreased by $1.96 million (2.8%) during the current fiscal year, primarily due to $13.2 million in principal payments made against existing debt which was partially offset by $11.2 million in new debt. A key factor in the decrease is additional advance principal repayments of $1.09 million offset by $5.6 million revenue bond to continue the AMI/DSM project in the Electric and Water Funds. Additionally, an existing loan with a balance of $2.20 million was partially repaid in advance with the remainder refinanced for $1.87 million, reducing both the interest rate and repayment terms to safe interest expense.
The City is in compliance with all bond covenants.
The City continues to receive low cost debt due to continued positive fiscal health. Overview of the Financial Statements This discussion and analysis is intended to serve as an introduction to the City’s basic financial statements. The City’s basic financial statements consist of three components: 1) government‐wide financial statements, 2) fund financial statements, and 3) notes to the financial statements (see Figure 1). The basic financial statements present two different views of the City through the use of government‐wide statements and fund financial statements. In addition to the basic financial statements, this report contains other supplemental information that will enhance the readers understanding of the financial condition of the City.

5
Required Components of Annual Financial Report
Figure 1
Summary Detail
Basic Financial Statements
The first two statements (pages 15 and 16) in the basic financial statements are Government‐wide Financial Statements that provide both short and long‐term information about the City’s financial status. The next statements (pages 17 through 28) are Fund Financial Statements. These statements focus on the activities of the individual parts of the City’s government. These statements provide more detail than the government‐wide statements. There are three parts to the fund financial statements: 1) the governmental funds statements; 2) the budgetary comparison statements; and 3) the proprietary fund statements.
Management’s
Discussion and
Analysis
Basic
Financial
Statements
Government-Wide
Financial
Statements
Fund
Financial
Statements
Notes to the
Financial
Statements
6
The next section of the basic financial statements is the notes. The notes to the financial statements explain in detail some of the data contained in those statements. After the notes, supplemental information is provided to show details about the City’s individual funds. Budgetary information required by the North Carolina General Statutes also can be found in this part of the statements. Government‐Wide Financial Statements The government‐wide financial statements are designed to provide the reader with a broad overview of the City’s finances, similar in format to a financial statement of a private‐sector business. The government‐wide statements provide short and long‐term information about the City’s financial status as a whole. The two government‐wide statements report the City’s net position and how they have changed. Net position is the difference between the City’s total assets and deferred outflows of resources and total liabilities and deferred inflows of resources. Measuring net position is one way to gage the City’s financial condition. The government‐wide statements are divided into two categories: Governmental activities – Most of the City’s basic services are included here, such as public safety,
streets, parks and recreation, and general administration. Property, sales and other taxes, operating transfers, and state and federal grant funds finance most of these activities.
Business‐type activities – The City charges fees to customers to cover the costs of services
provided. The City’s water, sewer, electric and stormwater services are included here.
The government‐wide financial statements are pages 15 and 16 of this report. Fund Financial Statements
The fund financial statements (see Figure 1) provide a more detailed look at the City’s most significant activities. A fund is a grouping of related accounts that is used to maintain control over resources that have been segregated for specific activities or objectives. The City of New Bern, like all other governmental entities in North Carolina, uses fund accounting to ensure and reflect compliance (or non‐compliance) with finance‐related legal requirements, such as the General Statutes or the City’s budget ordinance. All of the funds of the City can be divided into two categories: governmental funds and proprietary funds. Governmental Funds ‐ Governmental funds are used to account for those functions reported as governmental activities in the government‐wide financial statements. Most of the City’s basic services are accounted for in governmental funds. These funds focus on how assets can readily be converted into cash flow in and out, and what monies are left at year‐end that will be available for spending in the next year. Governmental funds are reported using an accounting method called modified accrual accounting which provides a short‐term spending focus. As a result, the governmental fund financial statements give the reader a detailed short‐term view that helps him or her determine if there are

7
more or less financial resources available to finance the City’s programs. The relationship between government activities (reported in the Statement of Net Position and the Statement of Activities) and governmental funds is described in a reconciliation that is a part of the fund financial statements. The City of New Bern adopts an annual budget for the General Fund, as required by the General Statutes. The budget is a legally adopted document that incorporates input from the citizens of the City, the management of the City, and the decisions of the Board of Aldermen about which services to provide and how to pay for them. It also authorizes the City to obtain funds from identified sources to finance these current period activities. The budgetary statement provided for the General Fund demonstrates how well the City complied with the budget ordinance and whether or not the City succeeded in providing the services as planned when the budget was adopted. The budgetary comparison statement uses the budgetary basis of accounting and is presented using the same format, language, and classifications as the legal budget document. The statement reflects the following: (a) the original budget as adopted by the Board, (b) the final budget as amended by the Board, (c) the actual resources, charges to appropriations, and ending balances in the General Fund, and (d) the difference or variance between the final budget and the actual resources and charges. A reconciliation showing the differences in the reported activities is shown at the end of the budgetary statement to account for the difference between the budgetary basis of accounting and the modified accrual basis.
Proprietary Funds ‐ The City has two different types of proprietary funds. Enterprise Funds are used to report the same functions presented as business‐type activities in the government‐wide financial statements. The City uses enterprise funds to account for its water and sewer activity and for its electric and stormwater operations. These funds are the same as those functions shown in the business‐type activities in the Statement of Net Position and the Statement of Activities. Internal Service Funds are an accounting device used to accumulate and allocate costs internally among the functions of the City. The City uses an internal service fund to account for one activity ‐ its self‐insured health benefit plan. Because this operation provides benefits to all City employees, the internal service fund has been included within the governmental activities in the government‐wide financial statements.
Notes to the Financial Statements ‐ The notes provide additional information that is essential to a full understanding of the data provided in the government‐wide and fund financial statements. The notes to the financial statements begin on page 29 of this report.
Other Information ‐ In addition to the basic financial statements and accompanying notes, this report includes certain required supplementary information concerning the City of New Bern’s progress in funding its obligation to provide pension benefits to its employees. Required supplementary information can be found beginning on page 72 of this report. Interdependence with Other Entities: The City depends on financial resources flowing from, or associated with, both the Federal Government and the State of North Carolina. Because of this dependency, the City is subject to changes in specific flows of intergovernmental revenues based on modifications to Federal and State laws and Federal and State appropriations.

8
Government‐Wide Financial Analysis
City of New Bern’s Net Position Figure 2
As noted earlier, net position may serve over time as one useful indicator of a government’s financial condition. The assets and deferred outflows exceeded liabilities and deferred inflows by $194.7 million as of June 30, 2016. The City’s net position increased by $19.9 million for the fiscal year ended June 30, 2016. However, the largest portion $140.2 million (72.0%) reflects the City's net investment in capital assets (e.g. land, buildings, machinery, equipment, infrastructure, and distribution systems). The City uses these capital assets to provide services to citizens; consequently, these assets are not available for future spending. Although the City’s net investment in capital assets is reported net of the outstanding related debt, the resources needed to repay that debt must be provided by other sources, since the capital assets cannot be used to liquidate these liabilities. An additional portion of the City’s net position, $5.9 million (3.0%), represents resources that are subject to external restrictions on how they may be used. The remaining balance of $48.7 million (25.0%) is unrestricted.
Several particular aspects of the City’s financial operations positively influenced the total unrestricted net position:
Roadways and streets were contributed by the State of North Carolina in the amount $10.13 million as capital assets in exchange for the State taking over the maintenance of the Cunningham Bridge
Overall debt financings have decreased $1.96 million
Continued low cost of debt due to the City’s positive financial position
Governmental Business-TypeActivities Activities Total
2016 2015 - restated 2016 2015 - restated 2016 2015 - restated
Current and other assets 27,822,970$ 27,491,204$ 55,267,433$ 48,425,808$ 83,090,403$ 75,917,012$ Capital assets 55,934,010 48,556,472 147,883,111 145,423,966 203,817,121 193,980,438 Deferred outflows of resources 1,013,751 1,035,389 473,886 500,505 1,487,637 1,535,894
Total assets and deferred outflows of resources 84,770,731 77,083,065 203,624,430 194,350,279 288,395,161 271,433,344
Long-term liabilities outstanding 18,386,190 20,912,421 63,877,607 59,810,583 82,263,797 80,723,004 Other liabilities 3,184,575 2,218,307 7,265,843 8,304,260 10,450,418 10,522,567 Deferred inflows of resources 602,182 3,632,644 341,512 1,755,169 943,694 5,387,813
Total liabilities and deferred inflows of resources 22,172,947 26,763,372 71,484,962 69,870,012 93,657,909 96,633,384
Net position:Net investment in capital assets 48,007,347 35,607,933 92,187,192 88,323,492 140,194,539 123,931,425 Restricted 5,857,526 6,181,074 - - 5,857,526 6,181,074 Unrestricted 8,732,911 8,530,686 39,952,276 36,156,775 48,685,187 44,687,461
Total net position 62,597,784$ 50,319,693$ 132,139,468$ 124,480,267$ 194,737,252$ 174,799,960$
9
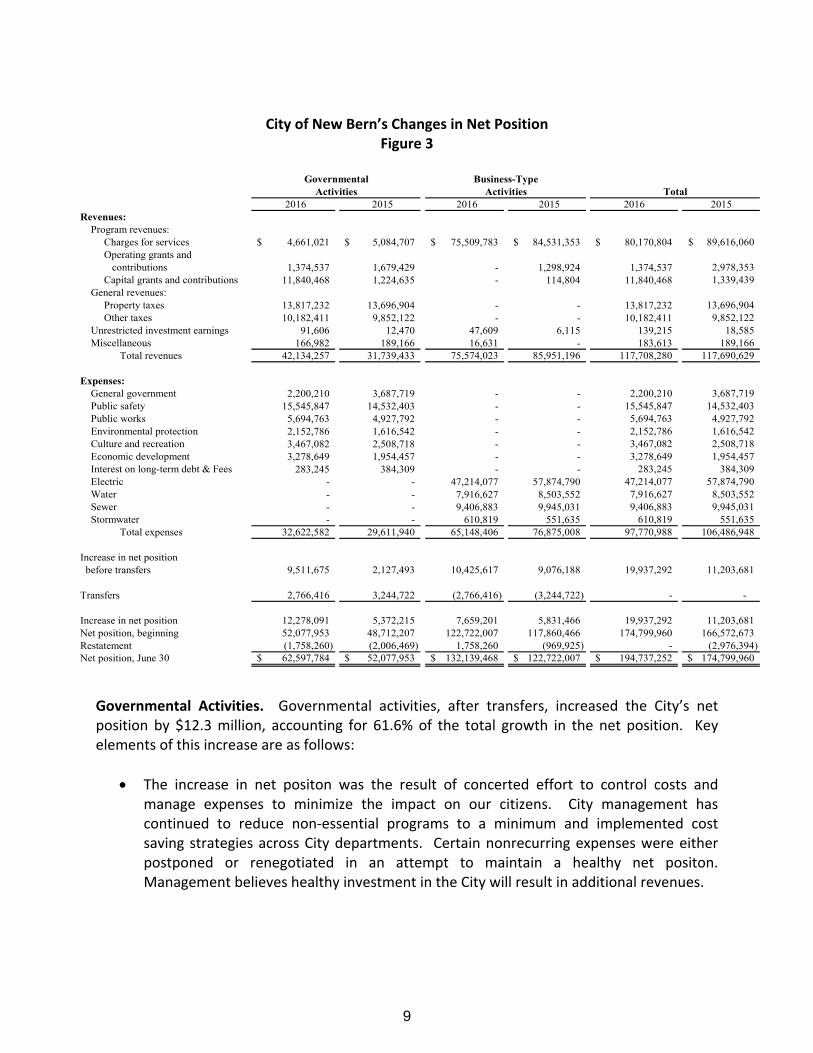
City of New Bern’s Changes in Net Position Figure 3
2016 2015 2016 2015 2016 2015Revenues: Program revenues: Charges for services 4,661,021$ 5,084,707$ 75,509,783$ 84,531,353$ 80,170,804$ 89,616,060$ Operating grants and contributions 1,374,537 1,679,429 - 1,298,924 1,374,537 2,978,353 Capital grants and contributions 11,840,468 1,224,635 - 114,804 11,840,468 1,339,439 General revenues: Property taxes 13,817,232 13,696,904 - - 13,817,232 13,696,904 Other taxes 10,182,411 9,852,122 - - 10,182,411 9,852,122 Unrestricted investment earnings 91,606 12,470 47,609 6,115 139,215 18,585 Miscellaneous 166,982 189,166 16,631 - 183,613 189,166 Total revenues 42,134,257 31,739,433 75,574,023 85,951,196 117,708,280 117,690,629
Expenses: General government 2,200,210 3,687,719 - - 2,200,210 3,687,719 Public safety 15,545,847 14,532,403 - - 15,545,847 14,532,403 Public works 5,694,763 4,927,792 - - 5,694,763 4,927,792 Environmental protection 2,152,786 1,616,542 - - 2,152,786 1,616,542 Culture and recreation 3,467,082 2,508,718 - - 3,467,082 2,508,718 Economic development 3,278,649 1,954,457 - - 3,278,649 1,954,457 Interest on long-term debt & Fees 283,245 384,309 - - 283,245 384,309 Electric - - 47,214,077 57,874,790 47,214,077 57,874,790 Water - - 7,916,627 8,503,552 7,916,627 8,503,552 Sewer - - 9,406,883 9,945,031 9,406,883 9,945,031 Stormwater - - 610,819 551,635 610,819 551,635 Total expenses 32,622,582 29,611,940 65,148,406 76,875,008 97,770,988 106,486,948
Increase in net position before transfers 9,511,675 2,127,493 10,425,617 9,076,188 19,937,292 11,203,681
Transfers 2,766,416 3,244,722 (2,766,416) (3,244,722) - -
Increase in net position 12,278,091 5,372,215 7,659,201 5,831,466 19,937,292 11,203,681 Net position, beginning 52,077,953 48,712,207 122,722,007 117,860,466 174,799,960 166,572,673 Restatement (1,758,260) (2,006,469) 1,758,260 (969,925) - (2,976,394) Net position, June 30 62,597,784$ 52,077,953$ 132,139,468$ 122,722,007$ 194,737,252$ 174,799,960$
TotalGovernmental Business-Type
Activities Activities
Governmental Activities. Governmental activities, after transfers, increased the City’s net position by $12.3 million, accounting for 61.6% of the total growth in the net position. Key elements of this increase are as follows:
The increase in net positon was the result of concerted effort to control costs and manage expenses to minimize the impact on our citizens. City management has continued to reduce non‐essential programs to a minimum and implemented cost saving strategies across City departments. Certain nonrecurring expenses were either postponed or renegotiated in an attempt to maintain a healthy net positon. Management believes healthy investment in the City will result in additional revenues.
10
Continued diligence in the collection of property taxes by maintaining a tax collection percentage of 99.27% versus 98.96% in the prior year. Property taxes are collected by Craven County on behalf of the City.
Sales tax and utilities franchise tax increased $470,000 and $52,000 respectively due to economic growth in the City and State and changes to the State sales tax laws.
The decrease in transfers from other funds is due to reduced electric rates causing a decrease in revenue collections and the resulting decreased rate of return on the investment in the electric system.
Business‐Type Activities. Business‐type activities, after transfers, increased the City’s net position by $7.7 million, accounting for 38.4% of the total growth in the government’s net position. Key elements of this increase are as follows:
The decrease in transfers to other funds is due to the decreased revenue collections and the resulting decreased rate of return on the investment in the electric system
The sale of the North Carolina Eastern Municipal Power Association electric generating assets and subsequent wholesale power purchase agreement resulted in a significant reduction in power supplies costs and contributed to the overall $10.7 million decrease in electric fund expenses. This reduction in costs made rate decreases of 12% effective September 1, 2015 and 1.25% effective April 1, 2016 possible, and contributed to reduced charges for services of $9.67 million.
The City was able to reduce operational costs and reallocated internal service charges that aided in the reduced rates for the Electric, Water and Sewer Funds.
Financial Analysis of the City’s Funds
As noted earlier, the City of New Bern uses fund accounting to ensure and demonstrate compliance with finance‐related legal requirements. Governmental Funds. The focus of the City’s governmental funds is to provide information on near‐term inflows, outflows, and balances of usable resources. Such information is useful in assessing the City’s financing requirements. The General Fund is the chief operating fund of the City of New Bern. At the end of the current fiscal year, the City’s fund balance available for appropriation was $12.9 million while total fund balance reached $20.5 million. The total fund balance in the General Fund increased $188,217. The City of New Bern has informally determined that the City should maintain an available fund balance of 25% of General Fund expenditures in case of unforeseen needs or opportunities and to meet the cash flow needs of the City. The City currently has an available fund balance of 36.2% of General Fund expenditures, while total fund balance represents 57.1% of the same amount.
11
At June 30, 2016, the governmental funds of the City of New Bern reported a combined fund balance of $20.1 million, which is a decrease of $584,150. General Fund Budgetary Highlights: During the fiscal year, the City revised the budget on several occasions. Generally, budget amendments fall into one of three categories: 1) amendments made to adjust the estimates that are used to prepare the original budget ordinance once exact information is available; 2) amendments made to recognize new funding amounts from external sources, such as Federal and State grants; and 3) increases in appropriations that become necessary to maintain services.
Overall revenues exceeded budget by $1.4 million. The increase is due in part to current year ad valorem taxes, sales taxes, and utilities franchise taxes exceeding budgeted revenues by $258,000, $310,000 and $173,000 respectively.
Total expenditures were $2.3 million under budget primarily due to $665,000 in reduced employee‐related costs including job vacancies; $786,570 due to open encumbrances; and the balance due to cost savings measures and reduced spending.
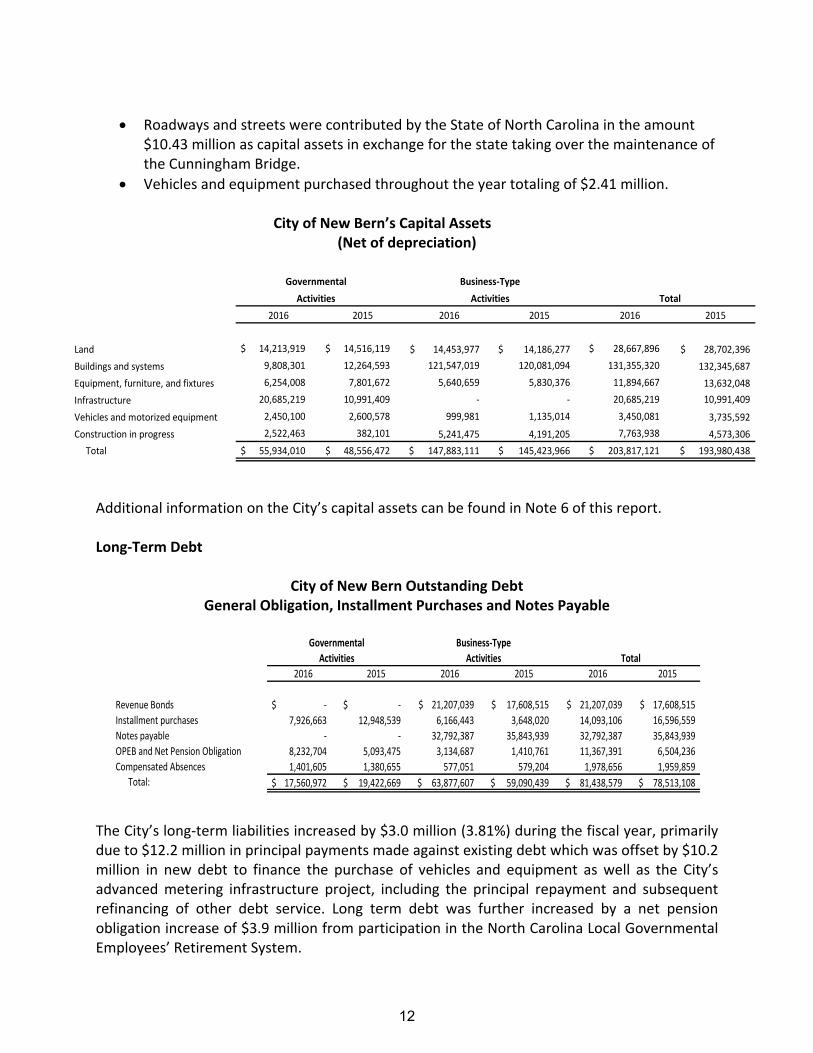
Proprietary Funds: The City’s proprietary funds provide the same type of information found in the government‐wide statements but in more detail. Unrestricted net position at the end of the year amounted to $20.0 million in the Electric Fund, $10.5 million in the Water Fund, $7.7 million in the Sewer Fund, and $0.3 million in the Stormwater Fund. All four proprietary funds, Electric, Water, Sewer and Stormwater experienced growth in net position of $2.9 million, $2.3 million, $2.6 million, and $.08 million respectively. The primary reason for the increases in net position for these funds are requirements for revenues to exceed operational expenses sufficient enough to meet debt service requirements. Capital Asset and Debt Administration Capital Assets At June 30, 2016, the City had $203.8 million (net of accumulated depreciation) in capital assets consisting primarily of land, roads, buildings and systems, machinery and equipment, park facilities, vehicles, infrastructure and construction in process. This amount represents a net decrease of $9.8 million or 5.1% over last year. Major capital asset transactions during the year include the following:
Construction in progress for the purchase of Advanced Metering Infrastructure/Demand Side Management System totaling $2.02 million.
Completion of the Kale Road project totaling $1.63 million.
12
Roadways and streets were contributed by the State of North Carolina in the amount $10.43 million as capital assets in exchange for the state taking over the maintenance of the Cunningham Bridge.
Vehicles and equipment purchased throughout the year totaling of $2.41 million. City of New Bern’s Capital Assets
(Net of depreciation)
2016 2015 2016 2015 2016 2015
Land 14,213,919$ 14,516,119$ 14,453,977$ 14,186,277$ 28,667,896$ 28,702,396$
Buildings and systems 9,808,301 12,264,593 121,547,019 120,081,094 131,355,320 132,345,687
Equipment, furniture, and fixtures 6,254,008 7,801,672 5,640,659 5,830,376 11,894,667 13,632,048
Infrastructure 20,685,219 10,991,409 ‐ ‐ 20,685,219 10,991,409
Vehicles and motorized equipment 2,450,100 2,600,578 999,981 1,135,014 3,450,081 3,735,592
Construction in progress 2,522,463 382,101 5,241,475 4,191,205 7,763,938 4,573,306
Total 55,934,010$ 48,556,472$ 147,883,111$ 145,423,966$ 203,817,121$ 193,980,438$
Total
Governmental Business‐Type
Activities Activities
Additional information on the City’s capital assets can be found in Note 6 of this report. Long‐Term Debt
City of New Bern Outstanding Debt General Obligation, Installment Purchases and Notes Payable
2016 2015 2016 2015 2016 2015
Revenue Bonds ‐$ ‐$ 21,207,039$ 17,608,515$ 21,207,039$ 17,608,515$
Installment purchases 7,926,663 12,948,539 6,166,443 3,648,020 14,093,106 16,596,559
Notes payable ‐ ‐ 32,792,387 35,843,939 32,792,387 35,843,939
8,232,704 5,093,475 3,134,687 1,410,761 11,367,391 6,504,236
Compensated Absences 1,401,605 1,380,655 577,051 579,204 1,978,656 1,959,859
Total: 17,560,972$ 19,422,669$ 63,877,607$ 59,090,439$ 81,438,579$ 78,513,108$
Total
Governmental Business‐Type
Activities Activities
OPEB and Net Pension Obligation
The City’s long‐term liabilities increased by $3.0 million (3.81%) during the fiscal year, primarily due to $12.2 million in principal payments made against existing debt which was offset by $10.2 million in new debt to finance the purchase of vehicles and equipment as well as the City’s advanced metering infrastructure project, including the principal repayment and subsequent refinancing of other debt service. Long term debt was further increased by a net pension obligation increase of $3.9 million from participation in the North Carolina Local Governmental Employees’ Retirement System.
13
North Carolina General Statutes limit the amount of general obligation debt that a unit of government can issue to 8% of the total assessed value of taxable property located within that government’s boundaries. The legal debt margin for the City is $230.80 million. Additional information regarding the City’s long‐term debt can be found in Note 7 of this report. Economic Factors and Next Year’s Budgets and Rates The following key economic indicators impact the City: Building permits issued during 2016 was 317, which is lower compared to 511 permits
issued in the prior year. Total value of all permits was $65.76 million, which was an increase from a $32.6 million level in the prior year.
Retail sales during 2016 are expected to increase from $953.2 million in 2015. The June 2016 unemployment rate for Craven County was 4.9% compared to 4.9% for the
State and 4.9% for the nation. This compares to June 2015 rates of 6.3% for Craven County, 5.8% for the State and 5.3% for the nation.
Budget Highlights for the Fiscal Year Ending June 30, 2017 Governmental Activities: The City has chosen to increase property tax rates in the 2017 budget to $.46 per $100 of assessed value to offset a decrease in property values. In addition, the City has chosen to appropriate $2.00 million of fund balance for street paving. Management believes that continued restrictions on spending will maintain the City’s financial position and all vacant positions are evaluated thoroughly for need of continued funding. The City has contracted for a study with the UNC School of Government’s Development Finance Initiative to prepare a market analysis for development potential of four parcels located in the City’s central business district. This study will assist with redevelopment and positive future economic growth within the district.
14
The North Carolina General Assembly has approved an expansion of the statewide sales tax to select services and additional items not previously taxed as well as modifications to the distribution of sales tax with a lesser emphasis on point of sale and more emphasis per capita. These modifications took effect March 2016 and are expected to have a positive impact on the City’s budget. Budgeted expenditures in the General Fund are $37.25 million. Business‐Type Activities: The fiscal year 2017 budget maintains the rate decreases effective July 1, 2015 in the electric (3%), water (6%), and sewer (4.5%), and no rate change for stormwater services. The budget also reflects additional electric rate reductions of 12% and 1.25% effective September 1, 2015 and April 1, 2016 respectively made possible by the sale of the electric generating assets of the North Carolina Eastern Municipal Power Association, of which the City is a member and purchases its wholesale power. Adopted budgets for the Electric, Water, Sewer and Stormwater Funds are $54.09 million, $9.98 million, $11.42 million and $670,000 respectively. Requests for Information This report is designed to provide an overview of the City’s finances for those with an interest in this area. Questions concerning any of the information found in this report or requests for additional information should be directed to the Director of Finance, City of New Bern, P.O. Box 1129, New Bern, NC 28563‐1129. One can also call (252) 639‐2711, visit our website www.newbern‐nc.org or send an email to finadm@newbern‐nc.org for more information.

Activities Activities Total
ASSETS
Cash and cash equivalents $ 23,270,275 $ 35,593,064 $ 58,863,339
Receivables, net of allowance for uncollectibles 3,134,089 8,806,547 11,940,636
Taxes receivable, net of allowance for uncollectibles 291,326 ‐ 291,326
Due from other governments 1,856,840 ‐ 1,856,840
Internal balances (1,602,416) 1,602,416 ‐
Inventories 106,353 1,921,039 2,027,392
Prepaid items 8,000 128,097 136,097
Restricted cash and cash equivalents 758,503 7,216,270 7,974,773
Capital assets:
Non‐depreciable 16,736,382 19,695,452 36,431,834
Depreciable, net of accumulated depreciation 39,197,628 128,187,659 167,385,287
Total assets 83,756,980 203,150,544 286,907,524
DEFERRED OUTFLOWS OF RESOURCES
Pension related items 1,013,751 473,886 1,487,637
Total deferred outflows of resources 1,013,751 473,886 1,487,637
LIABILITIES
Accounts payable 3,184,575 3,974,742 7,159,317
Accrued liabilities ‐ 544,781 544,781
Customer deposits ‐ 2,746,320 2,746,320
Interest payable 38,412 ‐ 38,412
Claims and judgments payable 786,806 ‐ 786,806
Installment notes payable, due within one year 1,499,854 4,136,539 5,636,393
Installment notes payable, due in more than one year 6,426,809 34,822,291 41,249,100
Bonds payable, due within one year ‐ 2,544,932 2,544,932
Bonds payable, due in more than one year ‐ 18,662,107 18,662,107
Compensated absences, due within one year 1,121,284 461,677 1,582,961
Compensated absences, due in more than one year 280,321 115,374 395,695
Net pension obligation, due in more than one year 2,219,770 ‐ 2,219,770
Net pension liability, due in more than one year 1,051,390 596,267 1,647,657
Net OPEB obligation, due in more than one year 4,961,544 2,538,420 7,499,964
Total liabilities 21,570,765 71,143,450 92,714,215
DEFERRED INFLOWS OF RESOURCES
Pension related items 602,182 341,512 943,694
Total deferred inflows of resources 602,182 341,512 943,694
NET POSITION
Net investment in capital assets 48,007,347 92,187,192 140,194,539
Restricted for:
Stabilization by State Statute 5,404,706 ‐ 5,404,706
Public safety 246,126 ‐ 246,126
Economic development 206,694 ‐ 206,694
Unrestricted 8,732,911 39,952,276 48,685,187
Total net position $ 62,597,784 $ 132,139,468 $ 194,737,252
The accompanying notes are an integral part of these financial statements.
CITY OF NEW BERN, NORTH CAROLINA
STATEMENT OF NET POSITION
JUNE 30, 2016
Governmental Business‐type
Primary Government
15

STATEMENT OF ACTIVITIES
FOR THE YEAR ENDED JUNE 30, 2016
Program Revenues
Operating Capital
Charges for Grants and Grants and Governmental Business‐type
Functions/Programs Expenses Services Contributions Contributions Activities Activities Total
Governmental activities:
General government $ 2,200,210 $ 642,598 $ 50,000 $ ‐ $ (1,507,612) $ ‐ $ (1,507,612)
Public safety 15,545,847 225,570 410,522 ‐ (14,909,755) ‐ (14,909,755)
Public works 5,694,763 141,675 ‐ 11,005,003 5,451,915 ‐ 5,451,915
Environmental protection 2,152,786 2,837,409 ‐ ‐ 684,623 ‐ 684,623
Cultural and recreational 3,467,082 139,581 2,256 ‐ (3,325,245) ‐ (3,325,245)
Economic and physical development 3,278,649 674,188 911,759 835,465 (857,237) ‐ (857,237)
Interest on long‐term debt 283,245 ‐ ‐ ‐ (283,245) ‐ (283,245)
Total governmental activities 32,622,582 4,661,021 1,374,537 11,840,468 (14,746,556) ‐ (14,746,556)
Business‐type activities:
Electric 47,214,077 52,734,945 ‐ 5,520,868 5,520,868
Water 7,916,627 10,147,159 ‐ ‐ ‐ 2,230,532 2,230,532
Sewer 9,406,883 11,946,470 ‐ ‐ ‐ 2,539,587 2,539,587
Stormwater 610,819 681,209 ‐ ‐ ‐ 70,390 70,390
Total business‐type activities 65,148,406 75,509,783 ‐ ‐ ‐ 10,361,377 10,361,377
Total primary government $ 97,770,988 $ 80,170,804 $ 1,374,537 $ 11,840,468 (14,746,556) 10,361,377 (4,385,179)
General revenues:
Ad valorem taxes 13,817,232 ‐ 13,817,232
Sales and use taxes 6,352,004 ‐ 6,352,004
Utilities franchise tax 2,064,744 ‐ 2,064,744
Payments in lieu of taxes 931,965 ‐ 931,965
Other taxes 833,698 ‐ 833,698
Investment earnings 91,606 47,609 139,215
Miscellaneous 154,638 ‐ 154,638
Gain on sale of capital assets 12,344 16,631 28,975
Transfers 2,766,416 (2,766,416) ‐
Total general revenues and transfers 27,024,647 (2,702,176) 24,322,471
Change in net position 12,278,091 7,659,201 19,937,292
Net position, beginning of year, restated 50,319,693 124,480,267 174,799,960
Net position, end of year $ 62,597,784 $ 132,139,468 $ 194,737,252
The accompanying notes are an integral part of these financial statements.
Net (Expenses) Revenues and
Changes in Net Position
CITY OF NEW BERN, NORTH CAROLINA
16
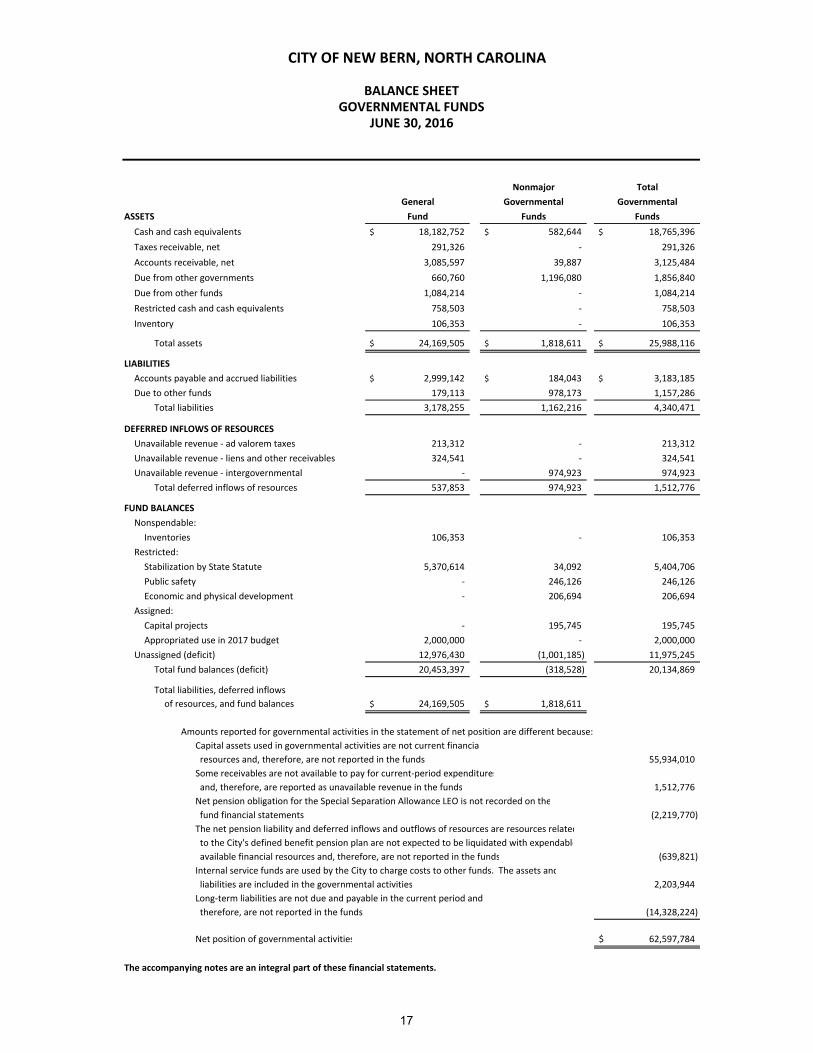
BALANCE SHEETGOVERNMENTAL FUNDS
JUNE 30, 2016
Total
Governmental Governmental
ASSETS Funds Funds
Cash and cash equivalents $ 18,182,752 $ 582,644 $ 18,765,396
Taxes receivable, net 291,326 ‐ 291,326
Accounts receivable, net 3,085,597 39,887 3,125,484
Due from other governments 660,760 1,196,080 1,856,840
Due from other funds 1,084,214 ‐ 1,084,214
Restricted cash and cash equivalents 758,503 ‐ 758,503
Inventory 106,353 ‐ 106,353
Total assets $ 24,169,505 $ 1,818,611 $ 25,988,116
LIABILITIES
Accounts payable and accrued liabilities $ 2,999,142 $ 184,043 $ 3,183,185
Due to other funds 179,113 978,173 1,157,286
Total liabilities 3,178,255 1,162,216 4,340,471
DEFERRED INFLOWS OF RESOURCES
Unavailable revenue ‐ ad valorem taxes 213,312 ‐ 213,312
Unavailable revenue ‐ liens and other receivables 324,541 ‐ 324,541
Unavailable revenue ‐ intergovernmental ‐ 974,923 974,923
Total deferred inflows of resources 537,853 974,923 1,512,776
FUND BALANCES
Nonspendable:
Inventories 106,353 ‐ 106,353
Restricted:
Stabilization by State Statute 5,370,614 34,092 5,404,706
Public safety ‐ 246,126 246,126
Economic and physical development ‐ 206,694 206,694
Assigned:
Capital projects ‐ 195,745 195,745
Appropriated use in 2017 budget 2,000,000 ‐ 2,000,000
Unassigned (deficit) 12,976,430 (1,001,185) 11,975,245
Total fund balances (deficit) 20,453,397 (318,528) 20,134,869
Total liabilities, deferred inflows
of resources, and fund balances $ 24,169,505 $ 1,818,611
Amounts reported for governmental activities in the statement of net position are different because:
Capital assets used in governmental activities are not current financia
resources and, therefore, are not reported in the funds 55,934,010
Some receivables are not available to pay for current‐period expenditures
and, therefore, are reported as unavailable revenue in the funds 1,512,776
Net pension obligation for the Special Separation Allowance LEO is not recorded on the
fund financial statements (2,219,770)
The net pension liability and deferred inflows and outflows of resources are resources related
to the City's defined benefit pension plan are not expected to be liquidated with expendable
available financial resources and, therefore, are not reported in the funds (639,821)
Internal service funds are used by the City to charge costs to other funds. The assets and
liabilities are included in the governmental activities 2,203,944
Long‐term liabilities are not due and payable in the current period and
therefore, are not reported in the funds (14,328,224)
Net position of governmental activities $ 62,597,784
The accompanying notes are an integral part of these financial statements.
Nonmajor
General
Fund
CITY OF NEW BERN, NORTH CAROLINA
17
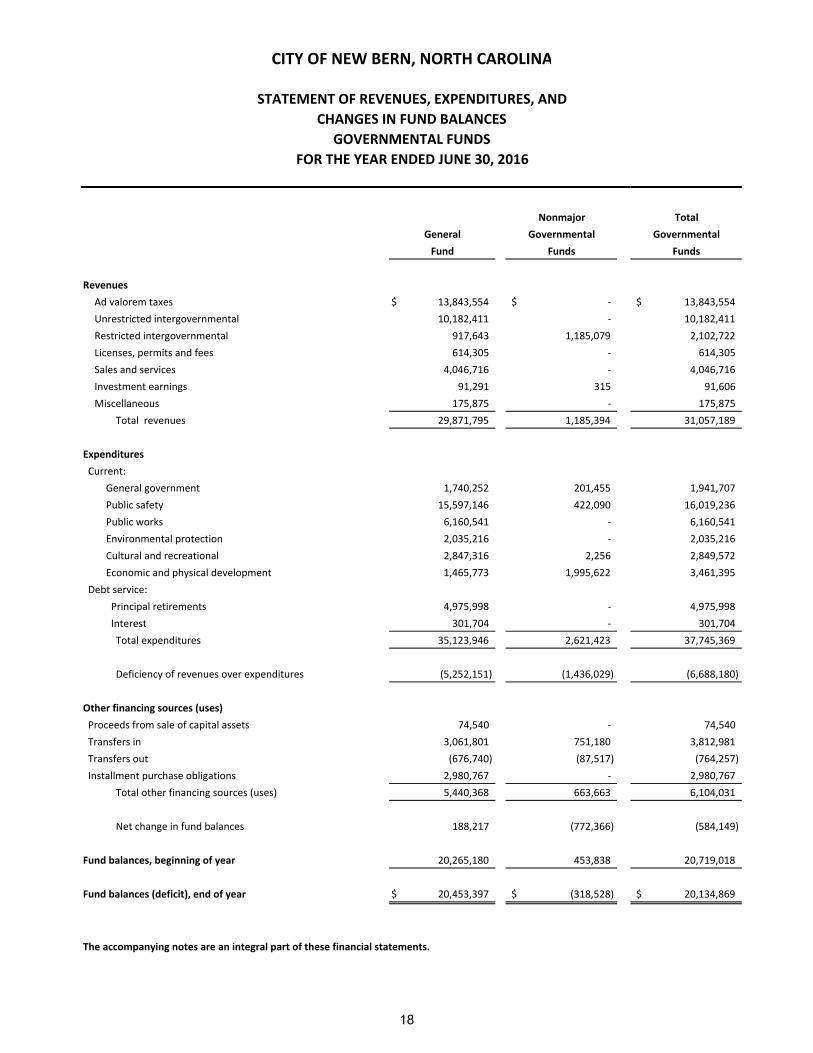
Total
Governmental Governmental
Fund Funds Funds
Revenues
Ad valorem taxes $ 13,843,554 $ ‐ $ 13,843,554
Unrestricted intergovernmental 10,182,411 ‐ 10,182,411
Restricted intergovernmental 917,643 1,185,079 2,102,722
Licenses, permits and fees 614,305 ‐ 614,305
Sales and services 4,046,716 ‐ 4,046,716
Investment earnings 91,291 315 91,606
Miscellaneous 175,875 ‐ 175,875
Total revenues 29,871,795 1,185,394 31,057,189
Expenditures
Current:
General government 1,740,252 201,455 1,941,707
Public safety 15,597,146 422,090 16,019,236
Public works 6,160,541 ‐ 6,160,541
Environmental protection 2,035,216 ‐ 2,035,216
Cultural and recreational 2,847,316 2,256 2,849,572
Economic and physical development 1,465,773 1,995,622 3,461,395
Debt service:
Principal retirements 4,975,998 ‐ 4,975,998
Interest 301,704 ‐ 301,704
Total expenditures 35,123,946 2,621,423 37,745,369
Deficiency of revenues over expenditures (5,252,151) (1,436,029) (6,688,180)
Other financing sources (uses)
Proceeds from sale of capital assets 74,540 ‐ 74,540
Transfers in 3,061,801 751,180 3,812,981
Transfers out (676,740) (87,517) (764,257)
Installment purchase obligations 2,980,767 ‐ 2,980,767
Total other financing sources (uses) 5,440,368 663,663 6,104,031
Net change in fund balances 188,217 (772,366) (584,149)
Fund balances, beginning of year 20,265,180 453,838 20,719,018
Fund balances (deficit), end of year $ 20,453,397 $ (318,528) $ 20,134,869
The accompanying notes are an integral part of these financial statements.
CITY OF NEW BERN, NORTH CAROLINA
GOVERNMENTAL FUNDS
General
FOR THE YEAR ENDED JUNE 30, 2016
STATEMENT OF REVENUES, EXPENDITURES, AND
CHANGES IN FUND BALANCES
Nonmajor
18

RECONCILIATION OF THE STATEMENT OF REVENUES, EXPENDITURES,
TO THE STATEMENT OF ACTIVITIES
Amounts reported for governmental activities in the statement of activities are different because:
Net change in fund balances ‐ total governmental funds $ (584,149)
Governmental funds report capital outlays as expenditures. However, in the statement of activities, the cost of those
assets is allocated over their estimated useful lives and reported as depreciation expense. This is the amount by
which capital outlays exceeded depreciation in the current period. 611,327
The net effect of various miscellaneous transactions involving capital assets (i.e., donations, sales and transfers of
assets to enterprise funds) is to increase net position. 6,766,211
Revenues in the statement of activities that do not provide current financial resources are not reported as revenues
in the funds. 927,364
The issuance of long‐term debt provides current financial resources to governmental funds, while the repayment of
the principal of long‐term debt consumes the current financial resources of governmental funds. Neither
transaction, however, has any effect on net position. This amount is the net effect of these differences in the
treatment of long‐term debt and related items. 5,021,876
Internal service funds are used by management to charge the costs of the City's insurance plan to individual funds.
The net expense of the internal service fund is reported within governmental activities. (329,890)
Some expenses reported in the statement of activities do not require the use of current financial resources and,
therefore, are not reported as expenditures in governmental funds. (134,648)
Change in net position ‐ governmental activities $ 12,278,091
The accompanying notes are an integral part of these financial statements.
AND CHANGES IN FUND BALANCES OF GOVERNMENTAL FUNDS
FOR THE YEAR ENDED JUNE 30, 2016
CITY OF NEW BERN, NORTH CAROLINA
19
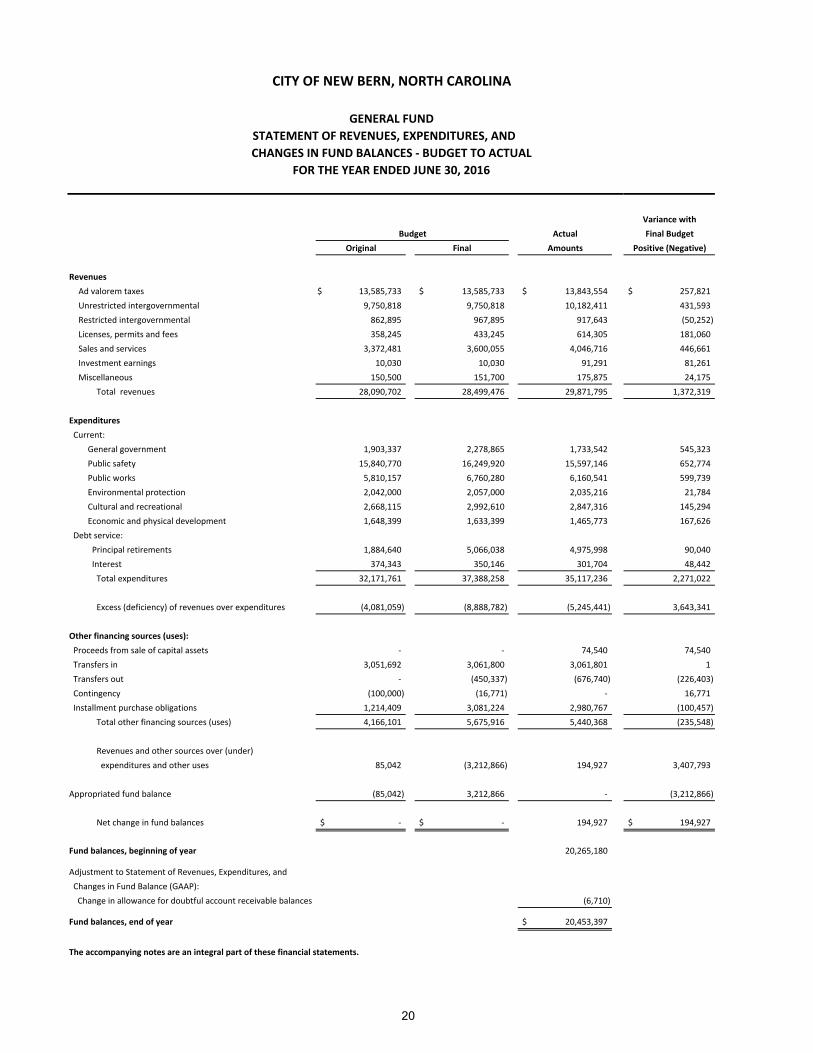
Variance with
Actual Final Budget
Original Final Amounts Positive (Negative)
Revenues
Ad valorem taxes $ 13,585,733 $ 13,585,733 $ 13,843,554 $ 257,821
Unrestricted intergovernmental 9,750,818 9,750,818 10,182,411 431,593
Restricted intergovernmental 862,895 967,895 917,643 (50,252)
Licenses, permits and fees 358,245 433,245 614,305 181,060
Sales and services 3,372,481 3,600,055 4,046,716 446,661
Investment earnings 10,030 10,030 91,291 81,261
Miscellaneous 150,500 151,700 175,875 24,175
Total revenues 28,090,702 28,499,476 29,871,795 1,372,319
Expenditures
Current:
General government 1,903,337 2,278,865 1,733,542 545,323
Public safety 15,840,770 16,249,920 15,597,146 652,774
Public works 5,810,157 6,760,280 6,160,541 599,739
Environmental protection 2,042,000 2,057,000 2,035,216 21,784
Cultural and recreational 2,668,115 2,992,610 2,847,316 145,294
Economic and physical development 1,648,399 1,633,399 1,465,773 167,626
Debt service:
Principal retirements 1,884,640 5,066,038 4,975,998 90,040
Interest 374,343 350,146 301,704 48,442
Total expenditures 32,171,761 37,388,258 35,117,236 2,271,022
Excess (deficiency) of revenues over expenditures (4,081,059) (8,888,782) (5,245,441) 3,643,341
Other financing sources (uses):
Proceeds from sale of capital assets ‐ ‐ 74,540 74,540
Transfers in 3,051,692 3,061,800 3,061,801 1
Transfers out ‐ (450,337) (676,740) (226,403)
Contingency (100,000) (16,771) ‐ 16,771
Installment purchase obligations 1,214,409 3,081,224 2,980,767 (100,457)
Total other financing sources (uses) 4,166,101 5,675,916 5,440,368 (235,548)
Revenues and other sources over (under)
expenditures and other uses 85,042 (3,212,866) 194,927 3,407,793
Appropriated fund balance (85,042) 3,212,866 ‐ (3,212,866)
Net change in fund balances $ ‐ $ ‐ 194,927 $ 194,927
Fund balances, beginning of year 20,265,180
Adjustment to Statement of Revenues, Expenditures, and
Changes in Fund Balance (GAAP):
Change in allowance for doubtful account receivable balances (6,710)
Fund balances, end of year $ 20,453,397
The accompanying notes are an integral part of these financial statements.
GENERAL FUND
Budget
CITY OF NEW BERN, NORTH CAROLINA
STATEMENT OF REVENUES, EXPENDITURES, AND
CHANGES IN FUND BALANCES ‐ BUDGET TO ACTUAL
FOR THE YEAR ENDED JUNE 30, 2016
20

Electric
ASSETS Fund Fund
CURRENT ASSETS
Cash and cash equivalents $ 17,492,839 $ 10,483,159 $ 7,337,921
Accounts receivable, net of allowances 6,418,928 1,112,332 1,212,849
Due from other funds 179,113 ‐ ‐
Prepaid items ‐ ‐ 128,097
Inventories 1,917,348 210 3,481
Restricted cash and cash equivalents 5,206,745 1,876,166 133,359
Total current assets 31,214,973 13,471,867 8,815,707
CAPITAL ASSETS
Nondepreciable 4,084,967 3,105,256 12,505,229
Depreciable, net of accumulated depreciation 28,604,899 45,197,457 52,397,273
Total noncurrent assets 32,689,866 48,302,713 64,902,502
Total assets 63,904,839 61,774,580 73,718,209
DEFERRED OUTFLOWS OF RESOURCES
Pension related items 241,599 121,068 96,735
Total deferred outflows of resources 241,599 121,068 96,735
LIABILITIES
CURRENT LIABILITIES
Accounts payable 3,754,971 90,538 129,233
Accrued liabilities 298,198 99,502 139,651
Customer deposits 2,746,320 ‐ ‐
Claims payable ‐ ‐ ‐
Due to other funds 106,041 ‐ ‐
Installment notes payable, current 536,218 59,277 375,373
Notes payable, current ‐ 1,680,331 1,405,554
Bonds payable, current 1,078,697 656,218 810,017
Compensated absences payable, current 262,318 110,029 80,417
8,782,763 2,695,895 2,940,245
NONCURRENT LIABILITIES
Installment notes payable 3,092,686 308,754 1,300,913
Notes payable ‐ 21,844,306 7,862,196
Bonds payable 8,496,739 5,024,589 5,140,779
Compensated absences payable 65,580 27,507 20,059
Net pension liability 307,354 151,456 124,409
Net OPEB obligation 1,323,867 641,637 518,194
Total noncurrent liabilities 13,286,226 27,998,249 14,966,550
Total liabilities 22,068,989 30,694,144 17,906,795
DEFERRED INFLOWS OF RESOURCES
Pension related items 176,036 86,747 71,256
Total deferred inflows of resources 176,036 86,747 71,256
NET POSITION
Net investment in capital assets 21,945,951 20,605,404 48,141,029
Unrestricted 19,955,462 10,509,353 7,695,864
Total net position $ 41,901,413 $ 31,114,757 $ 55,836,893
Adjustment to reflect the consolidation of internal service fund activities to enterprise funds
Net position of business‐type activites
The accompanying notes are an integral part of these financial statements.
Water Sewer
Fund
CITY OF NEW BERN, NORTH CAROLINA
STATEMENT OF NET POSITION
PROPRIETARY FUNDS
JUNE 30, 2016
21
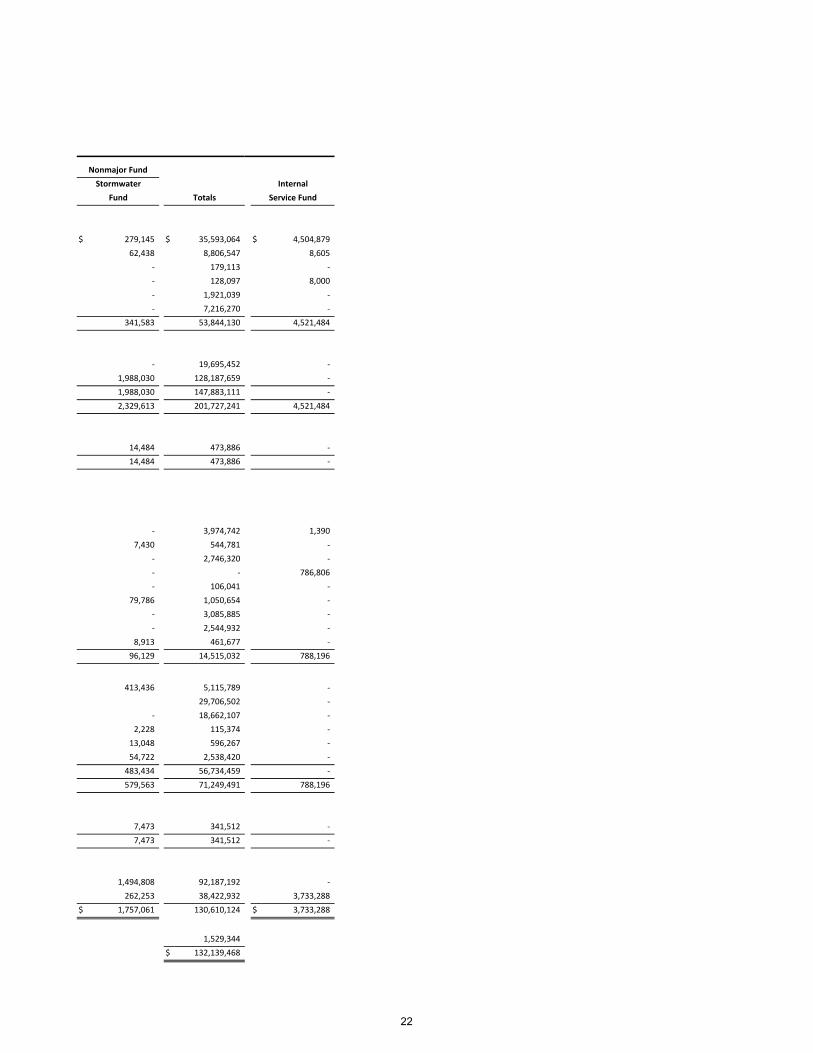
Totals
$ 279,145 $ 35,593,064 $ 4,504,879
62,438 8,806,547 8,605
‐ 179,113 ‐
‐ 128,097 8,000
‐ 1,921,039 ‐
‐ 7,216,270 ‐
341,583 53,844,130 4,521,484
‐ 19,695,452 ‐
1,988,030 128,187,659 ‐
1,988,030 147,883,111 ‐
2,329,613 201,727,241 4,521,484
14,484 473,886 ‐
14,484 473,886 ‐
‐ 3,974,742 1,390
7,430 544,781 ‐
‐ 2,746,320 ‐
‐ ‐ 786,806
‐ 106,041 ‐
79,786 1,050,654 ‐
‐ 3,085,885 ‐
‐ 2,544,932 ‐
8,913 461,677 ‐
96,129 14,515,032 788,196
413,436 5,115,789 ‐
29,706,502 ‐
‐ 18,662,107 ‐
2,228 115,374 ‐
13,048 596,267 ‐
54,722 2,538,420 ‐
483,434 56,734,459 ‐
579,563 71,249,491 788,196
7,473 341,512 ‐
7,473 341,512 ‐
1,494,808 92,187,192 ‐
262,253 38,422,932 3,733,288
$ 1,757,061 130,610,124 $ 3,733,288
1,529,344
$ 132,139,468
Internal
Service Fund
Stormwater
Fund
Nonmajor Fund
22

Electric
Fund Fund
OPERATING REVENUES
Charges for services $ 52,698,231 $ 9,864,062 $ 11,313,479
Other operating revenues 36,714 283,097 632,991
Employee and retiree contributions ‐ ‐ ‐
Employer and other contributions ‐ ‐ ‐
Total operating revenues 52,734,945 10,147,159 11,946,470
OPERATING EXPENSES
Administrative and general 4,258,288 2,027,659 1,884,296
Operations and maintenance 3,303,784 3,562,451 5,073,408
Production 36,674,861 ‐ ‐
Depreciation and amortization 2,069,769 1,595,690 1,968,930
Claims and payments to third party administrators ‐ ‐ ‐
Total operating expenses 46,306,702 7,185,800 8,926,634
Operating income (loss) 6,428,243 2,961,359 3,019,836
NON‐OPERATING REVENUES (EXPENSES)
Investment earnings 25,525 12,693 9,070
Gain (loss) on disposal of capital assets (596,429) 9,186 4,422
Interest expense (204,096) (665,513) (429,919)
Total non‐operating revenue (expenses) (775,000) (643,634) (416,427)
Income before capital contributions and transfers 5,653,243 2,317,725 2,603,409
Capital contributions 282,308 ‐ ‐
Transfers in 1,908 1,060 ‐
Transfers out (3,051,692) ‐ ‐
Change in net position 2,885,767 2,318,785 2,603,409
Net position, beginning of year 39,015,646 28,795,972 53,233,484
Net position, end of year $ 41,901,413 $ 31,114,757 $ 55,836,893
Adjustment to reflect the consolidation of internal service fund activities to enterprise funds
Change in net position of business‐type activities
The accompanying notes are an integral part of these financial statements.
Water Sewer
PROPRIETARY FUNDS
Fund
FOR THE YEAR ENDED JUNE 30, 2016
CITY OF NEW BERN, NORTH CAROLINA
STATEMENT OF REVENUES, EXPENSES, AND
CHANGES IN NET POSITION
23
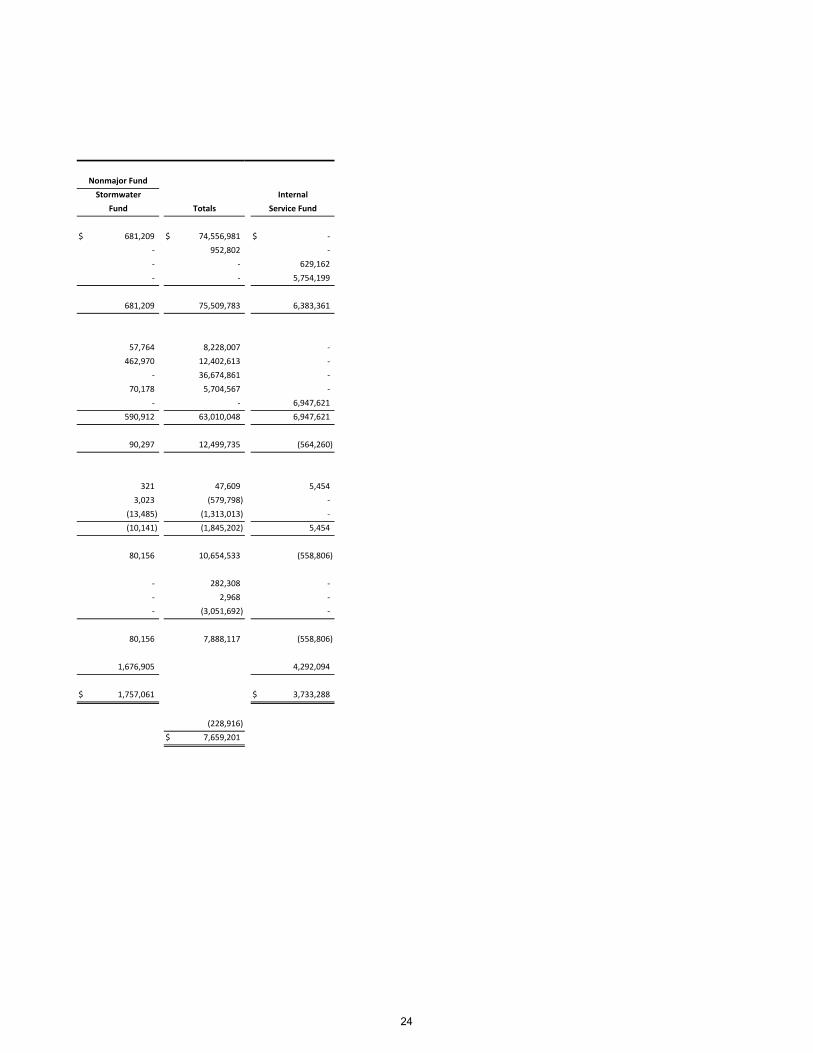
Totals
$ 681,209 $ 74,556,981 $ ‐
‐ 952,802 ‐
‐ ‐ 629,162
‐ ‐ 5,754,199
681,209 75,509,783 6,383,361
57,764 8,228,007 ‐
462,970 12,402,613 ‐
‐ 36,674,861 ‐
70,178 5,704,567 ‐
‐ ‐ 6,947,621
590,912 63,010,048 6,947,621
90,297 12,499,735 (564,260)
321 47,609 5,454
3,023 (579,798) ‐
(13,485) (1,313,013) ‐
(10,141) (1,845,202) 5,454
80,156 10,654,533 (558,806)
‐ 282,308 ‐
‐ 2,968 ‐
‐ (3,051,692) ‐
80,156 7,888,117 (558,806)
1,676,905 4,292,094
$ 1,757,061 $ 3,733,288
(228,916)
$ 7,659,201
InternalStormwater
Fund
Nonmajor Fund
Service Fund
24

Electric Water
Fund Fund
CASH FLOWS FROM OPERATING ACTIVITIES
Receipts from customers and users $ 53,986,174 $ 10,176,037 $ 11,948,030
Payments to suppliers (40,342,716) (2,882,030) (5,053,193)
Payments to employees (4,887,067) (2,619,513) (1,902,692)
Net cash provided by (used in) operating activities 8,756,391 4,674,494 4,992,145
CASH FLOWS FROM NON‐CAPITAL FINANCING ACTIVITIES
Transfers from other funds 1,908 1,060 ‐
Transfers to other funds (3,051,692) ‐ ‐
Net cash provided by (used in) non‐capital financing activities (3,049,784) 1,060 ‐
CASH FLOWS FROM CAPITAL AND RELATED FINANCING ACTIVITIES
Purchases and acquisition of capital assets (2,542,921) (2,444,640) (394,533)
Proceeds from sale of capital assets 4,351 9,186 4,422
Proceeds from issuance of debt 3,964,000 2,044,000 ‐
Principal payments on long‐term debt (1,076,392) (2,200,208) (2,700,653)
Interest paid (177,687) (661,830) (439,676)
Net cash provided by (used in) capital and related financing activities 171,351 (3,253,492) (3,530,440)
CASH FLOWS FROM INVESTING ACTIVITIES
Interest received 25,525 12,693 9,070
Net cash provided by investing activities 25,525 12,693 9,070
Net increase (decrease) in cash and cash equivalents 5,903,483 1,434,755 1,470,775
Cash and cash equivalents, beginning of year 16,796,101 10,924,570 6,000,505
Cash and cash equivalents, end of year $ 22,699,584 $ 12,359,325 $ 7,471,280
CASH AND CASH EQUIVALENTS CLASSIFIED AS:
Cash and cash equivalents $ 17,492,839 $ 10,483,159 $ 7,337,921
Restricted cash and cash equivalents 5,206,745 1,876,166 133,359
Total cash and cash equivalents $ 22,699,584 $ 12,359,325 $ 7,471,280
CITY OF NEW BERN, NORTH CAROLINA
STATEMENT OF CASH FLOWS
PROPRIETARY FUNDS
FOR THE YEAR ENDED JUNE 30, 2016
Sewer
Fund
25

Totals
$ 650,629 $ 76,760,870 $ 6,383,586
(194,070) (48,472,009) (6,863,113)
(330,880) (9,740,152) ‐
125,679 18,548,709 (479,527)
‐ 2,968 ‐
‐ (3,051,692) ‐
‐ (3,048,724) ‐
(73,445) (5,455,539) ‐
3,023 20,982 ‐
80,000 6,088,000 ‐
(71,997) (6,049,250) ‐
(10,644) (1,289,837) ‐
(73,063) (6,685,644) ‐
321 47,609 5,454
321 47,609 5,454
52,937 8,861,950 (474,073)
226,208 33,947,384 4,978,952
$ 279,145 $ 42,809,334 $ 4,504,879
$ 279,145 $ 35,593,064 $ 4,504,879
‐ 7,216,270 ‐
$ 279,145 $ 42,809,334 $ 4,504,879
continued
Nonmajor
Stormwater
Fund
Internal
Service Fund
26

Electric Water
Fund Fund
RECONCILIATION OF OPERATING INCOME (LOSS) TO NET CASH PROVIDED BY (USED IN)
OPERATING ACTIVITIES
Operating income (loss) $ 6,428,243 $ 2,961,359 $ 3,019,836
Adjustments to reconcile operating income (loss) to net
cash provided by (used in) operating activities:
Depreciation expense 2,069,769 1,595,690 1,968,930
Change in assets, deferred outflows of resources, liabilities, and
deferred inflows of rosources:
Decrease (increase) in accounts receivable 1,137,102 28,878 129,657
Increase in prepaid items ‐ ‐ (128,097)
Decrease (increase) in inventories (357,891) 115,330 70,825
Decrease (increase) in deferred outflows of resources 16,478 6,105 7,728
Decrease in accounts payable (1,149,625) (106,314) (248,505)
Increase (decrease) in accrued liabilities 257,829 (7,366) 82,530
Increase in due to other funds 106,041 ‐ ‐
Increase in customer deposits 114,127 ‐ ‐
Increase (decrease) in compensated absences payable (13,275) 5,878 3,398
Increase in net pension liability 678,684 334,437 274,714
Increase in claims payable ‐ ‐ ‐
Change in net pension liability (asset) (728,987) (359,223) (295,075)
Increase in net OPEB obligation 197,896 99,720 106,204
Net cash provided by (used in) operating activities $ 8,756,391 $ 4,674,494 $ 4,992,145
NONCASH CAPITAL AND RELATED FINANCING ACTIVITIES ITEMS
Donated captial assets from governmental activities $ 3,308,953 $ ‐ $ ‐
Long‐term liabilities assumed from governmental activities (3,026,645) ‐ ‐
Total noncash capital and related financing activities items $ 282,308 $ ‐ $ ‐
The accompanying notes are an integral part of these financial statements.
Fund
STATEMENT OF CASH FLOWS
PROPRIETARY FUNDS
FOR THE YEAR ENDED JUNE 30, 2016
Sewer
CITY OF NEW BERN, NORTH CAROLINA
27

Totals
$ 90,297 $ 12,499,735 $ (564,260)
70,178 5,704,567 ‐
(30,580) 1,265,057 225
‐ (128,097) ‐
‐ (171,736) ‐
(3,692) 26,619 ‐
(6,528) (1,510,972) (7,702)
2,259 335,252 ‐
‐ 106,041 ‐
‐ 114,127 ‐
1,846 (2,153) ‐
28,576 1,316,411 ‐
‐ ‐ 92,210
(30,372) (1,413,657) ‐
3,695 407,515 ‐
$ 125,679 $ 18,548,709 $ (479,527)
$ ‐ $ 3,308,953 $ ‐
‐ (3,026,645) ‐
$ ‐ $ 282,308 $ ‐
Internal
Fund Service Fund
Nonmajor
Stormwater
28

29
CITY OF NEW BERN, NORTH CAROLINA
NOTES TO FINANCIAL STATEMENTS JUNE 30, 2016
NOTE 1. SUMMARY OF SIGNIFICANT ACCOUNTING POLICIES
The financial statements of the City of New Bern, North Carolina (the “City”) have been prepared in
conformity with accounting principles generally accepted in the United States of America (GAAP) as applied
to government units. The Governmental Accounting Standards Board (GASB) is the accepted standard‐
setting body for establishing governmental accounting and financial reporting principles. The City’s
significant accounting policies are described below.
A. Reporting Entity Founded in 1710 and chartered under the laws of the State of North Carolina, the City of New Bern, North
Carolina is governed by an elected mayor and a six‐member board of aldermen. The government provides
such services as police and fire protection, cultural and recreational activities, public works, water, sewer,
and electric services. The City is managed by a City Manager who is hired directly by the Board. The City
does not report any component units.
B. Government‐wide and Fund Financial Statements
The government‐wide financial statements (i.e., the statement of net position and the statement of
activities) report information on all of the non‐fiduciary activities of the primary government.
Governmental activities, which normally are supported by taxes and intergovernmental revenues, are
reported separately from business‐type activities, which rely to a significant extent on fees and charges for
support. The statement of net position includes non‐current assets and non‐current liabilities. In addition,
the government‐wide statement of activities reflects depreciation expense on the City’s capital assets.
The statement of activities demonstrates the degree to which the direct expenses of a given function or
segments are offset by program revenues. Direct expenses are those that are clearly identifiable with a
specific function or segment. Program revenues include: 1) charges to those who purchase, use, or directly
benefit from goods, services, or privileges provided by a given function or segment, and 2) grants and
contributions that are restricted to meeting the operational or capital requirements of a particular function
or segment. Taxes and other items not properly included among program revenues are reported instead as
general revenues.
Separate financial statements are provided for governmental funds and proprietary funds. Major individual
governmental funds and major individual enterprise funds are reported as separate columns in the fund
financial statements.

30
NOTES TO FINANCIAL STATEMENTS
NOTE 1. SUMMARY OF SIGNIFICANT ACCOUNTING POLICIES (CONTINUED)
C. Measurement Focus, Basis of Accounting and Financial Statement Presentation The government‐wide financial statements are reported using the economic resources measurement focus
and the accrual basis of accounting, as are the proprietary fund financial statements. Revenues are
recorded when earned and expenses are recorded when a liability is incurred, regardless of the timing of
the related cash flows. Property taxes are recognized as revenues in the year for which they are levied.
Grants and similar items are recognized as revenue as soon as all eligibility requirements imposed by the
provider have been met.
Governmental fund financial statements are reported using the current financial resources measurement
focus and the modified accrual basis of accounting. Revenues are recognized as soon as they are both
measurable and available. Revenues are considered to be available when they are collectible within the
current period or soon enough thereafter to pay liabilities of the current period. For this purpose, the City
considers most revenues to be available if they are collected within 90 days of the end of the current fiscal
period, except for property taxes which use a 60 day period. At June 30, 2016, taxes receivable for property
other than motor vehicles are materially past due and are not considered to be an available resources
except as noted above to finance the operations of the current year. Also, as of September 1, 2013, State
law altered the procedures for the assessment and collection of property taxes on registered motor vehicles
in North Carolina. Effective with this change in the law, the State of North Carolina is responsible for billing
and collecting the property taxes on registered motor vehicles on behalf of all municipalities and special tax
districts. Property taxes are due when vehicles are registered. The billed taxes are applicable to the fiscal
year in which they are received. Uncollected taxes that were billed in periods prior to September 1, 2013
and for limited registration plates are shown as a receivable in these financial statements and are offset by
deferred inflows of resources. Expenditures generally are recorded when a liability is incurred, as under
accrual accounting. However, debt service expenditures, as well as expenditures related to other long‐term
liabilities, such as compensated absences and claims and judgments, are recorded only when payment is
due.
Property taxes and related items, sales taxes, franchise taxes, licenses, intergovernmental grants, and
investment income associated with the current fiscal period are all considered to be susceptible to accrual
and so have been recognized as revenues of the current fiscal period. All other revenue items are
considered to be measurable and available only when cash is received by the City.
In accordance with GASB Statement No. 33, Accounting and Financial Reporting for Non‐exchange
Transactions, the corresponding assets (receivables) in non‐exchange transactions are recognized in the
period in which the underlying exchange occurs, when an enforceable legal claim has arisen, when all
eligibility requirements have been met, or when resources are received, depending on the revenue source.
In accordance with GASB Statement No. 34, individual major funds are reported as separate columns in the
fund financial statements.

31
NOTES TO FINANCIAL STATEMENTS
NOTE 1. SUMMARY OF SIGNIFICANT ACCOUNTING POLICIES (CONTINUED)
C. Measurement Focus, Basis of Accounting and Financial Statement Presentation (Continued)
The City reports the following major governmental fund:
The General Fund is the City’s primary operating fund. It accounts for all financial resources of the
general government, except those required to be accounted for in another fund.
The City reports the following major enterprise funds:
The Electric Fund accounts for the operation, maintenance and development of the City’s electric system
and services.
The Water Fund accounts for the operation, maintenance and development of the City’s water system
and services.
The Sewer Fund accounts for the operation, maintenance and development of the City’s sewer system
and services.
Additionally, the City reports the following fund types:
The special revenue funds are used to account for specific revenues, such as various grants and
contributions, which are legally restricted or committed to expenditures for particular purposes.
The capital projects funds accounts for financial resources to be used for the acquisition and
construction of major capital projects.
The Stormwater fund accounts for the maintenance and development of the City’s stormwater system.
The internal service fund accounts for the City’s partially self‐insured health benefits plan and workers
compensation program which charges the other funds of the City for the insurance claims.
In accounting and reporting for its proprietary operations, the government applies all GASB
pronouncements. GASB Statement No. 62, Codification of Accounting and Financial Reporting Guidance
Contained in Pre‐November 30, 1989 FASB and AICPA Pronouncements incorporated into the GASB’s
authoritative literature certain accounting and financial reporting guidance issued on or before
November 30, 1989 which did not conflict with or contradict GASB pronouncements.

32
NOTES TO FINANCIAL STATEMENTS
NOTE 1. SUMMARY OF SIGNIFICANT ACCOUNTING POLICIES (CONTINUED)
C. Measurement Focus, Basis of Accounting and Financial Statement Presentation (Continued)
As a general rule, the effect of inter‐fund activity has been eliminated from the government‐wide financial
statements. However, any inter‐fund services provided and used are not eliminated as this process would
distort the direct costs and program revenues reported in the various functions.
Amounts reported as program revenues include: 1) charges to customers or applicants for goods, services,
or privileges provided, 2) operating grants and contributions, and 3) capital grants and contributions.
Internally dedicated resources are reported as general revenues rather than as program revenues. Likewise,
general revenues include all taxes.
Proprietary funds distinguish operating revenues and expenses from non‐operating items. Operating
revenues and expenses generally result from providing services and producing and delivering goods in
connection with a proprietary fund’s principal ongoing operations. The principal operating revenues of the
enterprise funds include the cost of these goods and services, administrative expenses, and depreciation on
capital assets. All revenues and expenses not meeting this definition are reported as non‐operating
revenues and expenses.
D. Budgets
The City’s budgets are adopted as required by the North Carolina General Statutes. Annual appropriated
budgets are adopted for all funds, with the exception of capital projects funds and grant‐related special
revenue funds, for which project length budgets are adopted. In accordance with state law, the budgets
adopted for the enterprise funds are adopted on the modified accrual basis of accounting, and a
reconciliation is provided along with the budget schedule to reconcile from the modified accrual basis to the
accrual basis. The enterprise fund capital project funds are consolidated with their respective operating
fund for reporting purposes. The governmental funds’ budgets are adopted on a basis other than
accounting principles generally accepted in the United States of America. Budgets are adopted to show use
of fund balance as an other financing source for both governmental and proprietary funds, as well as the
proprietary funds are budgeted on the modified accrual basis of accounting. Annual operating budgets are
adopted each fiscal year through passage of an annual budget ordinance and amended as required for the
General fund, special revenue funds, and the enterprise funds. During the fiscal year ended June 30, 2016,
the original budget was amended through supplemental appropriations. These changes are reflected in the
budgetary comparison schedules. All annual budget appropriations lapse at the end of each year.

33
NOTES TO FINANCIAL STATEMENTS
NOTE 1. SUMMARY OF SIGNIFICANT ACCOUNTING POLICIES (CONTINUED)
E. Deposits
Cash includes amounts in demand deposits as well as short‐term investments with a maturity date within
three months of the date acquired by the City. The City pools cash resources of its various funds in order to
facilitate the management of cash. Cash applicable to a particular fund is readily identifiable. The balance
in the pooled cash accounts is available to meet current operating requirements. Any deposit in excess of
the federal depository insured amounts must be collateralized by an equivalent amount of state or U.S.
obligations. For purposes of the statement of cash flows, all highly liquid investments with an original
maturity of less than 90 days are considered to be cash equivalents.
State law [G.S. 159‐30(c)] authorizes the City to invest in obligations of the United States or obligations fully
guaranteed both as to principal and interest by the United States, obligations of the state of North Carolina,
bonds and notes of any North Carolina local government or public authority, obligations of certain non‐
guaranteed federal agencies, certain high quality issues of commercial paper and bankers’ acceptances, and
the North Carolina Capital Management Trust (NCCMT). The NCCMT‐ Cash Portfolio, a SEC‐registered (2a‐7)
external investment pool, is measured at amortized cost and the NCCMT‐ Term Portfolio’s securities are
measured at fair value.
F. Restricted cash and cash equivalents
The City has restricted cash and cash equivalents related to unspent proceeds from long‐term debt issued
by the General Fund, Water Fund, Sewer Fund, and Electric Fund. These proceeds are held to be disbursed
as costs are incurred on the financed construction projects. Customer deposits held by the City are
restricted to the service for which the deposits are collected.
G. Receivables
All receivables are reported at their gross value and, where appropriate, are reduced by the estimated
portion that is expected to be uncollectible. In accordance with state law [G.S. 105‐347 and G.S. 159‐13(a)],
the City levies ad valorem taxes on property other than motor vehicles on July 1st, the beginning of the
fiscal year. The taxes are due on September 1st (lien date); however, interest does not accrue until the
following January 6th. These taxes are based on the assessed values as of January 1, 2015.
An estimated amount has been recorded for utility services provided but not billed as of the end of the fiscal
year, and is included in accounts receivable, net of uncollectible amounts.

34
NOTES TO FINANCIAL STATEMENTS
NOTE 1. SUMMARY OF SIGNIFICANT ACCOUNTING POLICIES (CONTINUED)
H. Long‐term Loan Receivables
The City has entered into two financing arrangements with an unrelated third party for the renovation and
rehab of certain structures within the City limits, which have resulted in long‐term loan receivables for the
City. These receivables are collateralized by a third position deed of trust on the underlying property;
however the City has considered the possibility of receiving these funds as remote and, accordingly, has
recorded an offsetting allowance for them as part of the City’s financial statements.
These notes include two (2) promissory notes collateralized by a third lien position, deed of trust on Green
Park Terrace, LLC (for Autumn Chase Apartments, elderly low income housing) in the amount totaling
$130,000, at 1% interest with payment in full plus accrued interest on November 7, 2017 for the $100,000
loan and June 30, 2018 for a $30,000 loan.
I. Allowances
All receivables that historically experience uncollectible accounts are shown net of an allowance for
doubtful accounts. This amount is estimated by analyzing the percentage of receivables that were written
off in prior years.
J. Interfund Receivables and Payables
Activity between funds that is representative of lending/borrowing arrangements outstanding at the end of
the fiscal year as well as all other outstanding balances between funds are reported as “due to/from other
funds.” Any residual balances outstanding between the governmental activities and business‐type activities
are reported in the government wide financial statements as “internal balances.”
K. Inventories
All inventories are valued at average cost using the first‐in/first‐out (FIFO) method. Inventories of
governmental funds are recorded as expenditures when consumed rather than when purchased.
Inventories of the enterprise funds are recorded as expenses when consumed rather than when purchased.
L. Prepaid Items
Payments made to vendors for services that will benefit periods beyond June 30, 2016, are recorded as
prepaid items in both government‐wide and fund financial statements.

35
NOTES TO FINANCIAL STATEMENTS
NOTE 1. SUMMARY OF SIGNIFICANT ACCOUNTING POLICIES (CONTINUED)
M. Capital Assets
Capital assets, which include property, plant, equipment, infrastructure assets (e.g., roads, bridges,
sidewalks, and similar items), and intangible assets are reported in the applicable governmental or business‐
type activities column in the government‐wide financial statements. Capital assets are defined by the City
as assets with an initial estimated useful life in excess of two years and individual cost capitalization
thresholds as follows: land of more than $1, infrastructure of more than $100,000; building and land
improvements of greater than $25,000; and equipment of more than $5,000. Such assets are recorded at
historical cost or estimated historical cost if purchased or constructed. Donated capital assets received prior
to June 30, 2015 are recorded at their estimated fair value at the date of donation. Donated capital assets
received after June 30, 2015 are recorded at acquisition value. The cost of normal maintenance and repairs
that do not add to the value of the asset or materially extend asset lives are not capitalized.
Capital assets of the City are depreciated using the straight line method over the following estimated useful
lives:
Buildings 25‐60 yearsImprovements 20‐50 yearsInfrastructure 30‐50 yearsPlants and distribution systems 30‐50 yearsVehicles and service equipment 3‐10 yearsFurniture and equipment 5‐10 years
N. Deferred Outflows/Inflows of Resources
In addition to assets, the statement of net position will sometimes report a separate section for deferred
outflows of resources. This separate financial statement element, deferred outflows of resources,
represents a consumption of net position that applies to a future period(s) and so will not be recognized as
an outflow of resources (expense) until then. The City reports two types of deferred outflow of resources
related to the reporting of the net pension liability. The deferred outflow of resources being recognized is a
deferred outflow of resources for the City’s actual contributions to the pension plan during the fiscal year
ended June 30, 2016, which was subsequent to the measurement date of the net pension liability. These
contributions will reduce the net pension liability in the subsequent period. Additionally, the City reports a
deferred inflow of resources for the difference between the City’s actual contributions towards the pension
plan and the City’s proportionate share of contributions. These deferred inflows of resources will be
amortized over the remaining service period of plan members.

36
NOTES TO FINANCIAL STATEMENTS
NOTE 1. SUMMARY OF SIGNIFICANT ACCOUNTING POLICIES (CONTINUED)
N. Deferred Outflows/Inflows of Resources (Continued)
In addition to liabilities, the statement of net position will sometimes report a separate section for deferred
inflows of resources. This separate financial statement element, deferred inflows of resources, represents
an acquisition of net position that applies to future period(s) and so will not be recognized as an inflow of
resources (revenue) until that time. The City has three (3) items that qualify for reporting in this category
which occurs in the governmental activities and in the individual proprietary funds. The City reports a
deferred inflow of resources for the: (1) difference between expected and actual experience of the pension
plan, (2) net difference between projected and actual investment earnings on the pension plan assets, and
(3) the difference between the City’s actual contributions towards the pension plan and the City’s
proportionate share of contributions. The deferred inflows of resources related to the net differences
between projected and actual investment earnings are amortized over a five year period while the other
two deferred inflow of resources will be amortized over the remaining service period of plan members.
Additionally, the City reports one (1) item which is reported as a deferred inflow of resources which arises
only under a modified accrual basis of accounting. Accordingly, the item, unavailable revenue, is reported
only in the governmental funds balance sheet. The governmental funds report unavailable revenues from
the accrual of ad valorem taxes and intergovernmental revenues which are earned by the City but are not
considered available for the liquidation of current expenditures. Additionally, deferred inflows of resources
are reported for outstanding lien receivables which are not collected within 90 days of the City’s fiscal year‐
end.
O. Compensated Absences
The vacation policy of the City provides for the accumulation of up to thirty days earned vacation leave with
such leave being fully vested when earned. For the City's government‐wide and proprietary funds, an
expense and a liability for compensated absences and the salary‐related payments are recorded as the leave
is earned. The City has assumed a first‐in, first‐out method of using accumulated compensated time. The
portion of that time that is estimated to be used in the next fiscal year has been designated as a current
liability in the government‐wide financial statements.
The City's sick leave policy provides for an unlimited accumulation of earned sick leave. Sick leave does not
vest, but any unused sick leave accumulated at the time of retirement may be used in the determination of
length of service for retirement benefit purposes. Since the City does not have any obligation for the
accumulated sick leave until it is actually taken, no accrual for sick leave has been made.

37
NOTES TO FINANCIAL STATEMENTS
NOTE 1. SUMMARY OF SIGNIFICANT ACCOUNTING POLICIES (CONTINUED)
P. Long‐Term Obligations
In the government‐wide and proprietary fund financial statements, long‐term debt and other long‐term
obligations are reported as liabilities in the applicable governmental activities, business‐type activities, or
proprietary fund type statement of net position. Bond premiums and discounts are accrued and amortized
over the term of the bonds using the effective interest method. Bonds payable are reported net of the
applicable discount or premium. Bond issuance costs are expensed in the year of issuance.
In the governmental fund financial statements, governmental fund types recognize bond premiums and
discounts during the current period. The face amount of the debt issued is reported as other financing
sources. Premiums received on debt issuances are reported as other financing sources while discounts on
debt issuances are reported as other financing uses. Issuance costs, whether or not withheld from the
actual debt proceeds received, are reported as debt service expenditures.
Q. Fund Equity
Fund equity at the governmental fund financial reporting level is classified as “fund balance.” Fund equity
for all other reporting is classified as “net position.”
Fund Balance – Generally, fund balance represents the difference between the assets and liabilities and
deferred inflows of resources under the current financial resources management focus of accounting. In the
fund financial statements, governmental funds report fund balance classifications that comprise a hierarchy
based primarily on the extent to which the City is bound to honor constraints on the specific purpose for
which amounts in those funds can be spent.
Fund balances are classified as follows:
Nonspendable – Fund balances are reported as nonspendable when amounts cannot be spent because
they are either: (a) not in spendable form (i.e., items that are not expected to be converted to cash), or
(b) legally or contractually required to be maintained intact.
Restricted – Fund balances are reported as restricted when there are limitations imposed on their use
through external restrictions imposed by creditors, grantors, laws or regulations of other governments.
One component of the restricted fund balance of the funds relate to the Stabilization by State Statute
(G.S. 159‐8(a)) which requires total fund balance less the fund balance available for appropriation
equals the total amount that must be restricted.

38
NOTES TO FINANCIAL STATEMENTS
NOTE 1. SUMMARY OF SIGNIFICANT ACCOUNTING POLICIES (CONTINUED)
Q. Fund Equity (Continued)
Committed – Fund balances are reported as committed when they can be used only for specific
purposes pursuant to constraints imposed by the City’s Board of Aldermen. Approval of a resolution
after a formal vote of the City’s Board is required to establish a commitment of fund balance. Similarly,
the City’s Board may only modify or rescind the commitment by formal vote and adoption of a
subsequent resolution.
Assigned – Fund balances are reported as assigned when amounts are constrained by the City’s intent
to be used for specific purposes, but are neither restricted nor committed. The City’s Board of
Aldermen, through officially adopted budget ordinances, has expressly delegated limited authority to
the City Manager and Finance Officer, to assign funds.
Unassigned – Fund balances are reported as unassigned as the residual amount when the balances do
not meet any of the above criterion. The City reports positive unassigned fund balance only in the
general fund. Additionally, any fund balance deficits in other governmental funds are reported as
unassigned.
Flow Assumptions – When both restricted and unrestricted amounts of fund balance are available for use
for expenditures incurred, it is the City’s policy to use restricted amounts first and then unrestricted
amounts as they are needed. For unrestricted amounts of fund balance, it is the City’s policy to use fund
balance in the following order: (1) Committed, (2) Assigned, and (3) Unassigned.
Net Position – Net position represents the difference between assets and deferred outflows of resources
and liabilities and deferred inflows of resources, in reporting which utilizes the economic resources
measurement focus. Net investment in capital assets consists of capital assets, net of accumulated
depreciation, reduced by the outstanding balances of any borrowing used (i.e., the amount that the City has
spent) for the acquisition, construction or improvement of those assets.
Net position is reported as restricted using the same definition as used for restricted fund balance as
described in the section above. All other net position is reported as unrestricted.
The City applies restricted resources first when an expense is incurred for purposes for which both restricted
and unrestricted net position is available.
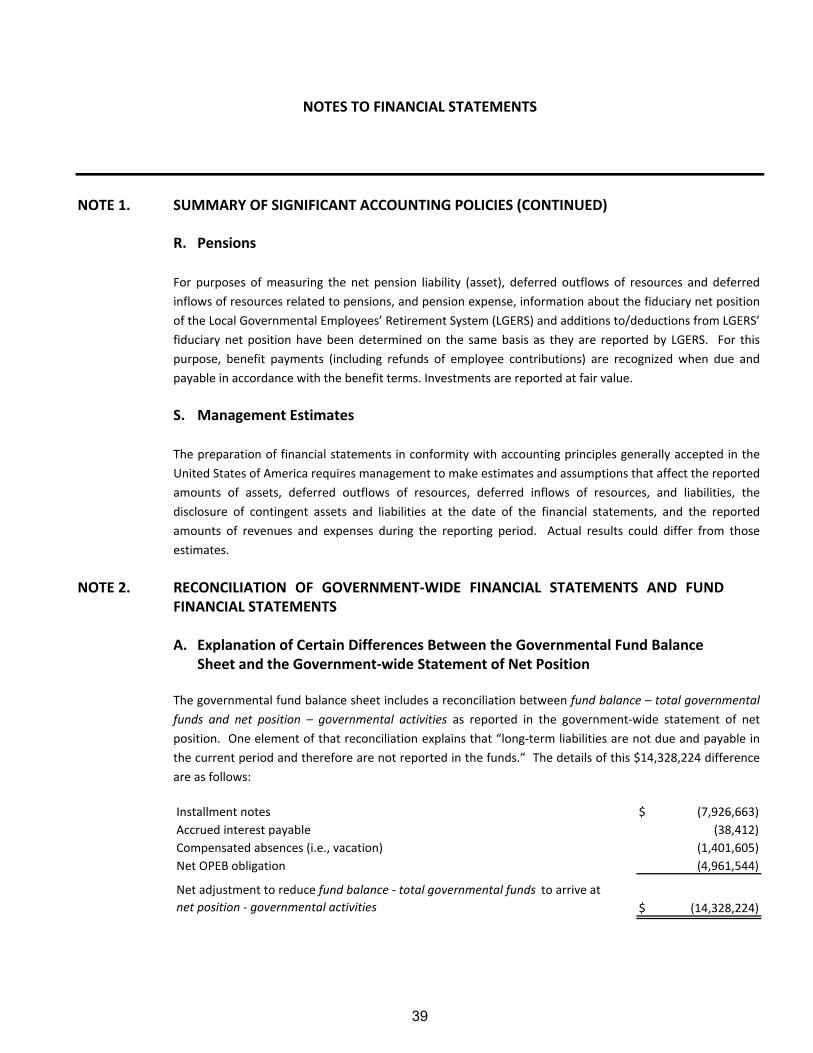
39
NOTES TO FINANCIAL STATEMENTS
NOTE 1. SUMMARY OF SIGNIFICANT ACCOUNTING POLICIES (CONTINUED)
R. Pensions
For purposes of measuring the net pension liability (asset), deferred outflows of resources and deferred
inflows of resources related to pensions, and pension expense, information about the fiduciary net position
of the Local Governmental Employees’ Retirement System (LGERS) and additions to/deductions from LGERS’
fiduciary net position have been determined on the same basis as they are reported by LGERS. For this
purpose, benefit payments (including refunds of employee contributions) are recognized when due and
payable in accordance with the benefit terms. Investments are reported at fair value.
S. Management Estimates
The preparation of financial statements in conformity with accounting principles generally accepted in the
United States of America requires management to make estimates and assumptions that affect the reported
amounts of assets, deferred outflows of resources, deferred inflows of resources, and liabilities, the
disclosure of contingent assets and liabilities at the date of the financial statements, and the reported
amounts of revenues and expenses during the reporting period. Actual results could differ from those
estimates.
NOTE 2. RECONCILIATION OF GOVERNMENT‐WIDE FINANCIAL STATEMENTS AND FUND FINANCIAL STATEMENTS
A. Explanation of Certain Differences Between the Governmental Fund Balance
Sheet and the Government‐wide Statement of Net Position
The governmental fund balance sheet includes a reconciliation between fund balance – total governmental
funds and net position – governmental activities as reported in the government‐wide statement of net
position. One element of that reconciliation explains that “long‐term liabilities are not due and payable in
the current period and therefore are not reported in the funds.” The details of this $14,328,224 difference
are as follows:
Installment notes $ (7,926,663)
Accrued interest payable (38,412)
Compensated absences (i.e., vacation) (1,401,605)
Net OPEB obligation (4,961,544)
Net adjustment to reduce fund balance ‐ total governmental funds to arrive at
net position ‐ governmental activities $ (14,328,224)

40
NOTES TO FINANCIAL STATEMENTS
NOTE 2. RECONCILIATION OF GOVERNMENT‐WIDE FINANCIAL STATEMENTS AND FUND
FINANCIAL STATEMENTS (CONTINUED)
B. Explanation of Certain Differences Between the Governmental Fund Statement of Revenues, Expenditures, and Changes in Fund Balances and the Government‐wide Statement of Activities
The governmental fund statement of revenues, expenditures, and changes in fund balances includes a
reconciliation between net change in fund balances – total governmental funds and changes in net position
of governmental activities as reported in the government‐wide statement of activities. One element of that
reconciliation explains that “Governmental funds report capital outlays as expenditures. However, in the
statement of activities the cost of those assets is allocated over their estimated useful lives and reported as
depreciation expense.” The details of this $611,327 difference are as follows:
Capital outlay $ 3,511,308
Depreciation expense (2,899,981)
Net adjustment to increase net change in fund balances ‐ total governmental funds
to arrive at change in net position ‐ governmental activities $ 611,327
The “net effect of various miscellaneous transactions involving capital assets (i.e., donations, sales and
transfers of assets to enterprise funds) is to increase net position.” The details of this $6,766,211 difference
are as follows:
Donated capital assets ‐ infrastructure $ 10,137,360
Disposal of capital assets (62,196)
Capital assets transferred to enterprise funds (3,308,953)
Net adjustment to increase net change in fund balances ‐ total governmental
funds to arrive at change in net position ‐ governmental activities $ 6,766,211

41
NOTES TO FINANCIAL STATEMENTS
NOTE 2. RECONCILIATION OF GOVERNMENT‐WIDE FINANCIAL STATEMENTS AND FUND
FINANCIAL STATEMENTS (CONTINUED)
B. Explanation of Certain Differences Between the Governmental Fund Statement of Revenues, Expenditures, and Changes in Fund Balances and the Government‐wide Statement of Activities (Continued)
Another element of the reconciliation states that “the issuance of long‐term debt provides current financial
resources to governmental funds, while the repayment of the principal of long‐term debt consumes the
current financial resources of governmental funds. Neither transaction, however, has any effect on net
position. This amount is the net effect of these differences in the treatment of long‐term debt and related
items.” The details of this $5,021,876 difference are as follows:
Payments on long‐term liabilities $ 4,975,998
Issuance of installment notes payable (2,980,767)
Long‐term liabilities transferred to enterprise funds 3,026,645
Net adjustment to increase net change in fund balances ‐ total governmental
funds to arrive at change in net position ‐ governmental activities $ 5,021,876
Another element of the reconciliation states that “some expenses reported in the statement of activities do
not require the use of current financial resources and, therefore, are not reported as expenditures in
governmental funds.” The details of this $134,638 difference are as follows:
Compensated absences (i.e., vacation) $ (20,950)
Change in accrued interest 18,459
Net pension liability (asset) and related deferred inflows / outflows
of resources ‐ LGERS 465,930
Net pension obligation ‐ Special Separation Allowance LEO (63,314)
Net OPEB obligation (534,773)
Net adjustment to decrease net change in fund balances ‐ total governmental
funds to arrive at change in net position ‐ governmental activities $ (134,648)

42
NOTES TO FINANCIAL STATEMENTS
NOTE 3. STEWARDSHIP, COMPLIANCE, AND ACCOUNTABILITY
Expenditures in Excess of Appropriations. The budget is officially adopted by the governing body prior to
the beginning of its fiscal year, or a resolution authorizing the continuation of necessary and essential
expenditures to operate the City will be adopted. The legal level of budgetary control (i.e., the level at
which expenditures may not legally exceed appropriations) is the department level, within the fund.
Transfers of appropriations within a department budget or within a non‐departmental expenditure category
require only the approval of the City Manager and/or Finance Officer. Increases in appropriations in a
departmental budget or in a non‐departmental expenditure category, require approval of the governing
body in the form of amendments to the budget ordinance.
Deficit Fund Balance. The following funds are reporting deficit fund balances as of June 30, 2016:
Fund Deficit Corrective Action
Glenburnie Road Multi‐Use Path Project (454,248) The fund is reporting unavailable revenues which will
offset the deficit in future years.Public‐Private Partnership (348) Future transfers from the General Fund.
Entitlement Cities CDBG Program (168,890) The fund is reporting unavailable revenues which will
offset the deficit in future years.
Neuse Boulevard Sidewalk (377,699) The fund is reporting unavailable revenues which will
offset the deficit in future years.
THE REMAINDER OF THE PAGE IS INTENTIONALLY LEFT BLANK
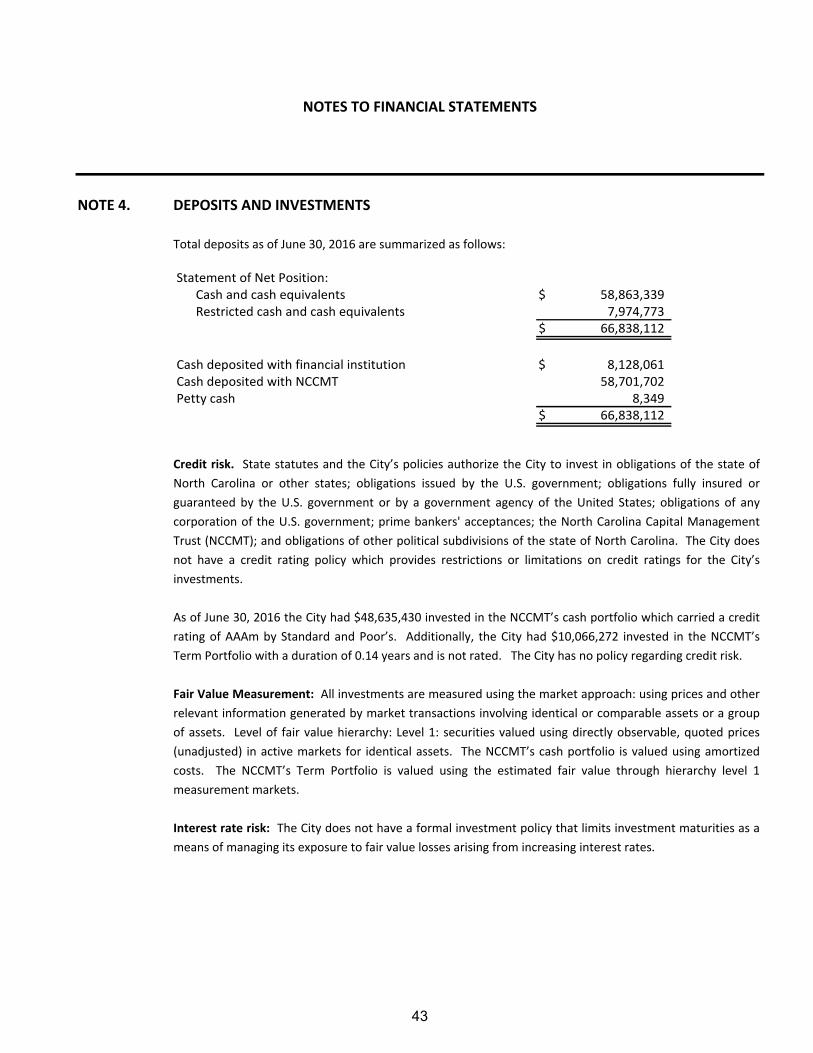
43
NOTES TO FINANCIAL STATEMENTS
NOTE 4. DEPOSITS AND INVESTMENTS
Total deposits as of June 30, 2016 are summarized as follows:
Statement of Net Position:Cash and cash equivalents $ 58,863,339 Restricted cash and cash equivalents 7,974,773
$ 66,838,112
Cash deposited with financial institution $ 8,128,061 Cash deposited with NCCMT 58,701,702 Petty cash 8,349
$ 66,838,112
Credit risk. State statutes and the City’s policies authorize the City to invest in obligations of the state of
North Carolina or other states; obligations issued by the U.S. government; obligations fully insured or
guaranteed by the U.S. government or by a government agency of the United States; obligations of any
corporation of the U.S. government; prime bankers' acceptances; the North Carolina Capital Management
Trust (NCCMT); and obligations of other political subdivisions of the state of North Carolina. The City does
not have a credit rating policy which provides restrictions or limitations on credit ratings for the City’s
investments.
As of June 30, 2016 the City had $48,635,430 invested in the NCCMT’s cash portfolio which carried a credit
rating of AAAm by Standard and Poor’s. Additionally, the City had $10,066,272 invested in the NCCMT’s
Term Portfolio with a duration of 0.14 years and is not rated. The City has no policy regarding credit risk.
Fair Value Measurement: All investments are measured using the market approach: using prices and other
relevant information generated by market transactions involving identical or comparable assets or a group
of assets. Level of fair value hierarchy: Level 1: securities valued using directly observable, quoted prices
(unadjusted) in active markets for identical assets. The NCCMT’s cash portfolio is valued using amortized
costs. The NCCMT’s Term Portfolio is valued using the estimated fair value through hierarchy level 1
measurement markets.
Interest rate risk: The City does not have a formal investment policy that limits investment maturities as a
means of managing its exposure to fair value losses arising from increasing interest rates.

44
NOTES TO FINANCIAL STATEMENTS
NOTE 4. DEPOSITS AND INVESTMENTS (CONTINUED)
Custodial credit risk – deposits: Custodial credit risk for deposits is the risk that, in the event of the failure
of a depository financial institution, a government will not be able to recover deposits or will not be able to
recover collateral securities that are in the possession of an outside party. State statutes (G.S. 159‐31)
require all deposits and investments (other than federal or state government instruments) to be
collateralized by depository insurance, obligations of the U.S. government, or bonds of public authorities,
counties, or municipalities. As of June 30, 2016, the City’s deposits are insured or collateralized as required
by state law.
NOTE 5. RECEIVABLES
Receivables at June 30, 2016, for the City’s individual major funds and aggregate nonmajor funds, including
any applicable allowances for uncollectible accounts are as follows:
General Electric Water Sewer Stormwater
Receivables:
Taxes $ 525,380 $ ‐ $ ‐ $ ‐ $ ‐ $ ‐
Notes 155,357 ‐ ‐ ‐ ‐ ‐
Accounts 3,092,548 6,554,528 1,179,407 1,342,854 70,138 39,887
Due from other
governments 660,760 ‐ ‐ ‐ ‐ 1,196,080
Less allowance
for uncollectible (396,362) (135,600) (67,075) (130,005) (7,700) ‐
Net total receivable $ 4,037,683 $ 6,418,928 $ 1,112,332 $ 1,212,849 $ 62,438 $ 1,235,967
Other
Governmental

45
NOTES TO FINANCIAL STATEMENTS
NOTE 6. CAPITAL ASSETS
Capital asset activity for the City for the year ended June 30, 2016 is as follows:
Beginning Ending
Balance Increases Decreases Transfers Balance
Governmental Activities:
Nondepreciable capital assets:
Land $ 14,516,119 $ 27,696 $ (329,896) $ ‐ $ 14,213,919
Construction in progress 382,101 2,173,122 ‐ (32,760) 2,522,463
Total 14,898,220 2,200,818 (329,896) (32,760) 16,736,382
Capital assets, being depreciated:
Buildings and improvements 18,018,342 ‐ (2,235,010) ‐ 15,783,332
Equipment 11,787,558 300,858 (1,029,744) ‐ 11,058,672
Furniture and fixtures 5,510,269 186,711 ‐ 32,760 5,729,740
Transformers 70,275 ‐ ‐ ‐ 70,275
Infrastructure 17,793,520 10,548,066 ‐ ‐ 28,341,586
Vehicle 9,039,694 412,215 (793,094) ‐ 8,658,815
Total being depreciated 62,219,658 11,447,850 (4,057,848) 32,760 69,642,420
Less accumulated depreciation for:
Buildings and improvements (5,753,749) (444,783) 223,501 ‐ (5,975,031)
Equipment (5,839,932) (552,566) ‐ ‐ (6,392,498)
Furniture and fixtures (3,696,983) (482,872) ‐ ‐ (4,179,855)
Transformers (29,515) (2,811) ‐ ‐ (32,326)
Infrastructure (6,802,111) (854,256) ‐ ‐ (7,656,367)
Vehicle (6,439,116) (562,693) 793,094 ‐ (6,208,715)
Total (28,561,406) (2,899,981) 1,016,595 ‐ (30,444,792)
Total capital assets, being
depreciated, net 33,658,252 8,547,869 (3,041,253) 32,760 39,197,628
Governmental activities capital
assets, net $ 48,556,472 $ 10,748,687 $ (3,371,149) $ ‐ $ 55,934,010

46
NOTES TO FINANCIAL STATEMENTS
NOTE 6. CAPITAL ASSETS (CONTINUED)
Beginning Decreases/ EndingBalance Increases Transfers Balance
Electric Fund:
Nondepreciable capital assets:Land $ 944,287 $ 267,700 $ ‐ $ 1,211,987 Construction in progress 4,191,205 1,132,534 (2,450,759) 2,872,980
Total 5,135,492 1,400,234 (2,450,759) 4,084,967
Capital assets, being depreciated:Buildings 1,677,762 2,079,525 1,644,997 5,402,284 Equipment 6,726,655 1,241,112 11,210 7,978,977 Furniture and fixtures 35,504 ‐ 193,772 229,276 Transformers 4,469,311 52,049 ‐ 4,521,360 Distribution systems 46,740,720 999,336 ‐ 47,740,056 Vehicles 2,805,151 79,618 (40,470) 2,844,299
Total 62,455,103 4,451,640 1,809,509 68,716,252
Less accumulated depreciation for:Buildings (581,386) (51,412) ‐ (632,798) Equipment (4,462,493) (261,261) ‐ (4,723,754) Furniture and fixtures (35,504) (32,295) ‐ (67,799) Transformers (3,279,298) (79,856) ‐ (3,359,154) Distribution systems (27,523,853) (1,455,702) ‐ (28,979,555) Vehicles (2,199,520) (189,243) 40,470 (2,348,293)
Total (38,082,054) (2,069,769) 40,470 (40,111,353)
Total capital assets beingdepreciated, net 24,373,049 2,381,871 1,849,979 28,604,899
Electric Fund capital assets, net $ 29,508,541 $ 3,782,105 $ (600,780) $ 32,689,866
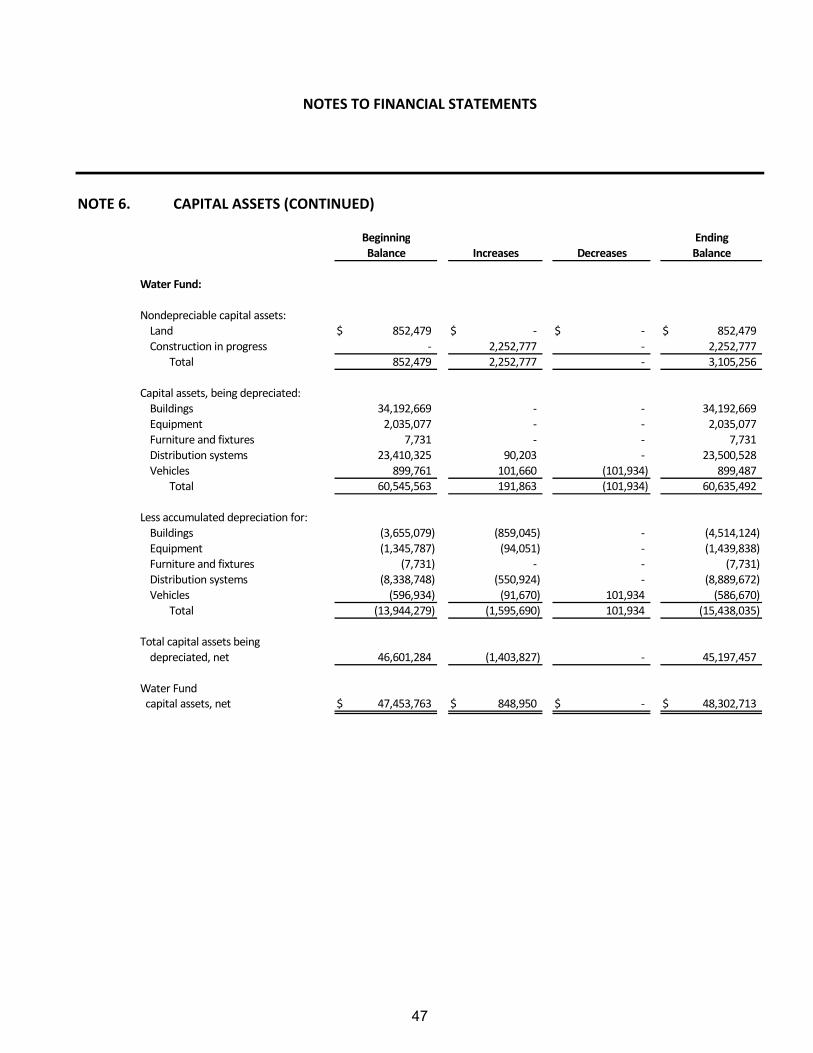
47
NOTES TO FINANCIAL STATEMENTS
NOTE 6. CAPITAL ASSETS (CONTINUED)
Beginning EndingBalance Increases Decreases Balance
Water Fund:
Nondepreciable capital assets:Land $ 852,479 $ ‐ $ ‐ $ 852,479 Construction in progress ‐ 2,252,777 ‐ 2,252,777
Total 852,479 2,252,777 ‐ 3,105,256
Capital assets, being depreciated:Buildings 34,192,669 ‐ ‐ 34,192,669 Equipment 2,035,077 ‐ ‐ 2,035,077 Furniture and fixtures 7,731 ‐ ‐ 7,731 Distribution systems 23,410,325 90,203 ‐ 23,500,528 Vehicles 899,761 101,660 (101,934) 899,487
Total 60,545,563 191,863 (101,934) 60,635,492
Less accumulated depreciation for:Buildings (3,655,079) (859,045) ‐ (4,514,124) Equipment (1,345,787) (94,051) ‐ (1,439,838) Furniture and fixtures (7,731) ‐ ‐ (7,731) Distribution systems (8,338,748) (550,924) ‐ (8,889,672) Vehicles (596,934) (91,670) 101,934 (586,670)
Total (13,944,279) (1,595,690) 101,934 (15,438,035)
Total capital assets beingdepreciated, net 46,601,284 (1,403,827) ‐ 45,197,457
Water Fund capital assets, net $ 47,453,763 $ 848,950 $ ‐ $ 48,302,713

48
NOTES TO FINANCIAL STATEMENTS
NOTE 6. CAPITAL ASSETS (CONTINUED)
Beginning EndingBalance Increases Decreases Balance
Sewer Fund:
Nondepreciable capital assets:Land $ 12,389,511 $ ‐ $ ‐ $ 12,389,511 Construction in progress ‐ 115,718 ‐ 115,718
Total 12,389,511 115,718 ‐ 12,505,229
Capital assets, being depreciated:Buildings 39,268,740 87,988 ‐ 39,356,728 Equipment 3,907,619 156,159 (17,150) 4,046,628 Furniture and fixtures 48,820 ‐ ‐ 48,820 Distribution system 37,223,499 ‐ ‐ 37,223,499 Vehicles 1,430,542 34,668 (68,898) 1,396,312
Total 81,879,220 278,815 (86,048) 82,071,987
Less accumulated depreciation for:Buildings (15,989,155) (962,031) ‐ (16,951,186) Equipment (2,232,111) (202,575) 17,150 (2,417,536) Furniture and fixtures (42,174) (1,733) ‐ (43,907) Distribution system (8,271,484) (746,267) ‐ (9,017,751) Vehicles (1,256,908) (56,324) 68,898 (1,244,334)
Total (27,791,832) (1,968,930) 86,048 (29,674,714)
Total capital assets beingdepreciated, net 54,087,388 (1,690,115) ‐ 52,397,273
Sewer Fund capital assets, net $ 66,476,899 $ (1,574,397) $ ‐ $ 64,902,502

49
NOTES TO FINANCIAL STATEMENTS
NOTE 6. CAPITAL ASSETS (CONTINUED)
Beginning EndingBalance Increases Decreases Balance
Stormwater Fund:
Capital assets, being depreciated:Lines $ 2,021,834 $ ‐ $ ‐ $ 2,021,834 Equipment 5,285 73,445 ‐ 78,730 Vehicles 68,710 ‐ ‐ 68,710
Total 2,095,829 73,445 ‐ 2,169,274
Less accumulated depreciation for:Lines (94,750) (50,546) ‐ (145,296) Equipment (528) (5,890) ‐ (6,418) Vehicles (15,788) (13,742) ‐ (29,530)
Total (111,066) (70,178) ‐ (181,244)
Stormwater Fund capital assets, net $ 1,984,763 $ 3,267 $ ‐ $ 1,988,030
Depreciation expense was charged to functions/programs of the City as follows:
Governmental activities:
General government $ 368,811
Public safety 1,265,429
Public works 766,664
Environmental protection 117,570
Culture and recreation 381,507
Total depreciation expense ‐ governmental activities $ 2,899,981
Business‐type activitiesElectric $ 2,069,769 Water 1,595,690 Sewer 1,968,930 Stormwater 70,178
Total depreciation expense ‐ business‐type activities $ 5,704,567

50
NOTES TO FINANCIAL STATEMENTS
NOTE 7. LONG‐TERM DEBT
Long‐term liability activity for the year ended June 30, 2016 is as follows:
Beginning Ending Due Within
Balance Additions Reductions Balance One Year
Governmental activities:
Installment notes $ 12,948,539 $ 2,980,767 $ (8,002,643) $ 7,926,663 $ 1,499,854
Compensated absences 1,380,655 995,224 (974,274) 1,401,605 1,121,284
Net pension liability (asset) (1,489,752) 3,546,590 (1,005,448) 1,051,390 ‐
Law enforcement officers'
SSA pension obligation 2,156,456 163,922 (100,608) 2,219,770 ‐
Net OPEB obligation 4,426,771 1,146,753 (611,980) 4,961,544 ‐
Governmental activity
Long‐term liabilities $ 19,422,669 $ 8,833,256 $ (10,694,953) $ 17,560,972 $ 2,621,138
Business‐type activities:Installment notes 3,648,020 3,514,645 (996,222) 6,166,443 1,050,654 Notes payable 35,843,939 ‐ (3,051,552) 32,792,387 3,085,885 Revenue bonds payable 17,608,515 5,600,000 (2,001,476) 21,207,039 2,544,932 Net pension liability (asset) (720,144) 2,012,328 (695,917) 596,267 ‐ Compensated absences 579,204 461,444 (463,597) 577,051 461,677 Net OPEB obligation 2,130,905 586,700 (179,185) 2,538,420 ‐ Business‐type activityLong‐term liabilities $ 59,090,439 $ 12,175,117 $ (7,387,949) $ 63,877,607 $ 7,143,148
For governmental funds, compensated absences are liquidated by the General Fund. The net pension
liability (asset), law enforcement officers’ SSA pension obligation, and OPEB obligation are liquidated by the
General Fund. Included in the reduction above for the governmental installment notes was $3,026,645 of
the liability which was transferred to the Electric Fund, along with the related assets which were financed
with the notes.

51
NOTES TO FINANCIAL STATEMENTS
NOTE 7. LONG‐TERM DEBT (CONTINUED)
Installment Notes Payable
The City has various installment notes outstanding for buildings, equipment, and vehicle financing
arrangements. The outstanding balances for the notes as of June 30, 2016 are as follows:
Balance as of Governmental activities June 30, 2016
354,770$
2,352,040
1,168,855
372,252
1,044,535
680,970
945,346
1,007,895
Total outstanding installment notes payable 7,926,663$
A note issued by BB&T Bank for $1,213,040 was issued in June 2015 with semi‐annual
payments of $121,304 for various vehicle acquisitions. The note bears an interest rate of
1.49% and matures in 2020.
A note issued by First Citizens Bank for $1,117,000 was issued in December 2015 with semi‐
annual payments of $116,458 (fixed principal) for the purchase various vehicles and
equipment. The note bears an interest rate of 1.58% and matures in 2021.
A note issued by Bank of America for $1,330,360 was issued in May 2005 with semi‐annual
payments of $44,345 for streetscape improvements, 200 and 300 block Craven Street
improvements, and fire classroom renovations. The note bears an interest rate of 3.72% and
matures in 2020.
A note issued by BB&T for $5,063,453 was issued in May 2008 with quarterly payments of
$84,001 for aquatic center and swimming pool construction, downtown streetscape projects,
and Elizabeth Avenue fires station improvements. The note bears an interest rate of 2.92%
and matures in 2023.
A note issued by BB&T for $3,485,500 was issued in June 2012 with semi‐annual payments of
$103,983 for the purchase and installation of radio network. The note bears an interest rate
of 2.04% and matures in 2022.
A note issued by BB&T for $465,315 was issued in May 2013 with semi‐annual payments of
$15,510 for South Front Street streetscape improvements. The note bears an interest rate of
2.54% and matures in 2028.
A note issued by BB&T for $1,740,891 was issued in February 2014 with semi‐annual
payments of $174,089 for various vehicle acquisitions. The note bears an interest rate of
1.39% and matures in 2019.
A note issued by SunTrust Bank for $756,633 was issued in July 2014 with semi‐annual
payments of $25,221 for the purchase of a fire truck. The note bears an interest rate of 2.86%
and matures in 2029.
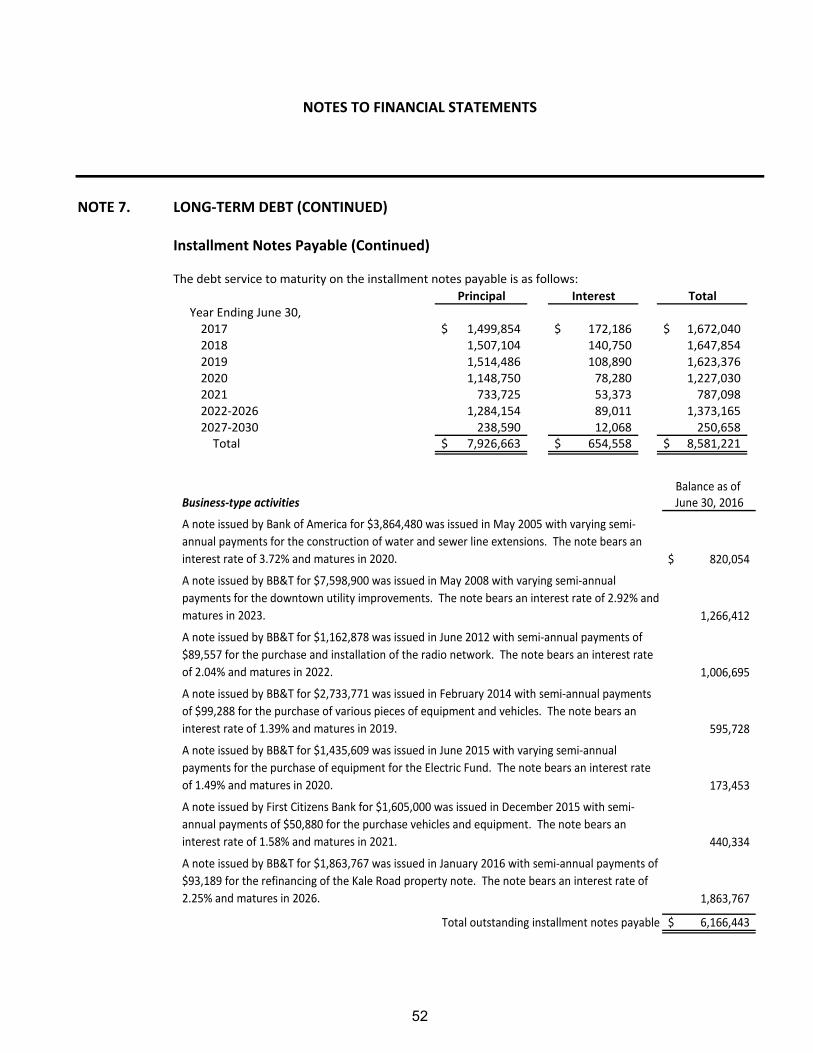
52
NOTES TO FINANCIAL STATEMENTS
NOTE 7. LONG‐TERM DEBT (CONTINUED)
Installment Notes Payable (Continued) The debt service to maturity on the installment notes payable is as follows:
Principal Interest TotalYear Ending June 30,2017 1,499,854$ 172,186$ 1,672,040$ 2018 1,507,104 140,750 1,647,854 2019 1,514,486 108,890 1,623,376 2020 1,148,750 78,280 1,227,030 2021 733,725 53,373 787,098 2022‐2026 1,284,154 89,011 1,373,165 2027‐2030 238,590 12,068 250,658 Total 7,926,663$ 654,558$ 8,581,221$
Balance as of Business‐type activities June 30, 2016
820,054$
1,266,412
1,006,695
595,728
173,453
440,334
1,863,767
Total outstanding installment notes payable 6,166,443$
A note issued by BB&T for $7,598,900 was issued in May 2008 with varying semi‐annual
payments for the downtown utility improvements. The note bears an interest rate of 2.92% and
matures in 2023.
A note issued by Bank of America for $3,864,480 was issued in May 2005 with varying semi‐
annual payments for the construction of water and sewer line extensions. The note bears an
interest rate of 3.72% and matures in 2020.
A note issued by BB&T for $2,733,771 was issued in February 2014 with semi‐annual payments
of $99,288 for the purchase of various pieces of equipment and vehicles. The note bears an
interest rate of 1.39% and matures in 2019.
A note issued by First Citizens Bank for $1,605,000 was issued in December 2015 with semi‐
annual payments of $50,880 for the purchase vehicles and equipment. The note bears an
interest rate of 1.58% and matures in 2021.
A note issued by BB&T for $1,863,767 was issued in January 2016 with semi‐annual payments of
$93,189 for the refinancing of the Kale Road property note. The note bears an interest rate of
2.25% and matures in 2026.
A note issued by BB&T for $1,162,878 was issued in June 2012 with semi‐annual payments of
$89,557 for the purchase and installation of the radio network. The note bears an interest rate
of 2.04% and matures in 2022.
A note issued by BB&T for $1,435,609 was issued in June 2015 with varying semi‐annual
payments for the purchase of equipment for the Electric Fund. The note bears an interest rate
of 1.49% and matures in 2020.
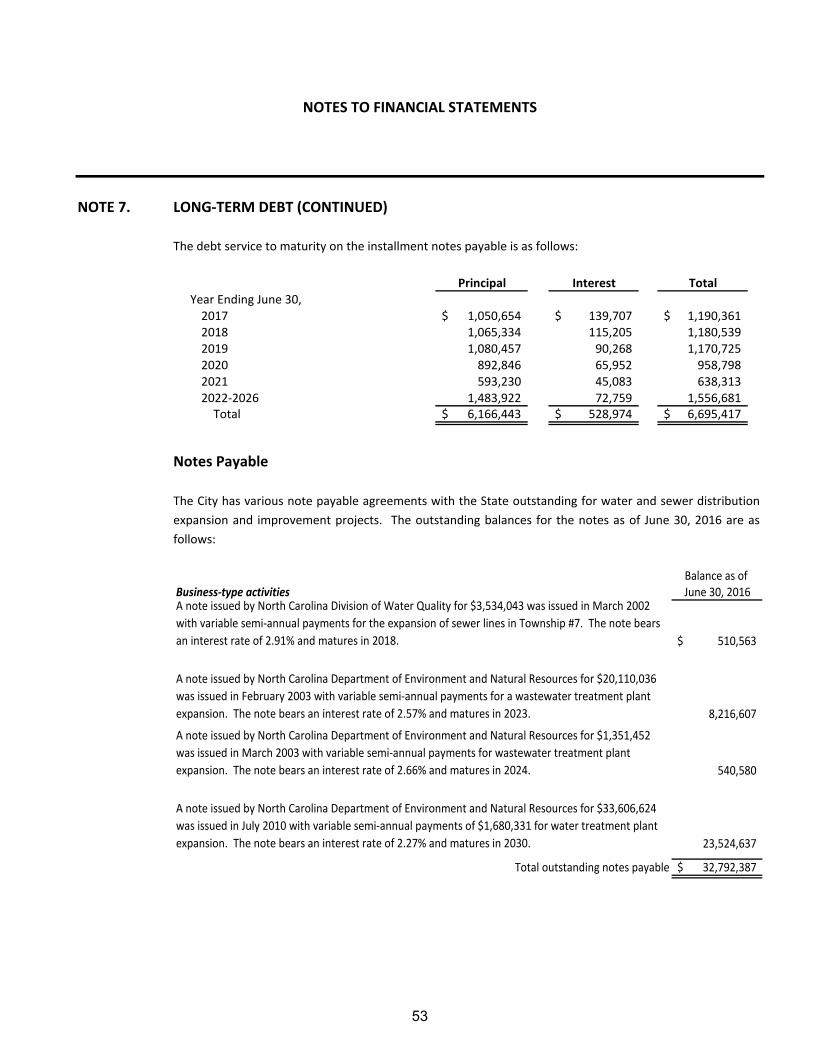
53
NOTES TO FINANCIAL STATEMENTS
NOTE 7. LONG‐TERM DEBT (CONTINUED)
The debt service to maturity on the installment notes payable is as follows:
Principal Interest Total
Year Ending June 30,2017 1,050,654$ 139,707$ 1,190,361$ 2018 1,065,334 115,205 1,180,539 2019 1,080,457 90,268 1,170,725 2020 892,846 65,952 958,798 2021 593,230 45,083 638,313 2022‐2026 1,483,922 72,759 1,556,681 Total 6,166,443$ 528,974$ 6,695,417$
Notes Payable
The City has various note payable agreements with the State outstanding for water and sewer distribution
expansion and improvement projects. The outstanding balances for the notes as of June 30, 2016 are as
follows:
Balance as of
Business‐type activities June 30, 2016
510,563$
8,216,607
540,580
23,524,637
Total outstanding notes payable 32,792,387$
A note issued by North Carolina Department of Environment and Natural Resources for $20,110,036
was issued in February 2003 with variable semi‐annual payments for a wastewater treatment plant
expansion. The note bears an interest rate of 2.57% and matures in 2023.
A note issued by North Carolina Division of Water Quality for $3,534,043 was issued in March 2002
with variable semi‐annual payments for the expansion of sewer lines in Township #7. The note bears
an interest rate of 2.91% and matures in 2018.
A note issued by North Carolina Department of Environment and Natural Resources for $33,606,624
was issued in July 2010 with variable semi‐annual payments of $1,680,331 for water treatment plant
expansion. The note bears an interest rate of 2.27% and matures in 2030.
A note issued by North Carolina Department of Environment and Natural Resources for $1,351,452
was issued in March 2003 with variable semi‐annual payments for wastewater treatment plant
expansion. The note bears an interest rate of 2.66% and matures in 2024.

54
NOTES TO FINANCIAL STATEMENTS
NOTE 7. LONG‐TERM DEBT (CONTINUED)
The debt service to maturity on the notes payable is as follows:
Principal Interest Total
Year Ending June 30,2017 3,085,885$ 773,237$ 3,859,122$ 2018 3,121,128 698,138 3,819,266 2019 2,890,821 622,109 3,512,930 2020 2,920,194 552,879 3,473,073 2021 2,950,322 482,894 3,433,216 2022‐2026 11,102,711 1,439,585 12,542,296 2027‐2031 6,721,326 380,595 7,101,921 Total 32,792,387$ 4,949,437$ 37,741,824$
Revenue Bonds In June 2013, the City issued $17,180,000 of Utility Revenue Bonds for water, sewer, and electric system improvements and expansion and refunding of installment notes payable. Semi‐annual payments of $930,882 are due on December 1 and June 1. The bonds bear an interest rate of 1.56%. At June 30, 2016, $12,300,651 of the bonds were outstanding. The bonds mature in 2023. The City has pledged future water, sewer, and electric revenues, net of specified operating expenses to repay these bonds. In December 2014, the City issued $3,830,000 of Utility Revenue Bonds for acquisition and construction of a warehouse, AMI, and other improvements at Kale Road. Semi‐annual payments of $213,847 are due on December 1 and June 1. The bonds bear an interest rate of 2.15%. At June 30, 2016, $3,306,388 of the bonds were outstanding. The bonds mature in 2025. The City has pledged future water, sewer, and electric revenues, net of specified operating expenses to repay these bonds. In May 2016, the City issued $5,600,000 of Utility Revenue Bonds for water and electric AMI expansion. Semiannual payments of $310,082 due on December 1 and June 1. The bonds bear an interest rate of 1.97%. At June 30, 2016, $5,600,000 of the bonds were outstanding. The bonds mature in 2026. The City has pledged future water and electric revenues, net of specified operating expenses to repay these bonds.

55
NOTES TO FINANCIAL STATEMENTS
NOTE 7. LONG‐TERM DEBT (CONTINUED)
The debt service to maturity on the revenue bonds is as follows:
Principal Interest Total
Year Ending June 30,2017 2,544,932$ 364,689$ 2,909,621$ 2018 2,591,325 318,296 2,909,621 2019 2,636,249 273,372 2,909,621 2020 2,681,967 227,654 2,909,621 2021 2,728,492 181,129 2,909,621 2022‐2026 8,024,074 295,200 8,319,274 Total 21,207,039$ 1,660,340$ 22,867,379$
The City is in compliance with the covenants as to rates, fees, rentals and charges in Section 704 and Section 711 of the Bond Order, authorizing the issuance of the Electric, Water and Sewer Revenue Bonds, Series 2013, secured solely by the pledge of net revenue of the City’s combined enterprise funds (Electric, Water and Sewer). Pursuant to Section 704(a) of the Bond and related agreements, the City has made certain covenants that provide for rates to be set at levels to provide annually to maintain a debt service coverage ratio of 120% (1.20) for parity indebtedness and 100% (1.0) for parity and subordinated indebtedness. In addition, pursuant to Section 711 of the Bond agreement, the principal amount of installment debt (liens) cannot exceed 15% of net investment in capital assets. The debt service coverage requirements for the year ended June 30, 2016, are as follows:
RevenuesUser charges $ 73,875,772 Interest earnings 47,288
Operating expenses (less depreciation) (56,784,747) Income available for debt service 17,138,313
Plus 15% of unrestricted net position 5,724,102 Total income available for debt service $ 22,862,415
Annual debt service (Revenue Bonds only) $ 2,911,622 Debt service coverage for parity 7.85
Total income available for debt service $ 22,862,415 Annual debt service (parity and subordinated debt) 7,256,446
Debt service coverage for parity and subordinated debt 3.15
Total installment debt outstanding $ 5,673,221 Net investment in capital assets 90,692,384
Lien covenant calculation 6.26%
Per loan covenants, operating expenses do not include depreciation expense.

56
NOTES TO FINANCIAL STATEMENTS
NOTE 8. INTERFUND RECEIVABLES, PAYABLES AND TRANSFERS
The composition of interfund balances as of June 30, 2016 is as follows:
Due to/from other funds:
Receivable Fund Payable Fund
Electric Fund General Fund $ 179,113
General Fund Nonmajor governmental funds $ 978,173
General Fund Electric Fund 106,041
$ 1,084,214
Amount
The General Fund has a payable to the Electric Fund for a reimbursement owed for debt service payment
made by the Electric Fund. The nonmajor funds and the Electric Fund owe the General Fund for temporary
cash shortages in the pooled cash account being covered by the General Fund.
Interfund transfers:
Transfers In Transfers Out
General Fund Electric Fund $ 3,051,692 General Fund Nonmajor governmental funds 10,109
3,061,801
Water Fund Nonmajor governmental funds $ 1,060
Electric Fund Nonmajor governmental funds $ 1,908
Nonmajor governmental funds General Fund $ 676,740 Nonmajor governmental funds Nonmajor governmental funds 74,440
$ 751,180
Amount
Transfers are used to move revenues from the fund that statute or budget requires to collect them to the fund that statute or budget requires to expend them.
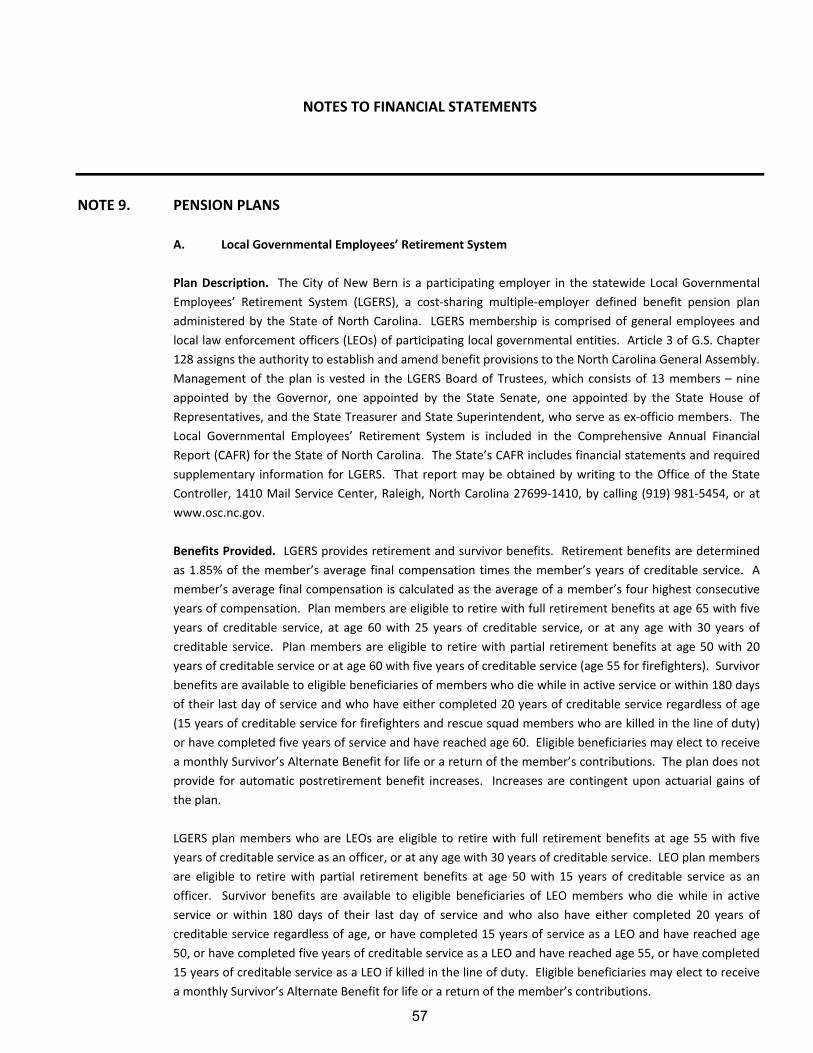
57
NOTES TO FINANCIAL STATEMENTS
NOTE 9. PENSION PLANS
A. Local Governmental Employees’ Retirement System
Plan Description. The City of New Bern is a participating employer in the statewide Local Governmental
Employees’ Retirement System (LGERS), a cost‐sharing multiple‐employer defined benefit pension plan
administered by the State of North Carolina. LGERS membership is comprised of general employees and
local law enforcement officers (LEOs) of participating local governmental entities. Article 3 of G.S. Chapter
128 assigns the authority to establish and amend benefit provisions to the North Carolina General Assembly.
Management of the plan is vested in the LGERS Board of Trustees, which consists of 13 members – nine
appointed by the Governor, one appointed by the State Senate, one appointed by the State House of
Representatives, and the State Treasurer and State Superintendent, who serve as ex‐officio members. The
Local Governmental Employees’ Retirement System is included in the Comprehensive Annual Financial
Report (CAFR) for the State of North Carolina. The State’s CAFR includes financial statements and required
supplementary information for LGERS. That report may be obtained by writing to the Office of the State
Controller, 1410 Mail Service Center, Raleigh, North Carolina 27699‐1410, by calling (919) 981‐5454, or at
www.osc.nc.gov.
Benefits Provided. LGERS provides retirement and survivor benefits. Retirement benefits are determined
as 1.85% of the member’s average final compensation times the member’s years of creditable service. A
member’s average final compensation is calculated as the average of a member’s four highest consecutive
years of compensation. Plan members are eligible to retire with full retirement benefits at age 65 with five
years of creditable service, at age 60 with 25 years of creditable service, or at any age with 30 years of
creditable service. Plan members are eligible to retire with partial retirement benefits at age 50 with 20
years of creditable service or at age 60 with five years of creditable service (age 55 for firefighters). Survivor
benefits are available to eligible beneficiaries of members who die while in active service or within 180 days
of their last day of service and who have either completed 20 years of creditable service regardless of age
(15 years of creditable service for firefighters and rescue squad members who are killed in the line of duty)
or have completed five years of service and have reached age 60. Eligible beneficiaries may elect to receive
a monthly Survivor’s Alternate Benefit for life or a return of the member’s contributions. The plan does not
provide for automatic postretirement benefit increases. Increases are contingent upon actuarial gains of
the plan.
LGERS plan members who are LEOs are eligible to retire with full retirement benefits at age 55 with five
years of creditable service as an officer, or at any age with 30 years of creditable service. LEO plan members
are eligible to retire with partial retirement benefits at age 50 with 15 years of creditable service as an
officer. Survivor benefits are available to eligible beneficiaries of LEO members who die while in active
service or within 180 days of their last day of service and who also have either completed 20 years of
creditable service regardless of age, or have completed 15 years of service as a LEO and have reached age
50, or have completed five years of creditable service as a LEO and have reached age 55, or have completed
15 years of creditable service as a LEO if killed in the line of duty. Eligible beneficiaries may elect to receive
a monthly Survivor’s Alternate Benefit for life or a return of the member’s contributions.

58
NOTES TO FINANCIAL STATEMENTS
NOTE 9. PENSION PLANS (CONTINUED)
A. Local Governmental Employees’ Retirement System (Continued)
Contributions. Contribution provisions are established by General Statute 128‐30 and may be amended
only by the North Carolina General Assembly. The City of New Bern employees are required to contribute
6% of their compensation. Employer contributions are actuarially determined and set annually by the
LGERS Board of Trustees. The City of New Bern’s contractually required contribution rate for the year ended
June 30, 2016, was 7.41% of compensation for law enforcement officers and 7.07% for general employees
and firefighters, actuarially determined as an amount that, when combined with employee contributions, is
expected to finance the costs of benefits earned by employees during the year. Contributions to the
pension plan from the City of New Bern were $1,419,969 for the year ended June 30, 2016.
Refunds of Contributions – City employees who have terminated service as a contributing member of
LGERS, may file an application for a refund of their contributions. By state law, refunds to members with at
least five years of service include 4% interest. State law requires a 60 day waiting period after service
termination before the refund may be paid. The acceptance of a refund payment cancels the individual’s
right to employer contributions or any other benefit provided by LGERS.
Pension Liabilities, Pension Expense, and Deferred Outflows of Resources and Deferred Inflows of
Resources Related to Pensions
At June 30, 2016, the City reported a liability of $1,647,657 for its proportionate share of the net pension
liability. The net pension liability was measured as of June 30, 2015. The total pension liability used to
calculate the net pension asset was determined by an actuarial valuation as of December 31, 2014. The
total pension liability was then rolled forward to the measurement date of June 30, 2015 utilizing update
procedures incorporating the actuarial assumptions. The City’s proportion of the net pension liability was
based on a projection of the City’s long‐term share of future payroll covered by the pension plan, relative to
the projected future payroll covered by the pension plan of all participating LGERS employers, actuarially
determined. At June 30, 2015, the City’s proportion was 0.36713%, which was a decrease of 0.00759% from
its proportion measured as of June 30, 2014.

59
NOTES TO FINANCIAL STATEMENTS
NOTE 9. PENSION PLANS (CONTINUED)
A. Local Governmental Employees’ Retirement System (Continued)
For the year ended June 30, 2016, the City recognized pension expense of $741,669. At June 30, 2016, the
City reported deferred outflows of resources and deferred inflows of resources related to pensions from the
following sources:
Deferred Outflows of
Resources
Deferred Inflows
of Resources
Differences between expected and actual experience ‐$ 387,296$ Net difference between projected and actual earnings on
pension plan investments ‐ 469,086 Changes in proportion and differences between City
contributions and proportionate share of contributions 36,686 87,312
City contributions subsequent to the measurement date 1,450,951 ‐
Total 1,487,637$ 943,694$
City contributions made subsequent to the measurement date of $1,450,951 are reported as deferred
outflows of resources and will be recognized as a decrease of the net pension liability in the year ended
June 30, 2017. Other amounts reported as deferred inflows of resources related to pensions will be
recognized in pension expense as follows:
Year ended June 30:2017 (557,152)$ 2018 (557,152) 2019 (556,682) 2020 763,978
(907,008)$
Actuarial Assumptions. The total pension liability in the December 31, 2014 actuarial valuation was
determined using the following actuarial assumptions, applied to all periods included in the measurement:
Inflation 3.0 percent
Salary increases 4.25 to 8.55 percent, including inflation and productivity
factor
Investment rate of return 7.25 percent, net of pension plan investment expense,
including inflation
The plan currently uses mortality tables that vary by age, gender, employee group (i.e. general, law
enforcement officer) and health status (i.e. disabled and healthy). The current mortality rates are based on
published tables and based on studies that cover significant portions of the U.S. population. The healthy
mortality rates also contain a provision to reflect future mortality improvements.

60
NOTES TO FINANCIAL STATEMENTS
NOTE 9. PENSION PLANS (CONTINUED)
A. Local Governmental Employees’ Retirement System (Continued)
The actuarial assumptions used in the December 31, 2014 valuation were based on the results of an
actuarial experience study for the period January 1, 2005 through December 31, 2009.
Future ad hoc COLA amounts are not considered to be substantively automatic and are therefore not
included in the measurement.
The projected long‐term investment returns and inflation assumptions are developed through review of
current and historical capital markets data, sell‐side investment research, consultant whitepapers, and
historical performance of investment strategies. Fixed income return projections reflect current yields
across the U.S. Treasury yield curve and market expectations of forward yields projected and interpolated
for multiple tenors and over multiple year horizons. Global public equity return projections are established
through analysis of the equity risk premium and the fixed income return projections. Other asset categories
and strategies’ return projections reflect the foregoing and historical data analysis. These projections are
combined to produce the long‐term expected rate of return by weighting the expected future real rates of
return by the target asset allocation percentage and by adding expected inflation. The target allocation and
best estimates of arithmetic real rates of return for each major asset class as of June 30, 2015 are
summarized in the following table:
Asset Class Target Allocation
Long‐Term Expected Real
Rate of ReturnFixed Income 29.0% 2.2%Global Equity 42.0% 5.8%Real Estate 8.0% 5.2%Alternatives 8.0% 9.8%Credit 7.0% 6.8%Inflation Protection 6.0% 3.4% Total 100%
The information above is based on 30 year expectations developed with the consulting actuary for the 2014
asset liability and investment policy study for the North Carolina Retirement Systems, including LGERS. The
long‐term nominal rates of return underlying the real rates of return are arithmetic annualized figures. The
real rates of return are calculated from nominal rates by multiplicatively subtracting a long‐term inflation
assumption of 3.00%. All rates of return and inflation are annualized.

61
NOTES TO FINANCIAL STATEMENTS
NOTE 9. PENSION PLANS (CONTINUED)
A. Local Governmental Employees’ Retirement System (Continued)
Discount rate. The discount rate used to measure the total pension liability was 7.25%. The projection of
cash flows used to determine the discount rate assumed that contributions from plan members will be
made at the current contribution rate and that contributions from employers will be made at statutorily
required rates, actuarially determined. Based on these assumptions, the pension plan’s fiduciary net
position was projected to be available to make all projected future benefit payments of the current plan
members. Therefore, the long‐term expected rate of return on pension plan investments was applied to all
periods of projected benefit payments to determine the total pension liability.
Sensitivity of the City’s proportionate share of the net pension liability to changes in the discount rate.
The following presents the City’s proportionate share of the net pension liability calculated using the
discount rate of 7.25 percent, as well as what the City’s proportionate share of the net pension asset or net
pension liability would be if it were calculated using a discount rate that is one percentage point lower (6.25
percent) or one percentage point higher (8.25 percent) than the current rate:
1% Decrease
(6.25%)
Discount Rate
(7.25%)
1% Increase
(8.25%)City's proportionate share of the net
pension liability (asset) 11,489,342$ 1,647,657$ (6,643,745)$
Pension plan fiduciary net position. Detailed information about the pension plan’s fiduciary net position is
available in the separately issued Comprehensive Annual Financial Report (CAFR) for the State of North
Carolina.

62
NOTES TO FINANCIAL STATEMENTS
NOTE 9. PENSION PLANS (CONTINUED)
B. Law Enforcement Officers Special Separation Allowance
Plan Description. The City of New Bern administers a public employee retirement system (the “Separation
Allowance”), a single employer defined benefit pension plan that provides retirement benefits to the City’s
qualified sworn law enforcement officers. The Separation Allowance is equal to .85 percent of the annual
equivalent of the base rate of compensation most recently applicable to the officer for each year of
creditable service. The retirement benefits are not subject to any increases in salary or retirement
allowances that may be authorized by the General Assembly. Article 12D of G.S. Chapter 143 assigns the
authority to establish and amend benefit provisions to the North Carolina General Assembly. A separate
report is not issued for the Plan.
All full time law enforcement officers of the City are covered by the Separation Allowance. At December 31,
2015, the date of the most recent actuarial valuation the Separation Allowance’s membership consisted of:
Retirees receiving benefits 10 Active plan members 76
Total 86
Basis of Accounting. The City has chosen to fund the Separation Allowance on a pay as you go basis.
Pension expenditures are made from the General Fund, which is maintained on the modified accrual basis of
accounting. Benefits and refunds are recognized when due and payable in accordance with the terms of the
plan.
The Separation Allowance has no assets accumulated in a trust that meets the following criteria which are
outlined in GASB Statements 67 and 68:
contributions to the pension plan and earnings on those contributions are irrevocable
pension plan assets are dedicated to providing benefits to plan members, and
pension plan assets are legally protected from the creditors or employers, nonemployer
contributing entities, the plan administrator, and plan members.
Method Used to Value Investments. No funds are set aside to pay benefits and administration costs. These
expenditures are paid as they come due.
Funding Policy ‐ The City is required by Article 12D of G.S. Chapter 143 to provide these retirement benefits
and has chosen to fund the benefit payments on a pay as you go basis through appropriations made in the
General Fund operating budget. The City’s obligation to contribute to this plan is established and may be
amended by the North Carolina General Assembly. There were no contributions made by employees.

63
NOTES TO FINANCIAL STATEMENTS
NOTE 9. PENSION PLANS (CONTINUED)
B. Law Enforcement Officers Special Separation Allowance (Continued)
The annual required contribution for the current year was determined as part of the December 31, 2014
actuarial valuation using the projected unit credit actuarial cost method. The study is performed bi‐
annually. The actuarial assumptions included: (a) 5.0% investment rate of return (net of administrative
expenses), and (b) projected salary increases of 4.25‐7.85% per year. Both (a) and (b) included an inflation
component of 3.0%. The assumptions did not include postemployment benefit increases. The unfunded
liability is amortized using the level dollar (closed) method, with a remaining amortization period of 16
years.
Annual Pension Cost and Net Pension Obligation. The City’s annual pension cost and net pension
obligation to the Separation Allowance for the current year were as follows:
Annual required contribution $ 245,600 Interest on net pension obligation 107,823 Adjustments to annual required contribution (189,501) Annual pension cost 163,922 Contributions made (100,608) Increase in net pension obligation 63,314 Net pension obligation, beginning of year 2,156,456 Net pension obligation, end of year $ 2,219,770
For The PlanYear EndingJune 30, 2016
Fiscal Year Annual Actual Percentage of Net
Ended Pension Pension APC Pension
June 30, Cost (APC) Contribution Contributed Obligation
2016 $ 163,922 $ 100,608 61.4 % $ 2,219,770
2015 152,995 100,608 65.8 2,156,456
2014 114,287 100,607 88.0 2,104,069
As of December 31, 2015, the most recent actuarial valuation date, the plan was not funded. The actuarial
accrued liability for benefits and the unfunded actuarial accrued liability (UAAL) was $2,611,191. The
covered payroll (annual payroll of active employees covered by the plan) was $4,334,746, and the ratio of
the UAAL to the covered payroll was 60.24 percent.
The schedule of funding progress, presented as required supplementary information following the notes to
the financial statements, presents multi‐year trend information about whether the actuarial value of plan
assets are increasing or decreasing over time relative to the actuarial accrued liability for benefits.
64
NOTES TO FINANCIAL STATEMENTS
NOTE 9. PENSION PLANS (CONTINUED)
B. Law Enforcement Officers Special Separation Allowance (Continued)
Actuarial valuations involve estimates of the value of reported amounts and assumptions about the
probability of events far into the future, and actuarially determined amounts are subject to continual
revision as results are compared to past expectations and new estimates are made about the future.
Actuarial calculations reflect a long‐term perspective. Calculations are based on the substantive plan in
effect as of December 31, 2015 and the current sharing pattern of costs between employer and employee.
C. Supplemental Retirement Income Plan for Law Enforcement Officers
Plan Description. The City contributes to the Supplemental Retirement Income Plan (“Plan”), a defined
contribution pension plan administered by the Department of State Treasurer and a Board of Trustees. The
Plan provides retirement benefits to law enforcement officers employed by the City. Article 5 of G.S.
Chapter 135 assigns the authority to establish and amend benefit provisions to the North Carolina General
Assembly. The Supplemental Retirement Income Plan for Law Enforcement Officers is included in the
Comprehensive Annual Financial Report (CAFR) for the state of North Carolina. The State’s CAFR includes
the pension trust fund financial statements for the Internal Revenue Code Section 401(k) plan that includes
the Supplemental Retirement Income Plan for Law Enforcement Officers. That report may be obtained by
writing to the Office of the State Controller, 1410 Mail Service Center, Raleigh, North Carolina 27699‐1410,
or by calling (919) 981‐5454.
Funding Policy. Article 12E of G.S. Chapter 143 requires the City to contribute, each month, an amount
equal to five percent of each officer's salary, and all amounts contributed are vested immediately. Also, the
law enforcement officers may make voluntary contributions to the plan. Contributions for the year ended
June 30, 2016 were $359,634 which consisted of $210,927 from the City and $148,707 from the law
enforcement officers.
D. Supplemental Retirement Income Plan for Employees Other than Law Enforcement
Officers
All other permanent full‐time employees of the City (excluding law enforcement officers) also participate in
the Supplemental Retirement income Plan, a defined contribution pension plan as described above. The
Plan is a defined contribution pension plan administered by the Department of State Treasurer and a Board
of Trustees. The City contributes each month an amount equal to 3% of each employee’s salary, and all
amounts contributed are vested immediately. Also, these employees may make voluntary contributions to
the plan. Contributions for the year ended June 30, 2016 were $1,199,630 which consisted of $798,747
from the City and $400,883 from the employees.

65
NOTES TO FINANCIAL STATEMENTS
NOTE 10. OTHER POSTEMPLOYMENT BENEFITS
Plan Description
Under the terms of a City resolution, the City administers a single‐employer defined benefit Healthcare
Benefits Plan (the “HCB Plan”). The City pays 100 percent of the cost for “maximum retirees” of the City,
while “other retirees” are eligible to enroll in the City’s insurance plan, but must pay the full cost. Maximum
Retirees are defined as meeting one of the following criteria (1) employee with thirty (30) or more years of
service with at least fifteen (15) of those years with the City; (2) employee with twenty‐seven (27) or more
years of service and three (3) years of prior military service with at least fifteen (15) of those years with the
City. To qualify as an “other retiree,” employees must meet one of the two following (1) have twenty‐five
(25) to twenty‐nine (29) years of service with at least ten (10) with the City or (2) twenty (20) or more years
of qualified service with at least ten (10) years with the City. Coverage for all retirees who are eligible for
Medicare will be transferred to a Medicare Supplemental plan after qualifying for Medicare. The City’s
Board of Aldermen established and may amend the benefit provisions. A separate report was not issued for
the plan.
Membership of the HCB Plan consisted of the following at December 31, 2014, the date of the latest
actuarial valuation:
Active participants 436Retirees and beneficiaries currently receiving benefits 58
Total 494
The following is a schedule of funding progress:
(b) (b‐a) [(b‐a)/c]
(a) Actuarial Unfunded (a/b) (c) UAAL as a
Valuation Actuarial Value Accrued Actuarial Accrued Funded Covered Percentage ofDate of Assets Liability (AAL) Liability (UAAL) Ratio Payroll Covered Payroll
12/31/14 $ ‐ $ 21,178,934 $ 21,178,934 0% $ 20,698,206 102.3%
The above schedule of funding progress serves as a surrogate for the funded status and the funding
progress of the Plan. See required supplementary information for a history of funding progress which
presents a multi‐year trend about whether the actuarial value of plan assets is increasing or decreasing over
time relative to the actuarial accrued liability for benefits.

66
NOTES TO FINANCIAL STATEMENTS
NOTE 10. OTHER POSTEMPLOYMENT BENEFITS (CONTINUED) Funding Policy
The City pays the full cost of coverage for the healthcare benefits paid to qualified retirees under a City
resolution that can be amended by the City’s Board of Alderman. The City’s Plan members pay the full cost
for spouse and dependent coverage. The City has chosen to fund the healthcare benefits on a pay as you go
basis.
The current annual required contribution (ARC) rate is 7.85% of annual covered payroll. For the current
year, the City contributed $791,165 or 3.8% of annual covered payroll. The City is self‐insured for
healthcare coverage and purchases catastrophic loss coverage through private insurers. The City’s required
contributions, under a City resolution, for employees not engaged in law enforcement, and for law
enforcement officers represented 1.6% and 0.9% of covered payroll, respectively. For the fiscal year ended
June 30, 2016, the total retiree contributions for health insurance were $95,664.
Employer Contributions
Fiscal Year Annual Actual Percentage of Net
Ended OPEB OPEB AOPEBC OPEB
June 30, Cost (AOPEBC) Contribution Contributed Obligation
2016 $ 1,733,453 $ 791,165 45.6 % $ 7,499,964
2015 1,535,705 610,051 39.7 6,557,676
2014 1,481,201 708,755 47.9 5,632,022
Annual OPEB Cost and Net OPEB Obligation
Annual required contribution $ 1,721,730 Interest on OPEB obligation 262,307 Adjustment to ARC (250,584) Annual OPEB Cost 1,733,453
Contributions (791,165) Increase(decrease) in OPEB obligation 942,288 Net OPEB obligation, beginning of year 6,557,676 Net OPEB obligation, end of year $ 7,499,964
June 30, 2016

67
NOTES TO FINANCIAL STATEMENTS
NOTE 10. OTHER POSTEMPLOYMENT BENEFITS (CONTINUED)
Assumptions
Actuarial valuations involve estimates of the value of reported amounts and assumptions about the
probability of events far into the future, and actuarially determined amounts are subject to continual
revision as results are compared to past expectations and new estimates are made about the future.
Actuarial calculations reflect a long‐term perspective. Calculations are based on the substantive plan in
effect as of December 31, 2014. The assumptions used in the December 31, 2014 actuarial valuation are as
follows:
Actuarial Cost Method: Projected Unit Credit
Discount Rate: 4%
Healthcare Cost Trend Rate: 7.5% ‐ 5%, Ultimate Trend in 2020
Amortization Method: Level Percentage of Pay, Open
Remaining Amortization Period: 30 years
Inflation Rate: 3%
NOTE 11. RISK MANAGEMENT
The City is exposed to various risks of loss related to torts; theft of, damage to, and destruction of assets,
errors and omissions, injuries to employees, and natural disasters. To mitigate the financial impact of any
losses, the City has established a program to manage its financial risks through a self‐funded arrangement in
combination with purchased insurance.
The City’s Internal Service Fund was established to account for an employee self‐insurance health benefit
program. The purpose of the fund is to pay medical claims of City employees and their covered dependents
and minimize the total cost of annual medical insurance to the municipality. Funding is provided by
employee contributions and charges to the various funds of the City based upon estimated claim and
employee participation. Expected claims are determined annually by the reinsurance carrier. The City carries
aggregate stop loss insurance coverage of 125% of annual expected paid claims and individual stop loss
coverage of $100,000 per covered individual and an aggregating specific deductible of $250,000 through the
plan administrator utilizing a reinsurance carrier. The City has recognized a provision for claims incurred, but
not reported, in the accompanying financial statements. This provision is estimated based upon actuarial
claims history utilizing a two month lag on outstanding claims.
The City is self‐insured for workers’ compensation claims up to $600,000 for all employees. The City has
reinsurance through a commercial company for single occurrence claims up to $1,000,000. The City also
purchased an Occupational Accident Buffer Layer Insurance Policy which covers all employees at $400,000
(attachment point) with a coverage limit of $200,000. The City’s Internal Service Fund is also used to
account for this program.

68
NOTES TO FINANCIAL STATEMENTS
NOTE 11. RISK MANAGEMENT (CONTINUED)
The City also purchases commercial insurance to protect against claims for property, general liability, auto
liability, public officials, and employee bonds. Claims have not exceeded coverage in the past three years.
There have been no significant reductions in insurance coverage in the past three years.
The City carries $1,000,000 of flood insurance, subject to a $50,000 deductible, included in its commercial
property coverage. The City does not have any property that has been mapped and designated an “A” area
(an area close to a river, lake, or stream) by the Federal Emergency Management Agency.
In accordance with G.S. 159‐29, the City’s employees that have access to $100 or more at any given time of
the City’s funds are performance bonded through a commercial surety bond. The Finance Officer and Tax
Collector are each individually bonded for $100,000 each. The remaining employees that have access to
funds are bonded under a blanket bond for $250,000.
For the Employee Benefit Insurance Internal Service Fund, a total of $5,986,622 in claims and changes in
estimates were incurred for benefits during the year ended June 30, 2016. Changes in the fund’s claims
liability amounts in the years ended June 30, 2016 and 2015, were as follows:
Beginning of Current Year End of
Fiscal Year Claims Claims and Changes Claims Year Claims
Year Liability in Estimates Paid Liability
2016 694,596$ 5,340,614$ 5,583,944$ 451,266$ 2015 658,425 4,722,111 4,685,940 694,596
Beginning of Current Year End of
Fiscal Year Claims Claims and Changes Claims Year Claims
Year Liability in Estimates Paid Liability
2016 ‐$ 646,008$ 310,468$ 335,540$ 2015 ‐ 785,526 785,526 ‐
EMPLOYEE HEALTH INSURANCE CLAIMS PAYABLE
WORKERS COMPENSATION CLAIMS PAYABLE

69
NOTES TO FINANCIAL STATEMENTS
NOTE 12. COMMITMENTS AND CONTINGENT LIABILITIES
Litigation:
The City is a defendant in various lawsuits. Although the outcome of these lawsuits is not presently
determinable, in the opinion of management and legal counsel, the resolution of these matters will not
have a material adverse effect on the financial condition of the City.
Grant Contingencies:
The City has received federal and state grants for specific purposes that are subject to review and audit by
the grantor agencies. Such audits could lead to the disallowance of certain expenditures previously
reimbursed by those agencies. Based upon prior experience, management of the City believes such
disallowances, if any, will not be significant.
Construction Commitments:
The City has active construction projects as of June 30, 2016. At year‐end, the City has contractual
commitments on uncompleted contracts of approximately $1,931,149.
NOTE 13. JOINT VENTURES, JOINTLY GOVERNED ORGANIZATIONS, AND RELATED ORGANIZATIONS
Joint Venture:
The City participates in a joint venture with Craven County to operate the New Bern/Craven County Library.
The City appoints five members of the ten‐member board. The City has an ongoing financial responsibility
for the joint venture because the Library’s continued existence depends on the participating governments’
continued funding. None of the participating governments have any equity interest in the Library, so no
equity interest has been reflected in the financial statements at June 30, 2016. The City contributed
$75,000 to the library during the fiscal year ended June 30, 2016.
Jointly Governed Organization:
Eastern Carolina Council – The City, in conjunction with nine counties and twenty‐eight other municipalities,
established the Eastern Carolina Council (the “Council”). The participating governments established the
Council to coordinate various funding received from federal and state agencies. Each participating
government appoints one member to the Council’s governing board. The City paid membership and
administrative fees of $10,598 to the Council during the fiscal year ended June 30, 2016.
70
NOTES TO FINANCIAL STATEMENTS
NOTE 13. JOINT VENTURES, JOINTLY GOVERNED ORGANIZATIONS, AND RELATED ORGANIZATIONS (CONTINUED)
Jointly Governed Organizations (Continued):
North Carolina Eastern Municipal Power Agency (“NCEMPA”) – NCEMPA is a joint agency formed by 32
municipalities, including the City, and organized and existing pursuant to Chapter 159B of the General
Statutes of North Carolina. The NCEMPA Board elects its own officers and is responsible for the selection of
management to run the daily operations of NCEMPA. NCEMPA Is responsible for budgeting and receiving its
financing. The City has made investment in this joint venture.
On July 31, 2015 NCEMPA completed the sale of most of its electricity generating assets to Duke Energy.
These proceeds were used to defease NCEMPA’s outstanding revenue bonds. NCEMPA entered into
contractual arrangements with its member cities and Duke Energy. Under these arrangements, NCEMPA
will supply wholesale power to its members and will purchase this power from Duke Energy. In addition to
payments made for electric power, NCEMPA members will make payments for their share of the debt
service on the NCEMPA’s new revenue bonds. The City’s purchases of power for the fiscal year ended June
30, 2016 were $35,729,212.
Related Organizations
New Bern Housing Authority – The Board of the New Bern Housing Authority (“Hosing Authority”) is
appointed by the Mayor of the City. The City is accountable for the Housing Authority because it appoints
the governing board; however, the City is not financially accountable for the Housing Authority.
Friends of New Bern Firemen’s Museum, Inc. – The Board of Directors of the Friends of New Bern Firemen’s
Museum (“Museum”) is appointed by the Board of Aldermen of the City. The City is accountable for the
Museum because it appoints the governing board; however, the City is not financially accountable for the
Museum.

71
NOTES TO FINANCIAL STATEMENTS
NOTE 14. RESTATEMENTS
During the fiscal year ended June 30, 2016 the City determined a restatement was necessary to correct the
beginning net position of the governmental activities and business‐type activities as it relates to the
reporting of the internal service funds. In prior years, the City was not allocating the net change in net
position of the internal service funds appropriately in the government wide statement of activities. Below is
the effect of the restatements.
Net position, as previously reported $ 52,077,953 $ 122,722,007
Change in net position for allocation of accumulated
net position of the internal service funds (1,758,260) 1,758,260
Net position, beginning balance, restated $ 50,319,693 $ 124,480,267
Governemental
Activities
Business‐type
Activities

REQUIRED SUPPLEMENTARY INFORMATION

REQUIRED SUPPLEMENTARY INFORMATION
SCHEDULE OF LAW ENFORCEMENT OFFICERS' SPECIAL SEPARATION ALLOWANCE
SCHEDULE OF FUNDING PROGRESS
(b‐a)
(b) Unfunded [(b‐a)/c]
(a) Actuarial Actuarial UAAL as a
Actuarial Actuarial Accrued Accrued (a/b) (c) Percentage
Valuation Value of Liability Liability Funded Covered of Covered
Date Assets (AAL) (UAAL) Ratio Payroll Payroll
12/31/13 $ ‐ $ 1,705,430 $ 1,705,430 0.0% $ 3,933,124 43.36%
12/31/14 ‐ 1,809,886 1,809,886 0.0% 4,105,427 44.09%
12/31/15 ‐ 2,611,191 2,611,191 0.0% 4,334,746 60.24%
Note: See assumptions used for the Schedule of Funding Progress in Note 9 to the financial statements.
CITY OF NEW BERN, NORTH CAROLINA
72

REQUIRED SUPPLEMENTARY INFORMATION
OTHER POSTEMPLOYMENT BENEFITS
SCHEDULE OF FUNDING PROGRESS
(b‐a)
(b) Unfunded [(b‐a)/c]
(a) Actuarial Actuarial UAAL as a
Actuarial Actuarial Accrued Accrued (a/b) (c) Percentage
Valuation Value of Liability Liability Funded Covered of Covered
Date Assets (AAL) (UAAL) Ratio Payroll Payroll
12/31/14 $ ‐ $ 21,178,934 $ 21,178,934 0.0% $ 20,698,206 102.32%
12/31/12 ‐ 17,801,370 17,801,370 0.0% 19,485,653 91.36%
12/31/10 ‐ 15,666,249 15,666,249 0.0% 20,111,064 77.90%
Note: See assumptions used for the Schedule of Funding Progress in Note 10 to the financial statements.
CITY OF NEW BERN, NORTH CAROLINA
73

REQUIRED SUPPLEMENTARY INFORMATION
CITY'S PROPORTIONATE SHARE OF NET PENSION LIABILITY (ASSET)
LAST THREE FISCAL YEARS*
LOCAL GOVERNMENTAL EMPLOYEES' RETIREMENT SYSTEM
2016 2015 2014City's proportion of the net pension liability (asset) (%) 0.36713% (0.37472%) 0.36820%
City's proportion of the net pension liability (asset) ($) 1,647,657$ (2,209,896)$ 4,438,224$
City's covered‐employee payroll 20,791,805$ 20,561,521$ 19,998,382$
City's proportionate share of the net pension liability (asset) as a percentage of its covered‐employee payroll 7.92% ( 10.75%) 22.19%
Plan fiduciary net position as a percentage of the total pension liability 98.09% 102.64% 94.35%
* The amounts presented for each fiscal year were determined as of the prior fiscal year ending June 30.
Note: Schedule is intended to show information for the last 10 fiscal years. Additional years will be displayed as they become available.
CITY OF NEW BERN, NORTH CAROLINA
74

2016 2015 2014
Contractually required contribution 1,419,969$ 1,486,944$ 1,461,830$
Contributions in relation to the contractually required contribution 1,419,969 1,486,944 1,461,830
Contribution deficiency (excess) ‐$ ‐$ ‐$
City's covered‐employee payroll 20,102,718$ 20,791,805$ 20,561,521$
Contributions as a percentage of covered‐employee payroll 7.06% 7.15% 7.11%
CITY OF NEW BERN, NORTH CAROLINA
SCHEDULE OF CONTRIBUTIONS
REQUIRED SUPPLEMENTARY INFORMATION
LAST THREE FISCAL YEARS
LOCAL GOVERNMENTAL EMPLOYEES' RETIREMENT SYSTEM
75

NOTES TO REQUIRED SUPPLEMENTARY INFORMATION
FOR THE FISCAL YEAR ENDED JUNE 30, 2016
Valuation date December 31, 2014
Actuarial cost method Frozen Entry age
Amortization method Level percentage of payroll, closed
Remaining amortization period 9 years
Asset valuation method 20% of market value plus 80% of expected actuarial value
(not greater than 120% of market value and not less than 80% of market value)
Inflation rate 3.00%
Salary increases 4.25 – 8.55%, including inflation
Investment rate of return 7.25%, net of pension plan investment
expense, including inflation
Method and assumptions used in calculations of actuarially determined contributions : The actuarially determined contribution
rates in the schedule of contributions are calculated as of December 31, one year prior to the end of the fiscal year in which
contributions are reported. The following actuarial methods and assumptions were used to determine the contractually required
contributions for year ended June 30, 2016 reported in that schedule:
CITY OF NEW BERN, NORTH CAROLINA
76

NONMAJOR GOVERNMENTAL FUNDS
Special Revenue Funds
Community Development Fund – is established to account for United States Department of Housing and Urban
Development (HUD) block grant and home program grant proceeds allocated to the City for community development
programs.
Emergency Telephone System Fund – is used to account for funds for the City’s 911 emergency telephone system.
Police Special Revenue Fund – is used to account for funds utilized for the investigation and mitigation of drug crime in the
City.
Grants Special Revenue Fund – accounts for the receipt and disbursement of Federal and State grants, excluding those for
which it may be deemed necessary for a separate fund be established due to the size or nature of the grant.
Glenburnie Road Multi‐Use Path Project Fund – is used to account for the revenues and expenditures associated with the
federal bicycle and pedestrian transportation engagement program grant.
Public Private Partnership Fund – is used to account for revenues and expenditures of special projects that may arise in
keeping with the City’s strategic goals and objectives.
FEMA Hurricane Irene Fund – is used to account for the revenues and expenditures associated with Federal disaster and
funding received subsequent to Hurricane Irene.
2012 CDBG NC Catalyst Fund – is used to account for the revenues and expenditures associated with the 2012 CDBG
Catalyst Grant.
Metropolitan Planning Organization (MPO) Plan Fund – is used to account for the revenues and expenditures associated
with the MPO Grant.
Entitlement Cities CDBG Program Fund – is used to account for the revenues and expenditures associated with the
Entitlement Cities CDBG Grant.
Neuse Boulevard Phase II Project Fund – is used to account for the revenues and expenditures associated with the federal
bicycle and pedestrian transportation engagement program grant.
2014 Bulletproof Vest Partnership Program Fund – is used to account for the revenues and expenditures associated with
the 2014 Bullet Proof Vest Partnership Grant.
Equitable Sharing U.S. Department of Justice Fund – is used to account for the receipt and disbursement of the restricted
State and Federal joint seizure funds received by the City’s police department from the U.S. Department of Justice.

NONMAJOR GOVERNMENTAL FUNDS
Capital Projects Funds
Radio System Equipment Fund – is used to account for revenues and expenditures for the Radio System Equipment Project.
General Capital Projects Fund – is used to account for revenues and expenditures of various capital projects for the benefit
of the City.
IT Network Merger Fund – is used to account for revenues and expenditures for the IT Network Merger project.

ASSETS
Cash and cash equivalents $ 18,971 $ 158,735 $ 6,388 $ 116,802 $ ‐
Accounts receivable, net 8,146 25,946 ‐ ‐ ‐
Due from other governments ‐ ‐ ‐ ‐ 454,247
Total assets $ 27,117 $ 184,681 $ 6,388 $ 116,802 $ 454,247
LIABILITIES, DEFERRED INFLOWS OF
RESOURCES, AND FUND BALANCES
LIABILITIES
Accounts payable and accrued liabilities $ ‐ $ 2,773 $ 511 $ ‐ $ 27,159
Due to other funds ‐ ‐ ‐ ‐ 427,089
Total liabilities ‐ 2,773 511 ‐ 454,248
DEFERRED INFLOWS OF RESOURCES
Unavailable revenues ‐ intergovernmental ‐ ‐ ‐ ‐ 454,247
Total deferred inflows of resources ‐ ‐ ‐ ‐ 454,247
FUND BALANCES
Restricted:
Stabilization by State Statute 8,146 25,946 ‐ ‐ ‐
Public safety ‐ 155,962 5,877 ‐ ‐
Economic and physical development 18,971 ‐ ‐ 116,802 ‐
Assigned:
Capital projects ‐ ‐ ‐ ‐ ‐
Unassigned ‐ ‐ ‐ ‐ (454,248)
Total fund balances (deficit) 27,117 181,908 5,877 116,802 (454,248)
Total liabilities, deferred inflows
of resources, and fund balances $ 27,117 $ 184,681 $ 6,388 $ 116,802 $ 454,247
Community
Development
Glenburnie Road
Multi‐use Path ProjectTelephone System
Police
Special Revenue
Grants
Special Revenue
CITY OF NEW BERN, NORTH CAROLINA
COMBINING BALANCE SHEET
NONMAJOR GOVERNMENTAL FUNDS
JUNE 30, 2016
Special Revenue Funds
Emergency
77
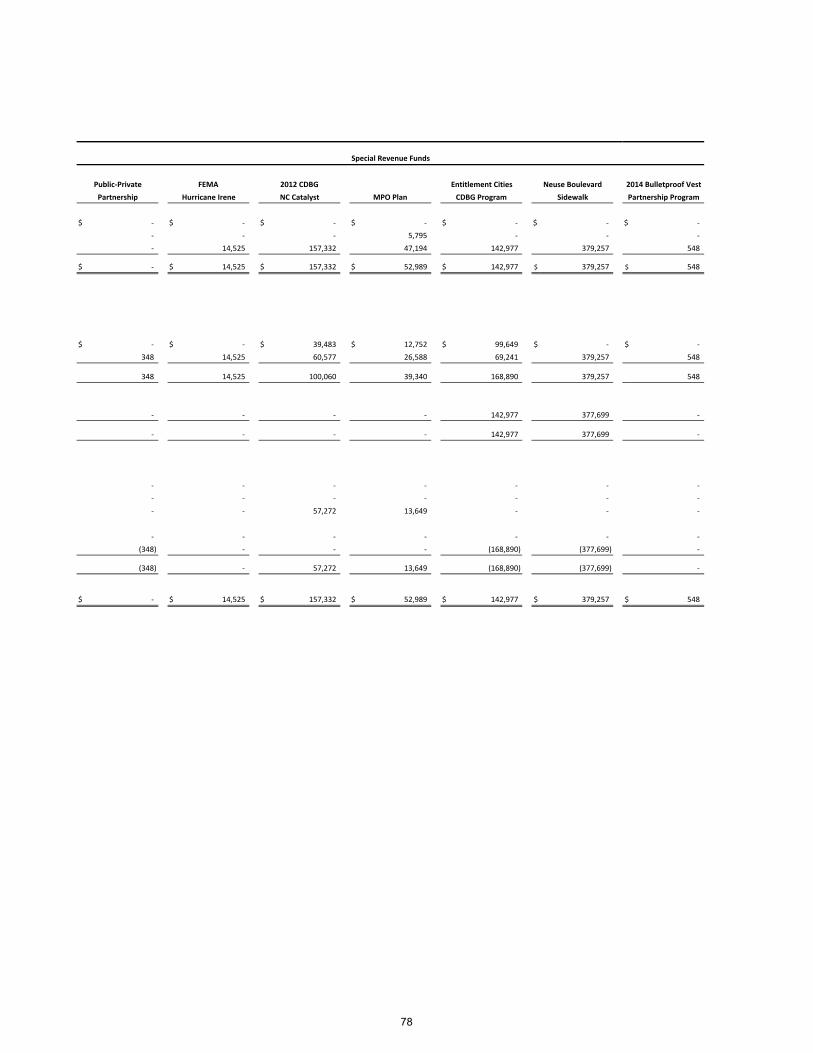
$ ‐ $ ‐ $ ‐ $ ‐ $ ‐ $ ‐ $ ‐
‐ ‐ ‐ 5,795 ‐ ‐ ‐
‐ 14,525 157,332 47,194 142,977 379,257 548
$ ‐ $ 14,525 $ 157,332 $ 52,989 $ 142,977 $ 379,257 $ 548
$ ‐ $ ‐ $ 39,483 $ 12,752 $ 99,649 $ ‐ $ ‐
348 14,525 60,577 26,588 69,241 379,257 548
348 14,525 100,060 39,340 168,890 379,257 548
‐ ‐ ‐ ‐ 142,977 377,699 ‐
‐ ‐ ‐ ‐ 142,977 377,699 ‐
‐ ‐ ‐ ‐ ‐ ‐ ‐
‐ ‐ ‐ ‐ ‐ ‐ ‐
‐ ‐ 57,272 13,649 ‐ ‐ ‐
‐ ‐ ‐ ‐ ‐ ‐ ‐
(348) ‐ ‐ ‐ (168,890) (377,699) ‐
(348) ‐ 57,272 13,649 (168,890) (377,699) ‐
$ ‐ $ 14,525 $ 157,332 $ 52,989 $ 142,977 $ 379,257 $ 548
Public‐Private
Partnership MPO Plan Sidewalk
FEMA Neuse Boulevard
Hurricane Irene
2012 CDBG
NC Catalyst
Entitlement Cities
CDBG Program Partnership Program
2014 Bulletproof Vest
Special Revenue Funds
78
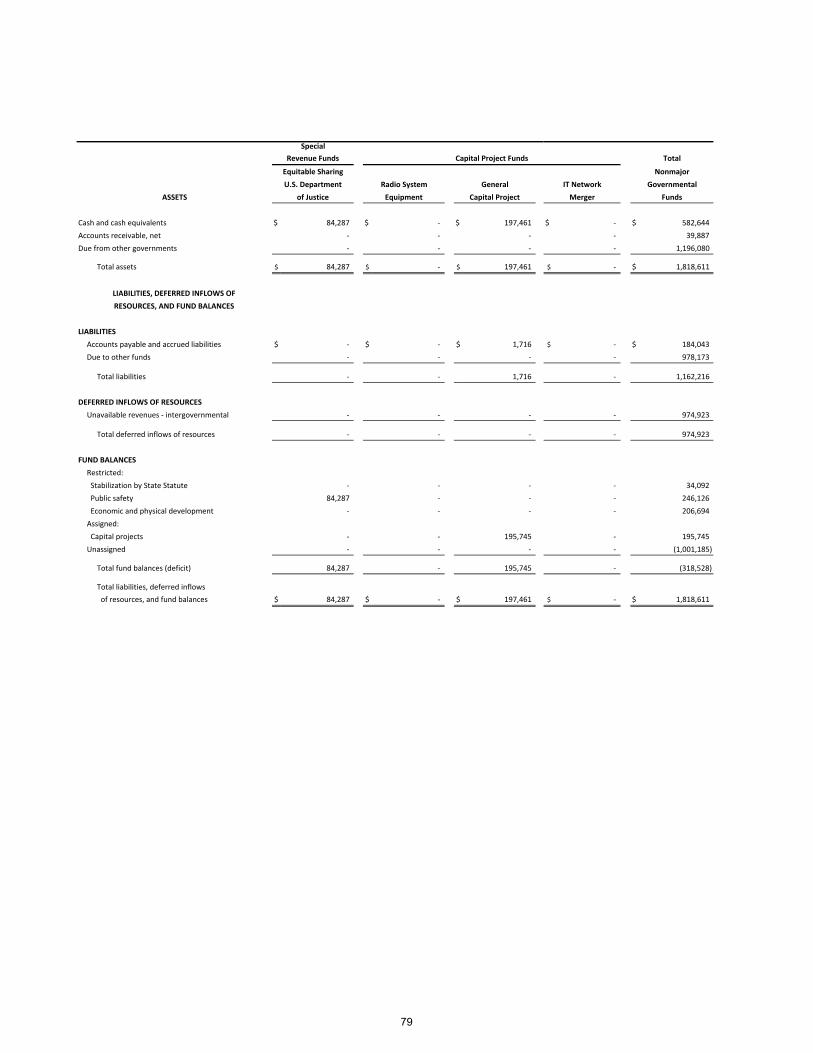
Total
Nonmajor
Governmental
ASSETS Funds
Cash and cash equivalents $ 84,287 $ ‐ $ 197,461 $ ‐ $ 582,644
Accounts receivable, net ‐ ‐ ‐ ‐ 39,887
Due from other governments ‐ ‐ ‐ ‐ 1,196,080
Total assets $ 84,287 $ ‐ $ 197,461 $ ‐ $ 1,818,611
LIABILITIES, DEFERRED INFLOWS OF
RESOURCES, AND FUND BALANCES
LIABILITIES
Accounts payable and accrued liabilities $ ‐ $ ‐ $ 1,716 $ ‐ $ 184,043
Due to other funds ‐ ‐ ‐ ‐ 978,173
Total liabilities ‐ ‐ 1,716 ‐ 1,162,216
DEFERRED INFLOWS OF RESOURCES
Unavailable revenues ‐ intergovernmental ‐ ‐ ‐ ‐ 974,923
Total deferred inflows of resources ‐ ‐ ‐ ‐ 974,923
FUND BALANCES
Restricted:
Stabilization by State Statute ‐ ‐ ‐ ‐ 34,092
Public safety 84,287 ‐ ‐ ‐ 246,126
Economic and physical development ‐ ‐ ‐ ‐ 206,694
Assigned:
Capital projects ‐ ‐ 195,745 ‐ 195,745
Unassigned ‐ ‐ ‐ ‐ (1,001,185)
Total fund balances (deficit) 84,287 ‐ 195,745 ‐ (318,528)
Total liabilities, deferred inflows
of resources, and fund balances $ 84,287 $ ‐ $ 197,461 $ ‐ $ 1,818,611
Equitable Sharing
U.S. Department
of Justice
Revenue Funds
Special
IT NetworkGeneral
Equipment MergerCapital Project
Capital Project Funds
Radio System
79

REVENUES
Restricted intergovernmental $ 8,146 $ 311,354 $ 12,952 $ 98,480 $ 3,519
Investment earnings 22 165 111 ‐ ‐
Total revenues 8,168 311,519 13,063 98,480 3,519
EXPENDITURES
General government ‐ ‐ ‐ ‐ ‐
Cultural and recreational ‐ ‐ ‐ 2,256 ‐
Public safety ‐ 299,462 56,056 50,385 ‐
Economic and physical development 1,500 ‐ ‐ 36,025 457,767
Total expenditures 1,500 299,462 56,056 88,666 457,767
Excess (deficiency) of revenues
over expenditures 6,668 12,057 (42,993) 9,814 (454,248)
OTHER FINANCING SOURCES (USES)
Transfers in ‐ ‐ ‐ ‐ ‐
Transfers out ‐ ‐ (74,440) ‐ ‐
Total other financing sources (uses) ‐ ‐ (74,440) ‐ ‐
Net change in fund balances 6,668 12,057 (117,433) 9,814 (454,248)
FUND BALANCES (DEFICIT), beginning of year 20,449 169,851 123,310 106,988 ‐
FUND BALANCES (DEFICIT), end of year $ 27,117 $ 181,908 $ 5,877 $ 116,802 $ (454,248)
CITY OF NEW BERN, NORTH CAROLINA
COMBINING STATEMENT OF REVENUES, EXPENDITURES, AND
CHANGES IN FUND BALANCES
NONMAJOR GOVERNMENTAL FUNDS
FOR THE YEAR ENDED JUNE 30, 2016
Special Revenue Funds
Special Revenue Special Revenue Multi‐use Path Project
Emergency Police Grants Glenburnie Road
Telephone System
Community
Development
80
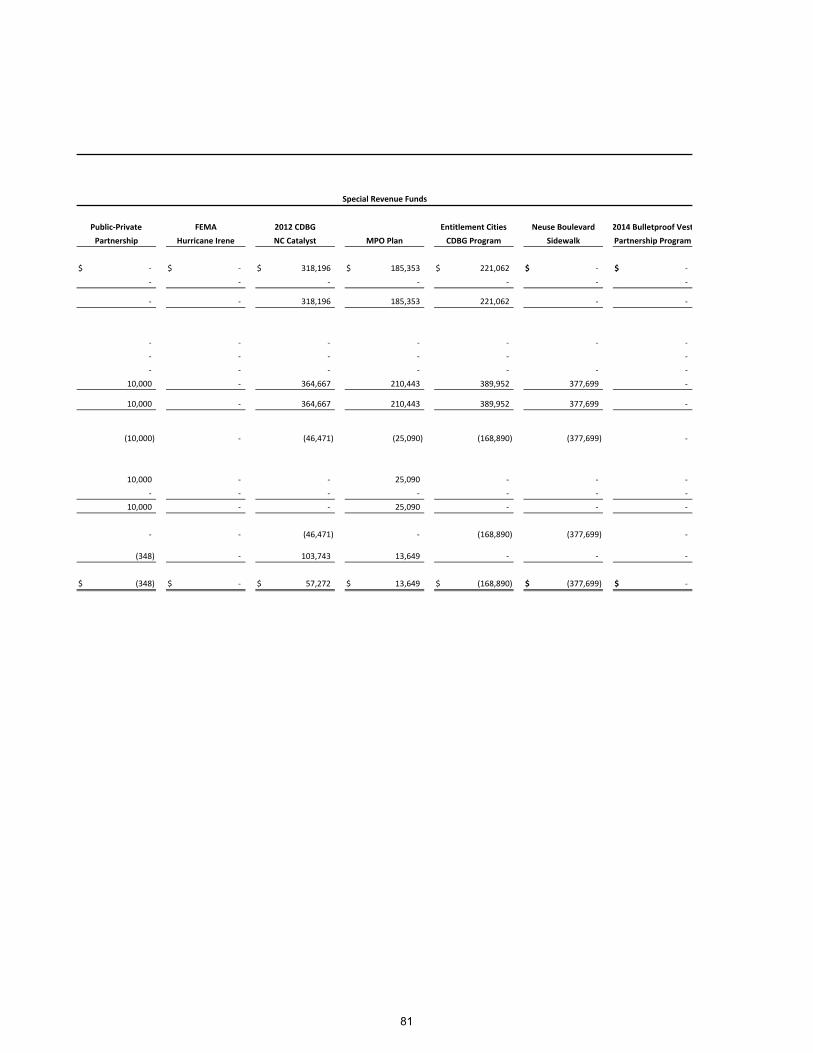
$ ‐ $ ‐ $ 318,196 $ 185,353 $ 221,062 $ ‐ $ ‐
‐ ‐ ‐ ‐ ‐ ‐ ‐
‐ ‐ 318,196 185,353 221,062 ‐ ‐
‐ ‐ ‐ ‐ ‐ ‐ ‐
‐ ‐ ‐ ‐ ‐ ‐
‐ ‐ ‐ ‐ ‐ ‐ ‐
10,000 ‐ 364,667 210,443 389,952 377,699 ‐
10,000 ‐ 364,667 210,443 389,952 377,699 ‐
(10,000) ‐ (46,471) (25,090) (168,890) (377,699) ‐
10,000 ‐ ‐ 25,090 ‐ ‐ ‐
‐ ‐ ‐ ‐ ‐ ‐ ‐
10,000 ‐ ‐ 25,090 ‐ ‐ ‐
‐ ‐ (46,471) ‐ (168,890) (377,699) ‐
(348) ‐ 103,743 13,649 ‐ ‐ ‐
$ (348) $ ‐ $ 57,272 $ 13,649 $ (168,890) $ (377,699) $ ‐
Special Revenue Funds
CDBG Program Sidewalk
Entitlement Cities Neuse Boulevard2012 CDBG
Partnership Partnership Program
2014 Bulletproof Vest
NC Catalyst MPO Plan
Public‐Private FEMA
Hurricane Irene
81

Total
Nonmajor
Governmental
Funds
REVENUES
Restricted intergovernmental $ 26,017 $ ‐ $ ‐ $ ‐ $ 1,185,079
Investment earnings 17 ‐ ‐ ‐ 315
Total revenues 26,034 ‐ ‐ ‐ 1,185,394
EXPENDITURES
General government ‐ ‐ 201,455 ‐ 201,455
Cultural and recreational ‐ ‐ ‐ ‐ 2,256
Public safety 16,187 ‐ ‐ ‐ 422,090
Economic and physical development ‐ ‐ ‐ 147,569 1,995,622
Total expenditures 16,187 ‐ 201,455 147,569 2,621,423
Excess (deficiency) of revenues
over expenditures 9,847 ‐ (201,455) (147,569) (1,436,029)
OTHER FINANCING SOURCES (USES)
Transfers in 74,440 ‐ 225,000 416,650 751,180
Transfers out ‐ (13,077) ‐ ‐ (87,517)
Total other financing sources (uses) 74,440 (13,077) 225,000 416,650 663,663
Net change in fund balances 84,287 (13,077) 23,545 269,081 (772,366)
FUND BALANCES (DEFICIT), beginning of year ‐ 13,077 172,200 (269,081) 453,838
FUND BALANCES (DEFICIT), end of year $ 84,287 $ ‐ $ 195,745 $ ‐ $ (318,528)
U.S. Department
of Justice
Special
Revenue Funds
Equitable Sharing
Radio System
Capital Project Funds
Equipment
General
Capital Project Merger
IT Network
82

GENERAL FUND
SCHEDULE OF REVENUES, EXPENDITURES, AND CHANGES
IN FUND BALANCES ‐ BUDGET AND ACTUAL (BUDGETARY BASIS)
FOR THE YEAR ENDED JUNE 30, 2016
Final Actual Final Budget
Revenues
Ad valorem taxes:
Current year $ 13,169,982 $ 13,169,982 $ 13,477,313 $ 307,331
Prior year 178,500 178,500 117,162 (61,338)
Municipal service district 192,251 192,251 196,360 4,109
Penalties and interest 45,000 45,000 52,719 7,719
Total ad valorem taxes 13,585,733 13,585,733 13,843,554 257,821
Unrestricted intergovernmental:
Local option sales taxes 6,042,160 6,042,160 6,352,004 309,844
Video programming tax 270,328 270,328 261,216 (9,112)
Payments in lieu of taxes 891,849 891,849 931,965 40,116
Telecommunications sales tax 351,690 351,690 261,175 (90,515)
Utilities franchise tax 1,891,956 1,891,956 2,064,744 172,788
Piped natural gas tax 66,049 66,049 59,194 (6,855)
Public Education Television 28,369 28,369 28,288 (81)
Beer and wine tax 134,837 134,837 132,193 (2,644)
Fire protection reimbursement 13,580 13,580 13,530 (50)
ABC distributions 60,000 60,000 78,102 18,102
Total unrestricted intergovernmental 9,750,818 9,750,818 10,182,411 431,593
Restricted intergovernmental:
Powell Bill allocation 862,895 862,895 867,643 4,748
State Disaster Assistance grant ‐ 55,000 ‐ (55,000)
Other grants ‐ 50,000 50,000 ‐
Total restricted intergovernmental 862,895 967,895 917,643 (50,252)
Licenses, permits and fees:
Building permits and inspection fees 308,445 383,445 550,235 166,790
Auto and taxi fees 35,000 35,000 46,290 11,290
Beer and wine licenses 2,100 2,100 2,035 (65)
Other permits 12,700 12,700 15,745 3,045
Total licenses, permits and fees 358,245 433,245 614,305 181,060
Sales and services:
Public works fees 115,000 126,000 121,739 (4,261)
Refuse collection fees 2,481,624 2,481,624 2,856,886 375,262
Planning and inspections 89,913 89,913 123,954 34,041
Public safety fees 214,300 319,300 314,823 (4,477)
Cultural and recreation fees 120,100 120,100 139,882 19,782
Rent income 165,134 165,134 167,212 2,078
Rent income ‐ enterprise funds 136,329 243,903 243,903 ‐
Other sales and services 50,081 54,081 78,317 24,236
Total sales and services 3,372,481 3,600,055 4,046,716 446,661
Investment earnings 10,030 10,030 91,291 81,261
continued
CITY OF NEW BERN, NORTH CAROLINA
Budget
Original
Variance With
83

GENERAL FUND
SCHEDULE OF REVENUES, EXPENDITURES, AND CHANGES
IN FUND BALANCES ‐ BUDGET AND ACTUAL (BUDGETARY BASIS)
FOR THE YEAR ENDED JUNE 30, 2016
Final Actual Final Budget
Other revenues:
Proceeds from insurance $ 25,000 $ 25,000 $ 20,201 $ (4,799)
Cemetery 75,000 75,000 93,475 18,475
Other revenues 50,500 51,700 62,199 10,499
Total other revenues 150,500 151,700 175,875 24,175
Total revenues 28,090,702 28,499,476 29,871,795 1,372,319
Expenditures
Current:
General government:
Governing body:
Salaries and employee benefits 178,313 172,313 145,202 27,111
Special appropriations 133,500 163,500 142,740 20,760
Operating expenditures 243,711 255,711 239,932 15,779
Total 555,524 591,524 527,874 63,650
Administration:
Salaries and employee benefits 522,202 483,902 424,959 58,943
Operating expenditures 121,570 269,870 199,274 70,596
Total 643,772 753,772 624,233 129,539
Public Education Television (PEG):
Salaries and employee benefits 2,387 29 ‐ 29
Operating expenditures 49,450 51,808 17,271 34,537
Total 51,837 51,837 17,271 34,566
Information Technology:
Salaries and employee benefits 610,975 610,975 577,215 33,760
Operating expenditures 703,084 724,714 612,792 111,922
Capital outlay 126,368 285,547 164,539 121,008
Total 1,440,427 1,621,236 1,354,546 266,690
Finance:
Salaries and employee benefits 873,681 873,681 866,424 7,257
Operating expenditures 293,096 341,815 329,135 12,680
Total 1,166,777 1,215,496 1,195,559 19,937
Legal:
Operating expenditures 214,465 214,465 210,817 3,648
Total 214,465 214,465 210,817 3,648
Human resources:
Salaries and employee benefits 453,005 443,005 421,985 21,020
Other operating expenditures 69,016 79,016 72,743 6,273
Total 522,021 522,021 494,728 27,293
Reimbursement from enterprise funds (2,691,486) (2,691,486) (2,691,486) ‐
Total general government 1,903,337 2,278,865 1,733,542 545,323
continued
Budget Variance With
Original
CITY OF NEW BERN, NORTH CAROLINA
84

GENERAL FUND
SCHEDULE OF REVENUES, EXPENDITURES, AND CHANGES
IN FUND BALANCES ‐ BUDGET AND ACTUAL (BUDGETARY BASIS)
FOR THE YEAR ENDED JUNE 30, 2016
Final Actual Final Budget
Public Safety:
Police:
Salaries and employee benefits $ 7,616,511 $ 7,755,311 $ 7,741,020 $ 14,291
Operating expenditures 1,385,034 1,254,989 1,162,271 92,718
Capital outlay 1,091,809 1,348,443 952,707 395,736
Total 10,093,354 10,358,743 9,855,998 502,745
Fire Department:
Salaries and employee benefits 5,121,029 5,081,299 4,993,441 87,858
Operating expenditures 565,387 611,378 557,335 54,043
Capital outlay 61,000 93,500 85,372 8,128
Total 5,747,416 5,786,177 5,636,148 150,029
E911 Support:
Salaries and employee benefits ‐ 105,000 105,000 ‐
Total ‐ 105,000 105,000 ‐
Total public safety 15,840,770 16,249,920 15,597,146 652,774
Public works:
Streets:
Salaries and employee benefits 1,230,255 1,343,255 1,093,675 249,580
Operating expenditures 1,936,267 2,502,290 2,349,663 152,627
Capital outlay 26,000 201,000 144,278 56,722
Total 3,192,522 4,046,545 3,587,616 458,929
Public buildings:
Salaries and employee benefits 414,043 379,043 342,646 36,397
Operating expenditures 568,377 659,082 618,402 40,680
Capital outlay ‐ 11,600 8,889 2,711
Total 982,420 1,049,725 969,937 79,788
Administration:
Salaries and employee benefits 514,777 498,777 490,883 7,894
Operating expenditures 475,220 492,950 471,501 21,449
Capital outlay ‐ 27,065 19,630 7,435
Total 989,997 1,018,792 982,014 36,778
Leaf and limb:
Salaries and employee benefits 426,985 434,985 433,851 1,134
Operating expenditures 218,233 210,233 187,123 23,110
Total 645,218 645,218 620,974 24,244
Total public works 5,810,157 6,760,280 6,160,541 599,739
continued
Budget
CITY OF NEW BERN, NORTH CAROLINA
Variance With
Original
85

GENERAL FUND
SCHEDULE OF REVENUES, EXPENDITURES, AND CHANGES
IN FUND BALANCES ‐ BUDGET AND ACTUAL (BUDGETARY BASIS)
FOR THE YEAR ENDED JUNE 30, 2016
Final Actual Final Budget
Environmental protection:
Sanitation:
Operating expenditures 2,042,000 2,057,000 2,035,216 21,784
Total environmental protection 2,042,000 2,057,000 2,035,216 21,784
Cultural and recreation:
Parks and recreation:
Salaries and employee benefits 1,678,906 1,713,106 1,666,910 46,196
Operating expenditures 884,209 863,867 823,799 40,068
Capital outlay 105,000 415,637 356,607 59,030
Total cultural and recreation 2,668,115 2,992,610 2,847,316 145,294
Economic and physical development:
Planning:
Salaries and employee benefits 1,269,395 1,269,395 1,208,769 60,626
Operating expenditures 362,004 347,004 240,544 106,460
Total 1,631,399 1,616,399 1,449,313 167,086
Municipal service district:
Operating expenditures 17,000 17,000 16,460 540
Total 17,000 17,000 16,460 540
Total economic and physical development 1,648,399 1,633,399 1,465,773 167,626
Debt Service:
Principal retirements 1,884,640 5,066,038 4,975,998 90,040
Interest 374,343 350,146 301,704 48,442
Total debt service 2,258,983 5,416,184 5,277,702 138,482
Total expenditures 32,171,761 37,388,258 35,117,236 2,271,022
Deficiency of revenues
over expenditures (4,081,059) (8,888,782) (5,245,441) 3,643,341
Other financing sources (uses):
Proceeds from sale of capital assets ‐ ‐ 74,540 74,540
Transfers in 3,051,692 3,061,800 3,061,801 1
Transfers out ‐ (450,337) (676,740) (226,403)
Contingency (100,000) (16,771) ‐ 16,771
Installment purchase obligations issued 1,214,409 3,081,224 2,980,767 (100,457)
Total other financing sources (uses) 4,166,101 5,675,916 5,440,368 (235,548)
Revenues and other financing sources over
(under) expenditures and other financing uses 85,042 (3,212,866) 194,927 3,407,793
Appropriated use of (increase in) fund balance (85,042) 3,212,866 ‐ (3,212,866)
Net change in fund balances $ ‐ $ ‐ 194,927 $ 194,927
Fund balance, beginning of year 20,265,180
Adjustment to Statement of Revenues, Expenditures, and Changes in Fund Balance (GAAP):
Change in allowance for doubtful account receivable balances (6,710)
Fund balance, end of year $ 20,453,397
Budget Variance With
Original
CITY OF NEW BERN, NORTH CAROLINA
86

COMMUNITY DEVELOPMENT
AND CHANGES IN FUND BALANCES ‐ BUDGET AND ACTUAL (NON‐GAAP BASIS)
Variance With
Original Final Actual Final Budget
REVENUES
Restricted intergovernmental
Historic grant program $ ‐ $ ‐ $ 8,146 $ 8,146
Investment earnings ‐ ‐ 22 22
Total revenues ‐ ‐ 8,168 8,168
EXPENDITURES
Economic and physical development
Operating expenditures 15,000 15,000 1,500 13,500
Excess of revenues over expenditures (15,000) (15,000) 6,668 21,668
Appropriated fund balance 15,000 15,000 ‐ (15,000)
Net change in fund balances $ ‐ $ ‐ 6,668 $ 6,668
FUND BALANCE, beginning of year 20,449
FUND BALANCE, end of year $ 27,117
CITY OF NEW BERN, NORTH CAROLINA
SCHEDULE OF REVENUES, EXPENDITURES,
FOR THE YEAR ENDED JUNE 30, 2016
Budget
87

CITY OF NEW BERN, NORTH CAROLINAEMERGENCY TELEPHONE SYSTEM
AND CHANGES IN FUND BALANCES ‐ BUDGET AND ACTUAL (NON‐GAAP BASIS)
Variance With
Original Final Actual Final Budget
REVENUES
Restricted intergovernmental
Wireless 911 funds $ 311,354 $ 311,354 $ 311,354 $ ‐
Investment earnings 100 100 165 65
Total revenues 311,454 311,454 311,519 65
EXPENDITURES
Public safety
Operating expenditures 319,212 323,049 299,462 23,587
Total expenditures 319,212 323,049 299,462 23,587
Excess (deficiency) of revenues over expenditures (7,758) (11,595) 12,057 23,652
OTHER FINANCING SOURCES
Appropriated fund balance 7,758 7,758 ‐ (7,758)
Transfers in ‐ 3,837 ‐ (3,837)
Total other financing sources 7,758 11,595 ‐ (11,595)
Net change in fund balances $ ‐ $ ‐ 12,057 $ 12,057
FUND BALANCE, beginning of year 169,851
FUND BALANCE, end of year $ 181,908
SCHEDULE OF REVENUES, EXPENDITURES,
FOR THE YEAR ENDED JUNE 30, 2016
Budget
88
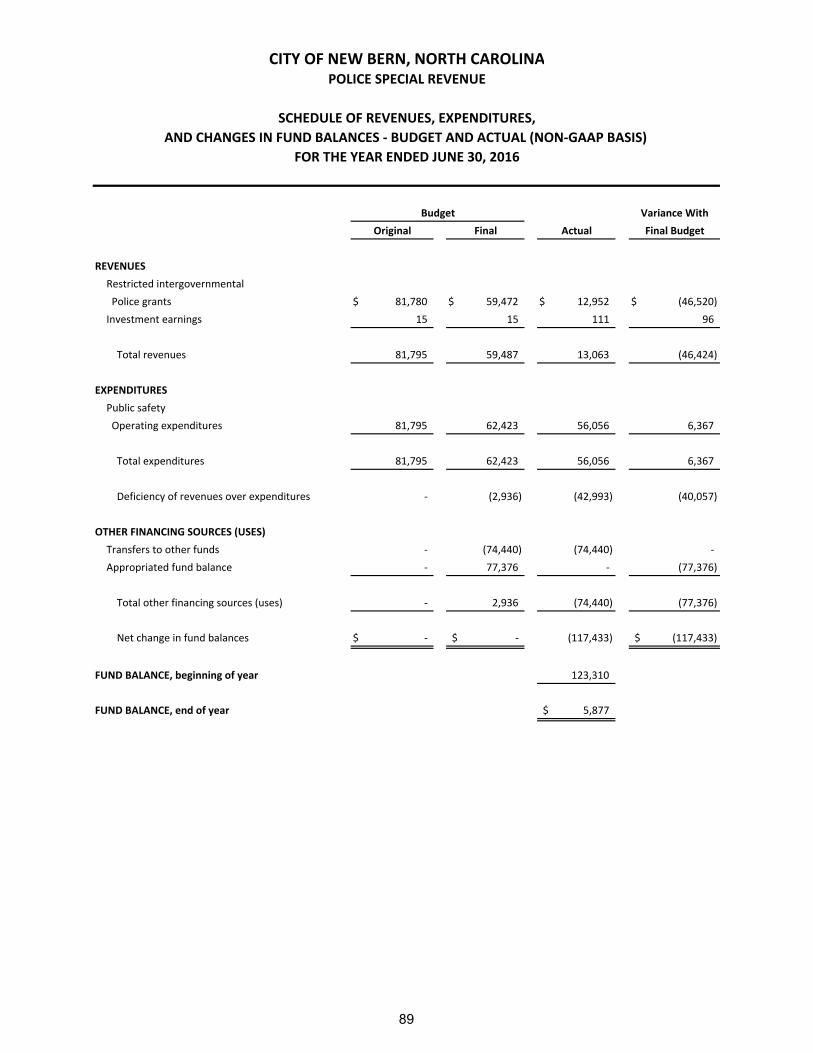
CITY OF NEW BERN, NORTH CAROLINAPOLICE SPECIAL REVENUE
AND CHANGES IN FUND BALANCES ‐ BUDGET AND ACTUAL (NON‐GAAP BASIS)
Variance With
Original Final Actual Final Budget
REVENUES
Restricted intergovernmental
Police grants $ 81,780 $ 59,472 $ 12,952 $ (46,520)
Investment earnings 15 15 111 96
Total revenues 81,795 59,487 13,063 (46,424)
EXPENDITURES
Public safety
Operating expenditures 81,795 62,423 56,056 6,367
Total expenditures 81,795 62,423 56,056 6,367
Deficiency of revenues over expenditures ‐ (2,936) (42,993) (40,057)
OTHER FINANCING SOURCES (USES)
Transfers to other funds ‐ (74,440) (74,440) ‐
Appropriated fund balance ‐ 77,376 ‐ (77,376)
Total other financing sources (uses) ‐ 2,936 (74,440) (77,376)
Net change in fund balances $ ‐ $ ‐ (117,433) $ (117,433)
FUND BALANCE, beginning of year 123,310
FUND BALANCE, end of year $ 5,877
Budget
SCHEDULE OF REVENUES, EXPENDITURES,
FOR THE YEAR ENDED JUNE 30, 2016
89

CITY OF NEW BERN, NORTH CAROLINAGRANTS SPECIAL REVENUE
AND CHANGES IN FUND BALANCES ‐ BUDGET AND ACTUAL (NON‐GAAP BASIS)
Variance With
Original Final Actual Final Budget
REVENUES
Restricted intergovernmental
Police grants $ ‐ $ 29,949 $ 64,088 $ 34,139
Fire grants 16,800 20,000 2,878 (17,122)
Economic and physical development 45,000 45,000 31,514 (13,486)
Total revenues 61,800 94,949 98,480 3,531
EXPENDITURES
Public safety
Operating expenditures 16,800 75,760 50,385 25,375
Cultural and recreational
Operating expenditures ‐ 2,868 2,256 612
Economic and physical development
Operating expenditures 45,000 45,000 36,025 8,975
Total expenditures 61,800 123,628 88,666 34,962
Excess (deficiency) of revenues over expenditures ‐ (28,679) 9,814 38,493
OTHER FINANCING SOURCES
Appropriated fund balance ‐ 28,679 ‐ (28,679)
Net change in fund balances $ ‐ $ ‐ 9,814 $ 9,814
FUND BALANCE, beginning of year 106,988
FUND BALANCE, end of year $ 116,802
SCHEDULE OF REVENUES, EXPENDITURES,
FOR THE YEAR ENDED JUNE 30, 2016
Budget
90

GLENBURNIE ROAD MULTI‐USE PATH PROJECT
AND CHANGES IN FUND BALANCES ‐ BUDGET AND ACTUAL (NON‐GAAP BASIS)
Project
Authorization Prior Years Current Year Total
REVENUES
Restricted intergovernmental
NC Department of Transportation $ 540,000 $ 13,578 $ 3,519 $ 17,097
Total revenues 540,000 13,578 3,519 17,097
EXPENDITURES
Economic and physical development
Capital outlay ‐ right of way 40,655 13,578 267 13,845
Capital outlay ‐ construction 499,345 ‐ 457,500 457,500
Total expenditures 540,000 13,578 457,767 471,345
Net change in fund balance $ ‐ ‐ (454,248) $ (454,248)
FUND BALANCE, beginning of year ‐ ‐
FUND BALANCE (DEFICIT), end of year $ ‐ $ (454,248)
CITY OF NEW BERN, NORTH CAROLINA
SCHEDULE OF REVENUES, EXPENDITURES,
PROJECT LIFE AS OF JUNE 30, 2016
Actual
91

CITY OF NEW BERN, NORTH CAROLINAPUBLIC‐PRIVATE PARTNERSHIP
AND CHANGES IN FUND BALANCES ‐ BUDGET AND ACTUAL (NON‐GAAP BASIS)
Variance With
Original Final Actual Final Budget
EXPENDITURES
Economic and physical development
Operating expenditures $ 10,000 $ 10,000 $ 10,000 $ ‐
Total expenditures 10,000 10,000 10,000 ‐
Deficiency of revenues over expenditures (10,000) (10,000) (10,000) ‐
OTHER FINANCING SOURCES
Transfers in 10,000 10,000 10,000 ‐
Total other financing sources 10,000 10,000 10,000 ‐
Net change in fund balances $ ‐ $ ‐ ‐ $ ‐
FUND BALANCE (DEFICIT), beginning of year (348)
FUND BALANCE (DEFICIT), end of year $ (348)
Budget
SCHEDULE OF REVENUES, EXPENDITURES,
FOR THE YEAR ENDED JUNE 30, 2016
92

FEMA HURRICANE IRENE
AND CHANGES IN FUND BALANCES ‐ BUDGET AND ACTUAL (NON‐GAAP BASIS)
Project
Authorization Prior Years Current Year Total
REVENUES
Restricted intergovernmental
Federal Public Assistance Disaster grant $ 142,149 $ 110,226 $ ‐ $ 110,226
State Public Assistance Disaster grant 47,383 36,742 ‐ 36,742
Miscellaneous 78,112 78,112 ‐ 78,112
Total revenues 267,644 225,080 ‐ 225,080
EXPENDITURES
Public safety
Operating expenditures 267,644 225,080 ‐ 225,080
Total expenditures 267,644 225,080 ‐ 225,080
Net change in fund balance $ ‐ ‐ ‐ $ ‐
FUND BALANCE, beginning of year ‐ ‐
FUND BALANCE, end of year $ ‐ $ ‐
SCHEDULE OF REVENUES, EXPENDITURES,
PROJECT LIFE AS OF JUNE 30, 2016
Actual
CITY OF NEW BERN, NORTH CAROLINA
93

2012 CDBG NC CATALYST
AND CHANGES IN FUND BALANCES ‐ BUDGET AND ACTUAL (NON‐GAAP BASIS)
Project
Authorization Prior Years Current Year Total
REVENUES
Restricted intergovernmental
NC Department of Commerce $ 500,000 $ 181,804 $ 318,196 $ 500,000
Coastal Community Action 20,000 ‐ ‐ ‐
Total revenues 520,000 181,804 318,196 500,000
EXPENDITURES
Economic and physical development
Operating expenditures 625,000 183,061 364,667 547,728
Total expenditures 625,000 183,061 364,667 547,728
Deficiency of revenues over expenditures (105,000) (1,257) (46,471) (47,728)
OTHER FINANCING SOURCES
Transfers in 105,000 105,000 ‐ 105,000
Net change in fund balance $ ‐ 103,743 (46,471) $ 57,272
FUND BALANCE, beginning of year ‐ 103,743
FUND BALANCE, end of year $ 103,743 $ 57,272
CITY OF NEW BERN, NORTH CAROLINA
SCHEDULE OF REVENUES, EXPENDITURES,
PROJECT LIFE AS OF JUNE 30, 2016
Actual
94

CITY OF NEW BERN, NORTH CAROLINAMETROPOLITAN PLANNING GRANT (MPO)
AND CHANGES IN FUND BALANCES ‐ BUDGET AND ACTUAL (NON‐GAAP BASIS)
Variance With
Original Final Actual Final Budget
REVENUES
Restricted intergovernmental
NC Department of Transportation $ 205,422 $ 205,422 $ 185,353 $ (20,069)
Total revenues 205,422 205,422 185,353 (20,069)
EXPENDITURES
Economic and physical development
Salaries and employee benefits 143,477 143,477 140,416 3,061
Operating expenditures 86,023 86,023 70,027 15,996
Total expenditures 229,500 229,500 210,443 19,057
Deficiency of revenues over expenditures (24,078) (24,078) (25,090) (39,126)
OTHER FINANCING SOURCES
Transfers in 24,078 24,078 25,090 1,012
Total other financing sources 24,078 24,078 25,090 1,012
Net change in fund balances $ ‐ $ ‐ ‐ $ (38,114)
FUND BALANCE, beginning of year 13,649
FUND BALANCE, end of year $ 13,649
SCHEDULE OF REVENUES, EXPENDITURES,
FOR THE YEAR ENDED JUNE 30, 2016
Budget
95

ENTITLEMENT CITIES CDBG PROGRAM
AND CHANGES IN FUND BALANCES ‐ BUDGET AND ACTUAL (NON‐GAAP BASIS)
Project
Authorization Prior Years Current Year Total
REVENUES
Restricted intergovernmental
NC Department of Commerce $ 774,114 $ 39,129 $ 221,062 $ 260,191
Total revenues 774,114 39,129 221,062 260,191
EXPENDITURES
Economic and physical development
Operating expenditures 774,114 39,129 389,952 429,081
Total expenditures 774,114 39,129 389,952 429,081
Net change in fund balance $ ‐ ‐ (168,890) $ (168,890)
FUND BALANCE, beginning of year ‐ ‐
FUND BALANCE (DEFICIT), end of year $ ‐ $ (168,890)
CITY OF NEW BERN, NORTH CAROLINA
SCHEDULE OF REVENUES, EXPENDITURES,
PROJECT LIFE AS OF JUNE 30, 2016
Actual
96

NEUSE BOULEVARD SIDEWALK IMPROVEMENTS ‐ PHASE II
AND CHANGES IN FUND BALANCES ‐ BUDGET AND ACTUAL (NON‐GAAP BASIS)
Project
Authorization Prior Years Current Year Total
REVENUES
Restricted intergovernmental
NC Department of Transportation $ 500,000 $ 66,682 $ ‐ $ 66,682
Total revenues 500,000 66,682 ‐ 66,682
EXPENDITURES
Economic and physical development
Capital outlay ‐ right of way 69,913 66,682 3,231 69,913
Capital outlay ‐ construction 430,087 ‐ 374,468 374,468
Total expenditures 500,000 66,682 377,699 444,381
Net change in fund balance $ ‐ ‐ (377,699) $ (377,699)
FUND BALANCE, beginning of year ‐ ‐
FUND BALANCE (DEFICIT), end of year $ ‐ $ (377,699)
CITY OF NEW BERN, NORTH CAROLINA
SCHEDULE OF REVENUES, EXPENDITURES,
PROJECT LIFE AS OF JUNE 30, 2016
Actual
97

2014 BULLET‐PROOF VEST PARTNERSHIP PROGRAM
AND CHANGES IN FUND BALANCES ‐ BUDGET AND ACTUAL (NON‐GAAP BASIS)
Project
Authorization Prior Years Current Year Total
REVENUES
Restricted intergovernmental
U.S. Department of Justice $ 5,744 $ 548 $ ‐ $ 548
Total revenues 5,744 548 ‐ 548
EXPENDITURES
Public safety
Operating expenditures 11,488 6,292 ‐ 6,292
Total expenditures 11,488 6,292 ‐ 6,292
Deficiency of revenues over expenditures (5,744) (5,744) ‐ (5,744)
OTHER FINANCING SOURCES
Transfers in 5,744 5,744 ‐ 5,744
Net change in fund balance $ ‐ ‐ ‐ $ ‐
FUND BALANCE, beginning of year ‐ ‐
FUND BALANCE, end of year $ ‐ $ ‐
CITY OF NEW BERN, NORTH CAROLINA
SCHEDULE OF REVENUES, EXPENDITURES,
PROJECT LIFE AS OF JUNE 30, 2016
Actual
98

CITY OF NEW BERN, NORTH CAROLINAEQUITABLE SHARING U.S. DEPARTMENT OF JUSTICE
AND CHANGES IN FUND BALANCES ‐ BUDGET AND ACTUAL (NON‐GAAP BASIS)
Variance With
Original Final Actual Final Budget
REVENUES
Restricted intergovernmental
Police grants $ 22,308 $ 22,308 $ 26,017 $ 3,709
Investment earnings ‐ ‐ 17 17
Total revenues 22,308 22,308 26,034 3,726
EXPENDITURES
Public safety
Operating expenditures 96,748 96,748 16,187 80,561
Total expenditures 96,748 96,748 16,187 80,561
Excess (deficiency) of revenues over expenditures (74,440) (74,440) 9,847 84,287
OTHER FINANCING SOURCES
Transfers in 74,440 74,440 74,440 ‐
Total other financing sources 74,440 74,440 74,440 ‐
Net change in fund balances ‐ ‐ 84,287 84,287
FUND BALANCE, beginning of year ‐ ‐ ‐ ‐
FUND BALANCE, end of year $ ‐ $ ‐ $ 84,287 $ 84,287
SCHEDULE OF REVENUES, EXPENDITURES,
FOR THE YEAR ENDED JUNE 30, 2016
Budget
99

RADIO SYSTEM EQUIPMENT
AND CHANGES IN FUND BALANCES ‐ BUDGET AND ACTUAL (NON‐GAAP BASIS)
Project
Authorization Prior Years Current Year Total
REVENUES
Other revenues
Investment earnings $ 17 $ 16 $ ‐ $ 16
Miscellaneous 468,311 468,311 ‐ 468,311
Total revenues 468,328 468,327 ‐ 468,327
EXPENDITURES
General government
Radio system equipment 4,242,031 4,242,030 ‐ 4,242,030
Total expenditures 4,242,031 4,242,030 ‐ 4,242,030
Deficiency of revenues over expenditures (3,773,703) (3,773,703) ‐ (3,773,703)
OTHER FINANCING SOURCES
Installment purchase obligations 3,485,500 3,485,500 ‐ 3,485,500
Transfers in 301,280 301,280 ‐ 301,280
Transfers out (13,077) ‐ (13,077) (13,077)
Total other financing sources (uses) 3,773,703 3,786,780 (13,077) 3,773,703
Net change in fund balance $ ‐ 13,077 (13,077) $ ‐
FUND BALANCE, beginning of year ‐ 13,077
FUND BALANCE, end of year $ 13,077 $ ‐
CITY OF NEW BERN, NORTH CAROLINA
SCHEDULE OF REVENUES, EXPENDITURES,
PROJECT LIFE AS OF JUNE 30, 2016
Actual
100
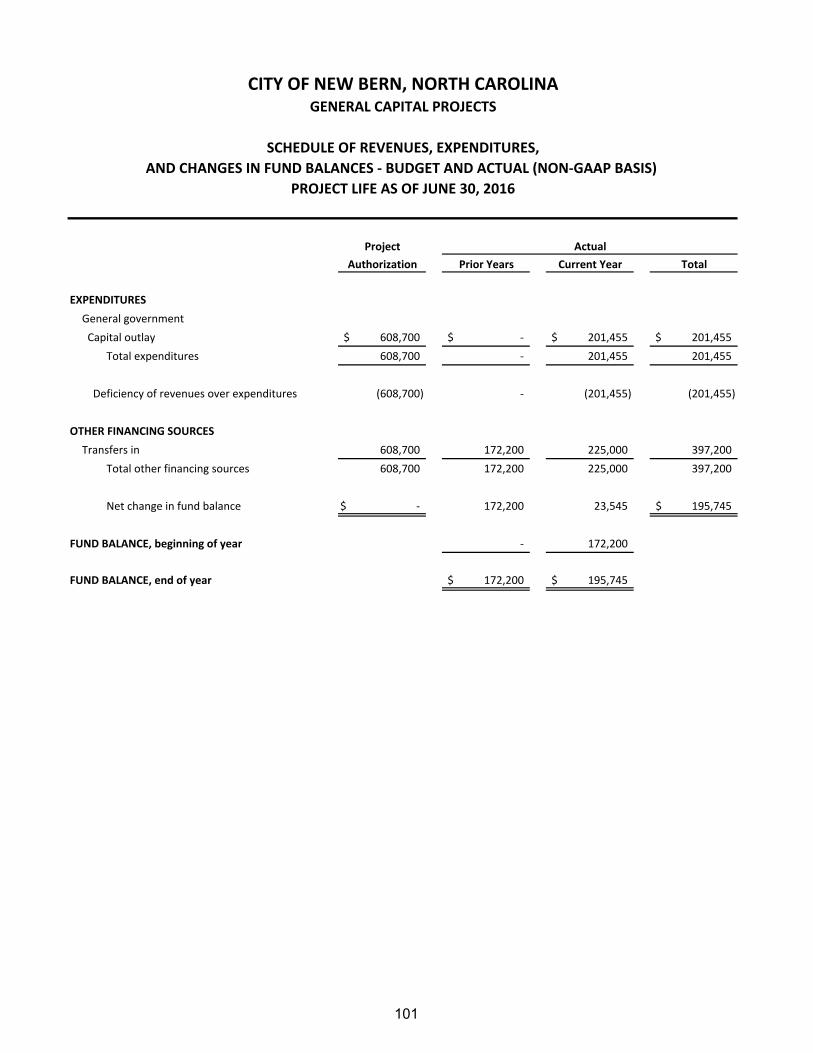
GENERAL CAPITAL PROJECTS
AND CHANGES IN FUND BALANCES ‐ BUDGET AND ACTUAL (NON‐GAAP BASIS)
Project
Authorization Prior Years Current Year Total
EXPENDITURES
General government
Capital outlay $ 608,700 $ ‐ $ 201,455 $ 201,455
Total expenditures 608,700 ‐ 201,455 201,455
Deficiency of revenues over expenditures (608,700) ‐ (201,455) (201,455)
OTHER FINANCING SOURCES
Transfers in 608,700 172,200 225,000 397,200
Total other financing sources 608,700 172,200 225,000 397,200
Net change in fund balance $ ‐ 172,200 23,545 $ 195,745
FUND BALANCE, beginning of year ‐ 172,200
FUND BALANCE, end of year $ 172,200 $ 195,745
CITY OF NEW BERN, NORTH CAROLINA
SCHEDULE OF REVENUES, EXPENDITURES,
PROJECT LIFE AS OF JUNE 30, 2016
Actual
101

IT NETWORK MERGER
AND CHANGES IN FUND BALANCES ‐ BUDGET AND ACTUAL (NON‐GAAP BASIS)
Project
Authorization Prior Years Current Year Total
EXPENDITURES
Economic and physical development
Engineering services $ 150,000 $ ‐ $ 84,195 $ 84,195
Capital outlay 335,500 269,081 63,374 332,455
Contingency 35,000 ‐ ‐ ‐
Total expenditures 520,500 269,081 147,569 416,650
Deficiency of revenues over expenditures (520,500) (269,081) (147,569) (416,650)
OTHER FINANCING SOURCES
Transfer from other funds ‐ ‐ 416,650 416,650
Issuance of long‐term debt 520,500 ‐ ‐ ‐
Total other financing sources 520,500 ‐ 416,650 416,650
Net change in fund balance $ ‐ (269,081) 269,081 $ ‐
FUND BALANCE (DEFICIT), beginning of year ‐ (269,081)
FUND BALANCE, end of year $ (269,081) $ ‐
CITY OF NEW BERN, NORTH CAROLINA
SCHEDULE OF REVENUES, EXPENDITURES,
PROJECT LIFE AS OF JUNE 30, 2016
Actual
102

CITY OF NEW BERN, NORTH CAROLINAELECTRIC FUND
AND CHANGES IN NET POSITION ‐ BUDGET AND ACTUAL (NON‐GAAP BASIS)
Variance With
Original Final Actual Final Budget
REVENUES
Operating revenues
Electric charges $ 60,378,009 $ 54,482,235 $ 52,698,231 $ (1,784,004)
Nonoperating revenues
Investment earnings 2,000 2,000 24,307 22,307
Interfund reimbursments 608,944 608,944 608,944 ‐
Miscellaneous 10,000 10,000 36,714 26,714
Total revenues 60,998,953 55,103,179 53,368,196 (1,734,983)
EXPENDITURES
Administration 3,549,939 3,683,857 3,287,362 396,495
Production 46,850,115 39,369,069 36,668,269 2,700,800
Distribution 3,333,790 3,384,267 3,308,963 75,304
Reimbursed expenditures ‐ General Fund 1,126,104 1,126,104 1,126,104 ‐
Capital outlay 2,033,000 2,217,475 1,514,554 702,921
Debt service 1,205,206 1,247,744 1,229,239 18,505
Total expenditures 58,098,154 51,028,516 47,134,491 3,894,025
Excess of revenues over expenditures 2,900,799 4,074,663 6,233,705 2,159,042
OTHER FINANCING SOURCES (USES)
Issuance of installment notes 408,000 408,000 408,000 ‐
Proceeds from sale of capital assets ‐ ‐ 4,351 4,351
Appropriated fund balance ‐ 218,402 ‐ (218,402)
Transfers in ‐ 4,727 4,727 ‐
Transfers out (3,051,692) (4,428,671) (4,428,671) ‐
Transfers out ‐ payment in lieu of taxes (257,107) (277,121) (277,121) ‐
Total other financing sources (uses) (2,900,799) (4,074,663) (4,288,714) (214,051)
Net change in fund balance $ ‐ $ ‐ 1,944,991 $ 1,944,991
Adjustments to full accrual:
Capital outlays 2,542,921
Payments of debt service ‐ principal 1,076,392
Assets transferred from governmental activities 3,308,953
Installment notes transferred from governmental activities (3,026,645)
Proceeds from long‐term liabilities (3,964,000)
Increase in accrued interest (26,409)
Increase in compensated absences (13,275)
Increase in OPEB obligation (197,896)
Bad debt expense (82,225)
Change in net pension liability and related deferred inflows/outflows of resources 33,825
Disposal of capital assets (600,780)
Deprecation expense (2,069,769)
Electric Rate Stabilization Fund 1,377,406
Allocated share of AMI/DSM System Enterprise Capital Project Fund 3,070,321
Allocated share of Kale Road Project Enterprise Capital Project Fund (488,043)
Change in net position $ 2,885,767
SCHEDULE OF REVENUES, EXPENDITURES,
FOR THE YEAR ENDED JUNE 30, 2016
Budget
103
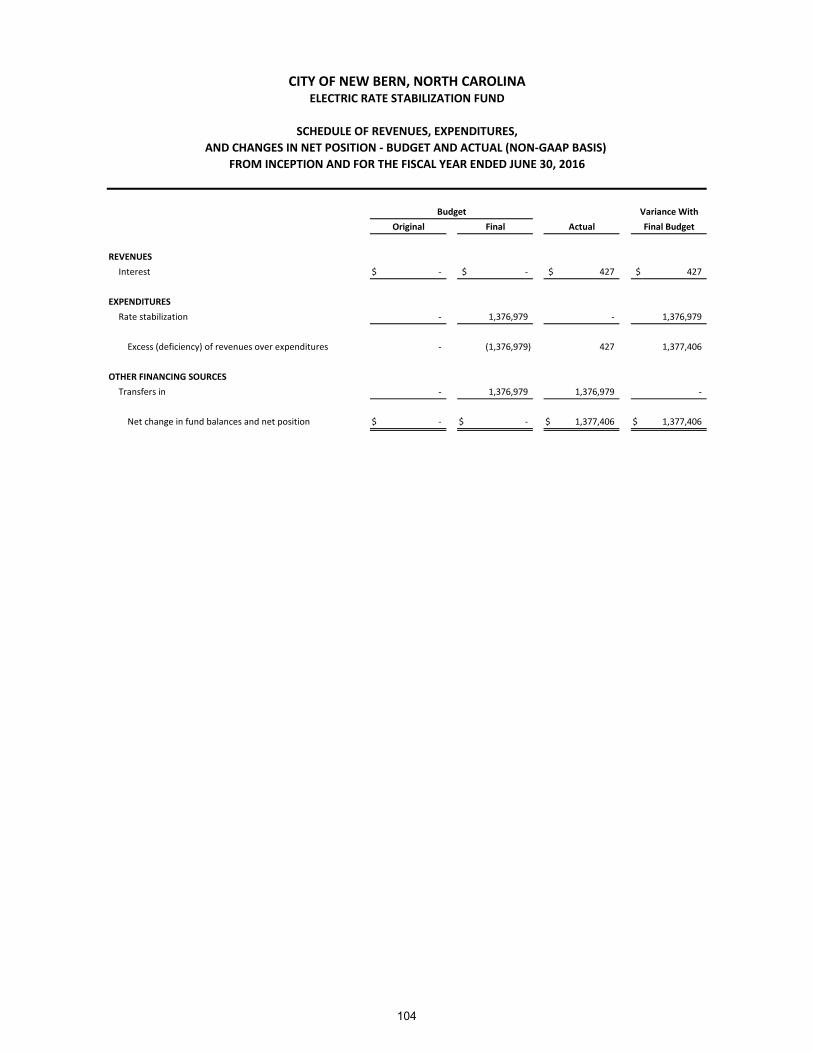
CITY OF NEW BERN, NORTH CAROLINAELECTRIC RATE STABILIZATION FUND
AND CHANGES IN NET POSITION ‐ BUDGET AND ACTUAL (NON‐GAAP BASIS)
Variance With
Original Final Actual Final Budget
REVENUES
Interest $ ‐ $ ‐ $ 427 $ 427
EXPENDITURES
Rate stabilization ‐ 1,376,979 ‐ 1,376,979
Excess (deficiency) of revenues over expenditures ‐ (1,376,979) 427 1,377,406
OTHER FINANCING SOURCES
Transfers in ‐ 1,376,979 1,376,979 ‐
Net change in fund balances and net position $ ‐ $ ‐ $ 1,377,406 $ 1,377,406
Budget
SCHEDULE OF REVENUES, EXPENDITURES,
FROM INCEPTION AND FOR THE FISCAL YEAR ENDED JUNE 30, 2016
104
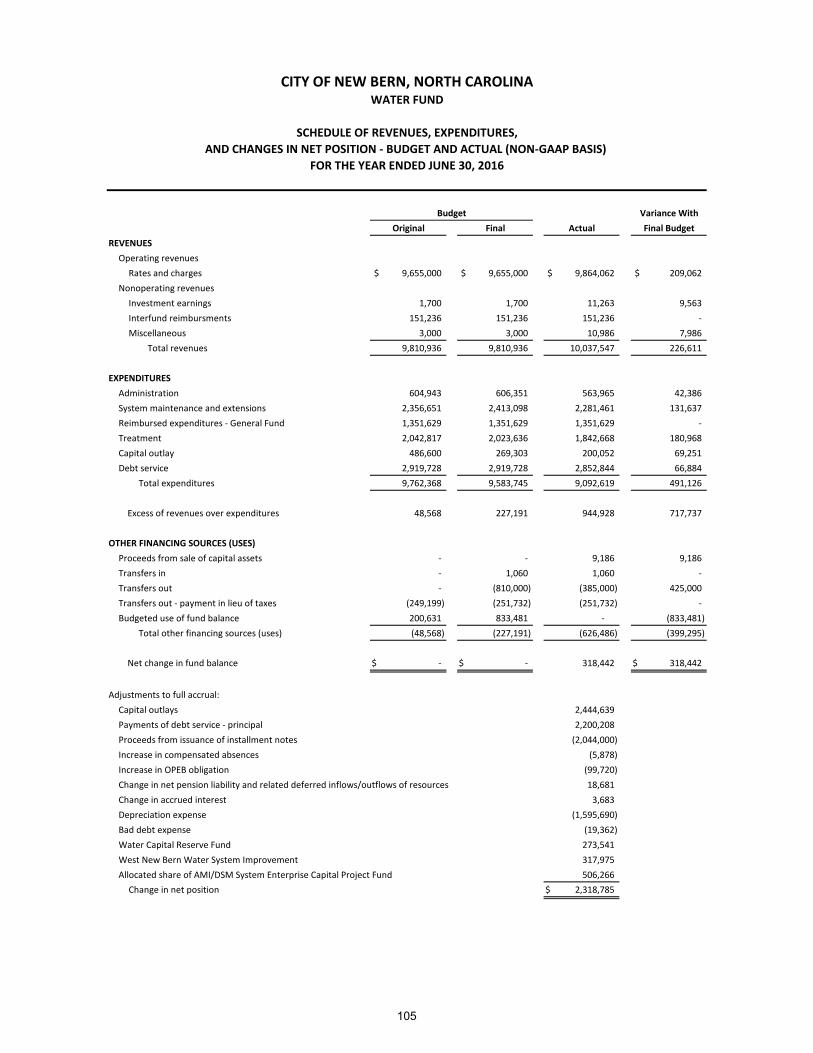
WATER FUND
AND CHANGES IN NET POSITION ‐ BUDGET AND ACTUAL (NON‐GAAP BASIS)
Variance With
Original Final Actual Final Budget
REVENUES
Operating revenues
Rates and charges $ 9,655,000 $ 9,655,000 $ 9,864,062 $ 209,062
Nonoperating revenues
Investment earnings 1,700 1,700 11,263 9,563
Interfund reimbursments 151,236 151,236 151,236 ‐
Miscellaneous 3,000 3,000 10,986 7,986
Total revenues 9,810,936 9,810,936 10,037,547 226,611
EXPENDITURES
Administration 604,943 606,351 563,965 42,386
System maintenance and extensions 2,356,651 2,413,098 2,281,461 131,637
Reimbursed expenditures ‐ General Fund 1,351,629 1,351,629 1,351,629 ‐
Treatment 2,042,817 2,023,636 1,842,668 180,968
Capital outlay 486,600 269,303 200,052 69,251
Debt service 2,919,728 2,919,728 2,852,844 66,884
Total expenditures 9,762,368 9,583,745 9,092,619 491,126
Excess of revenues over expenditures 48,568 227,191 944,928 717,737
OTHER FINANCING SOURCES (USES)
Proceeds from sale of capital assets ‐ ‐ 9,186 9,186
Transfers in ‐ 1,060 1,060 ‐
Transfers out ‐ (810,000) (385,000) 425,000
Transfers out ‐ payment in lieu of taxes (249,199) (251,732) (251,732) ‐
Budgeted use of fund balance 200,631 833,481 ‐ (833,481)
Total other financing sources (uses) (48,568) (227,191) (626,486) (399,295)
Net change in fund balance $ ‐ $ ‐ 318,442 $ 318,442
Adjustments to full accrual:
Capital outlays 2,444,639
Payments of debt service ‐ principal 2,200,208
Proceeds from issuance of installment notes (2,044,000)
Increase in compensated absences (5,878)
Increase in OPEB obligation (99,720)
Change in net pension liability and related deferred inflows/outflows of resources 18,681
Change in accrued interest 3,683
Depreciation expense (1,595,690)
Bad debt expense (19,362)
Water Capital Reserve Fund 273,541
West New Bern Water System Improvement 317,975
Allocated share of AMI/DSM System Enterprise Capital Project Fund 506,266
Change in net position $ 2,318,785
Budget
CITY OF NEW BERN, NORTH CAROLINA
SCHEDULE OF REVENUES, EXPENDITURES,
FOR THE YEAR ENDED JUNE 30, 2016
105
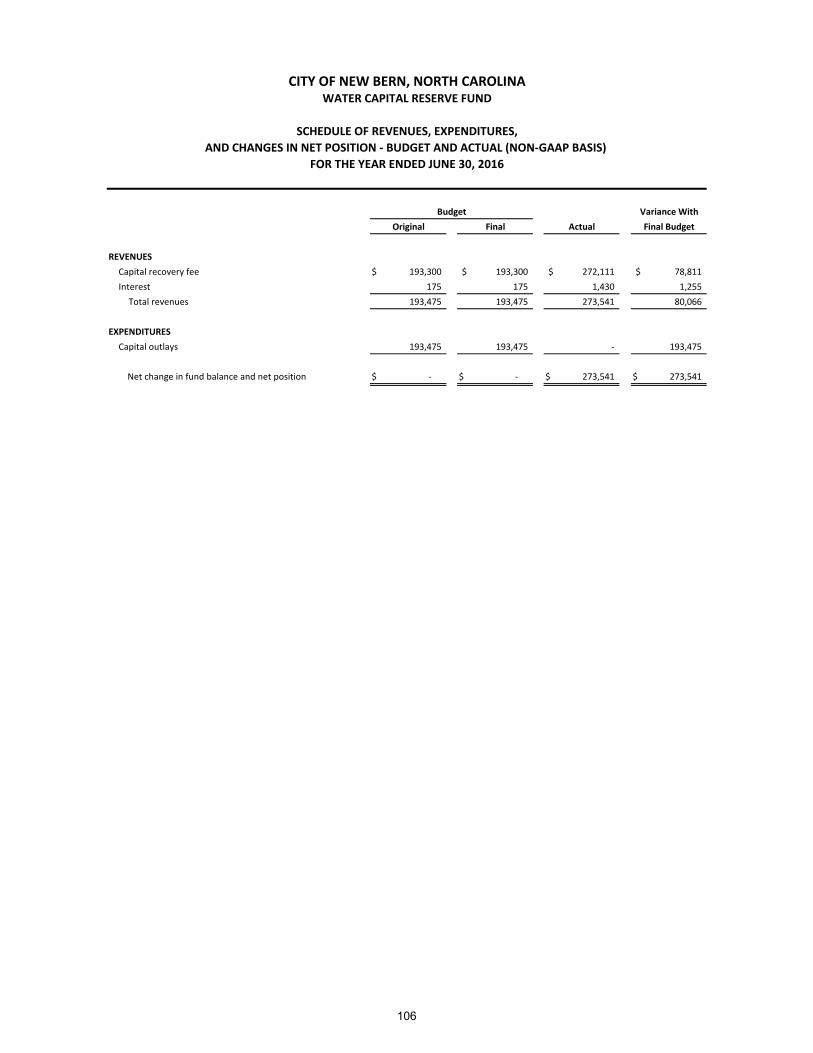
CITY OF NEW BERN, NORTH CAROLINAWATER CAPITAL RESERVE FUND
AND CHANGES IN NET POSITION ‐ BUDGET AND ACTUAL (NON‐GAAP BASIS)
Variance With
Original Final Actual Final Budget
REVENUES
Capital recovery fee $ 193,300 $ 193,300 $ 272,111 $ 78,811
Interest 175 175 1,430 1,255
Total revenues 193,475 193,475 273,541 80,066
EXPENDITURES
Capital outlays 193,475 193,475 ‐ 193,475
Net change in fund balance and net position $ ‐ $ ‐ $ 273,541 $ 273,541
SCHEDULE OF REVENUES, EXPENDITURES,
FOR THE YEAR ENDED JUNE 30, 2016
Budget
106

CITY OF NEW BERN, NORTH CAROLINAWEST NEW BERN WATER SYSTEM IMPROVEMENT CAPITAL PROJECT FUND
AND CHANGES IN NET POSITION ‐ BUDGET AND ACTUAL (NON‐GAAP BASIS)
Actual
Prior Current Variance With
Authorization Year Year Total Final Budget
EXPENDITURES
Capital outlays $ 385,000 $ ‐ $ 67,025 $ 67,025 $ 317,975
OTHER FINANCING SOURCES
Transfer in 385,000 ‐ 385,000 385,000 ‐
Net change in fund balance $ ‐ $ ‐ $ 317,975 $ 317,975 $ 317,975
FOR THE YEAR ENDED JUNE 30, 2016
Project
SCHEDULE OF REVENUES, EXPENDITURES,
107
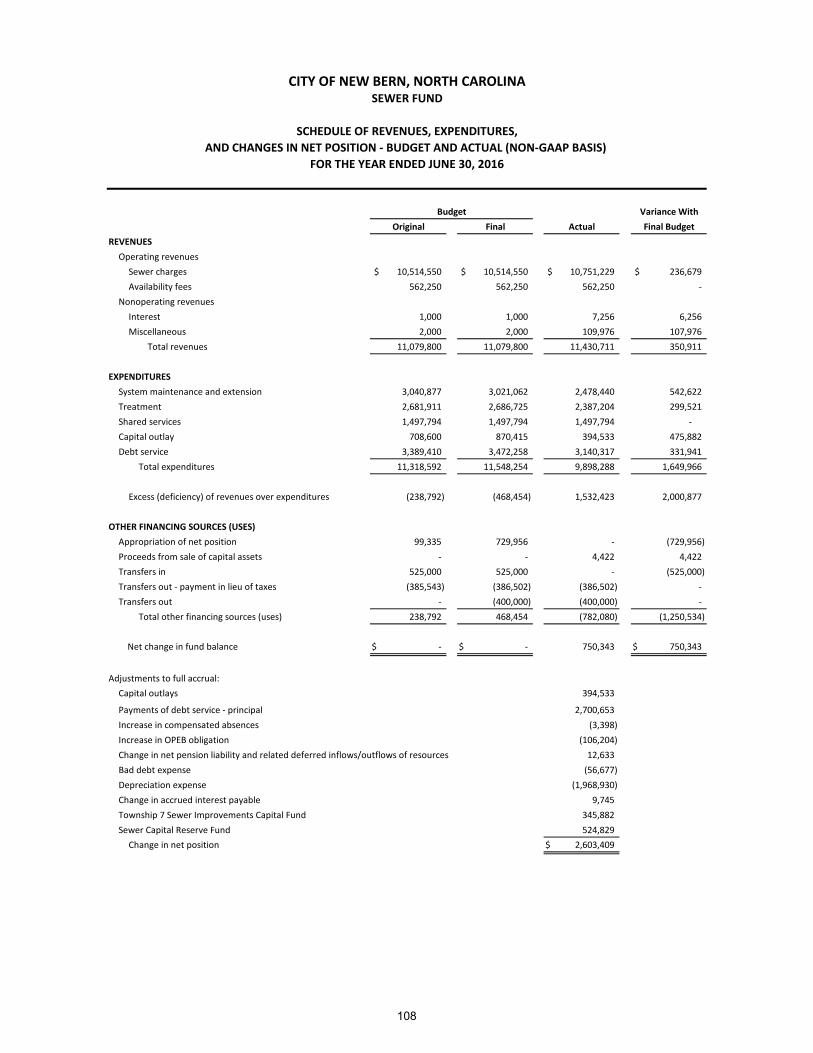
CITY OF NEW BERN, NORTH CAROLINASEWER FUND
AND CHANGES IN NET POSITION ‐ BUDGET AND ACTUAL (NON‐GAAP BASIS)
Variance With
Original Final Actual Final Budget
REVENUES
Operating revenues
Sewer charges $ 10,514,550 $ 10,514,550 $ 10,751,229 $ 236,679
Availability fees 562,250 562,250 562,250 ‐
Nonoperating revenues
Interest 1,000 1,000 7,256 6,256
Miscellaneous 2,000 2,000 109,976 107,976
Total revenues 11,079,800 11,079,800 11,430,711 350,911
EXPENDITURES
System maintenance and extension 3,040,877 3,021,062 2,478,440 542,622
Treatment 2,681,911 2,686,725 2,387,204 299,521
Shared services 1,497,794 1,497,794 1,497,794 ‐
Capital outlay 708,600 870,415 394,533 475,882
Debt service 3,389,410 3,472,258 3,140,317 331,941
Total expenditures 11,318,592 11,548,254 9,898,288 1,649,966
Excess (deficiency) of revenues over expenditures (238,792) (468,454) 1,532,423 2,000,877
OTHER FINANCING SOURCES (USES)
Appropriation of net position 99,335 729,956 ‐ (729,956)
Proceeds from sale of capital assets ‐ ‐ 4,422 4,422
Transfers in 525,000 525,000 ‐ (525,000)
Transfers out ‐ payment in lieu of taxes (385,543) (386,502) (386,502) ‐
Transfers out ‐ (400,000) (400,000) ‐
Total other financing sources (uses) 238,792 468,454 (782,080) (1,250,534)
Net change in fund balance $ ‐ $ ‐ 750,343 $ 750,343
Adjustments to full accrual:
Capital outlays 394,533
Payments of debt service ‐ principal 2,700,653
Increase in compensated absences (3,398)
Increase in OPEB obligation (106,204)
Change in net pension liability and related deferred inflows/outflows of resources 12,633
Bad debt expense (56,677)
Depreciation expense (1,968,930)
Change in accrued interest payable 9,745
Township 7 Sewer Improvements Capital Fund 345,882
Sewer Capital Reserve Fund 524,829
Change in net position $ 2,603,409
SCHEDULE OF REVENUES, EXPENDITURES,
FOR THE YEAR ENDED JUNE 30, 2016
Budget
108

CITY OF NEW BERN, NORTH CAROLINASEWER CAPITAL RESERVE FUND
AND CHANGES IN NET POSITION ‐ BUDGET AND ACTUAL (NON‐GAAP BASIS)
Variance With
Original Final Actual Final Budget
REVENUES
Capital recovery fee $ 295,000 $ 295,000 $ 523,015 $ 228,015
Interest 145 145 1,814 1,669
Total revenues 295,145 295,145 524,829 229,684
Excess of revenues over expenditures 295,145 295,145 524,829 229,684
OTHER FINANCING SOURCES (USES)
Appropriation of fund balance 229,855 229,855 ‐ (229,855)
Transfers out (525,000) (525,000) ‐ 525,000
Total other financing sources (uses) (295,145) (295,145) ‐ 295,145
Net change in fund balance $ ‐ $ ‐ $ 524,829 $ 524,829
SCHEDULE OF REVENUES, EXPENDITURES,
Budget
FOR THE YEAR ENDED JUNE 30, 2016
109
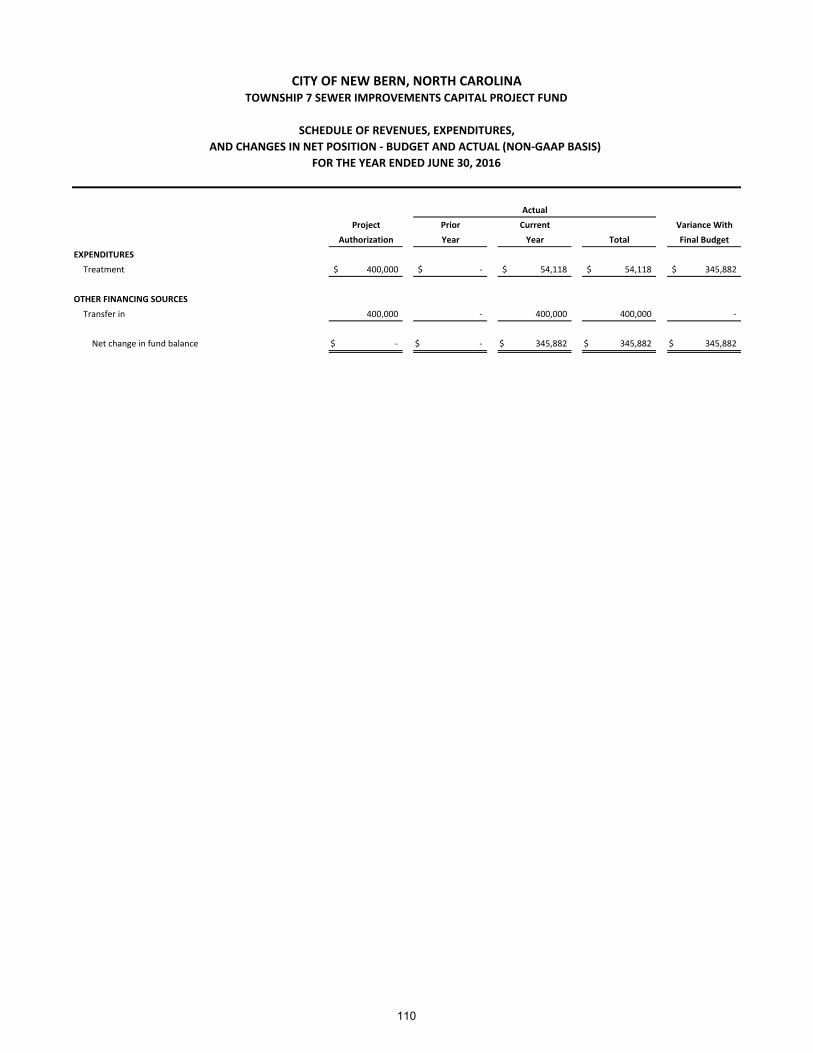
CITY OF NEW BERN, NORTH CAROLINATOWNSHIP 7 SEWER IMPROVEMENTS CAPITAL PROJECT FUND
AND CHANGES IN NET POSITION ‐ BUDGET AND ACTUAL (NON‐GAAP BASIS)
Actual
Prior Current Variance With
Authorization Year Year Total Final Budget
EXPENDITURES
Treatment $ 400,000 $ ‐ $ 54,118 $ 54,118 $ 345,882
OTHER FINANCING SOURCES
Transfer in 400,000 ‐ 400,000 400,000 ‐
Net change in fund balance $ ‐ $ ‐ $ 345,882 $ 345,882 $ 345,882
Project
FOR THE YEAR ENDED JUNE 30, 2016
SCHEDULE OF REVENUES, EXPENDITURES,
110

STORMWATER FUND
AND CHANGES IN NET POSITION ‐ BUDGET AND ACTUAL (NON‐GAAP BASIS)
Variance With
Original Final Actual Final Budget
REVENUES
Operating revenues
Rates and charges $ 670,000 $ 670,000 $ 681,209 $ 11,209
Nonoperating revenues
Investment earnings ‐ ‐ 321 321
Total revenues 670,000 670,000 681,530 11,530
EXPENDITURES
Stormwater system maintenance 528,989 528,989 489,575 39,414
Reimbursed expenditures ‐ General Fund 57,764 57,764 57,764 ‐
Capital outlay 80,000 80,000 73,445 6,555
Debt service 83,247 91,598 85,611 5,987
Total expenditures 750,000 758,351 706,395 51,956
Excess (deficiency) of revenues over expenditures (80,000) (88,351) (24,865) 63,486
OTHER FINANCING SOURCES
Installment notes issued 80,000 80,000 80,000 ‐
Proceeds from sale of capital assets ‐ ‐ 3,023 3,023
Appropriated use of fund balance ‐ 8,351 ‐ (8,351)
Total other financing sources 80,000 88,351 83,023 (5,328)
Net change in fund balance $ ‐ $ ‐ 58,158 $ 58,158
Adjustments to full accrual:
Donated capital assets ‐
Capital outlays 73,445
Payments of debt service ‐ principal 71,997
Issuance of installment notes (80,000)
Increase in compensated absences (1,846)
Increase in OPEB obligation (3,695)
Decrease in net pension liability 5,488
Decrease in accrued interest 129
Change in allowance for doubtful accounts 26,658
Depreciation expense (70,178)
Change in net position $ 80,156
CITY OF NEW BERN, NORTH CAROLINA
SCHEDULE OF REVENUES, EXPENDITURES,
FOR THE YEAR ENDED JUNE 30, 2016
Budget
111

AMI/DSM SYSTEM ENTERPRISE CAPITAL PROJECT FUND
AND CHANGES IN FUND BALANCES ‐ BUDGET AND ACTUAL (NON‐GAAP BASIS)
Project
Authorization Prior Years Current Year Total
REVENUES
Investment earnings ‐ Electric Fund $ ‐ $ 88 $ 791 $ 879
Total revenues ‐ 88 791 879
EXPENDITURES
Professional services ‐ Electric Fund 134,760 131,182 22,398 153,580
Professional services ‐ Water Fund 89,840 ‐ 30,213 30,213
Capital outlay ‐ Electric Fund 2,819,581 2,800,854 439,232 3,240,086
Capital outlay ‐ Water Fund 5,993,319 ‐ 1,490,961 1,490,961
Debt service ‐ interest and fiscal charges 12,500 ‐ 41,400 41,400
Total expenditures 9,050,000 2,932,036 2,024,204 4,956,240
Deficiency of revenues over expenditures (9,050,000) (2,931,948) (2,023,413) (4,955,361)
OTHER FINANCING SOURCES
Transfer in ‐ Water Capital Reserve 265,100 265,100 ‐ 265,100
Debt issued ‐ Electric Fund 5,677,000 2,121,000 3,556,000 5,677,000
Debt issued ‐ Water Fund 3,107,900 1,063,900 2,044,000 3,107,900
Total other financing sources 9,050,000 3,450,000 5,600,000 9,050,000
Net change in fund balance ‐ 518,052 3,576,587 4,094,639
FUND BALANCE, beginning of year ‐ ‐ 518,052 518,052
FUND BALANCE, end of year $ ‐ $ 518,052 $ 4,094,639 $ 4,612,691
CITY OF NEW BERN, NORTH CAROLINA
SCHEDULE OF REVENUES, EXPENDITURES,
PROJECT LIFE AS OF JUNE 30, 2016
Actual
112

KALE ROAD PROJECT ENTERPRISE CAPITAL PROJECT FUND
AND CHANGES IN FUND BALANCES ‐ BUDGET AND ACTUAL (NON‐GAAP BASIS)
Project
Authorization Prior Years Current Year Total
EXPENDITURES
Kale Road capital outlay ‐ Electric Fund $ 1,633,181 $ 1,159,773 $ 485,224 $ 1,644,997
Total expenditures 1,633,181 1,159,773 485,224 1,644,997
OTHER FINANCING SOURCES (USES)
Transfer in ‐ Water Capital Reserve 40,900 40,900 ‐ 40,900
Transfer out (2,819) ‐ (2,819) (2,819)
Debt issued ‐ Electric Fund 1,595,100 1,554,200 ‐ 1,554,200
Debt issued ‐ Sewer Fund ‐ 40,900 ‐ 40,900
Total other financing sources (uses) 1,633,181 1,636,000 (2,819) 1,633,181
Net change in fund balance ‐ 476,227 (488,043) (11,816)
FUND BALANCE, beginning of year ‐ ‐ 476,227 476,227
FUND BALANCE, end of year $ ‐ $ 476,227 $ (11,816) $ 464,411
PROJECT LIFE AS OF JUNE 30, 2016
Actual
CITY OF NEW BERN, NORTH CAROLINA
SCHEDULE OF REVENUES, EXPENDITURES,
113

SCHEDULE OF AD VALOREM TAXES RECEIVABLE
Uncollected UncollectedBalance Collections Balance
Fiscal Year June 30, 2015 Additions And Credits June 30, 2016
2015-2016 $ - $ 13,600,271 $ 13,501,551 $ 98,720 2014-2015 129,523 - 77,064 52,459 2013-2014 65,934 - 17,642 48,292 2012-2013 66,084 - 15,098 50,986 2011-2012 41,086 - 6,168 34,918 2010-2011 34,452 - 4,930 29,522 2009-2010 30,853 - 2,048 28,805 2008-2009 33,558 - 1,151 32,407 2007-2008 29,685 - 1,246 28,439 2006-2007 22,594 - 819 21,775 2005-2006 19,672 - 19,672 -
$ 473,441 $ 13,600,271 $ 13,647,389 426,323
Plus: Municipal Service District taxes receivable, all years, net of allowance 1,121 Plus: Ad Valorem Un-Tagged MV-Current 190 Plus: Motor vehicle taxes collected but not received from the County 95,887 Less: allowance for uncollectible accounts - General Fund (232,195)
Ad valorem taxes receivable - net $ 291,326
Reconciliation to revenues:
Ad valorem taxes - General Fund $ 13,843,554 Reconciling items: Interest collected (52,719) Amounts written off per statute 19,672 Releases, ad valorem 33,242 Less Municipal Services District taxes, penalty, and interested collected in all years (196,360) Total collections and credits $ 13,647,389
JUNE 30, 2016
CITY OF NEW BERN, NORTH CAROLINA
114

Property
excluding
Registered Registered
Total Motor Motor
Rate Levy Vehicles Vehicles
Original levy:
Property taxed at current rate $ 2,983,335,008 0.41 $ 13,324,802 12,231,681$ 1,093,121$
Penalties ‐ 4,453 4,453 ‐
Total 2,983,335,008 13,329,255 12,236,134 1,093,121
Discoveries:
Current year taxes 71,260,644 0.41 292,169 292,169 ‐
Penalties ‐ 18,390 18,390 ‐
Addbacks ‐ 270 270 ‐
Total 71,260,644 310,829 310,829 ‐
Abatements (9,710,423) 0.41 (39,813) (39,813) ‐ Total property valuation $ 3,044,885,229
Net levy 13,600,271 12,507,150 1,093,121
Uncollected taxes at June 30, 2016 (98,720) (98,720) ‐
Current year's taxes collected $13,501,551 $12,408,430 1,093,121
Current levy collection percentage 99.27% 99.21% 100.00%
Property
Valuation
City ‐ Wide
CITY OF NEW BERN, NORTH CAROLINA
ANALYSIS OF CURRENT TAX LEVY
CITY‐WIDE LEVY
JUNE 30, 2016
Total Levy
115

STATISTICAL SECTION
STATISTICAL SECTION
This part of the City of New Bern’s comprehensive annual financial report presents detailed information as a context for
understanding what the information in the financial statements, note disclosures, and required supplementary information says
about the City’s overall financial health.
Page
Financial Trends ................................................................................................................................................................ 116
These schedules contain trend information to help the reader understand how the City’s financial performance and
well‐being have changed over time.
Revenue Capacity.............................................................................................................................................................. 130
These schedules contain information to help the reader assess the City’s most significant local revenue source,
property tax.
Debt Capacity ................................................................................................................................................................... 141
These schedules present information to help the reader assess the affordability of the City’s current levels of
outstanding debt and the City’s ability to issue additional debt in the future. Demographic and Economic Information ........................................................................................................................... 145
These schedules offer demographic and economic indicators to help the reader understand the environment within
which the City’s financial activities take place. Operating Information ...................................................................................................................................................... 147
These schedules contain service and infrastructure data to help the reader understand how the information in the
City’s financial report relates to the services the City provides and the activities it performs.
Sources: Unless otherwise noted, the information in these schedules is derived from the comprehensive annual
financial report for the relevant year.

City of New Bern, North Carolina
Net Position By ComponentLast Ten Fiscal Years
(Accrual Basis of Accounting)(Unaudited)
2007 2008 2009 2010Governmental activities:Net investment in capital assets 27,941,069 $ 31,404,726 $ 32,315,686 $ 31,419,739 $ Restricted ‐ ‐ ‐ ‐ Unrestricted 6,149,098 5,203,061 4,219,981 3,051,269
Total governmental activities net position 34,090,167 $ 36,607,787 $ 36,535,667 $ 34,471,008 $
Business‐type activities:Net investment in capital assets 66,649,066 $ 72,480,430 $ 73,993,249 $ 76,160,558 $ Unrestricted 5,543,157 2,920,879 7,218,811 14,211,130
Total business‐type activities net position 72,192,223 $ 75,401,309 $ 81,212,060 $ 90,371,688 $
Primary government:Net investment in capital assets 94,590,135 $ 103,885,156 $ 106,308,935 $ 107,580,297 $ Restricted ‐ ‐ ‐ ‐ Unrestricted 11,692,255 8,123,940 11,438,792 17,262,399
Total primary government net position 106,282,390 $ 112,009,096 $ 117,747,727 $ 124,842,696 $
116

2011 2012 2013 2014 2015 2016
34,018,646 $ 34,826,041 $ 36,383,138 $ 36,694,879 $ 35,607,933 $ 48,007,347 $ 3,840,612 4,317,526 5,611,591 6,851,966 6,181,074 5,857,526 760,319 1,952,892 4,312,131 5,165,362 10,288,946 8,732,911
38,619,577 $ 41,096,459 $ 46,306,860 $ 48,712,207 $ 52,077,953 $ 62,597,784 $
78,578,999 $ 80,159,948 $ 83,796,943 $ 87,019,064 $ 88,323,492 $ 92,187,192 $ 21,659,418 23,829,737 25,922,244 30,841,402 34,398,515 39,952,276
100,238,417 $ 103,989,685 $ 109,719,187 $ 117,860,466 $ 122,722,007 $ 132,139,468 $
112,597,645 $ 114,985,989 $ 120,180,081 $ 123,713,943 $ 123,931,425 $ 140,194,539 $ 3,840,612 4,317,526 5,611,591 6,857,966 6,181,074 5,857,526
22,419,737 25,782,629 30,234,375 36,006,764 44,687,461 48,685,187
138,857,994 $ 145,086,144 $ 156,026,047 $ 166,578,673 $ 174,799,960 $ 194,737,252 $
117

City of New Bern, North Carolina
Changes In Net Position
Last Ten Fiscal Years
(Accrual Basis of Accounting)
(Unaudited)
2007 2008 2009 2010Expenses:Governmental activities:General government 2,611,090 $ 1,740,209 $ 1,607,896 $ 1,715,925 $ Public safety 12,850,444 14,256,696 16,013,462 17,093,862 Public works 1,764,001 4,155,602 4,473,588 4,376,173 Environmental protection 1,553,143 1,857,096 1,913,120 2,033,675 Culture and recreation 1,930,009 2,447,858 2,589,437 2,708,074 Economic and physical development 1,793,777 1,573,632 1,762,996 1,791,932 Interest on long‐term debt 504,338 352,293 536,679 563,132
Total governmental activities expenses 23,006,802 26,383,386 28,897,178 30,282,773
Business‐type activities:Electric 49,951,891 51,942,501 57,412,727 60,061,164 Water 4,580,662 6,003,170 5,688,144 6,331,408 Sewer 9,605,872 9,919,852 10,052,081 10,677,006 Stormwater ‐ ‐ ‐ ‐
Total business‐type activities expenses 64,138,425 67,865,523 73,152,952 77,069,578 Total primary government expenses 87,145,227 94,248,909 102,050,130 107,352,351
Program revenue:Governmental activities:Charges for services:General government 2,216,435 3,646,342 2,734,955 2,919,172 Public safety 68,505 74,246 464,430 414,458 Public works 1,173,852 162,910 198,964 179,765 Environmental protection 1,367,977 1,418,840 1,502,513 1,550,860 Culture and recreation 74,426 93,681 98,533 133,105 Economic and physical development ‐ ‐ 6,000 3,300
Operating grants and contributions:General government ‐ 236,608 ‐ ‐ Public safety 551,151 891,411 349,007 479,895 Public works ‐ ‐ 9,048 ‐ Environmental protection ‐ ‐ 563 63,892 Culture and recreation ‐ 5,762 107,531 7,875 Economic and physical development 596,071 356,331 32,120 120,605
Capital grants and contributions:General government ‐ ‐ ‐ ‐ Public safety ‐ 432,429 105,509 89,130 Public works ‐ 910,462 824,445 738,519 Environmental protection 784,016 ‐ ‐ ‐ Culture and recreation ‐ 12,732 ‐ 27,186 Economic and physical development ‐ 33,841 ‐ ‐
Total governmental activities program revenue 6,832,433 8,275,595 6,433,618 6,727,762
118

2011 2012 2013 2014 2015 2016
1,959,814 $ 2,737,701 $ 2,980,543 $ 3,175,305 $ 3,687,719 $ 2,200,210 $ 15,232,805 15,127,179 15,660,542 15,369,029 14,532,403 15,545,847 3,970,149 5,223,903 2,998,765 4,295,470 4,927,792 5,694,763 2,054,485 2,053,938 1,663,347 1,825,829 1,616,542 2,152,786 2,280,243 2,549,680 2,497,152 2,503,892 2,508,718 3,467,082 1,405,498 1,731,687 2,378,028 2,077,157 1,954,457 3,278,649 518,903 509,077 365,826 342,703 384,309 283,245
27,421,897 29,933,165 28,544,203 29,589,385 29,611,940 32,622,582
61,298,449 60,325,099 57,737,100 59,713,453 57,874,790 47,214,077 6,699,559 9,195,478 8,677,687 8,665,646 8,503,552 7,916,627
10,233,465 10,442,463 10,830,003 9,727,442 9,945,031 9,406,883 ‐ 74,153 671,691 633,072 551,635 610,819
78,231,473 80,037,193 77,916,481 78,739,613 76,875,008 65,148,406 105,653,370 109,970,358 106,460,684 108,328,998 106,486,948 97,770,988
3,158,508 1,945,596 1,554,015 1,591,361 1,282,636 642,598 355,296 185,272 519,536 337,912 270,426 225,570 247,586 130,132 987 11,000 ‐ 141,675
1,861,267 2,149,340 2,280,468 2,817,704 2,878,437 2,837,409 133,623 167,033 152,022 227,068 133,290 139,581
1,600 565,279 962,406 550,112 519,918 674,188
‐ ‐ ‐ 174,765 353,805 50,000 125,120 601,199 1,526,387 676,810 417,906 410,522
‐ 1,320,993 812,542 871,986 49,700 ‐ 145,054 161,299 ‐ ‐ ‐ ‐ 12,383 ‐ ‐ ‐ 143,168 2,256 52,762 293,530 1,290,569 110,661 714,850 911,759
‐ ‐ ‐ ‐ 929,785 ‐ 542,146 397,053 ‐ ‐ 26,845 ‐ 754,012 834,142 323,776 ‐ 187,745 11,005,003 (1)
‐ ‐ ‐ ‐ ‐ ‐ 460,082 ‐ ‐ ‐ ‐ ‐ 758,500 ‐ ‐ 68,424 80,260 835,465
8,607,939 8,750,868 9,422,708 7,437,803 7,988,771 17,876,026 (continued)
119

City of New Bern, North Carolina
Changes In Net Position
Last Ten Fiscal Years
(Accrual Basis of Accounting)
(Unaudited)
2007 2008 2009 2010Business‐type activities:Charges for services:Electric 51,077,708 $ 53,551,679 $ 61,694,281 $ 64,846,861 $Water 5,377,310 6,095,579 6,877,360 9,768,948 Sewer 10,864,324 11,945,455 11,406,773 12,383,344 Stormwater ‐ ‐ ‐ ‐
Capital grants and contributions:Electric 34,858 ‐ ‐ ‐ Water 755,828 ‐ 360,626 342,085 Sewer 4,211,536 598,245 841,156 449,829 Stormwater ‐ ‐ ‐ ‐
Operating grants and contributions:Electric ‐ ‐ ‐ ‐ Water ‐ ‐ ‐ ‐ Sewer ‐ ‐ ‐ ‐ Stormwater ‐ ‐ ‐ ‐
Total business‐type activities program revenues 72,321,564 72,190,958 81,180,196 87,791,067 Total primary government program revenues 79,153,997 80,466,553 87,613,814 94,518,829
Net (expense) revenue:Governmental activities (16,174,369) (18,107,791) (22,463,560) (23,555,011) Business‐type activities 8,183,139 4,325,435 8,027,244 10,721,489
Total primary government net expense (7,991,230) (13,782,356) (14,436,316) (12,833,522)
(Continued)
120

2011 2012 2013 2014 2015 2016
65,916,870 $ 60,516,535 $ 61,909,426 $ 63,763,783 $ 62,405,986 $ 52,734,945 $ 11,130,551 10,890,900 10,431,265 10,423,585 10,582,049 10,147,159 12,298,288 12,091,162 11,945,804 11,669,211 10,869,545 11,946,470
‐ 87,917 712,500 675,590 673,773 681,209
44,523 ‐ ‐ ‐ 33,208 ‐ 341,531 ‐ ‐ 152,400 ‐ ‐ 303,631 ‐ ‐ 233,027 76,311 ‐
‐ ‐ ‐ 1,014,571 5,285 ‐
‐ 1,417,005 539,058 171,545 24,883 ‐ ‐ 273,795 177,669 245,689 295,774 ‐ ‐ 382,268 358,422 422,744 978,027 ‐ ‐ ‐ 452 ‐ 240 ‐
90,035,394 85,659,582 86,074,596 88,772,145 85,945,081 75,509,783 98,643,333 94,410,450 95,497,304 96,209,948 93,933,852 93,385,809
(18,813,958) (21,182,297) (19,121,495) (22,151,582) (21,623,169) (14,746,556) 11,803,921 5,622,389 8,158,115 10,032,532 9,070,073 10,361,377 (7,010,037) (15,559,908) (10,963,380) (12,119,050) (12,553,096) (4,385,179)
(continued)
121

City of New Bern, North Carolina
Changes In Net Position (Continued)
Last Ten Fiscal Years
(Accrual Basis of Accounting)
(Unaudited)
2007 2008 2009 2010General revenues and other changes in net position:Governmental activities:Taxes:Ad valorem taxes 10,004,106 $ 11,394,396 $ 11,976,146 $ 12,043,657 $ Sales taxes 4,886,739 5,050,076 4,992,972 4,707,615 Utility franchise tax ‐ ‐ 1,455,896 1,482,365 Payment in Lieu of Taxes ‐ ‐ ‐ ‐ Other taxes 2,206,366 2,762,008 1,672,945 1,663,842
Grants & contributions not restricted to specific programs 268,561 ‐ ‐ ‐ Investment earnings ‐ 220,341 56,074 12,916 Miscellaneous ‐ ‐ ‐ ‐ Gain on sale of capital assets ‐ ‐ ‐ ‐ Transfers 609,202 1,198,590 2,237,407 1,579,957
Total governmental activities 17,974,974 20,625,411 22,391,440 21,490,352
Business‐type activities:Investment earnings 169,450 82,241 20,914 18,096 Gain on sale of capital assets ‐ ‐ ‐ ‐ Transfers (609,202) (1,198,590) (2,237,407) (1,579,957)
Total business‐type activities (439,752) (1,116,349) (2,216,493) (1,561,861) Total primary government 17,535,222 19,509,062 20,174,947 19,928,491
Changes in net position:Governmental activities 1,800,605 2,517,620 (72,120) (2,064,659) Business‐type activities 7,743,387 3,209,086 5,810,751 9,159,628
Total primary government 9,543,992 $ 5,726,706 $ 5,738,631 $ 7,094,969 $
(1) During the 2016 fiscal year the City received significantly more donated roadways than in prior years.
122
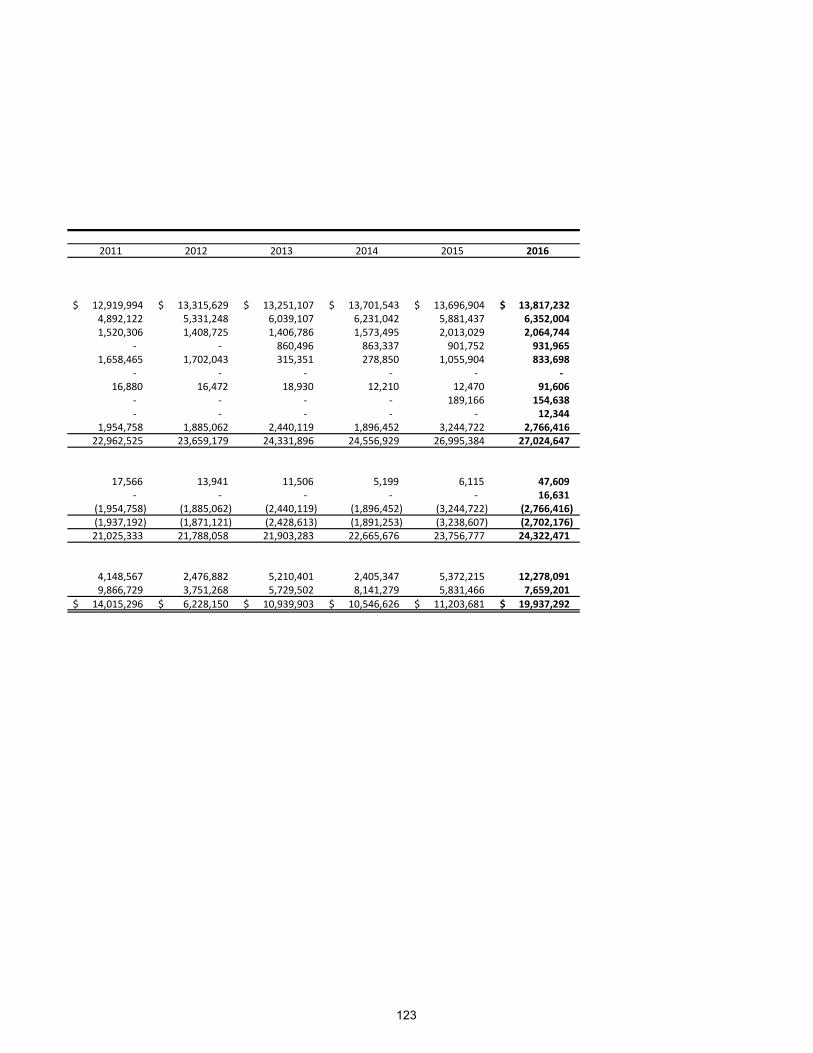
2011 2012 2013 2014 2015 2016
12,919,994 $ 13,315,629 $ 13,251,107 $ 13,701,543 $ 13,696,904 $ 13,817,232 $ 4,892,122 5,331,248 6,039,107 6,231,042 5,881,437 6,352,004 1,520,306 1,408,725 1,406,786 1,573,495 2,013,029 2,064,744
‐ ‐ 860,496 863,337 901,752 931,965 1,658,465 1,702,043 315,351 278,850 1,055,904 833,698
‐ ‐ ‐ ‐ ‐ ‐ 16,880 16,472 18,930 12,210 12,470 91,606
‐ ‐ ‐ ‐ 189,166 154,638 ‐ ‐ ‐ ‐ ‐ 12,344
1,954,758 1,885,062 2,440,119 1,896,452 3,244,722 2,766,416 22,962,525 23,659,179 24,331,896 24,556,929 26,995,384 27,024,647
17,566 13,941 11,506 5,199 6,115 47,609 ‐ ‐ ‐ ‐ ‐ 16,631
(1,954,758) (1,885,062) (2,440,119) (1,896,452) (3,244,722) (2,766,416) (1,937,192) (1,871,121) (2,428,613) (1,891,253) (3,238,607) (2,702,176) 21,025,333 21,788,058 21,903,283 22,665,676 23,756,777 24,322,471
4,148,567 2,476,882 5,210,401 2,405,347 5,372,215 12,278,091 9,866,729 3,751,268 5,729,502 8,141,279 5,831,466 7,659,201
14,015,296 $ 6,228,150 $ 10,939,903 $ 10,546,626 $ 11,203,681 $ 19,937,292 $
123

City of New Bern, North Carolina
Program Revenues by Function/Program, Net of ExpenseLast Ten Fiscal Years
(Accrual Basis of Accounting)
(Unaudited)
Function / Program 2007 2008 2009 2010
Governmental activities:General government (394,655) $ 2,142,741 $ 1,127,059 $ 1,203,247 $ Public safety (12,230,788) (12,858,610) (15,094,516) (16,110,379) Public works (590,149) (3,082,230) (3,441,131) (3,457,889) Environmental protection 598,850 (438,256) (410,044) (418,923) Culture and recreation (1,855,583) (2,335,683) (2,383,373) (2,539,908) Economic and physical development (1,197,706) (1,183,460) (1,724,876) (1,668,027) Interest on long‐term debt (504,338) (352,293) (536,679) (563,132)
Total governmental activities (16,174,369) (18,107,791) (22,463,560) (23,555,011)
Business‐type activities:Electric 1,160,675 1,609,178 4,281,554 4,785,697 Water 1,552,476 92,409 1,549,842 3,779,625 Sewer 5,469,988 2,623,848 2,195,848 2,156,167 Stormwater ‐ ‐ ‐ ‐
Total business‐type activities 8,183,139 4,325,435 8,027,244 10,721,489
Total government (7,991,230) $ (13,782,356) $ (14,436,316) $ (12,833,522) $
Source: City records.
124

2011 2012 2013 2014 2015 2016
1,198,694 $ (792,105) $ (1,426,528) $ (1,409,179) $ (1,121,493) $ (1,507,612) $ (14,210,243) (13,943,655) (13,614,619) (14,354,307) (13,817,226) (14,909,755) (2,968,551) (2,938,636) (1,861,460) (3,412,484) (4,690,347) 5,451,915
(48,164) 256,701 617,121 991,875 1,261,895 684,623 (1,674,155) (2,382,647) (2,345,130) (2,276,824) (2,232,260) (3,325,245) (592,636) (872,878) (125,053) (1,347,960) (639,429) (857,237) (518,903) (509,077) (365,826) (342,703) (384,309) (283,245)
(18,813,958) (21,182,297) (19,121,495) (22,151,582) (21,623,169) (14,746,556)
4,662,944 1,608,441 4,711,384 4,221,875 4,589,287 5,520,868 4,772,523 1,969,217 1,931,247 2,156,028 2,374,271 2,230,532 2,368,454 2,030,967 1,474,223 2,597,540 1,978,852 2,539,587
‐ 13,764 41,261 1,057,089 127,663 70,390 11,803,921 5,622,389 8,158,115 10,032,532 9,070,073 10,361,377
(7,010,037) $ (15,559,908) $ (10,963,380) $ (12,119,050) $ (12,553,096) $ (4,385,179) $
125
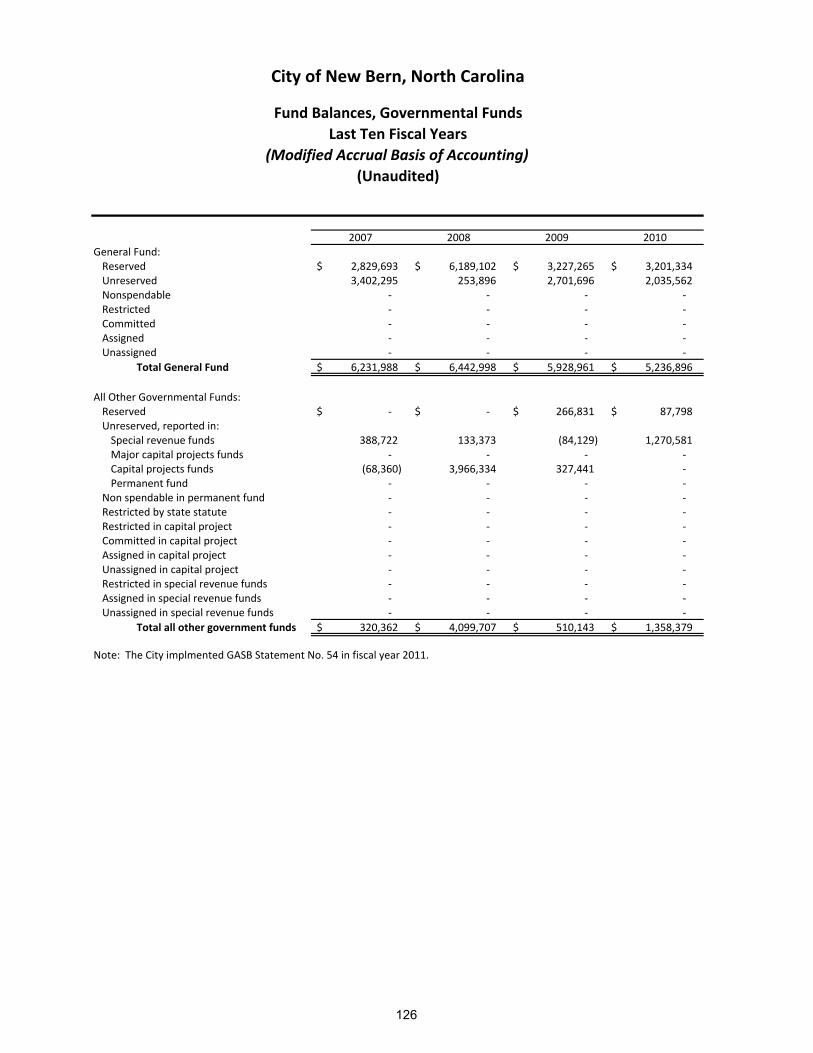
City of New Bern, North Carolina
Fund Balances, Governmental Funds
Last Ten Fiscal Years
(Modified Accrual Basis of Accounting)
(Unaudited)
2007 2008 2009 2010General Fund:Reserved 2,829,693 $ 6,189,102 $ 3,227,265 $ 3,201,334 $ Unreserved 3,402,295 253,896 2,701,696 2,035,562 Nonspendable ‐ ‐ ‐ ‐ Restricted ‐ ‐ ‐ ‐ Committed ‐ ‐ ‐ ‐ Assigned ‐ ‐ ‐ ‐ Unassigned ‐ ‐ ‐ ‐
Total General Fund 6,231,988 $ 6,442,998 $ 5,928,961 $ 5,236,896 $
All Other Governmental Funds:Reserved ‐$ ‐$ 266,831 $ 87,798 $ Unreserved, reported in:Special revenue funds 388,722 133,373 (84,129) 1,270,581 Major capital projects funds ‐ ‐ ‐ ‐ Capital projects funds (68,360) 3,966,334 327,441 ‐ Permanent fund ‐ ‐ ‐ ‐
Non spendable in permanent fund ‐ ‐ ‐ ‐ Restricted by state statute ‐ ‐ ‐ ‐ Restricted in capital project ‐ ‐ ‐ ‐ Committed in capital project ‐ ‐ ‐ ‐ Assigned in capital project ‐ ‐ ‐ ‐ Unassigned in capital project ‐ ‐ ‐ ‐ Restricted in special revenue funds ‐ ‐ ‐ ‐ Assigned in special revenue funds ‐ ‐ ‐ ‐ Unassigned in special revenue funds ‐ ‐ ‐ ‐
Total all other government funds 320,362 $ 4,099,707 $ 510,143 $ 1,358,379 $
Note: The City implmented GASB Statement No. 54 in fiscal year 2011.
126

2011 2012 2013 2014 2015 2016
‐$ ‐$ ‐$ ‐$ ‐$ ‐$ ‐ ‐ ‐ ‐ ‐ ‐
168,263 141,201 140,908 148,408 138,418 106,353 2,771,830 3,397,888 4,261,890 4,731,384 5,373,068 5,370,614
‐ ‐ ‐ ‐ ‐ ‐ ‐ ‐ ‐ ‐ ‐ 2,000,000
4,604,056 6,786,387 7,449,776 9,496,813 14,753,694 12,976,430
7,544,149 $ 10,325,476 $ 11,852,574 $ 14,376,605 $ 20,265,180 $ 20,453,397 $
‐$ ‐$ ‐$ ‐$ ‐$ ‐$
‐ ‐ ‐ ‐ ‐ ‐ ‐ ‐ ‐ ‐ ‐ ‐ ‐ ‐ ‐ ‐ ‐ ‐ ‐ ‐ 735,341 304,226 ‐ ‐ ‐ ‐ ‐ ‐ 418,676 34,092
394,325 326,614 324,372 455,346 ‐ ‐ 391,977 322,202 289,988 181,101 185,277 ‐
‐ ‐ ‐ ‐ ‐ 195,745 (2,348) (4,412) (33,941) ‐ ‐ ‐
1,288,530 733,213 ‐ ‐ 389,330 476,420 5,500 ‐ ‐ ‐ ‐ ‐
(799,068) (73,786) (368,626) (460,273) (539,445) (1,024,785)
1,278,916 $ 1,303,831 $ 947,134 $ 480,400 $ 453,838 $ (318,528) $
127

City of New Bern, North Carolina
Changes In Fund Balances, Governmental Funds
Last Ten Fiscal Years
(Modified Accrual Basis of Accounting)
(Unaudited)
2007 2008 2009 2010Revenues:Taxes 9,997,047 $ 11,355,453 $ 11,916,033 $ 11,935,701 $ Other taxes 276,852 286,108 282,833 268,819 Intergovernmental 9,005,926 10,175,984 9,258,155 9,112,105 Permits and fees 744,445 519,042 537,054 557,945 Charges for services 3,192,832 3,260,934 4,021,657 3,930,456 Investment earnings ‐ ‐ ‐ ‐ Other 640,628 451,825 249,061 217,419
Total revenues 23,857,730 26,049,346 26,264,793 26,022,445
Expenditures:General government 496,371 735,151 594,586 553,996 Public safety 13,033,632 14,389,262 14,640,876 15,115,471 Public works 3,350,136 3,665,542 3,763,739 3,394,160 Environmental protection 1,738,901 1,789,423 1,856,632 1,959,738 Culture and recreation 2,102,302 2,262,132 2,304,822 2,309,096 Economic and physical development 1,793,777 2,463,087 1,669,949 1,647,002 Interfund reimbursements ‐ ‐ ‐ ‐ Capital outlay 1,767,427 3,726,453 6,243,472 457,895 Debt service:Principal 1,978,519 2,001,293 2,434,480 2,196,177 Interest 504,339 352,562 536,681 563,134
Total expenditures 26,765,404 31,384,905 34,045,237 28,196,669
Excess of revenues (under) expenditures (2,907,674) (5,335,559) (7,780,444) (2,174,224)
Other financing sources (uses):Transfers in 662,989 1,605,312 1,308,391 1,907,075 Transfers out (53,787) (406,722) ‐ (327,118) Proceeds from sales of capital assets ‐ ‐ ‐ ‐ Issuance of long‐term debt 1,482,631 8,127,324 2,368,452 750,438
Total other financing sources 2,091,833 9,325,914 3,676,843 2,330,395
Net changes in fund balance (815,841) $ 3,990,355 $ (4,103,601) $ 156,171 $
Debt service as a percentage of noncapital expenditures 10.9% 9.4% 11.2% 10.1%
(1) During the fiscal years ended June 30, 2015 and June 30, 2016 capital outlays were reported as functional expenditures(2) During the fiscal years ended June 30, 2013 through June 30, 2015 the interfund allocation of administrative costswere not allocated to the respective departments to reduce the expenditures.
128
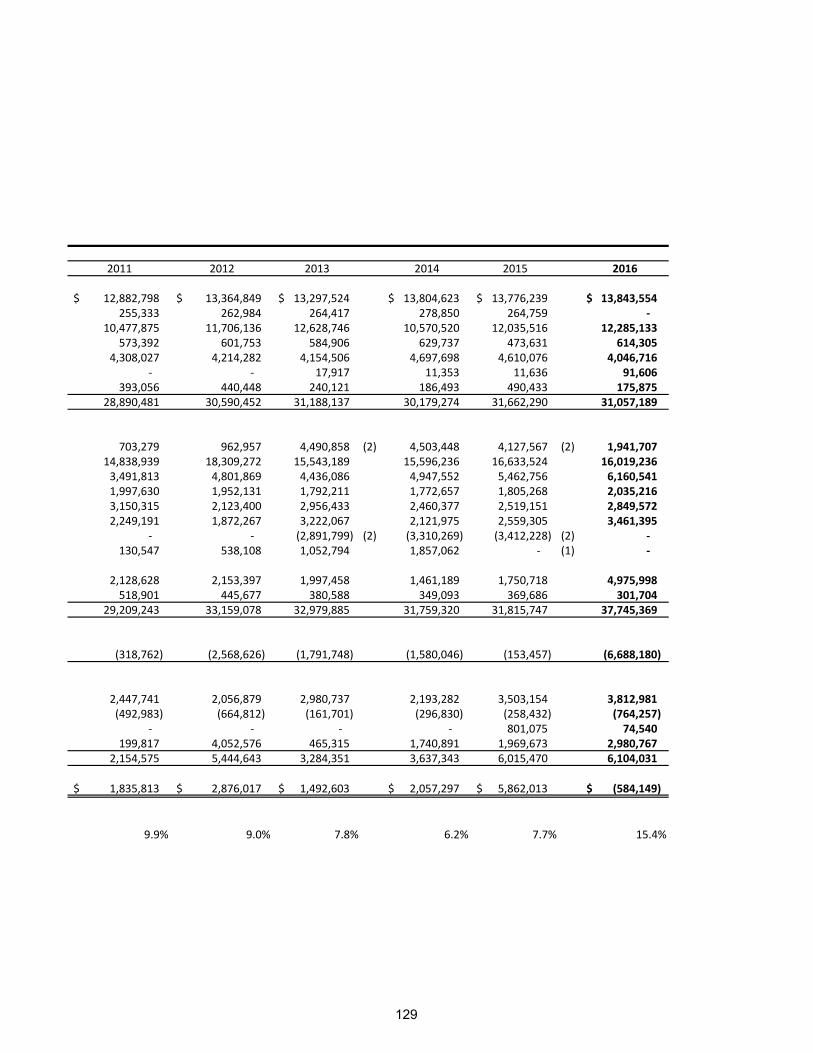
2011 2012 2013 2014 2015 2016
12,882,798 $ 13,364,849 $ 13,297,524 $ 13,804,623 $ 13,776,239 $ 13,843,554 $ 255,333 262,984 264,417 278,850 264,759 ‐
10,477,875 11,706,136 12,628,746 10,570,520 12,035,516 12,285,133 573,392 601,753 584,906 629,737 473,631 614,305
4,308,027 4,214,282 4,154,506 4,697,698 4,610,076 4,046,716 ‐ ‐ 17,917 11,353 11,636 91,606
393,056 440,448 240,121 186,493 490,433 175,875 28,890,481 30,590,452 31,188,137 30,179,274 31,662,290 31,057,189
703,279 962,957 4,490,858 (2) 4,503,448 4,127,567 (2) 1,941,707 14,838,939 18,309,272 15,543,189 15,596,236 16,633,524 16,019,236 3,491,813 4,801,869 4,436,086 4,947,552 5,462,756 6,160,541 1,997,630 1,952,131 1,792,211 1,772,657 1,805,268 2,035,216 3,150,315 2,123,400 2,956,433 2,460,377 2,519,151 2,849,572 2,249,191 1,872,267 3,222,067 2,121,975 2,559,305 3,461,395
‐ ‐ (2,891,799) (2) (3,310,269) (3,412,228) (2) ‐ 130,547 538,108 1,052,794 1,857,062 ‐ (1) ‐
2,128,628 2,153,397 1,997,458 1,461,189 1,750,718 4,975,998 518,901 445,677 380,588 349,093 369,686 301,704
29,209,243 33,159,078 32,979,885 31,759,320 31,815,747 37,745,369
(318,762) (2,568,626) (1,791,748) (1,580,046) (153,457) (6,688,180)
2,447,741 2,056,879 2,980,737 2,193,282 3,503,154 3,812,981 (492,983) (664,812) (161,701) (296,830) (258,432) (764,257)
‐ ‐ ‐ ‐ 801,075 74,540 199,817 4,052,576 465,315 1,740,891 1,969,673 2,980,767
2,154,575 5,444,643 3,284,351 3,637,343 6,015,470 6,104,031
1,835,813 $ 2,876,017 $ 1,492,603 $ 2,057,297 $ 5,862,013 $ (584,149) $
9.9% 9.0% 7.8% 6.2% 7.7% 15.4%
129
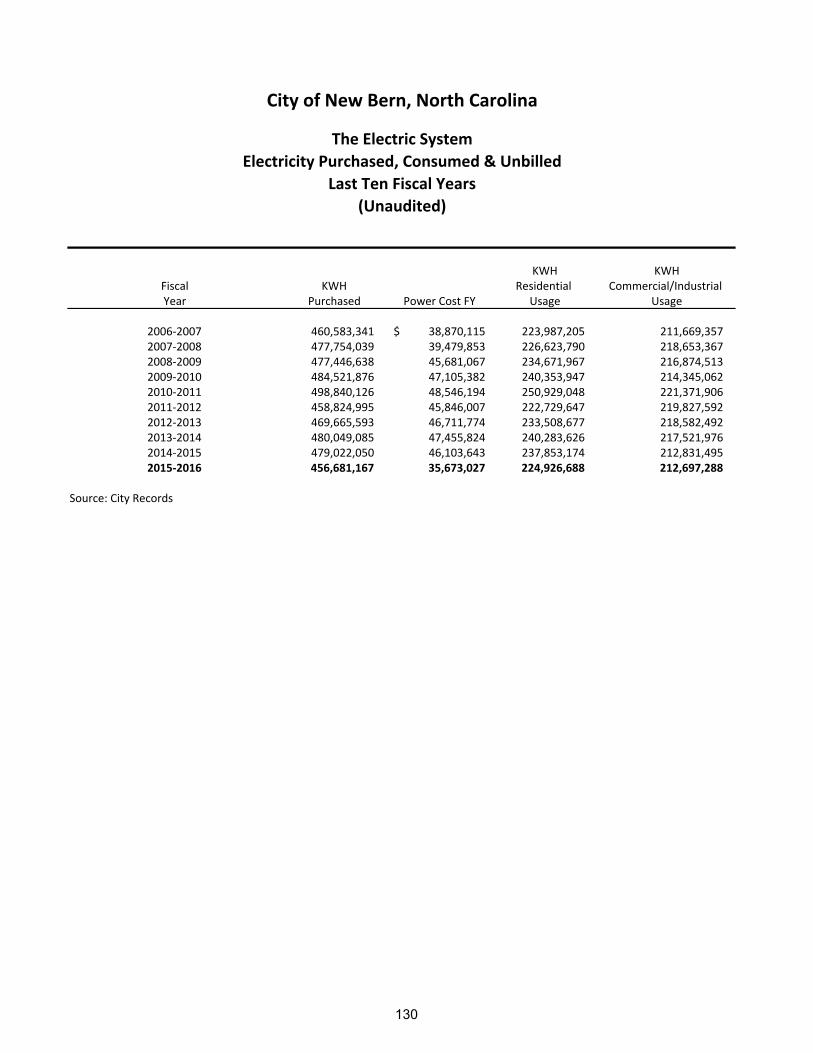
City of New Bern, North Carolina
The Electric System
Electricity Purchased, Consumed & Unbilled
Last Ten Fiscal Years
(Unaudited)
KWH KWHFiscal KWH Residential Commercial/Industrial Year Purchased Power Cost FY Usage Usage
2006‐2007 460,583,341 38,870,115$ 223,987,205 211,669,357 2007‐2008 477,754,039 39,479,853 226,623,790 218,653,367 2008‐2009 477,446,638 45,681,067 234,671,967 216,874,513 2009‐2010 484,521,876 47,105,382 240,353,947 214,345,062 2010‐2011 498,840,126 48,546,194 250,929,048 221,371,906 2011‐2012 458,824,995 45,846,007 222,729,647 219,827,592 2012‐2013 469,665,593 46,711,774 233,508,677 218,582,492 2013‐2014 480,049,085 47,455,824 240,283,626 217,521,976 2014‐2015 479,022,050 46,103,643 237,853,174 212,831,495 2015‐2016 456,681,167 35,673,027 224,926,688 212,697,288
Source: City Records
130

KWH KWH PurchasedOther Total KWH KWH Electric RateUsage Usage Unbilled Unbilled % (.00/KWH)
344,640 436,001,202 24,582,139$ 5% 0.0844$ 1,261,872 356,160 445,633,317 32,120,722 7% 0.0826 1,308,915 345,600 451,892,080 25,554,558 5% 0.0957 1,308,073 322,320 455,021,329 29,500,547 6% 0.0972 1,327,457 272,880 472,573,834 26,266,292 5% 0.0973 1,366,685 101,760 442,658,999 16,165,996 4% 0.0999 1,257,055 14,640 452,105,809 17,559,784 4% 0.0995 1,286,755
114,000 457,919,602 22,129,483 5% 0.0989 1,315,203 246,240 450,930,909 28,091,141 6% 0.0962 1,312,389 341,520 437,965,496 18,715,671 4% 0.0781 1,251,181
Daily Average
Usage
131
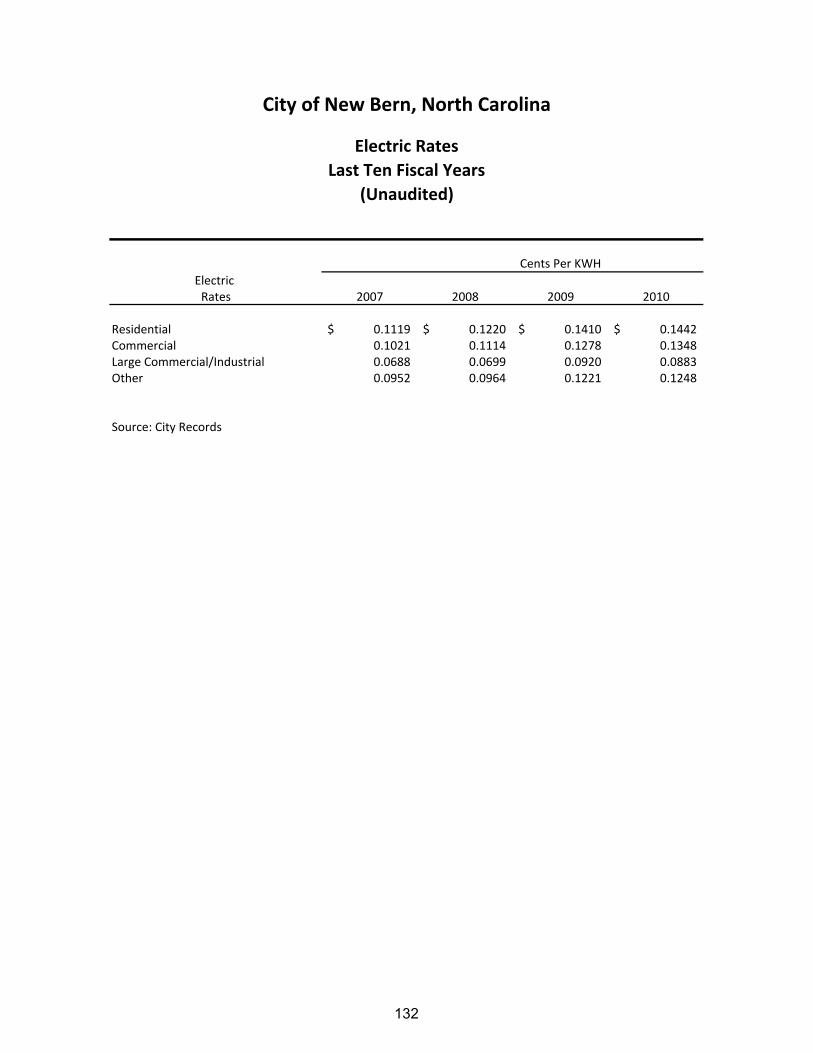
City of New Bern, North Carolina
Electric Rates
Last Ten Fiscal Years
(Unaudited)
Electric Rates 2007 2008 2009 2010
Residential 0.1119$ 0.1220$ 0.1410$ 0.1442$ Commercial 0.1021 0.1114 0.1278 0.1348 Large Commercial/Industrial 0.0688 0.0699 0.0920 0.0883 Other 0.0952 0.0964 0.1221 0.1248
Source: City Records
Cents Per KWH
132
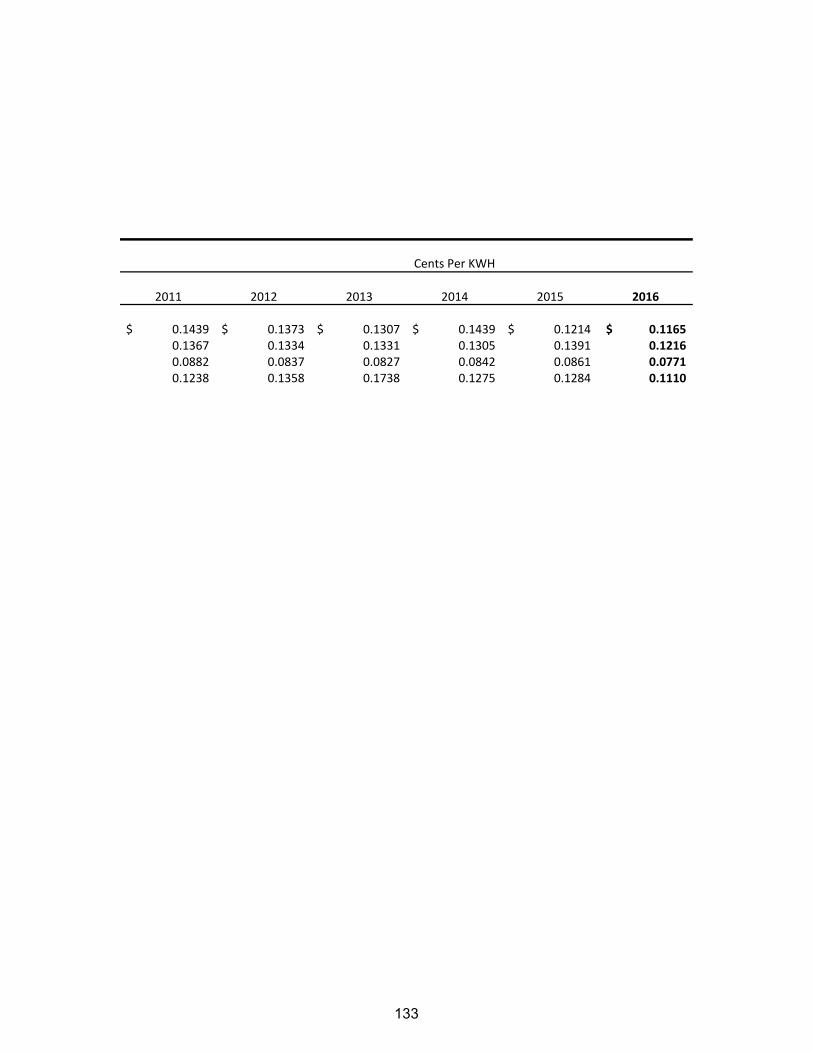
2011 2012 2013 2014 2015 2016
0.1439$ 0.1373$ 0.1307$ 0.1439$ 0.1214$ 0.1165$ 0.1367 0.1334 0.1331 0.1305 0.1391 0.1216 0.0882 0.0837 0.0827 0.0842 0.0861 0.0771 0.1238 0.1358 0.1738 0.1275 0.1284 0.1110
Cents Per KWH
133

City of New Bern, North Carolina
Electric System ‐ Major Users
Current Year and Nine Years Ago
(Unaudited)
Percentage Percentage of Total of Total
Annual Annual Electric Annual Annual Electric Rank Customer KWH Revenues Sales Rank Customer KWH Revenues Sales1 Carolina East Medical Center 18,163,200 $1,162,544 2.03% 1 Hatteras Yachts 12,936,000 $1,427,630 2.88%2 Craven Community 7,806,000 540,636 0.94% 2 Carolina East Medical Center 16,466,400 1,123,251 2.27%3 Hatteras Yacht 6,504,000 393,972 0.69% 3 Maola 5,674,800 579,397 1.17%4 City of New Bern STP 5,981,280 416,321 0.73% 4 Craven Community College 5,649,600 663,737 1.34%5 Wal‐Mart Havelock 4,890,600 340,923 0.59% 5 City of New Bern STP 5,375,520 382,473 0.77%6 Lowe's 2,503,600 195,164 0.34% 6 Lowe's 3,398,400 221,814 0.45%7 Carolina Telephone 2,352,000 217,233 0.38% 7 Craven Terrace 2,322,480 1,123,251 2.27%8 Sonoco Products co. 2,194,000 250,483 0.44% 8 New Bern Housing Authority 2,094,240 225,138 0.45%9 New Bern Housing Authority 2,030,880 211,416 0.37% 9 Carolina Telephone 1,999,600 190,251 0.38%10 N.C. Dept of Culture 1,981,800 218,395 0.38% 10 Craven County 1,721,952 497,362 1.00%
Revenue for All Revenue for AllTotals $57,308,462 54,407,360 $3,947,087 Totals $49,549,751 57,638,992 $6,434,304
Source: City Records
2016 2007
134

City of New Bern, North Carolina
Water System ‐ Major Users
Current Year and Nine Years Ago
(Unaudited)
Percentage Percentage of Total of Total
Annual Annual Electric Annual Annual Electric Rank Customer Gallons Revenues Sales Rank Customer Gallons Revenues Sales1 Craven Wood Energy 45,409 363,377$ 3.73% 1 Carolina East Medical Center 31,464 97,455$ 1.99%2 Carolina East Medical Center 13,538 131,441 1.35% 2 Craven Terrace 5‐2 13,288 43,885 0.90%3 Craven Terrace 13,010 54,736 0.56% 3 Maola 18,380 31,158 0.64%4 New Bern Housing Authority 10,005 44,972 0.46% 4 Moen 13,273 30,966 0.63%5 Moen 8,749 40,356 0.41% 5 Town of Cove City 14,135 25,127 0.51%6 RPG Hospitality 6,751 43,667 0.45% 6 NB Craven Board of Education 12,921 23,086 0.47%7 New Bern Health Holdings 6,718 26,195 0.27% 7 NB Housing Authority ‐ Trent Ct. 9,664 20,891 0.43%8 UHS Pruitt Corp 4,713 23,430 0.24% 8 Trent Court Apt 5‐3 8,808 17,104 0.35%9 BSH Home Appliance 3,762 19,998 0.21% 9 Sheraton Hotel 6,690 13,453 0.27%10 Sonoco 3,726 22,037 0.23% 10 Constant Care Services 3449 6,324 0.13%
Revenue for All Revenue for AllTotals $9,750,151 116,381 770,209$ Totals $4,901,653 132,072 309,449$
Source: City Records
2016 2007
135
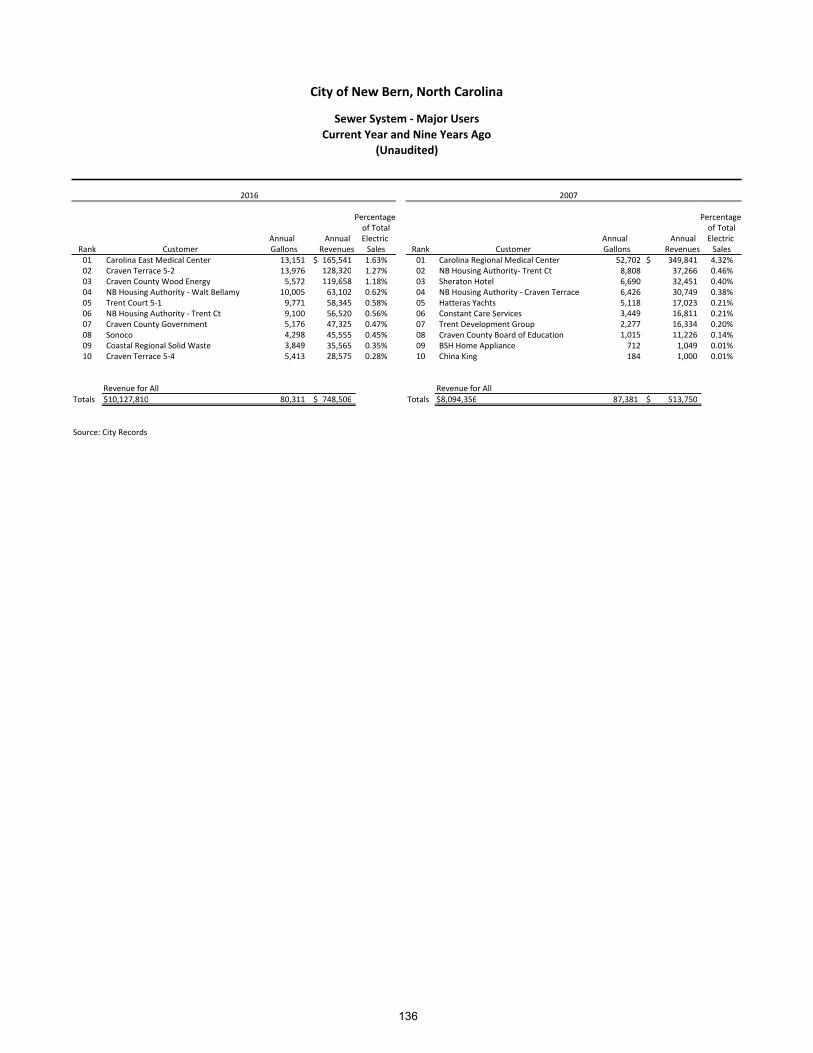
City of New Bern, North Carolina
Sewer System ‐ Major Users
Current Year and Nine Years Ago
(Unaudited)
Percentage Percentage of Total of Total
Annual Annual Electric Annual Annual Electric Rank Customer Gallons Revenues Sales Rank Customer Gallons Revenues Sales01 Carolina East Medical Center 13,151 165,541$ 1.63% 01 Carolina Regional Medical Center 52,702 349,841$ 4.32%02 Craven Terrace 5‐2 13,976 128,320 1.27% 02 NB Housing Authority‐ Trent Ct 8,808 37,266 0.46%03 Craven County Wood Energy 5,572 119,658 1.18% 03 Sheraton Hotel 6,690 32,451 0.40%04 NB Housing Authority ‐ Walt Bellamy 10,005 63,102 0.62% 04 NB Housing Authority ‐ Craven Terrace 6,426 30,749 0.38%05 Trent Court 5‐1 9,771 58,345 0.58% 05 Hatteras Yachts 5,118 17,023 0.21%06 NB Housing Authority ‐ Trent Ct 9,100 56,520 0.56% 06 Constant Care Services 3,449 16,811 0.21%07 Craven County Government 5,176 47,325 0.47% 07 Trent Development Group 2,277 16,334 0.20%08 Sonoco 4,298 45,555 0.45% 08 Craven County Board of Education 1,015 11,226 0.14%09 Coastal Regional Solid Waste 3,849 35,565 0.35% 09 BSH Home Appliance 712 1,049 0.01%10 Craven Terrace 5‐4 5,413 28,575 0.28% 10 China King 184 1,000 0.01%
Revenue for All Revenue for AllTotals $10,127,810 80,311 748,506$ Totals $8,094,356 87,381 513,750$
Source: City Records
2016 2007
136

City of New Bern, North CarolinaAssessed Value and Estimated Actual Value of Taxable Property
Last Ten Fiscal Years
(Unaudited)
Fiscal Total Estimated AssessedYear Less Total Taxable Direct Actual Value as aEnded Residential Commercial Motor Tax Exempt Assessed Tax Taxable Percentage ofJune 30, Property Property Vehicles Other Real Property Value Rate Value (1) Actual Value (2)
2007 1,009,184,721 600,579,392 240,416,975 248,109,734 6,080,824 2,092,209,998 0.470 3,049,424,279 68.61%2008 1,076,646,139 641,116,122 244,900,964 261,991,233 5,836,701 2,218,817,757 0.505 3,354,221,855 66.15%2009 1,146,888,181 682,642,384 233,661,254 274,372,842 6,720,461 2,330,844,200 0.505 3,495,567,187 66.68%2010 1,175,109,254 698,743,698 215,576,429 263,121,567 8,048,686 2,344,502,262 0.505 2,346,849,111 99.90%
2011 (3) 1,654,793,516 983,704,603 217,961,102 268,536,167 11,783,558 3,113,211,830 0.410 3,075,384,599 101.23%2012 1,691,989,475 1,004,138,358 227,578,581 221,190,195 14,850,508 3,130,046,101 0.410 2,931,029,217 106.79%2013 1,699,293,395 1,007,925,555 233,561,473 269,508,198 15,828,950 3,194,459,671 0.410 2,826,455,212 113.02%2014 1,721,521,337 1,007,745,243 133,550,747 250,894,383 16,129,202 3,097,582,508 0.410 2,737,831,455 113.14%2015 1,740,351,357 1,012,722,260 236,218,399 305,526,099 17,492,541 3,277,325,574 0.410 2,742,616,664 119.50%2016 1,756,129,303 1,022,041,633 235,673,549 286,274,025 17,569,333 3,046,875,628 0.410 3,035,643,746 100.37%
Source: Craven County Tax OfficeNotes: (1) Per $100 of value(2) The estimated market value is calculated by dividing the assessed value by an assessment ‐to‐sales ratio determined by the State Department of Revenue. The ratio is based on actual property sales within Craven County which took place in the calendar year ending during the fiscal year. (3) Property tax is reassessed every eight years by Craven County. The last reassessment was on January 1, 2010 and was the basis for fiscal 2011 taxes.
Real Property Personal Property
137

City of New Bern, North Carolina
Property Tax Levies and Collections
Last Ten Fiscal Years
(Unaudited)
Fiscal Year Total Tax CollectionsEnded Levy for Percentage in Subsequent PercentageJune 30, Fiscal Year Amount of Levy Years Amount of Levy
2007 8,911,639$ 8,856,640$ 99.38% 26,275$ 8,882,915$ 99.68%2008 10,256,118 10,175,877 99.22% 33,771 10,209,648 99.55%2009 10,882,144 10,731,998 98.62% 93,472 10,825,470 99.48%2010 11,031,702 10,769,066 97.62% 206,425 10,975,491 99.49%2011 12,150,856 11,833,088 97.38% 244,008 12,077,096 99.39%2012 13,034,415 12,694,505 97.39% 203,288 12,897,793 98.95%2013 13,113,654 12,801,046 97.62% 215,515 13,016,561 99.26%2014 12,713,597 12,533,988 98.59% 100,722 12,634,710 99.38%2015 12,411,797 11,974,859 96.48% 77,064 12,051,923 97.10%2016 12,502,513 12,403,793 99.21% ‐ 12,403,793 99.21%
Source: City property tax records
Fiscal Year of the LevyCollected within the
Total Collections to Date
138

City of New Bern, North Carolina
Principal Taxpayers
Current Year and Nine Years Ago
(Unaudited)
Percentage Percentageof Total of Total
Nature of Assessed Assessed Nature of Assessed AssessedName of Taxpayer Property Value Rank Value Name of Taxpayer Property Value Rank Value
BSH Home Appliances Household Appliances 87,910,974$ 1 2.89% BSH Home Appliances Household Appliances 98,259,156$ 1 4.70%New Bern Riverfront Developer(Condos) 24,890,230 2 0.82% Hatteras Yachts, Inc Boat Manufacturing 30,002,144 2 1.43%New Bern Apartments, LLC Residential Rental 15,095,880 3 0.50% Carolina Telephone Telephone Service 17,246,398 3 0.82%DRA Woodland Crossing LP Residential Rental 15,029,380 4 0.49% DDR Xenia & New Bern LLC Retail Sales 13,536,930 4 0.65%ATTA Holdings Medical Offices 14,497,300 5 0.48% HS New Bern LLC Retail Shopping Center 12,371,287 5 0.59%Navis HCY Real Estate LLC Boat Manufactoring 13,285,490 6 0.44% Amital Spinning Corp Yarn/Textile Manufactorer 12,213,613 6 0.58%Wal Mart Real Estate Business Trust Retail Sales 12,364,570 7 0.41% Thomas F & Karen Webb Developer 11,782,315 7 0.56%Overlook Holdings LLC Developer 12,156,670 8 0.40% Trent Neuse Hotel LLC Hotel 9,402,149 8 0.45%Carolina Telephone Telephone Service 12,122,470 9 0.40% Carolina Power & Light Power Service 8,148,420 9 0.39%RPG Hospitality LLC Hotel 9,891,471 10 0.32% Maola Milk & Ice Cream Co. Dairy Products 7,924,434 10 0.38%
Total Assessed Valuation of Top Ten Taxpayer 217,244,435$ 7.13% Total Assessed Valuation of Top Ten Taxpayer 220,886,846$ 10.56%
Balance of Assessed Valuation. 2,829,631,193$ 92.87% Balance of Assessed Valuation. 1,871,323,152$ 89.44%
Total Assessed Valuation 3,046,875,628$ 100.00% Total Assessed Valuation 2,092,209,998$ 100.00%
Source: City property tax records
2016 2007
139
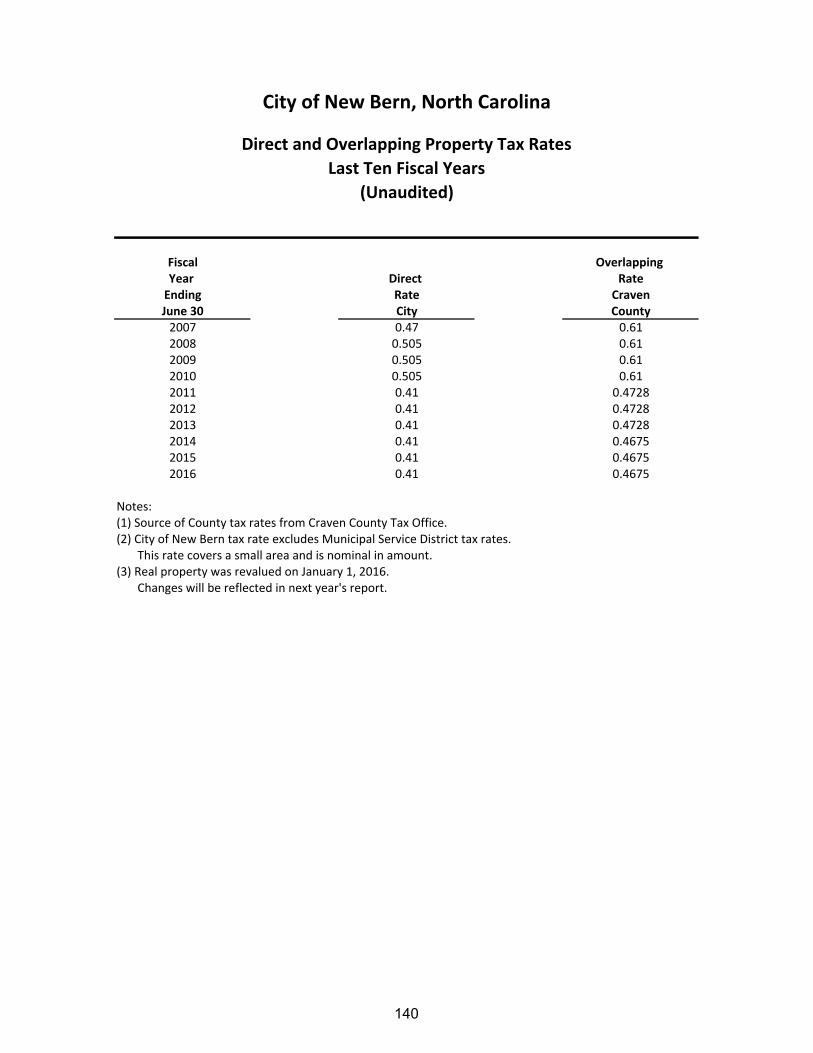
City of New Bern, North Carolina
Direct and Overlapping Property Tax Rates
Last Ten Fiscal Years
(Unaudited)
Fiscal Overlapping Year Direct RateEnding Rate CravenJune 30 City County2007 0.47 0.612008 0.505 0.612009 0.505 0.612010 0.505 0.612011 0.41 0.47282012 0.41 0.47282013 0.41 0.47282014 0.41 0.46752015 0.41 0.46752016 0.41 0.4675
Notes: (1) Source of County tax rates from Craven County Tax Office.(2) City of New Bern tax rate excludes Municipal Service District tax rates. This rate covers a small area and is nominal in amount.(3) Real property was revalued on January 1, 2016. Changes will be reflected in next year's report.
140
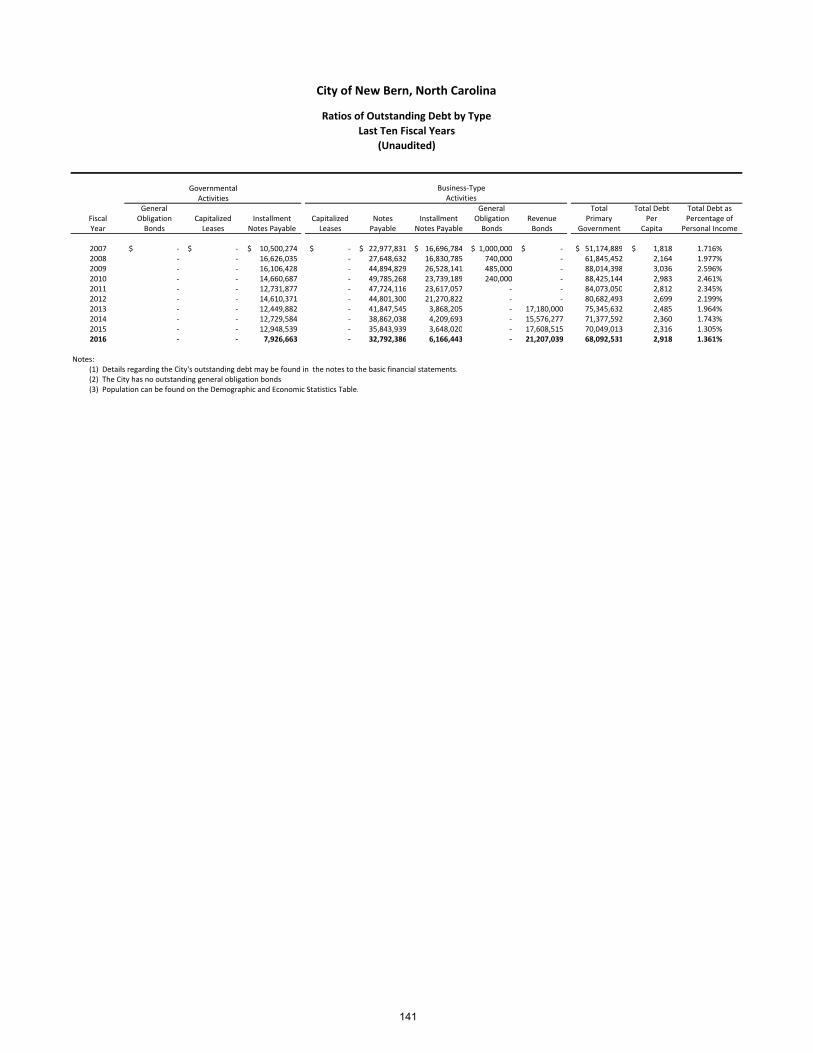
City of New Bern, North Carolina
Ratios of Outstanding Debt by Type
Last Ten Fiscal Years
(Unaudited)
GovernmentalActivities
General General Total Total Debt Total Debt asFiscal Obligation Capitalized Installment Capitalized Notes Installment Obligation Revenue Primary Per Percentage ofYear Bonds Leases Notes Payable Leases Payable Notes Payable Bonds Bonds Government Capita Personal Income
2007 ‐$ ‐$ 10,500,274$ ‐$ 22,977,831$ 16,696,784$ 1,000,000$ ‐$ 51,174,889$ 1,818$ 1.716%2008 ‐ ‐ 16,626,035 ‐ 27,648,632 16,830,785 740,000 ‐ 61,845,452 2,164 1.977%2009 ‐ ‐ 16,106,428 ‐ 44,894,829 26,528,141 485,000 ‐ 88,014,398 3,036 2.596%2010 ‐ ‐ 14,660,687 ‐ 49,785,268 23,739,189 240,000 ‐ 88,425,144 2,983 2.461%2011 ‐ ‐ 12,731,877 ‐ 47,724,116 23,617,057 ‐ ‐ 84,073,050 2,812 2.345%2012 ‐ ‐ 14,610,371 ‐ 44,801,300 21,270,822 ‐ ‐ 80,682,493 2,699 2.199%2013 ‐ ‐ 12,449,882 ‐ 41,847,545 3,868,205 ‐ 17,180,000 75,345,632 2,485 1.964%2014 ‐ ‐ 12,729,584 ‐ 38,862,038 4,209,693 ‐ 15,576,277 71,377,592 2,360 1.743%2015 ‐ ‐ 12,948,539 ‐ 35,843,939 3,648,020 ‐ 17,608,515 70,049,013 2,316 1.305%2016 ‐ ‐ 7,926,663 ‐ 32,792,386 6,166,443 ‐ 21,207,039 68,092,531 2,918 1.361%
Notes: (1) Details regarding the City's outstanding debt may be found in the notes to the basic financial statements. (2) The City has no outstanding general obligation bonds. (3) Population can be found on the Demographic and Economic Statistics Table.
ActivitiesBusiness‐Type
141

City of New Bern, North Carolina
Direct and Overlapping Governmental Activities Debt
For the Year Ended June 30, 2016
(Unaudited)
EstimatedEstimated Share of
Debt Percentage OverlappingGovernmental Unit Outstanding Applicable Debt
Craven County Debt 70,590,499$ 30.45% 21,495,811$
Subtotal, overlapping debt 70,590,499 21,495,811
City Direct Debt 7,926,663 100% 7,926,663
Total direct and overlapping debt 78,517,162$ 29,422,474$
Sources:
Notes:(1) Includes general obligation bonds for Enterprise Fund and General Long‐Term Debt Account Group.(2) Determined by ratio of assessed valuation of property subject to taxation in Craven County $9,904,145,988.(3) Amount in debt outstanding column multiplied by percentage applicable.
142

City of New Bern, North Carolina
Legal Debt Margin Information
Last Ten Fiscal Years
(dollars in thousands)
(Unaudited)
2007 2008 2009 2010
Debt limit 167,377,000 $ 177,506,221 $ 186,561,090 $ 187,560,181 $
Total net debt applicable to limit ‐ 5,244,681 ‐ 240,000
Legal debt margin 167,377,000 $ 172,261,540 $ 186,561,090 $ 187,320,181 $
Total net debt applicable to the limitas a percentage of debt limit 0.00% 3.04% 0.00% 0.13%
Notes:Debt includes Installment proceeds and Notes payable.
Legal Debt Margin Calculation for Fiscal Year 2016.
Assessed Valuation 3,046,875,628$
8% 243,750,050
Less applicable debt (7,926,663)
Debt margin 235,823,387$
143
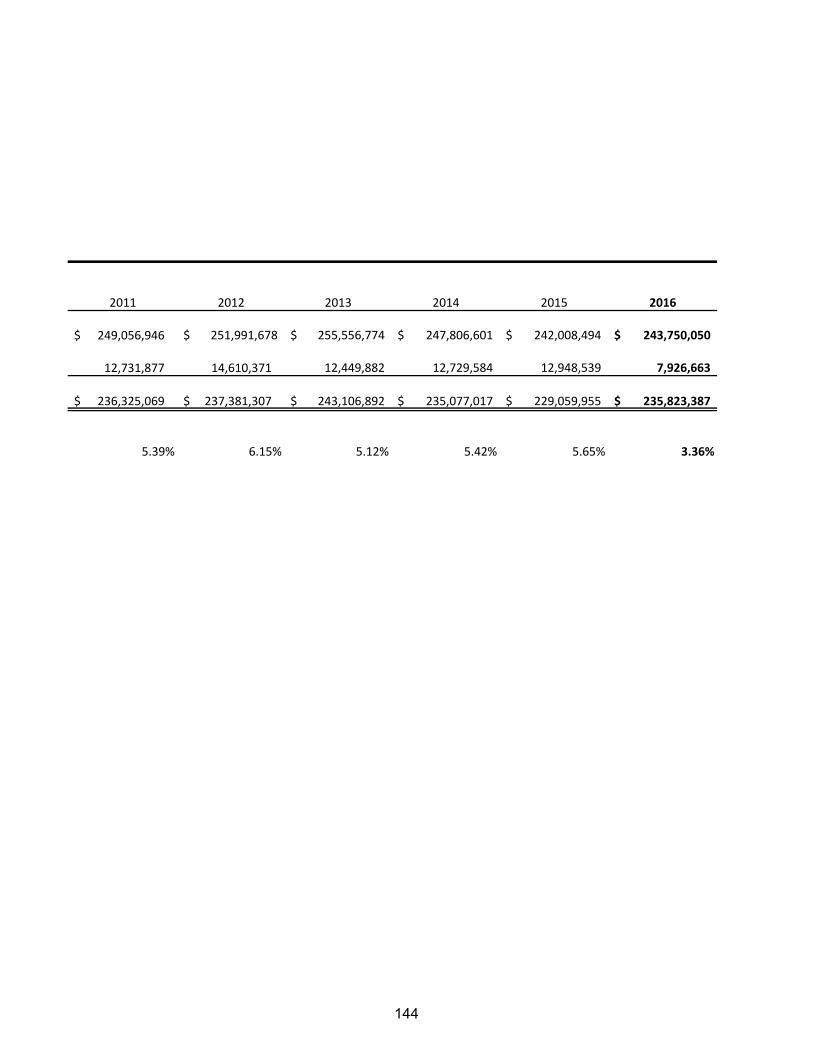
2011 2012 2013 2014 2015 2016
249,056,946 $ 251,991,678$ 255,556,774$ 247,806,601$ 242,008,494$ 243,750,050$
12,731,877 14,610,371 12,449,882 12,729,584 12,948,539 7,926,663
236,325,069 $ 237,381,307 $ 243,106,892$ 235,077,017$ 229,059,955$ 235,823,387$
5.39% 6.15% 5.12% 5.42% 5.65% 3.36%
144

City of New Bern, North Carolina
Demographic and Economic Statistics
Last Ten Fiscal Years
(Unaudited)
FiscalYear Per Capita Personal Ended Personal Income (3) School UnemploymentJune 30 Population (1) Income (2) (Amounts in 000's) Enrollment (4) Rate (5)
2006 27,508 24,141 2,982,972 7,805 3.9%2007 28,156 24,141 3,127,571 7,864 3.6%2008 28,584 24,141 3,390,907 7,413 4.0%2009 28,992 24,141 3,592,542 7,433 7.7%2010 29,646 24,141 3,585,722 7,457 9.6%2011 29,899 22,762 3,669,572 7,652 9.5%2012 30,316 22,762 3,836,260 7,633 9.2%2013 30,242 23,235 4,094,203 7,633 9.9%2014 30,291 22,555 5,365,822 7,419 7.1%2015 30,070 23,335 5,004,713 7,317 6.3%2016 (6) (6) (6) (6) 4.9%
Notes:(1) Population provided US Census Bureau.(2) Provided by U.S Census.(3) Bureau of Economic Analysis, U.S. Department of Commerce. Figures are as of the end
of the calendar year ended during the fiscal year.(4) Provided by NC School Report Cards.(5) Provided by U.S Bureau of Labor Statistics.(6) Information is not presently available.
145
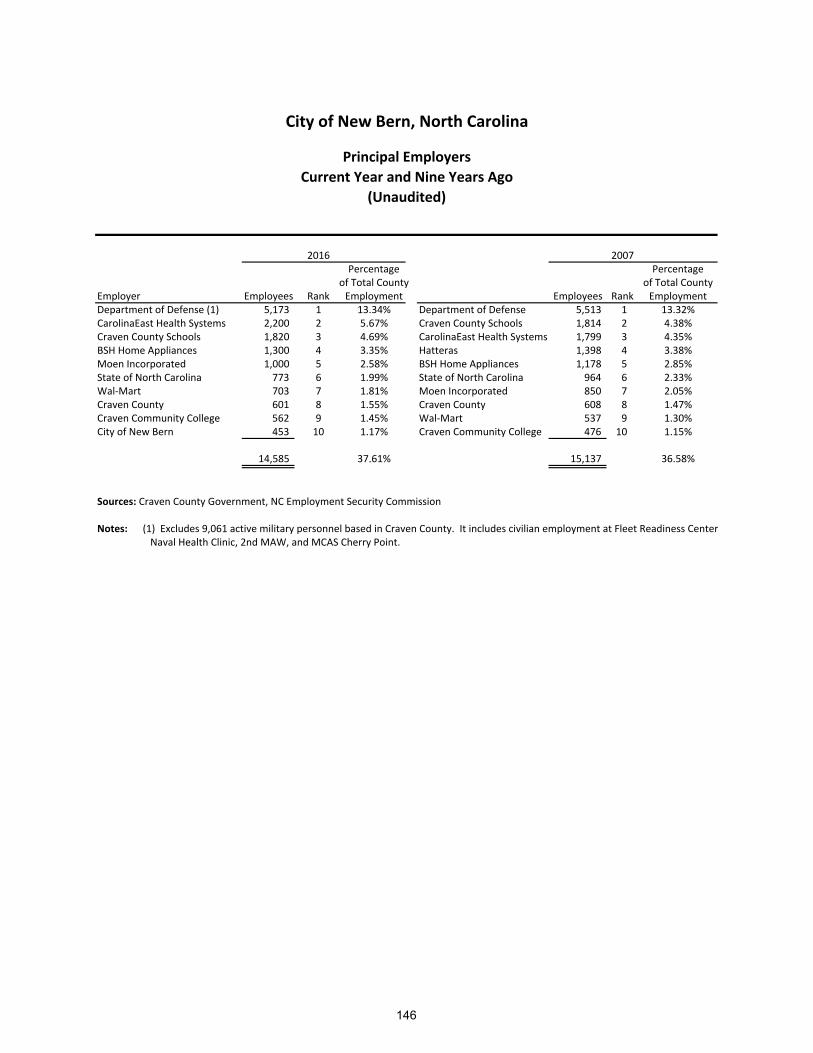
City of New Bern, North Carolina
Principal Employers
Current Year and Nine Years Ago
(Unaudited)
2016 2007Percentage Percentage
of Total County of Total CountyEmployer Employees Rank Employment Employees Rank EmploymentDepartment of Defense (1) 5,173 1 13.34% Department of Defense 5,513 1 13.32%CarolinaEast Health Systems 2,200 2 5.67% Craven County Schools 1,814 2 4.38%Craven County Schools 1,820 3 4.69% CarolinaEast Health Systems 1,799 3 4.35%BSH Home Appliances 1,300 4 3.35% Hatteras 1,398 4 3.38%Moen Incorporated 1,000 5 2.58% BSH Home Appliances 1,178 5 2.85%State of North Carolina 773 6 1.99% State of North Carolina 964 6 2.33%Wal‐Mart 703 7 1.81% Moen Incorporated 850 7 2.05%Craven County 601 8 1.55% Craven County 608 8 1.47%Craven Community College 562 9 1.45% Wal‐Mart 537 9 1.30%City of New Bern 453 10 1.17% Craven Community College 476 10 1.15%
14,585 37.61% 15,137 36.58%
Sources: Craven County Government, NC Employment Security Commission
Notes: (1) Excludes 9,061 active military personnel based in Craven County. It includes civilian employment at Fleet Readiness Center Naval Health Clinic, 2nd MAW, and MCAS Cherry Point.
146

City of New Bern, North Carolina
Full‐Time Equivalent City Government Employees By Functions/ProgramsLast Ten Fiscal Years
(Unaudited)
2007 2008 2009 2010 2011 2012 2013 2014 2015 2016Functions/Program
General Government:Governing Board 1 1 1 1 1 1 1 1 1 1 Administration 3 3 3 3 3 4 4 4 4 4 Information Technology 7 7 7 7 7 7 8 8 8 7
Finance:Accounting 12 12 12 12 11 10 10 10 10 9 Warehouse 5 5 5 5 4 4 4 4 4 3 Tax Collection 3 3 3 3 3 3 3 1 ‐ ‐
Human Resources: 6 6 6 6 6 5 5 6 6 5 Police: 116 116 138 141 127.5 114 112 112 116 109.5 Animal Control 2 2 ‐ ‐ ‐ ‐ ‐ ‐ ‐ ‐ Communications 17 19 ‐ ‐ ‐ ‐ ‐ ‐ ‐ ‐
Fire: 59 68 69 68 66 66 67 67 67 67 Parks and Recreation:Administration 2 3 2 2 2 2 2 2 2 3 West New Bern Recreation Center 4.3 5 5 5 5 5 5 5 5 4 Stanley White Recreation Center 3.3 4 5 5 4 4 4 4 4 4 Parks 17 17 17 17 14.6 13 14 14 14 13 Aquatics ‐ ‐ 1 1 0.4 0.4 ‐ ‐ ‐ ‐ Special Programs 1 1 ‐ ‐ ‐ ‐ ‐ ‐ ‐ ‐ Athletics 3.5 4 3 3 3 3.6 3.0 3.0 3.0 3
Planning & Inspections: ‐ ‐ Planning & Inspections 19 19 19 19 17 17 16 17 17 15 GIS 1 1 1 1 1 1 1 ‐ ‐ ‐
Public Works:Administration 4 4 4 4 3.5 3 3 3 3 3 Garage 4 4 4 4 4 4 4 4 4 4 Public Buildings 6 7 7 7 6 5 6 6 6 6 Streets 30 31 31 31 26 25 25 25 25 21 Cemeteries 1 1 1 1 1 1 ‐ ‐ ‐ ‐Leaf & Limb 9 9 9 9 9 8 7 7 7 7 Sanitation 1 1 1 1 ‐ ‐ ‐ ‐ ‐ ‐ Engineering 6 10 10 10 9 ‐ ‐ ‐ ‐ ‐
Water: ‐ ‐ Water Resources Administration ‐ ‐ ‐ ‐ ‐ 7 7 7 7 7 Water Treatment 3 3 3 5 7 12 11 11 11 11 Water Distribution System Maintenance 21 21 21 23 20 25 30 30 30 27 Hydrant Maintenance 3 4 4 4 4 ‐ ‐ ‐ ‐ ‐
Sewer: ‐ ‐ Sewer Treatment 17 20 20 20 19 21 21 21 20 19 Sewer Collection System Maintenance 30 32 33 37 27 21 16 14 14 12 PreTreatment 1 1 1 1 2 ‐ ‐ ‐ ‐ ‐
Electric:Electric Administration 6 7 7 7 7 7 7 7 7 6 Utility Billing 5 5 5 16 5 5 5 5 ‐ ‐ Utility Service 15 17 16 15 16 15 15 10 ‐ ‐ Distribution O&M 33 33 33 33 30 32 32 36 36 34 Power Supply 4 4 4 4 4 4 4 4 4 3 Communications Control 5 5 5 5 5 5 6 6 7 7 Utility Business Office 15 16 16 16 16 16 16 16 30 29
Stormwater: Stormwater ‐ ‐ ‐ ‐ ‐ ‐ 5 5 5 6
Other:Emergency Telephone System (E911) 2 2 2 2 2 2 2 2 2 1.5 Metropolitan Planning Organization ‐ ‐ ‐ ‐ ‐ ‐ ‐ ‐ ‐ 2 Municipal Service District 2 2 2 2 2 ‐ ‐ ‐ ‐ ‐
Total 505 535 536 556 500 478 481 477 479 453
Source: Prior years budget records
Note:
* Information is not readily available
147

City of New Bern, North Carolina
Operating Indicators By Function/ProgramLast Ten Fiscal Years
(Unaudited)
Function/Program 2007 2008 2009 2010
Police: Calls for service ** ** ** 44,980 Conduct DUI/Traffic Check Points ** ** ** ** Answer 90% of 911 class in 10 seconds ** ** ** ** Dispatch Emergency call in 90 seconds ** ** ** ** Dispatch Non‐Emergent call in 90 seconds ** ** ** ** Maintain 100% state certification for sworn and non‐sworn ** ** ** ** Conduct directed traffic enforcement ** ** ** ** Conduct directed radar enforcement campaigns ** ** ** ** Arrests ** ** ** **Fire:Calls for service 1,206 1,231 1,022 1,034 Value of Endangered Property ** ** ** **Value of Property Loss 2,573,590 $ 2,124,686 $ 1,549,760$ 850,040$ Fire Inspections ** ** ** ** Fire Investigations ** ** ** ** People Educated by Fire Education Programs ** ** ** ** Child Passenger Safety Seat Inspections ** ** ** ** Permits Issued ** ** ** ** Firefighter Training Hours ** ** ** **Recreation program attendance:Athletics 74,500 77,000 80,000 95,500Centers & Parks 268,304 269,190 269,546 270,551Other Programs 90,825 90,875 90,900 95,825
Planning & Development: Total building permits 831 651 553 645 Total value of all permits $148,822,321 $112,408,779 $48,034,918 $56,899,190
Public service:Garbage collected (ton) 7,659 7,618 7,562 7,495Recycle collected (ton) *** 1,630 1,628 1,848 1,644
StormwaterCalls for service ** ** ** **Yearly rainfall ** ** ** **Stormwater fee ** ** ** **Residential ERU's ** ** ** **Commercial ERU's ** ** ** **
Source: Various City recordsNOTE: ** Data not available *** Numbers are derived from Craven County Recycling tonnages. Only totals were available, however based on the percentage of households in the city to county33.53% was used from the total collected to generate an approximate City value**** Tracking Changes Amended, stats unavailable
148

2011 2012 2013 2014 2015 2016
38,397 36,818 48,532 42,819 43,113 42,525** ** 70 118 157 48** ** 99..6% 97.50% 98.05% 98.02%** ** 85.30% 91.15% 72.35% 89.80%** ** 97.80% 75.00% 74.40% 76.10%** ** 100.00% 98.78% 98.78% 98.78%** ** ** ** ** 362** ** 1 4 21 ****** ** 1,944 1,750 1,595 1,545
1,124 1,090 992 1,115 1,223 1,251 ** ** ** 50,260,192 13,718,938 122,605,907
1,658,581$ 6,131,061$ 1,389,713$ 2,811,003$ 656,825$ 1,201,657$ ** 1,860 1,787 1,519 1,568 1,420** 43 32 36 33 31** 7,033 7,298 8,857 9,929 11,065** 299 295 268 227 236** 140 82 126 91 113** 19,176 19,522 18,503
95,750 98,500 98,500 99,000 99,500 100,000278,501 285,500 286,000 286,500 306,000 310,00090,550 96,775 97,000 97,225 100,000 105,000
573 652 605 529 511 317$38,992,626 $47,994,419 $37,189,233 $40,634,053 $32,604,601 $65,763,473
7,640 7,719 7,626 7,854 8,135 8,5211,791 2,403 1,795 2,191 2,222 2,185
** ** 450 178 264 355** ** 43.99" 37.14" 54.91 67.15** ** $2.10 / ERU $2.10 / ERU $2.10 / ERU $2.10 / ERU** ** ** 12,516 12,756 12,906** ** ** 20,452 20,006 19,923
149

City of New Bern, North Carolina
Capital Asset Statistics By Function/ProgramLast Ten Fiscal Years
(Unaudited)
Function/Program 2007 2008 2009 2010
Police: Capital Assets 4 4 4 4Fire & Rescue: Fire Stations 3 3 3 3 Fire Training Academy Building 1 1 1 1 Fire Training Academy Classroom 1 1 1 1Parks & Recreation:Acreage 270 275 275 282Parks 17 18 18 19Frisbee Golf Course 0 1 1 1Baseball/Softball Diamonds 10 10 10 10Soccer/Football Fields 2 2 2 2Basketball Courts 4 4 4 4Tennis Courts 4 4 4 4Swimming pools 0 0 1 1Parks with Playground Equipment 8 8 9 9Picnic Shelters 7 8 8 8Community Centers 3 3 3 3Natural Sites 4 4 4 4Gymnasium 2 2 2 2Spray Ground 0 1 1 1Dog Park 0 0 1 1Boat Launch/Ramp/Pier 6 6 7 7
Picnic Tables 70 70 70 75Park Benches 90 90 100 108Multi‐purpose Fields 2 2 2 2Walking Trails 3 4 5 6Outdoor Restrooms 8 9 9 9Public Parking Lots 10 10 10 11Public Art 3 3 3 3Horseshoe Courts 1 2 2 3Outdoor Volleyball Courts 1 2 2 2Bike Racks 6 6 7 7
Wastewater: *Sanitary Sewers (miles) 211.2 211.4 211.4 211.4 *Storm Sewers (miles) 62.3 62.4 62.4 62.4 *Average Daily Flow 4.14 3.72 3.57 4.01Electric: Average Daily Usage (kWh) 1,261,872 1,308,915 1,308,073 1,327,457
Mile of Distribution Lines 470 515 515 515Source: Various City records
* Beginning in FY14 the STEP System and Vacuum System Sewer mains are included
150

2011 2012 2013 2014 2015 2016
4 4 5 5 5 5
3 3 3 3 3 31 1 1 1 1 11 1 1 1 1 1
312 312 312 350 360 36321 21 21 23 24 241 1 1 1 1 110 10 10 10 10 102 2 2 2 2 24 4 4 4 4 44 4 4 4 4 41 1 1 1 1 19 9 10 11 12 138 8 9 10 10 113 3 3 3 3 24 4 4 4 4 42 2 2 2 2 21 1 1 1 1 11 1 1 1 1 18 8 8 8 10 11
75 75 87 90 95 98108 108 126 130 138 1432 2 2 2 2 26 6 6 6 6 69 9 9 9 9 911 11 11 11 11 123 4 4 5 5 53 3 3 3 3 32 2 2 2 2 27 7 7 25 25 25
211.4 211.7 211.7 414.88 416.77 417.5862.4 62.5 62.5 74.35 74.62 76.583.82 3.63 3.63 3.89 3.88 4.55
1,366,685 1,257,055 1,286,755 1,254,574 1,304,406 1,251,181
515 515 518 520 630 550
151

COMPLIANCE SECTION

INDEPENDENT AUDITOR’S REPORT ON INTERNAL CONTROL OVER FINANCIAL REPORTING AND ON COMPLIANCE AND OTHER MATTERS BASED ON AN AUDIT OF FINANCIAL
STATEMENTS PERFORMED IN ACCORDANCE WITH GOVERNMENT AUDITING STANDARDS To the Honorable Mayor and Members of the Board of Aldermen City of New Bern, North Carolina
We have audited, in accordance with the auditing standards generally accepted in the United States of America and the
standards applicable to financial audits contained in Government Auditing Standards issued by the Comptroller General of
the United States, the financial statements of the governmental activities, the business‐type activities, each major fund, and
the aggregate remaining fund information of the City of New Bern, North Carolina (the “City”) as of and for the year ended
June 30, 2016, and the related notes to the financial statements which collectively comprise the City’s basic financial
statements, and have issued our report thereon dated December 28, 2016.
Internal Control over Financial Reporting
In planning and performing our audit of the financial statements, we considered the City’s internal control over financial
reporting (“internal control”) to determine the audit procedures that are appropriate in the circumstances for the purpose
of expressing our opinions on the financial statements, but not for the purpose of expressing an opinion on the
effectiveness of the City’s internal control. Accordingly, we do not express an opinion on the effectiveness of the City’s
internal control.
A deficiency in internal control exists when the design or operation of a control does not allow management or employees,
in the normal course of performing their assigned functions, to prevent, or detect and correct, misstatements on a timely
basis. A material weakness is a deficiency, or a combination of deficiencies, in internal control such that there is a
reasonable possibility that a material misstatement of the entity’s financial statements will not be prevented, or detected
and corrected on a timely basis. A significant deficiency is a deficiency, or a combination of deficiencies, in internal control
that is less severe than a material weakness, yet important enough to merit attention by those charged with governance.
200 GALLERIA PARKWAY S.E., SUITE 1700 • ATLANTA, GA 30339-5946 • 770-955-8600 • 800-277-0080 • FAX 770-980-4489 • www.mjcpa.com Members of The American Institute of Certified Public Accountants • RSM International
153
Our consideration of internal control was for the limited purpose described in the first paragraph of this section and was
not designed to identify all deficiencies in internal control that might be material weaknesses or significant deficiencies and
therefore, material weaknesses or significant deficiencies may exist that were not identified. We did identify certain
deficiencies in internal control, described in the accompanying schedule of findings and questioned costs as items 2016‐001
and 2016‐002 that we consider to be material weaknesses.
Compliance and Other Matters
As part of obtaining reasonable assurance about whether the City’s financial statements are free from material
misstatement, we performed tests of its compliance with certain provisions of laws, regulations, contracts, and grant
agreements, noncompliance with which could have a direct and material effect on the determination of financial statement
amounts. However, providing an opinion on compliance with those provisions was not an objective of our audit, and
accordingly, we do not express such an opinion. The results of our tests disclosed no instances of noncompliance or other
matters that are required to be reported under Government Auditing Standards. The City of New Bern, North Carolina’s Responses to Findings
The City’s responses to the findings identified in our audit are described in the accompanying schedule of findings and
questioned costs. The City’s responses were not subjected to the auditing procedures applied in the audit of the financial
statements and, accordingly, we express no opinion on them. Purpose of this Report
The purpose of this report is solely to describe the scope of our testing of internal control and compliance and the result of
that testing, and not to provide an opinion on the effectiveness of the entity’s internal control or on compliance. This
report is an integral part of an audit performed in accordance with Government Auditing Standards in considering the
entity’s internal control and compliance. Accordingly, this communication is not suitable for any other purpose.
Atlanta, Georgia December 28, 2016
INDEPENDENT AUDITOR’S REPORT ON COMPLIANCE FOR EACH MAJOR FEDERAL PROGRAM AND REPORT ON INTERNAL CONTROL OVER COMPLIANCE REQUIRED BY THE
UNIFORM GUIDANCE To the Honorable Mayor and Members of the Board of Aldermen City of New Bern, North Carolina Report on Compliance for Each Major Federal Program We have audited the City of New Bern, North Carolina’s (the “City”) compliance with the types of compliance requirements
described in the OMB Compliance Supplement that could have a direct and material effect on each of the City’s major federal programs for the year ended June 30, 2016. The City’s major federal programs are identified in the summary of auditor's results section of the accompanying schedule of findings and questioned costs. Management's Responsibility Management is responsible for compliance with federal statutes, regulations, and the terms and conditions of its federal awards applicable to its federal programs. Auditor's Responsibility Our responsibility is to express an opinion on compliance for each of the City’s major federal programs based on our audit of the types of compliance requirements referred to above. We conducted our audit of compliance in accordance with auditing standards generally accepted in the United States of America; the standards applicable to financial audits contained in Government Auditing Standards, issued by the Comptroller General of the United States; and the audit requirements of Title 2 U.S. Code of Federal Regulations Part 200, Uniform Administrative Requirements, Cost Principles, and Audit Requirements for Federal Awards (Uniform Guidance). Those standards and the Uniform Guidance require that we plan and perform the audit to obtain reasonable assurance about whether noncompliance with the types of compliance requirements referred to above that could have a direct and material effect on a major federal program occurred. An audit includes examining, on a test basis, evidence about the City’s compliance with those requirements and performing such other procedures as we considered necessary in the circumstances. We believe that our audit provides a reasonable basis for our opinion on compliance for each major federal program. However, our audit does not provide a legal determination of the City’s compliance. Opinion on Each Major Federal Program In our opinion, the City complied, in all material respects, with the types of compliance requirements referred to above that could have a direct and material effect on each of its major federal programs for the year ended June 30, 2016.
200 GALLERIA PARKWAY S.E., SUITE 1700 • ATLANTA, GA 30339-5946 • 770-955-8600 • 800-277-0080 • FAX 770-980-4489 • www.mjcpa.com Members of The American Institute of Certified Public Accountants • RSM International

155
Other Matters The results of our auditing procedures disclosed an instance of noncompliance, which is required to be reported in accordance with the Uniform Guidance and which is described in the accompanying schedule of findings and questioned costs as item 2016‐003. Our opinion on each major federal program is not modified with respect to this matter. The City’s response to the noncompliance finding identified in our audit is described in the accompanying schedule of findings and questioned costs and corrective action plan. The City’s response was not subjected to the auditing procedures applied in the audit of compliance and, accordingly, we express no opinion on the response.
Report on Internal Control Over Compliance
Management of the City is responsible for establishing and maintaining effective internal control over compliance with the types of compliance requirements referred to above. In planning and performing our audit of compliance, we considered the City’s internal control over compliance with the types of requirements that could have a direct and material effect on each major federal program to determine the auditing procedures that are appropriate in the circumstances for the purpose of expressing an opinion on compliance for each major federal program and to test and report on internal control over compliance in accordance with the Uniform Guidance, but not for the purpose of expressing an opinion on the effectiveness of internal control over compliance. Accordingly, we do not express an opinion on the effectiveness of the City’s internal control over compliance. A deficiency in internal control over compliance exists when the design or operation of a control over compliance does not allow management or employees, in the normal course of performing their assigned functions, to prevent, or detect and correct, noncompliance with a type of compliance requirement of a federal program on a timely basis. A material weakness in internal control over compliance is a deficiency, or combination of deficiencies, in internal control over compliance, such that there is a reasonable possibility that material noncompliance with a type of compliance requirement of a federal program will not be prevented, or detected and corrected, on a timely basis. A significant deficiency in internal control over compliance is a deficiency, or a combination of deficiencies, in internal control over compliance with a type of compliance requirement of a federal program that is less severe than a material weakness in internal control over compliance, yet important enough to merit attention by those charged with governance. Our consideration of internal control over compliance was for the limited purpose described in the first paragraph of this section and was not designed to identify all deficiencies in internal control over compliance that might be material weaknesses or significant deficiencies and therefore, material weaknesses or significant deficiencies may exist that were not identified. We did not identify any deficiencies in internal control over compliance that we consider to be material weaknesses. However, we identified a certain deficiency in internal control over compliance, as described in the accompanying schedule of findings and questioned costs as item 2016‐003 that we consider to be a significant deficiency. The City’s response to the internal control over compliance finding identified in our audit is described in the accompanying schedule of findings and questioned costs and corrective action plan. The City’s response was not subjected to the auditing procedures applied in the audit of compliance and, accordingly, we express no opinion on the response.

156
The purpose of this report on internal control over compliance is solely to describe the scope of our testing of internal control over compliance and the results of that testing based on the requirements of the Uniform Guidance. Accordingly, this report is not suitable for any other purpose.
December 28, 2016 Atlanta, Georgia

INDEPENDENT AUDITOR’S REPORT ON COMPLIANCE FOR EACH MAJOR STATE PROGRAM AND REPORT ON INTERNAL CONTROL OVER COMPLIANCE IN ACCORDANCE WITH THE
UNIFORM GUIDANCE AND THE STATE SINGLE AUDIT IMPLEMENTATION ACT To the Honorable Mayor and Members of the Board of Aldermen City of New Bern, North Carolina Report on Compliance for Each Major State Program We have audited the City of New Bern, North Carolina’s (the “City”) compliance with the types of compliance requirements
described in the Audit Manual for Governmental Auditors in North Carolina, issued by the Local Government Commission, that could have a direct and material effect on each of the City’s major state programs for the year ended June 30, 2016. The City’s major state programs are identified in the summary of auditor's results section of the accompanying schedule of findings and questioned costs. Management's Responsibility Management is responsible for compliance with the requirements of laws, regulation, contracts, and grants applicable to its state programs. Auditor's Responsibility Our responsibility is to express an opinion on compliance for each of the City’s major state programs based on our audit of the types of compliance requirements referred to above. We conducted our audit of compliance in accordance with auditing standards generally accepted in the United States of America; the standards applicable to financial audits contained in Government Auditing Standards, issued by the Comptroller General of the United States; and the applicable sections of Title 2 U.S. Code of Federal Regulations Part 200, Uniform Administrative Requirements, Cost Principles, and Audit Requirements for Federal Awards (Uniform Guidance), as described in the Audit Manual for Governmental Auditors in North Carolina, and the State Single Audit Implementation Act. Those standards, the Uniform Guidance, and the State Single Audit Implementation Act require that we plan and perform the audit to obtain reasonable assurance about whether noncompliance with the types of compliance requirements referred to above that could have a direct and material effect on a major state program occurred. An audit includes examining, on a test basis, evidence about the City’s compliance with those requirements and performing such other procedures, as we considered necessary in the circumstances. We believe that our audit provides a reasonable basis for our opinion on compliance for each major state program. However, our audit does not provide a legal determination of the City’s compliance. Opinion on Each Major State Program In our opinion, the City complied, in all material respects, with the types of compliance requirements referred to above that could have a direct and material effect on each of its major state programs for the year ended June 30, 2016.
200 GALLERIA PARKWAY S.E., SUITE 1700 • ATLANTA, GA 30339-5946 • 770-955-8600 • 800-277-0080 • FAX 770-980-4489 • www.mjcpa.com Members of The American Institute of Certified Public Accountants • RSM International

158
Report on Internal Control Over Compliance
Management of the City is responsible for establishing and maintaining effective internal control over compliance with the types of compliance requirements referred to above. In planning and performing our audit of compliance, we considered the City’s internal control over compliance with the types of requirements that could have a direct and material effect on a major state program to determine the auditing procedures that are appropriate in the circumstances for the purpose of expressing our opinion on compliance for each major state program and to test and report on internal control over compliance in accordance with the Uniform Guidance, but not for the purpose of expressing an opinion on the effectiveness of internal control over compliance. Accordingly, we do not express an opinion on the effectiveness of the City’s internal control over compliance. A deficiency in internal control over compliance exists when the design or operation of a control over compliance does not allow management or employees, in the normal course of performing their assigned functions, to prevent, or detect and correct, noncompliance with a type of compliance requirement of a state program on a timely basis. A material weakness in internal control over compliance is a deficiency, or a combination of deficiencies, in internal control over compliance, such that there is a reasonable possibility that material noncompliance with a type of compliance requirement of a state program will not be prevented, or detected and corrected, on a timely basis. A significant deficiency in internal control over compliance is a deficiency, or combination of deficiencies, in internal control over compliance with a type of compliance requirement of a state program that is less severe than a material weakness in internal control over compliance, yet important enough to merit attention by those charged with governance. Our consideration of internal control over compliance was for the limited purpose described in the first paragraph of this section and was not designed to identify all deficiencies in internal control over compliance that might be significant deficiencies or material weaknesses. We did not identify any deficiencies in internal control over compliance that we consider to be material weaknesses. However, material weaknesses may exist that have not been identified. The purpose of this report on internal control over compliance is solely to describe the scope of our testing of internal control over compliance and the results of that testing based on the requirements of the Uniform Guidance. Accordingly, this report is not suitable for any other purpose.
December 28, 2016 Atlanta, Georgia

Federal Agency or Pass‐
Grantor/Pass‐Through CFDA through Grantor
Grantor/Program Title Number Number Federal State Local
FEDERAL AWARDS
U.S. DEPARTMENT OF HOUSING AND URBAN DEVELOPMENT
Passed through North Carolina Department of Commerce,
Planning and Community Development
CDBG ‐ Entitlement Cities Grant Cluster
CDBG Entitlement Cities 14.218 B‐14‐MC‐37‐0024 $ 16,000 $ 389,952 $ ‐ $ ‐
2012 Catalyst Program 14.218 12‐C‐2471 ‐ 320,391 ‐ 20,675
Total CDBG ‐ Entitlement Cities Grant Cluster 16,000 710,343 ‐ 20,675
Total U.S. Department of Housing and Urban Development 16,000 710,343 ‐ 20,675
U.S. DEPARTMENT OF THE INTERIOR
Passed through the North Carolina Department of Cultural
Resources
Dryborough Historic Grant 15.904 n/a ‐ 5,890 ‐ 2,110
Total U.S. Department of the Interior ‐ 5,890 ‐ 2,110
U.S. DEPARTMENT OF JUSTICE
2014 Justice Assistance First Line Equipment 16.738 2015‐DJ‐BX‐0750 ‐ 13,364 ‐ ‐
Total U.S. Department of Justice ‐ 13,364 ‐ ‐
U.S. DEPARTMENT OF TRANSPORTATION
Passed through the North Carolina Department of Transportation
Highway Planning and Construction 20.205 EB‐5502 ‐ 302,159 75,540 ‐
Highway Planning and Construction 20.205 39225.1.30 ‐ 148,355 ‐ 37,089
Highway Planning and Construction 20.205 36230.42.1.1 ‐ 22,500 ‐ 2,500
Highway Planning and Construction 20.205 EB‐5501 ‐ 366,213 91,553 ‐
Total Highway Planning and Construction ‐ 839,227 167,093 39,589
Governor's Highway Safety Program 20.612 PT‐15‐09‐56 ‐ 34,142 ‐ ‐
Total U.S. Department of Transportation ‐ 873,369 167,093 39,589
U.S. DEPARTMENT OF HOMELAND SECURITY
Passed through the North Carolina Department of Public Safety
Night Vision Goggle Project 96.067 EMW‐2014‐SS‐00069‐S01‐142 ‐ 2,879 ‐ ‐
Total U.S. Department of Public Safety ‐ 2,879 ‐ ‐
Total Federal Awards 16,000 1,605,845 167,093 62,374
STATE AWARDS
NORTH CAROLINA DEPARTMENT OF TRANSPORTATION
Nonstate System Street Aid Allocation POWELL BILL ‐ 32570 ‐ ‐ 1,143,502 ‐
Total North Carolina Department of Transportation ‐ ‐ 1,143,502 ‐
NORTH CAROLINA DEPARTMENT OF ENVIRONMENT
AND NATURAL RESOURCES
Public Beach and Water Access ‐ 5871 ‐ ‐ 24,529 3,496
Public Beach and Waterfront Access ‐ 6730 ‐ ‐ 55,000 245,340
Total North Carolina Department of Environment
and Natural Resources ‐ ‐ 79,529 248,836
Total State Awards ‐ ‐ 1,223,031 248,836
Total Federal and State Awards $ 16,000 $ 1,605,845 $ 1,390,124 $ 311,210
Note 1. Basis of Presentation
Note 2. Summary of Significant Accounting Policies
Note 3. Indirect Cost Rate
rate.
Expenditures reported on the SEFSA are reported on the modified accrual basis of accounting. Such expenditures are recognized following the cost principles contained in the
Uniform Guidance, wherein certain types of expenditures are not allowable or are limited as to reimbursement.
CITY OF NEW BERN, NORTH CAROLINA
SCHEDULE OF EXPENDITURES OF FEDERAL AND STATE AWARDS
JUNE 30, 2016
Expenditures
The accompanying schedule of expenditures of federal and state awards (the “SEFSA”) includes the federal and state award activity of the City of New Bern, North Carolina (the
"City") under programs of the federal government and the state of North Carolina for the year ended June 30, 2016. The information in this SEFSA is presented in accordance with
the requirements of Title 2 U.S. Code of Federal Regulations Part 200, Uniform Administrative Requirements, Cost Principles, and Audit Requirements for Federal Awards (Uniform
Guidance) and the State Single Audit Implementation Act. Because the SEFSA presents only a selected portion of the operations of the City, it is not intended to and does not
present the financial position, changes in net position, or cash flows of the City.
Passed
through to
Subrecipient
159

160
CITY OF NEW BERN, NORTH CAROLINA
SCHEDULE OF FINDINGS AND QUESTIONED COSTS FOR THE YEAR ENDED JUNE 30, 2016
SECTION I SUMMARY OF AUDITOR’S RESULTS
Financial Statements Type of report the auditor issued on whether the financial statements audited were prepared in accordance with GAAP: Unmodified Internal control over financial reporting: Material weaknesses identified? X yes no Significant deficiencies identified? yes X none reported Noncompliance material to financial statements noted? yes X no Federal Awards Internal control over major programs: Material weaknesses identified: yes X no Significant deficiencies identified: X yes none reported Type of auditor’s report issued on compliance of major federal programs: Unmodified Any audit findings disclosed that are required to be reported In accordance with 2 CFR 200.516(a)? X yes no Identification of major programs: CFDA Number(s) Name of Federal Program or Cluster 14.218 CDBG ‐ Entitlement Cities Grant Cluster Dollar threshold used to distinguish between type A and type B programs: $750,000 Auditee qualified as low‐risk auditee? No

161
CITY OF NEW BERN, NORTH CAROLINA
SCHEDULE OF FINDINGS AND QUESTIONED COSTS FOR THE YEAR ENDED JUNE 30, 2016
SECTION I SUMMARY OF AUDITOR’S RESULTS (CONTINUED)
State Awards Internal control over major state programs: Material weaknesses identified: yes X no Significant deficiencies identified: yes X none reported Type of auditor’s report issued on compliance of major state programs: Unmodified Any audit findings disclosed that are require to be reported In accordance with the State Single Audit Implementation Act? yes X no Identification of major state program: Program Name Non‐State System Street Aid Allocation (Powell Bill)

162
CITY OF NEW BERN, NORTH CAROLINA
SCHEDULE OF FINDINGS AND QUESTIONED COSTS FOR THE YEAR ENDED JUNE 30, 2016
SECTION II
FINANCIAL STATEMENT FINDINGS AND RESPONSES 2016‐001 Financial Close and Reporting
Criteria: Internal controls should be in place to ensure the City’s financial close and reporting of
activity for the financial statements properly present the financial position and results of the City in
accordance with generally accepted accounting principles.
Condition: During the current year close‐out, the City’s internal controls were not sufficient to
detect and correct certain year‐end adjustments for reporting the financial statements of the City in
accordance with generally accepted accounting principles. First, the City’s interfund loans should be
evaluated as to the receiving fund’s ability and management’s intent to repay the borrowings. If it is
determined the receiving fund does not have the means or the intent to repay the borrowings,
those amounts should be reported as interfund transfers rather than borrowings. Additionally, the
City was not evaluating the allocation of the internal service funds in accordance with Governmental
Accounting Standards Board (“GASB”) Statement No. 34 to determine the necessary allocation
between governmental and business‐type activities.
Context/Cause: During our audit for the year ended June 30, 2016, audit adjustments and financial
reporting corrections were required to properly correct misstatements noted in the City’s financial
close‐out and reporting. The nature of these corrections are as follows:
During our testing of the interfund receivables and payables between the General Fund and
the IT Merger Network Fund we noted the interfund liability reported by the IT Merger
Network Fund was not within the Fund’s ability to repay. As such, it was determined the
General Fund was inappropriately deferring the recognition of the transfer out for the cash
transferred to the IT Network Merger Fund. An adjustment for approximately $417,000
was posted to write‐off the interfund receivables and payables and to recognize the
interfund transfers between the two funds.
The City was not properly allocating the fiscal change in net position for the internal service
fund between the governmental and business‐type activities. In accordance with GASB
Statement No. 34, Basic Financial Statements – and Management’s Discussion and Analysis
– for State and Local Governments, the annual change in net position should be allocated to
the activities based on their participating in the internal service fund’s activity. As such an
adjustment of approximately $559,000 was made to allocate the net change in position and
to allocate the opening net position of approximately $1,758,000. The opening balance
adjustment is reported as a restatement to reduce the net position of governmental
activities and to increase opening net position of business‐type activities.
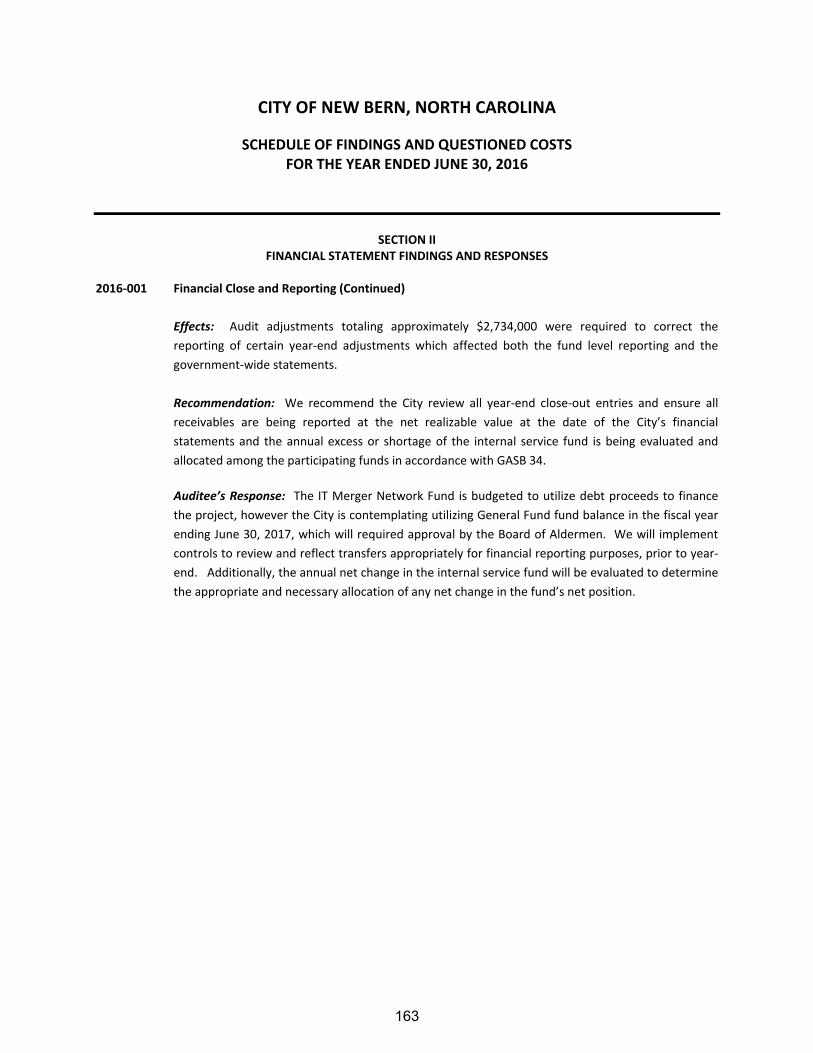
163
CITY OF NEW BERN, NORTH CAROLINA
SCHEDULE OF FINDINGS AND QUESTIONED COSTS FOR THE YEAR ENDED JUNE 30, 2016
SECTION II
FINANCIAL STATEMENT FINDINGS AND RESPONSES 2016‐001 Financial Close and Reporting (Continued)
Effects: Audit adjustments totaling approximately $2,734,000 were required to correct the
reporting of certain year‐end adjustments which affected both the fund level reporting and the
government‐wide statements.
Recommendation: We recommend the City review all year‐end close‐out entries and ensure all
receivables are being reported at the net realizable value at the date of the City’s financial
statements and the annual excess or shortage of the internal service fund is being evaluated and
allocated among the participating funds in accordance with GASB 34.
Auditee’s Response: The IT Merger Network Fund is budgeted to utilize debt proceeds to finance
the project, however the City is contemplating utilizing General Fund fund balance in the fiscal year
ending June 30, 2017, which will required approval by the Board of Aldermen. We will implement
controls to review and reflect transfers appropriately for financial reporting purposes, prior to year‐
end. Additionally, the annual net change in the internal service fund will be evaluated to determine
the appropriate and necessary allocation of any net change in the fund’s net position.

164
CITY OF NEW BERN, NORTH CAROLINA
SCHEDULE OF FINDINGS AND QUESTIONED COSTS FOR THE FISCAL YEAR ENDED JUNE 30, 2016
SECTION II
FINANCIAL STATEMENT FINDINGS AND RESPONSES (CONTINUED) 2016‐002 Revenue Recognition
Criteria: Internal controls should be in place to ensure that amounts reported as revenues and
related balance sheet accounts are appropriate, are properly valued, and are recorded in the proper
period in accordance with generally accepted accounting principles.
Condition: Internal controls were not sufficient to detect misstatements in the reporting of the
City’s revenues and related balance sheet accounts.
Context/Cause: During our testing, audit adjustments were required to properly report the City’s
revenues and related balance sheet accounts. The nature of these adjustments is as follows:
An adjustment was required in the Neuse Boulevard Sidewalk Fund to reduce the current
year revenues approximately $378,000 for accrued revenues that were not available within
the City’s 90 day revenue recognition policy under the modified accrual basis of accounting.
An entry was made to decrease the current year revenues and increase the deferred inflow
of resources for unavailable intergovernmental revenues.
An adjustment was required in the Glenburnie Road Multi‐Use Path Project Fund to reduce
the current year revenues approximately $454,000 for accrued revenues that were not
available within the City’s 90 day revenue recognition policy under the modified accrual
basis of accounting. An entry was made to decrease the current year revenues and
increase the deferred inflow of resources for unavailable intergovernmental revenues.
An adjustment was required in the Entitlement Cities CDBG Project Fund to reduce the
current year revenues approximately $144,000 for accrued revenues that were not
available within the City’s 90 day revenue recognition policy under the modified accrual
basis of accounting. An entry was made to decrease the current year revenues and
increase the deferred inflow of resources for unavailable intergovernmental revenues.
Effects: Total misstatements related to revenue recognition were approximately $976,000 for the
year ended June 30, 2016.
Recommendation: We recommend the City carefully review all accrued revenues to ensure they are
being recognized in the proper reporting period and in accordance with generally accepted
accounting principles.
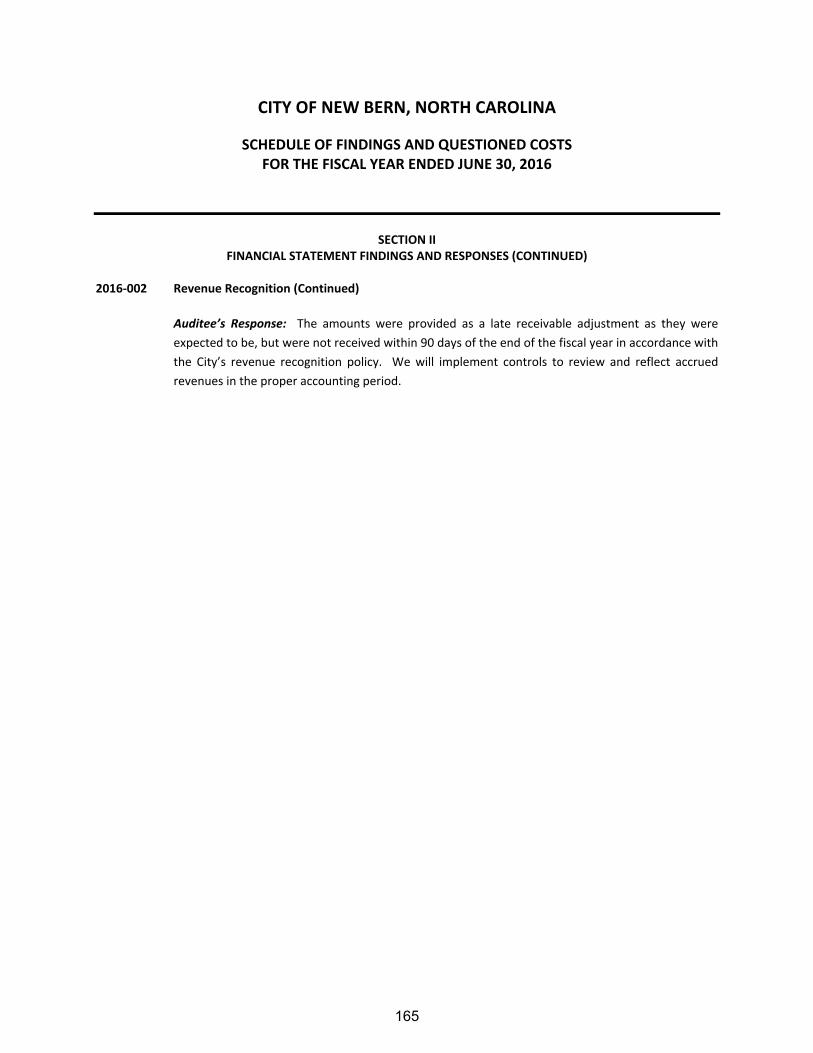
165
CITY OF NEW BERN, NORTH CAROLINA
SCHEDULE OF FINDINGS AND QUESTIONED COSTS FOR THE FISCAL YEAR ENDED JUNE 30, 2016
SECTION II
FINANCIAL STATEMENT FINDINGS AND RESPONSES (CONTINUED) 2016‐002 Revenue Recognition (Continued)
Auditee’s Response: The amounts were provided as a late receivable adjustment as they were
expected to be, but were not received within 90 days of the end of the fiscal year in accordance with
the City’s revenue recognition policy. We will implement controls to review and reflect accrued
revenues in the proper accounting period.

166
CITY OF NEW BERN, NORTH CAROLINA
SCHEDULE OF FINDINGS AND QUESTIONED COSTS FOR THE YEAR ENDED JUNE 30, 2016
SECTION III
FEDERAL AWARDS FINDINGS AND QUESTIONED COSTS
2016‐003 Reporting US DEPARTMENT OF HOUSING AND URBAN DEVELOPMENT
Passed through North Carolina Department of Commerce, Office of Community Planning and Development CFDA: 14.218
Grant Award: B‐14‐MC‐37‐0024 Entitlement Cities & 12‐C‐2471 Catalyst Program
Criteria: The City is required to submit monthly, quarterly, and annual performance reports to the
State. These reports summarize the activity of the work accomplished, future work to be performed
and anticipated completion dates for each project.
Condition: Internal controls were not sufficient to detect misstatements in the preparation of the
financial reports generated by the City for the fiscal year ended June 30, 2016. For the City’s
quarterly SF‐425 reports submitted during the year, the amounts reported as disbursements for
each quarter did not agree with the City’s general ledger, aggregating to a reported total for the
fiscal year, less than the general ledger by $125,136. Additionally, the City did not complete the two
Housing and Urban Development (HUD) specific reports C04PR03 Activity Summary Report and
C04PR26 CDBG Financial Summary.
Questioned Costs: None noted.
Context/Cause: Internal controls were not sufficient to allow for the accurate preparation and
submission of the required reports as outlined in the grant agreements.
Effects: The quarterly progress reports which were submitted to the State for the Entitlement Cities
program were inaccurate each quarter for reporting the disbursements of the City. As of the end of
the fiscal year, the City’s quarterly reports were underreporting the disbursements of the City as
compared with the City’s financial general ledger.
Repeat Finding: Not applicable, program was not tested in the prior year.
Recommendation: We recommend the City implement internal controls sufficient to allow for the
preparation and timely submission of the required reports in accordance with the grant agreements.
Additionally, we recommend a member of the Finance department be required to review the
submissions to ensure the reports are in agreement with the City’s general ledger, prior to
submission.
167
CITY OF NEW BERN, NORTH CAROLINA
SCHEDULE OF FINDINGS AND QUESTIONED COSTS FOR THE YEAR ENDED JUNE 30, 2016
SECTION III
FEDERAL AWARDS FINDINGS AND QUESTIONED COSTS
2016‐003 Reporting (Continued)
Auditee’s Response and Planned Corrective Actions: Internal controls exist requiring review of
performance reports in accordance with grant agreements by the Department of Finance but
distributed by the department administering the grant. We will modify our internal controls to
require all performance reports to be signed and distributed by the Department of Finance staff in
addition to the existing review requirement.
168
CITY OF NEW BERN, NORTH CAROLINA
SCHEDULE OF PRIOR AUDIT FINDINGS FOR THE YEAR ENDED JUNE 30, 2016
None reported

169
CITY OF NEW BERN, NORTH CAROLINA
MANAGEMENT’S CORRECTIVE ACTION PLAN FOR THE YEAR ENDED JUNE 30, 2016
2016‐001 Financial Close and Reporting Contact Person Responsible for the Corrective Action Plan: Joseph R. Sabatelli, Finance Director
Corrective Action Plan: The IT Merger Network Fund is budgeted to utilize debt proceeds to finance the project, however the City is contemplating utilizing General Fund fund balance in the fiscal year ending June 30, 2017, which will required approval by the Board of Aldermen. We will implement controls to review and reflect transfers appropriately for financial reporting purposes, prior to year‐end. The retiree portion of the health insurance claims will be removed from the internal service fund and appropriately tracked in the General Fund. Additionally, the annual net change in the internal service will be evaluated to determine the appropriate and necessary allocation of any net change in the fund’s net position.
Anticipated Completion Date: June 30, 2017 2016‐002 Revenue Recognition Contact Person Responsible for the Corrective Action Plan: Joseph R. Sabatelli, Finance Director
Corrective Action Plan: The amounts were provided as a late receivable adjustment as they were expected to be, but were not received within 90 days of the end of the fiscal year in accordance with the City’s revenue recognition policy. We will implement controls to review and reflect accrued revenues in the proper accounting period.
Anticipated Completion Date: June 30, 2017 2016‐003 Reporting Contact Person Responsible for the Corrective Action Plan: Joseph R. Sabatelli, Finance Director
Corrective Action Plan: Internal controls exist requiring review of performance reports in accordance with grant agreements by the Department of Finance but distributed by the department administering the grant. We will modify our internal controls to require all performance reports to be signed and distributed by the Department of Finance staff in addition to the existing review requirement.
Anticipated Completion Date: June 30, 2017