city of kawartha lakes
TRANSCRIPT
Committee of the Whole – Draft Findings
October 8, 2019
City of Kawartha Lakes
1
Development Charges
• Purpose of Development Charges (D.C.) is to recover the capital
costs associated with residential and non-residential growth
within the municipality
• The capital costs are in addition to what costs would normally be
constructed as part of a subdivision (i.e. internal roads,
watermains, roads, sidewalks, streetlights, etc.)
• Municipalities are empowered to impose these charges via the
Development Charges Act (D.C.A.)
2
8. Specified Local Services
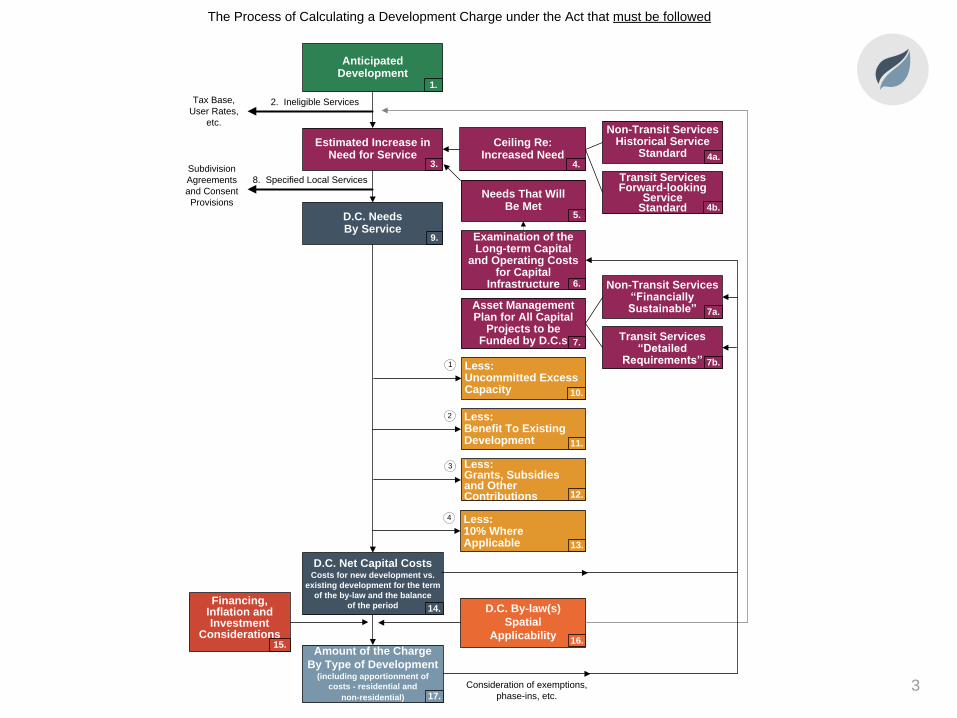
The Process of Calculating a Development Charge under the Act that must be followed
AnticipatedDevelopment
1.
Estimated Increase in Need for Service
2. Ineligible Services
Ceiling Re:Increased Need
Needs That WillBe Met
Examination of the Long-term Capital
and Operating Costs for Capital
Infrastructure
D.C. Needs By Service
Less: Uncommitted Excess Capacity
Less: Benefit To Existing Development
Less: Grants, Subsidies and Other Contributions
Less: 10% Where Applicable
D.C. By-law(s)
Spatial
Applicability
D.C. Net Capital CostsCosts for new development vs.
existing development for the term
of the by-law and the balance
of the period
Amount of the Charge
By Type of Development(including apportionment of
costs - residential and
non-residential)
Financing, Inflation and Investment
Considerations
3. 4.
5.
6.
11.
12.
13.
16.
17.
14.
15.
9.
Tax Base,
User Rates,
etc.
Subdivision
Agreements
and Consent
Provisions
Consideration of exemptions,
phase-ins, etc.
1
4
3
2
Non-Transit ServicesHistorical Service
Standard 4a.
Transit ServicesForward-looking
Service Standard 4b.
Asset Management Plan for All Capital
Projects to be Funded by D.C.s 7.
Non-Transit Services“Financially Sustainable” 7a.
Transit Services“Detailed
Requirements” 7b.
10.
3
More Homes, More Choice Act
• Bill 108, More Homes, More Choice Act, was introduced in the
Ontario Legislature on May 2, 2019 and received Royal Assent
on June 6, 2019
• Schedule 3 of the Act, amends the D.C.A.
• Many of the amendments to the D.C.A. do not come into effect
until they are proclaimed by the Lieutenant Governor, however,
transitional provisions with respect to soft services to the
prescribed date (currently anticipated to be January 1, 2021) are
provided
Status of Legislation
4
More Homes, More Choice Act
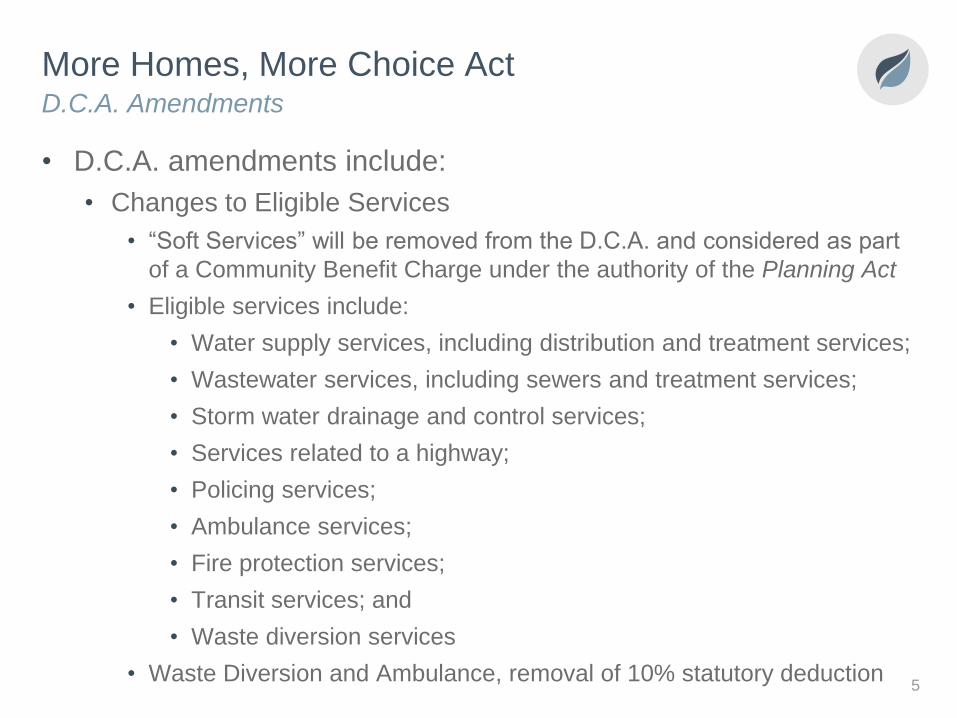
• D.C.A. amendments include:
• Changes to Eligible Services
• “Soft Services” will be removed from the D.C.A. and considered as part
of a Community Benefit Charge under the authority of the Planning Act
• Eligible services include:
• Water supply services, including distribution and treatment services;
• Wastewater services, including sewers and treatment services;
• Storm water drainage and control services;
• Services related to a highway;
• Policing services;
• Ambulance services;
• Fire protection services;
• Transit services; and
• Waste diversion services
• Waste Diversion and Ambulance, removal of 10% statutory deduction
D.C.A. Amendments
5
More Homes, More Choice Act
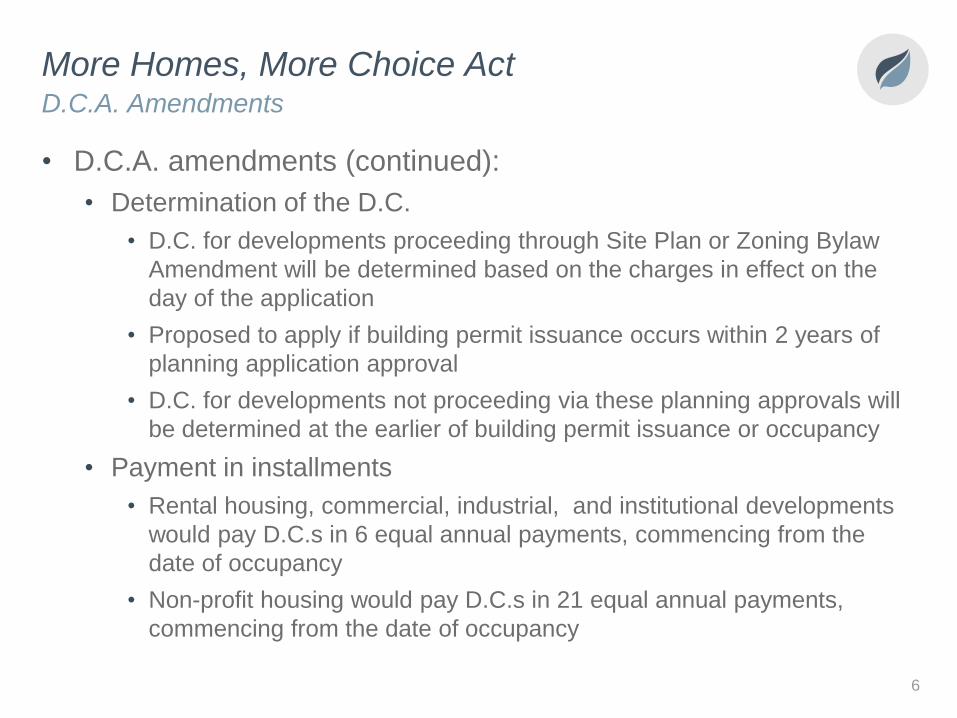
• D.C.A. amendments (continued):
• Determination of the D.C.
• D.C. for developments proceeding through Site Plan or Zoning Bylaw
Amendment will be determined based on the charges in effect on the
day of the application
• Proposed to apply if building permit issuance occurs within 2 years of
planning application approval
• D.C. for developments not proceeding via these planning approvals will
be determined at the earlier of building permit issuance or occupancy
• Payment in installments
• Rental housing, commercial, industrial, and institutional developments
would pay D.C.s in 6 equal annual payments, commencing from the
date of occupancy
• Non-profit housing would pay D.C.s in 21 equal annual payments,
commencing from the date of occupancy
D.C.A. Amendments
6
More Homes, More Choice Act
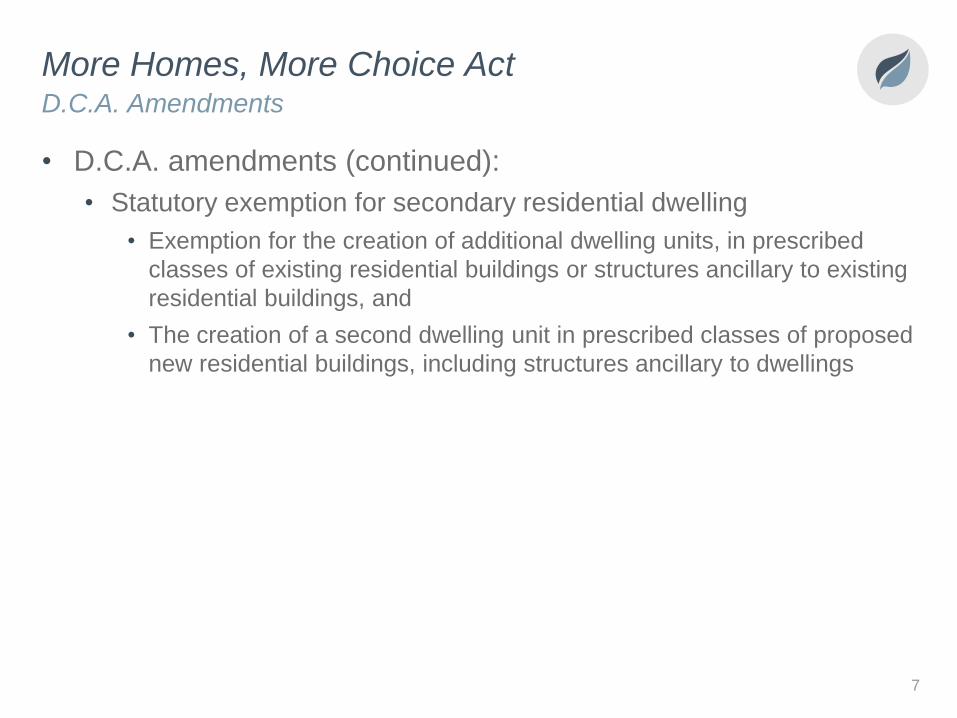
• D.C.A. amendments (continued):
• Statutory exemption for secondary residential dwelling
• Exemption for the creation of additional dwelling units, in prescribed
classes of existing residential buildings or structures ancillary to existing
residential buildings, and
• The creation of a second dwelling unit in prescribed classes of proposed
new residential buildings, including structures ancillary to dwellings
D.C.A. Amendments
7
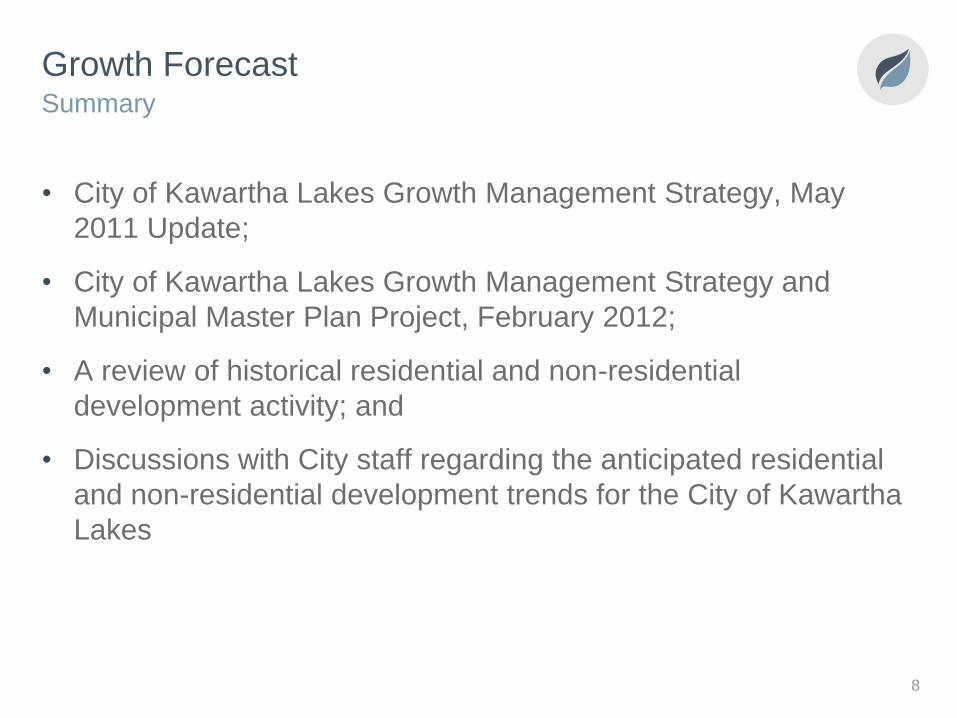
Growth Forecast
• City of Kawartha Lakes Growth Management Strategy, May
2011 Update;
• City of Kawartha Lakes Growth Management Strategy and
Municipal Master Plan Project, February 2012;
• A review of historical residential and non-residential
development activity; and
• Discussions with City staff regarding the anticipated residential
and non-residential development trends for the City of Kawartha
Lakes
Summary
8
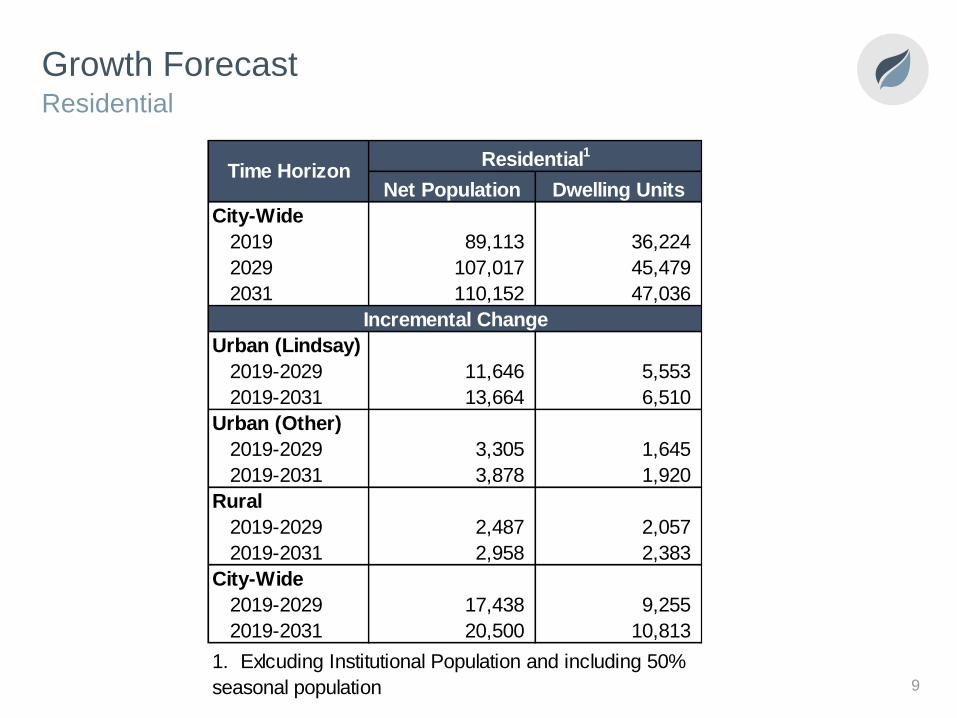
Growth Forecast
Net Population Dwelling Units
City-Wide
2019 89,113 36,224
2029 107,017 45,479
2031 110,152 47,036
Urban (Lindsay)
2019-2029 11,646 5,553
2019-2031 13,664 6,510
Urban (Other)
2019-2029 3,305 1,645
2019-2031 3,878 1,920
Rural
2019-2029 2,487 2,057
2019-2031 2,958 2,383
City-Wide
2019-2029 17,438 9,255
2019-2031 20,500 10,813
1. Exlcuding Institutional Population and including 50%
seasonal population
Time HorizonResidential
1
Incremental Change
Residential
9
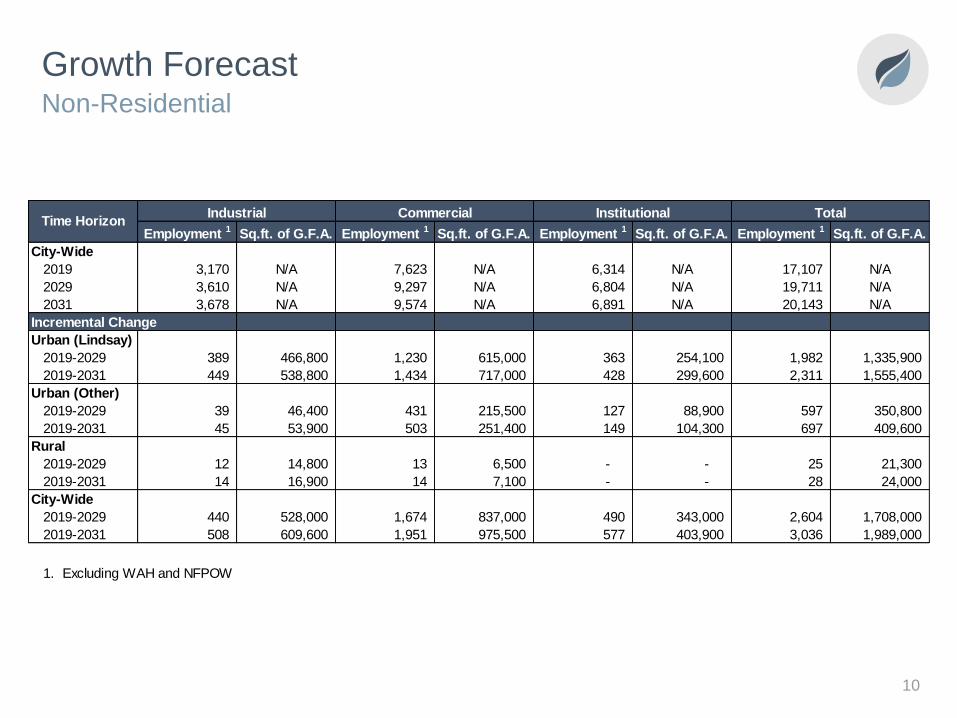
Growth Forecast
Employment 1
Sq.ft. of G.F.A. Employment 1
Sq.ft. of G.F.A. Employment 1
Sq.ft. of G.F.A. Employment 1
Sq.ft. of G.F.A.
City-Wide
2019 3,170 N/A 7,623 N/A 6,314 N/A 17,107 N/A
2029 3,610 N/A 9,297 N/A 6,804 N/A 19,711 N/A
2031 3,678 N/A 9,574 N/A 6,891 N/A 20,143 N/A
Incremental Change
Urban (Lindsay)
2019-2029 389 466,800 1,230 615,000 363 254,100 1,982 1,335,900
2019-2031 449 538,800 1,434 717,000 428 299,600 2,311 1,555,400
Urban (Other)
2019-2029 39 46,400 431 215,500 127 88,900 597 350,800
2019-2031 45 53,900 503 251,400 149 104,300 697 409,600
Rural
2019-2029 12 14,800 13 6,500 - - 25 21,300
2019-2031 14 16,900 14 7,100 - - 28 24,000
City-Wide
2019-2029 440 528,000 1,674 837,000 490 343,000 2,604 1,708,000
2019-2031 508 609,600 1,951 975,500 577 403,900 3,036 1,989,000
1. Excluding WAH and NFPOW
TotalTime Horizon
Industrial Commercial Institutional
Non-Residential
10
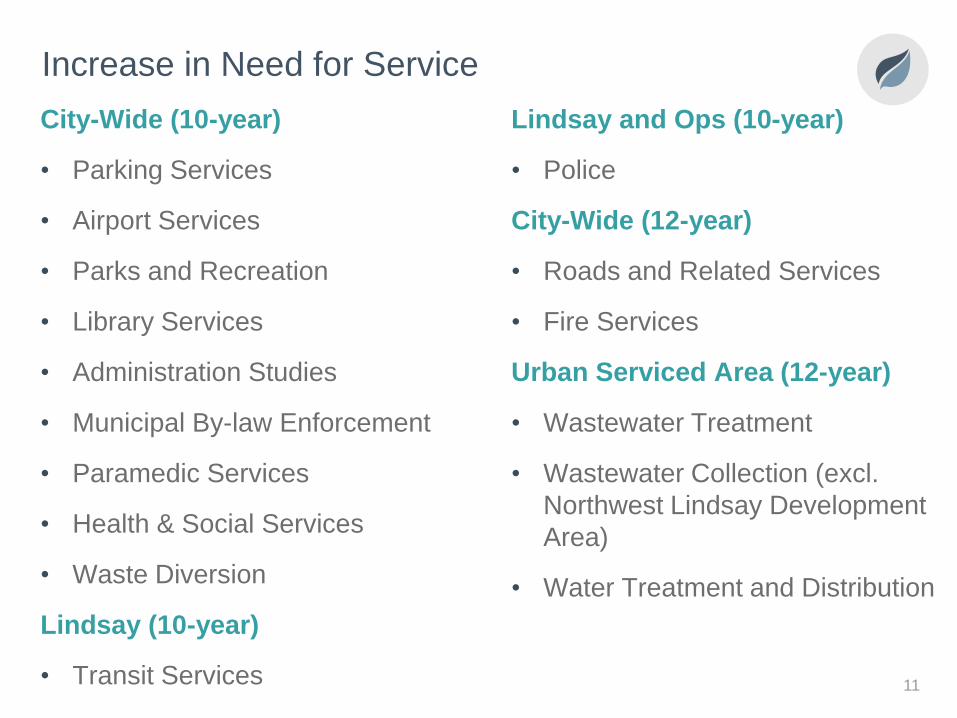
Increase in Need for Service
City-Wide (10-year)
• Parking Services
• Airport Services
• Parks and Recreation
• Library Services
• Administration Studies
• Municipal By-law Enforcement
• Paramedic Services
• Health & Social Services
• Waste Diversion
Lindsay (10-year)
• Transit Services
Lindsay and Ops (10-year)
• Police
City-Wide (12-year)
• Roads and Related Services
• Fire Services
Urban Serviced Area (12-year)
• Wastewater Treatment
• Wastewater Collection (excl.
Northwest Lindsay Development
Area)
• Water Treatment and Distribution
11
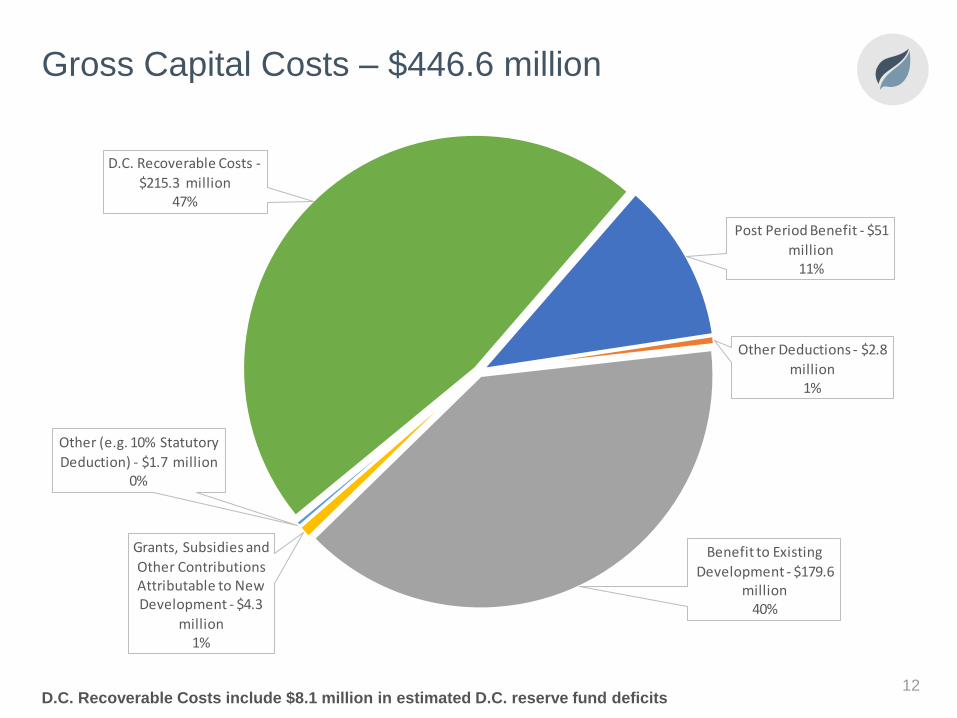
Gross Capital Costs – $446.6 million
D.C. Recoverable Costs include $8.1 million in estimated D.C. reserve fund deficits12
Post Period Benefit - $51
million11%
Other Deductions - $2.8
million1%
Benefit to Existing
Development - $179.6 million
40%
Grants, Subsidies and
Other Contributions Attributable to New Development - $4.3
million1%
Other (e.g. 10% Statutory
Deduction) - $1.7 million0%
D.C. Recoverable Costs -
$215.3 million47%
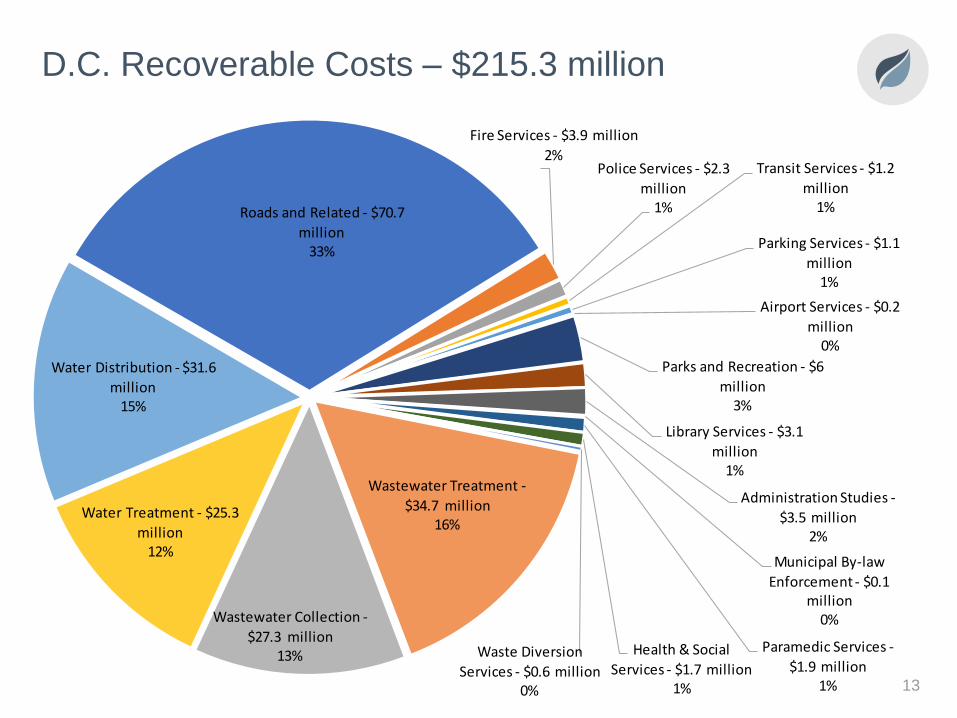
D.C. Recoverable Costs – $215.3 million
13
Roads and Related - $70.7
million33%
Fire Services - $3.9 million
2%Police Services - $2.3
million1%
Transit Services - $1.2
million1%
Parking Services - $1.1
million1%
Airport Services - $0.2
million0%
Parks and Recreation - $6
million3%
Library Services - $3.1
million1%
Administration Studies -
$3.5 million2%
Municipal By-law
Enforcement - $0.1 million
0%
Paramedic Services -
$1.9 million1%
Health & Social
Services - $1.7 million1%
Waste Diversion
Services - $0.6 million0%
Wastewater Treatment -
$34.7 million16%
Wastewater Collection -
$27.3 million13%
Water Treatment - $25.3
million12%
Water Distribution - $31.6
million15%
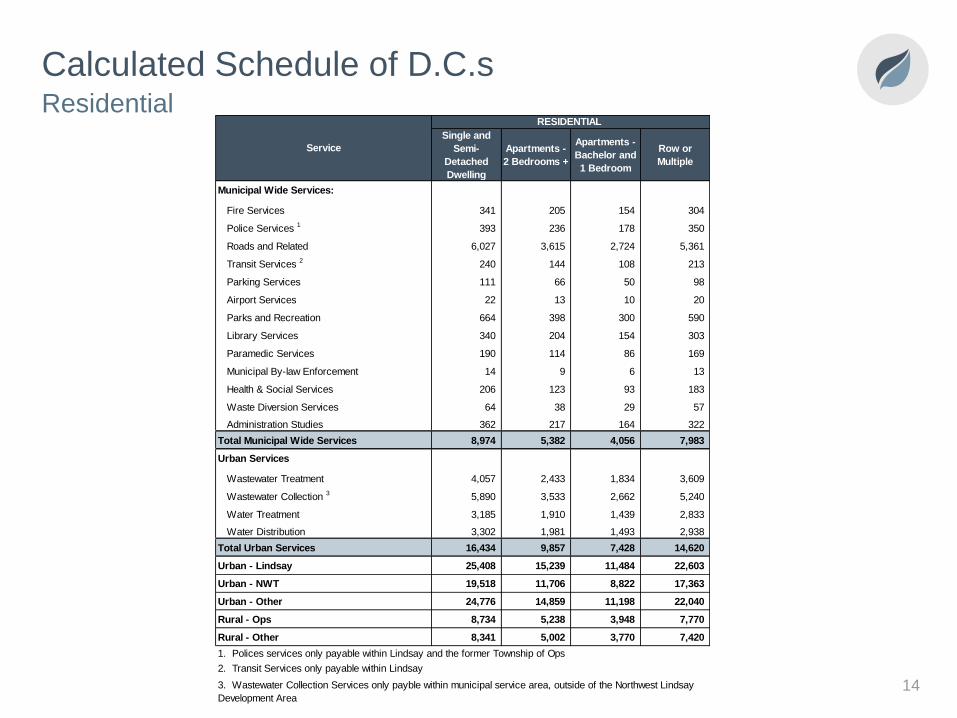
Calculated Schedule of D.C.s Residential
14
Single and
Semi-
Detached
Dwelling
Apartments -
2 Bedrooms +
Apartments -
Bachelor and
1 Bedroom
Row or
Multiple
Municipal Wide Services:
Fire Services 341 205 154 304
Police Services 1
393 236 178 350
Roads and Related 6,027 3,615 2,724 5,361
Transit Services 2
240 144 108 213
Parking Services 111 66 50 98
Airport Services 22 13 10 20
Parks and Recreation 664 398 300 590
Library Services 340 204 154 303
Paramedic Services 190 114 86 169
Municipal By-law Enforcement 14 9 6 13
Health & Social Services 206 123 93 183
Waste Diversion Services 64 38 29 57
Administration Studies 362 217 164 322
Total Municipal Wide Services 8,974 5,382 4,056 7,983
Urban Services
Wastewater Treatment 4,057 2,433 1,834 3,609
Wastewater Collection 3
5,890 3,533 2,662 5,240
Water Treatment 3,185 1,910 1,439 2,833
Water Distribution 3,302 1,981 1,493 2,938
Total Urban Services 16,434 9,857 7,428 14,620
Urban - Lindsay 25,408 15,239 11,484 22,603
Urban - NWT 19,518 11,706 8,822 17,363
Urban - Other 24,776 14,859 11,198 22,040
Rural - Ops 8,734 5,238 3,948 7,770
Rural - Other 8,341 5,002 3,770 7,420
1. Polices services only payable within Lindsay and the former Township of Ops
2. Transit Services only payable within Lindsay
Service
RESIDENTIAL
3. Wastewater Collection Services only payble within municipal service area, outside of the Northwest Lindsay
Development Area
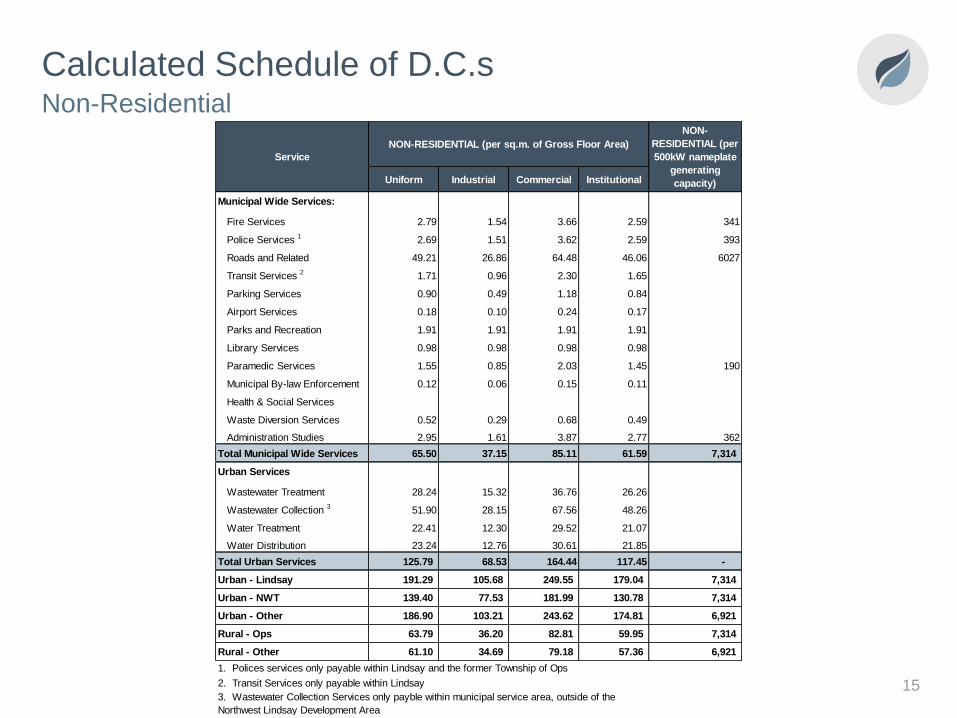
Calculated Schedule of D.C.s Non-Residential
15
Uniform Industrial Commercial Institutional
Municipal Wide Services:
Fire Services 2.79 1.54 3.66 2.59 341
Police Services 1
2.69 1.51 3.62 2.59 393
Roads and Related 49.21 26.86 64.48 46.06 6027
Transit Services 2
1.71 0.96 2.30 1.65
Parking Services 0.90 0.49 1.18 0.84
Airport Services 0.18 0.10 0.24 0.17
Parks and Recreation 1.91 1.91 1.91 1.91
Library Services 0.98 0.98 0.98 0.98
Paramedic Services 1.55 0.85 2.03 1.45 190
Municipal By-law Enforcement 0.12 0.06 0.15 0.11
Health & Social Services
Waste Diversion Services 0.52 0.29 0.68 0.49
Administration Studies 2.95 1.61 3.87 2.77 362
Total Municipal Wide Services 65.50 37.15 85.11 61.59 7,314
Urban Services
Wastewater Treatment 28.24 15.32 36.76 26.26
Wastewater Collection 3
51.90 28.15 67.56 48.26
Water Treatment 22.41 12.30 29.52 21.07
Water Distribution 23.24 12.76 30.61 21.85
Total Urban Services 125.79 68.53 164.44 117.45 -
Urban - Lindsay 191.29 105.68 249.55 179.04 7,314
Urban - NWT 139.40 77.53 181.99 130.78 7,314
Urban - Other 186.90 103.21 243.62 174.81 6,921
Rural - Ops 63.79 36.20 82.81 59.95 7,314
Rural - Other 61.10 34.69 79.18 57.36 6,921
1. Polices services only payable within Lindsay and the former Township of Ops
2. Transit Services only payable within Lindsay
Service
NON-RESIDENTIAL (per sq.m. of Gross Floor Area)
NON-
RESIDENTIAL (per
500kW nameplate
generating
capacity)
3. Wastewater Collection Services only payble within municipal service area, outside of the
Northwest Lindsay Development Area
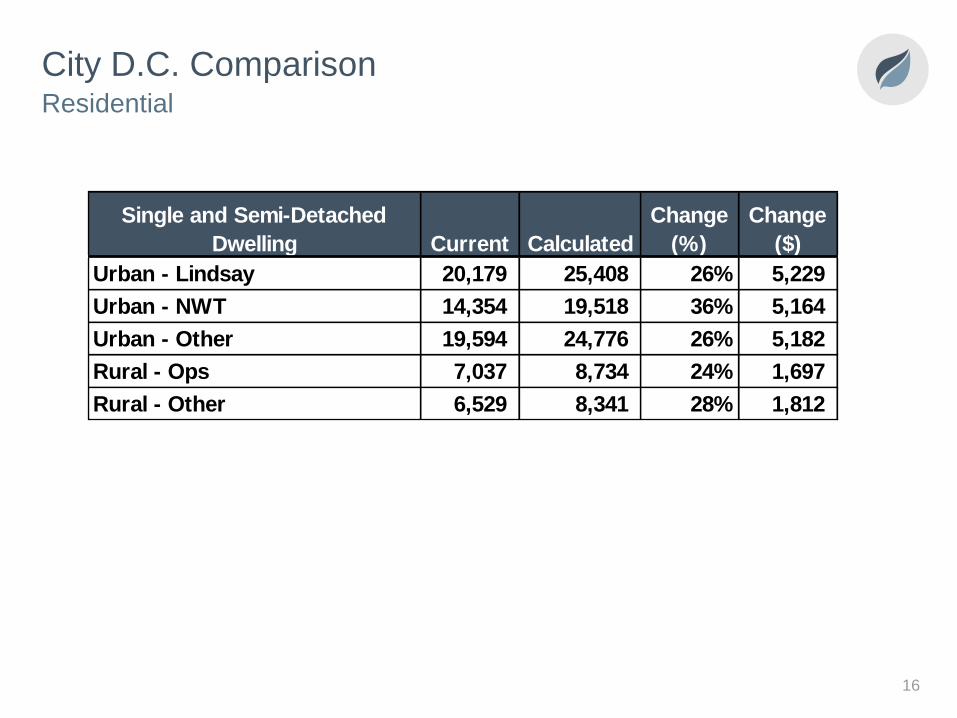
City D.C. ComparisonResidential
16
Urban - Lindsay 20,179 25,408 26% 5,229
Urban - NWT 14,354 19,518 36% 5,164
Urban - Other 19,594 24,776 26% 5,182
Rural - Ops 7,037 8,734 24% 1,697
Rural - Other 6,529 8,341 28% 1,812
Single and Semi-Detached
Dwelling Current Calculated
Change
(%)
Change
($)
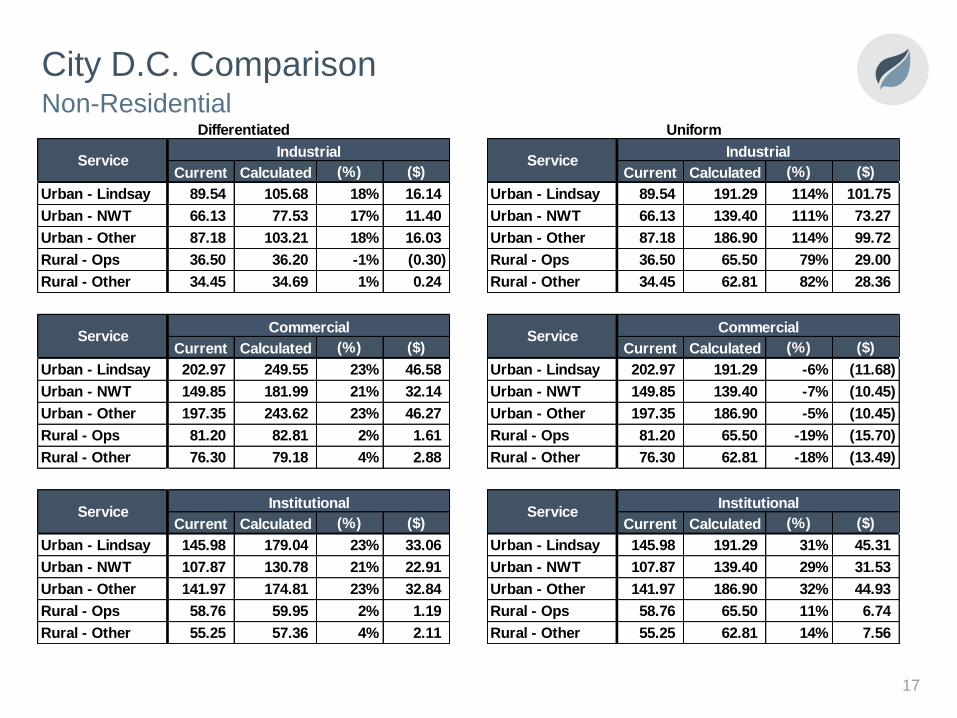
City D.C. ComparisonNon-Residential
17
Current Calculated
Change
(%)
Change
($)
Urban - Lindsay 89.54 105.68 18% 16.14
Urban - NWT 66.13 77.53 17% 11.40
Urban - Other 87.18 103.21 18% 16.03
Rural - Ops 36.50 36.20 -1% (0.30)
Rural - Other 34.45 34.69 1% 0.24
Current Calculated
Change
(%)
Change
($)
Urban - Lindsay 202.97 249.55 23% 46.58
Urban - NWT 149.85 181.99 21% 32.14
Urban - Other 197.35 243.62 23% 46.27
Rural - Ops 81.20 82.81 2% 1.61
Rural - Other 76.30 79.18 4% 2.88
Current Calculated
Change
(%)
Change
($)
Urban - Lindsay 145.98 179.04 23% 33.06
Urban - NWT 107.87 130.78 21% 22.91
Urban - Other 141.97 174.81 23% 32.84
Rural - Ops 58.76 59.95 2% 1.19
Rural - Other 55.25 57.36 4% 2.11
Differentiated
ServiceIndustrial
ServiceCommercial
ServiceInstitutional
Current Calculated
Change
(%)
Change
($)
Urban - Lindsay 89.54 191.29 114% 101.75
Urban - NWT 66.13 139.40 111% 73.27
Urban - Other 87.18 186.90 114% 99.72
Rural - Ops 36.50 65.50 79% 29.00
Rural - Other 34.45 62.81 82% 28.36
Current Calculated
Change
(%)
Change
($)
Urban - Lindsay 202.97 191.29 -6% (11.68)
Urban - NWT 149.85 139.40 -7% (10.45)
Urban - Other 197.35 186.90 -5% (10.45)
Rural - Ops 81.20 65.50 -19% (15.70)
Rural - Other 76.30 62.81 -18% (13.49)
Current Calculated
Change
(%)
Change
($)
Urban - Lindsay 145.98 191.29 31% 45.31
Urban - NWT 107.87 139.40 29% 31.53
Urban - Other 141.97 186.90 32% 44.93
Rural - Ops 58.76 65.50 11% 6.74
Rural - Other 55.25 62.81 14% 7.56
Uniform
Service
ServiceIndustrial
Commercial
Institutional
Service
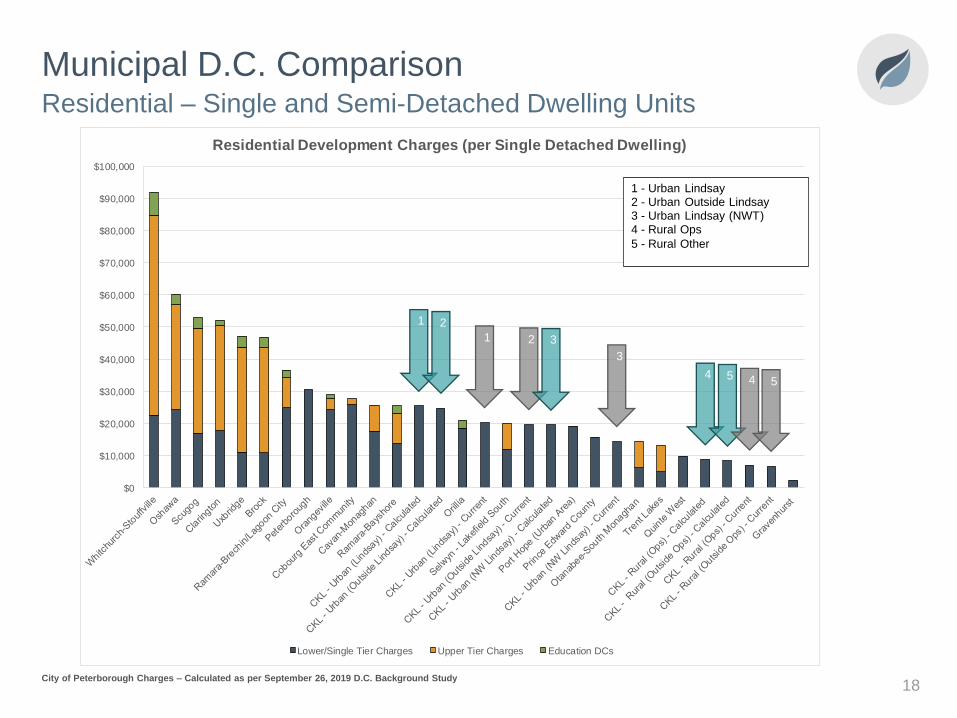
Municipal D.C. Comparison
City of Peterborough Charges – Calculated as per September 26, 2019 D.C. Background Study
Residential – Single and Semi-Detached Dwelling Units
18
$0
$10,000
$20,000
$30,000
$40,000
$50,000
$60,000
$70,000
$80,000
$90,000
$100,000
Residential Development Charges (per Single Detached Dwelling)
Lower/Single Tier Charges Upper Tier Charges Education DCs
1 - Urban Lindsay2 - Urban Outside Lindsay3 - Urban Lindsay (NWT)4 - Rural Ops
5 - Rural Other
1 2
1 2 3
3
4 5 4 5
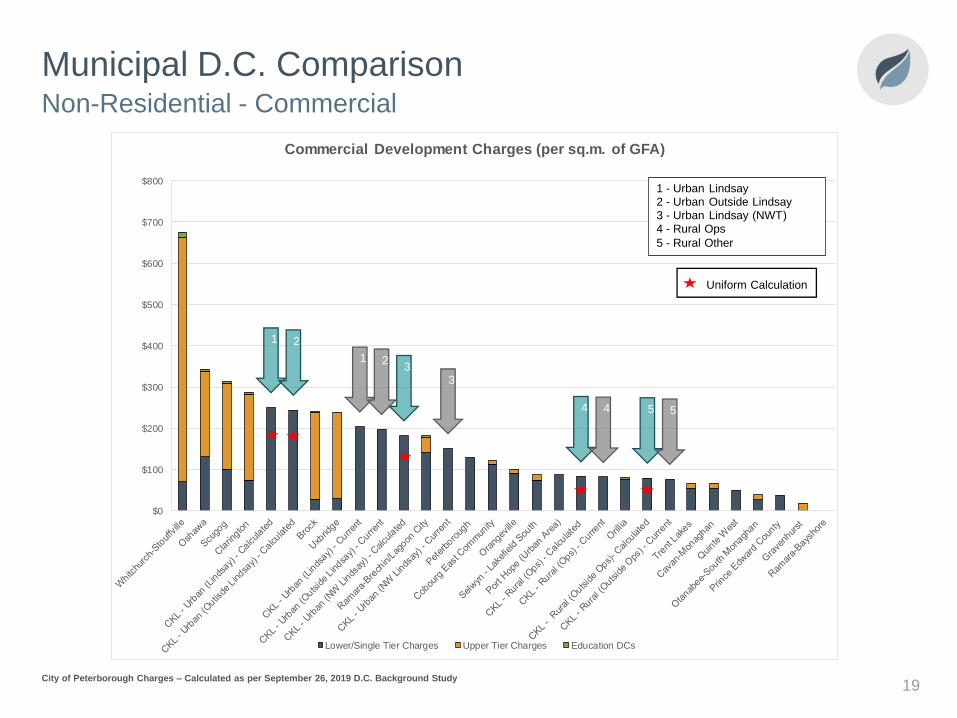
Municipal D.C. ComparisonNon-Residential - Commercial
19City of Peterborough Charges – Calculated as per September 26, 2019 D.C. Background Study
$0
$100
$200
$300
$400
$500
$600
$700
$800
Commercial Development Charges (per sq.m. of GFA)
Lower/Single Tier Charges Upper Tier Charges Education DCs
Uniform Calculation
1 - Urban Lindsay2 - Urban Outside Lindsay3 - Urban Lindsay (NWT)4 - Rural Ops
5 - Rural Other
1 2
1 23
3
4 4 5 5
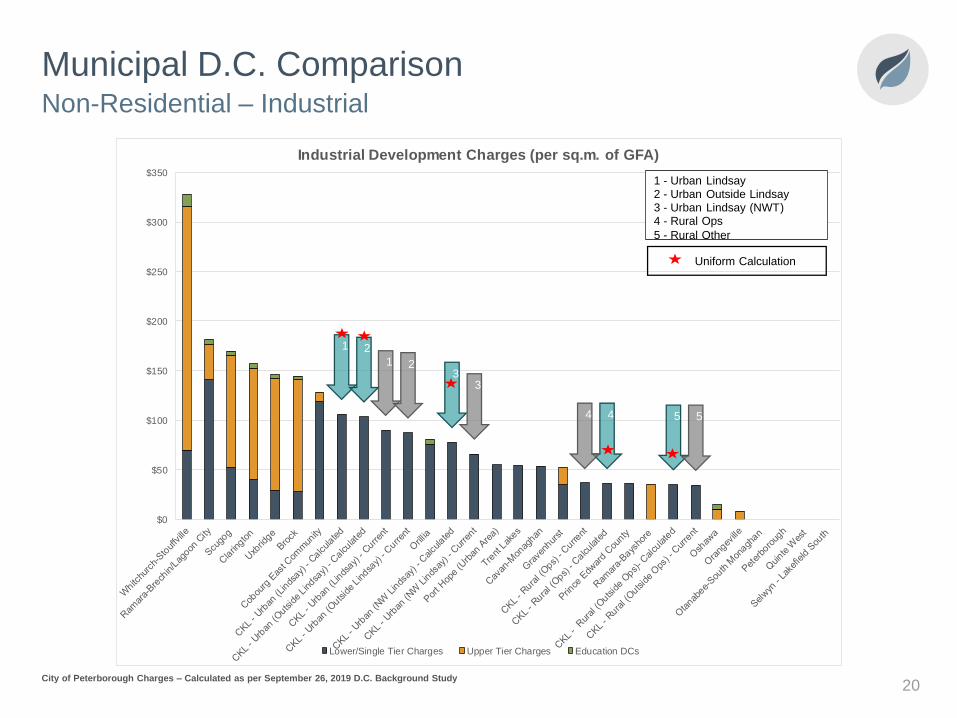
Municipal D.C. ComparisonNon-Residential – Industrial
20City of Peterborough Charges – Calculated as per September 26, 2019 D.C. Background Study
$0
$50
$100
$150
$200
$250
$300
$350
Industrial Development Charges (per sq.m. of GFA)
Lower/Single Tier Charges Upper Tier Charges Education DCs
54
1 2
3
Uniform Calculation
1 - Urban Lindsay2 - Urban Outside Lindsay3 - Urban Lindsay (NWT)4 - Rural Ops
5 - Rural Other
1 2
3
4 5
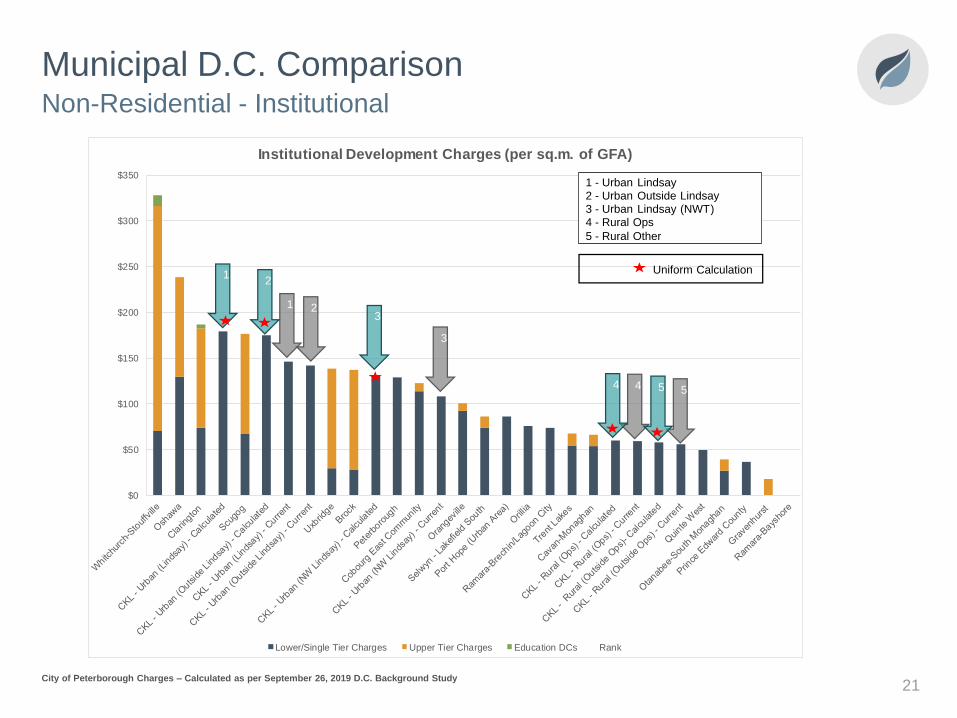
Municipal D.C. ComparisonNon-Residential - Institutional
21City of Peterborough Charges – Calculated as per September 26, 2019 D.C. Background Study
$0
$50
$100
$150
$200
$250
$300
$350
Institutional Development Charges (per sq.m. of GFA)
Lower/Single Tier Charges Upper Tier Charges Education DCs Rank
3
1 2
4 5
12
3
4 5
Uniform Calculation
1 - Urban Lindsay2 - Urban Outside Lindsay3 - Urban Lindsay (NWT)4 - Rural Ops
5 - Rural Other

Development Charge By-Law
Policies
22
Development Charges Assistance Policy
• The City’s “D.C. Assistance Policy” proposes to address
specific D.C. implementation policies
• The policy establishes guidelines for the implementation of the
D.C., with respect to:
• Deferred D.C. payments
• Defrayal/exemptions of D.C. payments
• Extensions for the eligibility of redevelopment credits
• D.C. Assistance Policy approach is being utilized to allow the
City to monitor the effectiveness of the policy and provide
increased flexibility to amend the policy as required
23
D.C. By-Law Policies
• D.C.s can be calculated and payable at the time of building
permit issuance or at subdivision registration for hard services
• Municipality may enter into agreement for the D.C. to paid before or
after it would otherwise be payable
• A municipality is not required to issue a building permit for
development to which a D.C. applies unless the charge has
been paid
• If a D.C. or any part of it remains unpaid after it is payable, the
amount unpaid shall be added to the tax roll and shall be
collected in the same manner as taxes
Timing of Collection
24
D.C. By-Law Policies
• Calculation and payment of D.C.s for roads, water, and
wastewater services may be required at the time of subdivision
or consent agreement, in accordance with Council policy
• All other D.C. are calculated and payable at the time of building
permit issuance
• D.C. Deferral Policies to be addressed in City’s D.C. Assistance
Policy:
• Deferral to condominium registration or occupancy
• Deferral for high density residential development (50% payable at
1.5 years from agreement and 50% at 3 years from agreement)
• Deferral to date of occupancy for residential development only
• Deferral for specified period
• Non-residential development (up to 3-year maximum deferral)
Timing of Collection – Proposed Policies
25
D.C. By-Law Policies
• The Act provides for some mandatory exemptions but also allows
municipalities the ability to provide it’s own exemptions
• Exemptions set out certain classes of development that will not be
required to pay D.C.s. These exemptions may be determined by:
• Use (e.g. places of worship, farm buildings)
• Geographic area
• Development type
• Service exemption
• The Act is specific in identifying that the revenue forgone may not
be made up by increasing the D.C.s for other classes of
development
• In effect, it is a loss of revenue to the municipality which will have
to be funded via taxes, rates, reserves or other financial resources
D.C. Exemptions
26
D.C. By-Law Policies
• The D.C.A. provides statutory exemptions for:
• Industrial building expansions (may expand by 50% with no D.C.)
• Residential intensification:
• May add up to two apartments for a single detached home as long as
size of home doesn’t double
• Add one additional unit in medium and high density buildings
• Upper/Lower Tier Governments and School Boards
Statutory Exemptions
27
Current D.C. Policies
• Non-statutory exemptions proposed:
• Place of worship, non-profit hospice, public hospital, cemetery,
burial site, or crematorium
• Agricultural development
• Park model trailer
• Municipal housing dwelling unit
Non-Statutory Exemptions
28
D.C. By-Law Policies
• Redevelopment credits on conversions or demolitions of existing
buildings or structures are generally granted to recognize what is
being replaced on site (not specific in the Act but provided by
case law)
• Redevelopment credits granted for conversions/demolitions
• Building/structure must have bee capable of being occupies
within 3-years prior to the date of redevelopment
• D.C. Assistance Policy proposes:
• Maximum 3-year extension where commitment to redeveloping in
timely manner has been demonstrated
• Maximum 7-year extension where timely demolition of a derelict
building is, in Council’s determination, in the public interest
Redevelopment Credits
29
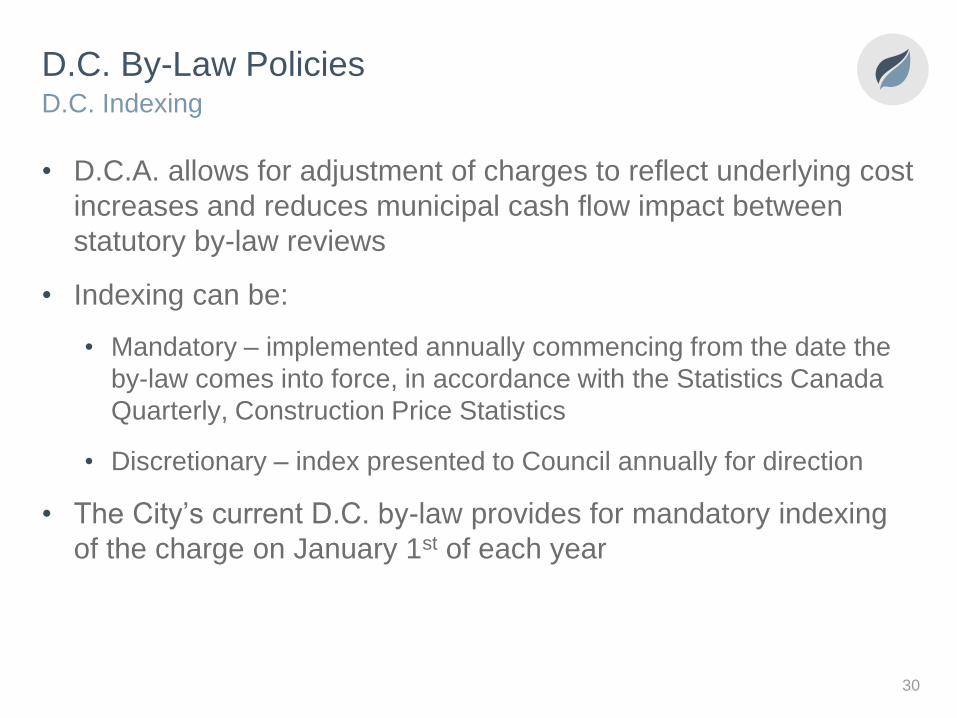
D.C. By-Law Policies
• D.C.A. allows for adjustment of charges to reflect underlying cost
increases and reduces municipal cash flow impact between
statutory by-law reviews
• Indexing can be:
• Mandatory – implemented annually commencing from the date the
by-law comes into force, in accordance with the Statistics Canada
Quarterly, Construction Price Statistics
• Discretionary – index presented to Council annually for direction
• The City’s current D.C. by-law provides for mandatory indexing
of the charge on January 1st of each year
D.C. Indexing
30
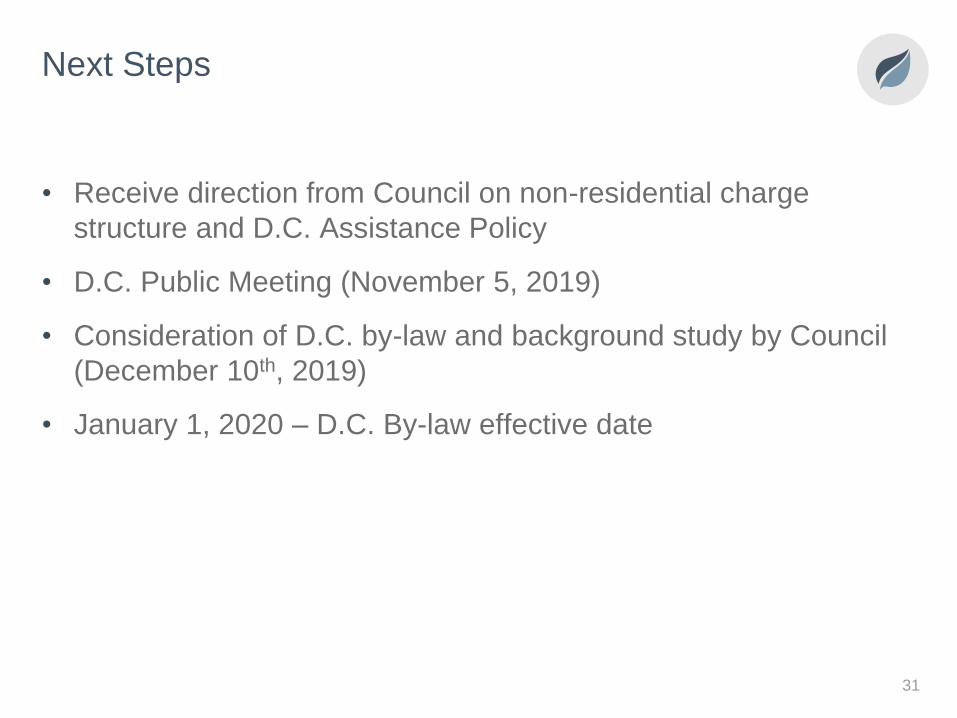
Next Steps
• Receive direction from Council on non-residential charge
structure and D.C. Assistance Policy
• D.C. Public Meeting (November 5, 2019)
• Consideration of D.C. by-law and background study by Council
(December 10th, 2019)
• January 1, 2020 – D.C. By-law effective date
31