city of manchester cafr.pdfmanchester airport, a self-supporting, city-owned entity, is the largest...
TRANSCRIPT

CCIITTYY OOFF MMAANNCCHHEESSTTEERR
NNEEWW HHAAMMPPSSHHIIRREE
CCOOMMPPRREEHHEENNSSIIVVEE AANNNNUUAALL
FFIINNAANNCCIIAALL RREEPPOORRTT
FFOORR TTHHEE FFIISSCCAALL YYEEAARR EENNDDEEDDJJUUNNEE 3300,, 22000033

CITY OF MANCHESTER, NEW HAMPSHIREComprehensive Annual Financial Report
Year Ended June 30, 2003
i
TABLE OF CONTENTSPage
INTRODUCTORY SECTION
Letter of Transmittal 1
Organizational Chart 31
City Officials 32FINANCIAL SECTION
Independent Auditor’s Report 33
Management’s Discussion and Analysis 35
Basic Financial StatementsGovernment-wide Financial Statements:
Statement of Net Assets 50
Statement of Activities 52
Fund Financial StatementsBalance Sheet – Governmental Funds 54
Statement of Revenues, Expenditures and Changes in Fund Balances(Deficit) – Governmental Funds 55
Reconciliation of the Statement of Revenues, Expenditures, and Changesin Fund Balances of Governmental Funds to the Statement of Activities 56
Statement of Revenues, Expenditures and Changes in Fund Balances –Budget and Actual (Budget Basis) – General Fund 57
Statement of Net Assets – Proprietary Funds 58
Statement of Revenues, Expenses, and Changes in Fund Net Assets –Proprietary Funds 59
Statement of Cash Flows - Proprietary Funds 60
Statement of Net Assets – Fiduciary Trust and Agency Funds 61
Statement of Changes in Fiduciary Net Assets – Fiduciary Trust 62Notes to the Financial Statements 63
Combining And Individual Fund Statements and Schedules
General Fund:
Comparative Balance Sheets 101
Comparative Statements of Revenues, Expenditures, and Changes inFund Balances 102
Schedule of Revenues and Transfers In - Budget and Actual (BudgetBasis) 103
Schedule of Expenditures, Encumbrances and Other Financing Uses -Budget and Actual (Budget Basis) 108
Nonmajor Governmental Funds:
Combining Balance Sheet 112
Combining Statement of Revenues, Expenditures and Changes inFund Balances 114

CITY OF MANCHESTER, NEW HAMPSHIREComprehensive Annual Financial Report
Year Ended June 30, 2003
ii
TABLE OF CONTENTSPage
Nonmajor Proprietary Funds:
Combining Statement of Net Assets 117
Combining Statement of Revenues, Expenditures and Changes in FundNet Assets 118
Combining Statement of Cash Flows 119
Capital Assets Used in the Operation of Governmental Funds:
Schedule of Capital Assets - By Source 121
Schedule of Capital Assets - By Function and Activity 122Schedule of Changes in Capital Assets - By Function and Activity 123
STATISTICAL SECTION
General Governmental Expenditures by Function Table I 126
General Governmental Revenues by Source Table II 128Property Tax Levies and Collections Table III 130
Assessed and Estimated Actual Value of Taxable Property Table IV 132
Special Assessment Billings and Collection - Central Business District Table V 134
Property Tax Rates Table VI 136Computation of Legal Debt Margin Table VII 137
Ratio of Net General Obligation Bonded Debt to Assessed Value and NetBonded Debt Per Capita Table VIII 138
Ratio of Annual Debt Service Expenditures for General Obligation BondedDebt to Total General Governmental Expenditures Table IX 140
Computation of Direct and Overlapping Debt Table X 141Revenue Bond Coverage Table XI 142
Ratio of Bonded Debt Expenditures to Local Revenues Table XII 144
Demographic Statistics Table XIII 145
Property Value, Construction, Bank Deposits and Airport Tonnage Table XIV 146Principal Taxpayers Table XV 147
Governmental Expenditures Per Capita Table XVI 148
Miscellaneous Statistics Table XVII 150

INTRODUCTORYSECTION

1
City of ManchesterDepartment of Finance
One City Hall PlazaManchester, NH 03101(603) 624-6460Fax: (603) 624-6549
January 2, 2004
To the Honorable Board of Mayor and Aldermen andCitizens of the City of Manchester, New Hampshire
The Comprehensive Annual Financial Report (the "CAFR") for the City of Manchester (the "City") forthe fiscal year ended June 30, 2003 is hereby submitted. The City's Finance Department prepared thisCAFR. The purpose of this report is to provide citizens, investors, grantor agencies, and other interestedparties with reliable financial information about the City. Responsibility for both the accuracy of thedata and the completeness and fairness of the presentation, including all disclosures, rests withmanagement. To the best of our knowledge and belief, the enclosed data is accurate in all materialrespects and is reported in a manner that presents fairly the financial position and results of theoperations of the various funds and component units of the City. All disclosures necessary to enable thereader to gain an understanding of the City's activities have been included.
The CAFR is presented in three sections: the introductory section, the financial section, and thestatistical section. The introductory section, which is unaudited, includes this letter of transmittal, theCity's organizational chart, and a listing of City officials. The financial section includes the independentauditor's report; management’s discussion and analysis; the basic financial statements; notes to financialstatements; and the combining and individual financial statements and schedules. The statistical section,which is unaudited, includes pertinent financial and general information indicating trends forcomparative basis fiscal years.
The City's basic financial statements include all entities for which the City is financially accountable,and other organizations of the City for which the nature and significance of their relationship with theCity are such that exclusion would cause the City's financial statements to be misleading or incomplete.The Governmental Accounting Standards Board ("GASB") Statement 14 has set forth criteria to beconsidered in determining financial accountability. This criteria includes whether the City, as theprimary government, has appointed a voting majority of an organization's governing body and (1) theability of the City to impose its will on that organization or (2) the potential for the organization toprovide specific financial benefits to, or impose specific financial burdens on the City.
The City has three component units - Manchester School District, Manchester DevelopmentCorporation, and the Manchester Transit Authority. Using the criteria of GASB Statement 14,management determined that the three component units should be discretely presented.

City of Manchester, New Hampshire2003 Comprehensive Annual Financial Report
2
The City is required to have an annual audit performed in accordance with auditing standards generallyaccepted in the United States of America, and the standards applicable to financial audits contained in"Government Auditing Standards," issued by the Comptroller General of the United States of Americaand in conformity with the provisions of the Single Audit Act Amendments of 1996 and the UnitedStates Office of Management and Budget Circular A-133, "Audits of States, Local Governments andNonprofit Organizations." The federal single audit for the year ended June 30, 2003, will be issuedunder separate cover. All information related to the single audit, including the schedule of expendituresof federal awards, findings and recommendations and auditor's report on compliance and on the internalcontrol over financial reporting based on an audit of the basic financial statements, will be includedtherein.
General Description - The City is located on the Merrimack River in south central New Hampshire,approximately 58 miles north of Boston, Massachusetts. It is bordered by the towns of Hooksett,Bedford, Londonderry, Goffstown, Auburn, Litchfield, and Merrimack. The City has a population of108,150, according to the 2003 report of the New Hampshire Office of State Planning, and occupies aland area of 33.9 square miles. The Manchester Metropolitan Area, with a ten mile radius, has apopulation of over 310,000, and the Manchester Trade Area, with a 20 mile radius, has a population ofover 628,000. The Manchester Metropolitan Area and the Manchester Trade Area are areas that the Citybelieves represent key geographic regions for the City’s growing economy.
The City’s history dates back to 1651 and was first settled in the early Eighteenth Century by JohnGoffe, on land, which is now the City, that was the disputed territory of Massachusetts and NewHampshire. This land became part of New Hampshire when New Hampshire became a separateprovince in 1741. In 1751, the area was incorporated as a town and renamed Derryfield. Over the nextcentury, the town evolved from a grazing field into a developing manufacturing center with major cottonand wool milling industries. Samuel Blodgett, the visionary of this development, compared the town tothe industrial center of Manchester, England: hence, in 1810, the name of the town was officiallychanged to Manchester. In 1846, Manchester was granted its city charter. Manchester was one of thefirst planned cities in the country. Its streets are laid out in a grid pattern and major streets run parallel tothe Merrimack River. In recent years the City's economy has undergone a transition from one that wasmanufacturing-based (textile) to one that includes a diverse array of businesses and industries.
The City is the largest city north of Boston and has been frequented by nearly every candidate forPresident dating back to the days of Abraham Lincoln, especially since the time when New Hampshirebegan the first in the nation presidential primary every four years. Currently, the City has a diverseeconomy with a combination of manufacturing, service and retail firms. Once the home of the world’slargest textile mill complex, today the City is home to over 200 diversified manufacturing firms alongwith service firms as noted herein.
The City continues to invest in its downtown and its future which has brought residents to the downtownarea for dining, recreation, shopping and numerous cultural events. The city has a new civic arena, theVerizon Wireless Arena, which is a $67 million multi-use facility with approximately 10,000 seats forthe American Hockey League’s Manchester Monarchs, an affiliate of the Los Angeles Kings of theNational Hockey League. The City also hosts a number of cultural organizations at the Palace Theatresuch as the New Hampshire Symphony Orchestra, the New Hampshire Philharmonic Orchestra and theOpera League of New Hampshire. The City has over 900 acres of parks and play grounds and also ownsthe McIntyre Ski Area, which provides substantial recreational resources for the community.

City of Manchester, New Hampshire2003 Comprehensive Annual Financial Report
3
The City owns and, through its Department of Aviation, operates Manchester Airport. Strategicallylocated in the heart of northern New England, Manchester Airport offers air travelers easy access,competitive airfares, ample parking near the terminal and growing schedule of non-stop and direct jetservice. Manchester Airport, a self-supporting, city-owned entity, is the largest commercial passenger,cargo, and general aviation airport in all of northern New England. Manchester Airport is completing amulti-year terminal and runway expansion project which when completed will permit enhanced service,including coast-to-coast non-stop flights and meet increased demand at the Airport. The terminal andrunway expansion projects were financed with the proceeds of revenue bonds issued by the City onbehalf of the Airport.
Government and Financial Controls – The City operates with a strong mayor form of government.The Mayor is the City’s full-time chief executive officer. The Mayor has appointment powers andbudget line-item veto authority. The City’s current charter (the “Charter”) was approved by the voters ofthe City at the November 5, 1996 general election. The Charter includes an ethics policy, a localinitiative option, and calls for the formation of a Charter Review Committee every ten years. A charterReview Committee was established during FY 2002 and produced its final report containing a proposednew Charter. The Board of Aldermen referred the Charter Review Committee’s proposed Charter toCity voters for consideration at the November, 2003 election. The proposed charter revisions included areturn to partisan City elections as well as the elimination of the two at-large positions on the Board ofAlderman and the School Board. The proposed new charter was defeated at the November 2003 generalelection.
The City is governed by an elected Mayor and a fourteen member Board of Aldermen representing eachof the city’s twelve wards and two aldermen elected at-large.
The Board of Mayor and Aldermen approves the City’s budget. The Board of Aldermen also nominatesand appoints the City’s officers. The Finance Committee, consisting of the entire Board of Mayor andAldermen, approves labor contracts and also adopts monetary appropriations.
City financial management is the responsibility of the City’s Department of Finance, which is staffed by14 full-time personnel. The head of the Department of Finance is the Finance Officer of the City. TheDepartment of Finance is responsible for establishing and maintaining a system of controls and financialreporting to ensure that the City’s assets are protected from loss, theft or misuse and to ensure thatadequate accounting data is compiled to allow for the preparation of financial statements in conformitywith law and generally accepted accounting principles (GAAP). The Department of Finance alsoperforms significant and ongoing monitoring of the financial performance of the City’s departments andenterprise funds, including monthly and quarterly interim reports and forecasted year-end revenue andexpenditure/expense balances for all departments. As required by City ordinance and by the Charter,interim reports are submitted to the Board of Mayor and Aldermen and all City Department heads. Keyrevenue and expenditure/expense items are highlighted in these reports by the Finance Officer forattention by the respective readers.
Interim reports are reviewed with the Committee on Accounts, Enrollment and Revenue Administration(“COA”). The COA is a five member standing committee of the Board of Aldermen. The COA meets ona regular basis to review and to discuss financial matters.

City of Manchester, New Hampshire2003 Comprehensive Annual Financial Report
4
The City has an adopted Investment Policy. The Finance Officer also reports on investment performanceto the Board of Mayor and Aldermen on a quarterly basis.
The City has also adopted debt policies and ordinances for the handling of one-time revenues, insurancereserves and undesignated fund balances.
The City’s interim financial reports, budget and CAFR are available for viewing on the City’s awardwinning web page.
Financial Information - The City's accounting system is organized and operated on a fund basis. Afund is defined as an accounting entity with a self-balancing set of accounts. The types of funds utilizedby the City are as follows: general, special revenue, capital projects, enterprise, trust, and agency. Thetype and number of individual funds established is determined by GAAP and sound financialadministration. The general, special revenue, and capital projects are maintained on a modified accrualbasis of accounting, generally with the revenues recorded when measurable and available and theexpenditures recorded when the services or goods are received and liabilities are incurred. However,debt service expenditues as well as expenditures related to compensated absences and claims andjudgements are recorded when payable from current financial resources. Accounting records for theCity's enterprise, pension, and trust funds are on the accrual basis of accounting. Agency funds arecustodial in nature (assets equal liabilities) and do not involve measurement of results of operations.
Internal Controls - Management of the City is responsible for establishing and maintaining a system ofinternal controls over financial reporting to ensure that the assets of the government are protected fromloss, theft, or misuse and to ensure that adequate accounting data is compiled to allow for thepreparation of financial statements in conformity with GAAP. Controls are designed to providereasonable, but not absolute assurance regarding (1) the safeguarding of assets against loss fromunauthorized use; and (2) the reliability and accuracy of financial statements. The concept of reasonableassurance recognizes that the cost of internal control should not exceed the benefits likely to be derived;and that the evaluation of cost and benefits requires estimates and judgment by management. The Citybelieves that its internal accounting controls adequately safeguard assets and provide reasonableassurance of proper recording of financial transactions.
As part of the City's single audit, tests were made of the government's internal controls over financialreporting and of its compliance with applicable laws and regulations, including those related to federaland state financial award programs. This testing was not sufficient to support an opinion on thegovernment's internal control system or its compliance with laws and regulation. However, the audit forthe year ended June 30, 2003 disclosed no material internal control weaknesses or material violations oflaws and regulations.
Appropriation Process and Budget Control - The Charter provides for the Mayor, and such otherofficials as the Mayor shall select, to prepare a budget for consideration by the Board of Aldermen. TheMayor's proposed budget must include certain historic and projected expenditure and revenueinformation and statements of anticipated tax levy and debt service requirements. The Mayor's proposedbudget is referred to a public hearing. After the public hearing the BMA may adopt the proposed budgetwith or without amendment. If amendments are made, a second public hearing may be held prior to finaladoption. The Mayor may veto the entire budget or line items thereof. In the event of a veto all portionsof the budget not vetoed shall be passed. If the BMA fails to adopt appropriation resolutions for theensuing fiscal year by June 30th, the Mayor's budget as originally proposed shall prevail.

City of Manchester, New Hampshire2003 Comprehensive Annual Financial Report
5
The Charter also provides for supplemental appropriations, reductions of appropriations, and transfers ofappropriations under certain limited circumstances.
The City maintains extensive budgetary controls. The objective of these controls is to ensure compliancewith legal provisions embodied in the annual appropriated budget approved by the BMA. Activities ofthe general fund are included in the annual appropriated budget. Project-length budgets are prepared forthe special revenue and capital projects funds. The level of budgetary control (i.e., the level at whichexpenditures cannot legally exceed the appropriated amount) is the departmental level within each fund.The City also maintains an encumbrance accounting system as one method of maintaining budgetarycontrol. Unencumbered amounts lapse at year-end. Encumbered amounts at year-end are reported asreservations of fund balance.
As demonstrated by the statements and schedules included in the financial section of this report, the Citycontinues to meet its responsibility for sound financial management.
Cash Management Policies and Practices - Excess cash was invested in U.S. Treasury Bills,certificates of deposit, repurchase agreements, and the State of New Hampshire (the "State") InvestmentPool. The maturities of the investments range from thirty days to six months, with the average maturitycloser to the thirty-day range. This was certainly not due to a shortage of funds, but to the reality that themarket was in an inverted yield curve position. Consequently, funds were invested for shorter durationsto take advantage of the rate environment. The average yield on investments was 1.34%, which resultedin the $736,111 that was realized as interest income in the general fund, which was considerably lessthan the anticipated revenue figure.
The City's Investment Policy conveys the concept that the preservation of capital and the liquidityrequirements are the two primary factors considered in the structure of the portfolio. Whetherinstruments are marketed by banking institutions or pooled investment managers, they are subject tostringent requirements. Accordingly, 78% of the investments held at fiscal year-end were collateralizedthrough Joint Custody Accounts at the Federal Reserve Bank of Boston or through perfected collateralarrangements. This contributed to the classification of a low risk profile, which the City strives tomaintain. Most accounts/securities were held and designated specifically in the name of the City, whilethe guarantor of the pooled investment arrangement is the nation's leading municipal bond insurer and apublicly traded, NYSE-listed company.
Risk Management - The City has a program of both self-insurance and policies for worker'scompensation, health, and general liability. Under this arrangement a third party administrator managesthe claims with the City Risk Manager.
The City has a pro-active Employee Safety Program with a Safety Officer and a Safety Committeemeeting on a regular basis.
Liability, property, auto, and professional coverage are maintained with claims coordinated through theRisk Management office.
Community Improvement Programs – As part of the City budget process, the City Finance Officerprovides the Mayor and Aldermanic CIP committee with a five year debt affordability forecast as a basisfor the Planning Department development of the Mayor’s recommended CIP program/budget. The pro-ject initiatives are envisioned over the ensuing fiscal period in accordance with the affordability forecast.

City of Manchester, New Hampshire2003 Comprehensive Annual Financial Report
6
GENERAL GOVERNMENT FUNCTIONS
Education
During fiscal year 2003, the Manchester School District (“MSD”) was able to establish $2,842,137 to itsbudgetary basis fund balances. The FY 2002 fund deficit of $2,081,077 has been eliminated in FY 2003by a BMA appropriation in accordance with a court-adopted Settlement Agreement (dated October 9,2001). The School District now has a fund balance of $761,060.
The MSD is the largest and oldest school system in the State. The MSD includes fifteen elementaryschools, including a developmental preschool, four middle schools, three fully accredited high schools,the Manchester School of Technology (a regional vocational/technical school), and a program of adulteducation. During the 2002-2003 academic year, the MSD served approximately 17,576 students,including Sending District (hereinafter defined) students, and employed approximately 2,475 full-timeand part-time faculty and staff.
The public school system comprises 22 school buildings as follows:
Preschool & Elementary 15
Junior High Schools 4
Senior High Schools 3
Enrollment in the Manchester schools for the 2002-2003 school year represents a 0.8% increase over the2001-2002 school year. The school faculty totals 1,284 full time teaching positions, yielding a student-to-teacher ratio of 13.7 to 1. The table below sets forth recent trends in Manchester’s school enrollments.
ENROLLMENT IN PUBLIC SCHOOLS
Year Elementary Middle/Junior High Senior High Total2002 — 03 7,201 3,765 6,610 17,5762001 — 02 7,277 3,719 6,442 17,4382000 — 01 7,422 3,713 6,272 17,4071999 — 00 7,379 3,612 6,056 17,0471998 — 99 8,111 3,064 5,630 16,805
Four of the City’s neighboring school districts, the Bedford School District, the Auburn School District,the Candia School District and the Hooksett School District (collectively, the “Sending Districts”) sendapproximately 1,790 secondary school students to the City’s high schools each year. The SendingDistricts have entered into agreements with the City to provide for the payment of tuition and other coststo the City.
The MSD’s middle schools and high schools offer extensive music and art programs, competitiveathletics, clubs, and community service organizations. All schools provide opportunities for parents toparticipate at school or from home through parent associations and volunteer groups. Partnerships withthe business community are highly valued. Most schools enjoy one or more business/educationcollaboratives.

City of Manchester, New Hampshire2003 Comprehensive Annual Financial Report
7
In addition to the basic curriculum, the MSD provides special education services for learning disabled,mentally retarded and emotionally disturbed children, programs for the deaf, and an English as a SecondLanguage program.
Although the City prides itself in the maintenance and upkeep of the school infrastructure, time placesdemands on these buildings that only an extensive and costly comprehensive repair, alteration andadditions program can properly address. In FY 2001, the City initiated an effort to address an anticipatedincreased student population and outdated systems.
In Fiscal Year 2001, the City commissioned Parsons Brinkerhoff Construction Services, Inc. (“PB”) anengineering firm located in Boston, Massachusetts, to undertake an extensive survey to examine thecondition of the City’s school facilities. PB was commissioned to identify facility deficiencies, identifynecessary facility additions and develop various options of courses of action for the City to consider, andprovide an estimate of costs associated with each option. PB issued the report in December 2000.
The PB report has been used as a guide to preparing a comprehensive program of renovating the City’sschool facilities. In this regard PB was re-engaged to help define a specific design/build/financeprocurement program for the City’s schools. The intent of the project is to provide renovation to allexisting schools. Renovations will include, but not be limited to, HVAC, electrical systems, floors,roofs, fire alarms, sprinklers, and both interior and exterior general maintenance. The project addressescapacity related deficiencies through additions to existing facilities. Additions are being constructed ontwo middle schools and three senior high schools.
In accordance with authority granted by an ordinance enacted on February 12, 2002, the City issued aRequest for Proposals (“RFP”) for a single contractor team to finance, design and construct additions tothree high schools and two middle schools, and other major capital improvements to all twenty-twopublic schools (the “Program”). The purpose of the ordinance was to authorize the City to conduct acomprehensive procurement to secure a single team to develop the Program on its behalf. Unliketraditional public contracting where design and construction performed by separate entities andselections is based on low bid, design-build allocates all responsibility to a single team and the selectionof that team was based on an expanded set of factors that take into account qualitative evaluations of arange of factors, including price, schedule, quality of design and construction, and financing strategies.
The City selected Gilbane Construction to undertake the $105 million Design Build Project.Furthermore, based on preliminary submissions it is anticipated that related construction will be “fasttracked” and completed within three years.
Based on preliminary estimates, it is anticipated that the cost of the Project will be evenly allocatedbetween new construction and renovation. In this regard neighboring towns voted on long term tuitionagreements at town meetings in March 2003. The City’s proposed design/build program, while directlyaddressing educational needs, also sends a strong economic development message. The City’s multi-year, multi-million dollar commitment to its schools is an important economic development investmentin the City’s future workforce. While other cities are establishing a moratorium due to the currenteconomic slowdown, the City of Manchester will, as a result of its long term financial planning, becreating jobs and significant economic activity. Given the “fast-track” nature of the project, capitalspending should provide significant continued stabilization to the Manchester economy. It is the City’sbelief that timely investments in its schools constitutes good economic policy.

City of Manchester, New Hampshire2003 Comprehensive Annual Financial Report
8
Education Funding
On December 17, 1997, the New Hampshire Supreme Court ruled that the State’s system of financingelementary and secondary public education primarily through local property taxes was unconstitutional.In its B-5 decision, the State Supreme Court noted that several financing models could be fashioned tofund public education, but that it was for the Legislature to select one that passes constitutional muster.The State Supreme Court did not remand the matter for consideration of remedies, but instead allowedthe existing funding mechanism to stay in effect through March 31, 1999, and stayed all furtherproceedings until the end of the 1999 legislative session to permit the Legislature to address the issuesraised in the case.
Chapter 17 of the Laws of 1999 became effective in April 1999 (see Chapter 17). The law included adefinition of “adequate education” for New Hampshire schools and establishes an “Education TrustFund” and a formula for providing state financial assistance to local school districts. The new lawincluded a phase-in provision for certain aspects of the Education Trust Fund.
The primary means of State funding for the Education Trust Fund is a uniform statewide property taxunder which some of the levies from more prosperous (“property rich” or “donor”) communities arecollected by the State and redistributed to less affluent (“property poor” or “recipient”) school districts.The law established a uniform tax rate of $6.60 per thousand of total equalized value (not includingutility property or local exemptions). The new state aid property tax is assessed and collected in virtuallythe same manner in which property taxes have been administered in the past with one primaryexception, donor communities are required to send amounts in excess of what is required locally for anadequate education to the State for redistribution to recipient districts. The City is a recipient district.
In addition to the property tax provisions, the State raised levies on its Business Profits Tax 1%,Business Enterprise Tax .25%, Real Estate Transfer Tax 50%, and added rental cars to the items coveredon its Meals and Rooms Tax. The State also earmarked revenue from the State’s share of the recentmulti-state tobacco settlement, as well as sweepstakes earnings and reserve funds of $62 million alreadycommitted to assist property poor communities. As a result of the enactment of Chapter 17, the Cityreceives approximately $45 million in state assistance for education.
The legislation also created two commissions: the Adequate Education Financing Commission and theTax Equity and Efficiency Commission to make further recommendations as to the funding of educationexpenditures. The legislation further provides that if the voters of the state adopt an amendment to thestate Constitution which relates to the role of the legislature in determining the nature of and means forfunding public education, the provisions of the legislation shall, with certain limited exceptions, bewithout effect as of the July 1 following such adoption and the provisions of laws affected by thelegislation shall be considered reenacted as they were on the day before the legislation became effective.The next opportunity for adoption of such an amendment is in November 2004.
The legislation in no way limits the amounts a municipality may appropriate to fund education above itsper pupil adequate education cost and in no way limits the additional amount of taxes that can be leviedto raise such additional appropriations or to pay debt issued for school purposes.
Prior to May 24, 1999 the MSD was administered as a department of the City, with departments of theCity administering certain school functions, such as Finance and Human Resources, at the direction of

City of Manchester, New Hampshire2003 Comprehensive Annual Financial Report
9
the school district. On or about December 9, 1998 the District filed a Petition for Declaratory Judgmentin the Hillsborough County Superior Court, Northern District. City of Manchester School District andSAU #37 v. City of Manchester, Hillsborough County Superior Court, Northern District. Docket number98-E-458. The Petition, among other requests for relief, sought a declaration that the District was not adepartment of the City. The court issued an order on May 24, 1999 in which it ruled that the District wasnot a department of the City. The court’s order was not appealed. In response to the court’s order theCity’s Board of Mayor and Aldermen determined that an amendment to the City Charter was desirable.A proposed amendment to the Charter was drafted that merged the District into the municipalcorporation with the District to be administered by the School Committee as a department of the City.
On or about March 29, 2001 the District filed a Petition for Declaratory Judgment, Permanent InjunctiveRelief and Damages. The City of Manchester School District and School Administrative Unit #37 v. TheCity of Manchester, Hillsborough County Superior Court, Northern District, Docket No. 01-E-149. ThePetition requested that the court issue rulings on various fiscal practices between the City and theDistrict. The petition was amended to include a new count regarding proposed amendment to the CityCharter and to request that the court rule that the District could not be made a department of the City byCharter amendment.
The proposed Charter amendment was sent to referendum and on November 6, 2001 the voters of theCity voted to adopt the charter amendment.
On April 11, 2003 the court issued an order ruling that the City could not make the District a departmentof the City by Charter amendment. The City appealed the court’s order to the New Hampshire SupremeCourt, which accepted the appeal on June 30, 2003. The appeal is presently pending before the NewHampshire Supreme Court.
In 2003, the State legislature enacted special legislation concerning the City and the District whichprovides that the City may incorporate the District as a department of the City and that the Mayor shallhave control over the form and procedures for preparation and adoption of the school departmentbudget. The special legislation took effect upon enactment. At the present time, the City does not intendto incorporate the District as a department of the City.
Neither the adoption of Chapter 17 nor the local court ruling is expected to substantially change theadministrative operation of the Manchester School District.
General Fund Budget - The FY 2004 Budget was adopted on June 9, 2003. The budget increases MSDspending by $5,427,008 (4.5%) and municipal spending by $2,993,866 (2.9%). The City's tax rateincreased by $.72 (2.8%).
Biennial Budget - Chapter 54 of the Laws of 1998 (RSA 32:25-26 Biennial Budgets) was adopted bythe New Hampshire Legislature in an effort to provide municipalities with more management flexibility.The statute allows for biennial budgets to be adopted for the periods immediately following a municipalelection, thus providing that elected officials could only adopt biennial budgets covering their two-yearterm of service. The City Charter also allows for the adoption of biennial budgets. Therefore, pursuant tothis legislation, the City initiated a trial biennial budget exercise as part of the FY 2003 and FY 2004budget cycle. This allowed the City to directly experience a biennial budget preparation process todetermine its practicality and usefulness as a strategic planning tool.

City of Manchester, New Hampshire2003 Comprehensive Annual Financial Report
10
ECONOMIC DEVELOPMENT/MANAGEMENT INITIATIVES
As the State’s largest city and business center, Manchester boasts a diversified economic base. Both theState and the City are recognized nationally for their livability (#2 Healthiest State – 2001 UnitedHealthcare Group; 2nd Safest State 2001 - Morgan Quinto; #2 in Child and Family Well-being - 2002Kids Count Data Book; #4 State of Caring Index – United Way of America; #2 Highest Standard ofLiving 2000 Expansion Magazine; #5 Start Quality of Life Rating, measuring communities best suitedfor business expansion or relocation); #4 Most attentive City for manufacturers (Business DevelopmentOutlook, 1999).
Manchester has always been a city where business prospers. Once the site of the world’s largest textilemill complex, the City today boasts an economy that is a diverse combination of manufacturing, serviceand retail firms. The history of Manchester is one of orderly growth, emphasizing the dual values ofbusiness prosperity and quality of life.
More than 200 diversified manufacturing firms call Manchester home. Nearly 70% of manufacturingjobs are in durable goods production, especially metal products, electrical products and machinery, andplastics.
Over 80% of the work force in the Manchester Metropolitan Statistical Area (“MSA”) is employed inmore than 2,000 non-manufacturing firms, and Manchester is the financial and commercial center ofnorthern New England.
The Manchester MSA has over 8,000 commercial establishments, including more than 800 retail storeswith annual sales of over $2.4 billion (2001). Continuing expansion of financial and business services,supported by significant growth in population and personal income during the past decade, hascontributed substantially to improvement of the area’s economy.
The Manchester Metropolitan Statistical Area labor force numbers 119,230 while the unemploymentrate is 4.2% (November 2003).
The City’s financial and economic position is further supported by its strong credit ratings (see BondIssues and Credit Ratings – page 28). The City began preparing for an economic slowdown in FY 1999.Through the use of conservative revenue forecasting and a dedication to disciplined spending, and aidedby unusually mild winters, the City has been able to grow and sustain positive undesignated GeneralFund balances and a $9,633,624 Revenue Stabilization Fund.
Economic Development
The City has made a major effort in recent years to diversify its economy. This planned effort has led tothe location of an array of businesses and industries in the City, and has provided a strong base for futureeconomic development activities. Much of this diversification was accomplished through redevelopmentprojects, which required a high degree of public and private cooperation.

City of Manchester, New Hampshire2003 Comprehensive Annual Financial Report
11
Master Plan
The City adopted a Master Plan in 1993 to serve as the basis for future land use decisions. The plan isintended to communicate the current needs, desires, and interests of its citizens in the form ofrecommendations that enable City officials to better provide for the future and ensure that the Cityacquires and maintains the capability to guide development. The Master Plan is based on variousneighborhood master plan workshops as well as a public opinion survey. The Planning Board receivedthe assistance of various public agencies in preparing certain portions of the plan and professionalplanning consulting firms provided expertise in drafting the various chapters.
The Master Plan provides an inventory of the natural and physical resources of the area, which in turn isintended to guide long range land use recommendations for the development of future housing, industry,and commercial uses as well as long range land use recommendations for the development of openspace, recreation, community facilities, and infrastructure. It also provides the basis for the City’s zoningordinance by establishing a blueprint for anticipated land use in terms of location, extent, and intensityof uses and provides a framework and rationale for the development of various implementing ordinancesincluding the City’s capital improvement program, site plan review, subdivision and building codes. TheCity intends to update the Master Plan by 2005.
Industrial Parks
There are three industrial parks within the City that were developed by the Manchester Housing andRedevelopment Authority under redevelopment powers granted by the New Hampshire Legislature. Asnoted below, over 7,000 people work in the industrial parks. The Brown Avenue and Grenier IndustrialParks and the Manchester Air Park are occupied by 50 manufacturing and industrial service companiesin over 1.9 million square feet of space, employing approximately 2,900 people. Occupants includenationally known companies such as Moore Business Forms, Sanmina Corporation, TruServe (TrueValue), and United Parcel Service, Inc.
Sale of the 23 lots in the Manchester Air Park began in 1992. As of September 2003, 22 of the parcelshad been sold. New construction completed or in progress totals nearly 500,000 square feet, and thesecompanies have created approximately 770 jobs.
The so-called East Industrial Park is another of Manchester’s major employment centers. Infrastructureto the area was installed in 1970, and subsequently this area has been extensively developed with privatecapital. Approximately 1.3 million feet of space has been constructed, with more than 3,000 peopleemployed. Nationally known firms located here include Hitachi Cable Manchester, Inc., AT&T,Comcast and Verizon Communications.
Overall Economic Development Program
The City received approval in August 1998 of the third annual update of its Overall Economic Develop-ment Program (“OEDP”) from the U.S. Department of Commerce Economic Development Admini-stration. The original OEDP, now known as CEDS (Comprehensive Economic Development Strategy),was approved in 1994, and an updated CEDS was prepared in 2000. Having an approved CEDS is thebasis for Manchester’s continuing eligibility for funding under programs administered by the EconomicDevelopment Administration, such as the Section 108 loan described below. The City, through theManchester Economic Development Office, is now completing its latest update of the CEDS.

City of Manchester, New Hampshire2003 Comprehensive Annual Financial Report
12
Downtown Revitalization
For the past decade Manchester has focused on its downtown as one of the main cogs of its economicengine. In the past two years, the results are starting to show.
The major rehabilitation of the City owned “Chase Building” in the center of downtown is now com-plete and has been recognized with three preservation awards. This project was made possible utilizing a$1 million grant from the U.S. Department of Commerce, Economic Development Administration, a $1million loan using Housing and Urban Development (HUD) Community Development Block Grant(CDBG) funds, a $1.55 million loan from the HUD Section 108 Loan Guarantee Program, and a$200,000 loan from the Manchester Development Corporation. The 44,000 square foot, six storystructure is a tax deeded property that was made possible by a public/private partnership with adeveloper who has guaranteed to pay off all debt in exchange for an option to purchase the building atthe end of fifteen years. In addition to the Chase Building, the Bond Building and the Dunlap Buildingshave been redeveloped in the same area and the McQuades Building is just beginning renovations.
The completed Bond Building renovation includes approximately 5,000 square feet of retail, 5,000square feet of office space and 9 units of market rate housing. This project is privately owned andfinanced through the use of $1.552 million in HUD Section 108 loans, $288,000 in CDBG funds,$150,000 from Manchester Housing and Redevelopment Authority, and a $100,000 private investmentfrom the Bank of New Hampshire. All funds were loaned to the project with various repaymentschedules.
The “Dunlap Building” was another blighted structure that has been recently renovated. This was madepossible through a loan from the City in the amount of $1.35 million and $450,000 from the ManchesterDevelopment Corporation. This privately owned building contains approximately 5,000 square feet ofretail and 20,000 square feet of class “B” office space.
Local government administration agreed to create a position that will focus just on the City’s EnterpriseCommunity to encourage development. The Destination Coordinator position has been in existence fortwo years and the fruits of this position are evident when you visit downtown.
Millyard Redevelopment
The Amoskeag Millyard, a major concentration of multi-story brick mills along the banks of theMerrimack River, was once home to the largest cotton textile manufacturer in the world. Since thedemise of this industry in New England in the 1930s, the City has taken steps to redevelop and adapt thearea for continued business use. A $20 million federally funded redevelopment project was completed in1985, and substantial private investment has also been involved this area. Approximately 90% of the3,500,000 square feet has been rehabilitated and is now used by a diversity of firms, includingmanufacturing, educational facilities, computer hardware and software, bio-tech and restaurants. One ofthese buildings is home to three museums: The Science and Engineering Hall of Fame, ScienceEnrichment Encounters, and the Manchester Millyard Museum of the Manchester Historic Association.Another building houses the campus of the University of New Hampshire/Manchester. Nationallyknown firms located in the Millyard include Kana Communications, Texas Instruments, AutoDesk, andMicrosoft Great Plains.
Plans for the final vacant mill building – Pandora – including the establishment of an upscale hotel, arebeing considered by its owner.

City of Manchester, New Hampshire2003 Comprehensive Annual Financial Report
13
Riverfront Development
Manchester continues to recognize the tremendous potential of the Merrimack River adjacent to itshistoric Amoskeag Millyard. A strategy to redevelop its riverfront is reaping great benefits for the City.Key to this strategy is the public investment in development of the Stadium, the pedestrian river walksystem (the “Riverwalk”) and parking.
The Riverfront Project will include the construction of the new Stadium, retail space, a hotel, luxurytownhouses and two condominium residential towers. The Stadium will seat over 6,500 spectators andwill become the home of a AA baseball team in 2005. The Stadium is expected to cost $24,400,000 andwill be financed, in part, with Municipal Bonds. The tax revenues from the site and payments to the Cityfrom the baseball team are expected to exceed the City’s debt service on the project. With the AAbaseball team expected to come to the City in 2004, the City and the developer will be renovatinghistoric Gill Stadium so that the team can play its 2004 season in the City. The $4,100,000 renovationwill allow the City to have an improved baseball and football venue for high school and amateur sportsonce the AA team moves to its new home at the Stadium.
The core of the pedestrian Riverwalk will extend approximately two miles from the Amoskeag Damsoutherly along the Amoskeag Mills and then along Singer Park to Hesser College. This will also be thecentral section of the Heritage Trail — a trail system that is eventually expected to run fromMassachusetts to the Canadian border. In addition to this north-south trail, a pedestrian bridge willconnect to the West Side of the City and the Piscataquog Trail, which will extend to the PiscataquogRiver Park and to Bedford. To the east, a connection will be made to the abandoned PortsmouthRailroad line, which has been developed into a trail system to the Atlantic coast. When these trailsystems are linked the Riverwalk will be the only central hub of a trail system that will span the Statefrom the north to the south and nearly span the width of the State from east to west. While the Riverwalkwill provide the obvious recreational attractions of bringing bicyclists, walkers, joggers, and roller-bladers to the Merrimack River, it will also provide a number of economic development opportunities inthe Millyard. A master plan was completed for the area in the 2003 summer under the guidance of aRiverwalk Advisory Group. The group is a combination of public officials and non-profit organizationswith the common vision of bringing the City back to the Merrimack River. Phase I of the Riverwalk inthe vicinity of Singer Park is now complete. It is expected that the overall Riverwalk will take five yearsand $8.5 million to complete. Funding is anticipated to be provided, in part, through the City’s issuanceof the Bonds and through federal grants, and private donations. A private non-profit group has beenorganized – “Hands Across the Merrimack” — to raise approximately $1 million in funds to reconstructthe trestle bridge spanning the Merrimack River to be used for pedestrians and bicyclists.
FIRST
During fiscal year 1995, the City acquired a 160,000 sq. ft. brick and timber mill building to serve as thehome of the Foundation for the Inspiration and Recognition of Science and Technology (“FIRST”).FIRST is a tax-exempt nonprofit entity. The building is the site of museums to display technological,scientific and industrial exhibits of historic and current interest, including a Science and EngineeringHall of Fame and the New Hampshire Industrial Heritage Museum. The project is expected to becompleted in phases over a ten-year period. Construction of the first 13,000 square foot phase has beencompleted and was opened in July of 1998. A National Science Foundation grant of $300,000 wasawarded for this phase of the project. FIRST is operated by Dean Kamen, the inventor of the Segway, a

City of Manchester, New Hampshire2003 Comprehensive Annual Financial Report
14
two-wheeled, self-balancing human transporter, which was developed in one of Mr. Kamen’s renovatedmill buildings located in Manchester’s Millyard.
Verizon Wireless Arena
This $67 million project was approved by the Board of Mayor and Aldermen in early 2000, andconstruction began in earnest in May of the same year. Financing was comprised of 80% public fundsand 20% private funds loaned by a consortium of local banks against a pledge of contractually obligatedincome generated at the building. The Verizon Wireless Arena is a 10,000-seat public assembly facilityto accommodate sporting events, family shows, concerts, and civic events. It was designed by anarchitectural team consisting of a local firm, Lavallee Brensinger Professional Association and anational firm, HOK Sport. The anchor tenant in the building is an American Hockey League franchise,the Manchester Monarchs, an affiliate of the Los Angeles Kings of the National Hockey League. TheManchester Monarchs led the league in attendance in only their second season with nearly 9,000spectators per game.
The building is professionally managed by SMG under contract to the City and the opening event washeld on November 15, 2001. The project is viewed as a major component in the City’s efforts tostimulate the revitalization of its downtown area. The Arena has been extremely successful and to datehas been in the top three venues nationally in attendance for an arena its size.
Retail
A major retailing area has developed along South Willow Street adjacent to Interstate 293 andManchester Airport. The anchor development of this retail area is the million square foot Mall of NewHampshire, which underwent a $35 million expansion that was completed in 1998. Occupants of themall include Sears Roebuck, J.C. Penny, and Filenes as well as more than 100 other retailers of varyingsize and category. Although developable land in the area is in short supply, limited developmentcontinues to occur. In the past year Wal-Mart renovated and assumed occupancy of a Home Quartersfacility and a Barnes & Noble Bookstore relocated and expanded its facility. A developer has an optionon approximately 10 acres of land for a retail development anchored by a Shaw’s Supermarket, which isnow under construction. The City approved a rezoning of a portion of the proposed site in order to allowthe development to proceed. A new hotel has just opened in the area and a new Super Stop and Shopgrocery store also opened in August, 2003.
Hackett Hill/UNH-Manchester
Following one and one half years of negotiations, the City and the University of New Hampshire-Manchester (“UNH-M”) concluded a major real estate transaction in March of 1999. The City acquired822 acres of land formerly owned by UNH-M for the development of a corporate business park, andUNH-M acquired a 72,000 square foot renovated mill building in the Amoskeag Millyard to consolidateoperations into a single building. This unique project also assisted the City in compliance with the USEPA mandated Combined Sewer Overflow program by providing for the preservation of 376 acres ofthe former UNH-M land as a wetlands preserve area. Of that acreage, approximately 342environmentally rich acres have since been transferred to the Nature Conservancy. Also related to theCSO program, the City is negotiating to acquire other contiguous land outside of the UNH parcel to beincluded within the preserve.

City of Manchester, New Hampshire2003 Comprehensive Annual Financial Report
15
Approximately 400 acres of the site will be developed into a higher end corporate business park. TheManchester Housing and Redevelopment Authority has received two offers on the first parcel in theproject – French Hall. As sites are sold, the City will utilize the proceeds to further develop theroadways and infrastructure of the park. The State Department of Transportation has committed to builda new highway interchange with I-293 when the park development reaches the southerly end of the site.
Transportation
Manchester Airport
The City owns and, through the Department of Aviation, operates Manchester Airport. The Airport islocated in both the City of Manchester and the Town of Londonderry, New Hampshire, approximatelysix miles south of the downtown area of the City in both Hillsborough and Rockingham counties. The1,200-acre Airport is the major air carrier airport in the State of New Hampshire. During Fiscal Year2003, there were an estimated 1,712,703 enplanements at the Airport, representing a 4.2% increase ascompared to Fiscal Year 2002. The Airport was one of the few airports in the country to sustain itspositive passenger growth after September 11, 2001. Between Fiscal Year 1997 and Fiscal Year 2002,the Airport experienced over 200% growth in the number of passengers enplaned annually due to thegrowth in service offered at the Airport by low cost carriers. For the first eight months of calendar year2003, the Airport is maintaining a 4.9% enplanement growth rate as compared with the same eightmonth period in calendar year 2002.
Strategically located in the heart of northern New England, Manchester Airport offers air travelers easyaccess, competitive airfares, ample parking near the terminal and a growing schedule of non-stop anddirect jet service. Manchester Airport is the largest commercial passenger, cargo, and general aviationairport in all of northern New England. The airport is also a designated Foreign Trade Zone.
In 1992, the City financed certain capital improvements to the Airport, including construction of a newterminal building, aircraft aprons and taxiways, and road and parking facilities through an initial State-guaranteed bond issuance in the aggregate amount of $42,730,000 (the Series 1992 Bonds). In October1997, the Federal Aviation Administration (the “FAA”) accepted the City’s Master Plan Update (the“Master Plan Update”) to address the then-current aviation needs at the Airport and the projections forfuture growth in aviation demand. In 1998, the City issued its General Airport Revenue Bonds, Series1998 in the aggregate amount of $124,275,000 to fund the initial phases of the Master Plan Update bycommencing various runway and roadway improvements and constructing an airport terminal expansionand a new parking garage. In 2000, the City issued its General Airport Revenue Bonds, Series 2000 inthe aggregate amount of $55,990,000 in order to finance additional costs related to the 1998 Project andto further implement certain elements of the Master Plan Update. In 2001, the City issued its GeneralAirport Revenue Bonds, Series 2001 which refunded the Series 1992 Bonds. In 2002, the City issued itsGeneral Airport Revenue Bonds, Series 2002 to finance a second terminal expansion, which will convertthe existing five commuter gates into four mainline jet-bridge-served gates and to rehabilitate and extendRunway 17/35.
The Runway 17/35 project was essentially complete in August 2003. Runway 17/35 will have anupgraded Category III ILS, which will allow safe landings during the worst visibility and weatherconditions.

City of Manchester, New Hampshire2003 Comprehensive Annual Financial Report
16
Future capital projects envision additional parking-lot expansions, including another garage structure, aswell as another terminal expansion, all of which will be demand driven by increasing activity and theconcomitant requirement for expanded facilities.
Airlines currently serving the Airport as of June 2003 include Air Canada, Boston-Maine Airways,Comair (Delta Connection), Commutair (Continental Connection), Continental Airlines, ContinentalExpress, Delta Airlines, Northwest Airlines, Southwest Airlines, United Airlines, and US Airways andUS Airways Express. These airlines provide non-stop service to Albany, Atlanta, Baltimore-Washington, Bangor, Chicago (O’Hare and Midway), Cincinnati, Cleveland, Detroit, Kansas City,Nantucket, Nashville, New York (LaGuardia and Newark), Minneapolis, Montreal, Orlando,Philadelphia, Pittsburgh, Portsmouth, Tampa, Toronto, Washington National, and Washington-Dulles.Through plane service is also available to 32 additional markets.
As a result of the terrorist attacks of September 11, 2001, the North American air transportation systemwas disrupted, leading to a temporary suspension of air travel in the United States. Air travel wasreinstated at reduced levels throughout the United States. Many airports and airlines suffered much-reduced activity and revenue margins. Contrary to industry trends, Manchester Airport, in the post-9/11environment, has actually had airlines add service and destinations. This increased activity wassignificant enough that after September 11th the Airport was the first airport in the country to have itsbond ratings upgraded. The Airport continued to experience enplanement growth in fiscal years 2002and 2003. Southwest Airlines, the Airport’s dominant carrier initiated non-stop Las Vegas service inSeptember, 2003. This is a direct result of the lengthening of its main runway, and the Airport isanticipating future non-stop west coast service.
In response to the Airport’s and the City’s growth, three major lodging facilities have been or arecurrently being built in the Airport’s immediate vicinity, e.g., Marriott’s Spring Hill Suites and Hilton’sHomewood Suites, which are on the Airport property and the new Tage Inn on the Airport’s main accessroad.
Manchester Airport recently commissioned its third Economic Impact Statement assessment in the lastdecade. The most recent report, prepared by Leigh Fisher Associates, estimates that the fiscal year 2002estimated economic impact from the Airport on the State of New Hampshire was $715.6 million, ofwhich $671.9 million occurred in the Manchester area. Additionally, the 2015 economic impact on theManchester area is projected to be nearly $1.5 billion.
The Airport has outstanding $276,435,000 of General Airport Revenue Bonds. Those bonds are limitedobligations payable from net revenues of the Airport. None of the Airport revenue bonds constitute orgive rise to any charge against the taxing power of the City.

City of Manchester, New Hampshire2003 Comprehensive Annual Financial Report
17
Seaport
The Port of New Hampshire in Portsmouth, 45 minutes east of Manchester via NH Route 101, is a year-round deep-water port. It is the site of the state-operated marine terminal, which can handle vessels up to700 feet in length. A major port facilities expansion has recently been completed. The Portsmouthterminal is a federally designated Foreign Trade Zone as is the former Grenier Air Force Base at theManchester Airport.
Highways
Manchester is the focal point of New Hampshire’s transportation system and is served by a network ofhighways, including the F.E. Everett Turnpike, U.S. Route 3, and Interstate Routes 93 and 293.Interstate Routes 95 and 495, which intersect Routes 3 and 93 in Massachusetts, are the circumferentialhighways, which serve the high technology industries of eastern Massachusetts and southern NewHampshire. The downtown area is accessed by way of Interstate 293. Exit ramps to the area, via GraniteStreet, were completed in 1984 (the northbound ramp) and in 1986 (the southbound ramp). The City isalso at the junction of many of New Hampshire’s intrastate highways, including Routes 28, 101 and 114,which lead to all major cities in the State. These highways allow for overnight trucking delivery to allmajor cities in the Northeast.
The City is responsible for the maintenance of nearly 400 miles of streets. The City has completelyreconstructed 14 miles of streets, mostly with its own forces, at a cost of approximately $13 million overthe past 10 years. The City also maintains an annual resurfacing program under which 10 to 20 miles ofstreets are resurfaced yearly at a cost ranging from $500,000 to $1,000,000.
The State of New Hampshire has more than 4,100 miles of state and federal highways. The StateLegislature enacts a ten-year highway plan administered by the New Hampshire Department ofTransportation (“NHDOT”) to serve as a guideline for highway development in the State. Two majorcomponents of the plan provide enhanced access to both the Downtown and Manchester Airport. Majorprojects include: completion of the I-293 interchange with Granite Street along with the widening ofGranite Street, the highway access road to the Manchester Airport, road improvements in the vicinity ofthe airport, and the Candia Road reconstruction. The NHDOT project consists of a new interchange atthe intersection of Route 293 and Granite Street providing complete northbound and southboundmovements. This project is expected to enhance the access to Manchester via Granite Street and willbecome the primary highway access point to downtown. In particular it will also provide improvedaccess to the Verizon Wireless Arena and the recently approved Stadium and riverfront development.This interchange project is scheduled to be completed by the State early in 2006, at a cost of over $30million. The City is planning its own project to widen Granite Street in conjunction with the State’sinterchange project. The widening of Granite Street by the City is expected to cost about $20 million andwill also be completed early in 2006. The Federal government has already committed $8 million towardsthe City’s Granite Street project and the City anticipates receiving an additional $7 million from theFederal government, but this amount has not yet been appropriated by Congress. In addition to theadditional traffic capacity that the Granite Street improvements will provide, it is being designed to be apremier “Gateway” into the City with landscaping, bike lanes and sidewalk improvements.
Highway access to the Manchester Airport remains a high priority for the City and the State. TheNHDOT project consists of a new access road connecting Route 3 and the Everett Turnpike directly to

City of Manchester, New Hampshire2003 Comprehensive Annual Financial Report
18
the Manchester Airport. The connector will provide quicker access to the Airport and relieve trafficstress placed on the local roads surrounding the facility. The project is under design and is in the finalstages of Federal environmental review. Construction is expected to be completed by the end of 2006 ata cost of approximately $85 million.
The reconstruction of Candia Road between Interstate Route 93 and N.H. By-Pass 28, partially fundedwith Federal money, is expected to begin in this calendar year. The City has committed its matchingshare of this $7,000,000 project.
The City maintains three bridges over the Merrimack River connecting the City’s east and west sides.Construction was completed on the Notre Dame Bridge in 1991. The City doubled the traffic capacity ofthe bridge by converting it from one span and two-lanes to two spans and four-lanes. The City com-pleted the reconstruction of the Queen City Bridge in 1994. The reconstruction allowed for the wideningof the F.E. Everett Turnpike underpass. Reconstruction of the third bridge, the Amoskeag bridge wascompleted in the Fall of 1999. The City has expended over $43 million over the past 10 years on theconstruction and rehabilitation of its major bridges, these being the Notre Dame Bridge, the Queen CityBridge, the Amoskeag Bridge, and the Nazaire E. Biron Bridge over the Piscataquog River. The Cityalso maintains an ongoing inspection, maintenance, and rehabilitation program for all of its 30 bridges.
The City is looking towards the eventual return of passenger rail service to Manchester. Plans arecurrently underway to extend service to Nashua, New Hampshire. When this is completed, service maythen be continued northerly to Manchester. City officials are reviewing appropriate locations for apassenger terminal and the State has committed $10,000,000 towards the development of a parkinggarage in conjunction with a multimodal center.
The City has just recently expended $2 million in CDBG funds on the rehabilitation of Elm Street in thedowntown area. This effort was mainly directed at traffic calming measures in order to make thedowntown more pedestrian friendly and to enhance the downtown retail environment. The City currentlyhas plans to perform similar work on the side streets connecting to Elm Street and to establish apedestrian connection between the Millyard area and Elm Street.
Freight and Public Transportation
Manchester is served by the Boston & Maine Railroad (Gilford Transportation Industries, Inc.), andfreight service is maintained to Boston and connecting lines. Motor freight service to all points isavailable from a number of nationally known carriers. Daily express service is maintained to all majorcities within a 200-mile radius and to New York City. United Parcel Service, Airborne Express, andFedEx provide daily small package air freight service from Manchester Airport. The Manchester TransitAuthority provides local scheduled bus service, while regular service to other points, both interstate andintrastate, is provided by Vermont Transit Lines and Concord Trailways. Limousine service fromManchester to Logan International Airport in Boston is offered by several local companies.

City of Manchester, New Hampshire2003 Comprehensive Annual Financial Report
19
Utilities
Gas, electric, and telephone services are provided by private utilities. Water and sewer services areprovided by the City, as described below.
Deregulation of the electric utility industry in New Hampshire, and associated enactments by the StateLegislature, prompted the City in 1997 to institute the Manchester Area Aggregation Program(“MAAP”) to assist local residents and businesses. MAAP is designed to take advantage of the City’slarge buying power by grouping retail electric and natural gas customers to broker or contract for energysupply and services for such customers. The City, as “Aggregator”, is a municipality engaging in theaggregation of customers within its boundaries. Manchester, through its Department of Finance,administers MAAP on behalf of participating municipalities.
A move toward full customer choice in the electric utility industry is expected to place the City in abetter competitive position through its Aggregation Program with greater loads and a larger pool ofcompetitors. The manner in which energy services have traditionally been provided has changed as aresult of deregulation; however, the implementation of electric transition service rates essentially placesa “cap” on the prices MAAP can pay to an alternative supplier. MAAP is taking a comprehensiveapproach to understanding the energy needs of Participants and devising comprehensive energystrategies to reduce overall energy costs. The second largest city in the State, Nashua, has also adoptedan Aggregation Plan and has entered into an intermunicipal agreement with MAAP to administer theprogram. MAAP administration includes procuring energy supply and services, negotiating andadministering contracts entered into by MAAP, and coordinating customer participation in MAAP.
While full competition in the electric industry in New Hampshire has been slowed, MAAP hasproceeded with the aggregation of energy efficiency measures (“EEM”) and natural gas. The EEMcontracts provide MAAP with access to energy audits and energy efficient fixtures and equipment.Manchester’s implementation of completed energy efficient projects has resulted in reduced energycosts of approximately $360,000 annually.
The natural gas contract provides municipal and industrial MAAP participants — retail access is not yetavailable to small commercial or residential accounts in New Hampshire — with savings over currenttariff rates. Manchester has included gas services as a component of the MAAP for the past four years.Only those customers eligible to take transportation service under KeySpan’s existing tariffs wereeligible. However, a viable market for full retail customer choice of gas suppliers has not developed.
Wastewater Treatment Plant
The City owns and, through EPD operates a regional sewerage treatment plant which provides sewagetreatment through inter-municipal agreements for the towns of Bedford, Londonderry, and Goffstown.Under the requirements of the National Pollution Discharge Elimination System Permit issued to theCity by the US Environmental Protection Agency (“EPA”), it is required to treat wastewater before it isdischarged to receiving waters and meet water quality standards that are outlined in the permit.
The City’s wastewater treatment facilities include a wastewater treatment plant, interceptors includingsanitary sewers and related pumping stations and appurtenances thereto. The current capacity of theplant is 34 MGD (million gallons per day), with an average current volume of 22 MGD. A recent

City of Manchester, New Hampshire2003 Comprehensive Annual Financial Report
20
upgrade provides capacity for the system through the year 2008 as required by the EPA. This project isbeing financed in part by the State Revolving Loan Fund ("SRF").
The City’s sewer department is operated on a self-supporting enterprise basis. The user charge systemwas established for paying the cost of construction, payment of debt, operation and maintenance, andreplacement of the facilities. The charges consists of a service charge (fixed and usage charges based onwater consumed (variable) as well as strength of wastewater for industrial users). The rates are enactedby ordinance as recommended by the staff of the Environmental Protection Division to insure that thefund is self-supporting. The current sewer rate, which became effective January 1, 1997, is $1.55 per100 cubic fee. It is anticipated that a rate increase will be necessary in fiscal year 2004 in order to ensurethe City’s sewer department remains self-supporting.
In addition to the user charges, other major sources of revenue include State Aid Grants on the originalplant construction as well as the interceptor and the West Side Pump Station, town contributions on thecapital expenditures as well as the operations and maintenance costs, investment income on investedsurplus balances and cost and interest fees collected on delinquent payments.
The EPD completed the Long-Term Control Plan for Combined Sewer Overflows in 1998 and enteredinto negotiations with EPA. The project is estimated to cost $85 to $140 million. The City has signed aconsent order with EPA and NHDES to address the first phase of the CSO Remediation over an 11-yearperiod at an estimated cost of $59 million.
EPD has initiated the CSO projects as required by the City's Consent Order. To date, the CSO Bypass atthe WWTF and the Theophile Street Basin Separation Projects, Electric and Sullivan Streets and theVarney Street Basin Separation projects have been completed at a cost of $12.2 million. Contracts fordesign of and N. Main Street Separation and Cemetery Brook Basin Study have been awarded at a costof $1.7 million.
To date, all eligible CSO work has been awarded SRF loans and 20% State grants. At the conclusion ofPhase I, the City and EPA will reassess CSO activity and evaluate the need for Phase II. To date, $4million has been authorized in fiscal year 1999, $6 million for fiscal year 2000, and $17.7 million forfiscal year 2001.
Manchester Water Works
The City owns and, through the Manchester Water Works (MWW), operates a regional water treatmentplant and distribution system. The management of the MWW is vested in the Water Commission inaccordance with the Charter. The Water Commission consists of seven members, of which six areappointed by the Board of Mayor and Aldermen.
The City’s water department is operated on a self-supporting enterprise basis. Lake Massabesic supplieswater to the City. The City’s potable water treatment facility was built approximately 35 years ago andhas a 40 million gallons per-day capacity. Current peak utilization is 30 million gallons per day. TheCity has an ongoing expansion program, which entails the addition of 40,000 — 60,000 feet of newwater mains annually. The distribution system is maintained and upgraded annually and is in excellentcondition.

City of Manchester, New Hampshire2003 Comprehensive Annual Financial Report
21
The MWW is the primary water utility in the south-central region of New Hampshire. Its retaildistribution area includes the City and portions of five surrounding municipalities consisting of theTowns of Hooksett, Londonderry, Bedford, Auburn and Goffstown, an area of approximately 55.5square miles with a population of approximately 115,000. The MWW also supplies water service to fourwholesale customers who in turn distribute that water to an area of approximately 25 square milescontaining a population of approximately 25,000. The MWW serves approximately 28,000 customers ona wholesale and retail basis across various customer classes.
In August of 2003, the City issued $38,345,000 of revenue bonds on behalf of the MWW (“MWWbonds”) in order to finance certain capital improvements and upgrades to the City’s water treatmentplant and water distribution system. The MWW bonds were issued pursuant to a General Water RevenueBond Resolution (the “Resolution”) adopted by the City prior to the issuance of the MWW bonds.Under the Resolution, the MWW bonds are payable solely from revenues of the City derived from theownership and operation of its water treatment plant and water distribution system, subject to the priorpayment of operation and maintenance expenses.
The MWW, through its Board of Water Commissioners (the “Board” or the “Board of WaterCommissioners”), is responsible for setting and imposing the water rates and charges for City residentsand for other retail and wholesale customers in the MWW’s service area. The Resolution requires theMWW to maintain rates at levels sufficient to pay operating expenses of the System, to pay debt serviceon bonds and provide for reserves. The Board has voted to implement an overall 14% rate increaseeffective on July 1, 2003 and also has approved a multi-year increase in rates to be implemented in fiscalyears 2004, 2005 and 2006, respectively. Prior to the 2003 rate increase, the MWW had not increasedrates and charges since 1990. Historically, the MWW has collected approximately 45% of all water billswithin 30 days of billing, approximately 85-90% within 60 days of billing and close to 100% within 90days of billing.
Recreation
The Parks, Recreation & Cemetery Department operates under the guidelines of two individual fundingmechanisms. The Enterprise Budget involves revenue-producing facilities that are supported by userfees. The facilities include an 18-hole golf course, two ice arenas, one with a seating capacity of 2,600for ice hockey, a ski area, with a 169-foot vertical drop, and a semi-professional baseball park. Propertytax-funded organizations include nine cemeteries, the largest being the 275-acre Pine Grove Cemetery,and Parks Division. The Parks Division responsibilities include management of all City owned passiveparks, playgrounds, athletic fields, tennis courts, traffic islands, four aquatic facilities, one public beachand snow removal at twenty-three school buildings.
Revenues supporting recreation operations include rental and user charges at all of the facilities with theexception of the municipal swimming pools.

City of Manchester, New Hampshire2003 Comprehensive Annual Financial Report
22
Housing
The City is involved in a major effort to rehabilitate its center city. This effort is being undertaken inconjunction with the Neighborhood Reinvestment Corporation, a federally chartered and fundednonprofit organization that operates nationwide to assist communities in rehabilitating neighborhoods.This collaboration has resulted in the formation of Manchester Neighborhood Housing Services(“MNHS”), a local nonprofit organization consisting of neighborhood residents, members of thecorporate community, and government officials.
MNHS has embarked on a three-phase program to combat neighborhood deterioration. The first phaseconsists of a revolving loan fund to assist owner occupants in making repairs to their buildings andapproximately $1 million in private funds have been raised to assist in these efforts. Second is thepromotion of home ownership by encouraging the purchase, repair, and owner occupancy of singlefamily and smaller multi-unit buildings. The third phase is a rehabilitation program to bring larger multi-family buildings up to contemporary standards for occupancy by rental tenants. A foreclosure preventioncomponent, using City Community Development Block Grant (“CDBG”) funds, is also part of theMNHS effort. MNHS has completed a major affordable housing renovation project on Elm Street and isnow working on two properties on Temple Court.
The Manchester Housing and Redevelopment Authority has recently become more active in providingnew affordable housing projects and is planning three sites – the Brown School, Gale Home and a cityparcel at 628 Hanover Street.
Families in Transition has recently completed an expansion of their transitional housing project onMarket Street. This project is located in and was developed consistent with the historic CorporationHousing Historic District.
Bridge and Elm Street
In 1999 a developer exercised his option not to develop this site for a major office building and theParking Garage. Since that time, this last large parcel of land in downtown has been the subject ofnumerous discussions. Most recently, the City has completed agreements to develop a major housingproject on this site.
Sylvestri, Inc. will be developing 200 market rate dwelling units in a high rise building with the Citydeveloping the Parking Garage on the site. The project has now received all City development approvalsand the Parking Garage is being financed with approximately $5,000,000 of the proceeds of the Series2003C Bonds.
Health And Sanitation
Health
The City Health Department, the area medical community, and community agencies all work together tomaintain the City’s excellent health status. The Health Department coordinates the Healthy ManchesterCoordinating Council, which is comprised of key community agency, government, health care,education, and business leaders. This body examines public health issues in the community and developscollaborative strategies to improve the health of the public. Over the last five years, this group led the

City of Manchester, New Hampshire2003 Comprehensive Annual Financial Report
23
City to a 30 % reduction in adolescent births, community water fluoridation, and improved access todental and health care for Manchester residents. The community’s health care providers work closelywith the Health Department to insure that emerging public health issues are monitored and addressedthrough prevention and a quick response. The City was the recipient of a significant Federal grant forpublic health preparedness that enables it to coordinate community work on issues such as bioterrorism,smallpox vaccination and outbreak response, and SARS. The Health Department relocated in 2002 to abuilding purchased by the City to consolidate health services. The building is a more modern and largerfacility that is equipped to handle potentially infectious clients and to convene health care providers. Thefacility will soon be equipped with backup generator power so that the Health Department can fullyoperate in the event of an emergency, and in fact, provide a fully equipped secondary EmergencyOperation Center for the City.
The Health Department provides full time school nursing staff to each of Manchester’s public schoolsthrough a long standing relationship with MSD. This enables the Health Department to quickly respondto student health concerns and to link school health services with health services available in thecommunity. From a variety of funding sources, the Health Department currently employs or contractswith approximately 70 health professionals. Collectively, the public health team provides 24/7 publichealth emergency response for the City.
There are two primary hospitals in the City. The 255 bed Catholic Medical Center providescomprehensive diagnostic, therapeutic and preventive health services, including cardiac care, CRTscanning, nuclear medicine, corporate fitness and emergency medical services educational programs.The Elliot Hospital has 296 beds and is staffed by 220 physicians, 85% of who are Board Certified in 29medical specialties. The Elliot has the state’s largest center for therapeutic radiation and is the region’sdesignated Trauma Center. Specialty services include walk-in emergency care, a comprehensiverehabilitation medicine unit, Medicare certified home health services, and a free physician referralservice. The Laser Center located at the Elliot offers advanced laser surgery as well as regional trainingfor physicians. Women’s health services include a Breast Diagnostic Center and the City’s onlyadvanced care neonatal unit for critically ill newborns. A Veteran’s Administration Hospital is alsolocated in Manchester. The Hitchcock Clinic, founded in 1927 and a component of the DartmouthHitchcock Medical Center, operates a medical care facility in Manchester. The Hitchcock Clinic and theLahey Clinic in Massachusetts merged into a regional group practice with 830 physicians, which will bethe third largest multi-specialty group practice in the United States.
Visiting Nurse Association of Manchester provides home health services to area residents. There areover 200 practicing physicians and surgeons with offices in the City, giving a favorable one doctor per500 population ratio.
The Manchester Community Health Center, a federally qualified health center, provides primary healthcare services to low income persons.
The Mental Health Center of Greater Manchester provides in patient care for acute cases, day hospitalprograms for out patient diagnostic and treatment services for children, adolescents, adults, the elderlyand alcoholics, emergency services (24 hours a day), consultation, and community education.

City of Manchester, New Hampshire2003 Comprehensive Annual Financial Report
24
Sanitation
The City provides curbside collection of garbage, rubbish, bulky items, appliances, yard waste, andrecyclables. The garbage, rubbish, and bulky waste collection is provided by the Highway Departmentand the transfer to a lined landfill of this material is provided by Waste Management, Inc. Yard wasteand recyclable collections also are provided by Waste Management, Inc. under a long-term, multi-yearcontract to the City. Appliance collection is also provided by the City’s Highway Department through aseparate vendor.
The City stopped receiving waste at its landfill in July 1996 and has commenced a landfill closureprocess. Engineering studies have estimated the total cost of closure to be $12,350,000. The first phaseof closure has been completed at a cost of $6,300,000. The second and final phase of the landfill closurestarted in October of 2001 and it is expected to be substantially complete in October, 2003. Post closurecosts have been estimated at $230,000 per year of 30 years. To fund closure costs, the City executed anagreement with the State for a State Revolving Fund loan to a maximum principal amount of$13,850,000. As the project progresses, periodic reimbursement requests are forwarded to the State forreimbursement from the fund. Upon completion of the project, the aggregate principal amount plusaccrued interest will be payable in annual installments for up to twenty years. The City has the right toprepay principal at any time without a penalty. Interest accrues at 1% per annum during the constructionperiod. Post closure costs are subject to appropriation on an annual basis.
In addition to the State Revolving Fund Loan, the State has established a landfill grant program toreimburse municipalities up to 20% of eligible administrative closure costs. The City has been acceptedto participate in this grant program.
SOURCES OF CITY REVENUES
Property Taxes
The principal revenue source of the City is the tax on real and personal property. There is no limit as torate or amount. A single tax is levied for state, county, municipal, and school purposes. For NewHampshire municipalities the “assessment year” for taxing purposes runs from April 1 to March 31 ofthe following year. Taxes are due in Manchester in two installments, on July 1 and December 1 (subjectto deferral if tax bills are sent out late). Interest accrues on delinquent taxes at a rate of 12 percent perannum from the due date to the date of payment. Real property (land and buildings) is subject to a lienfor the taxes assessed upon it (subject to any paramount federal lien and subject to bankruptcy andinsolvency laws). The City places a lien on delinquent property prior to May 1 of the following year.From the date of the tax lien, a two-year period of redemption is allowed the owner, during which timepayment of taxes, interest, and costs will be accepted and the lien released. During the redemptionperiod, 18 percent interest per annum is charged. Beyond the two year period of redemption, propertiesare deeded to the City (unless either the lien has been sold by the City, or the City has notified thecollector that it will not accept the deed because acceptance could result in liability under environmentalstatutes imposing strict liability on owners). Except for any paramount federal lien and subject tobankruptcy and insolvency laws, tax liens take precedence over all other liens, and tax collector’s deedsare free and clear of all encumbrances.

City of Manchester, New Hampshire2003 Comprehensive Annual Financial Report
25
The amount to be levied in each year is the amount appropriated or required by law to be raised formunicipal expenditures less estimated receipts from other sources and less appropriations voted fromavailable funds.
In 2000, the City began the process of a City-wide revaluation. The revaluation is as of April 1, 2001and was used to assess property taxes beginning with fiscal year 2002. As part of the Supreme Courtdecision regarding school funding, cities and towns in New Hampshire are required to undertakerevaluations every five years. For more detailed information about the Supreme Court decision andeducation funding in New Hampshire, see “Appendix B – City of Manchester Selected FinancialInformation – Education Funding.” The City’s next revaluation will be effective for April 1, 2004. Thetables IV and VI in the statistics section set forth the trend in the City’s assessed valuations, the stateequalized valuations and the tax rate per $1,000 assessed valuation as of April 1, for each of the last tenfiscal years.
The annual tax rate and tax levy are established by the State of New Hampshire Department of RevenueAdministration (DRA) in October or November of the fiscal year, based on adopted appropriations ofthe City and Hillsborough County and anticipated non-property tax revenues. Tax rates and levies areestablished separately for the county, municipal, and local and state school portions. The DRA recentlyapproved a 2.8% increase in the overall property tax rate imposed on City taxpayers, from $25.68 per$1,000 of assessed valuation for fiscal year 2003 to $26.40 per $1,000 of assessed valuation for fiscalyear 2004.
The tax levy calculations set forth in the following table for fiscal years 1999 through 2003 arepresented in the same manner as supplied to DRA for tax rate setting purposes. A requirement of DRAis that all costs included under departmental appropriations on behalf of the MSD be reflected as part ofthe school costs and reduced from the original appropriation category. Therefore, the categoricalamounts in the tax levy calculation cannot easily be equated to those shown below under “Fiscal Year2004 Budget.”

City of Manchester, New Hampshire2003 Comprehensive Annual Financial Report
26
Calculation of Property Tax Levy
1999 2000 2001 2002 2003
Departmental Requirements:General Government $10,825,635 $15,138,988 $22,412,332 $22,795,572 $21,089,086Public Safety 28,028,631 29,385,878 32,896,813 35,675,949 36,920,465Highways & Safety 16,024,361 16,491,509 18,125,291 15,326,474 18,111,301Sanitation 1,390,160 1,693,622 1,785,333 6,440,962 2,966,376Health 1,348,004 2,305,824 2,503,716 2,733,226 2,805,523Welfare 1,190,924 1,299,024 1,269,737 1,461,074 1,476,875Culture &Recreation 4,230,524 5,326,011 4,629,710 4,834,839 4,671,441Economic Development 220,527 232,650 2,220,785 2,595,161 2,890,339Education 90,226,231 102,722,154 106,832,425 115,808,857 121,148,267
Debt Service RequirementsPrincipal on Long-Term Loans 8,493,847 9,175,353 10,287,693 10,034,398 10,890,802Interest on Long-Term Loans 3,645,218 4,157,805 3,585,996 3,298,349 5,181,213
Non-Departmental Requirements:Transit Subsidy 900,000 674,000 663,330 725,000 725,000Motorized Equipment 450,000 419,550 399,900 382,500 50,000County Tax 7,349,481 7,494,747 8,045,138 8,736,858 8,465,440Veterans Exemptions 606,000 623,155 590,700 573,400 575,200Overlay Reserve for Abatements 547,513 593,100 (2,307) 1,081,931 1,023,700
Total Estimated Requirements 175,477,056 197,733,370 216,246,592 232,504,550 238,991,028Estimated Revenues:
Taxes, Penalties & Interest 1,710,006 1,716,703 1,587,210 1,152,162 1,140,787Auto Registration 11,339,850 11,246,450 12,682,000 14,913,000 15,569,000Licenses & Permits 3,819,360 3,290,916 3,888,400 3,806,100 4,422,038State and Federal Revenues 18,019,770 7,660,814 8,160,596 8,533,036 8,862,815Charges for Services 14,112,626 2,834,305 11,138,603 16,507,345 5,816,757Interest 2,041,557 1,800,000 1,700,000 1,825,000 1,816,000Surplus 500,000 700,000 1,800,000 1,500,000 2,250,000Trust & Agency Funds 850,000 300,000 300,000 300,100 300,000Miscellaneous 1,350,720 284,620 3,862,130 1,589,419 10,317,663Education Adequacy Grant 36,878,752 36,878,752 42,283,387 42,473,084State Education Taxes (1) 25,515,954 25,515,954 28,447,547 29,155,221School Revenues 16,060,200 17,468,979 18,036,000 15,007,326
Total Estimated Revenues 53,743,889 108,288,714 124,982,624 138,893,096 137,130,691Tax Levy $121,733,167 $ 89,444,656 $ 91,263,968 $ 93,611,454 $ 101,860,337
(1) State Education Taxes are included as part of the City’s total tax levy
As shown in the table above, for purposes of calculating the property tax levy, estimated departmentalbudgetary requirements, which in fiscal year 2003 totaled $238,991,028, are assumed to be funded firstfrom estimated non-tax revenues, which in fiscal year 2003 totaled $137,130,691. The remainingbudgetary requirements are then assumed to be funded from the property tax levy.

City of Manchester, New Hampshire2003 Comprehensive Annual Financial Report
27
Employee Relations
Pursuant to New Hampshire RSA 273-A, all public employees in the State of New Hampshire have theright to organize and to bargain collectively with their public employers on matters of wages, hours, andother conditions of employment other than managerial policy. The City has approximately 1,272employees, of whom approximately 67% are bargaining unit members.
The following identifies Manchester’s municipal labor organizations, their affiliations, the length ofeach contract and the date on which the contract expires.
Length Expiration Organization Affiliation of Contract of ContractAirport Teamsters 2.0 Years 06/30/04Public Works, Parks and Sanitation AFSCME 298 2.0 Years 06/30/04Police Department MAPS 3.0 Years 06/30/02Police Department MPPA 3.0 Years 06/30/02Water Works USWA 3.0 Years 06/30/02Fire Department IAFF 3.0 Years 06/30/02Police Department Support Staff Teamsters 2.0 Years 06/30/04Fire Department MAFS 2.0 Years 06/30/04Health Department AFSCME 2.0 Years 06/30/04
AFSCME: American Federation of State, County, and Municipal EmployeesMAPS: Manchester Association of Police SupervisorsMPPA: Manchester Association of Police PatrolmenUSWA: United Steelworkers of AmericaIAFF: International Association of FirefightersTeamsters: Local 633 of NHMAFS: Manchester Association of Fire Supervisors
The City and the applicable union have agreed to the material terms necessary to extend and/or modifyof the existing collective bargaining agreements. New collective bargaining agreements, however, havenot yet been executed.
In addition to the above listed groups that are officially organized, there is one other group that hasretained their status as Non-affiliated Employees. The “Non-affiliated” group is comprised ofadministrative, clerical, and supervisory personnel in most of the departments listed above, as well as theentire segment of employees, which account for the “General Government” grouping.
Summary
The combination of these new economic projects along with the City’s successful investment in theManchester Airport, the Verizon Wireless Arena and various Millyard initiatives should help sustain theCity’s economy for the next decade.
While the City has taken actions to stimulate the local economy, it should be recognized that the overallNew Hampshire economy is still faring better in this period of economic uncertainty than any of its

City of Manchester, New Hampshire2003 Comprehensive Annual Financial Report
28
neighboring New England states. New Hampshire’s current growth outpaces both national and NewEngland averages.
While the City’s current economy appears resilient with property tax collections remaining strong(98.9%), the Board of Mayor and Aldermen have adopted the above mentioned policies and capitalinitiatives to further strengthen the City’s financial condition and the local economy during thisanticipated sustained period of economic slowdown. These projects are aimed not only at providingjobs, but also more importantly, at enhancing local education and quality of life.
BOND ISSUES AND CREDIT RATING DURING PERIOD
The general debt limit of the City is 9.75% of base valuation, a total capacity of $686,468,412; not morethan 7% of which may be incurred for School purposes. Water and Sewer projects ordered by the StateWater Supply and Pollution control commission, self-supporting sewer debt, debt for urbanredevelopment and housing purposes, and overlapping debt are excluded from the measure ofindebtedness. Other water projects are subject to a separate, special debt limit of 10% of the City's basevaluation. Borrowings authorized by special legislative acts rather than the general municipal financestatutes are also sometimes excluded from a city or town's statutory debt limit.
As of June 30, 2003 the City has a total outstanding General Obligation debt of $118,936,695 andauthorized and unissued debt of $258,762,909 for compliance with various improvements, infrastructureimprovements, and economic development projects.
Although the City did not issue any bonds during FY 2003, significant effort was devoted during theyear in preparation for three (3) issues scheduled for early in FY 2004.
On July 31, 2003 the City issued $105,000,000 school improvement bonds.
On August 31, 2003 the City issued on behalf of the Manchester Water Works $38,345,000 revenuebonds for improvement / expansion of the water treatment facility.
Also on December 1, 2003 the City issued $87,520,000 including $24,350,000 financing for theProfessional Minor League Baseball Stadium as part of the City’s commitment to the RiverfrontDevelopment Project. $37,675,000 to finance various municipal capital improvement projects as part ofthe City Capital Improvement Program; and $25,495,000 refunding bonds.
The City was assigned the following credit ratings; FitchRatings (“Fitch”), Moody’s Investors Service,Inc. (“Moody’s”) and Standard & Poor’s Ratings Services, a division of The McGraw-Hill Companies,Inc. (“S&P”), have assigned the ratings of “AA+,” “Aa2,” and “AA+,” respectively, to the Bonds.
The MSD was assigned the following credit ratings; Fitch, Moody’s and S&P, have assigned the ratingsof “AA,” “Aa3,” and “AA,” respectively, to the Bonds.
The MWW was assigned the following credit ratings; Fitch, Moody’s and S&P, have assigned theratings of “AA,” “Aa3,” and “AA,” respectively, to the Bonds.

City of Manchester, New Hampshire2003 Comprehensive Annual Financial Report
29
INDEPENDENT AUDIT
State statutes and the City Charter require an annual audit by an independent certified public accountant.The City has engaged McGladrey & Pullen, LLP, Certified Public Accountants, to conduct the City'saudit. In addition to meeting the requirements set forth in State statutes and the Charter, the audit wasalso designed to meet the requirements of the federal Single Audit Act and related OMB Circular A-133.The financial records, books of accounts, and transactions of the City for the fiscal year ended June 30,2003 have been audited by McGladrey & Pullen, LLP. The auditor's report on the basic financial state-ments is included in the financial section of this report. The auditor's reports on internal controls andcompliance with applicable laws and regulations can be found in a separately issued single audit report.
ACKNOWLEDGEMENTS
I would like to thank all of the City's department heads, payroll and account clerks for completion ofanother successful year. I would especially like to thank the staff of the Finance Department for theirdedication and attention to detail.
Respectfully submitted,
Kevin A. CloughertyKevin A. CloughertyFinance Officer

30
This Page Intentionally Left Blank

WELFARE COMMISSIONERElected by Citizens
CITY OF MANCHESTER NEW HAMPSHIREORGANIZATION CHART
BOARD OF SCHOOL COMMITTEEElected by Citizens
School DistrictWelfare Department
MAYORElected by Citizens
BOARD OF ALDERMENElected by Citizens
DEPARTMENTSNominated by the Mayor and Confirmed by the Board of Aldermen
SPECIAL SERVICE BOARDS AND COMMISSIONSNominated by the Mayor and Confirmed by the Board of Aldermen
HeritageCommission
ArtCommission
Board ofRecount
Conduct Board Planning Board
PlanningDepartment
CommunityImprovement
Program
RiskManagement
Safety ReviewBoard
Chief Negotiator/Contract
Administration
PersonnelAppeals Board
Office of theCity Solicitor
Department ofHuman
Resources
City SolicitorDirector of
HumanResources
CITY OFFICERSNominated and Appointed by Board of Aldermen
FinanceOfficer
City Clerk
FinanceDepartment
Office of theCity Clerk
LIBRARY TRUSTEESNominated and Appointed by Board of Aldermen
Libraries
Trustees ofTrust Funds
Board ofRegistrars
LibraryTrust Funds
Department ofWater
Water Director
WaterCommission
ManchesterDevelopmentCorporation
Zoning Boardof Adjustment
ConservationCommission
MDC Inc.PlanningDirector
PoliceCommission
SystemsAdvisory
Committee
Board ofHealth
FireCommission
Elderly ServicesCommission
Department ofPolice
Protection
InformationSystems
Department
Department ofHealth
Department ofFire Prevention
Department ofElderly Services
Office ofYouth Services
Department ofTax Collection
Police ChiefDirector ofInformation
Systems Health OfficerFire Chief
Director ofElderly Services
Director ofYouth Services
Tax Collector
Department ofTraffic
Director of Traffic
AirportAuthority
Parks &RecreationCommission
Building Boardof Appeals
Department ofAviation
Departmentof Parks,
Recreation &Cemeteries
Department ofBuilding
AirportDirector
Superintendentof Parks,
Recreation &Cemeteries
BuildingCommissioner
EconomicDevelopment
Office
EconomicDevelopment
Director
HighwayCommission
Director ofPublic Works
Department ofHighway
BuildingMaintenance
Division
City Assessors
Office of Assessors
AggregationDivision
EnvironmentalProtectionDivision
31

in office at the close of fiscal year ended June 30, 2003
Ward 1 David M. Wihby Ward 7 William P. SheaWard 2 Theodore L. Gatsas Ward 8 Betsi L. DeVriesWard 3 Frank C. Guinta Ward 9 Michael D. GarrityWard 4 Mary A. Sysyn Ward 10 George W. SmithWard 5 Ed Osborne Ward 11 Henry R. ThibaultWard 6 Real R. Pinard Ward 12 Armand D. ForestAt-large Michael J. Lopez At-large Daniel P. O'Neil ** Chairman of the Board
Finance Officer Kevin A. CloughertyDeputy Finance Officer Randy M. Sherman, CPASecond Deputy Finance Officer, Treasury Manager Joanne L. Shaffer, CCMCity Clerk Leo R. BernierCity Solicitor Thomas R. ClarkCommissioner of Welfare Paul R. R. MartineauChief of Police John A. JaskolkaFire Chief Joseph P. KanePublic Health Director Frederick Rusczek, M.P.H.Director of Public Works Frank C. Thomas, P.E.Director of Parks, Recreation & Cemetery Ronald E. LudwigDirector of Economic Development UnfilledBuilding Commissioner Leon LaFreniereDirector of Traffic Thomas P. LolicataAirport Director Kevin A. DillonDirector of Water Thomas M. Bowen, P.E.Director of Information Systems Diane PrewDirector of City Library John Anthony BrisbinDirector of Planning Board Robert S. MackenzieSuperintendent of Schools Michael Ludwell, Ph.D.Director of Human Resources Virginia A. LambertonDirector of Elderly Services Barbara A. VigneaultActing Director of Youth Services Laurel BuccinoChairman Board of Assessors Steven G. TellierCollector of Taxes Joan A. Porter
32
City Departments
List of Principal Officials
MayorRobert A. Baines
Aldermen

FINANCIALSECTION

INDEPENDENT AUDITOR’S REPORT To the Honorable Board of Mayor and Aldermen City of Manchester, New Hampshire We have audited the accompanying financial statements of the governmental activities, the business-type activities, the aggregate discretely presented component units, each major fund, and the aggregate remaining fund information of the City of Manchester, New Hampshire (“the City”) as of and for the year ended June 30, 2003 which collectively comprises the City’s basic financial statements, as listed in the table of contents. These financial statements are the responsibility of the City's management. Our responsibility is to express an opinion on these financial statements based on our audit. We did not audit the Manchester School District or the Manchester Transit Authority, component units of the City, which financial statements reflect 96.9% of the revenues and 9% of the assets of the discretely presented component units. We also did not audit the City of Manchester Employees’ Contributory Retirement System, a pension trust fund and a blended component unit of the City, which represents 80% of the assets and 100% of the additions of the pension trust funds. Those financial statements were audited by other auditors whose reports have been furnished to us, and our opinion on the basic financial statements, insofar as it relates to amounts included for the Manchester School District, the Manchester Transit Authority and the City of Manchester Employees’ Contributory Retirement System, component units of the City, is based solely on the reports of other auditors. We conducted our audit in accordance with auditing standards generally accepted in the United States of America and the standards applicable to financial audits contained in "Government Auditing Standards" issued by the Comptroller General of the United States. Those standards require that we plan and perform the audit to obtain reasonable assurance about whether the basic financial statements are free of material misstatement. An audit includes examining, on a test basis, evidence supporting the amounts and disclosures in the financial statements. An audit also includes assessing the accounting principles used and significant estimates made by management, as well as evaluating the overall financial statement presentation. We believe that our audit, and the reports of other auditors, provide a reasonable basis for our opinions. As described in Note 9 to the basic financial statements, the City accounted for the receipt of title to the Manchester Civic Center as a non-exchange transaction. We were not able to obtain sufficient evidence to satisfy ourselves as to the propriety of this accounting treatment of the carrying value of net assets.
McGladrey & Pullen, LLP is a member firm of RSM International - an affiliation of separate and independent legal entities.
33

In our opinion, except for the effect, if any, of the reporting of the receipt of title to the Manchester Civic Center as a non-exchange transaction on governmental activities, as described in the preceding paragraph, based on our audit and the reports of other auditors the financial statements referred to above present fairly, in all material respects, the respective financial position of the governmental activities, the business-type activities, the aggregate discretely presented component units, each major fund, and the aggregate remaining fund information of the City of Manchester, New Hampshire, as of June 30, 2003, and the respective changes in financial position and cash flows, where applicable, thereof, and the respective budgetary comparison for the General Fund, for the year then ended in conformity with accounting principles generally accepted in the United States of America. The management discussion and analysis on pages 35 through 48 is not a required part of the basic financial statements, but is supplementary information required by the Governmental Accounting Standards Board. We have applied certain limited procedures, which consisted principally of inquiries of management regarding the methods of measurement and presentation of the required supplementary information. However, we did not audit the information and express no opinion on it. In accordance with "Government Auditing Standards," we have also issued our report dated October 29, 2003 on our consideration of the City of Manchester, New Hampshire's internal control over financial reporting and our tests of its compliance with certain provisions of laws, regulations, contracts and grants. That report is an integral part of an audit performed in accordance with “Government Auditing Standards” and should be read in conjunction with this report in considering the results of our audit. Our audit was conducted for the purpose of forming opinions on the financial statements that collectively comprise the City’s basic financial statements. The introductory section, budgetary detail, combining and individual nonmajor fund statements and schedules, and statistical section are presented for purposes of additional analysis and are not a required part of the basic financial statements. The combining and individual nonmajor fund statements and schedules have been subjected to the auditing procedures applied by us in the audit of the basic financial statements and, in our opinion, are fairly stated in all material respects in relation to the basic financial statements taken as a whole. The introductory section and statistical section have not been subjected to the auditing procedures applied by us in the audit of the basic financial statements and, accordingly, we express no opinion on them.
New Haven, Connecticut October 29, 2003
34

35
City of Manchester, New HampshireManagement’s Discussion and Analysis
June 30, 2003
As management of the City of Manchester, New Hampshire (the “City”) we offer readers of thefinancial statements this narrative overview and analysis of the financial activities of the City for thefiscal year ended June 30, 2003. We encourage readers to consider the information presented here alongwith additional information we have furnished in our letter of transmittal, as well as the City’s basicfinancial statements that follow this section.
Financial Highlights
♦ On a government-wide basis, the assets of the City exceeded its liabilities resulting in total net assetsat the close of the fiscal year of $383 million. Total net assets for Governmental Activities at fiscalyear-end was $71.7 million and total net assets for Business-Type Activities were $311.3 million.The unrestricted net assets at June 30, 2003 were $14 million or 3.7% of the City’s total net assets.
♦ On a government-wide basis, during the year, the City’s net assets increased by $37.4 million or10.7%, from $345.6 million to $383 million. Net assets increased by $8.2 million for GovernmentalActivities and net assets increased by $29.2 million for Business-Type Activities. Government-wideexpenses were $187.3 million, while revenues were $224.7 million.
♦ At the close of the year, the City’s governmental funds reported, on a current financial resourcebasis, combined ending fund balances of $32.1 million, a decrease of $11.3 million from the priorfiscal year. Of the total fund balance as of June 30, 2003, there is a deficit of $5.9 million whichrepresents the combined unreserved deficit in the general fund, special revenue funds, capitalprojects fund and permanent funds. The combined deficit is due to the capital projects deficit of$8.4 million.
♦ At the end of the current fiscal year, the total fund balance for the general fund alone was $22.8million, an increase of $1 million from the prior fiscal year. Included in the fiscal year 2003 budgetwas an appropriation of $1.1 million of unreserved and undesignated fund balance. As of June 30,2003, $1.3 million of the total general fund fund balance represents unreserved and undesignatedgeneral fund balance. Unreserved general fund fund balance at year-end represents 1.3% of totalgeneral fund expenditures and transfers ($100.8 million).
Overview of the Financial Statements
This discussion and analysis is intended to serve as an introduction to the City’s basic financialstatements. The basic financial statements are comprised of three components: 1) government-widefinancial statements; 2) fund financial statements; and 3) notes to the financial statements. This reportalso contains other supplementary information as well as the basic financial statements.

36
It is important to note that the City implemented the new reporting requirements outlined in GASB 34effective July 1, 2001. The financial statements, therefore, contained within this report as of June 30,2003, are the City’s second report using the new reporting model. In addition, the City was among oneof the first municipalities in the State of New Hampshire required to report under the new model for thefiscal year ended June 30, 2002. As allowed under GASB 34, the City elected not to present all requiredcomparative data for that year of implementation. The report for fiscal year ending June 30, 2003,however, contains all required comparative information with the City itself.
Government-Wide Financial Statements
The government-wide financial statements are designed to provide readers with a broad overview of theCity’s finances, in a manner similar to a private-sector business. All of the resources the City has at itsdisposal are shown, including major assets such as buildings and infrastructure. A thorough accountingof the cost of government is rendered because the statements present all costs, not just how much wascollected and disbursed. They provide both long-term and short-term information about the City’soverall financial status.
The statement of net assets presents information on all of the City’s assets and liabilities, with thedifference reported as net assets (deficits). Over time, increases or decreases in net assets (deficits) mayserve as an indicator of whether the financial position of the City is improving or deteriorating. It speaksto the question of whether or not, the City, as a whole is better or worse off as a result of this year’sactivities. Other non-financial factors will need to be considered, however, such as changes in the City’sproperty tax base and the condition of the City’s infrastructure, to assess the overall health of the City.
The statement of activities presents information showing how the City’s net assets (deficits) changedduring the most recent fiscal year. All of the current year’s revenues and expenses are taken into accountregardless of when cash is received or paid. Thus, revenues and expenses are reported in this statementfor some items that will only result in cash flow in some future fiscal period, uncollected taxes andearned but unused vacation leave are examples.
Both of the government-wide financial statements distinguish functions of the City of Manchester thatare supported by taxes and intergovernmental revenues (governmental activities) from other functionsthat are intended to recover all or a significant portion of their costs through user fees and charges(business type activities).
♦ Governmental activities of the City encompass most of the City’s basic services and includegovernmental and community services, administration, public safety, health and sanitation, highwaysand streets, welfare, and education and library as well as cemetery, and parks and recreation.Property taxes, charges for services and state and federal grants finance most of these activities.
♦ Business-type activities of the City consist of the Water Works, Environmental Protection Division,Aviation, Recreation and the Aggregation Program. They are reported here, as the City charges auser fee to customers to help cover all or most of the cost of operations.
♦ The government-wide financial statements include not only the City itself, but also three legallyseparate component units, the Manchester School District (“MSD”), the Manchester TransitAuthority (“MTA”) and the Manchester Development Corporation (“MDC”).
The government-wide financial statements (statement of net assets and statement of activities) can befound on pages 50-53 of this report.

37
Fund Financial Statements
A fund is a grouping of related accounts that is used to maintain control and accountability overresources that have been segregated for specific activities or objectives. The City, like other state andlocal governments, uses fund accounting to ensure and demonstrate compliance with finance-relatedlegal requirements. The City has three kinds of funds:
Governmental funds. Governmental funds are used to account for essentially the same functionsreported as governmental activities in the government-wide financial statements. However, unlike thegovernment-wide financial statements, governmental fund financial statements focus on near-terminflows and outflows of spendable resources, as well as on balances of spendable resources available atthe end of the fiscal year. Such information may be useful in evaluating a government’s near-termfinancing requirements.
Because the focus of governmental funds is narrower than that of the government-wide financialstatements it is useful to compare the information presented for governmental funds with similarinformation presented for governmental activities in the government-wide financial statements. Bydoing so, readers may better understand the long-term impact of the government’s near-term financingdecisions. Both the governmental fund balance sheet and the governmental fund statement of revenues,expenditures, and changes in fund balances provide a reconciliation to facilitate this comparisonbetween governmental funds and governmental activities.
The City maintains eight individual governmental funds. Information is presented separately in thegovernmental fund balance sheet and in the governmental fund statement of revenues, expenditures, andchanges in fund balances for the General Fund and the Capital Projects which are considered to be majorfunds. Data from the other governmental funds are combined into a single, aggregated presentation asOther Governmental Funds. Non-major governmental funds, as discussed in the Letter of Transmittal,for the City include the United States Department of Housing and Urban Development (DHUD) Section108 Fund, Cash Special Projects Fund, Community Development Block Grant Fund, Other Grants Fund,Civic Center Fund, and the Revolving Loan Fund. Permanent Funds consist of the Cemetery Fund andthe Library Fund. Individual fund data for each of these non-major governmental funds is provided inthe combining balance sheets on pages 112-113 and in the combining statement of revenues,expenditures and changes in fund balance on pages 114-115.
The City adopts an annual appropriated budget for its general fund. A budgetary comparison statementhas been provided for the general fund to demonstrate compliance with the authorized budget. Thestatement of revenues, expenditures and changes in fund balance on a budgetary basis can be found onpage 57.
The basic governmental fund financial statements (balance sheet and statement of revenues,expenditures and changes in fund balance) can be found on pages 54-55 of this report.
Proprietary funds. The City of Manchester maintains five proprietary funds. Enterprise funds are usedto report the same functions presented as business-type activities in the government-wide financialstatements. The City of Manchester uses enterprise funds to account for its Water Works, EnvironmentalProtection Division, Aviation, Recreation and the Aggregation Program Funds. The proprietary fundfinancial statements provide separate information for the Water Works, Environmental ProtectionDivision and Aviation, which are considered to be major funds of the City of Manchester. Conversely,both of the remaining funds are combined into a single, aggregated presentation in the proprietary fund

38
financial statements. Individual fund data for the Recreation Fund and the Aggregation Program isprovided on pages 117-119 in the form of combining statements elsewhere in this report.
Proprietary funds provide the same type of information as the government-wide financial statements,only in more detail. The proprietary fund financial statements can be found on pages 58-60 of thisreport.
Fiduciary funds. Fiduciary funds are used to account for resources held for the benefit of partiesoutside the government. Fiduciary funds are not reflected in the government-wide financial statementbecause the resources of those funds are not available to provide services to the City’s constituency. TheCity has two pension trust funds and one agency fund. The accounting used for fiduciary funds is muchlike that used for proprietary funds. The basic fiduciary fund financial statements can be found on pages61-62 and 90-91 of this report.
Notes to the Financial Statements
The notes provide additional information that is essential to a full understanding of the data provided inthe government-wide and fund financial statements. The notes to the financial statements can be foundon pages 63-99 of this report.
The notes to this report also contain certain information concerning the City’s progress in funding itsobligation to provide pension benefits to its employees.
Government-wide Financial Analysis
As noted earlier, net assets may serve over time as a useful indicator of a government’s financialposition and an important determinant of its ability to finance services in the future. On a government-wide basis, the City’s assets exceeded its liabilities by $383 and $345.6 million at June 30, 2003 and2002, respectively.
Reported for the first time in 2002 were some of the City’s infrastructure assets including The VerizonWireless Arena, roads, sidewalks, bridges, dams, right-of-ways, streetlights, and culverts, all of whichhave useful lives that range between 20 and 50 years. The City has, in the past, reported only its stormand sanitary sewers with useful lives of 50 years.

39
At the end of the current fiscal year, the City is able to report a positive balance in both its governmentaland proprietary activities.
The portion of the City’s net assets of $309.6 million reflects its investment in capital assets (e.g., land,buildings, machinery and equipment), net any outstanding debt related to these assets. The City usesthese capital assets to provide services to citizens; consequently, these assets are not available for futurespending. Although the City’s investment in its capital assets is reported net of related debt, it should benoted that the resources needed to repay this debt must be provided from other sources, since the capitalassets themselves cannot be used to liquidate these liabilities.
Govern- Business Govern- Businessmental Type mental Type
Activities Activities Total Activities Activities Total
Current and Other Assets 116,468$ 134,779$ 251,247$ 118,097$ 159,747$ 277,844$ Non-Current 18,187 8,081 26,268 18,511 9,268 27,779 Capital Assets 173,781 517,958 691,739 173,630 464,750 638,380
Total Assets 308,436 660,818 969,254 310,238 633,765 944,003
Current Liabilities 84,079 23,185 107,264 73,046 20,633 93,679 Long-term liabilities
outstanding 152,643 326,332 478,975 173,697 330,999 504,696 Total Liabilities 236,722 349,517 586,239 246,743 351,632 598,375
Net Assets:Invested in capital assets,
net of related debt 84,480 225,163 309,643 73,140 202,690 275,830 Restricted 17,545 41,479 59,024 17,994 26,540 44,534 Unrestricted (30,311) 44,659 14,348 (27,639) 52,903 25,264
Total Net Assets 71,714$ 311,301$ 383,015$ 63,495$ 282,133$ 345,628$
City of Manchester, New HampshireNet Assets ($000's)
June 30, 2002June 30, 2003
Primary Government
Primary Government Net Assets, as of June 30, 2003
Invested in capital assets,net of related
debt81%
Restricted15%
Unrestricted4%

40
The portion of the City’s net assets that are restricted, $59.0 million, represents resources that are subjectto external restrictions on how they may be used. Governmental unrestricted net assets (deficit) of($30.3) million may not be used to meet the City’s ongoing obligations to citizens and creditors, due tothe negative balance. The primary reasons for the negative balance are due to the issuance of the 1993Fiscal Year Conversion Bonds, which were issued to properly fund revenue and expenditure timingdifferences, which has an outstanding balance of $6,199,461 as well as related Capital AppreciationBonds accrual of $5,136,395, the Pension Obligation Bond with an outstanding balance of $17,230,045,which was issued to properly fund the unfunded amount, the Landfill Closure Project, which has anoutstanding balance of $1,180,555, other landfill closure and post-closure care costs estimated liabilitywith an outstanding balance of $18,106,957, Urban Renewal Related Projects with outstanding balancesof $2,744,909, Revaluation debt with an outstanding balance of $885,000, long-term debt related toinsurance claims with an estimated outstanding balance of $4,135,101, as well as long-term debt relatedto compensated absences with an estimated outstanding balance of $6,328,390 at June 30, 2003.
Govern- Business Govern- Businessmental Type mental Type
Activities Activities Total Activities Activities Total
Revenues:Program Revenues:
Charges for services 20,866$ 65,829$ 86,695$ 20,154$ 61,790$ 81,944$ Operating grants and contributions 20,824 7,094 27,918 21,491 2,812 24,303 Capital grants and contributions 29,199 29,199 65,739 26,468 92,207
General Revenues:Property taxes/auto/franchise fees 73,037 73,037 73,204 73,204
Unrestricted investment earnings 1,088 2,627 3,715 2,122 2,762 4,884 Transfers and other 5,837 (15,361) (9,524) 2,096 (16,662) (14,566)
Total revenues 121,652 89,388 211,040 184,806 77,170 261,976
Expenses:General government 32,561 32,561 38,574 38,574 Public safety 37,766 37,766 38,059 38,059 Health and sanitation 4,196 4,196 3,527 3,527 Highways and streets 28,905 28,905 30,354 30,354 Welfare 1,405 1,405 2,240 2,240 Education and library 3,817 3,817 4,835 4,835 Parks and recreation 4,724 4,724 835 835 Cemetery Trust 36 36 27 27 Investment management fee 23 23 20 20 Contribution to Pension Trust Fund 449 449 Operations 60,220 60,220 - 47,928 47,928
Total Expenses 113,433 60,220 173,653 118,920 47,928 166,848 Change in net assets 8,219 29,168 37,387 65,886 29,242 95,128
Net assets (deficits)-beginning 63,495 282,133 345,628 (2,391) 252,891 250,500 Net assets (deficits)-ending 71,714$ 311,301$ 383,015$ 63,495$ 282,133$ 345,628$
Primary government
City of Manchester, New HampshireChanges in Net Assets (Deficits) ($ 000's)
June 30, 2003 June 30, 2002

41
Manchester’s net assets increased by $37.4 million during the fiscal year, with net assets ofGovernmental Activities increasing by $8.2 million, and net assets of Business-Type Activitiesincreasing by $29.2 million. The increase in net assets within Business-Type Activities is primarily dueto the increases in capital contribution revenues.
June 30, 2003 Primary government revenues
Program revenues and other
65%
Property taxes/ auto/franchise fees
35%
City of ManchesterExpenses
June 30, 2003
Parks and recreation2.72%
Cemetery Trust0.02%
Investment management fee
0.01%
Education and library2.19%
Welfare0.81%
Highways and streets16.65%
Operations34.68%
General government18.75%
Health and sanitation2.42%
Public safety21.75%

42
Governmental Activities
More than 60% of the governmental funds revenues were derived from property taxes, auto registrationsand franchise fees, followed by 17.2% from charges for services, then 17.1% from operating grants andfinally, about 5.7% of the City’s revenue in this fiscal year was derived from a combination ofinvestment earnings, gain (loss) of sales of capital assets, and transfers.
Major revenue factors included:
♦ Investment earnings fell in the general fund from $1.13 million in the prior fiscal year to $.74million for the fiscal year ended June 30, 2003. The reduction in interest and dividend earnings wasthe result of a slowing economy and the further subsequent reduction in interest rates by the FederalReserves Bank.
Business-Type Activities
Business-Type activities increased the City’s net assets by $29.2 million.
♦ Aviation fund capital contributions amounted to $25.5 million, an increase from $23.2 million theprevious year .
Financial Analysis of the Fund Financial Statements
As noted earlier, the City uses fund accounting to ensure and demonstrate compliance with finance-related legal requirements.
Governmental funds. The focus of the City’s governmental funds is to provide information on near-term inflows, outflows, and balances of spendable resources. Such information is useful in assessing theCity’s financing requirements. In particular, unreserved fund balance may serve as a useful measure of agovernment’s net resources available for spending at the end of the fiscal year.
As of the end of the current fiscal year, the City’s governmental funds reported combined ending fundbalances of $32.06 million, a decrease from $43.38 million as reported on June 30, 2002. Approximately28.6% of this total amount constitutes unreserved fund balance that is available for spending at thegovernment’s discretion. The remainder of fund balance is reserved to indicate that it is not available fornew spending because it has already been committed: $14.58 million to cemetery, library and other trustfunds; $3.14 million to liquidate contracts and purchase orders of the prior period; $2.96 million to self-insured workers’ compensation claims reserve; $1.62 million for advances to an enterprise fund and $.6million for inventory.
The general fund is the chief operating fund of the City. At the end of the current fiscal year,undesignated, unreserved fund balance of the general fund was $1.3 million while the total fund balancereached $22.8 million. As a measure of the general fund’s liquidity, it may be useful to compare bothunreserved fund balance and total fund balance to total fund expenditures and education operatingtransfers. Unreserved fund balance represents 16.23% of total general fund expenditures, while totalfund balance represents 22.62% of that same amount.
Proprietary funds. The City’s proprietary funds provide the same type of information found in thegovernment-wide financial statements, but in more detail.

43
Net assets of the proprietary fund consisting of the Water Works were $61.75 million, as compared to$59.03 million in the prior year.
The unrestricted deficit of the Water Works was $3.95 million. The Water Works experienced operatingrevenues of $10.03 million from user fees. There was a total net income for the Water Works of $50,910before capital contributions of $2.67 million. The change in net assets for the fiscal year ended June 30,2003 was $2.72 million.
The total assets for EPD decreased by 1.4%, $2 million, bringing the ending balance to $146.4 million atJune 30, 2003. Total current assets decreased by $4.5 million, and noncurrent assets by $1 million,while total capital assets increased by $3.3 million.
The fiscal year 2003 ending fund balance (fund net assets) remained relatively constant at $103.5million. Of this amount, $71 million is invested in capital assets and $ .3 million is restricted forequipment replacement.
Unrestricted assets decreased by $5.4 million and the investment in capital assets increased $5.6 millionfor the fiscal year 2003.
Manchester Airport continues to experience real passenger growth in FY2003, approximately 4.4%higher than FY 2002. Operating income fell from $11,366,591 in FY2002 to $4,768,019 in FY2003, adecrease of 58%.
General Fund Budgetary Highlights
The City ended Fiscal Year 2003 with an improved balance sheet over FY 2002. The City's "rainy day"revenue stabilization fund increased from $9,576,915 to $9,633,624. The City's undesignated fundbalance decreased from $4,683,957 to $1,304,404, because the City established two new designatedfund accounts. The first is the tax rate stabilization account of which the excess of one percent of the FY2002 tax warrants was transferred into, or $1,981,568. The second is the special revenue account whichaccounts for one-time revenues, (i.e., property sales, etc.) which amounts to $848,437. The City'sreserves for workers compensation, health insurance, and general liability had an aggregate increase of$889,717 or 19% from $4,665,427 to $5,555,145.
The difference between the original budget and the final revised budget was $650,000. Budget cutsadopted during the year are summarized below:
♦ The net budget amendment dated September 4, 2002, decreased the general fund departmentalexpenditures budget by $650,000.
♦ A reduction from original General Government appropriations of $227,218.
♦ A reduction from original Public Safety appropriations of $120,000.
♦ A reduction from original Highways and Streets appropriations of $240,664.
♦ A reduction from original Education and Library appropriations of $23,069.
♦ A reduction from original Parks and Recreations appropriations of $39,049.
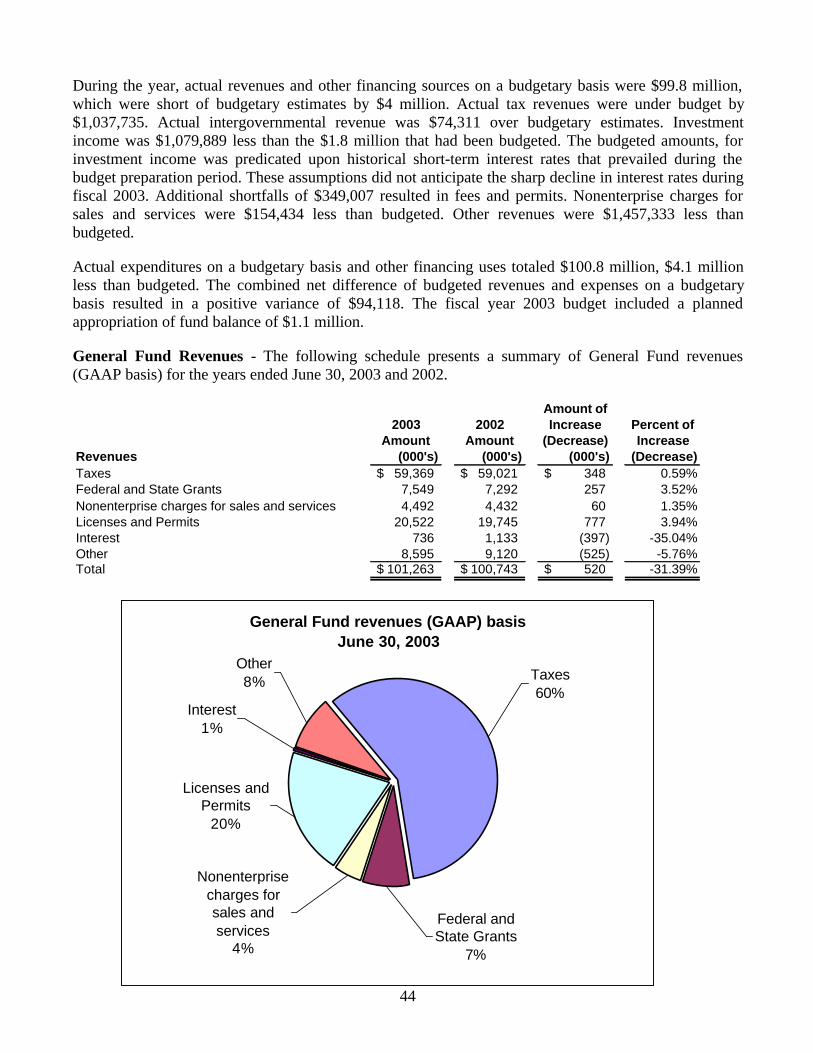
44
During the year, actual revenues and other financing sources on a budgetary basis were $99.8 million,which were short of budgetary estimates by $4 million. Actual tax revenues were under budget by$1,037,735. Actual intergovernmental revenue was $74,311 over budgetary estimates. Investmentincome was $1,079,889 less than the $1.8 million that had been budgeted. The budgeted amounts, forinvestment income was predicated upon historical short-term interest rates that prevailed during thebudget preparation period. These assumptions did not anticipate the sharp decline in interest rates duringfiscal 2003. Additional shortfalls of $349,007 resulted in fees and permits. Nonenterprise charges forsales and services were $154,434 less than budgeted. Other revenues were $1,457,333 less thanbudgeted.
Actual expenditures on a budgetary basis and other financing uses totaled $100.8 million, $4.1 millionless than budgeted. The combined net difference of budgeted revenues and expenses on a budgetarybasis resulted in a positive variance of $94,118. The fiscal year 2003 budget included a plannedappropriation of fund balance of $1.1 million.
General Fund Revenues - The following schedule presents a summary of General Fund revenues(GAAP basis) for the years ended June 30, 2003 and 2002.
Amount of2003 2002 Increase Percent of
Amount Amount (Decrease) IncreaseRevenues (000's) (000's) (000's) (Decrease)Taxes 59,369$ 59,021$ 348$ 0.59%Federal and State Grants 7,549 7,292 257 3.52%Nonenterprise charges for sales and services 4,492 4,432 60 1.35%Licenses and Permits 20,522 19,745 777 3.94%Interest 736 1,133 (397) -35.04%Other 8,595 9,120 (525) -5.76%Total 101,263$ 100,743$ 520$ -31.39%
General Fund revenues (GAAP) basisJune 30, 2003
Licenses and Permits
20%
Other8% Taxes
60%Interest
1%
Federal and State Grants
7%
Nonenterprise charges for sales and services
4%

45
General Fund Expenditures - The following schedule presents a summary of General Fund Expenditures(GAAP basis) for the years ended June 30, 2003 and 2002.
Amount of2003 2002 Increase Percent of
Amount Amount (Decrease) IncreaseExpenditures (000's) (000's) (000's) (Decrease)General government 18,658$ 18,369$ 289$ 1.57%Public safety 35,445 34,556 889 2.57%Health and sanitation 2,463 2,712 (249) -9.18%Highway and streets 19,903 20,099 (196) -0.98%Welfare 1,352 2,147 (795) -37.03%Library 2,146 2,259 (113) -5.00%Parks and recreation 2,992 3,034 (42) -1.38%Debt service 16,072 14,754 1,318 8.93%Pension benefit payment 18,660 (18,660) -100.00%Total 99,031$ 116,590$ (17,559)$ -31.39%
General Fund ExpendituresJune 30, 2003
Public safety37%
Health and sanitation
2%
Highway and streets20%
Library2%
Parks and recreation
3%Debt service
16%
General government
19%
Welfare1%

46
Capital Asset and Debt Administration
Capital assets. The City’s investment in capital assets for its governmental and business type activitiesas of June 30, 2003, amounts to $691.7 million, net of accumulated depreciation. This investment incapital assets includes land, building and system improvements, machinery and equipment, parkfacilities, roads, sewers and bridges. The total increase in the City’s investment in capital assets for thecurrent fiscal year was $53.3 million or 8.4%.
Govern- Business- Govern- Business-mental Type mental Type
Activities Activities Total Activities Activities Total Change
Land 18,984$ 36,677$ 55,661$ 18,366$ 10,377 28,743 26,918$ Buildings and improvements 111,652 306,058 417,710 114,839 235,201 350,040 67,670 Infrastructure 17,914 - 17,914 17,572 - 17,572 342 Machinery, equipment,
distribution and collection systems 6,329 51,226 57,555 5,309 52,118 57,427 128
Construction in progress 18,902 123,997 142,899 17,544 167,054 184,598 (41,699) Total 173,781$ 517,958$ 691,739$ 173,630$ 464,750 638,380 53,359$
2003 2002
City of Manchester, New HampshireCapital Assets (net of depreciation) (000's)
June 30, 2003 and 2002Primary Government
City of Manchester, New HampshireCapital assets
2003
Land8%
Construction in progress
21%
Buildings and improvements
60%
Infrastructure3%
Machinery, equipment,
distribution and collection systems
8%

47
Major capital asset events during the current fiscal year included the following:♦ Improvements and renovations to school buildings and facilities.♦ Continued rehabilitation of playgrounds and athletic fields.♦ Infrastructure improvements including roads, bridges, and sanitary and sewer projects.♦ Replacement of several pieces of emergency and rescue equipment for the fire department and
purchase of police vehicles.♦ Acquisition of parcels for ongoing city development projects.♦ Continued improvements and expansion of the Manchester Airport.
Additional information on the City of Manchester’s capital assets can be found in Note 8 on pages 81-84of this report.
Long-term debt. At the end of the current fiscal year, the City had total debt service requirementsincluding interest payments, on bonded debt outstanding, of $514,630,631. 100% of the generalobligation debt is backed by the full faith and credit of the City government.
The City was assigned the following credit ratings; FitchRatings, Moody’s Investors Service, Inc. andStandard & Poor’s Ratings Services, a division of The McGraw-Hill Companies, Inc., have assigned theratings of “AA+,” “Aa2,” and “AA+,” respectively, to the Bonds.
The general debt limit of the City is 9.75% of base valuation. The base valuation ($7,040,701,663) forcomputing the debt limit is determined by adding the amount of taxable property lost to cities, towns anddistricts as a result of the enactment of the State Business Profit Tax Law to the “equalize assessedvaluation.” Not more than 7% of the base valuation may be incurred for school purposes. Water andSewer projects ordered by the State Water Supply and Pollution Control Commission, self-supportingsewer debt, debt for urban redevelopment and housing purposes, and overlapping debt are excludedfrom the measure of indebtedness. Other water projects are subject to a separate, special debt limit of10% of the City’s base valuation. Borrowings authorized by legislative acts rather than the generalmunicipal finance statutes are sometimes excluded from a city or town’s debt limit. The Total EqualizedValuation figure includes Utility Valuation and Railroad Monies Reimbursements. The total bondeddebt for the general government includes the School District portion. As of June 30, 2003, the Cityrecorded long-term debt of $77.3 million related to Governmental Activities, $41.7 related to the SchoolDistrict and $44 million related to Business-Type Activities, well below its statutory debt limit.
Additional information on the City of Manchester’s long-term debt can be found in Note 9 on pages 85-89 of this report.
Govern- Business- Govern- Business-mental Type mental Type
Activities Activities Total Activities Activities Total
General Obligation Bonds 118,937$ 44,030$ 162,967$ 135,788$ 50,927$ 186,715$ General Obligation Revenue Bonds 271,254 271,254 - 275,329 275,329 Totals 118,937$ 315,284$ 434,221$ 135,788$ 326,256$ 462,044$
2003 2002
City of Manchester, New HampshireOutstanding Debt
General Obligation and Revenue Bonds (000's) in thousandsJune 30, 2003 and 2002

48
Economic Factors and Next Year’s Budgets and Rates
As of November 2003, the unemployment rate for the Manchester Metropolitan Statistical Area was4.2%, down from 4.6% in the prior year. Moreover, New Hampshire state government is now reportingserious revenue shortfalls that may translate into reductions in State aid to the City of Manchester andother municipalities in the State.
Fiscal Year 2004 Budget
The fiscal year 2004 combined General Fund budget for the City and the MSD contains an appropriationincrease of 1.31% over the fiscal 2003 budget. Non-property tax revenues are anticipated to remain flat.In the formulation of the fiscal 2004 budget, the Board of Mayor and Aldermen, after consultation withthe Department of Finance and the City’s assessing department, produced a budget to meet allcontracted obligations without layoffs or reductions in City services. The areas of concern indeveloping the fiscal year 2004 budget were a sluggish economy leading to flat collections of non-property tax revenues, increased costs for retirement fund contributions and health insurance and anobligation to maintain the highest possible level of public safety, health and education. The Citybelieves that it has met all of those concerns in the final adopted fiscal year 2004 budget.
The following table sets forth the City’s General Fund operating budgets for fiscal years 2002-2004.Enterprise funds, the County tax, veteran exemptions and the overlay reserve for abatements areexcluded from this table.
BUDGET TRENDS
Amount % Amount % Amount %
Education 115,808,857$ 52.9% 125,898,267$ 54.7% 126,575,275$ 54.3%General Government 21,582,883 9.9% 19,276,497 8.4% 18,172,463 7.8%Public Safety 35,675,949 16.3% 37,096,643 16.1% 40,134,677 17.2%Highway and Streets 21,767,436 9.9% 21,247,079 9.2% 21,520,212 9.2%Health and Welfare 4,194,300 1.9% 4,438,720 1.9% 4,378,700 1.9%Culture and Recreation 5,841,695 2.7% 5,748,578 2.5% 5,819,972 2.5%Economic Development 261,737 0.1% 273,178 0.1% 172,000 0.1%Motorized Equipment 382,500 0.2% 50,000 0.0% 120,000 0.1%Debt Service 13,332,747 6.1% 16,072,015 7.0% 16,228,552 7.0%
Total Budget 218,848,104 100.0% 230,100,977 100% 233,121,851 100.0%
Less MSD Budget (115,808,857) (125,898,267) (126,575,275)
General Fund Budget 103,039,247$ 104,202,710$ 106,546,576$
2002 2003 2004
Requests for Information
The financial report is designed to provide a general overview of the City’s finances for all those with aninterest in government’s finances. Questions concerning any of the information provided in this report orrequests for additional financial information should be addressed to the Director of Finance at One CityHall Plaza, Manchester, NH 03101.

BASIC FINANCIAL STATEMENTS

49
This Page Intentionally Left Blank

Statement of Net Assets
Governmental Business-typeActivities Activities Total
ASSETSCurrent assets:
Cash and cash equivalents 65,807,980$ 24,057,207$ 89,865,187$ Restricted cash 5,338,142 82,824,030 88,162,172 Investments 16,179,055 3,245,877 19,424,932 Receivables 26,247,041 25,193,446 51,440,487 Prepaid expenses 4,099 870,836 874,935 Internal balances 2,302,137 (2,302,137) - Due from City - Inventories 589,385 889,349 1,478,734
Total current assets 116,467,839 134,778,608 251,246,447
Noncurrent assets:Land held for resale - Capital assets, net of depreciation 173,781,497 517,958,279 691,739,776 Pension asset 17,857,717 17,857,717 Deferred professional fees, net 329,428 2,054,524 2,383,952 Receivables 5,741,227 5,741,227 Other 285,285 285,285
Total noncurrent assets 191,968,642 526,039,315 718,007,957
Total Assets 308,436,481$ 660,817,923$ 969,254,404$
LIABILITIESCurrent liabilities:
Accounts payable 11,077,097$ 8,578,312$ 19,655,409$ Retainage payable 2,120,603 2,120,603 Accrued liabilities 3,858,567 12,412,637 16,271,204 Other liabilities 1,296,477 1,296,477 Insurance claims payable 804,454 804,454 Due to school district 22,643,986 22,643,986 Deferred revenue 18,212,077 73,201 18,285,278 Taxes collected in advance 26,186,396 26,186,396
Total current liabilities 84,079,054 23,184,753 107,263,807
Noncurrent liabilities:Due within one year 24,991,194 13,230,373 38,221,567 Other liabilities due withing one year 868,835 868,835 Due in more than one year 127,652,344 317,414,009 445,066,353 Other liabilities due in more than one year - Bond discounts (5,181,278) (5,181,278)
Total noncurrent liabilities 152,643,538 326,331,939 478,975,477
Total Liabilities 236,722,592 349,516,692 586,239,284
NET ASSETSInvestment in capital assets,
net of related debt 84,480,112 225,163,369 309,643,481 Restricted for:
Coverage account 13,845,394 13,845,394 Manchester Regional Industrial Foundation 1,166,851 1,166,851 PFCs 4,577,382 4,577,382 MSDC 5,214,905 5,214,905 Revenue bond O&M 5,961,000 5,961,000 Revenue bond fund 10,713,087 10,713,087 Workmen's compensation 2,964,110 2,964,110 Cemetery and other trust funds 11,925,653 11,925,653 Library trust funds 2,655,562 2,655,562
Designated for:Land held for resale - Equipment replacement 278,986 278,986
Unrestricted (30,311,548) 44,380,257 14,068,709
Total Net Assets 71,713,889$ 311,301,231$ 383,015,120$
See accompanying notes.
50
Primary Government

Manchester Manchester ManchesterSchool Transit DevelopmentDistrict Authority Corporation
6,101,523$ 1,004,737$ 1,734,420$ 34,398
3,714,893 506,969 645,738 13,382 48,634
22,643,986 162,671
32,473,784 1,723,011 2,414,556
504,187 5,259,572 2,129,243
5,259,572 2,129,243 504,187
37,733,356$ 3,852,254$ 2,918,743$
2,148,565$ 17,689$
14,341,212 37,003 33,930$ 50,401
25,215,226 5,402
41,705,003 60,094 84,331
1,822,918
4,771,685 301,942
6,594,603 301,942 -
48,299,606 362,036 84,331
5,259,572 2,129,243
504,187 49,484 975,262
(15,875,306) 385,713 2,330,225
(10,566,250)$ 3,490,218$ 2,834,412$
51
City of Manchester New HampshireJune 30, 2003
Component Units

Statement of Activities
Operating Capital Sales and Grants and Grants and
Expenses Services Contributuions Contributions
Primary government:General government 32,560,283$ 10,097,598$ 11,429,867$ Public safety 37,765,649 2,161,469 1,376,437 Health and sanitation 4,196,162 1,375,369 1,203,218 Highways and streets 28,905,257 6,288,694 6,199,844 Welfare 1,404,958 107,019 Education and library 3,816,562 8,965 Parks and recreation 4,724,302 835,795 605,682 Cemetery Trust 36,037 Investment management fee 23,511
Total governmental activities 113,432,721 20,865,944 20,824,013 -
Business-type activitiesWater 9,796,790 9,989,204 2,673,613 EPD 11,308,620 11,332,387 325,855 997,522 Aviation 50,322,106 42,050,284 6,768,504 25,527,921 Recreation 2,353,924 2,274,829 Aggregation 134,986 182,090
Total business-type activities 73,916,426 65,828,794 7,094,359 29,199,056
Total primary government: 187,349,147$ 86,694,738$ 27,918,372$ 29,199,056$
Component unitsManchester School District 136,173,457 16,539,326 87,600,928 332,922 Manchester Transit Authority 4,907,432 2,537,721 1,761,573 80,515 Manchester Development Corporation 69,767
Total component units 141,150,656$ 19,077,047$ 89,362,501$ 413,437$
General revenues:Property taxesAuto registration feesFranchise feesUnrestricted investment earningsDebt reimbursement from MSDDonation of landLoss on disposal of assets
Total general revenues
Change in net assets (deficits)
Net assets (deficits) - beginning
Net assets (deficits) - ending
See accompanying notes.
52
Program Revenues

Manchester Manchester ManchesterGovernmental Business-type School Transit Development
Activities Activities Total District Authority Corporation
(11,032,818)$ (11,032,818)$ (34,227,743) (34,227,743)
(1,617,575) (1,617,575) (16,416,719) (16,416,719)
(1,297,939) (1,297,939) (3,807,597) (3,807,597) (3,282,825) (3,282,825)
(36,037) (36,037) (23,511) (23,511)
(71,742,764) - (71,742,764)
2,866,027 2,866,027 1,347,144 1,347,144
24,024,603 24,024,603 (79,095) (79,095) 47,104 47,104
- 28,205,783 28,205,783
(71,742,764)$ 28,205,783$ (43,536,981)$
(31,700,281)$ (527,623)$
(69,767)$
-$ -$ -$ (31,700,281)$ (527,623)$ (69,767)$
58,168,059 58,168,059 34,512,636 13,873,904 13,873,904
995,354 995,354 1,087,525 2,626,689 3,714,214 129,158 11,726 75,837 5,985,063 5,985,063
(723,590) (723,590) (147,804) (940,727) (1,088,531) 10,671
79,962,101 962,372 80,924,473 34,641,794 22,397 75,837
8,219,337 29,168,155 37,387,492 2,941,513 (505,226) 6,070
63,494,552 282,133,076 345,627,628 (13,507,763) 3,995,444 2,828,342
71,713,889$ 311,301,231$ 383,015,120$ (10,566,250)$ 3,490,218$ 2,834,412$
City of Manchester New HampshireFor the Fiscal Year Ended June 30, 2003
Primary Government
53
Component UnitsNet (Expense) Revenue and Changes in Net Assets (Deficits)

Balance SheetGovernmental Funds
Other TotalCapital Governmental Governmental
General Projects Funds Funds
AssetsCash and cash equivalents 62,840,860$ 36,594$ 2,930,526$ #### 65,807,980$ Restricted cash and cash equivalents 2,074,460 3,263,682 #### 5,338,142 Investments 511,328 15,667,727 #### 16,179,055 Receivables, net of allowances
for collection losses 20,096,729 10,748 4,610,474 #### 24,717,951 Prepaid items 4,099 #### 4,099 Due from other funds 10,493,960 #### 10,493,960 Inventories 589,385 #### 589,385
Total Assets 96,610,821$ -$ 47,342$ -$ 26,472,409$ #### 123,130,572$
Liabilities and Fund Equity
LiabilitiesAccounts and warrants payable 4,672,490$ 2,761,467$ 3,643,140$ #### 11,077,097$ Accrued liabilities 1,397,348 615,000 65,590 #### 2,077,938 Insurance claims payable 804,454 #### 804,454 Due to other funds 5,039,968 2,074,019 #### 7,113,987 Due to Manchester School District 23,550,478 #### 23,550,478 Deferred revenue 17,190,758 2,987,734 #### 20,178,492 Taxes collected in advance 26,186,396 #### 26,186,396 Other 77,725 #### 77,725
Total Liabilities 73,801,924 8,416,435 8,848,208 #### 91,066,567
Fund Equity #REF! ####Fund balances
Reserved forEncumbrances 1,272,469 1,305,156 559,565 #### 3,137,190 Cemetery and other trust funds 11,925,652 #### 11,925,652 Library 2,655,562 #### 2,655,562 Inventory 589,385 #### 589,385 Advances 1,623,865 #### 1,623,865 Workers' compensation 2,964,110 #### 2,964,110
Designated forHealth insurance 1,879,840 #### 1,879,840 General liability insurance 711,195 #### 711,195 Special revenue 848,437 848,437 Tax rate stabilization 1,981,568 1,981,568 Revenue stabilization 9,633,624 #### 9,633,624
Unreserved, reported in: ####General fund 1,304,404 1,304,404 Capital projects (9,674,249) (9,674,249) Special revenue 2,483,422 #### 2,483,422
Total Fund Equity 22,808,897 (8,369,093) 17,624,201 #### 32,064,005
Total Liabilities and Fund Balances 96,610,821$ 47,342$ 26,472,409$ #### 123,130,572$
Amounts reported for governmental activities in the statement of net assets are different because:Capital assets used in governmental activities are not financial resources and, therefore, are not reported in the funds. 173,781,497Pension asset created in governmental activities is not a financial resource and, therefore, is not reported in the funds. 17,857,717Other long-term assets are not available to pay for current period expenditures and, therefore, are deferred in the funds. 1,274,131Long-term liabilities consisting of bonds payable are not due and payable in current period and, therefore,are not reported in the funds. (152,589,546)Long-term liabilities consisting of accruals are not due and payable in the current period and, therefore,are not reported in the funds. (673,915)
71,713,889$ See accompanying notes.
54
City of Manchester, New HampshireJune 30, 2003

Statement of Revenues,Expenditures and Changes in Fund Balances (Deficit)Governmental Funds
Capital Other TotalGeneral Projects Governmental Governmental
Fund Fund Funds FundsRevenues
Taxes 59,369,549$ # 59,369,549$ Federal and state grants and aid 7,549,154 4,054,014$ 9,152,463$ 20,755,631Nonenterprise charges for sales and services 4,491,647 122,228 4,613,875Licenses and permits 20,521,738 20,521,738Interest 736,111 351,414 1,087,525Contributions 117,529 117,529Net loss on sale of securities 75,061 75,061Other 8,594,706 740,482 # 9,335,188#
Total Revenues 101,262,905 4,054,014 10,559,177 115,876,096
Expenditures #Current:
General government 18,658,422 5,332,620 6,732,051 30,723,093Public safety 35,444,763 2,167,584 1,294,921 38,907,268Health and sanitation 2,462,857 10,560 1,479,154 3,952,571Highway and streets 19,902,962 7,393,925 1,839,580 29,136,467Welfare 1,352,284 20,942 1,373,226Education 2,145,815 19,134 100,185 2,265,134Parks and recreation 2,992,399 881,131 839,448 4,712,978Cemetery Trust 34,000 34,000Investment management fee 23,511 23,511
Debt service:Principal retirement 10,890,802 10,890,802Interest 5,181,212 5,181,212
Total Expenditures 99,031,516 15,804,954 12,363,792 127,200,262
Excess (Deficiency) of revenues over expenditures 2,231,389 (11,750,940) (1,804,615) (11,324,166)
Other Financing Sources (Uses)Transfers in 561,912 2,025,842 # 2,587,754Transfers out (1,790,165) (2,278) (789,242) # (2,581,685)
Total Other Financing Sources (Uses) (1,228,253) (2,278) 1,236,600 6,069
Net Change in Fund Balances 1,003,136 (11,753,218) (568,015) (11,318,097)
Fund Balance , beginning 21,805,761 3,384,125 18,192,216 43,382,102
Fund Balance (Deficit), ending 22,808,897$ (8,369,093)$ 17,624,201$ 32,064,005$
See accompanying notes.
City of Manchester, New HampshireYear Ended June 30, 2003
55

56
This Page Intentionally Left Blank

General FundStatement of Revenues, Expenditures and Changesin Fund Balances - Budget and Actual (Budget Basis)
Variance with Final Budget
Original Revised PositiveBudget Budget Actual (Negative)
RevenuesTaxes 60,069,227$ 60,069,227$ 59,031,492$ (1,037,735)$ Federal and state grants and aid 6,673,980 6,673,980 6,748,291 74,311Nonenterprise charges for sales and services 4,646,081 4,646,081 4,491,647 (154,434)Licenses and permits 20,886,977 20,886,977 20,537,970 (349,007)Interest 1,816,000 1,816,000 736,111 (1,079,889)Other 9,385,445 9,385,445 7,928,112 (1,457,333)
Total Revenues 103,477,710 103,477,710 99,473,623 (4,004,087)
Expenditures
Current:General government 20,413,968 20,830,650 18,770,932 2,059,718Public safety 35,754,088 35,634,088 34,690,543 943,545Health and sanitation 2,805,523 2,805,523 2,475,542 329,981Highway and streets 21,077,677 20,843,113 20,473,882 369,231Welfare 1,476,875 1,476,875 1,345,431 131,444Education 2,306,852 2,283,783 2,148,845 134,938Parks and recreation 3,230,547 3,191,498 3,018,319 173,179
Debt service:Principal retirement 10,890,802 10,890,802 10,890,802 Interest 5,181,213 5,181,213 5,181,213
Total Expenditures 103,137,545 103,137,545 98,995,509 4,142,036
Excess of revenues over expenditures 340,165 340,165 478,114 137,949
Other Financing Sources (Uses)Transfers in 350,000 350,000 306,169 (43,831)Transfers out (1,790,165) (1,790,165) (1,790,165)
Total Other Financing Sources (Uses) (1,440,165) (1,440,165) (1,483,996) (43,831)
Net Change in Fund Balances (1,100,000)$ (1,100,000)$ (1,005,882)$ 94,118$
See accompanying notes.
City of Manchester, New HampshireYear Ended June 30, 2003
57

Proprietary Funds Statement of Net Assets
Water Works EPD Aviation Non-MajorFund Fund Fund Funds Total
ASSETSCurrent assets:
Cash and cash equivalents 24,057,207$ 24,057,207$ Restricted cash and cash equivalents 4,418,497$ 673,924 77,731,609$ 82,824,030 Restricted investments 3,245,877 3,245,877 Receivables, net of allowances
for collection losses 2,432,277 4,608,296 17,955,778 197,095$ 25,193,446 Prepaid items 253,100 587,000 30,736 870,836 Due from other funds 394,467 394,467 Inventories 735,445 46,088 101,908 5,908 889,349
Total current assets: 8,233,786 29,385,515 99,622,172 233,739 137,475,212
Noncurrent assets:Capital assets, net, where applicable,
of accumulated depreciation 69,096,428 110,984,726 333,851,942 4,025,183 517,958,279 Deferred charges 2,015,596 38,928 2,054,524 Receivables 5,741,227 5,741,227 Other receivables 285,285 285,285
Total noncurrent assets: 69,096,428 117,011,238 335,867,538 4,064,111 526,039,315
Total Assets 77,330,214$ 146,396,753$ 435,489,710$ 4,297,850$ 663,514,527$
LiabilitiesCurrent liabilities
Accounts and warrants payable 516,000$ 1,085,248$ 6,874,207$ 102,857$ 8,578,312$ Retainage payable 394,938 1,725,665 2,120,603 Accrued liabilities 630,065 1,539,449 10,208,704 34,419 12,412,637 Due to other funds 671,112 2,025,492 2,696,604 Deferred revenue 73,201 73,201 Bonds and notes payable 832,233 5,790,454 5,050,000 121,600 11,794,287 Compensated absences 930,549 234,532 119,190 151,815 1,436,086 Other 821,426 47,409 868,835
Total Current liabilities 4,401,385 9,092,030 24,050,967 2,436,183 39,980,565
Noncurrent liabilitiesBonds payable 9,424,225 27,037,247 266,203,722 824,400 303,489,594 Notes Payable 1,753,431 6,766,600 8,520,031 Deferred Revenue 129,684 18,794 148,478 Other 74,628 74,628
Total Noncurrent liabilities 11,177,656 33,803,847 266,408,034 843,194 312,232,731
Total Liabilities 15,579,041 42,895,877 290,459,001 3,279,377 352,213,296
Net AssetsInvested in Capital Assets,
net of related debt 60,484,925 71,390,425 90,208,836 3,079,183 225,163,369 Restricted 5,214,905 278,986 36,263,714 41,757,605 Unrestricted (3,948,657) 31,831,465 18,558,159 (2,060,710) 44,380,257
Total Net Assets 61,751,173$ 103,500,876$ 145,030,709$ 1,018,473$ 311,301,231$
58
City of Manchester, New HampshireJune 30, 2003
Business-type Activities-Enterprise FundsMajor

Proprietary Funds Combining Statement of Revenues, Expenses and Changes in Fund Net Assets
Water Works EPD Aviation Non-majorFund Fund Fund Funds Total
Operating RevenuesCharges for goods and services 10,032,235$ 11,225,665$ 32,342,749$ 2,366,092$ 55,966,741$ Other 3,044,487 51,928 3,096,415
Total Operating Revenues 10,032,235 11,225,665 35,387,236 2,418,020 59,063,156
Operating ExpensesPersonnel services 4,681,087 2,574,297 4,237,332 1,471,774 12,964,490 Plant maintenance 512,478 1,700,390 2,182,001 83,703 4,478,572 Light/heat and power 835,177 1,631,374 1,585,245 281,411 4,333,207 General and administrative 1,371,017 509,004 12,188,102 270,289 14,338,412 Depreciation and amortization 2,126,843 4,525,236 10,426,537 331,068 17,409,684
Total Operating Expenses 9,526,602 10,940,301 30,619,217 2,438,245 53,524,365
Operating Income (Loss) 505,633 285,364 4,768,019 (20,225) 5,538,791
Non-Operating Revenues (Expenses), netSoundproofing program grant 6,768,504 6,768,504 Soundproofing program expense (6,516,717) (6,516,717) Interest income 313,084 356,016 2,252,535 2,921,635 Interest expense (532,366) (1,091,910) (12,974,092) (83,433) (14,681,801) Reimbursements of bond interest expense 285,507 285,507 Finance and service charges 106,722 (212,078) (105,356) Passenger facility charges 4,632,085 4,632,085 Customer facility charges 2,030,963 2,030,963 Rent and other income (43,031) 38,899 (4,132) Donation of land (723,590) (723,590) Loss on disposal of fixed assets (192,410) (20,269) (4,459) (217,138)
Total Non-operating Expenses (454,723) (1,087,524) (4,023,259) (44,534) (5,610,040)
Net income (loss) before capital contributions 50,910 (802,160) 744,760 (64,759) (71,249) - Capital Contributions 2,673,613 1,037,870 25,527,921 29,239,404
Change in Net Assets 2,724,523 235,710 26,272,681 (64,759) 29,168,155
Fund Net Assets, beginning of year 59,026,650 103,265,166 118,758,028 1,083,232 282,133,076
Fund Net Assets, end of year 61,751,173$ 103,500,876$ 145,030,709$ 1,018,473$ 311,301,231$
59
City of Manchester, New HampshireYear Ended June 30, 2003
MajorBusiness-type Activities-Enterprise Funds

Proprietary Funds Statement of Cash Flows
Water Works EPD Aviation Non-MajorFund Fund Fund Funds Total
Cash Flows from Operating ActivitiesCash received from customers 9,572,978$ 11,646,798$ 34,056,058$ 2,275,939$ 57,551,773$ Cash payments for goods and services (2,877,398) (4,578,587) (16,434,972) (648,942) (24,539,899) Cash payments to employees for services (4,670,004) (2,466,793) (4,215,003) (1,449,451) (12,801,251) Other operating revenues 74,982 74,982
Net Cash Provided by Operating Activities 2,025,576 4,601,418 13,406,083 252,528 20,285,605
Cash Flows from Non-Capital and Related Financing ActivitiesAmounts from federal & state governments for soundproofing 6,768,504 - 6,768,504 Soundproofing related expenses (6,516,717) - (6,516,717) Passenger and customer facility charges 6,572,048 - 6,572,048 Interest paid on cash advances (27,238) (27,238) Short-term cash advance from City 671,112 76,344 747,456
Net Cash Provided by Non-Capital & Related Financing Activities 671,112 - 6,823,835 49,106 7,544,053
Cash Flows from Capital and Related Financing ActivitiesProceeds from State of New Hampshire Revolving Fund 1,753,431 3,590,705 - 5,344,136 Reimbursement of bond interest expenses 305,878 14,917 320,795 Payments for State of New Hampshire liability (4,932,750) - (4,932,750) Principal paid on bonds (866,585) (920,914) (4,465,000) (151,600) (6,404,099) Interest paid on bonds (532,366) (1,193,205) (10,103,368) (57,354) (11,886,293) Contributed capital by federal, state & local governments 2,673,613 1,556,022 20,431,718 - 24,661,353 Acquisition and construction of capital assets (5,666,378) (7,852,527) (56,195,373) (222,597) (69,936,875) Proceeds from sale of capital assets 115,000 115,000
Net Cash Used in Capital & Related Financing Activities (2,638,285) (9,446,791) (50,332,023) (301,634) (62,718,733)
Cash Flows from Investing ActivitiesSale of investment securities 648,893 - 648,893 Interest and dividends from investments 313,084 446,570 2,252,535 - 3,012,189
Net Cash Provided by Investing Activities 313,084 446,570 2,901,428 - 3,661,082
Net Increase (Decrease) in Cash and Cash Equivalents 371,487 (4,398,803) (27,200,677) - (31,227,993)
Cash and Cash Equivalents at Beginning of Year 4,047,010 29,129,934 104,932,286 - 138,109,230
Cash and Cash Equivalents at End of Year 4,418,497$ 24,731,131$ 77,731,609$ -$ 106,881,237$
Reconciliation of operating income (loss) to net cash provided by operating activities
Operating income (loss) 505,633$ 285,364$ 4,768,019$ (20,225)$ 5,538,791$ Adjustments to reconcile operating income (loss) to cash - provided by operating activities: -
Depreciation and amortization 2,126,843 4,525,236 10,426,537 331,068 17,409,684 Non-operating revenue 23,982 23,982
- Change in Assets and Liabilities -
(Increase) decrease in receivables (459,257) 264,865 (1,350,373) (3,235) (1,548,000) (Increase) decrease in inventories (11,799) 10,692 (101,908) - (103,015) Increase in prepaid expenses and other assets (163,179) (8,943) (412,939) (30,736) (615,797) Increase (decrease) in accounts payable (189,426) (800,642) (569,255) 15,198 (1,544,125) Increase (decrease) in accrued liabilities 214,782 305,541 604,478 (91,213) 1,033,588 Increase in compensated absences 11,083 19,305 22,329 22,323 75,040 Increase in Deferred Revenue 19,195 5,366 24,561 Decrease in interfund liabilities (9,104) (9,104)
Net Cash Provided by Operating Activities 2,025,576$ 4,601,418$ 13,406,083$ 252,528$ 20,285,605$ 0 0 0 0
Schedule of Noncash Investing, Capital and Financing ActivitiesTransfer of Debt to General fund 25,000 25,000 Donation of land 723,590 723,590
60
Major
Year Ended June 30, 2003City of Manchester, New Hampshire
Business-type Activities-Enterprise Funds

Fiduciary Funds Statement of Fiduciary Net Assets
Pension AgencyTrust Funds Fund
AssetsCash and cash equivalents 10,190,659$ Investments 83,463,697Receivables, net of allowances
for collection losses 436,709 1,077,836$ Other assets 8,927 Capital assets, net, where applicable,
of accumulated depreciation 240,975
Total Assets 94,340,967$ 1,077,836$
LiabilitiesAccounts and warrants payable 137,940$ Accrued liabilities 562,762 Due to other funds 1,077,836$
Total Liabilities 700,702 1,077,836$
Net AssetsHeld in trust for Employees' Retirement System 93,640,265$
See accompanying notes.
City of Manchester, New HampshireYear ended June 30, 2003
61

Fiduciary TrustsStatement of Changes in Fiduciary Net Assets
Pension Trust Funds
AdditionsContributionsEmployer 1,794,576$ Plan members 1,531,458
Total Contributions 3,326,034
Investment Gain (Loss)Net realized and unrealized depreciationin fair value of investments (10,175,748)
Interest 1,403,694 Dividends 1,067,951 Less investment expense (380,435)
Net Investment Loss (8,084,538)
Total Additions (Reductions) (4,758,504)
DeductionsBenefits paid directly to participants 6,566,563 Refunds of employee contributions 301,901 Administrative expenses 645,320
Total Deductions 7,513,784
Net Decrease (12,272,288)
Net Assets Held in Trust for Pension BenefitsBeginning of year 105,912,553 End of year 93,640,265$
City of Manchester New HampshireYear Ended June 30, 2003
62

NOTES TOFINANCIAL STATEMENTS

City of Manchester, New HampshireNotes to Financial Statements
June 30, 2003
1. Summary of Significant Accounting Policies
63
Reporting entity
The City of Manchester, New Hampshire, (the City) was incorporated in June of 1846 and operates as amunicipal corporation governed by an elected mayor and a fourteen (14) member aldermanic board.Accounting principles generally accepted in the United States of America require that the reportingentity include (1) the primary government, (2) organizations for which the primary government isfinancially accountable and (3) other organizations for which the nature and significance of theirrelationship with the primary government are such that exclusion would cause the reporting entity'sfinancial statements to be misleading or incomplete. The criteria provided in Government AccountingStandards Board Statement No. 14 have been considered and as a result, the component units discussedbelow are included in the City's reporting entities because of their operational significance and financialrelationship with the City.
Discretely presented component units
Manchester Development Corporation (“MDC”) - The MDC was created by the Board of Mayor andAldermen (“BMA”) as a public corporation for the purpose of developing economic opportunities forthe City. The MDC Board of Directors is comprised of twelve (12) members, all of whom shall benominated by the Mayor and confirmed by the Board of Aldermen of the City. Separate financialstatements are not available. MDC is presented as a governmental fund type.
Manchester School District (“District” or “MSD”) - The MSD is responsible for elementary andsecondary education within the government's jurisdiction. The fourteen (14) members of the schoolboard are elected by the voters. However, the District is fiscally dependent upon the government as thegovernment's BMA approves the District's budget, levies taxes (if necessary) and must approve any debtissuances. Other independent auditors audited the MSD, a June 30 year-end, and their report, datedSeptember 19, 2003, has been issued under separate cover. The District is presented as a governmentalfund type.
Manchester Transit Authority (“MTA”) - The MTA was created by the BMA to provide a public trans-portation system for the citizens of the City. A five-member board appointed by the BMA oversees theMTA. Other independent auditors audited the MTA, a June 30 year-end, and their report, dated August28, 2003, has been issued under separate cover. The MTA is presented as a proprietary fund type.
Complete financial statements of the individual component units for MSD and MTA may be obtaineddirectly from their administrative offices.
Manchester Development Corporation Manchester School District Manchester Transit AuthorityOne City Hall Plaza 196 Bridge Street 110 Elm StreetManchester NH 03104 Manchester NH 03104 Manchester NH 03101-2799

City of Manchester, New HampshireNotes to Financial Statements
June 30, 2003
1. Summary of Significant Accounting Policies (continued)
64
Blended Component Unit
City of Manchester Employees’ Contributory Retirement System (the "New System") - The New Sys-tem was created by the BMA for the purpose of administering the assets of the employees’ contributoryretirement system. The New System’s Board of Trustees consists of seven members, as follows: the CityFinance Officer, the Mayor, one person appointed by the Board of Aldermen, two citizens of the City -one appointed by the Mayor, one elected by the New System members and two New System membersalso elected by the New System members. Other independent auditors audited the New System, aDecember 31 year end, for the year ended December 31, 2002, and their report, dated March 14, 2003,has been issued under separate cover. The New System is presented as a pension trust fund.
Complete financial statements of the individual component units may be obtained directly from itsadministrative office.
City of Manchester Employees’Contributory Retirement System1045 Elm StreetManchester NH 03101
Government-wide and Fund Financial Statements
The government-wide financial statements (i.e., the statement of net assets and the statement of changesin net assets) report information on all of the non-fiduciary activities of the primary government and itsnon-blended component units. For the most part, the effect of interfund activity has been removed fromthese statements. Governmental activities, which normally are supported by taxes and intergovernmentalrevenues, are reported separately from business-type activities, which rely to a significant extent on feesand charges for support. Likewise, the primary government is reported separately from certain locallyseparate component units which the city is financially accountable for.
The statement of activities demonstrates the degree to which the direct expenses of a given function orsegment are offset by program revenues. Direct expenses are those that are clearly identifiable with aspecific function or segment. Program revenues include 1) charges to customers or applicants whopurchase, use, or directly benefit from goods, services, or privileges provided by a given function orsegment and 2) grants and contributions that are restricted to meeting the operational or capitalrequirements of a particular function or segment. Taxes and other items not properly included amongprogram revenues are reported instead as general revenues.
Separate financial statements are provided for governmental funds, proprietary funds, and fiduciaryfunds, even though the latter are excluded from the government-wide financial statements. Majorindividual governmental funds and major individual enterprise funds are reported as separate columns inthe fund financial statements.
Measurement Focus, Basis of Accounting, and Financial Statement Presentation
The government-wide financial statements are reported using the economic resources measurementfocus and the accrual basis of accounting, as are the proprietary fund and fiduciary fund financialstatements. Revenues are recorded when earned and expenses are recorded when a liability is incurred,

City of Manchester, New HampshireNotes to Financial Statements
June 30, 2003
1. Summary of Significant Accounting Policies (continued)
65
regardless of the timing of related cash flows. Property taxes are recognized as revenues in the year forwhich they are levied, provided an enforceable legal claim exists. Grants and similar items arerecognized as revenue as soon as all eligibility requirements imposed by the provider have been met.
Governmental fund financial statements are reported using the current financial resources measurementfocus and the modified accrual basis of accounting. Revenues are recognized as soon as they are bothmeasurable and available. Revenues are considered to be available when they are collectible within thecurrent period or soon enough thereafter to pay liabilities of the current period. For this purpose, thegovernment considers revenues to be available if they are collected within 60 days of the end of thecurrent fiscal period. Expenditures generally are recorded when a liability is incurred, as under accrualaccounting. However, debt service expenditures, as well as expenditures related to compensatedabsences and claims and judgments, are recorded when payable from current financial resources.
Property taxes when levied for, licenses, and interest associated with the current fiscal period are allconsidered to be susceptible to accrual and so have been recognized as revenues of the current fiscalperiod. In determining when to recognize intergovernmental revenues (grants and entitlements) the legaland contractual requirements of the individual programs are used as guidance. Revenues are recognizedwhen the eligibility requirements have been met. All other revenue items are considered to bemeasurable and available only when cash is received by the government.
The City reports the following major governmental funds:
The General Fund is the City’s primary operating fund. It accounts for all financial resources of thegeneral government, except those required to be accounted for in another fund.
The Capital Projects Fund accounts for financial resources to be used for capital expenditures or forthe acquisition or construction of capital facilities, improvements and/or equipment. Most of thecapital outlays are financed by the issuance of general obligation bonds. Other sources includecapital grants and low-interest state loans.
The City reports the following major proprietary funds:
The Water Works Fund accounts for the operations of the City’s water service for residential,commercial and industrial entities for the City and six surrounding communities. It is independent interms of its relationship to other City functions. It’s operations are financed from special assessmentsand direct charges to the users of the service.
The Environmental Protection Division (EPD) accounts for the operations of the City’s wastewatertreatment plant as well as all services related to the treatment of sewage for the City and threesurrounding communities. It’s operations are financed from special assessments and direct chargesto the users of the service.
Aviation Fund is used to account for the operations of the City’s airport which is operated by theDepartment of Aviation.

City of Manchester, New HampshireNotes to Financial Statements
June 30, 2003
1. Summary of Significant Accounting Policies (continued)
66
Additionally, the City reports the following fund types:
Permanent Trust Funds are used to account for assets, contributions and income earned oninvestments used to maintain the City’s cemeteries, endowment funds, and libraries.
The Pension Trust Funds account for the activities of the City’s two defined benefit pension plans,which accumulate resources for pension benefit payments to qualified employees.
The Agency Funds account for monies held as a custodian for outside groups and agencies.
As a general rule, the effect of interfund activity has been eliminated from the government-widefinancial statements. Exceptions to this general rule are charges between the enterprise funds andvarious other functions of the government. Elimination of these charges would distort the direct costsand program revenues reported for the various functions concerned.
Private-sector standards of accounting and financial reporting issued prior to December 1, 1989,generally are followed in both the government-wide and proprietary fund financial statements to theextent that those standards do not conflict with or contradict guidance of Governmental AccountingStandards Board. Governments also have the option of following subsequent private-sector guidance fortheir business-type activities and enterprise funds, subject to this private-sector guidance for theirbusiness-type activities and enterprise funds, subject to this same limitation. The City has elected tofollow subsequent private-sector guidance.
Amounts reported as program revenues include 1) charges to customers or applicants for goods,services, or privileges provided, 2) operating grants and contributions, and 3) capital grants andcontributions, including special assessments.
Proprietary funds distinguish operating revenues and expenses from nonoperating items. Operatingrevenues and expenses generally result from providing services in connection with a proprietary fund’sprincipal ongoing operations. The principal operating revenues of the proprietary funds are charges tocustomers for services. Operating expenses for the proprietary funds include the cost of operations andmaintenance, provision for doubtful accounts, and depreciation on capital assets. All revenues andexpenses not meeting this definition are reported as nonoperating revenues and expenses.
When both restricted and unrestricted resources are available for use, it is the City’s policy to userestricted resources first, then unrestricted resources as they are needed.
Accounting estimates
The preparation of financial statements in conformity with accounting principles generally accepted inthe United States of America requires management to make estimates and assumptions that affect thereported amounts of assets and liabilities and disclosures of contingent assets and liabilities at the date ofthe financial statements and the reported amounts of revenues and expenses during the reporting period.Actual results could differ from those estimates.

City of Manchester, New HampshireNotes to Financial Statements
June 30, 2003
1. Summary of Significant Accounting Policies (continued)
67
Cash equivalentsNew Hampshire Revised Statutes Annotated (“RSA”) Chapter 48:16 (“RSA 48:16”), as amended,establishes the policy the City must adhere to when investing City funds. With approval of the BMA, theFinance Officer, acting as Treasurer, may invest in obligations of the United States government, insavings bank deposits of banks incorporated under the laws of the State of New Hampshire (“the State”),in participation units of the New Hampshire Public Deposit Investment Pool (“NH-PDIP”), in certificatesof deposit of banks incorporated under the laws of the State, or in national banks located in NewHampshire or the Commonwealth of Massachusetts. RSA 48:16 does not allow the City to enter intoreverse repurchase agreements.
The City’s cash and cash equivalents represent short-term investments with an initial maturity of threemonths or less.
InvestmentsInvestments are stated at fair value using quoted market prices.
Capital AssetsCapital assets, which include property, plant, equipment, and infrastructure assets (e.g., roads, bridges,sidewalks, and similar items), are reported in the applicable governmental or business-type activitiescolumns in the government-wide and proprietary fund financial statements. Capital assets are defined bythe government as assets with an initial, individual cost of $5,000 or more and an estimated useful lifeequal to or in excess of three years. Such assets are recorded at historical cost or estimated historical costif purchased or constructed. Donated capital assets are recorded at fair value at the date of donation.
The costs of normal maintenance and repairs that do not add to the value of the asset or materiallyextend assets lives are not capitalized.
Property and equipment that has been purchased by governmental funds is recorded as expenditures inthe purchasing funds at the time of purchase or construction, and no depreciation expense is recorded.Major outlays for capital assets and improvements are capitalized as projects are constructed. Interestincurred during the construction phase of capital assets of business-type activities is included as part ofthe capitalized value of the assets con-structed. Net interest cost capitalized in the EnvironmentalProtection Division Fund and Aviation Fund amounted to approximately $29,000 and $1,212,000,respectively, for the year ended June 30, 2003.
Property, plant, and equipment of the City is depreciated using the straight-line method over thefollowing estimated useful lives:
Assets Years
Buildings 15-60Improvements 5-30Equipment 5-15Vehicles 3-10Interceptors (EPD) 50Infrastructure 20-50

City of Manchester, New HampshireNotes to Financial Statements
June 30, 2003
1. Summary of Significant Accounting Policies (continued)
68
Compensated absences
City employees accumulate vacation and sick leave hours for subsequent use or for payment upontermination or retirement. Vacation and sick leave expenses to be paid in future periods are accruedwhen earned in the government-wide, proprietary, and fiduciary fund financial statements.
The current liability for compensated absences, which represents the City’s commitment to fund suchcosts from future operations, is reported in the governmental funds’ accrued liabilities while the longterm portion is recorded in the government-wide statements. The liability reported as compensatedabsences includes vested and accumulated vacation leave and sick leave benefits that are not expected tobe liquidated with current fiscal year available financial resources. No liability is recorded fornonvesting accumulating rights to receive sick-pay benefits. However, a liability is recognized for thatportion of accumulated sick-leave benefits that it is estimated will be taken as terminal leave prior toretirement.
Long-term obligations
In the government-wide financial statements, and proprietary fund types in the fund financial statements,long-term debt and other long-term obligations are reported as liabilities in the applicable governmentalactivities, business-type activities, or proprietary fund type statement of net assets. Bond premiums anddiscounts, as well as issuance costs, are deferred and amortized over the life of the bonds using theeffective interest method. Bonds payable are reported net of the applicable bond premium or discount.Bond issuance costs are reported as deferred charges and amortized over the term of the related debt.
In the fund financial statements, governmental fund types recognize bond premiums and discounts, aswell as bond issuance costs, during the current period. The face amount of debt issued is reported asother financing sources. Premiums received on debt issuances are reported as other financing sourceswhile discounts on debt issuances are reported as other financing uses. Issuance costs, whether or notwithheld from the actual debt proceeds received, are reported as debt service expenditures.
Pension accounting
Pension Trust Funds:Employee contributions are recognized in the period in which the contributions are due.Employer contributions to the plan are recognized when due and the City has made a formalcommitment to provide the contributions. Benefits and refunds are recognized when due andpayable in accordance with the terms of each plan.
Government-wide Statements:The net pension obligation (asset), the cumulative difference between annual pension cost andthe City's contributions to the plans since 1986, is calculated on an actuarial basis consistent withthe requirements of Government Accounting Standards Board Statement No. 27 and isrecognized in the government wide financial statements. Expenditures are recognized when theyare paid or are expected to be paid with current available resources.
Funding Policy:The City makes annual contributions based upon annual actuarial determinations.

City of Manchester, New HampshireNotes to Financial Statements
June 30, 2003
1. Summary of Significant Accounting Policies (continued)
69
Encumbrances
Encumbrances represent commitments related to unperformed contracts for goods or services.Encumbrance accounting, under which purchase orders, contracts and other commitments for theexpenditure of resources are recorded to reserve that portion of the applicable appropriation, is utilizedin the governmental funds. Encumbrances outstanding at year-end are reported as a reservation of fundbalance as they do not constitute either expenditures or liabilities.
Inventory
Inventory is stated as lower of cost or market on a first-in, first-out basis.
Land held for resale
The City holds property for resale. The carrying value of this property is reported at the lower of cost ornet realizable value. When the property is sold the cost of the portion sold is charged to expenditure.
Fund Equity and Net Assets
In the Governmental-Wide Financial Statements, net assets are classified in the following categories:
Invested in Capital Assets, Net of Related Debt – This category groups all capital assets, includinginfrastructure, into one component of net assets. Accumulated depreciation and the outstandingbalances of debt that are attributable to the acquisition, construction or improvement of these assetsreduces this category.
Restricted Net Assets – This category presents external restrictions imposed by creditors, grantors,contributors or laws or regulations of other governments and restrictions imposed by law throughconstitutional provisions or enabling legislation.
Unrestricted Net Assets – This category represents the net assets of the City, which are not restrictedfor any project or other purpose.
In the fund financial statements, fund balances of governmental funds are classified in three separatecategories. The two categories, and their general meanings, are as follows:
Reserved fund balance - indicates that portion of fund equity which has been legally segregated forspecific purposes.
Undesignated and unreserved fund balance - indicates that portion of fund equity which isavailable for appropriation and expenditure in future periods.

City of Manchester, New HampshireNotes to Financial Statements
June 30, 2003
2. Reconciliation of Government-Wide and Fund Financial Statements
70
Explanation of certain differences between the governmental fund balance sheet and the government-wide statement of net assets
The governmental fund balance sheet includes a reconciliation between fund balance – totalgovernmental funds and net assets – governmental activities are reported in the government-widestatement of net assets. One element of that reconciliation explains that “other long-term assets are notavailable to pay for current period expenditures, and therefore, are not reported in the funds.” Thedetails of the $1,274,131 difference consisting of current assets are as follows:
Accounts receivable:Trade $ 944,703
Deferred professional fees:Underwriters’ discount and Cost of Issuance 329,428
Net adjustment to increase fund balance – total governmental fundsto arrive at net assets – governmental activities $ 1,274,131
Another element of that reconciliation explains that “long-term liabilities, including bonds payable, arenot due and payable in the current period and therefore are not reported in the funds.” The details of the$(152,589,546) difference consisting of long-term debt are as follows:
Bonds payable: $ (118,936,695)Less: Deferred loss on refunding (to be amortized as
interest expense) 738,270Add: Deferred charge for refunding premium (to be
amortized over life of debt) (135,278)Deferred discount on pension obligation (to be amortized as interest expense) (549,000)Capital appreciation bonds (5,136,395)Compensated absences (6,328,390)Insurance claims (4,135,101)Landfill closure and post-closure care (18,106,957)
Net adjustment to reduce fund balance – total governmental fundsto arrive at net assets – governmental activities $ (152,589,546)

City of Manchester, New HampshireNotes to Financial Statements
June 30, 2003
2. Reconciliation of Government-Wide and Fund Financial Statements (continued)
71
The details of the $(673,915) difference consisting of current accruals are as follows:
Accrued interest $ (3,067,544)Due to School District 427,215Deferred revenue 1,966,414Net adjustment to increase fund balance – total governmental funds
to arrive at net assets – governmental activities $ (673,915)
Explanation of certain differences between the governmental fund statement of revenues, expenditures,and changes in fund balances and the government-wide statement of activities
The governmental fund statement of revenues, expenditures, and changes in fund balances includes areconciliation between net changes in fund balances – total governmental funds and changes in netassets of governmental activities as reported in the government-wide statement of activities. Oneelement of that reconciliation explains that “Governmental funds report capital outlays as expenditures.However, in the statement of activities the cost of those assets is allocated over their estimated usefullives and reported as depreciation expense.” The details of this $151,438 difference are as follows:
Capital outlay $ 8,347,013Asset retirements (17,887)Depreciation expense (8,177,688)Net adjustment to increase net changes in fund balances -
total governmental funds to arrive at changes in net assetsof governmental activities $ 151,438

City of Manchester, New HampshireNotes to Financial Statements
June 30, 2003
2. Reconciliation of Government-Wide and Fund Financial Statements (continued)
72
Another element of that reconciliation states that “the issuance of long-term debt (e.g., bonds, leases)provides current financial resources to governmental funds, while the repayment of the principal oflong-term debt consumes the current financial resources of governmental funds. Neither transaction,however, has any effect on net assets. Also, governmental funds report the effect of issuance costs,premiums, discounts, and similar items when debt is first issued, whereas these amounts are deferredand amortized in the statement of activities.” The details of this $16,867,785 difference are as follows:
Long-term liabilities issued or incurred:Less series 2001 A discounts and COI amortization $ (3,609)Less series 2001 B discounts and COI amortization (6,141)Less series 2001 C discounts and COI amortization (5,560)Less series 2001 C discounts and COI amortization 195,244Less series 2001 B deferred loss on refinancing (49,218)Add series 2001 B premium 30,500Add series 2001 B refunding premium (153,315)Add series 2001 B refunding premium 9,019General obligation debt-Aggregation fund transfer (25,000)
Principal repayments:General obligation debt-City portion 10,890,802General obligation debt-MSD portion reimbursed 5,985,063
Net adjustment to decrease net changes in fund balances -total governmental funds to arrive at changes in net assets ofgovernmental activities $ 16,867,785
Another element of that reconciliation states that “Some expenses reported in the statement of activitiesdo not require the use of current financial resources and therefore are not reported as expenditures ingovernmental funds.” The details of this $2,724,348 difference are as follows:
Prepaid Pension Asset $ (653,531)Long-term liabilities incurred:
Risk reserve (64,020)Landfill reserve 3,402,780Capital appreciation bonds reserve 851,235Compensated absences (909,898)Accrued interest 97,782
Net adjustment to decrease net changes in fund balances -total governmental funds to arrive at changes in net assets ofgovernmental activities $ 2,724,348
City of Manchester, New HampshireNotes to Financial Statements
June 30, 2003
3. Stewardship, Compliance and Accountability
73
A. Budgets and Budgetary Accounting
Pursuant to the City’s Charter, Section 6.01, the City adopts an annual budget for all General Fundfunctions and certain enterprise functions (the Water Works enterprise fund operates on anonappropriated budgetary basis). The legal level of budgetary control is the department level. Thespecial revenue and capital project funds are appropriated through a five-year capital improvement plan.
All portions of the annual City budget and the MSD budget are prepared under the direction of theMayor. The Mayor establishes the procedures applicable to the preparation and adoption of the annualbudget. Budgets include all proposed expenditures and the proposed use of all anticipated revenues. Alldepartments, agencies, and officers submit detailed statements of departmental budget requests to theMayor per established procedures.
The Mayor develops budget recommendations on appropriations and revenues and submits therecommendations to the BMA on or before the last day of March of each year. Departmentalappropriations are made on a bottom-line basis. Benefits and non-departmental items are appropriatedapart from the departmental budgets.
The Finance Committee of the BMA reviews the proposed budget recommendations presented by theMayor. The BMA may increase, reduce or reject any item in the budget submitted by the Mayor. Apublic hearing is required to be conducted. A majority vote of the BMA is required to adopt the budgetappropriation resolutions and is to be completed no later than the second Tuesday in June. The Mayorhas line item veto authority.
If the BMA fail to adopt appropriation resolutions, the budget, as originally submitted by the Mayor,shall become the budget.
If during the fiscal year the Mayor certifies, after consultation with and verification by the FinanceOfficer, that there are available for appropriation revenues in excess of those estimated in the budget, theBMA may make supplemental appropriations for the year up to the amount of such excess, afterobserving the budget procedures set forth in section 6.04 of the City Charter. There were no additionalappropriations during the year.
If at any time during the fiscal year it appears probable to the Mayor, after consultation with andverification by the Finance Officer, that the revenues or fund balances available will be insufficient tofinance the expenditures for which appropriations have been authorized, the Mayor shall report to theBMA without delay, indicating the estimated amount of the deficit, any remedial action taken by theMayor and recommendations as to any other steps to be taken. The BMA shall then take such furtheraction as it deems necessary to prevent or reduce any deficit and for that purpose it may reduce one ormore appropriations.
The legal level of control for budgetary is established by object categories within the departmentalbudgets. Departmental budget transfers from one object category to another must be approved by theFinance Officer prior to approval of the BMA. The Finance Officer is responsible for establishingcontrols related to the management and monitoring of the budget to prevent expenditures fromexceeding budgeted appropriations.

City of Manchester, New HampshireNotes to Financial Statements
June 30, 2003
3. Stewardship, Compliance and Accountability (continued)
74
Encumbrance accounting is employed in governmental funds. On the GAAP basis, encumbrances (e.g.purchase orders, contracts) outstanding at year end are reported as reservations of fund balances and donot constitute expenditures or liabilities because the commitments will be reappropriated and honoredduring the subsequent year.
The City employs certain accounting principles for budgetary reporting purposes that differ from aGAAP basis. The Statements of Revenues and Expenditures - Budgetary Basis, presents the “actual”results to provide a comparison with the budgets.
The major differences between the budgetary basis and the GAAP basis are:
(a) Tax revenues are recorded when invoiced (budgetary), as opposed to when susceptible to accrual(GAAP).
(b) Encumbrances outstanding at year-end do not represent GAAP expenditures or liabilities butrepresent budgetary accounting controls. Governmental fund budgets are maintained on the modifiedaccrual basis of accounting except that budgetary basis expenditures include purchase orders andcontracts (encumbrances) issued for goods or services not received at year end. Encumbrances arerecorded to reserve a portion of fund balance in the governmental fund types for commitments for whichno firm liability exists.
B. Budget/GAAP Reconciliation
Reconciliation of the reported revenues and expenditures of the general fund between the budgetarybasis and the GAAP basis are presented below:
Revenues ExpendituresStatement of revenues and expenditures -
budgetary basis 99,473,623$ 98,995,509$ Central Business District 224,867 225,000 Riverfront reimbursements 570,420 Civic Center revenue sharing 226,091 Current year encumbrances (16,232) (1,272,469) State retirement contributions 800,863 800,863 Tax revenues of 2002 recognized in 2003 896,948 Tax revenues of 2003 deferred until 2004 (783,758) Loss on disposal of capital assets (129,917) Prior year encumbrances adjustment (417) Expenditures of prior year encumbrances 283,030
Statement of revenues, expenditures and changes in fund balances (in conformity with GAAP) 101,262,905$ 99,031,516$

City of Manchester, New HampshireNotes to Financial Statements
June 30, 2003
4. Cash, Cash Equivalents and Investments
75
Primary Government
Cash and cash equivalents consist of the following types of accounts at June 30, 2003.
Cash & Cash Equivalents PrimaryGovernment
ComponentUnits
Restricted Deposits $10,273,830 $ 34,398Deposits 853,250 864,667
(1) Repurchase Agreements 122,713,199 115,474(1) Money Market / Index Funds 30,819,890(1) NH - PDIP Unclassified 22,753,364(1) MDC – Vanguard/BNH Portfolio Trust 754,279
$ 187,413,533 $1,768,818(1) See categorization under investments
Investments $ 28,789,032 0
The City pools substantially all cash, except for separate cash accounts, which are maintained inaccordance with legal restrictions.
Written contracts relative to third party holders of collateral or establishing each party’s rights withregard to repurchase agreements are entered into by the City. Banks through which repurchase notes arewritten maintain their collateral in an investment book entry account with the Federal Reserve. Forcertain contracts collateral is separate from the bank’s assets, while for other contracts it is not separate.Repurchase agreements are entered into only with financial institutions; no brokers or dealers areinvolved in these transactions. The following tables present collateral information for the City’s depositsfor all funds, as well as the City’s component units.
Category A: Fully insured or collateralized with securities held by the City or its agent in the City’sname.
Category B: Collateralized with securities held by the pledging financial institution’s trustdepartment or agent in the City’s name.
Category C: Uncollateralized
Category Total Bank CarryingA B C Balance Amount
Pooled DepositsDemand deposits 6,582,280$ 9,945$ 6,592,225$ 1,717,917$
Restricted Deposits 10,273,830 35,398 10,309,228 10,309,228
Total Deposits 16,856,110$ -$ 45,343$ 16,901,453$ 12,027,145$

City of Manchester, New HampshireNotes to Financial Statements
June 30, 2003
4. Cash, Cash Equivalents and Investments (continued)
76
In accordance with GASB Statement 3, investments are classified as to risk by the three categoriesdescribed below:
Category l: Insured or registered in the City’s name, or securities held by the City or itsagent in the City’s name.
Category 2: Uninsured and unregistered, with securities held by the counter-party’s trustdepartment or agent in the City’s name.
Category 3: Uninsured and unregistered, with securities held by the counter-party or byits trust department or agent but not in the City’s name.
Category Carry and Fair1 2 3 Uncategorized (1) Value
InvestmentsUS Treasury Notes 3,879,552$ 3,879,552$ US Government Securities 996,753$ 996,753 Corporate Bonds 4,211,539 4,211,539 Common Stocks 1,358,576 1,358,576 Index Funds 13,237,238$ 13,237,238 Equity Mutual Funds 44,925 44,925 Fixed Inc Mutaul Funds 124,630 124,630 Mortgage-Back 1,689,942 1,689,942
Total Investments -$ 3,879,552$ 6,566,868$ 15,096,735$ 25,543,155$
Cash Equivalents Repurchase Agreements 125,958,076$ 125,958,076$
Non-Categorized Items (2) Index Funds 30,819,890 NH - PDIP Unclassified 22,753,364 Total Cash Equivalents -$ 125,958,076$ -$ -$ 179,531,330$
Grand Total -$ 129,837,628$ 6,566,868$ 15,096,735$ 205,074,485$
(1) Funds are not subject to investment classification because specific securities related to the City cannot be identified
(2) The amounts are not subject to risk categorization since the City does not own identifiablesecurities.

City of Manchester, New HampshireNotes to Financial Statements
June 30, 2003
4. Cash, Cash Equivalents and Investments (continued)
77
At year end, the CRS Pension Trust’s cash balance was as follows:
Cash and cash equivalents consist of the following types of accounts at December 31, 2002.
Cash & Cash Equivalents CRS PensionTrust
Deposits $ 804,485(1) See categorization under investments
Investments $ 74,099,597
At year end, the CRS Pension Trust’s investment balances were as follows:
Carry and FairUncategorized (1) Value
InvestmentsEquity funds 60,582,597$ 60,582,597$ Fixed income 11,247,364 11,247,364 Emerging market funds 1,869,155 1,869,155 Cash and equivalents 400,481 400,481
Total Investments 74,099,597$ 74,099,597$
(1) Funds are not subject to investment classification because specific securities related to the Citycannot be identified.

City of Manchester, New HampshireNotes to Financial Statements
June 30, 2003
5. Taxes and Abatements
78
The principle tax of the City is the tax on real property. The State has no cap or limit as to the rate oramount of tax a municipality may raise. The municipality’s annual property tax rate is established by theCommissioner of the Department of Revenue Administration of the State, based on reports filed with theState. A single tax is levied for general, county and school purposes. The “assessment year” for taxingpurposes runs from April 1 to March 31 of the following year.
The City bills and collects its property taxes in two installments. The levy dates are June 1 andNovember 1 and the due dates for these semi-annual tax billings are July 1 and December 1. Propertytaxes are recorded as a receivable when billed, net of estimated allowance for abatements. Property taxrevenues have been recorded using the modified accrual basis of accounting as described in Note 1.
Real property (land and buildings) is subject to a lien for the taxes assessed upon it (subject to anyparamount federal lien and subject to bankruptcy and insolvency laws). The City places a lien ondelinquent property taxes prior to May 1 of the following assessment year. From the date of the tax lien,a two-year period of redemption is allowed the owner, during which time payment of taxes, interest andcosts will be accepted and the lien released.
Interest accrues on delinquent taxes at a rate of 12 percent per annum from the due date to the date ofpayment. During the redemption period, 18 percent interest per annum is charged. Beyond the two-yearperiod of redemption the City has the right to foreclose on properties for which taxes have not been paid.Properties are deeded to the City unless either the lien has been sold by the City, or the City has notifiedthe tax collector that it will not accept the deed because acceptance could result in liability underenvironmental statutes imposing strict liability on owners. Except for any paramount federal lien andsubject to bankruptcy and insolvency laws, tax liens take precedence over all other liens, and taxcollector’s deeds are free and clear of all encumbrances.
In December 1997, the New Hampshire Supreme Court declared that the property tax to fund educationis a State tax, and therefore must be administered in a manner that is equal in valuation and uniform inrate throughout the State.
Chapter 17 of the Laws of 1999 became effective in 1999. The law includes a definition of “adequateeducation” for New Hampshire schools and establishes an “Education Trust Fund” and a formula forproviding state financial assistance to local school districts.
The primary means of State funding for the Education Trust fund is a uniform statewide property taxunder which some of the levies from more prosperous (“property rich” or “donor”) communities will becollected by the State and redistributed to less affluent (“property poor” or “recipient”) school districts.The law initially established a uniform tax rate of $6.60 per thousand of total equalized value (notincluding utility property or local exemptions) but has been adjusted to $5.80 for 2003. The new stateaid property tax is assessed and collected in virtually the same manner in which property taxes havebeen administered in the past with one primary exception, donor communities will be required to sendamounts in excess of what is required locally for an adequate education to the State for redistribution torecipient districts. The MSD is a recipient district.

City of Manchester, New HampshireNotes to Financial Statements
June 30, 2003
6. Receivables
79
Primary Government
The receivables from the State of New Hampshire and other governmental entities represent theircontractual commitment to reimburse the City for the repayment of debt incurred to build its wastewatertreatment and related facilities.
7. Interfund Receivables, Payables and Transfers
Due from/to other funds consist of the following at June 30, 2003:
Receivable Fund Payable Fund AmountGeneral Fund Agency 1,077,836$
Special Revenue:Other grantsHUD Section 108 1,573,984CDBG 105,568
Enterprise:Recreation 401,627 Water Works 671,112 Aggregation 1,623,865
10,493,960
Water Works Expendable Trust 394,467
Total - All Funds 10,888,427$
General CIP MWW EPD Aviation Other Total
Due from Warrants 15,166,804$ $15,166,804Due from State of NH &other local governments 2,459,292 7,229,020$ 654,471$ 10,342,783Prior year tax liens 716,177 716,177Tax titles 975,602 975,602Due fromfederal government 69,705 13,829,513 391,865$ 14,291,083Accounts receivable-trade 1,310,502 10,748$ 2,192,558$ 2,776,263 3,406,794 209,800 9,906,665Notes receivable 4,194,609 4,194,609Other 507,362 239,719 559,820 65,000 11,295 1,383,196
Total gross receivables 21,135,739 10,748 2,432,277 10,634,808 17,955,778 4,807,569 56,976,919
Allowance forcollection losses (1,039,010) (1,039,010)
Total net receivables 20,096,729$ 10,748$ 2,432,277$ 10,634,808$ 17,955,778$ 4,807,569$ 55,937,909$

City of Manchester, New HampshireNotes to Financial Statements
June 30, 2003
7. Interfund Receivables, Payables and Transfers (continued)
80
The balances of $671,112, $401,627 and $1,623,865 due from the three enterprises to the general fundare the result of short-term advances. The balance of $394,467 is also a result of a short-term advance.All remaining balances resulted from the time lag between the dates payments occur between funds forvarious activities.
Interfund transfers during the year ended June 30, 2003 were as follows:
Transfers are used to account for unrestricted revenues collected mainly in the general fund to financevarious programs accounted for in other funds in accordance with budget authorizations.
Due to / from primary government and component units:
Receivable Entity Payable Entity AmountPrimary government - general fund Component unit - MDC 6,069$
Interfund transfers:
General Other Transfers out Fund Funds Total
General Fund 1,790,165$ 1,790,165$ Other Funds 555,843 233,399 789,242 Capital Projects 2,278 2,278
555,843$ 2,025,842$ 2,581,685$
Transfers In:

City of Manchester, New HampshireNotes to Financial Statements
June 30, 2003
8. Capital Assets
81
Governmental activitiesChanges in the governmental capital assets for the year ended June 30, 2003, were as follows:
Balance Balance
30-Jun-02 Additions Retirements Transfers 30-Jun-03Capital assets, not being depreciated
Land 18,365,631$ 402,581$ 215,596$ 18,983,808$ Construction-in-Progress 17,544,172 3,156,848 (1,798,970)$ 18,902,050
Total capital assets,
not being depreciated 35,909,803 3,559,429 - (1,583,374) 37,885,858
Capital assets, being depreciated
Buildings 168,715,492 860,600 1,100,000 170,676,092 Improvements
other than buildings 13,990,266 289,682 (47,700)$ 21,900 14,254,148 Equipment 4,906,664 1,042,665 - 111,595 6,060,924 Vehicles 15,038,936 1,255,776 (209,882) 16,084,830 Infrastructure 33,741,900 1,338,861 - 349,879 35,430,640
Total capital assets, being depreciated 236,393,258 4,787,584 (257,582) 1,583,374 242,506,634
Less accumulated depreciationBuildings 62,188,625 4,815,031 - - 67,003,656 Improvements
other than buildings 5,678,445 625,087 (29,813) - 6,273,719 Equipment 2,926,577 414,210 - 3,340,787 Vehicles 11,709,926 975,993 (209,882) - 12,476,037
Infrastructure 16,169,429 1,347,367 - - 17,516,796
Total accumulated depreciation 98,673,002 8,177,688 (239,695) - 106,610,995
Governmental Activities Capital Assets, Net 173,630,059$ 169,325$ (17,887)$ -$ 173,781,497$

City of Manchester, New HampshireNotes to Financial Statements
June 30, 2003
8. Capital Assets (continued)
82
Business-type Activities
Balance Balance
30-Jun-02 Additions Retirements Transfers 30-Jun-03Capital assets,
not being depreciatedLand 10,377,423$ 34,334$ (755,162)$ 27,020,942$ 36,677,537$ Construction-in-Progress 167,053,689 66,060,770 (1,106,470) (108,011,429) 123,996,560
Total capital assets, not being depreciated 177,431,112 66,095,104 (1,861,632) (80,990,487) 160,674,097
Capital assets,being depreciated
Buildings 206,597,915 3,641,731 (40,285) 34,375,695 244,575,056
Improvementsother than buildings 135,933,960 434,995 (3,927) 46,602,812 182,967,840
Equipment 82,299,676 1,760,957 (918,499) 11,980 83,154,114 Total capital assets,
being depreciated 424,831,551 5,837,683 (962,711) 80,990,487 510,697,010
Less total accumulated depreciation 137,512,522 16,982,916 (1,082,609) - 153,412,829
Business-typeCapital Assets, Net 464,750,141$ 54,949,871$ (1,741,734)$ -$ 517,958,278$

City of Manchester, New HampshireNotes to Financial Statements
June 30, 2003
8. Capital Assets (continued)
83
Discretely Reported Component Units
Property and equipment activity in the School District at June 30, 2003, consisted of the following:
Balance BalanceJuly 1, 2002 Increases June 30, 2003
Capital assets, being depreciatedPortable classrooms 843,608$ 843,608$ Instruments 63,000 20,561$ 83,561 Other machinery & equipment 6,956,919 1,369,496 8,326,415
Total capital assets, being depreciated 7,863,527 1,390,057 9,253,584
Less accumulated depreciationPortable classrooms 89,606 28,122 117,728 Instruments 6,943 6,499 13,442 Other machinery & equipment 3,264,535 598,307 3,862,842
Less total accumulated depreciation 3,361,084 632,928 3,994,012
Total Capital Assets being depreciated, Net 4,502,443$ 757,129$ 5,259,572$

City of Manchester, New HampshireNotes to Financial Statements
June 30, 2003
8. Capital Assets (continued)
84
Property and equipment activity in the MTA at June 30, 2003, consisted of the following:
Depreciation expense was charged to functions/programs of the primary government as follows:
Governmental Activities:General $ 2,523,367Public safety 738,592Highways and streets 2,486,016Health and welfare 99,336Education and library 1,528,734Parks 801,643
Total depreciation expense – governmental activities $ 8,177,688
Balance Balance
30-Jun-02 Additions Retirements Transfers 30-Jun-03Capital assets, not being depreciated
Land 129,109$ 129,109$
Total capital assets, not being depreciated 129,109 - - - 129,109
Capital assets, being depreciatedBuildings 1,807,598 1,807,598
Buses 5,785,833 50,670$ (182,153)$ 5,654,350 Equipment 1,477,212 6,862 (36,291) 1,447,783
Total capital assets being depreciated 9,070,643 57,532 (218,444) - 8,909,731
Less accumulated depreciation 6,596,241 531,800 (218,444) - 6,909,597
Total Capital Assets being depreciated, Net 2,603,511$ (474,268)$ -$ -$ 2,129,243$

City of Manchester, New HampshireNotes to Financial Statements
June 30, 2003
9. Long-Term Debt
85
Primary Government
The debt service requirements of the City’s outstanding general obligation bonds, revenue bonds andnotes payable at June 30, 2003 are as follows:
Governmental long-term debt: Capital
Fiscal year Appreciation Principal Interest Total
2004 414,226$ 15,434,450$ 8,008,206$ 23,856,882$ 2005 14,489,168 7,702,326 22,191,4942006 10,908,037 4,289,885 15,197,9222007 7,907,186 3,875,083 11,782,2692008 7,703,556 3,523,059 11,226,6152009-2013 30,937,831 12,848,997 43,786,8282014-2018 22,825,868 6,118,395 28,944,2632019-2023 5,345,718 1,749,380 7,095,0982024-2028 2,379,242 735,177 3,114,4192029-2031 1,005,639 120,793 1,126,432
Total 414,226$ 118,936,695$ 48,971,301$ 168,322,222$ Business-type Activities:
Fiscal year Principal Interest Total
2004 11,794,287$ 11,992,418$ 23,786,705$ 2005 12,206,014 13,148,206 25,354,220 2006 11,888,890 12,728,134 24,617,024 2007 10,909,656 12,293,890 23,203,546 2008 10,268,332 11,863,539 22,131,871 2009-2013 52,536,006 52,898,927 105,434,933 2014-2018 56,817,571 40,928,317 97,745,888 2019-2023 63,139,282 27,745,170 90,884,452 2024-2028 66,620,758 13,792,881 80,413,639 2029-2032 24,284,363 1,955,268 26,239,631
Debt Service Requirement 320,465,159 199,346,750 519,811,909
Less Bond Discount (3,507,495) (3,507,495) Less Deferred Loss (1,673,783) (1,673,783)
Total Business-type Activities 315,283,881$ 199,346,750$ 514,630,631$

City of Manchester, New HampshireNotes to Financial Statements
June 30, 2003
9. Long-Term Debt (continued)
86
Interest rates for the City’s outstanding GO bonds range from 2.05% to 8.875%. At June 30, 2003 theCity’s legal debt limit was $686,468,412. Authorized, but unissued, bonds as of June 30, 2003 amountedto $258,762,909. Unissued bonds at June 30, 2003 include authorization for an unprecedented amount ofinfrastructure improvements and economic development projects.
Over the course of the last year and a half, the City has worked methodically and conscientiously tostructure a proposal to package all of the school, additions and renovations that were to be included aspart of the Design / Build / Finance initiative in the total amount of $105,000,000. These SchoolFacilities Revenue Bonds represent the single largest General Fund issuance ever and are uniquebecause the debt service on the additions and renovations to the high schools is to be borne by thesending districts per the Tuition Agreements that were approved July 2003.
The City is preparing to bring MWW to market as an independent issuer of revenue bonds to finance theupgrade of the Water Treatment Plant and to fund Water Distribution System upgrades.
From the economic development perspective, the City has agreed to pay up to five million dollarstowards the costs of a garage at the Bridge and Elm Street location, where the construction of an upscaleapartment building has been proposed.
The second high profile economic development project is the construction of a baseball stadium at thesite of the former Singer Park. This stadium would be home to a AA baseball team and because theterms of the Master Lease Agreement contain provisions for ancillary development of a hotel and anapartment complex and retail space, the fiscal impact that this development could generate is enormous.Part of this authorization includes funding for improvements to Gill Stadium. This historic locale willbe homefield to the new baseball team as it debuts in April 2004, for its novice year in Manchester.Subsequently, the long overdue improvements will provide a state of the art facility and venue for futurehigh school and other league athletic events.
Along with the proposed sale of bonds to finance the baseball stadium and garage, there are a number ofother construction projects and infrastructure improvements that also will be funded for bridgerehabilitation, a new fire station, parks rehabilitation, streets, sewers, major building renovations, aplethora of projects and a new senior citizen center anticipated to improve and enhance the everyday lifeof the citizenry.
The business-type funds, EPD and Water Works comprise a large part of this total outstanding dollaramount with $29,412,099 and $48,500,000, respectively. Of those amounts, $34,412,099 is expected tobe financed through the State of New Hampshire DES-SRF program while the balance will providefunding for the Water Treatment Plant. Additionally, the most significant ongoing GO project is theSanitary Landfill Closure in the amount of $13,850,000, which is expected to be financed through theState DES-SRF program. The process has been substantially completed and expected to be amortizedearly in fiscal year 2005. The full faith, credit and revenue-raising powers of the City have been pledgedto secure these bonds.

City of Manchester, New HampshireNotes to Financial Statements
June 30, 2003
9. Long-Term Debt (continued)
87
For June 30, 2003 an amount of $5,136,395 was recorded in the Government-Wide Financial Statementfor the accretion of interest on the capital appreciation bonds which is also included in the governmentallong-term debt service in fiscal years 2004 through 2005.
Long-term liability activity for the year ended June 30, 2003 was as follows:
The EPD Enterprise Fund has eight loan agreements with original principal balances amounting to$44,813,578 with the State of New Hampshire, State Water Pollution Control Revolving Fund (SRF)program for the purpose of financing certain projects in connection with the expansion of the wastewatertreatment facility and water pollution abatement project.
Additionally, several projects are currently utilizing the services of the SRF. These projects are in variousstages of the construction or completion phase of the project. Three of the DES eligible projects areclassified as EPD Enterprise, while the single exception, the Sanitary Landfill Closure carries a generalfund genre. Total indebtedness unamortized as of June 30, 2003 is $18,873,557, comprised of$6,766,600 for EPD and CSO projects, and $12,106,957 for the Sanitary Landfill Closure.
In prior years, the City defeased certain general obligation and other bonds by placing the proceeds ofnew bonds in an irrevocable trust to provide for all future debt service payments of the old bonds.Accordingly, the trust account asset and liability for the defeased bonds are not included in the City’sfinancial statements. On June 30, 2003 $15,410,000 of bonds outstanding are considered defeased.
Balance Balance Due within1-Jul-02 Increases Decreases 30-Jun-03 One year
Governmental activities:General Obligation Bonds Payable - City 88,120,240$ 25,000$ 10,890,802$ 77,254,438$ 9,688,629$ General Obligation Bonds Payable - MSD 47,667,320 - 5,985,063 41,682,257 5,745,821
135,787,560 25,000 16,875,865 118,936,695 15,434,450
Compensated absences 5,418,492 909,898 6,328,390 2,959,335Insurance claims 4,071,081 64,020 4,135,101 3,884,998Capital appreciation bonds 6,909,802 719,629 2,493,036 5,136,395 2,712,411Landfill closure and
post-closure care 21,509,737 3,402,780 18,106,957 -
173,696,672$ 1,718,547$ 22,771,681$ 152,643,538$ 24,991,194$
Business-type activitiesGeneral Obligation Debt 50,927,008$ -$ 6,896,849$ 44,030,159$ 6,744,287$ Revenue Bonds, net of
unamortized OriginalIssue Discount 275,328,820 - 4,075,098 271,253,722 5,050,000
326,255,828$ -$ 10,971,947$ 315,283,881$ 11,794,287$

City of Manchester, New HampshireNotes to Financial Statements
June 30, 2003
9. Long-Term Debt (continued)
88
The Department of Aviation (the “DA”) Enterprise Fund has entered into a twenty year interest rateswap agreement for $38,340,000 of its variable rate demand general airport revenue bonds. Based onthe swap agreement, the DA owes interest calculated at a fixed rate of 4.38% to the counterparty to theswap. In return, the counterparty owes the DA interest based on a variable rate that matches the raterequired by the bonds. Only the net difference in interest payments is actually exchanged with thecounterparty. The $38,340,000 in bond principal is not exchanged; it is only the basis on which theinterest payments are calculated.
The DA continues to pay interest to the bondholders at the variable rate provided by the bonds.However, during the term of the swap agreement, the DA effectively pays a fixed rate on the debt. Thedebt service requirements to maturity for these bonds are based on the fixed rate.
At June 30, 2003, the swap agreement resulted in a cumulative unfavorable fair value of approximately$4,669,000, based on dealer quoted prices, and accordingly, the fair value of the swap was recorded inaccounts payable and additional interest expense in the related accompanying financial statements.
Manchester Housing and Redevelopment Authority
In March 2000, the Manchester Housing and Redevelopment Authority, New Hampshire the (“MHRA”)issued $49,772,909 in revenue bonds (the “Bonds”) to finance, in part, the construction of theManchester Civic Center (now the Verizon Wireless Arena) (the “Arena”). The MHRA is a public body,corporate and politic, established pursuant to Chapter 203 of the New Hampshire Revised Statutes. TheMHRA is not a component unit of the City within the meaning of GASB No. 14.
The Bonds issued by the MHRA to finance the construction of the Arena are secured, to a degree, byrevenues to be paid by the City pursuant to a Financing Agreement between the City and the MHRA(the “Financing Agreement”). At the time of the issuance of the Bonds, MHRA assigned all of its rightsunder the Financing Agreement to a corporate trustee, to be held, in trust, for the benefit of the holdersof the Bonds from time to time. Under the terms of the Financing Agreement, the City is to makepayment of meals and rooms tax revenues received by it from the State of New Hampshire, pursuant toRSA 78-A:26, but only to the extent that (i) such funds are actually received by the City from thissource, in excess of $454,927 in any given year, and (ii) that the City’s Board of Mayor and Aldermen(the “BMA”) actually appropriates such funds in each year to make such payments. The City’s paymentsunder the Financing Agreement are not secured by its full faith and credit. Moreover, the City is notmorally obligated to make any payments under the Financing Agreement. The Financing Agreementstipulates that the Mayor will include an appropriation request in the annual budget submission to theCity’s Board of Mayor and Aldermen, payable from the meals and rooms tax imposed by the State andpaid to the City in excess of $454,927 in each fiscal year in an amount sufficient to make the paymentsrequired under the Financing Agreement. There is, however, no assurance that the BMA will appropriatesuch funds on an annual basis or that sufficient meals and rooms tax revenues will be received by theCity to make scheduled payments under the Financing Agreement. Pursuant to New Hampshire law, theBonds do not constitute indebtedness of the City of Manchester.

City of Manchester, New HampshireNotes to Financial Statements
June 30, 2003
9. Long-Term Debt (continued)
89
In the event that either (i) the City does not receive meals and rooms tax revenues sufficient to makepayments under the Financing Agreement, or (ii) that the BMA should determine not to appropriatemeals and rooms tax revenues to make payments under the Financing Agreement (each an “Event ofEarly Termination”), holders of the Bonds may look only to an insurance policy provided AmericanCapital Access Financial Guaranty Corporation for the payment of scheduled installments of principaland interest on the Bonds. An Event of Early Termination does not constitute a default by the City underthe Financing Agreement. Holders of the Bonds have no security interest, mortgage, or other claim orinterest in the Arena to secure the repayments of the Bonds.
In the event of default, bond reserves initially and subsequent bond insurance arrangements includingthe exercise of management control of the facility by the insurer will provide remedies for bondholders.In any event, title to the facility always remains with the City of Manchester. Therefore, the Arena isincluded as an asset on the City’s financial statement. The City treated the donation of the asset fromMHRA as a non-exchange transaction and recorded the asset at construction cost as the estimated fairmarket value at the time of the donation.
Due to the uncertainty of the state meals and rooms tax revenue formula, the City is not including theseunknown funds as either revenues or receivables. Similarly, since the non-funding clause in theFinancing Agreement provides annual lease payments which are contingent upon the items discussed inthe second paragraph, the City has not included any future payments pursuant to the FinancingAgreement. Accruals for the general or unspecified business risks (“reserves for general contingencies”)are not permitted per FASB 5. The BMA may at any time, at its sole discretion, decide not toappropriate meals and rooms tax revenue funds.

City of Manchester, New HampshireNotes to Financial Statements
June 30, 2003
10. Employee Benefit Plans
90
All full-time employees of the City participate in one of the City’s pension plans or the New HampshireRetirement System (“NHRS”).
City Plans
The vast majority of employees of the City participate in the City’s pension plan known as the NewSystem or the CRS. Certain employees of the City participate in a prior pension plan known as the OldSystem. In addition, a limited number of former police and fire department employees covered by theNHRS also qualify for supplementary benefits that are administered and paid for by the City.
CRS Pension Old System TotalTrust Pension Trust
AssetsCash and cash equivalents 804,485$ 9,386,174$ 10,190,659$
Investments 74,099,597 9,364,100 83,463,697 Receivables, net of allowances
for collection losses 343,262 93,447 436,709 Other assets 8,927 8,927 Property and equipment, net whereapplicable, of accumulated depreciation 240,975 240,975
Total Assets 75,497,246$ 18,843,721$ 94,340,967$
LiabilitiesAccounts and warrants payable 137,940$ 137,940$
Accrued liabilities 562,762 562,762
Total Liabilities 700,702 700,702
Net Assets Held in Trustfor Pension Benefits 74,796,544$ 18,843,721$ 93,640,265$
SCHEDULE OF PLAN NET ASSETS

City of Manchester, New HampshireNotes to Financial Statements
June 30, 2003
10. Employee Benefit Plans (continued)
91
CRS Pension Old System TotalTrust Pension Trust
AdditionsContributionsEmployer 1,794,576$ 1,794,576$ Plan members 1,531,458 1,531,458
Total Contributions 3,326,034 3,326,034
Investment Gain (Loss)Net realized and unrealized appreciation (depreciation) in fair value of investments (10,274,998) $ 99,250 (10,175,748)Interest 720,912 682,782 1,403,694 Dividends 1,067,951 1,067,951 Less investment expense (380,435) (380,435)
Net Investment Income (Loss) (8,866,570) 782,032 (8,084,538)
Total Additions (Reductions) (5,540,536) 782,032 (4,758,504)
DeductionsBenefits paid directly to participants 4,568,960 1,997,603 6,566,563 Refunds of employee contributions 301,901 301,901 Administrative expenses 578,213 67,107 645,320
Total Deductions 5,449,074 2,064,710 7,513,784
Net Decrease (10,989,610) (1,282,678) (12,272,288)
Net Assets Held in Trustfor Pension BenefitsBeginning of year 85,786,154 20,126,399 105,912,553 End of year 74,796,544$ 18,843,721$ 93,640,265$
SCHEDULE OF CHANGES OF PLAN NET ASSETS

City of Manchester, New HampshireNotes to Financial Statements
June 30, 2003
10. Employee Benefit Plans (continued)
92
New System
In 1974, the City established a single-employer public employee retirement system (the “New System”)to provide pension benefits to employees other than firefighters, police officers, teachers and employeespreviously covered under the “Old System” described below. Manchester School District administrationemployees are covered under this plan.
All covered employees hired after January 1, 1974 are required to participate in the New System as acondition of employment. Employees are 100% vested after five years of service. The retirement benefitis calculated at 1-1/2% of final average total compensation during the highest three years of service inthe last ten years of service (hereafter average compensation), multiplied by the years of service prior toJanuary 1, 1999 plus 2% after January 1, 1999 of average compensation multiplied by the years ofservice after January 1, 1999. There is a minimum benefit of 50% of average compensation foremployees hired prior to January 1, 1974 who complete 20 years of service and attain age 62 beforeretirement or have combined age and years of service over specified amounts. All eligible employees arerequired to contribute 2-1/2% of their salaries to the New System prior to January 1, 1999 and 3-3/4% oftheir salaries after January 1, 1999. If an employee leaves covered employment or dies before five yearsof service, accumulated employee contributions and earnings thereon at rates determined annually by theNew System Board of Trustees (5%, for the periods ended June 30, 2003 and 2002) are refunded. TheCity is required to contribute the remaining amounts necessary to finance the benefits for its employees.Benefit provisions and contribution requirements are established by the City and may be amended onlyby the BMA, subject to approval of the voters of the City through referendum. The Plan was lastamended on November 1, 2002.
Membership in the Plan consisted of the following at December 31, 2002, the date of the last actuarialvaluation:
Retirees and beneficiaries receiving benefits 484
Terminated vested members 66
Active members 1,330
Total Participants 1,880

City of Manchester, New HampshireNotes to Financial Statements
June 30, 2003
10. Employee Benefit Plans (continued)
93
The City’s plans, by policy, (i) require annual actuarial valuations, with yearly updates, and (ii) requireannual City contributions based on actuarial determinations. During the year of actuarial valuation, theCity has historically contributed the annual required contribution (“ARC”) of the pension plan. Any dif-ference between the ARC and the actual contribution made has been settled by the next actuarial valuationdate, and thus the City has never actually had, or had need to report, a net pension obligation (“NPO”).
SCHEDULE OF EMPLOYER CONTRIBUTIONSYear Ended
June 30,Annual Required
ContributionPercentage
Contributed2002 $__1,794,576 100 %2001 _1,117,163 1002000 __713,685 100 %1999 796,552 100 %1998 514,216 100 %1997 543,835 100 %
SCHEDULE OF FUNDING PROGRESS
ActuarialValuation
Date
Actuarial Valueof Assets
(a)
UnfundedActuarial AccruedLiability (Surplus)
(b)
ActuarialAccrued Liability
(c)
FundedRatio(a)/(c)
CoveredPayroll
(prior year)
12/31/02 $ 89,755,853 $ 16,364,857 $ 106,120,710 84.6 % $ 38,940,10412/31/01 94,812,631 1,457,848 96,270,479 98.5 38,692,73812/31/00 90,144,513 (3,049,404) 87,095,109 103.5 % 35,370,96112/31/99 82,584,305 (3,263,538) 79,320,767 103.0 % 29,581,57712/31/98 72,569,967 (1,494,444) 71,075,523 102.1 % 28,255,20812/31/97 65,839,177 (4,296,452) 61,542,725 107.0 % 26,961,37512/31/96 59,838,164 (3,121,758) 56,716,406 105.5 % 24,418,320
Additional information as of the latest actuarial valuation follows:
Valuation Date: January 1, 2003Mortality: The 1983 Group Annuity Mortality TableActuarial Cost Method: Entry AgeInvestment Return: 7.5% per year compounded annually, net of expensesCompensation Increases: Under 35 – 5.5%; 35 to 49 – 5%; 50 and over – 4.5%Amortization Method: Level percentage closedAsset Valuation Method: 5 year smoothed marketInflation Rate: 4.5%
The System reduced the normal age of retirement from 62 to 60 and provided for a two-percent annualsubsidy on early retirement for participants aged 55 with at least 20 years of service or participants

City of Manchester, New HampshireNotes to Financial Statements
June 30, 2003
10. Employee Benefit Plans (continued)
94
whose age plus years of service equal at least 80 (including previously terminated participants). Thisamendment was granted during 2002 and became effective November 1, 2002. The increase in planliabilities was $3 million, which reflects the impact of the plan amendment as well as a change inassumed retirement rates. The amortization of this change increases the customary contribution by$200,000 for the first 20 years and $500,000 for the subsequent 10 years.
The System adopted a 3% COLA to participants in payment status as of June 1, 2002. The effect of thisCOLA was to increase liabilities by $1.2 million. This increase is funded over ten years. For 2003, theimpact on the customary contribution is a charge of approximately $165,000.
Old System
Prior to January 1, 1974, all eligible City employees participated in the Old System, a single employercontributory public employee retirement system (PERS). All employees hired before January 1, 1974were given the option to remain in the Old System or participate in the New System. The Old Systemwas replaced by the New System and only operates to cover the remaining participants. All employeescovered under the Old System are fully vested. Benefits under the Old System are limited to retirementbenefits without death benefits to survivors. Benefits are recognized as expenditures of the General Fundon a pay-as-you-go basis. At June 30, 2003, the Old System membership consisted of:
Members currently receiving benefits 138Active Vested Members 21Total Members 159
SCHEDULE OF EMPLOYER CONTRIBUTIONS
Plan Year endedJune 30
Annual requiredcontributions
Percentagecontributed *
2003 $ 87,547 0.0 %2002 2,175,245 967.32001 2,196,055 92.62000 2,158,104 93.41999 2,048,811 96.81998 1,728,000 100.0

City of Manchester, New HampshireNotes to Financial Statements
June 30, 2003
10. Employee Benefit Plans (continued)
95
The City’s annual pension cost and net pension obligation to the Plan for the current year were:
Annual required contribution $ 87,547Interest on net pension obligation (1,388,344)Adjustment to annual required contribution 1,954,328Annual pension cost 653,531Less contributions made 0Increase in net pension obligation (asset) 653,531Net pension obligation (asset) beginning of year (18,511,248)Net pension obligation (asset) end of year $(17,857,717)
Three year trend information
Fiscal YearEnding
Annual PensionCost (APC)
Percentage ofAPC Contributed
Net PensionObligation (Asset)
6/30/2003 $ 653,531 0.0 % $(17,857,717)6/30/2002 2,165,300 967.3 (18,511,248)6/30/2001 2,190,986 92.6 364,220
SCHEDULE OF FUNDING PROGRESS
ActuarialValuation
Date Assets
ActuarialAccrued Liability
(AAL) P.U.C.
UnfundedAAL
(UAAL)FundedRatio
CoveredPayroll
UAAL as aPercentage of
Covered Payroll07/01/2002 $ 20,126,399 $ 20,955,638 $ 829,239 96.04 % $ 1,025,725 80.84 %07/01/2001 - 21,262,936 21,262,936 0.00 1,009,090 2,107.1407/01/2000 - 22,085,349 22,085,349 0.00% 1,097,032 2,013.1907/01/1999 - 22,269,566 22,269,566 0.00% 1,326,886 1,678.3307/01/1998 - 22,453,076 22,453,076 0.00% 1,417,158 1,584.3707/01/1997 N/A N/A N/A N/A N/A N/A
Additional information as of the latest actuarial valuation follows:
Valuation date June 30, 2003Actuarial cost method Projected unit creditAmortization method Level dollar, closedRemaining amortization period 15 yearsAsset valuation method Market ValueActuarial assumptions:Investment rate of return 7.50 %Projected salary increases 4.50 %

City of Manchester, New HampshireNotes to Financial Statements
June 30, 2003
10. Employee Benefit Plans (continued)
96
NHRS Related Supplementary Benefits Plan
The City pays supplementary benefits of up to 50% of the last annual wage for any City employee whoparticipates in the NHRS, was hired before June 30, 1972, and does not receive a pension benefit fromthe NHRS equal to at least 50% of the last annual wage. These costs are accounted for on a pay-as-you-go basis in the general fund.At June 30, 2003, the membership consisted of:
Members currently receiving benefits 55
New Hampshire Retirement System
The City contributes to the NHRS a cost-sharing, multiple-employer defined benefit pension plan ad-ministered by the state retirement board. The NHRS provides retirement and disability and death bene-fits to plan members and beneficiaries. Revised Statutes Annotated 100-A41-a of New Hampshire Lawassigns the system the authority to establish and amend benefit provisions of the plan and grant cost-of-living increases. The NHRS issues a publicly available financial report which can be obtained throughthe New Hampshire Retirement System at 4 Chennel Drive, Concord, New Hampshire 03301-8509.
NHRS members are required to contribute 9.30% of annual covered compensation to the pension plan.The City makes annual contributions to the pension plan equal to the amount required by RevisedStatutes Annotated 100-A:16 and ranges from 5.33% to 6.61% of covered compensation.
The City’s contributions to the system, consisting of firefighters and police officers, for the years endedJune 30, 2003 and 2002 were $1,492,473 and $1,427,011 respectively and were equal to the requiredcontributions. For the years ended June 30, 2003 and 2002, the City has recognized both revenue andexpenditures of $800,863 and $646,212, respectively, on behalf of contributions made by the State to theNHRS.

City of Manchester, New HampshireNotes to Financial Statements
June 30, 2003
11. Contingent Liabilities and Insurance
97
There are various claims and legal actions pending against the City for which provision has been madein the financial statements starting in fiscal year 2002. In the opinion of the City Solicitor and other Cityofficials, liabilities arising from these claims and legal actions, if any, will not be significant.
The City has received federal grants for specific purposes that are subject to review and audit by thefederal government. Although such audits could result in expenditure disallowance under grant terms,any required reimbursements are not expected to be significant.
The City’s insurance coverage consists of both self-insured programs and policies maintained withvarious carriers. Coverage has not been materially reduced nor have settled claims exceeded commercialcoverage in any of the past three years.
Changes in the balances of claims liabilities recorded by the City during the past two years are asfollows:
Claims Claims and ClaimsFiscal Year Payable Changes in Claims Payable
Ended July 1 Estimates Paid June 30
2003 $4,976,402 $4,640,796 $4,603,949 $4,939,555
2002 5,488,269 4,344,763 $3,832,896 4,976,402
Accident and Health
Accident and health claims are administered through a private carrier. The City is self-insured under thisprogram. The City maintains a stop-loss policy with limits of $100,000 per year, per claim and a 115%aggregate for the entire cost. The City has recorded $804,454 in the General Fund for claim liabilities atyear end.
Property
Property insurance is maintained with a commercial insurer and provides for a deductible of $100,000for each claim and an overall coverage limit of $100,000,000.
General Liability
Liability claims are administered through a private carrier. The City is self-insured under this program,except for the Aviation Fund which maintains a liability insurance policy which provides coveragegenerally up to $100,000,000 for each occurrence and in the aggregate in any one annual period ofinsurance. State law generally limits a city’s liability for an incident to $150,000 per individual and$500,000 per incident. $3,675,304 was recorded in the government wide statements for fiscal year 2003as the City’s estimated liabilities for unsettled claims.

City of Manchester, New HampshireNotes to Financial Statements
June 30, 2003
11. Contingent Liabilities and Insurance (continued)
98
Worker’s Compensation
Worker’s compensation claims are administered through a private carrier. The City is self-insured underthis program for all City employees. There is no limit per employee. $2,964,110 was recorded in thegovernment wide statements as the City’s estimated liability for all types of claims incurred in 2003 orprior, which have not been settled.
Department of Aviation
The DA has comprehensive airport liability insurance policies with insurance companies, which providecoverage generally up to $100,000,000 for each occurrence and in the aggregate in any one annualperiod of insurance. Claims are subject to a deductible of $1,000 for each occurrence up to a maximumof $5,000 during any one annual insurance period.
Settled claims have not exceeded commercial coverage in any of the past three fiscal years.
Regulatory
The City was issued an Administrative Order against it by the United States Environmental ProtectionAgency (EPA), ordering the City to evaluate and plan for appropriate treatment of combined sewer overflows pursuant to the Federal Clean Water Act. The City believes it is in compliance with theAdministrative Order and is working with Federal and State authorities in dealing with combined seweroverflows from its publicly-owned treatment works. As of June 30, 2003, there is no pending claim bythe EPA or the State.
12. Landfill Closure and Postclosure Care Costs
State and federal laws and regulations required the City to place final cover on its landfill site when itstopped accepting waste and to perform certain maintenance and monitoring functions at the site forthirty years after closure. Although closure and postclosure care costs will be paid only near or after thedate the landfill stopped accepting waste, the City reports a portion of these closure and postclosurecosts as an operating expense in each period based on landfill capacity used as of the financial statementdate. The $18,106,957 reported as landfill closure and postclosure care liability at June 30, 2003represents the cumulative amount reported to date based on use of 100 percent of the estimated capacityof the landfill. The City closed the landfill on June 28, 1996. Actual cost may be higher due to inflation,changes in technology, or changes in regulations. The City anticipates that the funding for the landfillclosure costs will be provided through the issuance of general obligation bonds.
13. Fund Deficit
As of June 30, 2003, the CDBG, Capital Projects and the Aggregation funds had fund deficits in theamounts of $146,616, $8,369,093 and $1,581,101, respectively.
The City anticipates financing the deficits through future revenues and through future debt issuances.

City of Manchester, New HampshireNotes to Financial Statements
June 30, 2003
14 . Issued But Not Effective Professional Standards
99
The Governmental Accounting Standards Board (GASB) has issued two statements not yet implementedby the City. The statements which might impact the City are as follows:
Statement No. 39, “Determining Whether Certain Organizations are Component Units,” an amendmentof GASB Statement No. 14 issued May 2002, will be effective for fiscal year ending June 30, 2004.Statement No. 39 provides new guidance to determine whether certain organizations for which theprimary government is not financially accountable should be reported as component units based on thenature and significance of their relationship with the primary government.
Statement No. 40, “Deposit and Investment Risk Disclosures,” issued March 31, 2003, will be effectivefor the fiscal year ending June 30, 2005. Statement No. 40 imposes new standards for disclosingdeposits and investments. The statement addresses common deposit and investment risks related tocredit risk, interest rate risk, and foreign currency risk. The statement’s effect on the financialstatements will limit the deposit and investment disclosure to categorizing deposits that are not coveredby depository insurance and investment securities that are uninsured.
15. Subsequent Events
On July 31, 2003 the City issued $101,410,000 School Facilities Revenue Bonds, Series 2003. Thisambitious undertaking was structured as a Design/Build/Finance Project to provide funding for acomprehensive renovation to schools in the City including additions to middle and high schools. Withthe utilization of the D/B/F concept, the City awarded a contract in the GMP amount of $94,900,000 inApril, 2003 for construction costs. Interest rates range from 2.00% to 5.50% over the 25 yearamortization period.
On August 14, 2003 the City received proceeds for $38,345,000 (MWW) Water Revenue Bonds, Series2003. This issuance represented the introduction of Manchester Water Works as an independent issuerto the marketplace. The insured bonds have a TIC (True Interest Cost) of 5.089% and will be amortizedover a 30 year term. The proceeds will finance construction expansion and upgrades to the WaterTreatment Facility and permanent improvements to the water distribution system. Contracts for theWTF project were awarded in May, 2003 for $28.7 million while the oversight of the distribution systemimprovements will continue to be administered by MWW.

100
This Page Intentionally Left Blank

COMBINING AND INDIVIDUALFINANCIAL STATEMENTS AND SCHEDULES

General FundComparative Balance Sheets
2003 2002
Assets Cash and cash equivalents 62,840,860$ 58,543,082$ Restricted cash and cash equivalents 2,074,460 5,406,750Investments 511,328 505,116Receivables, net of allowances
for collection losses 20,096,729 18,614,409Prepaid items 4,099 82,325Due from other funds 10,493,960 5,038,627Inventories 589,385 619,177
Total Assets 96,610,821$ 88,809,486$
Liabilities and Fund Equity
LiabilitiesAccounts and warrants payable 4,672,490$ 4,307,092$ Retainage payable 4,532Accrued liabilities 1,397,348 2,005,273Insurance claims payable 804,454 905,321Due to Manchester School District 23,550,478 18,522,747Deferred revenue 17,190,758 15,736,535Taxes collected in advance 26,186,396 25,522,225
Total Liabilities 73,801,924 67,003,725
Fund EquityFund balances
Reserved forEncumbrances 1,272,469 540,119Inventory 589,385 619,177Advances 1,623,865 1,720,166Workers' compensation 2,964,110 1,253,582
Designated forHealth insurance 1,879,840 1,913,932General liability insurance 711,195 1,497,913Special revenue 848,437Tax rate stabilization 1,981,568Revenue stabilization 9,633,624 9,576,915
Unreserved Undesignated fund balance 1,304,404 4,683,957
Total Fund Equity 22,808,897 21,805,761
Total Liabilities and Fund Equity 96,610,821$ 88,809,486$
City of Manchester, New HampshireJune 30, 2003
101

2003 2002Revenues
Taxes 59,369,549$ 59,020,928$ Federal and state grants and aid 7,549,154 7,291,673 Nonenterprise charges for sales and services 4,491,647 4,432,086 Licenses and permits 20,521,738 19,744,630 Interest 736,111 1,132,648 Other 8,594,706 9,120,585
Total Revenues 101,262,905 100,742,550
ExpendituresCurrent:
General government 18,658,422 18,368,831 Public safety 35,444,763 34,556,506 Health and sanitation 2,462,857 2,711,544 Highway and streets 19,902,962 20,099,068 Welfare 1,352,284 2,146,722 Education 2,145,815 2,258,746 Parks and recreation 2,992,399 3,034,011 Pension Benefit Payments 18,960,260
Debt service:Principal retirement 10,890,802 11,030,422 Interest 5,181,212 3,565,940 Issue Costs 158,662
Total Expenditures 99,031,516 116,890,712
Excess of revenues over expenditures 2,231,389 (16,148,162)
Other Financing Sources (Uses)Proceeds of refunding bonds 14,150,020 Payment to refunded bond escrow agent (13,996,706) Proceeds from pension obligation bonds 18,960,260 Transfers in 561,912 769,277 Transfers out (1,790,165) (1,620,742)
Total Other Financing Sources (Uses) (1,228,253) 18,262,109
Net Change in Fund Balance 1,003,136 2,113,947
Fund Balance, beginning of year 21,805,761 19,691,814
Fund Balance, end of year 22,808,897$ 21,805,761$
102
Expenditures and Changes in Fund Balances
General Fund City of Manchester, New HampshireComparative Statements of Revenues, Year Ended June 30, 2002

General FundSchedule of Revenues and Transfers in -Budget and Actual (Budget Basis)
Variance with Final Budget
Original Revised PositiveBudget Budget Actual (Negative)
Taxes
Property tax 57,936,379 57,936,379 57,385,431 (550,948) Boat tax 40,000 40,000 44,192 4,192 Cable franchise fee 1,437,448 1,437,448 995,354 (442,094) Cost on deferred tax 15,000 15,000 33,546 18,546 Cost on tax title 25,000 25,000 24,211 (789) Interest on tax 150,000 150,000 292,380 142,380 Interest on tax lien 400,000 400,000 217,968 (182,032) Railroad tax 5,400 5,400 4,633 (767) Tax lien 60,000 60,000 33,777 (26,223)
Total Taxes 60,069,227 60,069,227 59,031,492 (1,037,735)
Federal and State Grants and Aid
CIP/federal capital 227,000 227,000 151,811 (75,189) Highway block grant 1,547,000 1,547,000 1,617,030 70,030 Home Investment Program - - 33,675 33,675 Landfill closure 22,340 22,340 22,340 - Lieu of tax - Carpenter Center 47,000 47,000 47,849 849 Lieu of tax - MHRA 140,000 140,000 199,974 59,974 Lieu of tax - other 265,000 265,000 238,464 (26,536) Meals & rooms tax 454,927 454,927 454,927 - Revenue Sharing Distribution 3,955,713 3,955,713 3,955,713 - Traffic reimbursement 15,000 15,000 26,508 11,508
Total Federal and State Grants and Aid 6,673,980 6,673,980 6,748,291 74,311
Nonenterprise Charges forSales and Services
Cemetery - Care of lot and grave 13,800 13,800 26,644 12,844 Cemetery - Cement container 22,000 22,000 19,833 (2,167) Cemetery - Internment 98,150 98,150 95,410 (2,740) Cemetery - Sale of mausoleum 13,000 13,000 13,900 900 City Clerk - Certified record 200,000 200,000 211,235 11,235 City Clerk - Certified record, state share (132,000) (132,000) (126,041) 5,959 City Clerk - Late fee 3,000 3,000 2,319 (681) City Clerk - Political filing fee - - 60 60 City Clerk - UCC financing statement 45,500 45,500 38,876 (6,624) City Clerk - Vending machine commission 36 36 55 19 Finance - Wage assignment fee 1,800 1,800 1,924 124 Fire - Alarm permit 210,000 210,000 243,983 33,983 Fire - Central station monitoring 26,000 26,000 22,496 (3,504) Fire - Day care inspection 2,000 2,000 2,325 325 Fire - False alarm 94,000 94,000 159,675 65,675 Fire - Hazardous inspection fee 5,000 5,000 2,700 (2,300) Fire - Review of life safety code plan 1,500 1,500 2,000 500 Fire - Sprinkler system review 3,000 3,000 18,846 15,846 Fire - Standby fee 2,000 2,000 1,080 (920)
(continued)
City of Manchester, New HampshireYear Ended June 30, 2003
103

General FundSchedule of Revenues and Transfers in -Budget and Actual (Budget Basis) (Continued)
Variance with Final Budget
Original Revised PositiveBudget Budget Actual (Negative)
City of Manchester, New HampshireYear Ended June 30, 2003
Nonenterprise Charges forSales and Services (Continued)
Fire - Telephone dialer fee 400 400 725 325 Health - Day care health inspection 1,000 1,000 1,130 130 Health - Immunization reimbursement 3,000 3,000 6,299 3,299 Highway - Bid fee 5,738 5,738 1,635 (4,103) Highway - Delay rent on landfill 12,500 12,500 32,264 19,764 Highway - Drop-off Center 607,830 607,830 530,325 (77,505) Highway - Grade certification 2,440 2,440 4,880 2,440 Highway - Inspection fee 17,732 17,732 40,188 22,456 Highway - Maintenance 2,500 2,500 387 (2,113) Highway - Sewer tap fee 61,250 61,250 92,000 30,750 Highway - Hackett Hill sewer recovery - - 49,106 49,106 Highway - Wellington sewer recovery - - (28,567) (28,567) Highway - Youngsville sewer recovery - - 71,280 71,280 Human resources - Examination fee 5,000 5,000 17,452 12,452 Information systems - Department supplies 725 725 3,909 3,184 Parks - Concessions, rentals, bids 500 500 6,553 6,053 Parks - Softball fee - - 1,440 1,440 Planning - Site plan fee 75,000 75,000 93,363 18,363 Planning - Sub-Division fee 13,000 13,000 29,400 16,400 Planning - Zoning variance 27,000 27,000 44,033 17,033 Police/Fire - Accident/investigation report 59,000 59,000 63,215 4,215 Police - Auction 15,000 15,000 6,683 (8,317) Police - Bicycle fee 100 100 - (100) Police - Booting fee 6,000 6,000 8,090 2,090 Police - Building violation fine 12,000 12,000 18,625 6,625 Police - Court parking fine 7,000 7,000 9,042 2,042 Police - District court fine 30,000 30,000 32,750 2,750 Police - Dog pound fee 5,000 5,000 11,390 6,390 Police - Expired meter parking ticket 1,025,220 1,025,220 926,428 (98,792) Police - Extra detail administrative 78,000 78,000 89,388 11,388 Police - Fingerprint 8,500 8,500 9,795 1,295 Police - Photograph sale 5,100 5,100 2,334 (2,766) Police - Towing fine - - 492 492 Police - Witness fee 100,100 100,100 106,901 6,801 Tax collector - auto registration parking - - 316 316 Tax collector - Demolition - - 9,000 9,000 Tax collector - Fee duplicate tax receipt 3,000 3,000 5,398 2,398 Tax collector - Motor vehicle title fee 50,000 50,000 58,535 8,535 Tax collector - Municipal agent fee 205,000 205,000 185,037 (19,963) Traffic - Parking downtown meters & reserve 1,501,200 1,501,200 1,158,319 (342,881) Traffic - Parking meter hoods revenue 60,000 60,000 13,026 (46,974) Various - Bounced check fee 10,360 10,360 10,445 85 Various - Research fee 12,100 12,100 22,594 10,494 Various - Photocopy 9,000 9,000 8,722 (278)
Total Nonenterprise Charges forSales and Services 4,646,081 4,646,081 4,491,647 (154,434)
104

General FundSchedule of Revenues and Transfers in -Budget and Actual (Budget Basis) (Continued)
Variance with Final Budget
Original Revised PositiveBudget Budget Actual (Negative)
City of Manchester, New HampshireYear Ended June 30, 2003
Licenses and Permits
Tax collector - Auto registration 14,455,000 14,455,000 13,873,920 (581,080) Building - Certificate of compliance 250,000 250,000 206,026 (43,974) Building - Building permit 1,100,000 1,100,000 1,392,450 292,450 Building - Electric permit 185,000 185,000 275,636 90,636 Building - Elevator permit 1,000 1,000 2,890 1,890 Building - Heating permit 108,000 108,000 150,187 42,187 Building - Plumbing permit 65,000 65,000 99,108 34,108 Building - Sign permit 20,000 20,000 25,440 5,440 Building - Yard sale permit 5,500 5,500 4,265 (1,235) City Clerk - Amusement license 19,000 19,000 16,980 (2,020) City Clerk - Dog license 46,000 46,000 44,882 (1,118) City Clerk - Dog license, state share (4,800) (4,800) (4,836) (36) City Clerk - Employment office license 600 600 456 (144) City Clerk - Marriage license 40,000 40,000 46,665 6,665 City Clerk - Marriage license, state share (33,900) (33,900) (34,846) (946) City Clerk - Mechanical device license 185,000 185,000 188,950 3,950 City Clerk - Peddler license 10,000 10,000 15,438 5,438 City Clerk - Second hand license 2,500 2,500 2,193 (307) City Clerk - Sunday permit 80,000 80,000 82,500 2,500 City Clerk - Taxi license 11,500 11,500 9,010 (2,490) Health - Bathing facility permit 8,000 8,000 8,400 400 Health - Food permit 130,000 130,000 133,680 3,680 Health - Septic permit 6,000 6,000 4,050 (1,950) Highway - Encumbrance permit 9,450 9,450 8,700 (750) Highway - Excavation permit 84,300 84,300 106,450 22,150 Highway - Pipe layer certification 1,800 1,800 3,150 1,350 Highway - Reclamation trust fund 330,000 330,000 293,715 (36,285) Highway - Road Resurfacing 579,000 579,000 559,093 (19,907) Police - Alarm permit 24,000 24,000 33,960 9,960 Police - Blasting permit 700 700 1,000 300 Police - Game of chance license 100 100 - (100) Police - Gun permit 4,000 4,000 7,336 3,336 Police - Place of assembly permit 25,000 25,000 28,700 3,700 Police - Towing license 18,250 18,250 14,040 (4,210) Traffic - Parking fees 3,120,977 3,120,977 2,938,382 (182,595)
Total Licenses and Permits 20,886,977 20,886,977 20,537,970 (349,007)
Interest
Income from invested funds 1,816,000 1,816,000 736,111 (1,079,889)
105

General FundSchedule of Revenues and Transfers in -Budget and Actual (Budget Basis) (Continued)
Variance with Final Budget
Original Revised PositiveBudget Budget Actual (Negative)
City of Manchester, New HampshireYear Ended June 30, 2003
Other Revenues
Building - Restitution from prior year 4,000 4,000 8,728 4,728 Building - Administration 1,000 1,000 1,410 410 Building - Sale of code 2,050 2,050 840 (1,210) City Clerk - Building rent 13,200 13,200 91,200 78,000 City Solicitor - Worker's comp. reimb. 361,830 361,830 474,110 112,280 Finance - Airport reimbursement 50,000 50,000 28,561 (21,439) Finance - Debt Recovery Livingston Park 25,000 25,000 25,000 - Finance - Debt Recovery Riverfront Stadium 69,580 69,580 69,580 - Health - HIV education reimbursement 71,000 71,000 - (71,000) Health - Immunization reimbursement 50,000 50,000 - (50,000) Health - Lead Poisoning 25,000 25,000 - (25,000) Health - STD reimbursement 25,000 25,000 - (25,000) Health - TB reimbursement 90,000 90,000 - (90,000) Health audit recoveries 500,000 500,000 - (500,000) Highway - Fuel reimbursements 6,500 6,500 8,766 2,266 Highway - Sewer Maintenance WWTP - - 12,601 12,601 Highway / Traffic - Scrap metal and salvage 4,000 4,000 8,405 4,405 MEDO - Wall St. Tower refinance 59,450 59,450 59,450 - Police - Cruiser rental 4,000 4,000 3,633 (367) Police - Extra detail revolving fund - - 4,597 4,597 Tax collector - Excess receipt - - 38,621 38,621 Traffic - Repair traffic signals admin. 6,700 6,700 10,483 3,783 Traffic - Repair traffic signals labor 7,500 7,500 4,875 (2,625) Traffic - Sale of capital assets 750,000 750,000 - (750,000) Various - Data processing 54,416 54,416 60,541 6,125 Various - Maps, prints, etc. 10,960 10,960 12,118 1,158 Various - Miscellaneous 54,350 54,350 170,263 115,913 Various - Reimbursement O/T salary 37,506 37,506 32,922 (4,584) Various - telephone reimb. 336 336 4,788 4,452 Welfare - Benefit recoveries 94,707 94,707 107,019 12,312 MSD chargebacks 7,007,360 7,007,360 6,689,601 (317,759)
Total Other Revenues 9,385,445 9,385,445 7,928,112 (1,457,333)
Total Revenues 103,477,710 103,477,710 99,473,623 (4,004,087)
Transfers in 350,000 350,000 306,169 (43,831)
Total Transfers in 350,000 350,000 306,169 (43,831)
Total Revenues and Transfers in 103,827,710 103,827,710 99,779,792 (4,047,918)
106

107
This Page Intentionally Left Blank

General FundSchedule of Expenditures, Encumbrances andOther Financing Uses - Budget and Actual (Budget Basis)
Purchased Purchased Other Salaries & Employee Professional Property Purchased
Wages Benefits Services Services Services
General GovernmentAldermen 68,460$ 66,566$ Assessors 352,387 61,961 4,150$ 7,727$ Building 854,588 217,866 3,578 25,624 City Clerk 749,034 159,376 21,831 126,167 City Solicitor 658,903 456,574 1,947$ 432,826 Civic ContributionConservation - - - Economic Development Office 187,019 30,488 656 12,676 Elderly Services 157,310 54,936 48,837 4,302 Finance 679,706 123,071 217,119 2,019 27,446 Information Systems 943,346 229,896 14,270 587,430 121,051 Mayor 196,623 48,821 5,874 MCTV 218,568 61,957 NondepartmentalNon-city ProgramHuman Resources 602,065 1,102,395 14,345 47 23,485 Planning 682,334 137,445 5,010 3,123 17,930 Building Maintenance 607,092 154,448 4,281 312,686 3,515,577 Tax Collector 464,577 109,970 16,381 2,981 24,702 Youth Services 398,872 77,483 1,160 27,537 7,533
Total General Government 7,820,884 3,093,253 274,513 1,014,875 4,352,920
Public SafetyFire 12,615,422 3,220,327 18,269 305,822 133,465 Police 13,250,864 3,351,229 7,506 304,093 345,074
Total Public Safety 25,866,286 6,571,556 25,775 609,915 478,539
Health and SanitationHealth 1,860,070 459,861 2,883 8,097 73,405
Total Health and Sanitation 1,860,070 459,861 2,883 8,097 73,405
Highway and StreetsHighway 7,511,106 2,106,989 6,106 4,957,579 266,806 Traffic 657,496 175,861 34,380 1,333,614 727,191
Total Highway and Streets 8,168,602 2,282,850 40,486 6,291,193 993,997
WelfareWelfare 421,444 85,783 2,139 58,724 179,434
Total Welfare 421,444 85,783 2,139 58,724 179,434
EducationMSDLibrary 1,431,917 341,313 73,306 22,549
Total Education 1,431,917 341,313 73,306 22,549
Parks and RecreationParks & Recreation 1,795,029 382,918 432 93,731 47,225
Total Parks and Recreation 1,795,029 382,918 432 93,731 47,225
Debt ServicePrincipal retirementInterestIssue costs
Total Debt Service
Total Expenditures 47,364,232 13,217,534 346,228 8,149,841 6,148,069
Other Financing UsesCommunity improvement program
Total Other Financing Uses
Total Expenditures and Other Financing Uses 47,364,232$ 13,217,534$ 346,228$ 8,149,841$ 6,148,069$
108

Supplies & Capital 2003 Total 2003 Revised 2003 Original 2002 Total
Materials Outlay Miscellaneous Commitments Budget Variance Budget Commitments
135,026$ 136,375$ 1,349$ 138,044$ 129,641$ 14,192$ 3,876$ 444,293 465,343 21,050 504,449 501,367 6,787 1,284 1,109,727 1,164,146 54,419 1,166,377 1,144,879
48,004 18,411 59,669 1,182,492 1,224,131 41,639 1,206,707 1,235,634 14,959 8,631 1,573,840 1,109,524 (464,316) 1,112,351 1,116,746
119,645 119,645 124,644 4,999 152,644 114,678 - 13,310 13,310 13,355 45 13,355 8,382
1,460 1,156 233,455 262,628 29,173 264,628 245,385 8,601 75 274,061 286,952 12,891 298,372 279,556
14,046 62,203 1,125,610 1,212,310 86,700 1,227,143 1,268,584 35,976 2,447 370 1,934,786 2,003,851 69,065 2,028,369 1,927,239 1,166 (1,195) 251,289 263,317 12,028 266,539 270,005
91,100 371,625 385,700 14,075 385,700 330,302 884,911 884,911 2,119,037 1,234,126 1,580,000 1,279,912 67,597 67,597 67,597 67,597 66,893
8,822 6,429 34,235 1,791,823 2,504,469 712,646 2,515,995 1,340,402 4,325 1,070 851,237 897,873 46,636 903,541 851,362
382,794 12,247 272,154 5,261,279 5,363,021 101,742 5,319,422 5,139,331 7,551 92 626,254 703,099 76,845 733,836 672,006 3,648 (200) 2,639 518,672 523,278 4,606 528,899 474,258
552,331 39,334 1,622,822 18,770,932 20,830,650 2,059,718 20,413,968 18,396,562
344,264 135,173 14,749 16,787,491 17,392,848 605,357 17,452,848 16,365,615 440,435 11,770 192,081 17,903,052 18,241,240 338,188 18,301,240 17,488,204 784,699 146,943 206,830 34,690,543 35,634,088 943,545 35,754,088 33,853,819
64,090 5,054 2,082 2,475,542 2,805,523 329,981 2,805,523 2,705,481 64,090 5,054 2,082 2,475,542 2,805,523 329,981 2,805,523 2,705,481
1,350,303 75,260 980,579 17,254,728 17,513,531 258,803 17,713,531 16,351,453 285,365 5,247 3,219,154 3,329,582 110,428 3,364,146 3,384,481
1,635,668 75,260 985,826 20,473,882 20,843,113 369,231 21,077,677 19,735,934
5,965 58 591,884 1,345,431 1,476,875 131,444 1,476,875 2,145,427 5,965 58 591,884 1,345,431 1,476,875 131,444 1,476,875 2,145,427
278,604 1,156 2,148,845 2,283,783 134,938 2,306,852 2,253,692 278,604 - 1,156 2,148,845 2,283,783 134,938 2,306,852 2,253,692
287,959 63,972 347,053 3,018,319 3,191,498 173,179 3,230,547 3,032,982 287,959 63,972 347,053 3,018,319 3,191,498 173,179 3,230,547 3,032,982
10,890,802 10,890,802 10,890,802 10,890,802 11,030,422 5,181,213 5,181,213 5,181,213 5,181,213 3,565,940
- 158,66216,072,015 16,072,015 16,072,015 16,072,015 14,755,024
3,609,316 330,621 19,829,668 98,995,509 103,137,545 4,142,036 103,137,545 96,878,921
1,790,165 1,790,165 1,790,165 1,790,165 1,620,7421,790,165 1,790,165 1,790,165 1,790,165 1,620,742
3,609,316$ 330,621$ 21,619,833$ 100,785,674$ 104,927,710$ 4,142,036$ 104,927,710$ 98,499,663$
City of Manchester, New HampshireYear Ended June 30, 2002
109
Commitments vsRevised Budget

110
This Page Intentionally Left Blank

CITY OF MANCHESTER, NEW HAMPSHIREComprehensive Annual Financial Report
Year Ended June 30, 2003
Nonmajor Governmental Funds
Special Revenue Funds are to account for revenues legally restricted for specificexpenditures.
HUD Section 108 Fund - to account for Housing Urban Development Programsthat qualify for funding under Section 108.
Cash Special Projects Fund - to account for cash funded special programs,administered by City Departments.
CDBG - to account for various Community Development Block Grant fundedprograms.
Other Grant Fund - to account for all other Federal, State and private grants forspecial programs administered by City departments.
Civic Center - to account for a portion of the Meals and Rooms Tax distributionfrom the State of New Hampshire to help fund a City owned civic center.
Revolving Loan Fund - to account for a loan program funded by CDBG funds.
Expendable Trust Fund - to account for contributions and income receivedfrom various revenue sources for non-capital and capital reserve funds.
Permanent Funds are to report resources that are legally restricted to the extent that onlyearnings, not principal, may be used for purposes that support the reporting government’sprograms.
Cemetery Trust Fund - to account for assets, contributions and incomeearned on investments used to maintain the City's cemeteries and endowmentfunds, as well as for other purposes deemed appropriate by the Trustees.
Library Trust Fund - to account for contributions and income earned oninvestments used to maintain the City's library. The principal of the Trust ispreserved with income used to add to the City's library resources.
NONMAJOR
GOVERNMENTAL
FUNDS

111
This Page Intentionally Left Blank

Nonmajor Governmental FundsCombining Balance Sheet
CashHUD Special Other
Section 108 Projects CDBG GrantsFund Fund Fund Fund
AssetsCash and cash equivalents 109,375$ 633,053$ 106,204$ 1,758,239$ Restricted cash and cash equivalents 2,988,194 InvestmentsReceivables, net of allowances
for collection losses 4,194,609 341,585
Total Assets 4,303,984$ 633,053$ 106,204$ 5,088,018$
Liabilities and Fund Equity
LiabilitiesAccounts and warrants payable 2,730,000$ 188,216$ 125,114$ 599,810$ Accrued liabilities 6,717 22,138 35,510 Due to other funds 1,573,984 105,568 Deferred revenue 2,987,734 Other 77,725
Total Liabilities 4,303,984 194,933 252,820 3,700,779
Fund EquityFund balances
Reserved forEncumbrances 88,914 130,694 339,957 Cemetery and other trust fundsLibrary
Unreserved Undesignated fund balance 349,206 (277,310) 1,047,282
Total Fund Equity (Deficit) 438,120 (146,616) 1,387,239
Total Liabilities and Fund Equity 4,303,984$ 633,053$ 106,204$ 5,088,018$
112
Special Revenue

Permanent Funds
Civic Revolving ExpendableCenter Loan Trust Cemetery LibraryFund Fund Fund Trust Trust Total
175,658 1,414$ 2,471$ 111,861$ 32,251$ 2,930,526$ 93,876 181,612 3,263,682
1,423,447 11,813,791 2,430,489 15,667,727
62,986 84 11,210 4,610,474
175,658$ 158,276$ 1,426,002$ 11,925,652$ 2,655,562$ 26,472,409$
3,643,140$ 1,225$ 65,590
394,467$ 2,074,019 2,987,734
77,725
1,225 394,467 8,848,208
- -
559,565 11,925,652$ 11,925,652
2,655,562$ 2,655,562
175,658$ 157,051 1,031,535 2,483,422
175,658 157,051 1,031,535 11,925,652 2,655,562 17,624,201
175,658$ 158,276$ 1,426,002$ 11,925,652$ 2,655,562$ 26,472,409$
113
June 30, 2003City of Manchester, New Hampshire
Special Revenue

Nonmajor Governmental FundsCombining Statement of Revenues,Expenditures and Changes in Fund Balances
CashHUD Special Other
Section 108 Projects CDBG GrantFund Fund Fund Fund
RevenuesFederal and state grants and aid 1,720,651$ 4,806,101$ Nonenterprise charges for sales and services 122,228Interest 64ContributionsNet loss on sale of securitiesOther 514,391
Total Revenues 1,720,651 5,442,784
ExpendituresCurrent:
General government 689,165$ 1,303,911 1,664,633Public safety 4,894 1,290,027Health and sanitation 3,140 29,264 1,446,750Highway and streets 779,383 187,116 873,081Welfare 20,942Education 8,552Parks and recreation 233,958 316,652 288,838Cemetery TrustInvestment management fee
Total Expenditures 1,719,092 1,836,943 5,584,271
Excess (deficiency) of revenues over expenditures (1,719,092) (116,292) (141,487)
Other Financing Sources (Uses)Transfers in 1,875,842 150,000Transfers out (339,142) (150,000)
Total Other Financing Sources (Uses) 1,536,700
Net Change in Fund Balance (182,392) (116,292) (141,487)
Fund Balance (Deficit), beginning of year 620,512 (30,324) 1,528,726
Fund Balance (Deficit), end of year -$ 438,120$ (146,616)$ 1,387,239$
114
Special Revenue

`
Civic RevolvingCenter Loan Expendable Cemetery LibraryFund Fund Trust Trust Trust Total
2,625,711$ 9,152,463$ 122,228
658 16,619$ 18,317$ 231,164$ 84,592$ 351,414 108,564 8,965 117,529
(4,579) 94,562 (14,922) 75,061 226,091 740,482
2,852,460 16,619 13,738 434,290 78,635 10,559,177
2,851,802 222,540 6,732,051 1,294,921 1,479,154 1,839,580
20,942 91,633 100,185
839,448 34,000 34,000
8,800 14,711 23,511
2,851,802 222,540 42,800 106,344 12,363,792
658 16,619 (208,802) 391,490 (27,709) (1,804,615)
2,025,842 (300,100) (789,242)
(300,100) 1,236,600
658 16,619 (208,802) 91,390 (27,709) (568,015)
175,000 140,432 1,240,337 11,834,262 2,683,271 $18,192,216
175,658$ 157,051$ 1,031,535$ 11,925,652$ 2,655,562$ 17,624,201$
115
Year Ended June 30, 2003City of Manchester, New Hampshire
Permanent FundsSpecial Revenue

116
This Page Intentionally Left Blank

CITY OF MANCHESTER, NEW HAMPSHIREComprehensive Annual Financial Report
Year Ended June 30, 2003
Enterprise Funds - to account for the operations of the City that are financed and operatedin a manner similar to private business enterprises. The intent of the governing body is thatthe costs of providing goods or services to the general public on a continuing basis will berecovered or financed primarily through user charges.
Recreation Fund - to account for certain operations of the Parks andRecreation Department related to the revenue generating recreationalfacilities owned by the City. These facilities included a ski area, a golf course,a stadium and two ice skating rinks.
Aggregation Fund - to account for revenues and expenditures incurred inprocuring energy services for the City.
NONMAJOR
PROPRIETARY
FUNDS

Nonmajor Proprietary FundsCombining Statement of Net Assets
Recreation AggregationFund Fund Total
AssetsCurrent assets:
Receivables, net of allowancesfor collection losses 192,802$ 4,293$ 197,095$
Prepaid items 30,736 30,736 Inventories 5,908 5,908
Total current assets: 223,538 10,201 233,739
Noncurrent assets:Capital assets, net, where applicable,
of accumulated depreciation 4,021,999 3,184 4,025,183 Other assets 38,928 38,928
Total noncurrent assets: 4,021,999 42,112 4,064,111
Total Assets 4,245,537$ 52,313$ 4,297,850$
LiabilitiesCurrent liabilities
Accounts and warrants payable 98,670$ 4,187$ 102,857$ Accrued liabilities 31,212 3,207 34,419 Due to other funds 401,627 1,623,865 2,025,492 Bonds and notes payable - City 121,600 121,600 Compensated absences 149,660 2,155 151,815
Total Current liabilities 802,769 1,633,414 2,436,183
Noncurrent liabilitiesBonds payable 824,400 824,400 Deferred Revenue 18,794 18,794
Total Noncurrent liabilities 843,194 - 843,194
Total Liabilities 1,645,963 1,633,414 3,279,377
Net AssetsInvested in Capital Assets,
net of related debt 3,075,999 3,184 3,079,183 Unreserved (476,425) (1,584,285) (2,060,710)
Total Net Assets 2,599,574$ (1,581,101)$ 1,018,473$
117
City of Manchester, New HampshireJune 30, 2003
Non-MajorBusiness-type Activities-Enterprise Funds

Nonmajor Proprietary FundsCombining Statement of Revenues, Expensesand Changes in Fund Net Assets (Deficits)
Recreation AggregationFund Fund Total
Operating RevenuesCharges for goods and services 2,249,919$ 116,173$ 2,366,092$ Other 928 51,000 51,928
Total Operating Revenues 2,250,847 167,173 2,418,020
Operating ExpensesPersonnel services 1,415,648 56,126 1,471,774 Plant maintenance 83,703 83,703 Light/heat and power 281,411 281,411 General and administrative 236,966 33,323 270,289 Depreciation and amortization 287,276 43,792 331,068
Total Operating Expenses 2,305,004 133,241 2,438,245
Operating Income (Loss) (54,157) 33,932 (20,225)
Non-Operating Revenues (Expenses), netInterest expense (54,449) (28,984) (83,433) Rent and other income 23,982 14,917 38,899
Total Non-operating Revenues (Expenses) (30,467) (14,067) (44,534)
Change in Net Assets (84,624) 19,865 (64,759)
Fund Net Assets (Deficit), beginning of year 2,684,198 (1,600,966) 1,083,232
Fund Net Assets (Deficit), end of year 2,599,574$ (1,581,101)$ 1,018,473$
118
Business-type Activities-Enterprise Funds
City of Manchester, New HampshireYear Ended June 30, 2003

Nonmajor Proprietary Funds Statement of Cash Flows
Recreation AggregationFund Fund Total
Cash Flows from Operating ActivitiesCash received from customers 2,223,323$ 52,616$ 2,275,939$ Cash payments for goods and services (621,471) (27,471) (648,942) Cash payments to employees for services (1,394,022) (55,429) (1,449,451) Other operating revenues 23,982 51,000 74,982
Net Cash Provided by Operating Activities 231,812 20,716 252,528
Cash Flows from Non-Capital and Related Financing ActivitiesInterest paid on cash advances (27,238) (27,238) Short-term cash advance from City 172,645 (96,301) 76,344
Net Cash Provided by (Used in) Non-Capital & Related Financing Activities 172,645 (123,539) 49,106
Cash Flows from Capital and Related Financing ActivitiesReimbursement of bond interest expenses 14,917 14,917 Principal paid on bonds (126,600) (25,000) (151,600) Interest paid on bonds (55,260) (2,094) (57,354) Acquisition and construction of capital assets (222,597) (222,597) Proceeds from sale of capital assets 115,000 115,000
Net Cash Provided by (Used in) Capital & Related Financing Activities (404,457) 102,823 (301,634)
Net Change in Cash and Cash Equivalents - - -
Cash and Cash Equivalents at Beginning of Year - - -
Cash and Cash Equivalents at End of Year -$ -$ -$
Reconciliation of operating income (loss) to net cash provided by operating activities
Operating income (loss) (54,157)$ 33,932$ (20,225)$ Adjustments to reconcile operating income (loss) to cash provided by operating activities:
Depreciation and amortization 287,276 43,792 331,068 Non-operating revenue 23,982 23,982
Change in Assets and Liabilities (Increase) decrease in receivables (32,890) 29,655 (3,235) Increase in prepaid expenses and other assets (30,736) (30,736) Decrease in accounts payable 11,011 4,187 15,198 Increase (decrease) in accrued liabilities 334 (91,547) (91,213) Increase in compensated absences 21,626 697 22,323 Increase in Deferred Revenue 5,366 5,366
Net Cash Provided by Operating Activities 231,812$ 20,716$ 252,528$ 0 0 0
Schedule of Noncash Investing, Capital and Financing ActivitiesTransfer of Debt to General fund 25,000 25,000 Donation of land
City of Manchester, New HampshireYear Ended June 30, 2003
Business-type Activities-Enterprise Funds
119

120
This Page Intentionally Left Blank

CITY OF MANCHESTER, NEW HAMPSHIREComprehensive Annual Financial Report
Year Ended June 30, 2003
Governmental Capital Assets - Capital assets of the City used in the operation notrelated to specific proprietary or trust funds.
GOVERNMENTAL
CAPITAL
ASSETS

Capital AssetsLand 18,983,808$ Buildings 170,676,092 Improvements other than buildings 14,254,148 Equipment 6,060,924 Work-in-Process 18,902,050 Vehicles 16,084,830 Infrastructure 35,430,640
Total Capital Assets 280,392,492$
Investments in Capital AssetsCapital project funds 232,842,520$ General fund revenues 26,613,382 Special revenue funds 20,936,590
Total Investments in Capital Assets 280,392,492$
121
Governmental Capital AssetsSchedule of Capital Assets - By Source
City of Manchester, New HampshireJune 30, 2003

Governmental Capital AssetsSchedule of Capital Assets - By Function and Activity
Improvementsother than
Land Buildings buildings Equipment Vehicles Infrastructure Total
General GovernmentAssessorsBuilding 5,985$ 115,176$ 121,161$ City Clerk 90,304$ 38,001 37,840 166,145 City Solicitor 5,115 5,115 Civic Center 2,960,900$ 62,739,798 65,700,698 Economic Development Office 4,109,431 5,294 4,114,725 Elderly Services - Finance 105,000 25,775 130,775 Information Systems 939,797 14,375 954,172 Mayor 19,495 19,495 Personnel 21,663 21,663 Planning 44,714 768,974 25,311 838,999 Public Buildings 437,250 7,888,750 22,505 389,337 8,737,842 Tax Collector - Youth Services -
Total General Government 7,657,295 71,487,826 - 1,067,783 597,886 - 80,810,790
Public SafetyFire Protection 661,291 6,581,752 55,714$ 432,410 6,278,685 14,009,852 Police Protection 96,115 3,445,944 52,716 277,176 809,518 4,681,469
Total Public Safety 757,406 10,027,696 108,430 709,586 7,088,203 - 18,691,321
Health and SanitationCemetery 71,255 298,604 322,782 374,977 1,067,618 Health 164,529 241,702 406,231
Total Health and Sanitation 71,255 298,604 - 487,311 616,679 - 1,473,849
Highway and StreetsHighway 108,104 1,270,028 800,565 596,799 6,580,966 35,080,760$ 44,437,222 Traffic 3,687,949 15,642,972 1,736,206 240,437 320,553 21,628,117
Total Highway and Streets 3,796,053 16,913,000 2,536,771 837,236 6,901,519 35,080,760 66,065,339
WelfareWelfare 27,488 109,955 137,443
Total Welfare 27,488 109,955 - - - - 137,443
EducationHigh School Athletics - Library 72,270 1,334,211 110,198 1,516,679 School 1,609,845 67,548,783 1,835,615 70,994,243
Total Education 1,682,115 68,882,994 1,835,615 110,198 - - 72,510,922
Parks and RecreationParks & Recreation 4,992,196 2,956,017 9,773,332 2,848,810 880,543 349,880 21,800,778
Total Parks and Recreation 4,992,196 2,956,017 9,773,332 2,848,810 880,543 349,880 21,800,778
Construction in Progress 17,330,453 1,571,597 18,902,050
Total General Fixed AssetsAllocated to Functions 18,983,808$ 188,006,545$ 15,825,745$ 6,060,924$ 16,084,830$ 35,430,640$ 280,392,492$
City of Manchester, New HampshireJune 30, 2003
122

Capital Assets Capital AssetsAdditions Deductions Transfers
General GovernmentBuilding 121,161$ 121,161$ City Clerk 166,145 166,145City Solicitor 5,115 5,115Civic Center 65,700,698 65,700,698Economic Development Office 4,114,725 4,114,725Finance 130,775 130,775Information Systems 437,766 509,411 6,995 954,172Mayor 19,495 19,495Personnel - 21,663 21,663Planning 845,994 (6,995) 838,999Public Buildings 8,692,173 45,669 8,737,842Tax Collector - Youth Services -
Total General Government 80,234,047 509,411 67,332 80,810,790
Public SafetyFire Protection 11,391,803 1,528,049 (10,000) 1,100,000 14,009,852Police Protection 4,685,680 52,550 (56,761)$ 4,681,469
Total Public Safety 16,077,483 1,580,599 (10,000) 1,043,239 18,691,321
Health and SanitationCemetery 1,053,069 14,549 1,067,618Health 252,388 153,843 406,231
Total Health and Sanitation 1,305,457 168,392 1,473,849
Highway and StreetsHighway 42,798,241 1,821,543 (199,882) 17,320 44,437,222 Traffic 21,626,934 29,074 (27,891) 21,628,117
Total Highway and Streets 64,425,175 1,850,617 (199,882) (10,571) 66,065,339
WelfareWelfare 137,443 137,443
Total Welfare 137,443 137,443
EducationLibrary 1,516,679 - 1,516,679 School 70,994,243 - 70,994,243
Total Education 72,510,922 72,510,922
Parks and RecreationParks & Recreation 20,068,362 1,081,146 (47,700) 698,970 21,800,778
Total Parks and Recreation 20,068,362 1,081,146 (47,700) 698,970 21,800,778
Construction in Progress 17,544,172 3,156,848 (1,798,970) 18,902,050
Total General Fixed AssetsAllocated to Functions 272,303,061$ 8,347,013$ (257,582)$ -$ 280,392,492$
123
Governmental Capital AssetsSchedule of Changes in Capital Assets - By Function and Activity
End of YearBeginning of Year
City of Manchester, New HampshireYear Ended June 30, 2003

124
This Page Intentionally Left Blank

STATISTICALSECTION

125
This Page Intentionally Left Blank

General Governmental Expenditures by Function (1)Last Ten Fiscal Years
Fiscal General Public Health and Highway Year Government Safety Sanitation and Streets Welfare
1994 (2) 23,632,081 35,347,208 3,584,951 20,668,958 1,799,492
1995 13,024,281 23,949,556 2,412,168 13,238,142 1,089,981
1996 14,047,737 24,822,918 2,356,684 14,468,980 1,118,771
1997 11,878,493 25,163,363 2,451,268 16,126,906 1,035,032
1998 11,469,775 27,063,571 2,544,046 16,538,533 1,524,002
1999 15,082,402 28,775,663 1,984,397 17,426,902 932,944
2000 17,751,003 29,689,148 2,304,060 18,505,080 1,213,010 2000 (4)2000 17,751,003 29,689,148 2,304,060 18,505,080 1,213,010
2001 17,384,526 32,148,521 2,620,250 19,717,326 1,401,741 2001 (4)2001 17,384,526 32,148,521 2,620,250 19,717,326 1,401,741
2002 18,368,831 34,556,506 2,711,544 20,099,068 2,146,722 2002 (4)2002 18,368,831 34,556,506 2,711,544 20,099,068 2,146,722
2003 18,658,422 35,444,763 2,462,857 19,902,962 1,352,284 2003 (4)2003 18,658,422 35,444,763 2,462,857 19,902,962 1,352,284
Notes
(1) Includes the General Fund only prepared using GAAP basis.
(2) Fiscal 1994 represents an 18 month operating budget to cover the City's fiscal year conversion period.
(3) Beginning in fiscal 1995 many recreation functions were accounted for in the Enterprise Fund.
(4) MSD is included as a governmental discrete component unit beginning in fiscal year 2000.
(5) City and MSD combined school chargebacks , were not allocated toschool department from other general fund departments prior to this year.
126

City of Manchester, New HampshireTable I
Parks and Total Education Recreation Debt Service Expenditures
94,826,842 3,779,205 17,505,727 201,144,464
65,080,717 1,088,965 (3) 15,501,374 135,385,184
70,883,458 1,166,400 15,290,065 144,155,013
69,740,141 1,158,885 16,872,450 144,426,538
78,409,488 1,169,744 16,164,151 154,883,310
79,988,320 2,411,070 19,733,680 166,335,378
3,049,175 2,790,074 13,522,285 88,823,835 107,809,716 (5) 8,407,080 116,216,796 110,858,891 2,790,074 21,929,365 205,040,631
2,184,410 2,940,972 13,873,698 92,271,444 108,250,789 8,194,461 116,445,250 110,435,199 2,940,972 22,068,159 208,716,694
2,258,746 3,034,011 14,755,024 97,930,452 128,526,953 - 128,526,953 130,785,699 3,034,011 14,755,024 226,457,405
2,145,815 2,992,399 16,072,014 99,031,516 136,173,457 - 136,173,457 138,319,272 2,992,399 16,072,014 235,204,973
127

Charges forFiscal Federal Sales and LicensesYear Taxes and State Services and Permits
1994 (2) 100,952,145 17,704,791 17,388,372 13,116,970
1995 95,650,105 13,191,242 10,795,404 10,192,255
1996 100,570,543 13,645,131 11,120,727 11,120,727
1997 103,951,582 14,354,349 11,578,643 13,802,836
1998 107,223,578 18,769,545 13,711,063 14,129,835
1999 117,348,501 17,963,054 14,138,976 14,969,847
2000 60,190,452 7,302,746 3,615,039 16,212,440 2000 (3) 23,167,248 (4) 71,911,186 13,458,205 - 2000 83,357,700 79,213,932 17,073,244 16,212,440
2001 58,628,056 7,146,789 3,898,497 18,432,863 2001 (3) 26,968,740 (4) 72,758,132 15,689,722 - 2001 85,596,796 79,904,921 19,588,219 18,432,863
2002 59,020,928 7,291,673 4,432,086 19,744,630 2002 (3) 27,046,973 (4) 84,367,190 15,266,844 - 2002 86,067,901 91,658,863 19,698,930 19,744,630
2003 59,369,549 7,549,154 4,491,647 20,521,738 2003 (3) 34,512,636 (4) 87,782,355 16,539,326 - 2003 93,882,185 95,331,509 21,030,973 20,521,738
Notes
(1) Includes the General Fund only using GAAP basis.
(2) Fiscal 1994 represents an 18 month operating budget to cover the City's fiscal year conversion period.
(3) MSD is included as a governmental discrete component unit beginning in fiscal year 2000.
(4) The City issues a combined property tax bill for both local and state funding.The State portion is included in federal and state.
128
Last Ten Fiscal YearsGeneral Governmental Revenues by Source (1)

TotalInterest Other Revenues
1,752,094 5,086,908 156,001,280
1,856,668 3,200,885 134,886,559
2,426,075 2,969,759 141,852,962
2,342,522 3,100,525 149,130,457
2,008,604 1,403,320 157,245,945
1,989,669 1,384,046 167,794,093
2,548,473 6,655,281 96,524,431 - 5,626,537 114,163,176
2,548,473 12,281,818 210,687,607
2,255,766 7,942,319 98,304,290 443,944 1,153,134 117,013,672
2,699,710 9,095,453 215,317,962
1,132,648 9,120,585 100,742,550 202,593 76,678 126,960,278
1,335,241 9,197,263 227,702,828
736,111 8,594,706 101,262,905 129,158 151,495 139,114,970 865,269 8,746,201 240,377,875
129
City of Manchester, New HampshireTable II

Percent of DelinquentFiscal Current Tax Current Taxes TaxYear Collections (1) Collected Collections (1)
1994 (2) 105,408,690 100,530,691 95.37% 16,428,716
1995 106,908,274 102,767,174 96.13% 7,196,199
1996 106,457,759 103,886,028 97.58% 4,683,658
1997 113,630,813 110,590,166 97.32% 3,464,940
1998 114,851,627 112,425,511 97.89% 2,869,480
1999 120,680,494 117,945,857 97.73% 4,035,991
2000 67,984,582 2000 (3) 47,634,400 2000 115,618,982 113,614,291 98.56% 2,539,282
2001 63,738,811 2001 (3) 52,484,6942001 116,223,505 114,648,459 98.64% 2,355,346
2002 66,132,649 2002 (3) 55,489,4702002 121,622,119 120,213,115 98.84% 2,188,790
2003 66,896,880 2003 (3) 63,667,8572003 130,564,737 129,134,168 98.90% 1,506,291
Notes
(1)
(2)
(3) MSD is included as a governmental discrete component unit beginning in fiscal year 2000.
130
Property Tax Levies and CollectionsLast Ten Fiscal Years
Actual collections of levy, including additional warrants (less refunds), and amounts refundable, including proceeds from tax titles, possessions, abatements and other credits.
Fiscal 1994 represents an 18 month operating budget to cover the City's fiscal year conversion period.
Total Tax Levy

Ratio of Ratio of Total Tax Outstanding Delinquent
Total Tax Collections to Delinquent Taxes to Total Collections (1) Total Tax Levy Taxes Tax Levy
116,959,407 110.96% 11,561,083 10.97%
109,963,373 102.86% 8,505,985 7.96%
108,569,686 101.98% 6,394,058 6.01%
114,055,106 100.37% 5,969,765 5.25%
115,294,991 100.39% 5,526,401 4.81%
121,981,848 101.08% 4,225,047 3.50%
116,153,574 100.64% 3,690,455 2.82%
117,003,805 100.67% 2,910,155 2.50%
122,401,905 100.64% 2,130,369 1.75%
130,640,459 100.06% 2,054,648 1.57%
131
City of Manchester, New HampshireTable III

Fiscal Assessed Estimated Assessed EstimatedYear Value Market Value Value Market Value
1994 (3) 2,181,699,800 1,885,184,683 1,591,546,500 1,417,626,676
1995 2,189,624,800 1,832,332,667 1,546,090,000 1,333,994,744
1996 2,207,856,400 1,843,933,159 1,470,693,500 1,267,839,224
1997 2,236,972,700 1,928,424,741 1,455,775,600 1,254,978,966
1998 2,259,471,600 1,984,603,953 1,465,117,900 1,286,884,409
1999 2,282,638,700 2,037,888,314 1,521,938,800 1,358,752,611
2000 2,304,804,600 2,093,183,725 1,557,536,400 1,414,527,654
2001 2,336,235,300 2,157,786,367 1,560,443,200 1,441,251,686
2002 (4) 3,144,786,262 2,953,682,974 2,123,426,704 1,994,389,691
2003 3,176,542,062 3,049,090,096 2,088,003,742 2,004,227,051
Notes
(1) Exemptions for the blind and elderly.
(2) Amounts shown are net taxable assessed values after deducting exemptions for the blind and elderly.
(3)
(4) Reflects the new assessed valuation determined through a Citywide valuation.
132
Assessed and Estimated Actual Value of Taxable PropertyLast Ten Fiscal Years
Fiscal 1994 represents an 18 month operating budget to cover the City's fiscal year conversion
REAL PROPERTYNON-RESIDENTIAL
REAL PROPERTYRESIDENTIAL

Ratio of TotalAssessed Value
to TotalAssessed Estimated Estimated
Exemptions (1) Value (2) Market Value Market Value
65,233,500 3,708,012,800 3,302,811,359 112.27%
65,964,850 3,669,749,950 3,166,327,411 115.90%
67,420,550 3,611,129,350 3,111,772,383 116.05%
68,416,750 3,624,331,550 3,183,403,707 113.85%
60,331,000 3,664,258,500 3,271,488,362 112.01%
64,695,250 3,739,882,250 3,396,640,925 110.11%
64,609,150 3,797,731,850 3,507,711,379 108.27%
64,874,250 3,831,804,250 3,599,038,053 106.47%
113,152,500 5,155,060,466 4,948,072,665 104.18%
133,472,400 5,131,073,404 5,053,317,147 101.54%
133
City of Manchester, New HampshireTable IV
TOTAL

Special Assessment Billings and Collection -Central Business DistrictLast Ten Fiscal Years
Fiscal Year
1994 (1) 35,577 35,577 100.00% 14,422
1995 40,600 40,600 100.00% -
1996 180,374 180,108 99.85% -
1997 150,272 149,300 99.35% 164
1998 167,176 155,238 92.86% -
1999 223,818 222,206 99.28% 11,958
2000 221,289 218,844 98.90% 2,432
2001 205,833 204,208 99.21% 1,505
2002 207,495 192,415 92.73% 2,819
2003 220,253 218,496 99.20% 13,284
Notes
(1)
134
DelinquentAssessmentCollections
Fiscal 1994 represents an 18 month operating budget to cover the City's fiscal year conversion period.
Total
BillingsAssessment
Percent
Collectedof BillingsCurrent
Collections

49,999 140.54% - 0.00%
40,600 100.00% - 0.00%
180,108 99.85% 266 0.15%
149,464 99.46% 1,074 0.71%
155,238 92.86% 13,032 7.80%
234,164 104.62% 2,686 1.20%
221,276 99.99% 2,699 1.22%
205,713 99.94% 2,819 1.37%
195,234 94.09% 15,080 7.27%
231,779 105.23% 3,555 1.61%
135
City of Manchester, New HampshireTable V
of Total Billingsas a Percent
Total CollectionsRatio of
Delinquent
to Total BillingsAssessments
Outstanding
AssessmentsDelinquentTotal
Collections

`
REAL PROPERTY TAX RATES
Fiscal Rate per thousand (1)Year City School School County Total
Local State
1994 4.20 22.24 2.11 28.55 (2)
1995 10.93 15.73 2.00 28.66
1996 10.29 17.32 2.02 29.63
1997 11.37 17.42 2.05 30.84
1998 11.88 17.31 1.97 31.16
1999 12.17 18.47 1.91 32.55
2000 15.53 6.10 6.94$ 1.92 30.49 (3)
2001 14.74 7.04 6.86 2.04 30.68
2002 11.26 5.25 5.66 1.65 23.82 (4)
2003 11.51 6.73 5.83 1.61 25.68
Notes
(1) Rates are based on assessed value of property. Assessment rate for real property is 100% percent.
(2) Fiscal 1994 represents an 18 month operating budget to cover the City's fiscal year conversion period.
(3) Beginning in 2000, Rate includes Statewide tax for education.
(4) 2002 tax rate reflects the new assessed valuation determined through a Citywide valuation.
136
Property Tax RatesLast Ten Fiscal Years Table VI
City of Manchester, New Hampshire

Base Valuation - Real Estate (1) 7,040,701,663$
Legal Debt Limit (City):
9.75% of Base Valuation 686,468,412$
Amount of Debt Applicable to Legal Debt Limit:Total Bonded Debt for General Government (2) 113,247,643$ Recreation Enterprise Debt 946,000 Aggregation Enterprise Debt 25,000 Less: Debt for Fiscal Year Conversion (6,199,461) Less: Debt for Urban Redevelopment (2,744,909) Less: Debt for Parking Facilities (2,919,142) Less: Debt for Pension Obligation Bonds (17,230,045) 85,125,085
Legal Debt Limit - City $601,343,327Legal Debt Margin:
Percent of:Legal Debt Margin Outstanding 12.4%Legal Debt Margin Available 87.6%
100.0%
Legal Debt Limit (School):
7% of Base Valuation 492,849,116$ Amount of Debt Applicable to Legal Debt Limit:
Bonded Debt for School District 41,682,258$ Less: Debt for fiscal year conversion (3,223,720) Less: Debt for Pension Obligation Bonds (59,002) 38,399,536
Legal Debt Limit - School 454,449,580$ Legal Debt Margin:
Percent of:Legal Debt Margin Outstanding 7.8%Legal Debt Margin Available 92.2%
100.0%Legal Debt Limit (Water and Waste Water):
10% of Base Valuation 704,070,166$
Amount of Debt Applicable to Legal Debt Limit:Debt for water projects 10,256,458$ Debt for sewer projects 32,827,701 43,084,159
Legal Debt Limit - Water & Wastewater 660,986,008$ Legal Debt Margin:
Percent of:Legal Debt Margin Outstanding 6.1%Legal Debt Margin Available 93.9%
100.0%Summary of Base Valuation:
2002 Net Local Assessed Valuation 5,264,545,804$ State of New Hampshire Dept. of Revenue Administration Inventory Adjustment 1,575,060,992 State of New Hampshire Dept. of Revenue Administration Shared Revenue Adjustment 201,094,867
7,040,701,663$
(1) The general debt limit of the City is 9.75% of base valuation. The base valuation for computing the debt limit is determined by addingthe amount of taxable property lost to cities, towns and districts as a result of the enactment of the State Business Profit Tax Lawto the "equalize assessed valuation". Not more than 7% of the base valuation may be incurred for school purposes. Water andsewer projects ordered by the State Water Supply and Pollution Control Commission, self-supporting sewer debt, debt for urbanredevelopment and housing purposes, and overlapping debt are excluded from the measure of indebtedness. Other water projectsare subject to a separate, special debt limit of 10% of the City's base valuation. Borrowings authorized by legislative acts rather thanthe general municipal finance statutes are sometimes excluded from a city or town's debt limit.The Total Equalized Valuation figure includes Utility Valuation and Railroad Monies Reimbursements.
(2) The total bonded debt for general government includes the School District portion.
137
City of Manchester, New HampshireTable VII
Computation of Legal Debt MarginJune 30, 2003

Ratio of Net General Obligation Bonded Debt toAssessed Value and Net Bonded Debt Per CapitaLast Ten Fiscal Years
Debt Payable from Fiscal Assessed Gross Enterprise Year Population (1) Value (2) Bonded Debt Revenues
1994 (3) 101,039 3,708,012,800 175,916,541 64,160,633
1995 100,668 3,669,749,950 183,319,614 81,919,281
1996 101,900 3,611,129,350 201,193,606 83,240,962
1997 102,675 3,624,331,550 185,624,973 79,118,458
1998 103,330 3,664,258,500 196,451,555 75,198,876
1999 105,221 3,739,882,250 303,770,286 196,421,507
2000 106,180 3,797,731,850 381,830,519 254,435,951
2001 107,297 3,831,804,250 371,180,560 260,310,117
2002 108,078 5,155,060,466 467,614,567 331,827,007
2003 108,150 5,131,073,404 439,401,854 320,465,159
Notes
(1) Population figures acquired from State of New Hampshire, Planning Department.
(2) From Table IV.
(3)
138
Fiscal 1994 represents an 18 month operating budget to cover the City's fiscal year conversion period.

Net Ratio of Net Net General General Obligation General Obligation Bonded Debt Obligation Bonded to Assessed Bonded Debt Debt Value Per Capita
111,755,908 3.01% 1,106
101,400,333 2.76% 1,007
117,952,644 3.27% 1,158
106,506,515 2.94% 1,037
121,252,679 3.31% 1,173
107,348,779 2.87% 1,020
127,394,568 3.35% 1,200
110,870,443 2.89% 1,033
135,787,560 2.63% 1,256
118,936,695 2.32% 1,100
139
City of Manchester, New HampshireTable VIII

Ratio of Annual Debt Service Expenditures for General Obligation Bonded Debt to Total General Governmental Expenditures (1) Table IX Last Ten Fiscal Years
Total GeneralGovernmental
Fiscal ExpendituresYear (City/MSD)
1994 (3) 201,144,464 17,505,727 8.70%
1995 135,385,184 15,501,374 11.45%
1996 144,155,013 15,290,065 10.61%
1997 144,426,538 16,872,450 11.68%
1998 154,883,310 16,164,151 10.44%
1999 166,335,378 19,733,680 11.86%
2000 88,823,835 13,522,285 2000 (4) 100,643,360 8,477,713 2000 189,467,195 21,999,998 11.61%
2001 92,271,444 13,873,698 2001 (4) 104,032,817 8,194,4612001 196,304,261 22,068,159 11.24%
2002 97,930,452 14,596,362 2002 (4) 112,773,899 8,439,5892002 210,704,351 23,035,951 10.93%
2003 99,031,516 16,072,014 2003 (4) 119,872,722 9,250,3882003 218,904,238 25,322,402 11.57%
Notes
(1) Includes the General Fund only.
(2) General obligation bonds reported in enterprise funds have been excluded.
(3)
(4) MSD is included as a governmental discrete component unit beginning in fiscal year 2000.
140
City of Manchester, New Hampshire
fiscal year conversion period.Fiscal 1994 represents an 18 month operating budget to cover the City's
Ratio of DebtService to General
GovernmentalExpenditures
Bonded DebtExpenditures (2)
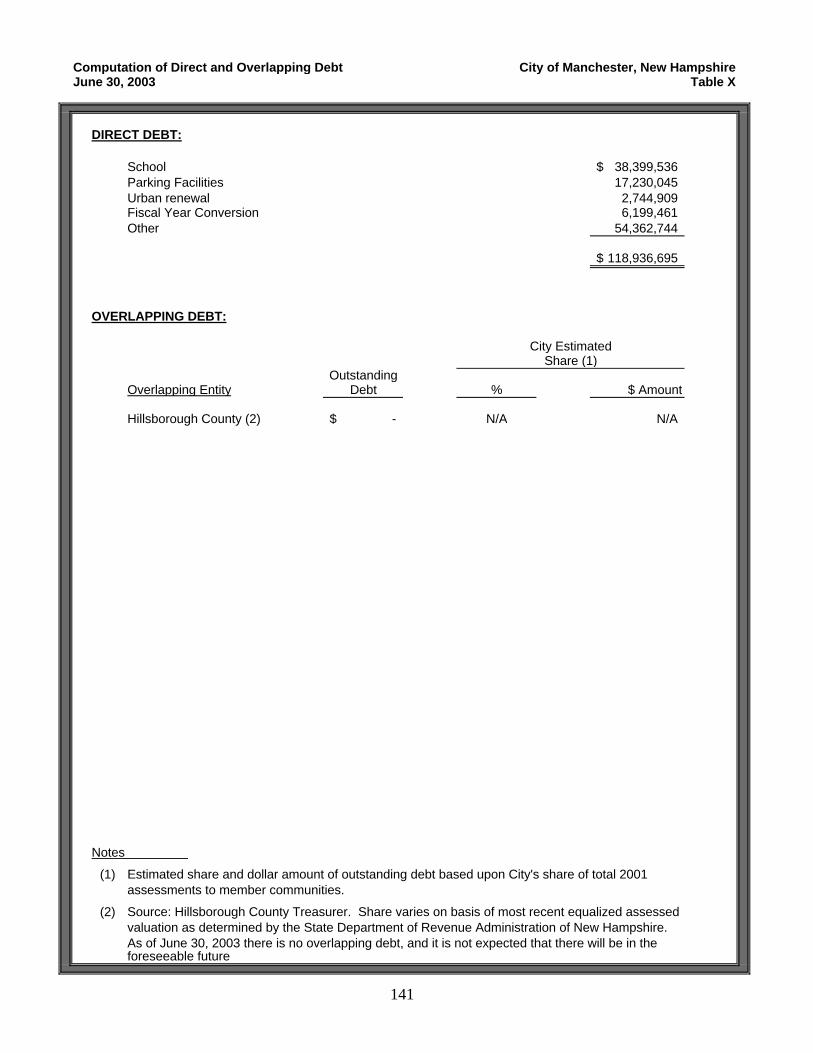
DIRECT DEBT:
School 38,399,536$ Parking Facilities 17,230,045 Urban renewal 2,744,909 Fiscal Year Conversion 6,199,461 Other 54,362,744
118,936,695$
OVERLAPPING DEBT:
City EstimatedShare (1)
OutstandingOverlapping Entity Debt % $ Amount
Hillsborough County (2) -$ N/A N/A
Notes
(1) Estimated share and dollar amount of outstanding debt based upon City's share of total 2001assessments to member communities.
(2) Source: Hillsborough County Treasurer. Share varies on basis of most recent equalized assessedvaluation as determined by the State Department of Revenue Administration of New Hampshire.As of June 30, 2003 there is no overlapping debt, and it is not expected that there will be in the foreseeable future
141
City of Manchester, New HampshireTable X
Computation of Direct and Overlapping DebtJune 30, 2003

Revenue Bond CoverageLast Ten Fiscal Years
Net RevenueAvailable for
Fiscal Gross 1992Year Revenue Expenses (1) Debt Service
1994 (2) 9,143,656 7,276,891 1,866,765$
1995 8,898,791 5,710,017 3,188,774
1996 9,327,954 5,989,549 3,338,405
1997 10,464,648 6,335,497 4,129,151
1998 11,586,104 6,459,977 5,126,127
1999 21,831,476 11,136,557 10,694,919
2000 25,347,377 13,336,522 12,010,855
2001 32,183,363 13,909,243 18,274,120
2002 35,214,341 14,923,309 20,291,032
2003 (4) 38,658,389 20,192,680 N/A
Notes
(1) Exclusive of depreciation and bond interest.
(2)
(3)
(4) As of fiscal 2003, the 1992 Debt was paid off and there is no 1992 Debt Service coverage required.
142
Principal, interest, and O&M reserve required at year end to fund three months of operations and maintenance expense.
Fiscal 1994 represents an 18 month operating budget to cover the City's fiscal year conversion period.

Net RevenueAvailable for
1998/2000/2001/2002Total (3) Coverage Debt Service Total (3) Coverage
1,396,743$ 1.34
4,015,111 0.79
3,993,449 0.84
3,329,084 1.24
3,308,280 1.55
3,306,450 3.23
3,331,255 3.61 8,679,600$ 4,266,791$ 2.03
3,332,688 5.48 14,941,432 6,866,107 2.18
1,666,233 12.18 18,624,799 8,881,197 2.10
N/A N/A 18,465,709 11,300,538 1.63
143
City of Manchester, New HampshireTable XI
Debt Service 1992 Debt Service
REQUIREMENTS REQUIREMENTS1998/2000/2001/2002

Ratio ofBonded Debt Expenditures
Fiscal Local Bonded Debt To LocalYear Revenues Expenditures Revenues
1994 (2) 138,527,744 17,505,727 12.64%
1995 121,695,317 15,501,374 12.74%
1996 128,162,993 15,290,065 11.93%
1997 134,776,108 16,872,450 12.52%
1998 138,476,400 16,164,151 11.67%
1999 149,831,039 19,733,680 13.17%
2000 89,221,685 13,522,285 2000 (3) 42,251,990 8,477,713 2000 131,473,675 21,999,998 16.73%
2001 91,157,501 13,873,698 2001 (3) 44,255,540 8,194,461 2001 135,413,041 22,068,159 16.30%
2002 93,450,877 14,596,362 2002 (3) 42,593,088 8,439,589 2002 136,043,965 23,035,951 16.93%
2003 93,713,751 16,072,014 2003 (3) 51,332,615 9,250,388 2003 145,046,366 25,322,402 17.46%
Notes
(1) Includes the General Fund only.
(2)
(3) MSD is included as a governmental discrete component unit beginning in fiscal year 2000.
144
Fiscal 1994 represents an 18 month operating budget to cover the City's fiscal year conversion period.
City of Manchester, New HampshireTable XII
Ratio of Bonded Debt Expenditures
Last Ten Fiscal Yearsto Local Revenues (1)

NH ManchesterFiscal Per Capita School UnemploymentYear Population (1) Income (2) Enrollment (3) Rate (4)
1994 101,039 23,704 15,032 6.60%
1995 100,668 25,400 15,355 4.60%
1996 101,900 26,526 16,587 4.00%
1997 102,675 26,615 16,791 2.90%
1998 103,330 27,806 17,104 2.70%
1999 105,221 29,303 16,467 2.40%
2000 106,180 31,114 16,693 2.50%
2001 107,006 33,332 16,942 2.80%
2002 108,078 34,138 16,994 4.50%
2003 108,150 35,064 17,172 4.10%
Source
(1) State of New Hampshire, Planning Department
(2) U.S. Department of Commerce, Bureau of Economic Analysis, estimated based on most recent data available.
(3) School Department
(4) State of New Hampshire, Economic and Labor Market Information Bureau
145
Demographic StatisticsLast Ten Fiscal Years
City of Manchester, New HampshireTable XIII

Property Value, Construction, Bank Deposits & Airport TonnageLast Ten Fiscal Years
New New
Fiscal Bank AirportYear Deposits (2) Tonnage (3)
1994 (4) 7,628,500 12,482,470 20,110,970 8,415,277 68,889
1995 7,904,712 30,400,084 38,304,796 (5) 51,774
1996 32,708,609 31,213,466 63,922,075 (5) 59,736
1997 57,985,836 35,906,571 93,892,407 (5) 57,350
1998 51,086,703 26,496,083 77,582,786 (5) 65,513
1999 22,034,115 16,466,026 38,500,141 (5) 72,135
2000 21,514,398 20,446,608 41,961,006 (5) 83,227
2001 49,137,554 27,493,997 76,631,551 (5) 80,711
2002 23,541,058 20,321,036 43,862,094 (5) 93,570
2003 16,374,751 79,676,760 96,051,511 (5) 84,751
Notes
(1) City of Manchester, Building Department
(2) Source: Sheshunoff Reports and State Banking Commissioner
(3) City of Manchester, Airport Authority.
(4) Fiscal 1994 represents an 18 month operating budget to cover the City's fiscal year conversion period.
(5) Unavailable
146
1991 and 1992 are Manchester deposits only. 1994 represents state-wide amounts. Individual municipal breakdowns are not available at this time.
TotalConstructionConstruction
Commercial
Value Value (1)
ResidentialConstruction
Value
City of Manchester, New HampshireTable XIV

% of TotalType of Real Property Assessed
Name of Business Business Assessed Value Value
Manchester Mall Realty Trust Retail Mall 83,500,000$ 1.58%
Public Service Co. of NH Utility 72,151,904 1.36%
Keyspan Energy Delivery Utility 30,011,700 0.57%
IPC Office Properties, LLC Utility 22,342,000 0.42%
Manchester Hill Vistas, Inc Office Condominiums 16,862,600 0.32%
May Center Associates Corp Retail Store 16,600,000 0.31%
Cotter Company Warehouse/Distributor 14,799,900 0.28%
BCIA New England Holdings Office Buildings 14,764,300 0.28%
Portnoy, Barry M. Tee Medical Insurance 14,665,000 0.28%
The Hitchcock Clinic Healthcare Facility 14,337,200 0.27%
300,034,604$ 5.67%
Source City of Manchester, Board of Assessor
147
Principal TaxpayersJune 30, 2003
City of Manchester, New HampshireTable XV

Governmental Expenditures Per Capita (1)Last Ten Fiscal Years
Fiscal General Public Health and Highway Year Population Government Safety Sanitation and Streets
1994 (2) 101,039 156 233 24 136
1995 100,668 129 238 24 132
1996 101,900 138 244 23 142
1997 102,675 116 245 24 157
1998 103,330 111 262 25 160
1999 105,221 143 273 19 166
2000 106,180 167 280 22 174
2001 107,006 162 300 24 184
2002 108,078 170 320 25 186
2003 108,150 173 328 23 184
Notes
conversion period.
148
(2) Fiscal 1994 represents an 18 month operating budget to cover the City's fiscal year
(1) Includes the General Fund only.

Parks and Debt Welfare Education Recreation Service MSD Total
12 626 25 116 1,328
11 646 11 154 1,345
11 696 11 150 1,415
10 679 11 164 1,406
15 759 11 156 1,499
9 760 23 188 1,581
11 29 26 207 1,095$ 2,011
13 20 27 206 1,085 2,021
20 21 28 137 1,189 2,096
13 20 28 149 1,259 2,177
149
City of Manchester, New HampshireTable XVI

Miscellaneous Statistics June 30, 2003
Date of Incorporation June 1846 Form of Government Mayoral Number of employees:
City 1,272School 2,567
Area in square miles 33.906Number of registered voters 45,235Total population 108,150Total number of properties 31,420Total taxable properties 30,046Total tax-exempt properties 1,374Manchester, New Hampshire facilities and services:
Miles of streets 390Number of street lights 8,822Culture and recreation:
Golf course 1Ski area 1Parks 73Park acreage 1,224Athletic fields, basketball and tennis courts 130Indoor ice arenas 2
Fire Department:Number of stations 9Number of fire personnel and officers 243Number of fire/hazardous condition calls 4,369Number of emergency medical service calls 9,051
Police Protection:Number of stations 5Number of police personnel and officers 288Number of motorized patrol units 37Number of bike patrol units 18Number of mounted patrol units 2Total number of arrests 5,289Total number of calls for service 97,128
Sewerage System:Miles of sanitary sewers 349Sewage pumping stations 13Number of service connections 22,992
Water System:Miles of water mains 479Number of service connections 29,900Number of fire hydrants 3,212Daily average consumption in gallons 17,148,000
Education:Number of elementary schools 15Number of secondary schools 8Number of full time equivalent instructors K-12 1,284Number of elementary school students 7,246Number of secondary school students 9,926
Airport:Number of employees 62Number of enplanements 1,712,703Number of carriers 14
150
City of Manchester, New HampshireTable XVII