city focus: a web-based interactive 2d and 3d gis application to find the best place to live in a...
TRANSCRIPT

A web-based interactive 2D and 3D GIS application to find the best place to live in a city, using open data and open
source software
Carolina Arias Muñoz, Simone Corti, Monia Elisa Molinari, Daniele Oxoli, Gabriele Prestifilippo
GEOlab (Geomatics and Earth Observation laboratory), Politecnico di Milano Como Campus,
Como, Italy
Session: CitySmart, Open Source Apps for Urban
Management (chair: Hogan; Brovelli)

Eng. Carolina Arias Muñoz
Dr. Monia Elisa Molinari
Eng. Daniele Oxoli
Eng. Gabriele Prestifilippo
Simone Corti
MSc degree in Environmental and Geomatics Engineering. PhD student in Environmental and Infrastructure Engineering
MSc degree in Environmental and Geomatics Engineering. PhD in Earth Sciences
MSc degree in Environmental Engineering. PhD student in Environmental and Infrastructure Engineering
MSc degree in Computer Science and Engineering
Computer technician, linux system administrator and web developer
WebGIS, Volunteer Geographic Information (VGI) and Geo Big Data.
2

What is City Focus?
Is a web-based interactive 2D and 3D GIS application to find the bestplace in a city to live, or to pass shorter staying
The user can select among different criteria and decide their importanceby assigning weights to each of them
The application provides thematic maps on the places which better fit theuser’s preferences

Most of the existing apps:
http://teleport.org http://www.findyourspot.com http://where2roost.com
focus on finding a city to live and not on identifying a suitable place within a city.
The existing apps also allow searching for places to live by specifying few parameters such as
apartment or house prices.
City focus help to perform this task in an automatic as well as user-friendly way avoiding long
and hand-made search on the Web.
City Focus takes into account environmental conditions such as air quality levels, that existing
apps do not consider.
The app exploits exclusively open data as well as Free and Open Source Software (FOSS) for
its implementation by enabling continuous improvements while minimizing development costs.
How is City Focus different from other apps?

MYGEOSS: Innovative Apps in the environmentaland social domains
City Focus is a Winner of the MYGEOSS third callfor innovative Apps, launched by the EuropeanCommission
The aim: Development of innovative applications(mobile or web-based) using openly available orcrowd-generated data indifferent domainsaddressing citizens’ needs
MYGEOSS is a two-year project (2014-16) by theEuropean Commission to develop Global EarthObservation System of Systems based smartInternet applications
http://digitalearthlab.jrc.ec.europa.eu/mygeoss/results3.cfm

City Focus Data
Repository License Link
Open Data LombardiaItalian Open Data License v.2.0 (IODL 2.0)(http://www.dati.gov.it/iodl/2.0)
https://www.dati.lombardia.it
Dati Comune MilanoItalian Open Data License v.2.0 (IODL 2.0)(http://www.dati.gov.it/iodl/2.0)
http://dati.comune.milano.it
OpenStreetMapOpen Data Commons Open Database (http://opendatacommons.org/licenses/od
https://www.openstreetmap.or
ISTATCC-BY 3.0 (https://creativecommons.org/licenses/by
http://www.istat.it
GEOSS data core /https://www.earthobservationsdsp.shtml
Case Study: Milan, Italy
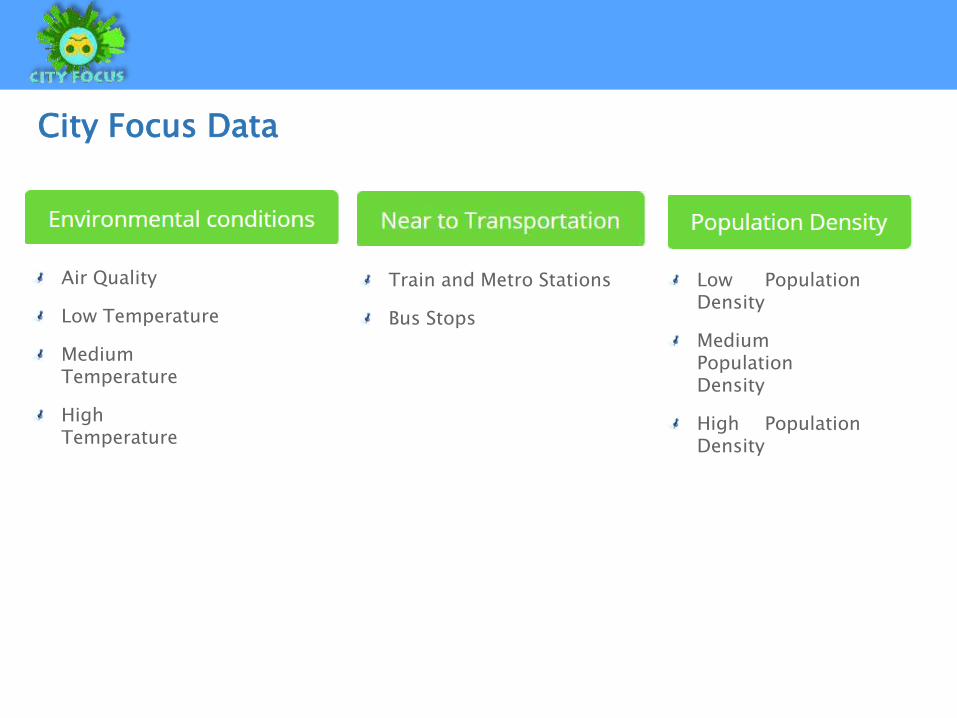
City Focus Data
Air Quality
Low Temperature
MediumTemperature
HighTemperature
Train and Metro Stations
Bus Stops
Low PopulationDensity
MediumPopulationDensity
High PopulationDensity

City Focus Data
ATMs
Banks
Coffee Shops
Hospitals
Pharmacies
Police Stations
Post Offices
Supermarkets
Veterinary Clinics
Parks
Dog Parks
Green Areas
Natural Water
Industrial or commercial units
Continuousurban fabric
Discontinuousurban fabric
Universities
High Schools
Primary Schools
Secondary Schools
Kindergartens

Application principle
Final Map
X
Y
Score
maps c
𝑟 = 𝑖=1𝑛 𝑤𝑖𝑐𝑖 𝑖=1𝑛 𝑤𝑖
𝑟 ∈ ℝ | 0 ≤ 𝑟 ≤ 1
𝑤1𝑤2𝑤3
𝑤𝑖
…
The output consists of a raster computed as a weighted average of thescore maps representing the user’s selected criteria. The final map is thendisplayed with an intuitive color gradient, enabling the user to identify thebest places within the city which better fits his/her preferences.
*200 m resolution

Data Processing
Reprojection
A. Data cleaning
Projecteddata
Downloadeddata Buffers
Cleaneddata
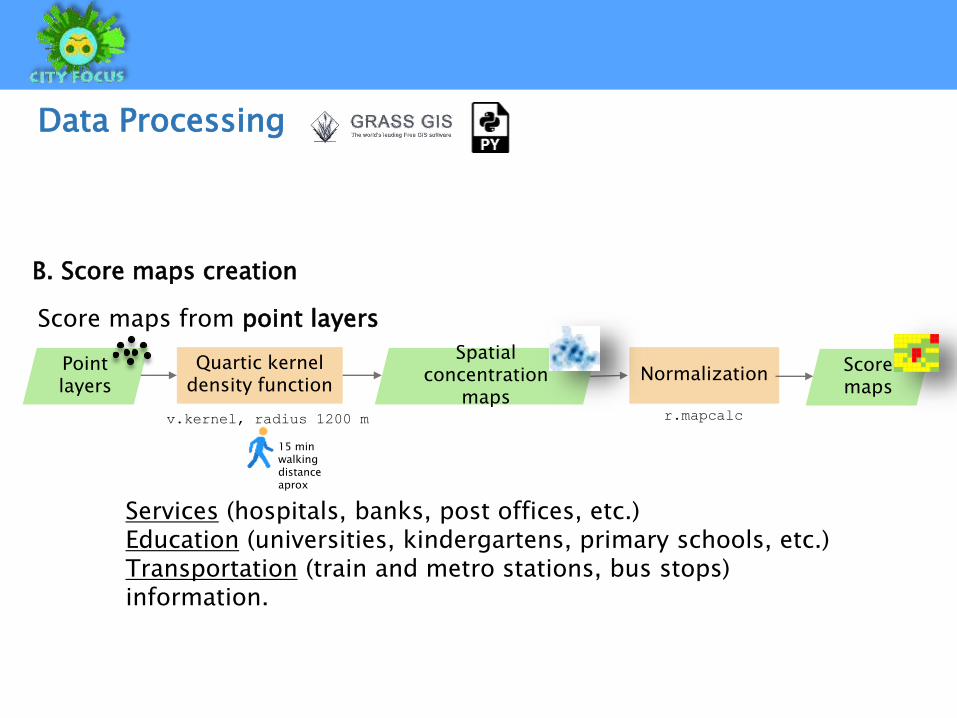
Data Processing
Quartic kernel density function
Point layers
Score maps from point layers
Spatialconcentration
maps
NormalizationScore maps
v.kernel, radius 1200 m r.mapcalc
B. Score maps creation
Services (hospitals, banks, post offices, etc.)Education (universities, kindergartens, primary schools, etc.) Transportation (train and metro stations, bus stops) information.
15 min walking distance aprox

Data Processing
Score maps from polygon layers
Rasterization
Polygonlayers
Raster mapsMultiple
distance buffers
Proximitymaps
ReclassificationScore maps
v.to.rast r.buffer
r.reclass
Distance d [m] classes
Score
d = 0 1
0 < d ≤ 400 0.75
400 < d ≤ 800 0.50
800 < d ≤ 0.25
d > 1200 0
Natural data such as parks, green areas, natural waters, etc.

Data Processing
Normalization*Air
Pollution
Score maps from raster layers
Score maps
r.mapcalc
Reclassification
T°, pop,landuselayers
Temperature (high, medium, low)
Population density (high, medium, low)
Landuse (Industrial or commercial units, Continuousurban fabric, Discontinuous urban fabric)
Air pollution (PM2,5)
r.Reclass
High / Industrial
Medium / Continuous
Low / Discontinuous
Classes Category
MIN ≤ x < ⅓*MAX low
⅓*MAX ≤ x < medium
⅔*MAX ≤ x ≤ MAX high
Score maps
Reclassification
r.Reclass
0 or 1 **
*High scores on less polluted areas
**score 1 to the cells within the category of interest

Application architecture
ClientOGC
Services ServerDatabase
PetascopeWCPS

Application architecture
ClientOGC
Services ServerDatabase
PetascopeWCPS

for a in (atms), b in (banks), c in (cafe), d in (hospitals) … z in (discontinuous)
return encode ( ( (a*50 + b*50 + c*80 + d*70 … z*80)/180.4), "csv") )
Application architecture
Criteria vector layers “locations of interest” are added into the applicationas geojson
The final map, as well as the criteria raster layers “criterion map” are«painted» by coloring a grid (vector version of the score maps) using thevalues of the retrieved csv files from the WCPS requests
The POST WCPS request is of the form:

https://youtu.be/oKM7vPGIJAc

Conclusions
Possible improvements:
Possibility for users to get a glimpse of the changing environmentwithin a city through trend maps or graphs for any specific criterion(e.g. temperature changes in the last five years, etc.)
Add the name of best scored city blocks from the final map (i.e. thecells with the highest scores) may be displayed too, associating tothese cells to neighborhoods by means of geocoding.
Take more advantage of the 3D functionalities (e.g. elevate cellsaccording to cells values)
Add user functionalities to gather information about userpreferences, to make inferences and statistics: Useful for urbanmanagement purposes
Add information about house/appartments sale/rent prices
As a first case study, we considered the city of Milan. In the future, otheritalian as well as european cities are planned to be included.

Check the application on:
http://muvias.eoapps.eu/cityfocus/application.html
And the documentation /source code:
https://github.com/GabrielePrestifilippo/CityFocus
Thank you for your attention!